Embed Size (px)
Citation preview
Professors Troy G. Schmitz, James Seale, and Andrew SchmitzArizona State University and University of Florida
The Economics of Alternative Energy Sources and Globalization: The Road Ahead
Embassy Suites Hotel Orlando Airport November 15–17, 2009
•Overview of Brazil’s Sugar and Ethanol Production•Brazil’s Hidden Subsidies•Brazil’s Ethanol/Gasoline Blend Ratios•Relative Oil, Sugar and Corn Prices•Comparison With the U.S.
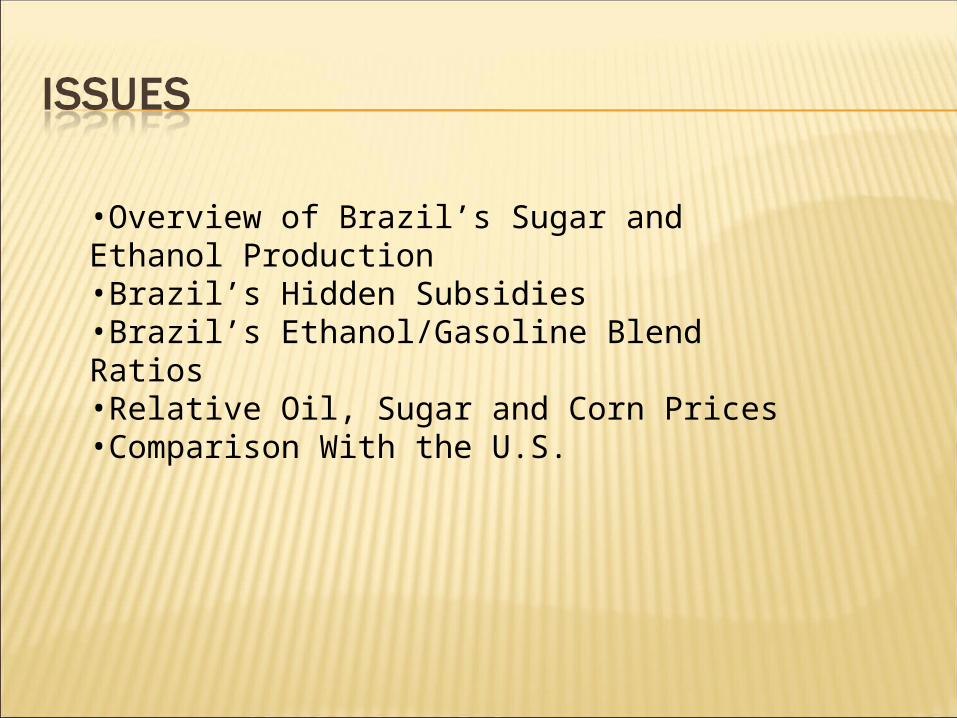
Year Sugar Productio
n
Ethanol Production
Oil Price World Raw Sugar Price
Sugar / Ethanol Ratio
Sugar / Oil Price Ratio
(1000 tonnes)
(million gallons)
($/barrel) (¢pound)
2003/2004 3910 27.69 8.01 0.29
2004/2005 4068 37.66 7.85 0.21
2005/2006 26,850 4174 50.04 10.46 6.4 0.21
2006/2007 31,450 4719 58.30 15.78 6.7 0.27
2007/2008 32,100 5916 64.20 11.67 5.4 0.18
2008/2009E 30,427 7054 99.65 13.67 4.3 0.14
2009/2010E 33,559 15.94
2010/2011E 39,015
2011/2012E 42,669
E = Estimates
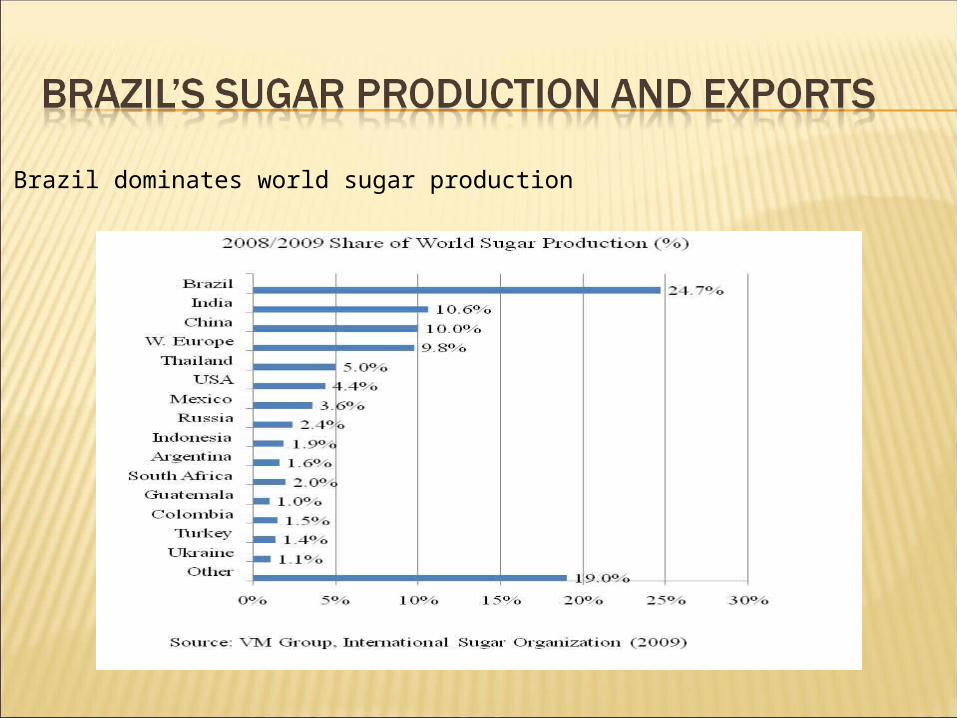
Brazil dominates world sugar production
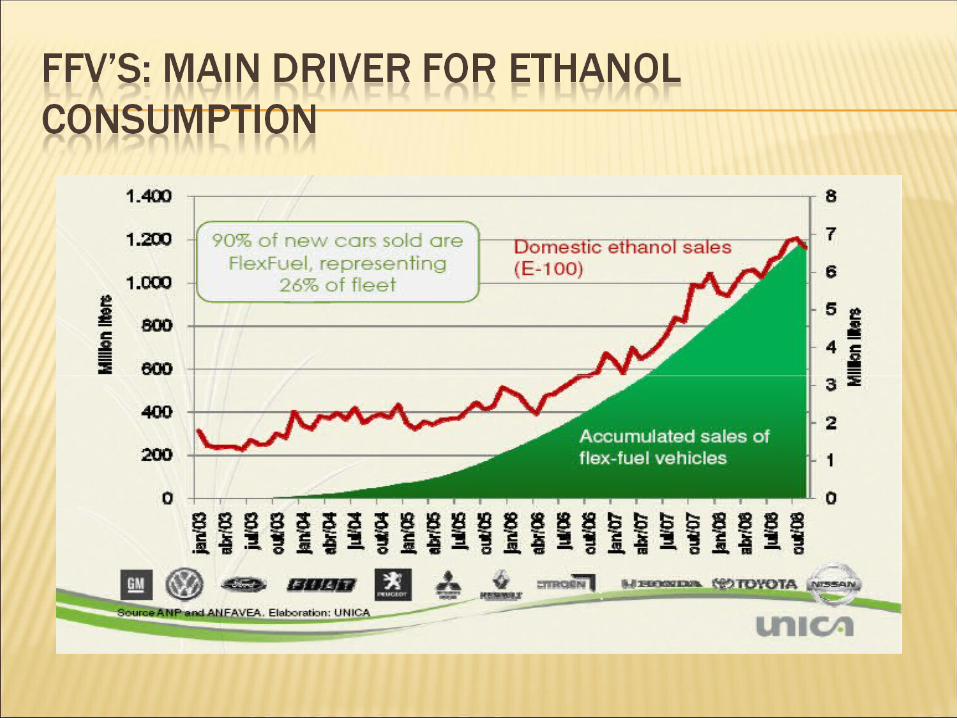
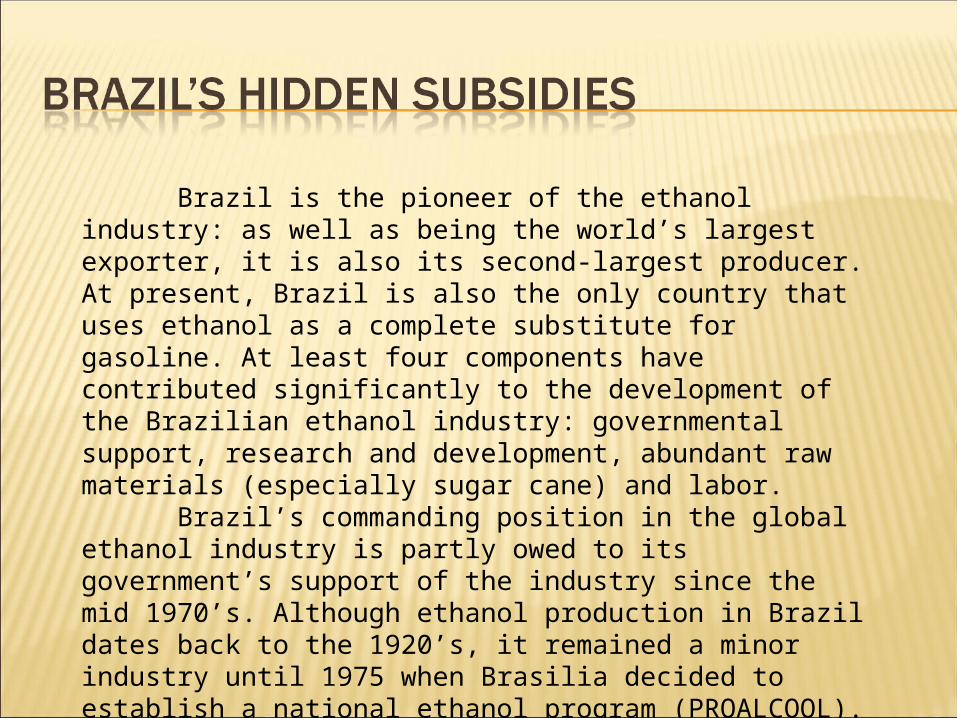
Brazil is the pioneer of the ethanol industry: as well as being the world’s largest exporter, it is also its second-largest producer. At present, Brazil is also the only country that uses ethanol as a complete substitute for gasoline. At least four components have contributed significantly to the development of the Brazilian ethanol industry: governmental support, research and development, abundant raw materials (especially sugar cane) and labor.
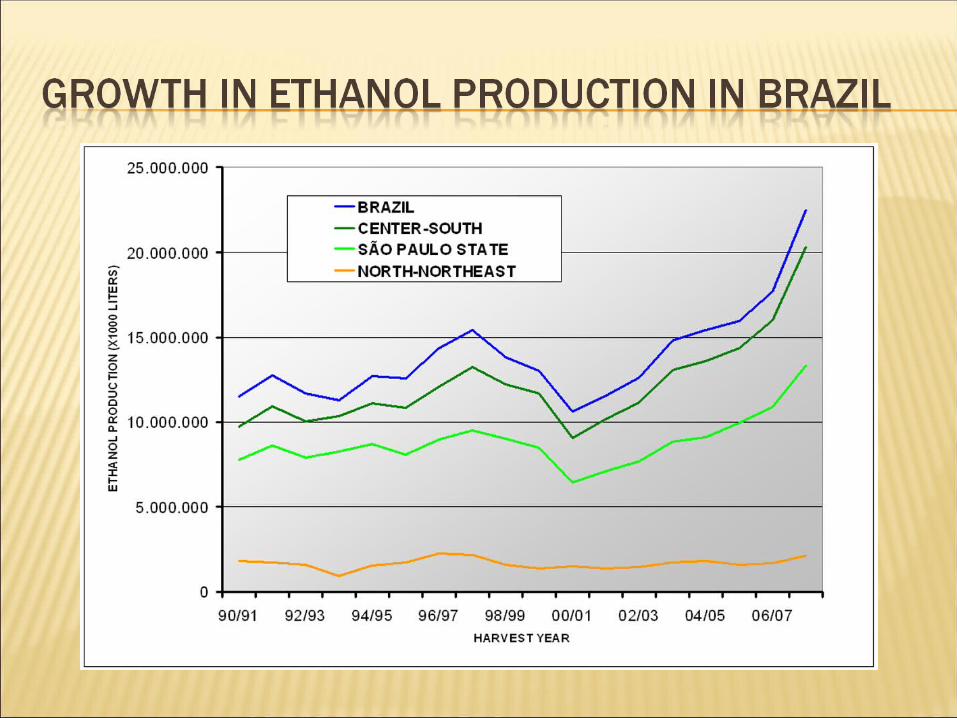
Brazil’s commanding position in the global ethanol industry is partly owed to its government’s support of the industry since the mid 1970’s. Although ethanol production in Brazil dates back to the 1920’s, it remained a minor industry until 1975 when Brasilia decided to establish a national ethanol program (PROALCOOL).
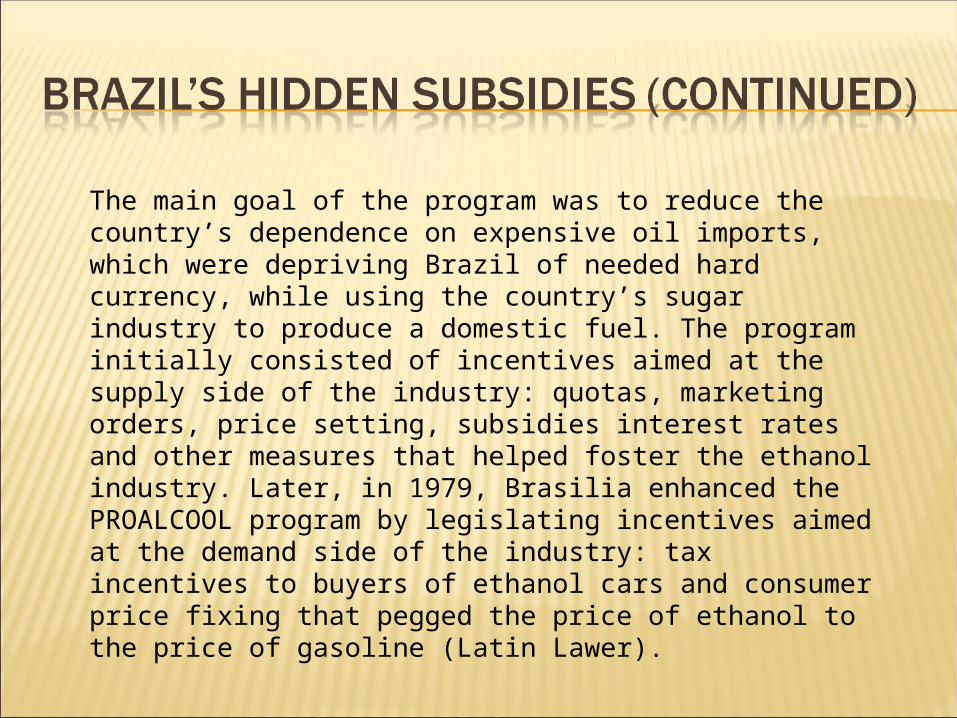
The main goal of the program was to reduce the country’s dependence on expensive oil imports, which were depriving Brazil of needed hard currency, while using the country’s sugar industry to produce a domestic fuel. The program initially consisted of incentives aimed at the supply side of the industry: quotas, marketing orders, price setting, subsidies interest rates and other measures that helped foster the ethanol industry. Later, in 1979, Brasilia enhanced the PROALCOOL program by legislating incentives aimed at the demand side of the industry: tax incentives to buyers of ethanol cars and consumer price fixing that pegged the price of ethanol to the price of gasoline (Latin Lawer).
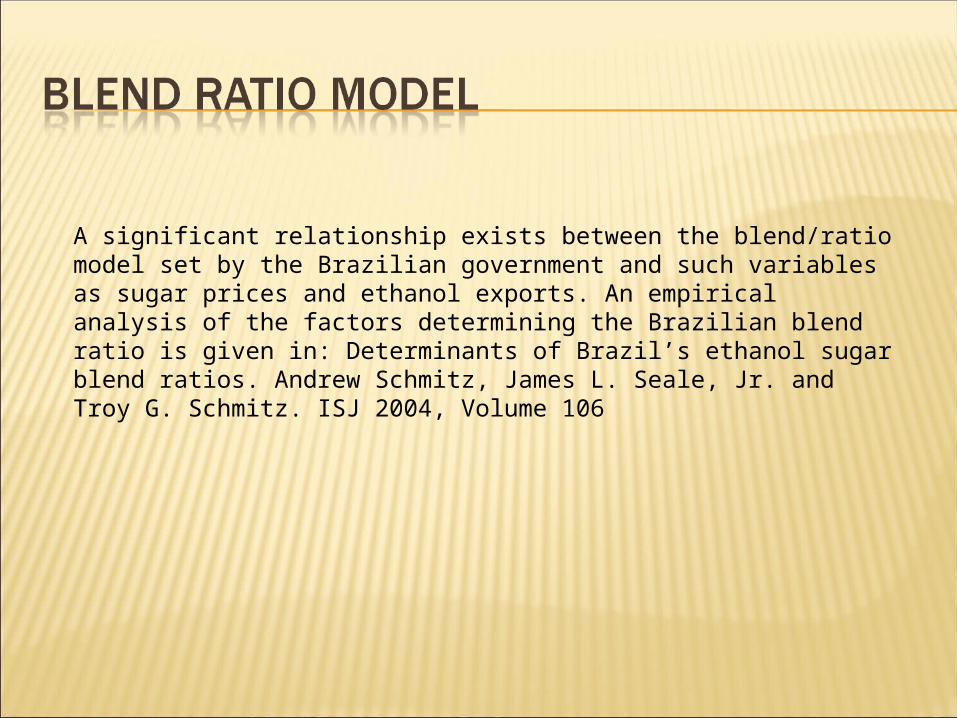
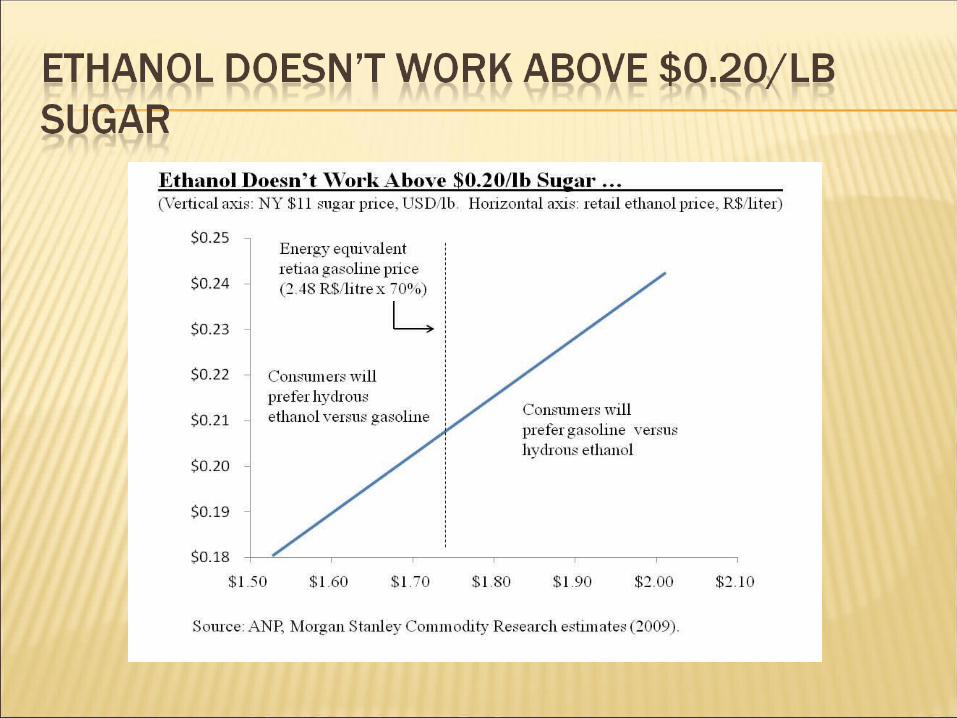
A significant relationship exists between the blend/ratio model set by the Brazilian government and such variables as sugar prices and ethanol exports. An empirical analysis of the factors determining the Brazilian blend ratio is given in: Determinants of Brazil’s ethanol sugar blend ratios. Andrew Schmitz, James L. Seale, Jr. and Troy G. Schmitz. ISJ 2004, Volume 106
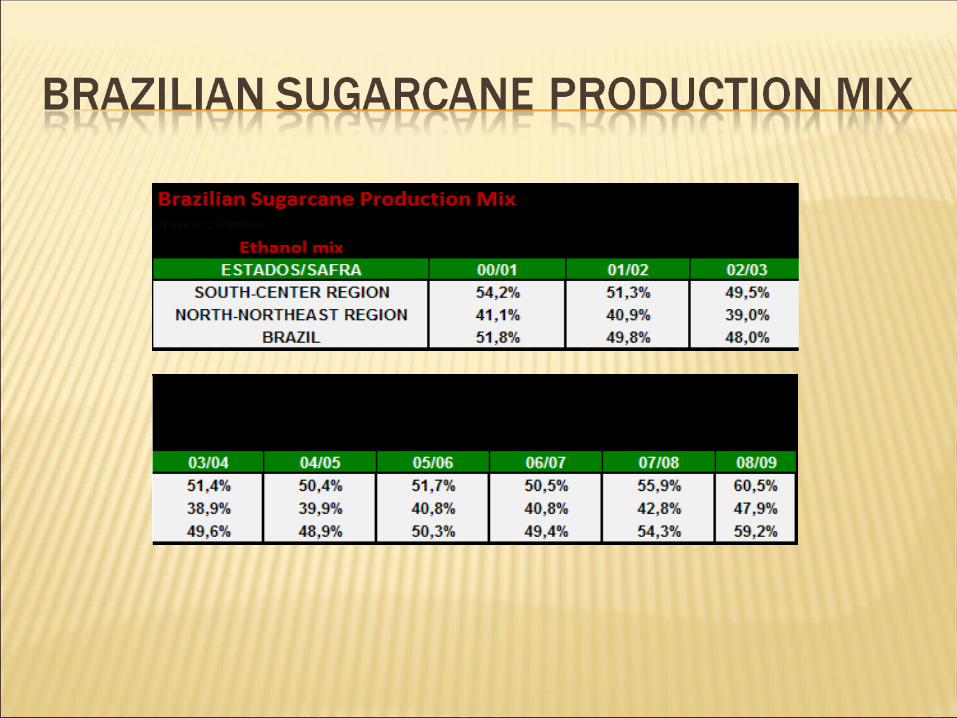
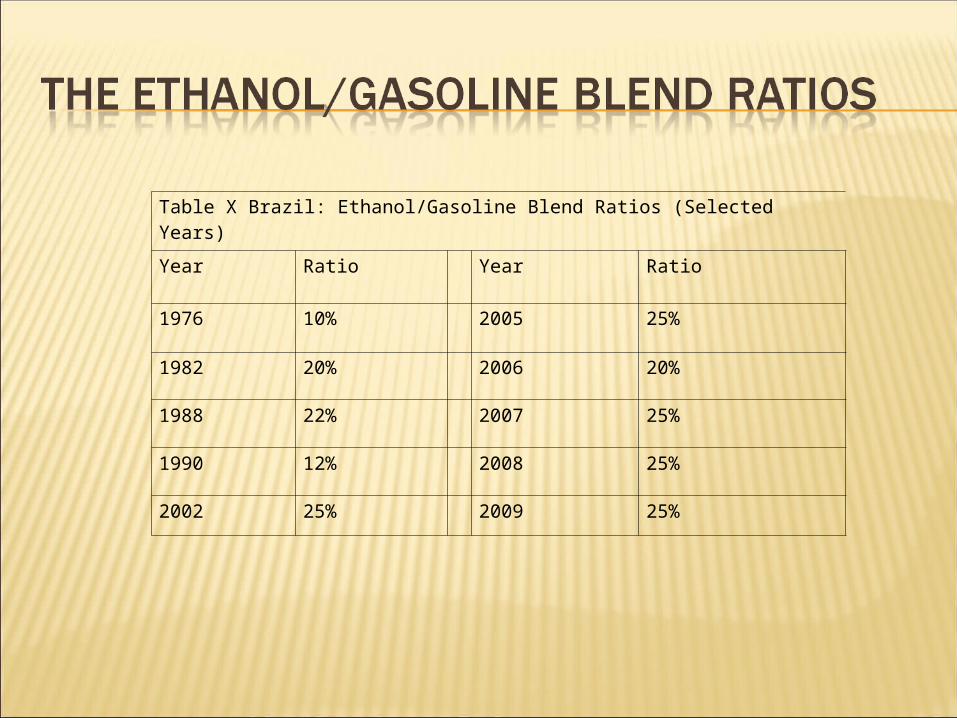
Table X Brazil: Ethanol/Gasoline Blend Ratios (Selected Years)
Year Ratio Year Ratio
1976 10% 2005 25%
1982 20% 2006 20%
1988 22% 2007 25%
1990 12% 2008 25%
2002 25% 2009 25%
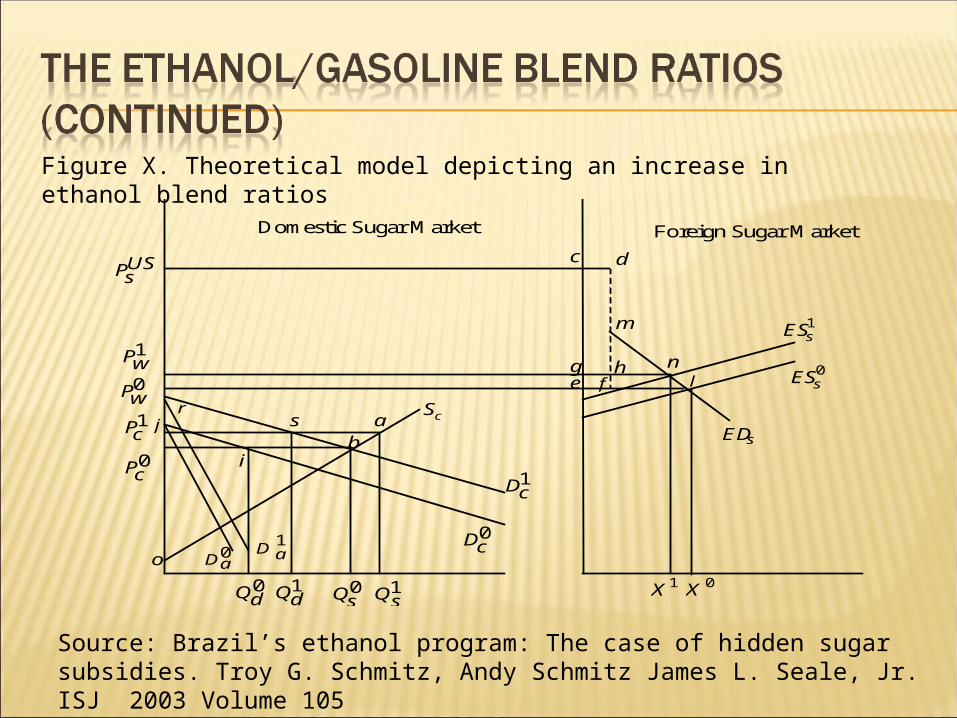
Figure X. Theoretical model depicting an increase in ethanol blend ratios
S c a b
c d
e g h
o
j
i
f l
m
n
r s
US P s
1 P w 0 P w 1 P c
0 D c
1 D c
0 D a 1 Q d 0 Q s
1 Q s 1 X 0 X
s ED
1 s ES
0 s ES
Domestic Sugar Market Foreign Sugar Market
0 Q d
0 P c
1 D a
Source: Brazil’s ethanol program: The case of hidden sugar subsidies. Troy G. Schmitz, Andy Schmitz James L. Seale, Jr. ISJ 2003 Volume 105
Unless sugar prices drop significantly in the United States (which is highly unlikely based on current U.S. Farm Policy), corn will serve as a major input for ethanol production and for non-sugar sweeteners. Source: Sweetener-ethanol complex in Brazil, the United States and Mexico: Do prices matter? Andrew Schmitz, James L. Seale, Jr. and Troy G. Schmitz. ISJ 2003 Volume 105.
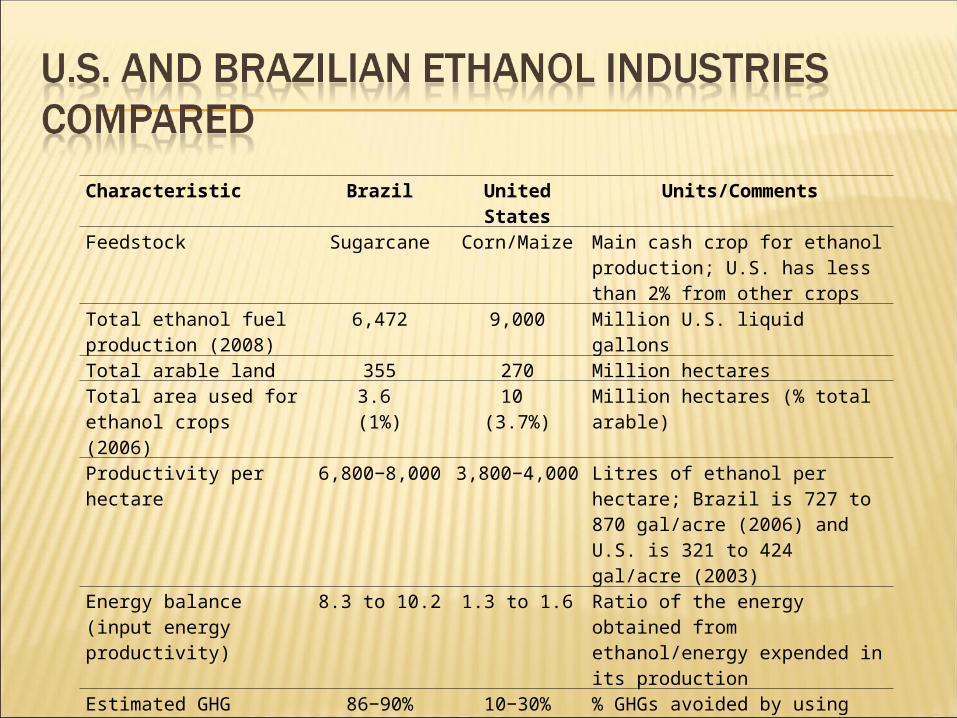
Characteristic Brazil United States
Units/Comments
Feedstock Sugarcane Corn/Maize Main cash crop for ethanol production; U.S. has less than 2% from other crops
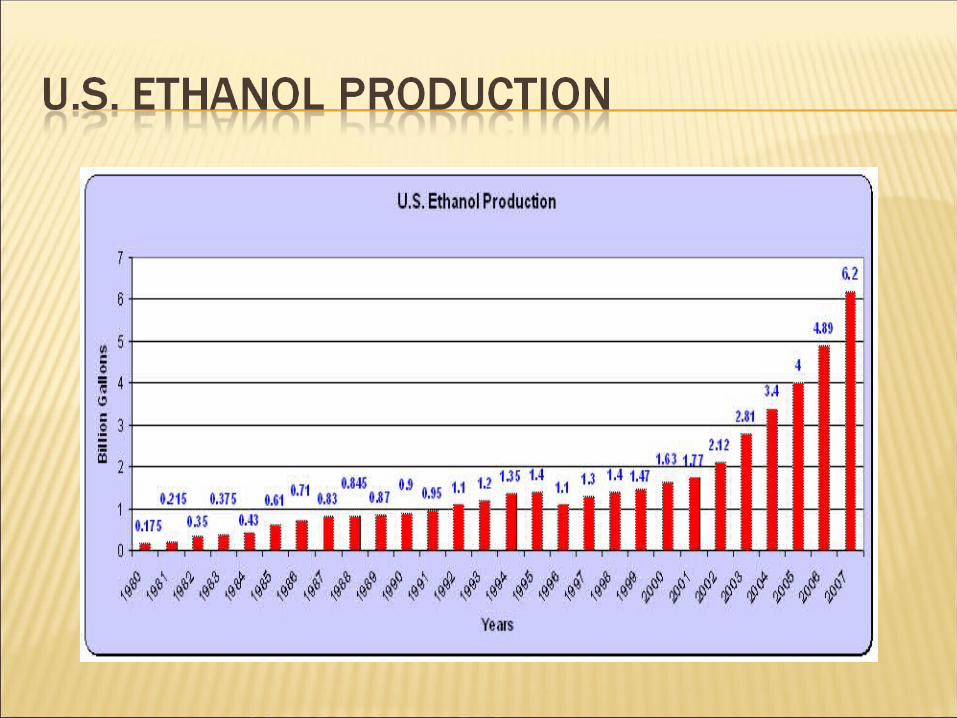
Total ethanol fuel production (2008)
6,472 9,000 Million U.S. liquid gallons
Total arable land 355 270 Million hectaresTotal area used for ethanol crops (2006)
3.6 (1%)
10 (3.7%)
Million hectares (% total arable)
Productivity per hectare
6,800−8,000 3,800−4,000 Litres of ethanol per hectare; Brazil is 727 to 870 gal/acre (2006) and U.S. is 321 to 424 gal/acre (2003)
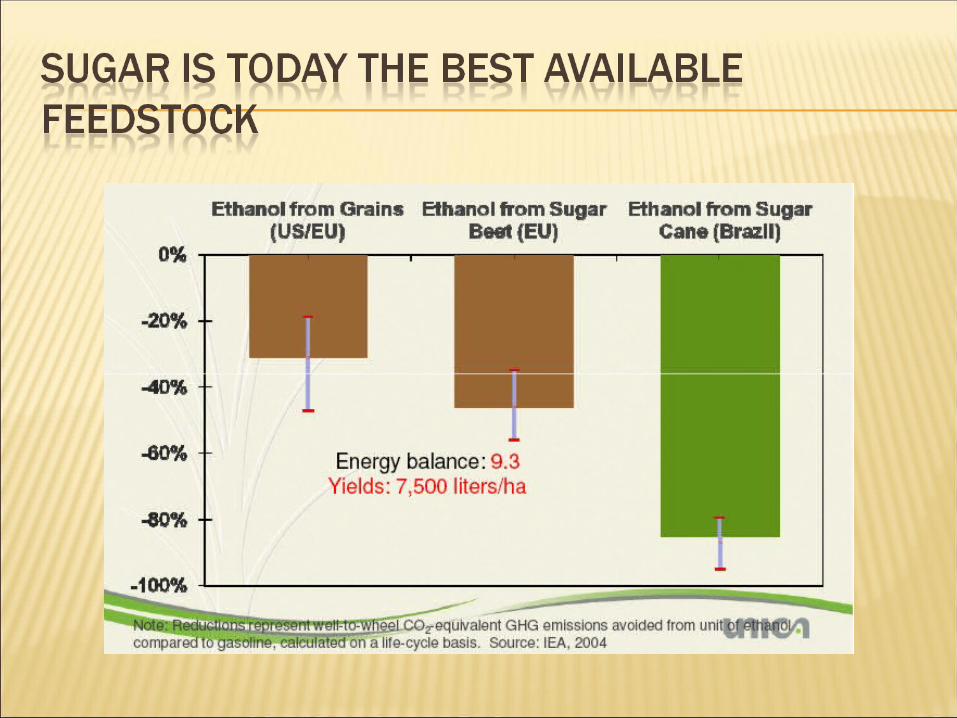
Energy balance (input energy productivity)
8.3 to 10.2 1.3 to 1.6 Ratio of the energy obtained from ethanol/energy expended in its production
Estimated GHG emissions reduction
86−90% 10−30% % GHGs avoided by using ethanol instead of gasoline, using existing cropland (No ILUC)
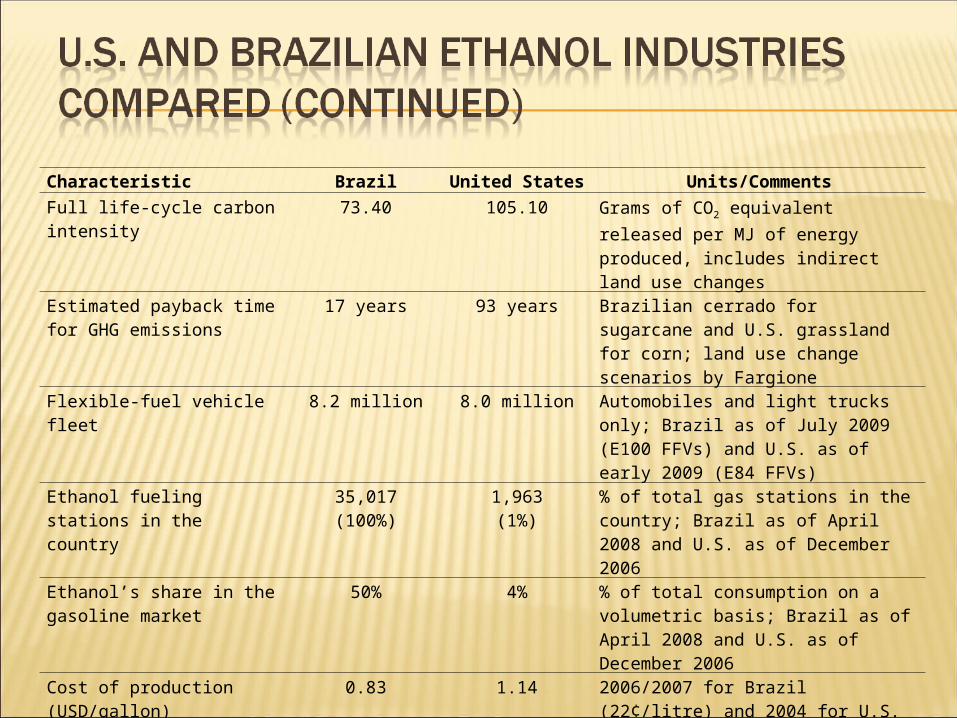
Characteristic Brazil United States Units/CommentsFull life-cycle carbon intensity
73.40 105.10 Grams of CO2 equivalent released
per MJ of energy produced, includes indirect land use changes
Estimated payback time for GHG emissions
17 years 93 years Brazilian cerrado for sugarcane and U.S. grassland for corn; land use change scenarios by Fargione
Flexible-fuel vehicle fleet 8.2 million 8.0 million Automobiles and light trucks only; Brazil as of July 2009 (E100 FFVs) and U.S. as of early 2009 (E84 FFVs)
Ethanol fueling stations in the country
35,017(100%)
1,963(1%)
% of total gas stations in the country; Brazil as of April 2008 and U.S. as of December 2006
Ethanol’s share in the gasoline market
50% 4% % of total consumption on a volumetric basis; Brazil as of April 2008 and U.S. as of December 2006
Cost of production (USD/gallon)
0.83 1.14 2006/2007 for Brazil (22¢/litre) and 2004 for U.S. (35¢/litre)
Government subsidy (USD) 0¢ 45¢/gallon Brazilian ethanol production is no longer subsidized; U.S. tax credit since January 2009
Import tariffs (USD) 0¢ 54¢/gallon As of June 2009, Brazil does not import ethanol, but U.S. does
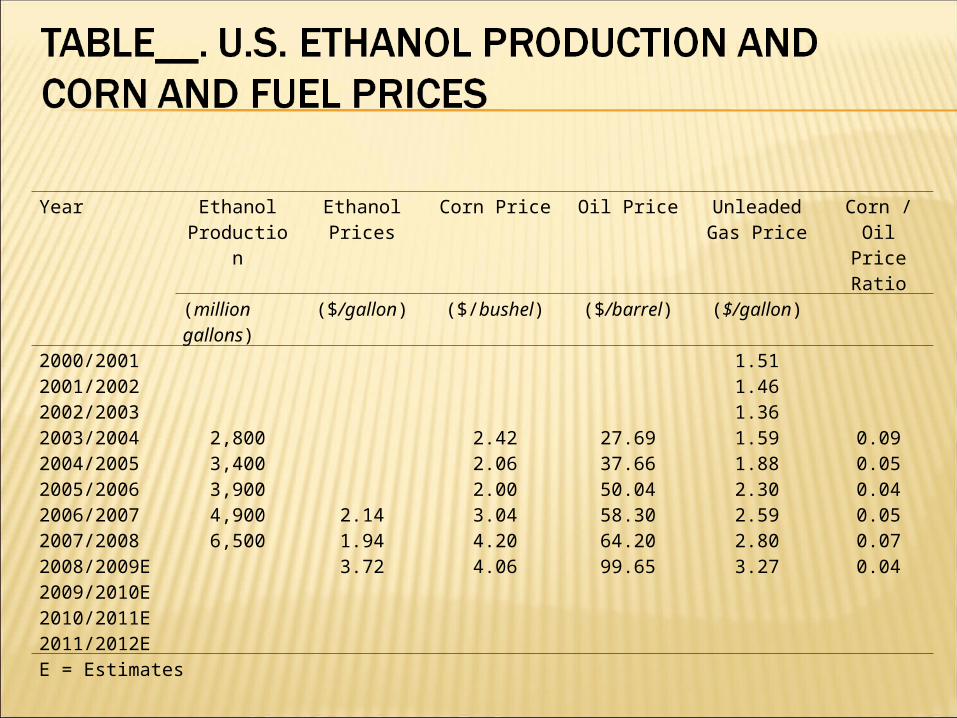
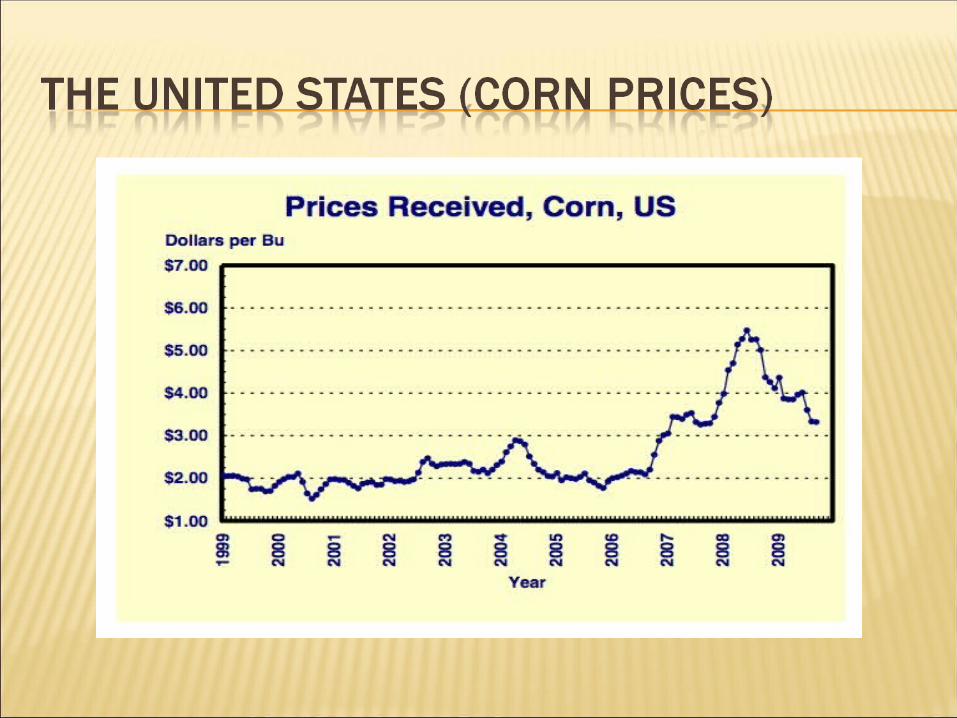
Year Ethanol Production
Ethanol Prices
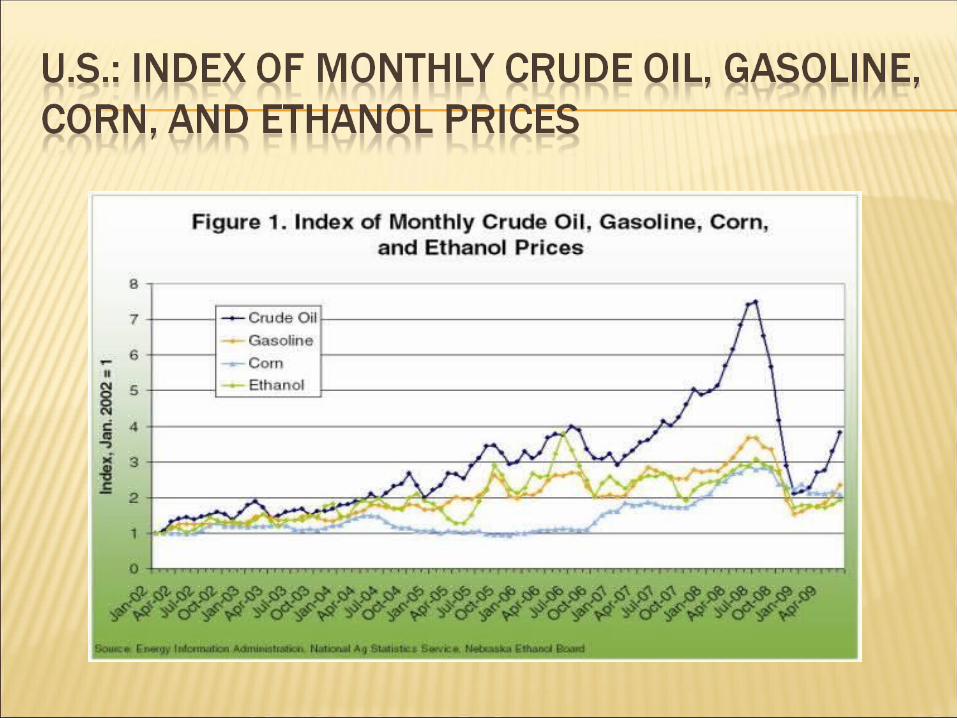
Corn Price Oil Price Unleaded Gas Price
Corn / Oil Price Ratio
(million gallons)
($/gallon) ($/bushel) ($/barrel) ($/gallon)
2000/2001 1.512001/2002 1.462002/2003 1.362003/2004 2,800 2.42 27.69 1.59 0.092004/2005 3,400 2.06 37.66 1.88 0.052005/2006 3,900 2.00 50.04 2.30 0.042006/2007 4,900 2.14 3.04 58.30 2.59 0.052007/2008 6,500 1.94 4.20 64.20 2.80 0.072008/2009E 3.72 4.06 99.65 3.27 0.042009/2010E2010/2011E2011/2012EE = Estimates
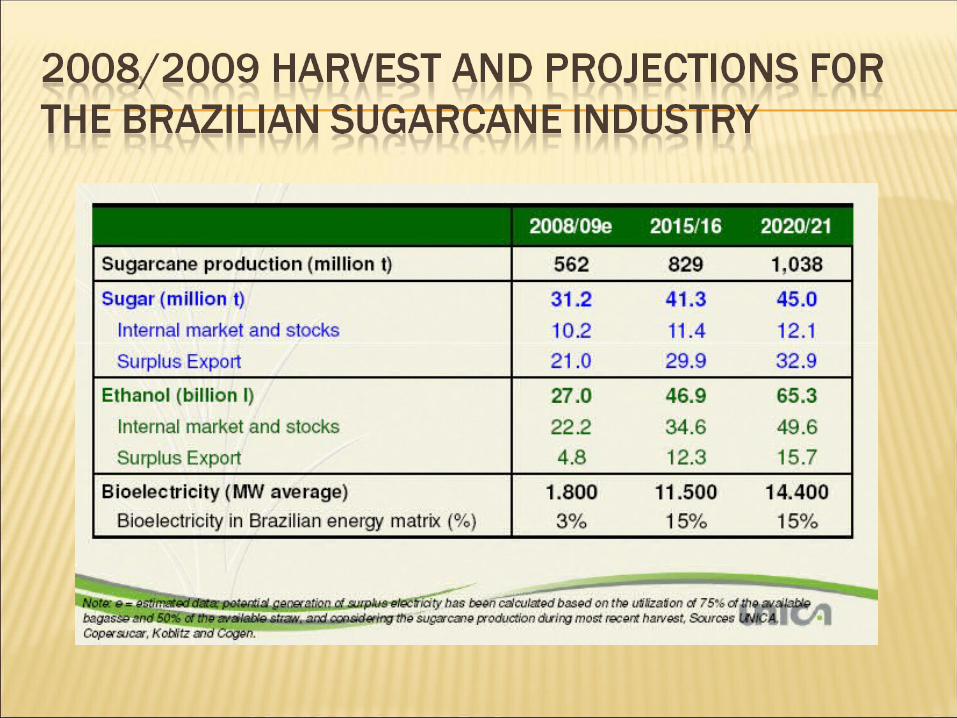
•Bioelectricity—Brazil is emerging as a leader in the generation of bioelectricity (Emmanuel Desplechin, World Biofuels Conference, Seville- 5/28/2009)•Biodiesel—(Gabriella et al., Energy Policy 2007) The use of biofuels is not only an economical and secure alternative to fossil fuels but it also has many favorable environmental and social aspects: (i) bioidiesel is biodegradable and harmless; (ii) it can be produced from renewable materials; (iii) ethyl or methyl fatty acid esters contain no sulfur; (iv) biodiesel decreases soot emission considerably (up to 50%); (v) biodiesel emits about the same amount of CO2 that is absorbed during cultivation of the oilseed; (vi) it does not contain any of the carcinogens found in diesel oil; (vii) biodiesel is not considered a hazardous material; (viii) there are numerous social and economic advantages from its use, particularly in developing countries such as Brazil; (ix) biodiesel represents a suitable outlet for vegetable oil industry, serving as an important tool for market regulation; and (x) it increases engine lifetime owing to a superior lubrication capability (Parente, 2003; Schuchardt et al., 1998; Ramos et al., 2003; NBB, 2004).