Embed Size (px)
Citation preview

Prof. Rafi MelnickProvost, IDC Herzliya
National Security BalanceThe Civilian Quantitative Dimension
The Herzliya Indices
Herzliya Conference 2014
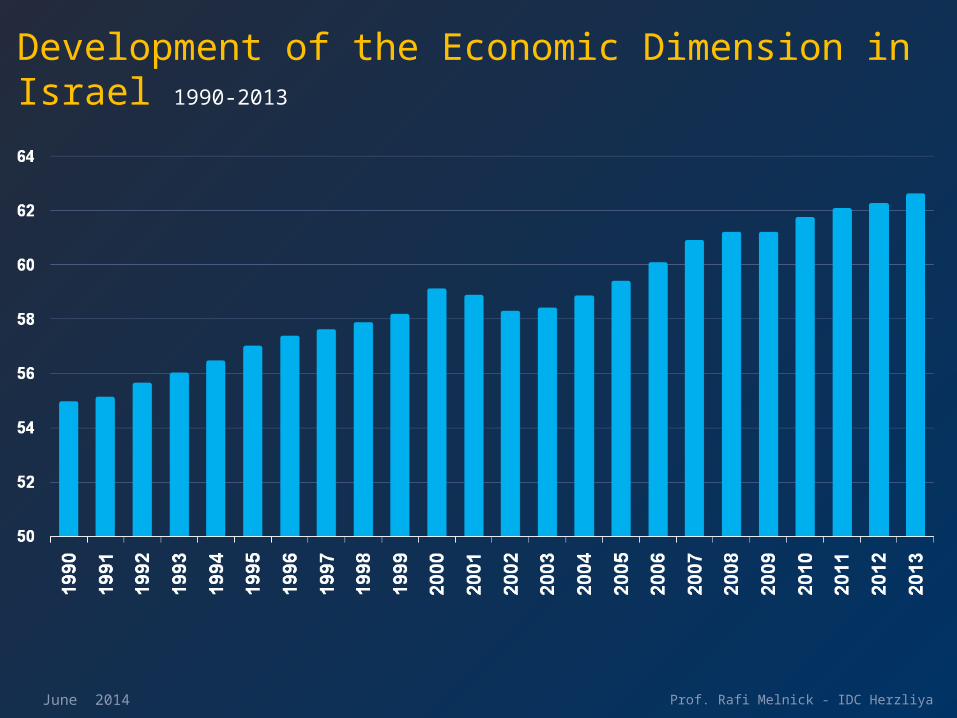
Development of the Economic Dimension in Israel 1990-2013
June 2014 Prof. Rafi Melnick - IDC Herzliya

...
• N indicators are measurable; they affect and are affected by national security, which is an unobservable latent variable.• The presence of multiple indicators allows (under defined assumptions) one to quantify national security.• A rise in each indicator means improvement in national security, in the corresponding dimension.
Multiple Indicators Approach
June 2014 Prof. Rafi Melnick - IDC Herzliya

1. GDP Per Capita, PPP (16%)
2. GDP, PPP (15%)
3. Unemployment (15%)
4. General Government Gross Financial Liabilities (half weight 11%)
5. R&D Investment* - Percent of GDP (11%)
6. Current Account Balance (11%)
7. Inflation (11%)
8. Long Term interest rate** (5%)
9. Fiscal Deficit** (5%)
Prof. Rafi Melnick - IDC Herzliya
* Replacing High-Technology Exports % of Manufactured Exports General Government Gross)
** Replacing Foreign currency reserves (half weight of 10%)June 2014
Components of the Economic Indicator(Relative Weight in Parenthesis)

Construction of a panel data set of 27 countries
The model includes: Israel 26 OECD countries
Data ranges from 1990 through 2013
Prof. Rafi Melnick - IDC HerzliyaJune 2014
The Model

Primary Sources
OECD Statistics OECD Economic Outlook Israel’s National Insurance institute -
Research and Planning Administration Israel’s Central Bureau of Statistics
Secondary Sources
IFS – International Financial Statistics (IMF)
IMF – World Economic Outlook Bank of Israel and various central banks Other sources
Prof. Rafi Melnick - IDC HerzliyaJune 2014
Economic Data Resources

A preliminary base is calibrated.
Each variable is measured in percentage change or percentage difference in the case that its basic measurement is in percents
An annual weighted average is calculated using the weights obtained from a panel of experts
The indices are formed, over time, by cumulating annual weighted averages
Methodology
Prof. Rafi Melnick - IDC HerzliyaJune 2014

2014 RESULTS
The Herzliya Indices

Economic Base - 1990
Prof. Rafi Melnick - IDC HerzliyaJune 2014

Economic Base - 2013
Prof. Rafi Melnick - IDC HerzliyaJune 2014

Development of the Economic DimensionIsrael and the Developed Countries
Prof. Rafi Melnick - IDC HerzliyaJune 2014

Per Capita GDP Growth - 2013(percent)
Prof. Rafi Melnick - IDC HerzliyaJune 2014

Unemployment Rate - 2013(percent)
Prof. Rafi Melnick - IDC HerzliyaJune 2014

General Government Liabilities - 2013(percent of GDP)
Prof. Rafi Melnick - IDC HerzliyaJune 2014

Economic Dimension GapIsrael and the Developed Countries
Prof. Rafi Melnick - IDC HerzliyaJune 2014

Economic Index 2013
17
18
19
20
21
22
23
24
25
26
27
1
2
3
4
5
6
7
8
9
10
11
12
13
14
15
16
USA 103.54
Japan 74.26
Norway 73.29
Germany 73.08
Switzerland 72.48
Canada 69.49
Netherlands 69.33
Australia 68.67
UK 68.51
Denmark 68.21
Sweden 67.54
France 66.66
Austria 66.49
Korea, Rep 65.54
Belgium 64.23
New Zealand 63.37
lreland 63.16
Israel 62.56
Finland 62.25
ltaly 62.10
Spain 58.50
Czech Rep 58.01
Portugal 56.34
Poland 53.78
Hungary 51.02
Greece 50.18
Turkey 46.69
Prof. Rafi Melnick - IDC HerzliyaJune 2014

The Herzliya Composite
Economic Social Index

1. GDP Per Capita, PPP (11%)
2. GDP, PPP (10%)
3. Unemployment (10%)
4. Poverty Incidence (10%)
5. Inequality Gini (8%)
6. General Government Gross Financial Liabilities (8%)
7. R&D Investment - % of GDP (8%)
8. Current Account Balance (8%)
9. Long Term Unemployment (7%)
10. Employment Rate (7%)
11. Inflation (7%)
12. Long Term Interest Rate (3%)
13. Fiscal Deficit (3%)
Components of the Economic-Social Indicator(Relative Weight in Parenthesis, Social indicators in yellow)
Prof. Rafi Melnick - IDC HerzliyaJune 2014

Development of the Economic and Social Dimension in Israel
Prof. Rafi Melnick - IDC HerzliyaJune 2014
1990 - 2013

Poverty Incidence in Israel 1979 - 2012(Families, percent)
Prof. Rafi Melnick - IDC HerzliyaJune 2014

Poverty Incidence(Families, the latest available data point, percent)
Prof. Rafi Melnick - IDC HerzliyaJune 2014

Inequality in Israel 1979-2012(Families, Gini Coefficient)
Prof. Rafi Melnick - IDC HerzliyaJune 2014

Inequality(Families, the latest available data point, Gini coefficient)
Prof. Rafi Melnick - IDC HerzliyaJune 2014

Long Term Unemployment in Israel 1995-2013(percent)
Prof. Rafi Melnick - IDC HerzliyaJune 2014

Long Term Unemployment(Families, the latest available data point, percent)
Prof. Rafi Melnick - IDC HerzliyaJune 2014

Employment Rate Israel 1995 - 2013(percent)
Prof. Rafi Melnick - IDC HerzliyaJune 2014

Employment Rate (The latest available data point, Percent)
Prof. Rafi Melnick - IDC HerzliyaJune 2014

Economic Social Base - 1990
Prof. Rafi Melnick - IDC HerzliyaJune 2014

Economic Social Base - 2013
Prof. Rafi Melnick - IDC HerzliyaJune 2014
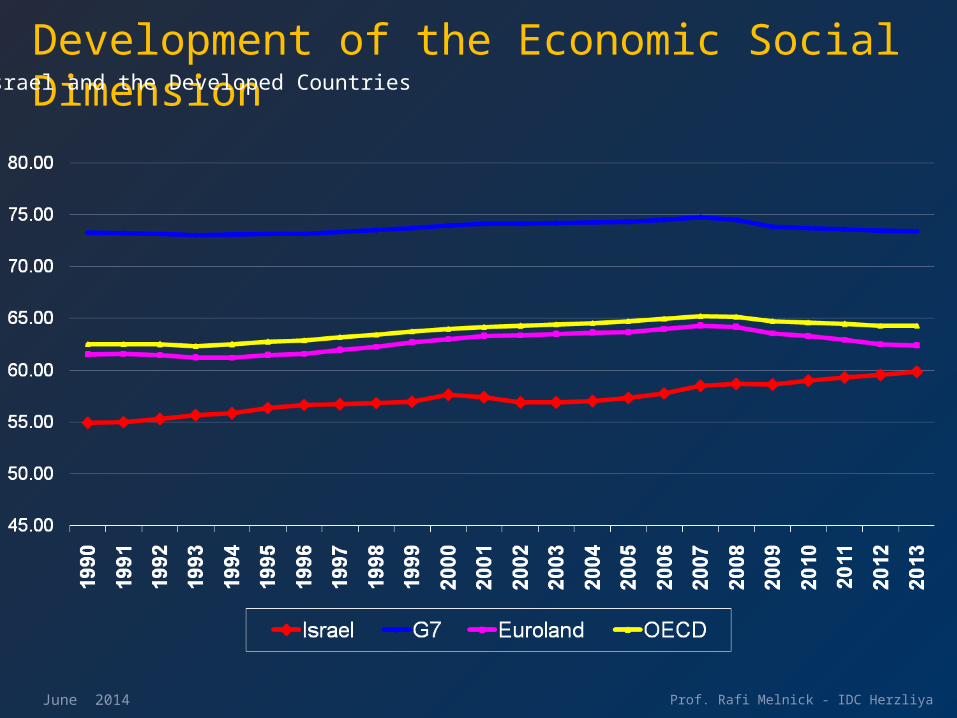
Development of the Economic Social Dimension
Prof. Rafi Melnick - IDC HerzliyaJune 2014
Israel and the Developed Countries

Economic Social Dimension Gap
Prof. Rafi Melnick - IDC HerzliyaJune 2014
Israel and the Developed Countries

Economic Social Index 2013
17
18
19
20
21
22
23
24
25
26
27
1
2
3
4
5
6
7
8
9
10
11
12
13
14
15
16
USA 101.76
Japan 75.15
Germany 72.34
Switzerland 72.00
Norway 71.71
Canada 68.22
UK 68.20
Netherlands 68.02
Australia 66.68
Denmark 66.67
France 66.29
Austria 65.87
Sweden 65.35
Belgium 63.66
Korea, Rep 63.52
lreland 61.92
ltaly 61.90
New Zealand 61.85
Finland 61.06
Israel 59.83
Spain 58.21
Czech Rep 56.92
Portugal 56.39
Poland 52.32
Greece 50.05
Hungary 49.96
Turkey 45.48
Prof. Rafi Melnick - IDC HerzliyaJune 2014

Development of the Economic and the Economic Social Dimension a Comparison
Prof. Rafi Melnick - IDC HerzliyaJune 2014
Israel and the Developed Countries

Economic and Economic Social Dimension Gap
Prof. Rafi Melnick - IDC HerzliyaJune 2014
Israel and the Developed Countries

Prof. Rafi Melnick - IDC Herzliya
Thank you