Embed Size (px)
Citation preview

1 © Dr. Mohamed S. Abdel Wahab
Prof. Dr. Mohamed S. Abdel Wahab
Professor of Dispute Resolution & Chair of Private International Law – Cairo University
Founding Partner, Head of International Arbitration Group, Zulficar & Partners Law Firm
Vice-Chairman, Chartered Institute of Arbitrators (Cairo Branch)

Outline
Prologue: Africa – A Continental Snapshot.
African Trade and Economics: A Transformative Growth
Foreign Direct Investment in Africa: Opportunities and Challenges.
International Arbitration Overview: Africa & the World.
Epilogue: International Arbitration: The Changing Landscape.
2 © Dr. Mohamed S. Abdel Wahab

The recorded history of early civilization arose in Egypt, and Nubia, the Sahel (covers parts of (from west to east) the Gambia, Senegal, southern Mauritania, central Mali, Burkina Faso, southern Algeria and Niger, northern Nigeria and Cameroon, central Chad, southern Sudan, northern South Sudan and northern Eritrea), the Maghreb the Horn of Africa, and South Africa. The Homo Erectus is said to have originated in Africa.
Some anthropological studies consistently established that ancient Egyptians were originally Africans and overtime gained biological affinities towards Middle Eastern and southern European populations.
3 © Dr. Mohamed S. Abdel Wahab
Prologue: Africa - Continental
Snapshot

Africa is now composed of 55 Sovereign States (54 members of the African Union to the exclusion of Morocco), with more than 1 billion inhabitants.
Legal systems in Africa are a diverse mix of common, civil, customary and religious law. There are over 700 (known) languages, and working languages include: English, French, Portuguese, and Arabic.
Africa has experienced high and continuous economic growth in the past decade. The average annual real growth rate: 1980-1989 1.8%
1990-1999 2.6%
2000-2010 5.3% (UNCTAD Report 2014 “Catalyzing investment for Transformative Growth in Africa)
4 © Dr. Mohamed S. Abdel Wahab
Prologue: Africa - Continental
Snapshot
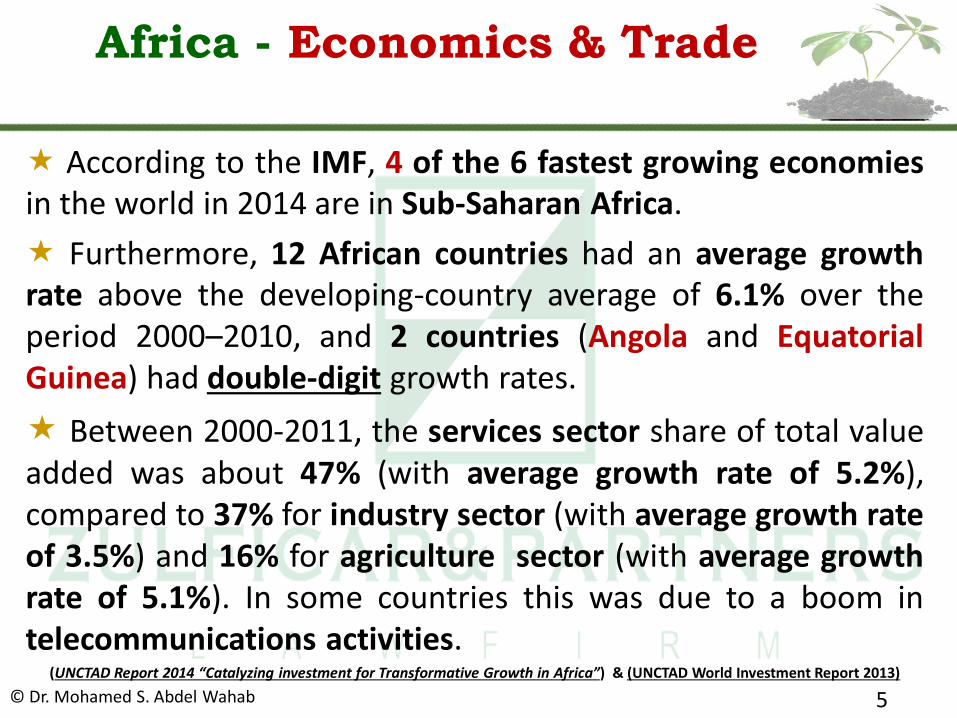
According to the IMF, 4 of the 6 fastest growing economies in the world in 2014 are in Sub-Saharan Africa.
Furthermore, 12 African countries had an average growth rate above the developing-country average of 6.1% over the period 2000–2010, and 2 countries (Angola and Equatorial Guinea) had double-digit growth rates.
Between 2000-2011, the services sector share of total value added was about 47% (with average growth rate of 5.2%), compared to 37% for industry sector (with average growth rate of 3.5%) and 16% for agriculture sector (with average growth rate of 5.1%). In some countries this was due to a boom in telecommunications activities.
(UNCTAD Report 2014 “Catalyzing investment for Transformative Growth in Africa”) & (UNCTAD World Investment Report 2013)
5 © Dr. Mohamed S. Abdel Wahab
Africa - Economics & Trade
Favourable commodity prices, stronger economic cooperation with emerging economies, higher official development assistance since 2000, and an increase in FDI flows contributed to economic growth process.
Over the past two decades the average investment rate in Africa hovered around 18%. (This is well below the 25% target for reducing poverty). However, only 9 countries in Africa have sustained investment rates of 25% and above. These are: Algeria, Botswana, Cape Verde, the Congo, Equatorial Guinea, Guinea, Lesotho, Sao Tome and Principe, and Seychelles.
(UNCTAD Report 2014 “Catalyzing investment for Transformative Growth in Africa”)
6 © Dr. Mohamed S. Abdel Wahab
Africa - An Investment Magnet?
In 2012, Africa received US$50 billion in FDIs (about 3.7% of global inflows). This reached US$56.3 billion in 2013. (In 2008, the US$59 billion represented about 3.2% of global inflows).
Africa continues to attract relatively small FDI compared to other continents. Nevertheless, it attracted significant FDIs into the manufacturing and services sectors, the extractive industries account for the bulk of FDIs in the past decade.
In North Africa, FDIs increased by 35% (US$11.5 billion in 2012 - still much lower than the levels reached by Egypt prior to 2011). In East Africa, recently discovered gas reserves in Tanzania and oil fields in Uganda increased FDIs from US$4.5 billion in 2011 to US$6.3 billion in 2012.
(UNCTAD Report 2014 “Catalyzing investment for Transformative Growth in Africa”) & (UNCTAD World Investment Report 2013)
7 © Dr. Mohamed S. Abdel Wahab
Africa – Foreign Direct Investment
Between 2012-2014, FDI outflows from Africa tripled compared to outflows from developing Asia and Latin America and the Caribbean remained at their 2011 levels.
Measured by FDI stock, Malaysia, South Africa, China and India are the largest developing-country investors in Africa.
South Africa ranked as the 15th top host economy for 2013-2015 (UNCTAD Survey, 2013). It has abundant human, financial and natural resources. Over the period 2000 – 2011, South Africa’s average investment ratio was about 17.9%, compared to the continental average of 18.7% and the world average of 21.7%.
(UNCTAD Report 2014 “Catalyzing investment for Transformative Growth in Africa”) & (UNCTAD World Investment Report 2013)
8 © Dr. Mohamed S. Abdel Wahab
Africa – Foreign Direct Investment
21 out of 40 riskiest economies in the world are African States, with the 5 riskiest in Africa. Such risks, whether perceived or real, adversely impact FDI and include: Macroeconomic volatility, political instability, legal uncertainty, policy reversals, poor infrastructure, high transactions cost associated with starting and operating a business and weak enforcement of contracts. (Weak infrastructure reduces productivity of companies in Africa
by 40% and growth of per capita income by 2%).
14 out of 20 least competitive countries on the Global Competitiveness Index are in Africa, and Africa trails behind South East Asia, and Latin America and the Caribbean, with the greatest gap in: quality of institutions, infrastructure, macroeconomic stability, education and ICTs. (World Economic Forum, 2013)
9 © Dr. Mohamed S. Abdel Wahab
Africa – FDI Risks and Challenges

10 © Dr. Mohamed S. Abdel Wahab
• Seth and Osiris/Horus dispute resolved by Thoth (He who decides impartially).
• Arbitrating funerary
trust arrangements in 2500 B.C. and 2300 B.C.
• Arbitrating Tribal Disputes (Africa). Before
the advent of colonial rules in Africa, arbitration was known and (is still) prevalent in the customary laws of African jurisdictions or societies. Its nature, purpose and philosophy were entirely different from those of the arbitration imported into the continent.
Africa - Arbitrium Historia

In the MENA and SSA regions the legal framework on Alternative Dispute Resolution (ADR) is perceived as a moderate to minor obstacle to FDI.
The Arbitrating and Mediating Disputes Perception Score (AMDPS) measures the average perception of contributors, based on a scale from 1 to 5, of the extent to which the legal framework on ADR is an obstacle to FDI. The highest scores indicate the regions where the obstacle is perceived as bigger. The highest scores are 2.7 in SSA region and 2.8 in MENA region. (FDI Regulations database, 2012)
There seems to be a direct relationship between FDI and AMDPS. Economies that score better on the AMDPS tend to facilitate the receipt of more FDI inflows.
11 © Dr. Mohamed S. Abdel Wahab
Africa & the World: ADMPS & FDI
12 © Dr Mohamed S. Abdel Wahab
1967 1959
1989
1959
1997
1996
1977
1989
1962
1965
1998
1963
1989
2014
2009
1992
1976
1974
1987
1994 1965
1970
1994
2002
1995
2013
2005
1991
1968
1991
2007
1988
1972
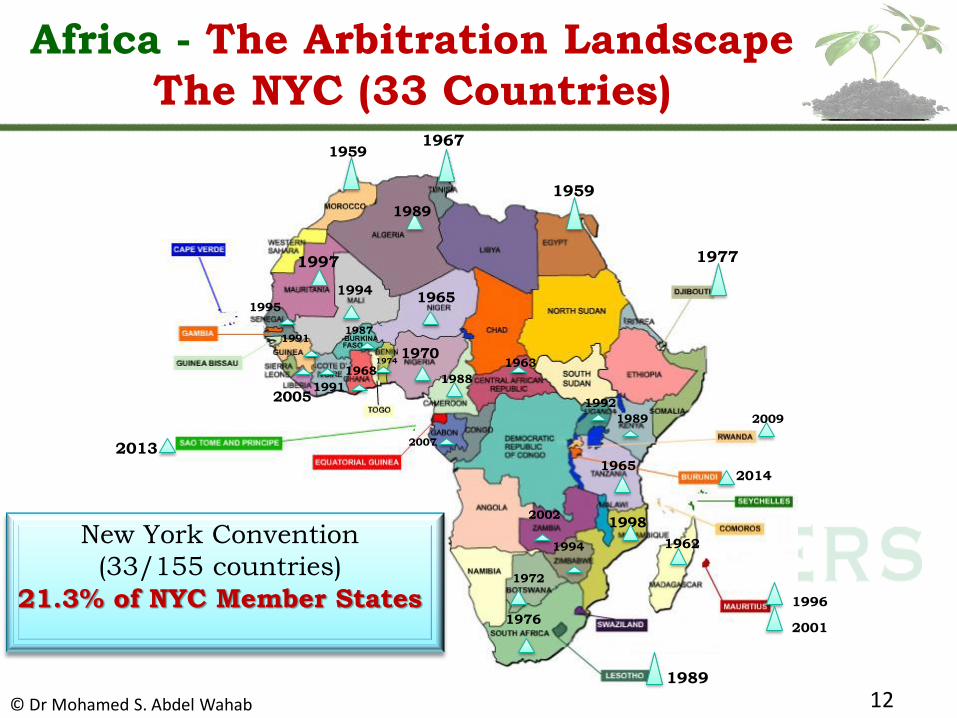
New York Convention
(33/155 countries)
21.3% of NYC Member States
2001
Africa - The Arbitration Landscape
The NYC (33 Countries)

13 © Dr Mohamed S. Abdel Wahab
1993
1990
2008
1998
1994
1995 2008
2000
1996
2000
UNCITRAL ML
(10/69 countries)
14.5% of total number of
ML adopting States
Africa - The Arbitration Landscape
The ML (10 Countries)

© Dr Mohamed S. Abdel Wahab 14
OHADA Uniform Arbitration
Act (1999) 17 countries
Africa - The Arbitration Landscape
OHADA Uniform Arb. Act (17 Countries)
© Dr Mohamed S. Abdel Wahab 15
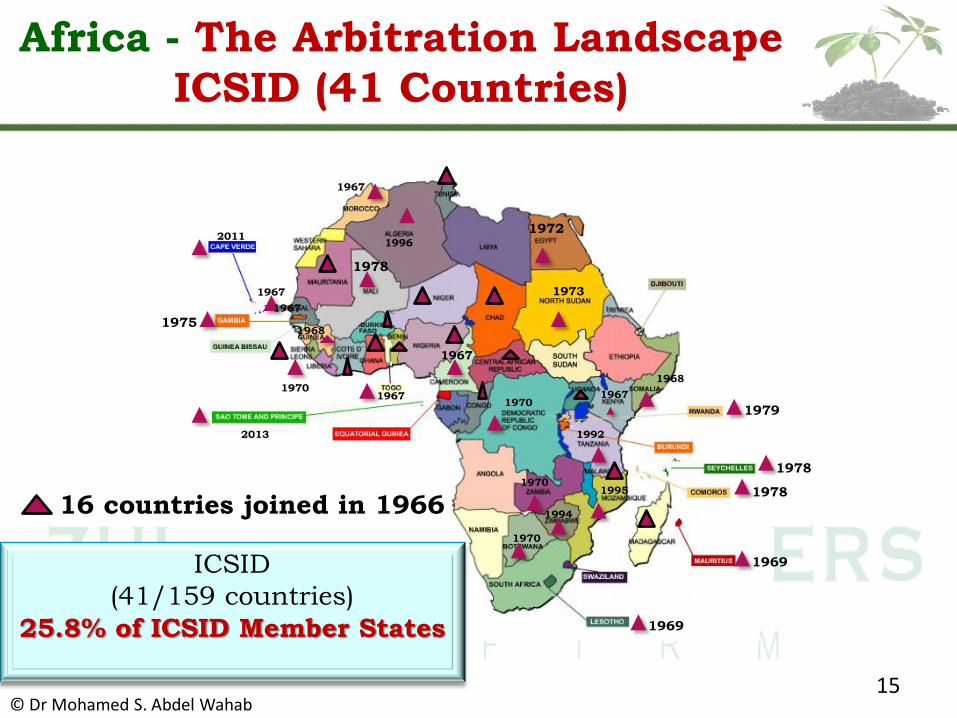
ICSID
(41/159 countries)
25.8% of ICSID Member States
16 countries joined in 1966
1967
1967
1968
1967
1967
1967
1968
1967
1969
1969
1970
1970
1970
1970
1972
1973
1975
1978
1978
1978
1979
1994
1996
1995
1992 2013
2011
Africa - The Arbitration Landscape
ICSID (41 Countries)

© Dr Mohamed S. Abdel Wahab 16
Africa - The Arbitration Landscape
Arbitration Centers/Institutions

Africa – Statistical Share in
International Institutional Arbitration
17 © Dr. Mohamed S. Abdel Wahab
ICC
20
13
Sub-Saharan Africa cases involved parties from 29 nationalities and seats in 8 countries in the region. African involvement increased by more than 85% in 14 years.
In 2010, 70% of the seats of arbitration were in Europe, 14% in Asia/Pacific, 14.5% in the Americas, and 1.5% in Africa (compared to 0.5% ten years ago). In 2013, cases involving State and State owned entities (86 cases out of 767) 34% came from Africa (9% North Africa and 26% Sub-Saharan Africa).
LCIA
20
13
A total of 290 arbitrations were referred to the LCIA with around 12% involving African Parties (with Mauritius 1.8% and Nigeria 2% and South Africa 1.4%)

The most active African States in arbitration (in terms of known number of cases) are: Egypt, Mauritius, Nigeria, South Africa, Tunisia.
African States concluded 828 known BITs, with the following 6 countries having concluded the highest number of BITs: (ICSID &
UNCTAD Statistics)
Egypt (around 102-109 BITs)
Morocco (around 63-67 BITs)
Tunisia (around 54-59 BITs)
South Africa (around 50 BITs)
Algeria (around 42-47 BITs)
Mauritius (around 38-41 BITs) 18 © Dr. Mohamed S. Abdel Wahab
Africa & the World:
The International Arbitration Landscape
The total number of known treaty-based cases (1987-2013) reached 568 cases. About three-quarters of which were brought against developing and transition economies.
The top 10 Respondent States (1987-2013) included 1 African State (Egypt) and 3 South American States (Argentina, Ecuador, Venezuela) and 3 East European States (Poland, Czech Republic, Ukraine).
(UNCTAD Recent Developments in ISDS, 2014 Report)
19 © Dr. Mohamed S. Abdel Wahab
Africa & the World:
International Investment Arbitration

20 © Dr. Mohamed S. Abdel Wahab
Africa & the World: ICSID
Statistics until 31 Dec. 2014
In total and until 31 December 2014, ICSID had registered
497 cases, with 26% State Parties involved from the MENA and SSA regions (10% MENA region and 16% SSA region).
In terms of economic sectors: the Oil, Gas & Mining sector topped the chart by 26%, followed by the energy and power sector with 14% of all registered cases.
With respect to appointed arbitrators, conciliators and ad hoc committee members:
MENA & SSA regions 6%
Western European and North American regions 69%
(ICSID Caseload Statistics Issue 2015-1)

21 © Dr. Mohamed S. Abdel Wahab
Africa & the World: ICSID
Statistics in 2014 ONLY
In 2014: ICSID registered 38 cases. 9 cases were filed against African States (23.68%).
21% of the 9 cases filed against countries from the SSA region.
3.6% of the 9 cases filed against countries from the North Africa region.
The 9 cases were brought against 8 African States:
(ICSID Caseload Statistics Issue 2015-1)
Gambia 2
Egypt 1
Mauritania 1
Senegal 1
Mozambique 1
Sudan 1
Guinea 1
Burundi 1
22 © Dr. Mohamed S. Abdel Wahab
Africa & the World: ICSID
Statistics in 2014 ONLY
In 2014: Oil, Gas & Mining disputes topped the chart with 37%, followed by energy and power disputes 26% of the 2014 registered cases.
In 2014: only 4 African arbitrators were appointed (Morocco, Somalia, Egypt, and Nigeria) out of 155 appointed arbitrators. Arbitrators from France, UK and USA topped the appointments with 19, 11, and 10 appointments respectively.
(ICSID Caseload Statistics Issue 2015-1)

Epilogue: The Changing Landscape of
International Arbitration –
Enculturation and Evolution
The Emergence of ‘Arbitral Enculturation/ Acculturation’: The ‘Third Culture’
The International Arbitration Cosmos: Spatial – Temporal Continuum & Global Competition and Seat Saturation (Traditional, New and Migrating Seats).
23 © Dr. Mohamed S. Abdel Wahab

Africa
Thank you! © Dr. Mohamed S. Abdel Wahab 24