Embed Size (px)
Citation preview

UNITED NATIONS INDUSTRIAL DEVELOPMENT ORGANIZATION Vienna International Centre, P.O. Box 300, 1400 Vienna, Austria
Tel: (+43-1) 26026-0 · www.unido.org · [email protected]
OCCASION
This publication has been made available to the public on the occasion of the 50th
anniversary of the
United Nations Industrial Development Organisation.
DISCLAIMER
This document has been produced without formal United Nations editing. The designations
employed and the presentation of the material in this document do not imply the expression of any
opinion whatsoever on the part of the Secretariat of the United Nations Industrial Development
Organization (UNIDO) concerning the legal status of any country, territory, city or area or of its
authorities, or concerning the delimitation of its frontiers or boundaries, or its economic system or
degree of development. Designations such as “developed”, “industrialized” and “developing” are
intended for statistical convenience and do not necessarily express a judgment about the stage
reached by a particular country or area in the development process. Mention of firm names or
commercial products does not constitute an endorsement by UNIDO.
FAIR USE POLICY
Any part of this publication may be quoted and referenced for educational and research purposes
without additional permission from UNIDO. However, those who make use of quoting and
referencing this publication are requested to follow the Fair Use Policy of giving due credit to
UNIDO.
CONTACT
Please contact [email protected] for further information concerning UNIDO publications.
For more information about UNIDO, please visit us at www.unido.org
Republic of Korea
PRODUCTIVITY PERFORMANCE IN DEVELOPING COUNTRIES
Country case studies
Republic of Korea
Hak K. Pyo November 2005
i

Productivity performance
This paper has not been formally edited. The designations employed and the presentation of material in this publication do not imply the expression of any opinion whatsoever on the part of the Secretariat of the United Nations Industrial Development Organization concerning the legal status of any country, territory, city or area, or of its authorities, or concerning the delimitation of its frontiers or boundaries. The opinions, figures and estimates set forth are the responsibility of the author and should not necessarily be considered as reflecting the views or carrying endorsement of UNIDO. The designations “developed” and “developing” economies are intended for statistical convenience and do not necessarily express a judgment about the stage reached by a particular country or area in the development process. Mention of firm names or commercial products does not imply endorsement by UNIDO. Material in this paper may be freely quoted but acknowledgement is requested with a copy of the publication containing the quotation or reprint.
ii

Republic of Korea
Contents Page
Contents iii
List of tables
iv
Executive summary
v
I Productivity performance in Korea: Introduction 1
1.1 Overview and context 1
1.2 Objective of study 2
1.3 Methodology 2
1.4 Organization of report
2
II Growth of the economy and productivity trends 3
2.1 Record of GDP growth 3
2.2 Comparison of results with those of other studies
4
III Assessment of the major determinants of productivity 17
3.1 Reflections 17
3.2 Technology issues 17
3.3 Investment in human capital, physical capital, infrastructure 20
3.4 Institutions, integration, invariants 25
3.5 Competition, social dimension and environment 28
3.6 Issue specific to Korea
30
IV Discussion of policies with effect on productivity 33 4.1 Direct productivity enhancing policy 33
4.2 Indirect productivity enhancing policy 34
4.3 The political economy and institutional aspects
36
V Concluding remarks
39
Bibliography
41
Annex 1. Korea: Economic and poverty indicators 43
iii

Productivity performance
List of tables
Page
2.1 Index of Industrial Differences in Wages 5 2.2 Principal Economic Indicators 8
iv

Republic of Korea
Executive summary
Background and context In the literature of growth and productivity convergence, the Republic of Korea has been one of the most often-cited countries. There seem to be three main reasons why the Korean case has attracted a great deal of attention from the researchers of growth and productivity. The first reason is, naturally, Korea’s episode of rapid growth over the period of 35 years from 1962 to1997, which was termed an “economic miracle” by Lucas (1993). The second reason is the relatively well-maintained available data on basic growth and productivity performance such as GDP, employment, and investment, etc. The third reason could be its recent episode of financial crisis in 1997 with the sudden slump in productivity and growth. In these respects, the Korean episode of rapid growth and sudden slump seems to warrant a renewed analysis and explanation.
Growth of the economy and productivity trends
Korea recorded the highest growth rate (7.89%) of GDP in constant 1996 Purchasing Power Parity (PPP) prices. It had negative growth in 1980 (- 3.38%) after the second oil crisis and in 1998 (- 8.21%) after the Asian financial crisis. Except for these two years, it succeeded in achieving a remarkably high growth for four decades. The corresponding estimates in Korea’s manufacturing sector during the period of 1964-2000 are the average annual growth rate of labor productivity in manufacturing (8.24%); the average annual growth rate of per capita capital in manufacturing (8.35%); and the average annual growth rate of total factor productivity (TFP) in manufacturing (4.40%). Therefore, we conclude: 1) The growth accounting at the economy-wide aggregate level over the period of 1962-2000 in Korea exhibited a capital-input-driven growth rather than TFP-led growth, confirming the Krugman (1994) proposition. The relative contribution of TFP growth to total GDP growth was only 5.5 percent. It also confirms Nadiri’s (1972) proposition that the relative contribution of TFP to output growth is small in developing economies as compared to its critical importance in industrialized economies. 2) The manufacturing sector in Korea has accumulated capital at a faster rate (11.21%) than the aggregate economy (8.43%), and has increased employment, too, at a faster rate (5.32%) than the aggregate economy (2.78%). Its growth rate in capital deepening (8.35%) is almost the same as the economy-wide growth rate (8.43%). But the relative contribution of TFP in manufacturing (32.9%) is much more significant than that at the aggregate economy-wide level (5.5%). Therefore, Korea’s rapid growth was manufacturing-led growth, and the significant contribution of its TFP seems to have exercised a spillover effect into other sectors such as the primary sector and the service sector, mitigating their lower TFP. The estimated share of labor income in manufacturing (54%) was higher than that in the aggregate economy (45%), due to higher rates of growth in employment, even though the average wage rate in manufacturing was lower than the rest of the sectors.
v

Productivity performance
The data provided by UNIDO indicates an episode of rapid productivity convergence: Korea’s per-capita income in 1961 was about 15.27 percent of US per-capita income but it reached the level of 48.4 percent of US per-capita income over four decades. We can explain the Korean experience of rapid productivity convergence through three stages. During the first stage (1962-1976) of economic development, the Park government adopted a vent-for-surplus type development strategy. The First Five-Year Development Period (1962-1966) can be characterized as a period of explosive export growth. The export amount in current US dollars increased from US$54.8 million in 1962 to US$253.7 million, or by about five times. Helped by extraordinary export performance, the annual average GDP growth rate increased at 8.5%, exceeding the target rate (7.1%). In general, it was a period when the nationalistic feeling was very high. The foreign direct investments did not receive much credit, due to strong anti-Japanese sentiment, and the Park government, therefore, opted for inducing project loans from the Asian Development Bank and the World Bank and using them for basic industries such as steel and cement and social infrastructure such as highways and railroads and power plants, etc. Most private projects were awarded to private firms, usually to qualified conglomerates, through the Korea Development Bank, the Korea Export Import Bank, the Korea Medium and Small Enterprise Bank and other commercial banks, through syndicated loans or government-subsidized policy loans. For getting next-round loans, one of the most important criteria was export performance by the loan-awarded companies. Both the government and banks monitored the companies’ performances. This criterion of export-performance exercised a constant pressure on private firms and their owners and entrepreneurs so that they were almost obsessed with how to sell their products in overseas market. Even though there must have been a lot of distortion effect, the explicit criterion of export priority reduced the arbitrariness by bureaucrats and bankers and made the monitoring system relatively more transparent than that under the import substitution system. Entering the second stage (1977-1986), the Korean economy experienced the second oil crisis in the early 1980s, and had to go through restructuring the past investments in heavy and chemical industries made during the late 1970s. But this was the period when major conglomerates such as Samsung, Lucky Goldstar (LG) and Hyundai started investing in semi-conductor industries because they anticipated the technology frontier in that industry and because the government wanted to promote competition in the industry. During this period the Korean government moved from a direct industrial support policy to an indirect support policy. For example, they tried to shift the paradigm of industrial promotion from directly subsidizing an industry such as steel or automobiles to indirectly promoting investments in energy saving, conserving the environment, and introducing new technologies through enhanced R&D programs. It was also a period in which trade liberalization before capital market opening was seriously deliberated as a backdrop against rising wages and trade unionism. The third stage (1987-2000) is characterized by a turbulent transition from an authoritarian regime to a more democratic one. It was a period in which Korea pursued import liberalization and capital market opening by joining the WTO and the OECD. It was a period when Korean conglomerates engaged in excessive competition in a pattern of monopolistic competition across industries. Many of them invested in pre-emptive investment projects in non-tradable sectors to stay alive against increasing foreign and
vi
Republic of Korea
domestic competition. The monitoring system by both government and banks became less transparent and a lax financial supervision created a vast network of moral hazard. It was also a period of rapidly declining rates of return on capital in Korea. As the Independent Evaluation Office of the IMF described it, the Korean financial crisis of 1997 was a twin crisis: both a foreign exchange crisis and a domestic credit crunch. During the post-crisis IMF programs, there was both corporate and financial restructuring, and about two-thirds of the top 30 conglomerates went bankrupt. But toward the end of this stage, the Korean economy was affected by the New Economy and the IT revolution. There was substitution of investments from conventional non-IT sectors to IT sectors. However, the employment absorption by IT sectors was rather weak and, once the IT boom was over by 1999, the investment became quite stagnant, casting doubt on new sources of sustainable growth for the Korean economy.
My explanation of this significant episode of rapid productivity convergence by Korea is based on two key phrases: ‘potential initial conditions’ and ‘structural change and transformation’. By ‘potential initial conditions’, I mean that we need to identify the state of initial conditions of the country not only by visible and quantifiable indicators but also by often-hidden indicators. These hidden indicators are known as deep determinants (Rodrik et al., 2002), and are typically of a social, religious and political nature. Among the potential initial conditions, I argue that historical heritages, which are often embodied in institutions and commercial practices, are the most important determinant because they ultimately shape policy environments and determine the success or failure of later development programs. In the case of Korea, I can single out three such initial conditions among hundreds of potential conditions. The first is a colonial heritage that the primary school enrollment ratio was once increased from less than 5 percent to 30 percent in the 1930s. The second is the episode of an early land reform after independence before interest groups could be formed and allied. The third is the expansion of primary education in the mid-1950s under the influence of the American mass-education system. The first and the third elements combined formed the basis of what I define as the two-tier system of human capital, which is a unique historical heritage of Korea. In summary, the episode of rapid productivity convergence in Korea was made possible by the successful adoption of a development strategy based on incremental comparative advantage and industrial restructuring on the initiative of the government. It was a consequence of interaction between market forces and government intervention.
Assessment of the major determinants of productivity
Among numerous determinants which must have mutually interacted, I would, without hesitation, rate human capital determined by historical precondition as the most important. The enlargement of primary education and upward mobility in the education system are the key elements in improving a nation’s stock of human capital. Human capital enhances knowledge, absorptive capacity, indigenous R&D efforts, and institutional environments.
The second most important determinant is the maturity of social institutions and political stability. Without maturity and stability in socio-economic institutions, a development program cannot be maintained. We can find numerous histories of failure in development
vii

Productivity performance
programs in modern world history. Most of them have failed not because there was a lack of physical capital or resources but because there was social disruption and political instability.
Discussion of policies with effect on productivity
It is well known that increased spending on R&D can lead to the discovery of new technologies or the development of new products that contribute to higher productivity. But in many developing countries, R&D can be wasted because of a lack of R&D infrastructure and motivation for indigenous R&D effort. Korea was no exception. It was only after experiencing two-rounds of oil crisis and the first year of negative real GDP growth (-2.1%) in 1980 that the new government of the post-Park regime realized the limitation of extensive growth based on factor accumulation and capacity expansion under the “ Heavy and Chemical Industrialization Policy ” and started to seek new sources of growth. According to MCI, the policy targets announced in February 1982 included export promotion with enhanced value-added, the upgrading and rationalizing of industrial structure, and the enhancement of industrial competitiveness through maintaining balanced growth among different sectors.
Concluding remarks
The overall assessment of the macroeconomic performance of Asian-Crisis countries is that the rebound of growth over the period of 1999-2000 slowed down in the subsequent period of 2001-2003, mainly because of stagnant demand for domestic investment across all crisis-inflicted economies. In particular, the domestic investment in machinery and equipment was very disappointing. For example, in the case of Korea, its average annual growth rate was 17 percent during the pre-crisis period of 1994-1996, and became negative during the crisis-years in 1997 (-9.6%) and 1998 (-42.3%). Then the average annual growth rate became explosively positive in 1999 (36.8%) and 2000 (33.6%), but suddenly dropped in 2001 (-9.0%), 2002 (7.5%) and 2003 (-1.2%). In order to resume sustainable growth and renew the productivity convergence, Korea needs to find a new paradigm and system under drastically changed social and political landscapes.
The Korean economy has been struggling to find such a path under a non-authoritarian regime. It may take much longer than expected because, under the current mode of globalization, relying on market mechanism seems to be the only solution for a small open economy like Korea’s.
viii

Republic of Korea
I. Productivity performance in Korea: Introduction
1.1 Overview and context In the literature of growth and productivity convergence, the Republic of Korea (hereinafter called Korea) has been one of the most often-cited countries (see, for example, Lucas (1993), Young (1994), Baumol, Nelson and Wolff (1994), and Rodrik (2003)). There seem to be mainly three reasons why the Korean case has attracted a great deal of attention from the researchers of growth and productivity. The first reason is, naturally, Korea’s episode of rapid growth over the period of 35 years from 1962 to1997,, which was termed an “economic miracle” by Lucas (1993). The second reason is the relatively well-maintained available data on basic growth and productivity performance such as GDP, employment, and investment, etc., as documented in Pyo (2002). The Bank of Korea published National Income Accounts for the period of 1953-1970 (old accounts) and 1970-2003 (new accounts). The National Statistical Office has published a national wealth survey (capital stock) for four benchmark years (1968, 1977, 1987 and 1997). The third reason could be its recent episode of financial crisis in 1997 with the sudden slump in productivity and growth. In these respects, the Korean episode of rapid growth and sudden slump seems to warrant a renewed analysis and explanation.
The actual time span of the period to be covered by the present case study can be divided into three stages as follows:
The First Stage (1962-1976):
The First Five-Year Economic Development Plan was launched by President Park in 1962. Under this plan, Korea invested in basic infrastructure (highway and ports, etc.) and basic industries (steel and cement, etc.) and light manufactures (clothing and electronics, etc.) until the first oil crisis (1974).
The Second Stage (1977-1986):
This period involved Korea’s investment in heavy and chemical industries, and regime-change from President Park to the Post-Park authoritarian regime under President Chun. During this period, Korean conglomerates went through the restructuring of heavy and chemical industries and entered into semi-conductor industries.
The Third Stage (1987-2000):
This was Korea’s turbulent transition period after hosting the 1988 Olympic Games, with a movement toward more democratic regimes and trade and financial liberalization, including accession to the WTO and the OECD, until the financial crisis in 1997. The post-crisis recovery was attempted but the stagnation of investment continued while, on the other hand, the IT revolution created a new socio-political environment.
The present report is organized as follows: In this section we will analyze productivity change over four decades, and discuss significant episodes of productivity convergence by Korea, based on the UNIDO data. In Section Two, assessments of the major determinants of productivity will be made and their link to productivity change will be
1

Productivity performance
examined. Section Three will present the mechanism of input-driven policies and productivity performance. A final section concludes the report. We will start with a set of UNIDO-provided data for Korea (total factor productivity and labor productivity levels at the aggregate and manufacturing sector levels for the time period 1960-2000). Then we will discuss the relationship between overall total productivity growth and the growth of average labor productivity at both the aggregate and the manufacturing sector levels. Since the UNIDO data set on total factor productivity is decomposed by efficiency change and technical change in both level index and percentage change, we may provide different interpretations of efficiency change and technical change.
1.2 Objective of study This study aims to investigate productivity performance in Korea, with the growth of the overall economy as the main focus. The investigation is intended to analyse general factors as well as factors specific to Korea. 1.3 Methodology Secondary data from official government documents have been used. In particular, comparative cross-country TFP data provided by UNIDO were used to discern trends. Primary data were generated through a limited sample survey to validate some of the assertions made. 1.4 Organization of report In addition to this brief introduction, a description of growth and productivity trends is presented in the next section. Section three provides an assessment of the major determinants of productivity, while section four presents a discussion of policies affecting productivity in Korea. Section five, devoted to concluding remarks, completes the report.
2

Republic of Korea
II. Growth of the economy and productivity trends This section presents an analysis of the growth of the economy and productivity trends. The discussion starts with a brief account of GDP growth over the years. 2.1 Record of GDP growth
Growth performance
According to estimates made by UNIDO, the overall productivity performance of Korea during the period of 1962-2000 can be summarized in terms of average annual growth rates in constant 1996 PPP as follows:
GDP growth (DY) = 7.89% Capital deepening (DKL) = 8.43%
Labor productivity growth (DLP) = 5.11% TFP growth (DTFP) = 0.43%
Change in technical efficiency (DEFFCH) =0.28% Technical change (TECHCH) = 0.36%
The estimates seem to be consistent with my own estimates from various sources of data, which is attached in the Appendix. From the UNIDO list of 15 developing countries, Korea recorded the highest growth rate (7.89%) of GDP in constant 1996 PPP prices. It recorded negative growth in 1980 (- 3.38%) after the second oil crisis and in 1998 (- 8.21%) after the Asian financial crisis. Except for these two years, it succeeded in achieving a remarkably high growth for four decades. The decomposition of economy-wide aggregate growth accounting in per-capita terms can be made as follows:
DLP (5.11%) = SK (0.55) × DKL (8.43%) + DTFP (0.43%) (1)
where SK is the average share of capital income in total GDP, which is imputed as 0.55 (55%) from the estimates of DLP, DKL and DTFP, using the above identity. Alternatively, the decomposition of GDP growth can be made as follows: DY (7.89%) = SK (0.55) × DK (11.21%) + SL (0.45) × DL (2.78%) + DTFP (0.43%) (2)
where DK is the average growth rate of capital, SL is the average share of labor income in total GDP, and DL is the average growth rate of labor employment. From UNIDO estimates of DY, DLP and DKL, we have imputed DK and DL, using the following identity:
DLP (5.11%) = DY (7.89%) – DL (2.78%) (3) DKL (8.43%) = DK (11.21%) – DL (2.78%) (4) Even though we have imputed shares of capital income and labor income from the UNIDO estimates of the rest of the variables in the identity of growth accounting as above, in principle there are two alternative ways of estimation. One way is to estimate
3
Productivity performance
the average of the ratio of wages to value-added in the aggregate economy over the full period, and the other is to is to take the average of changing annual wage shares in the aggregate economy from the annual National Income Accounts statistics on gross national income and wages and salaries. However, both estimates of labor income will underestimate the contribution of labor input relative to capital input because it does not incorporate the contribution of farmers’ own labor and proprietors’ labor in the retail and wholesale sector etc. As a consequence, for the aggregate economy of Korea, where capital deepening has dominated the total factor input, the underestimation of the labor share (SL) and, therefore, the overestimation of the capital share (SK) tend to bias upward the contribution of total factor input and, accordingly, bias downward the contribution of total factor productivity.
2.2 Comparison of results with those of other studies
Manufacturing productivity growth
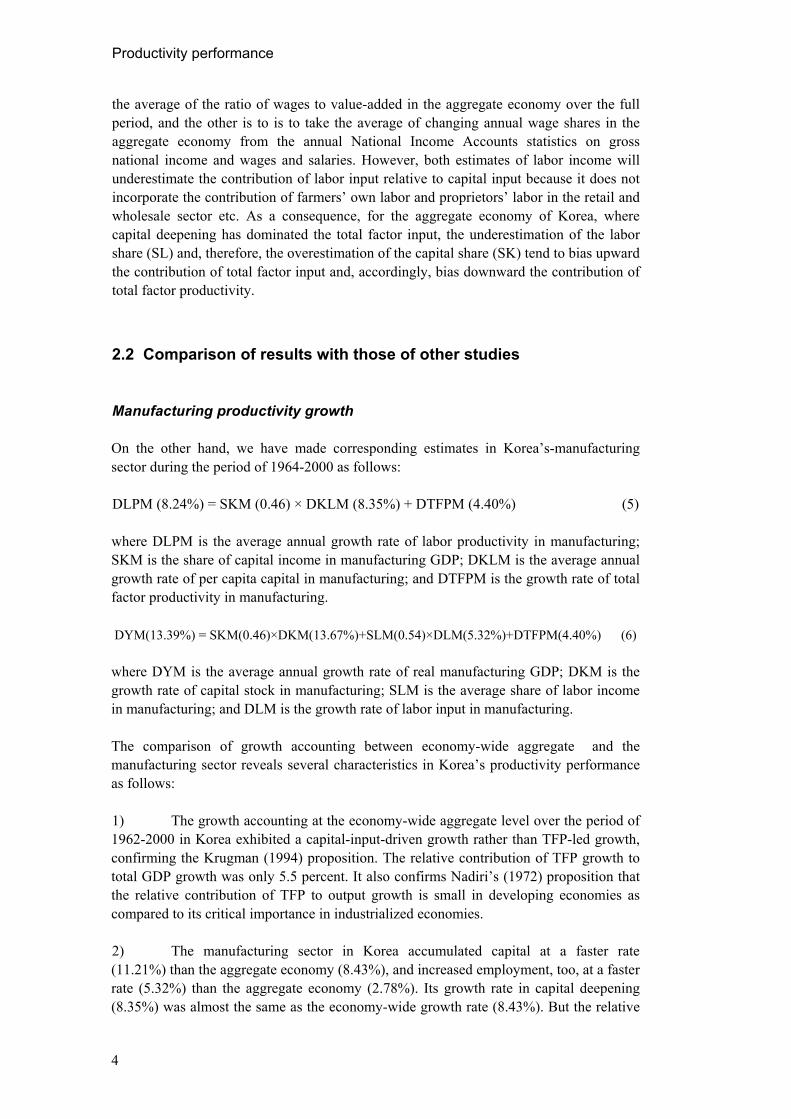
On the other hand, we have made corresponding estimates in Korea’s-manufacturing sector during the period of 1964-2000 as follows: DLPM (8.24%) = SKM (0.46) × DKLM (8.35%) + DTFPM (4.40%) (5)
where DLPM is the average annual growth rate of labor productivity in manufacturing; SKM is the share of capital income in manufacturing GDP; DKLM is the average annual growth rate of per capita capital in manufacturing; and DTFPM is the growth rate of total factor productivity in manufacturing. DYM(13.39%) = SKM(0.46)×DKM(13.67%)+SLM(0.54)×DLM(5.32%)+DTFPM(4.40%) (6)
where DYM is the average annual growth rate of real manufacturing GDP; DKM is the growth rate of capital stock in manufacturing; SLM is the average share of labor income in manufacturing; and DLM is the growth rate of labor input in manufacturing. The comparison of growth accounting between economy-wide aggregate and the manufacturing sector reveals several characteristics in Korea’s productivity performance as follows:
1) The growth accounting at the economy-wide aggregate level over the period of 1962-2000 in Korea exhibited a capital-input-driven growth rather than TFP-led growth, confirming the Krugman (1994) proposition. The relative contribution of TFP growth to total GDP growth was only 5.5 percent. It also confirms Nadiri’s (1972) proposition that the relative contribution of TFP to output growth is small in developing economies as compared to its critical importance in industrialized economies. 2) The manufacturing sector in Korea accumulated capital at a faster rate (11.21%) than the aggregate economy (8.43%), and increased employment, too, at a faster rate (5.32%) than the aggregate economy (2.78%). Its growth rate in capital deepening (8.35%) was almost the same as the economy-wide growth rate (8.43%). But the relative
4

Republic of Korea
contribution of TFP in manufacturing (32.9%) is much more significant than that at the aggregate economy-wide level (5.5%). Therefore, Korea’s rapid growth was manufacturing-led growth, and the significant contribution of its TFP seems to have exercised a spillover effect into other sectors such as the primary sector and the service sector, mitigating their lower TFP. 3) The estimated share of labor income in manufacturing (0.54) was higher than that in the aggregate economy (0.45), due to higher rates of growth in employment, even though the average wage rate in manufacturing was lower than in the rest of the sectors. According to the Korea National Statistical Office, the industrial differences in wages were as follows in 1980 and 2000, where the index of manufacturing wage is treated as base index (100):
Table 2.1 Index of industrial differences in wages 1980 2000
Agriculture, Forestry and Fishery 138.4 110.8
Mining 145.4 106.7
Manufacturing 100.0 100.0
Electricity, Gas and Water 179.5 153.9
Construction 197.2 108.1
Wholesale, Retail, Restaurants and Hotels 139.1 95.7
Transport, Storage and Communication 136.9 111.8
Finance, Insurance, Real Estate and Business Service 170.6 121.7
Community, Social and Personal services 187.4 105.3
Sources: Korea National Statistical Office, Social Indicators in Korea, 2001
The wage differential between manufacturing and non-manufacturing was reduced from 1980 (100: 161.8) to 2000 (100: 114.2). There was a significant catch-up in the level of manufacturing wages to non-manufacturing wages due to the changes to a productivity-based compensation policy, strong union activity in manufacturing, and an increase in skill-intensity in manufacturing labor. The overall productivity trends at both the aggregate economy-wide level and the manufacturing level seem to suggest that the growth of TFP may not seem significant in the aggregate sense but that it played a crucial role indirectly through lifting up the productivity of the manufacturing sector.
Technical change and technical efficiency
UNIDO has applied Data Envelopment Analysis (DEA) to obtain the change in technical efficiency and technical change, and the Malmquist index to obtain TFP growth. It is argued that the advantage of this method is that it does not assume any functional form, and no assumptions about perfect competition, profit maximization, etc. are needed. It is further argued that, technically, DEA involves the use of linear programming methods to construct a non-parametric piece-wise frontier (or surface in the case of several outputs).
5

Productivity performance
From UNIDO estimates of TFP growth (DTFP) for the Republic of Korea (1962-2000), we calculated the average TFP growth rate of 0.43 percent, which confirms UNIDO estimate of DTFP in equations (1) and (2). In addition, both Korea’s average change in technical efficiency (DEFFCH) and average change in technical change (TECHCH) are estimated to be 0.28 percent and 0.36 percent respectively. The picture might have been quite different if we had the corresponding estimates in manufacturing because the relative contribution of TFP in the sector (32.9%) was a lot bigger than that in the aggregate economy. Therefore, the magnitudes of both change in technical efficiency and change in technical change must have been bigger in manufacturing than those in the aggregate economy. Now it is apparent that, in the case of Korea, the overall productivity gain was driven by the manufacturing sector and the sector’s growth was driven not only by the fast accumulation of rival inputs (capital and labor), which accounted for two-thirds of the manufacturing GDP growth, but also by the growth of TFP, which accounted for the remaining one-third of the manufacturing growth. In summary, we can argue that, in the case of Korea, the growth of TFP may not seem significant in the aggregate sense but it played a crucial role indirectly through lifting up the productivity of the manufacturing sector. In particular, the growth in technical efficiency and technical change in the manufacturing sector must have worked in two directions to lift up productivity in the rest of the sectors: one is a direct effect on manufactures-user industries and the other is an indirect effect of spillover and learning-by-doing. For example, computer manufacturing and assembly causes a lifting up of the productivity of computer-using service industries, and computer manufacturing itself generates a spillover effect and induces learning-by-doing by other industries’ manpower. Productivity convergence
The data provided by UNIDO indicates the following convergence of Korea’s labor productivity relative to the US:
Korea’s labor productivity relative to the US, 1961: 15.27 Korea’s labor productivity relative to the US, 2000: 48.40
It provides an episode of rapid productivity convergence: Korea’s per-capita income in 1961 was about 15.27 percent of US per-capita income, but it reached the level of 48.4 percent of US per-capita income over four decades. As pointed out by Lucas (1993), we need a growth theory that incorporates the possibility of rapid-growth episodes and productivity convergence. No single theory could explain this episode because it involves more than the growth of an aggregate economy; it should deal with the complex story of development with late industrialization. It would be tempting to say that everything the Korean Government did was appropriate and timely and that the interaction between government and market in Korea was well coordinated. However, a careful examination of the past development history of Korea reveals that there were pros and cons and ups and downs and that the episode of fast growth was far from smooth. The Korean economy had to go through very
6

Republic of Korea
turbulent periods, as witnessed in 1980-1981 following the second oil crisis and the assassination of President Park, and in 1997-1998 in the middle of Asian financial crisis. In what follows, I advance a set of propositions and hypotheses that may provide us with not a single theory or episode but multiples of them together, with which we could possibly lay out analytic narratives for Korea’s fast productivity convergence. I will do so by following the three chronological stages of Korean development.
(1) Reconstruction and import substitution (1953-1961)
In order to set the first stage in the right perspective, it seems necessary to briefly overview the Korean economy after the Korean War. The period of 1953-1961 can be called the Reconstruction Period. As a consequence of a devastating war, which lasted three years, the magnitude of war destruction was immense. According to Lee (2001), in the agricultural sector total land that could be used for production was damaged by 27.4 percent and the rice harvest declined by 40 percent from 1948. The magnitude of destruction in the industrial sector is estimated to be about 60 percent on average. In particular, the destruction of light manufacturing facilities worsened the shortage of basic industrial products such as food, clothing and other basic necessities. It was a period in which the Korean government relied heavily on foreign aid to stabilize the domestic economy and carry out a minimum reconstruction investment. During the period, total foreign aid -occupied 71.3 percent of total imports and was used to purchase raw materials, semi-manufactured intermediate goods, and machinery and equipment for private sectors. The government allocated its foreign reserves to finance an extra portion of imports. Since it was a period when the Korean government used foreign aid to finance the current account deficit and to support the defense budget (34.8%) and fiscal investment and finance (64.2%), the utmost importance was given to restricting imports and promoting import substitution. The direct subsidy policy for exports was almost non-existent until 1961. During the period, the allocation of foreign exchange was centrally controlled by the Bank of Korea and both quantitative import restriction and tariff policy were administered to save foreign exchange and promote import substitution. The Ministry of Commerce and Industry announced bi-annually from 1955 the list of import items subject to three categories: 1) automatic approval items 2) restricted items and 3) prohibited items. The representative import substitutes such as cotton fabric and wheat flour and milling products, were prohibited from being imported from 1955. The tariff structure was a typical escalation system: basic necessities in shortage and non-producible products (10%); domestically-produced unfinished products (20%); domestically-non-producible finished products (30%); domestically-produced finished products (40%); semi-luxury goods (50-90%); and luxury goods (over 100%). The average tariff rate by 1957 was 40 percent.
During this period of 1953-1961, the foreign aid total reached US$2,284.6 million. The largest source was the US ICA (International Cooperation Administration) and its successor, AID (Agency for International Development) with US$1,743.7 million (76.3%), and the second and the third largest sources were CRIK and US PL (Public Law) 480 with US$218 million (9.5%) and US$202.7 million (8.9%) respectively.
7
Productivity performance
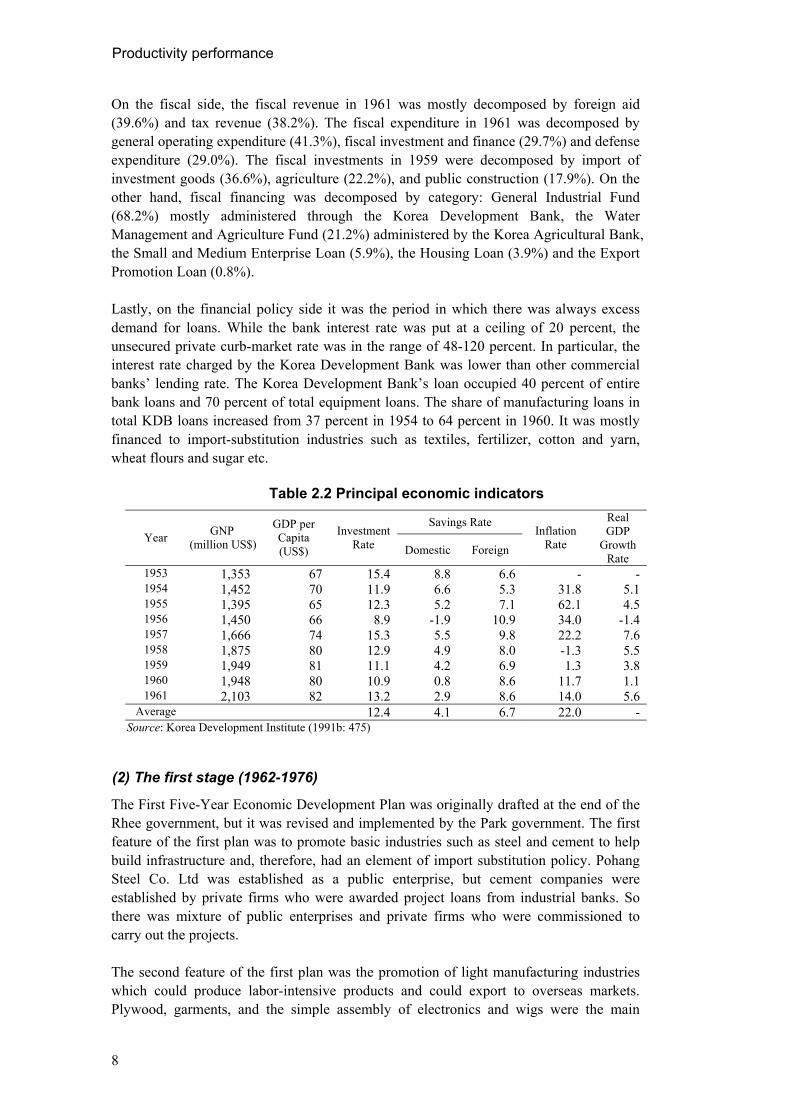
On the fiscal side, the fiscal revenue in 1961 was mostly decomposed by foreign aid (39.6%) and tax revenue (38.2%). The fiscal expenditure in 1961 was decomposed by general operating expenditure (41.3%), fiscal investment and finance (29.7%) and defense expenditure (29.0%). The fiscal investments in 1959 were decomposed by import of investment goods (36.6%), agriculture (22.2%), and public construction (17.9%). On the other hand, fiscal financing was decomposed by category: General Industrial Fund (68.2%) mostly administered through the Korea Development Bank, the Water Management and Agriculture Fund (21.2%) administered by the Korea Agricultural Bank, the Small and Medium Enterprise Loan (5.9%), the Housing Loan (3.9%) and the Export Promotion Loan (0.8%). Lastly, on the financial policy side it was the period in which there was always excess demand for loans. While the bank interest rate was put at a ceiling of 20 percent, the unsecured private curb-market rate was in the range of 48-120 percent. In particular, the interest rate charged by the Korea Development Bank was lower than other commercial banks’ lending rate. The Korea Development Bank’s loan occupied 40 percent of entire bank loans and 70 percent of total equipment loans. The share of manufacturing loans in total KDB loans increased from 37 percent in 1954 to 64 percent in 1960. It was mostly financed to import-substitution industries such as textiles, fertilizer, cotton and yarn, wheat flours and sugar etc.
Table 2.2 Principal economic indicators
Savings Rate Year GNP
(million US$)
GDP per Capita (US$)
Investment Rate Domestic Foreign
Inflation Rate
Real GDP
Growth Rate
1953 1,353 67 15.4 8.8 6.6 - - 1954 1,452 70 11.9 6.6 5.3 31.8 5.1 1955 1,395 65 12.3 5.2 7.1 62.1 4.5 1956 1,450 66 8.9 -1.9 10.9 34.0 -1.4 1957 1,666 74 15.3 5.5 9.8 22.2 7.6 1958 1,875 80 12.9 4.9 8.0 -1.3 5.5 1959 1,949 81 11.1 4.2 6.9 1.3 3.8 1960 1,948 80 10.9 0.8 8.6 11.7 1.1 1961 2,103 82 13.2 2.9 8.6 14.0 5.6
Average 12.4 4.1 6.7 22.0 - Source: Korea Development Institute (1991b: 475)
(2) The first stage (1962-1976)
The First Five-Year Economic Development Plan was originally drafted at the end of the Rhee government, but it was revised and implemented by the Park government. The first feature of the first plan was to promote basic industries such as steel and cement to help build infrastructure and, therefore, had an element of import substitution policy. Pohang Steel Co. Ltd was established as a public enterprise, but cement companies were established by private firms who were awarded project loans from industrial banks. So there was mixture of public enterprises and private firms who were commissioned to carry out the projects. The second feature of the first plan was the promotion of light manufacturing industries which could produce labor-intensive products and could export to overseas markets. Plywood, garments, and the simple assembly of electronics and wigs were the main
8

Republic of Korea
products, and most production was left to private industries. Typically, the General Trading Companies (GTC) of major conglomerates known as Chaebol, played the role of subcontracting export orders to smaller domestic firms, financing them through export financing or the domestic credit system by guaranteeing their loans to domestic banks, and marketing their products in the export market. The public enterprises and private firms started absorbing the labor force, and the shortage of labor force in manufacturing induced rural-urban migration. Korea seemed to have passed the Lewisian turning point by 1974-1975 after passing the take-off stage in the late 1960s. The government adopted an implicit rule of game or at times an explicit decree or announcement or set of directives and regulations that announced “Export Priority”. At the time of launching the first plan there was internal debate between bureaucrats and scholars about the mode of development financing. It happened to coincide with the Korea-Japan Agreement on normalizing the bilateral relationship, and Japanese grants and aids were negotiated. In general, it was a period when the nationalistic movement was very strong. The foreign direct investments did not receive much credit due to strong anti-Japanese sentiment and the Park government therefore opted for inducing project loans from the Asian Development Bank and the World Bank, and using them for basic industries such as steel and cement and for social infrastructure such as highways and railroads and power plants, etc. Most private projects were awarded to private firms, usually to qualified conglomerates through the Korea Development Bank, the Korea Export Import Bank, the Korea Medium and Small Enterprise Bank, and other commercial banks, through syndicated loans or government-subsidized policy loans. For getting next-round loans, one of the most important criteria was export performance by the loan-awarded companies. Both the government and banks monitored the companies’ performance. This criterion of export-performance exercised a constant pressure on private firms and their owners and entrepreneurs so that they were almost obsessed with how to sell their products in the overseas market. Even though there must have been a lot of distortion effect, the explicit criterion of export priority reduced the arbitrariness by bureaucrats and bankers and made the monitoring system relatively more transparent than that under the import-substitution system.
The First Five-Year Development period (1962-1966) can be characterized as a period of explosive export growth. As shown in Appendix Table A3-1, the export amount in current US dollars increased from US$54.8 million in 1962 to US$253.7 million, or by about five times. Helped by an extraordinary export performance, the annual average GDP growth rate by 8.5 percent, exceeding the target rate (7.1%). The growth momentum that was built up under the First Five-Year Development Plan was carried over to two consecutive Five-Year Development Plans until 1976, despite the first oil crisis in 1974. The actual GDP growth rates in the Second (9.7%) and the Third Five-Year Development Plans (10.1%) exceeded target rates (7.0% and 8.6% respectively). By end of the First Stage in 1976, exports (US$7,815 million) were not far off imports (US$8,405 million). During the first stage the domestic savings rate increased from 0.8 percent in 1962 to 23.1 percent in 1976, which was instrumental to Korea’s productivity convergence. Industrial structure transformed from the primary (33.4%), the
9
Productivity performance
secondary (21.7%), and the tertiary (44.9%) in 1962 to the primary (24.0%), the secondary (29.5%), and the tertiary (46.5%) in 1976. In summary, it was a truly remarkable export-led and manufacturing-oriented extensive growth, which has achieved the productivity convergence at an unprecedented speed. (3) The second stage (1975-1987)
While the first stage (1962-1976) of Korean development was characterized by the rural-urban migration and the inter-industry transformation from the primary sector to the light-manufacturing sector, the second stage (1975-1986) can be described as a period of intra-manufacturing transformation from labor-intensive industries to capital- and technology-intensive industries. The quadrupled oil prices in the 1974 oil crisis and the increasing wage rate after passing the Lewisian turning point when the period of unlimited supply of labor was over, forced the Korean government and private firms to look for alternative industries and product lines for more value-added. GTC-based conglomerates started looking for opportunities to invest in automobiles, shipbuilding, petroleum and chemical industries, and metals and industrial-machinery industries. But since some of these industries were more import-substituting industries than export-promoting industries, the monitoring system became less transparent. In the early 1980s, the Korean economy experienced the second oil crisis and had to go through restructuring the investments in heavy and chemical industries made during the late 1970s. But it was in this period that major conglomerates such as Samsung, Lucky Goldstar (LG) and Hyundai started investing in semi-conductor industries because they anticipated the technology frontier in that industry and the government wanted to promote competition in the industry as outlined in Pyo (2000). During this period the Korean government moved from a direct industrial-support policy to an indirect support policy. For example, they tried to shift the paradigm of industrial promotion from directly subsidizing an industry such as steel or automobile to indirectly promoting investments in energy saving, preserving the environment, and introducing new technologies through enhanced R&D programs. It was also a period in which trade liberalization before capital market opening was seriously deliberated as a backdrop against rising wages and trade unionism, as discussed in Pyo (1990). During the second stage, the performance of GDP growth was mixed between the Fourth Plan period (5.5% annual average below the target rate of 9.2%) and the Fifth Plan period (8.4% annual average above the target rate of 7.6%). We also note an excessive investment drive during the Fourth Plan period in which the actual investment rate (35.5%) exceeded the planned rate (26.2%) by a large margin. This excessive over-investment was combined with the second oil crisis and the assassination of President Park in late 1979 and the subsequent political instability in 1980, making the Korean economy experience a negative growth (- 6.2%) in that year for the first time since 1962. By the end of the Fifth Five-Year Development Plan in 1986, the Korean government had stopped drafting Five-Year Development Plans and had moved toward a sort of indicative planning with annual projection and mid-term projection of three years or so.
10

Republic of Korea
(4) The third stage (1987-2000)
The third stage (1987-2000) is characterized by a turbulent transition from an authoritarian regime to a more democratic one. It was a period in which Korea pursued import liberalization and capital market opening by joining the WTO and the OECD. It was a period when Korean conglomerates engaged in excess competition in a pattern of monopolistic competition across industries. Many of them invested in pre-emptive investment projects in non-tradable sectors to stay alive against increasing foreign and domestic competition. The monitoring system by both government and banks became less transparent, and a lax financial supervision created a vast network of moral hazard. It was also a period of rapidly declining rates of return on capital in Korea, as observed in Pyo and Nam (1998). As the Independent Evaluation Office of the IMF described it, the Korean financial crisis of 1997 was a twin crisis: a foreign exchange crisis and a domestic credit crunch. During the post-crisis IMF programs, there was both corporate and financial restructuring, and about two-thirds of the top 30 conglomerates went bankrupt. But toward the end of this stage, the Korean economy was affected by the New Economy and the IT revolution. There was substitution of investments from conventional non-IT sectors to IT sectors, but the employment absorption by IT sectors was rather weak and, once the IT boom was over by 1999, the investment became quite stagnant, casting doubt on new sources of sustainable growth for the Korean economy.
An episode of rapid productivity convergence So far we have reviewed productivity change in Korea and its fast productivity convergence mostly in quantitative terms with historical perspectives. Lucas (1993) has suggested that we need a theory that incorporates the possibility of rapid growth episodes and that such theory should be able to explain why Korea experienced rapid growth since the mid-1960s while the Philippines experienced no such growth, although both economies started from roughly similar socio-economic conditions. Since then, multiple theories of new growth have followed, but they seem to have emphasized only a particular aspect (for example, externality, human capital, learning-by-doing or the threshold aspect) and not multiple significant aspects of growth.
In what follows, I attempt to provide not another new growth theory but rather significant episodes of productivity change and rapid productivity convergence, based on observations of Korea during the last four decades. In theoretical terms, no single growth or development theory can explain such episodes, but a combination of new institutionalists’ views and neoclassical models of trade and growth can provide theoretical conjectures. My explanation of significant episodes is based on two key phrases: ‘potential initial conditions’ and ‘structural change and transformation’. By ‘potential initial conditions’, I mean that we need to identify the state of initial conditions of the country not only by visible and quantifiable indicators but also by often-hidden indicators. These hidden indicators are so-called deep determinants (Rodrik et al., 2002), typically of a social, religious and political nature. Among the potential initial conditions, I argue that historical heritages, which are often embodied in institutions and commercial practices,
11

Productivity performance
are the most important determinant because they ultimately shape policy environments and determine the success or failure of later development programs. In the case of Korea, I can single out three such initial conditions among hundreds of potential conditions. The first is a colonial heritage that the primary school enrollment ratio was once increased from less than 5 percent to 30 percent in the 1930s. The second is the episode of an early land reform after independence before interest groups could be formed and allied. The third is the expansion of primary education in the mid-1950s under the influence of the American mass-education system. The first and the third elements combined formed the basis of what I define as the two-tier system of human capital, which is a unique historical heritage of Korea. Even though Lucas (1993) has observed that both the Philippines and South Korea started from “roughly similar socio-economic conditions”, the potential initial conditions were quite different between the two economies in the early 1960s. First, while there was an extensive agricultural land reform in Korea as of March 25, 1950, five years after its independence from Japan in 1945, there was almost no significant agricultural land reform in the Philippines. While there was almost no large landlord class as a ruling class in Korea, there were large agricultural oligarchies in the Philippines. Second, there existed a significant difference in the state of income distribution between the two economies. According to the World Bank, Social Indicators of Development 1988, the income received by the highest 10% of households in the Philippines was 40% (1965) and 39% (1975), while that in Korea was 28% (1975). In terms of primary school enrollment rates, the two economies were identical, at near 100%, by 1965. But the enrollment rates of secondary and tertiary schools began to diverge from the 1970s. In the Philippines, the secondary school enrollment rate improved from 46% in 1970 to 73% in 1990, and the tertiary school enrollment rate increased from 3% to 27%. On the other hand, in the Republic of Korea, the two rates improved at much faster rates, from 42% to 87% and from 16% to 39% respectively. The second key element in explaining significant episodes of productivity change and convergence in Korea is the social capacity to transform from an agriculture-based economy to a manufacturing one at an earlier stage and from labor-intensive manufacturing to capital-intensive and technology-intensive manufacturing industries at later stages. Such a social capacity could exist as just a potential capacity and could never materialize in many developing countries, unless some kind of development shock comes through. Naturally, this is the reason why the role of government is important because it can generate domestically a development shock, or absorb a foreign shock and internalize it into a domestic one. For example, on May 16, 1961, a military coup staged by President Park generated a domestic development shock because the military group had to build their own legitimacy by providing the public with blueprints of economic development. On the other hand, the sudden reduction of US aid in early 1960s caused economic hardship but generated an external shock which made the Korean people aware of the fact that they could not live on foreign aid forever and, therefore, they needed their own indigenous effort in rebuilding the national economy. As reviewed before, Korea was basically an agricultural economy by the early 1960s. According to my long-run database of Korea (Pyo, 2001), the share of the primary sector (agriculture, fishery and forestry) in total value added has changed: 62.6% (1911), 47.1% (1938), 40.4% (1953) and 41.1% (1961). The share of the primary sector in total
12
Republic of Korea
employment is estimated to have changed: 87.4% (1911), 82.5% (1938), 70.4% (1953) and 64.2% (1961). The episode of productivity change was begun by a concerted effort by the government and the private sector. After the Rhee government was toppled by student demonstrations on April 19, 1960, a weak cabinet government was formed, but economic and political instability followed until President Park consolidated power through a military coup on May 16, 1961. The Park government was very weak in legitimacy and, therefore, had to establish themselves by solving the nation’s economic hardship and eliminating poverty. They announced a series of economic stabilization measures including the freezing of high-interest loans to farmers and fishery households on May 25, 1961. By this measure, farmers and fishers were supposed to pay back their loans to the National Agricultural Cooperative Federation (public bank) at a reduced annual interest rate (12%) over an extended period of time (5 years). In turn, the National Agricultural Cooperative Federation issued an Agriculture Finance Bond to lenders, who were supposed to be paid back at a 20% annual interest rate over a four-year-period after a one-year grace period. Under this measure, a total of 53.7 billion Hwan was registered as high-interest loans and 29.6 billion Hwan was ruled as eligible loans, and 23.7 billion Hwan was paid back through the bond. Since, at the time, farmers and fishers were trapped by high-interest (at times over 40%) on curb-market loans which they had incurred as operating expenses and child education fees, etc., the measure was taken as a significant relief to them, and became instrumental in their mobility to the manufacturing sector.
The Economic Planning Board (EPB) was established in July 1961 as an up-scaled Ministry independent of the Ministry of Finance, specializing in drafting and administering economic development plans, and it was also given budgeting power and a supervisory role over public enterprises. The Deputy Prime Minister was appointed to head the EPB, and the planning and implementation of economic development plan was centralized. The EPB drafted the First Five-Year Economic Development Plan (FEDP) by the end of 1961, and announced it on January 5, 1962. Under the plan, two types of industries were chosen as strategic industries. One was the labor-intensive manufacturing sector such as plywood, wigs, simple assembly of home electronics and textile & apparel, which have the best potential for exports. The other was the basic industries for constructing infrastructure and providing basic materials for other industries such as steel & iron, cement, and electric power plants, etc., which are import-substitutes. During the First (1962-1966) and Second Five-Year Economic Development Plans (1967-1971), the industrial restructuring took the form of inter-industry transformation, mostly migration from agriculture, forestry and fishery to mining and manufacturing and services. When the first oil crisis shocked the country in 1974, the Korean government started realizing that exports of simple assembled manufactures may become no longer viable. In addition to material and intermediate product cost-inflation due to quadrupled oil prices, there was a substantial wage increase as the Korean economy passed the Lewisian turning point around 1975, ending a period of unlimited labor supply. According to Nurkse (1961), if the source of growth of an economy lies in the growth of a factor, one of the most important tasks is to allocate that factor to the industries with “incremental comparative advantage”. Nurkse (1961, P.308) made a distinction between “established” and “incremental” comparative advantage, which becomes necessary as
13

Productivity performance
soon as we apply the central concept of international trade theory to the problem of economic growth.
After distinguishing between two types of industrialization, export promotion of manufactured goods to industrial countries and production for domestic markets, he then argued: “It is to make use of growing resources which cannot with comparative advantage be absorbed by expansion in the traditional sectors that industrialization becomes really necessary. We therefore envisage industrial activities, whether for export or for home use, as being set up on top of the existing export sectors, so long as in these sectors a country still enjoys a high “established” comparative advantage even though, as a consequence of sluggish expansion of external demand, its “incremental “ comparative advantage in these lines may be low.” In other words, it is necessary to view comparative advantage in a dynamic setting for a development strategy based on export promotion through industrialization. In the case of Korea, the inter-industry transformation in the form of migration from traditional sector to manufacturing took place during the period of 1962-1974. Then it was substituted by intra-manufacturing transformation and restructuring during the period of 1975-1979 from unskilled-labor-intensive industries to skilled-labor-intensive industries and more capital-intensive industries. This restructuring was provoked by the first oil crisis in 1973-74. The second restructuring was carried out mainly during the 1980s in order to rectify some of the investments which were ill conceived or mismanaged. After President Park was assassinated in October 1979, there was a brief period of political instability and also the second oil crisis in 1980 followed. The growth rate of real GDP dropped from 9.3 percent in 1978 and 6.8 percent in 1979 to –1.5 percent in 1980. The regime of President Chun, coming from a military background, also had to seek political legitimacy by improving economic conditions. One of President Chun’s policy doctrines was to follow President Park’s principle of keeping economic policies independent of political and military influence. Most of the major economic policy decisions were left to expert bureaucrats, who decided that there was a need to carry out a major industrial restructuring and reduce foreign debt. During the period of 1975-79, some of the conglomerates carried out pre-emptive investments in heavy and chemical industries such as automobile, shipbuilding, cement, iron and steel, and in refinery and petrochemical industries, following the government policy direction to restructure the economy from light industries to heavy and chemical industries. Many of such projects became white elephants in the early 1980s, and were no longer viable. Some of the major conglomerates had to give up several projects, and consolidation of excessive investment became inevitable. The government initiated restructuring through government-controlled banks such as the Korea Development Bank, which had provided loans to major heavy and chemical industries projects. During the period of the 1980s there were some important policy shifts to help restructure the economy. The first shift was to promote technology-intensive industries after learning lessons from over-investing in heavy and chemical capital-intensive industries. From the early 1980s, Samsung entered into semi-conductor investments, and Lucky-Goldstar (LG)
14

Republic of Korea
and Hyundai followed Samsung. The second shift was made by the Ministry of Commerce and Industry (MCI), which changed industrial support policy from a direct support system to an indirect support system. For example, in the 1970s MCI tried to identify the so-called strategic export sector and promoted the industry by providing various incentive tax-cum-subsidy systems and easy access to loans from government controlled banks. But in the 1980s, the direct support system was slowly replaced by an indirect support system. For example, there was an R&D support system and an investment tax credit system for investments in energy-saving machinery and equipments and facilities. The third shift was to move toward import liberalization in commodity markets, as documented in Pyo (1990). The trade liberalization effort in the 1980s provided a significant incentive for industrial restructuring by reducing inflationary pressure and, therefore, reducing financial distortion which existed in the form of the gap between the official bank lending rate and the unofficial curb-market rate. The third industrial restructuring was made as a consequence of the IMF bailout measure after the December 1977 financial crisis. As documented in IMF (2003), it was basically a twin-crisis: a combination of domestic banking crisis and foreign exchange crisis. Under the system of IMF mandated bailout, Korean industries had to go through a massive restructuring. As I have outlined in Pyo (2004), in 1997 there were thirteen Chaebols out of the top thirty Chaebols that went under court-supervised restructuring. The fundamental cause of the 1997 crisis in Korea was pre-emptive over-investments by major conglomerates while there was a significant reduction in rates of return. As I defined in Pyo (2000), it was the failure of the excess competition model as a consequence of unchecked financial liberalization and lax bank supervision. The excess competition occurred not because chaebols were not interested in profits but because they began to realize that their protected market and regulatory regime was being threatened by the change in political economy between the government and chaebols and by increased foreign competition through full-scale trade and financial liberalization by Korea’s accession to the WTO and the OECD. The change in the political economy was inevitable because Korea was going through a very turbulent period of democratization in transition from the quasi-military authoritarian regimes of Presidents Chun (1981-1987) and Roh (1988-1992) to the truly civilian government of President Kim (1993-1997). The transition implied a transformation from a strong government to a weaker government. In other words, the alliance between the government and big business through the exchange of political contributions and favoritism was weakened, creating an environment where chaebols were no longer well protected in their respective markets. And the impending foreign competition accentuated this trend and made many conglomerates impatient and nervous, and caused them to over-react or over-invest recklessly. The industrial restructuring after 1998 took the form of M&A and big deals among troubled major conglomerates. In addition, as the IT boom followed after the financial crisis, Korean industries invested in the IT sector and venture capital. But investment stagnation followed, and the long-run prospect of productivity growth is therefore quite uncertain at this point. After a massive restructuring in the form of cuts in employment and working hours, labor productivity has improved but the overall gain in total factor productivity is not observed yet. But the recovery after the crisis was made possible by some productivity gain through industrial restructuring under IMF- mandated programs.
15

Productivity performance
In summary, the episode of rapid productivity convergence in Korea was made possible by the successful adoption of a development strategy based on incremental comparative advantage and industrial restructuring on the initiative of the government. It was a consequence of interaction between market forces and government intervention.
16

Republic of Korea
III. Assessment of the major determinants of productivity
3.1 Reflections
The fruits of knowledge, which are frequently hidden and intangible by their nature, have been important determinants of Korea’s productivity growth. The stock of knowledge at the beginning stage of development plans was so shallow that it did not reach the threshold level where externality can be put into effect.
3.2 Technology issues
As in many developing countries, Korea relied on imported foreign technology to carry out the construction and operation of major manufacturing facilities. At the beginning stage, the imported technology came in the form of machines and equipments, mostly from the United States and Japan. The operation manuals by the Japanese producers could be easily interpreted because there were many senior engineers who had been trained in the colonial period. One of the reasons why the Japanese machines and equipments were popular at the beginning stage of development was this familiarity with the system and know-how. Another reason was easy access to after-sales service because of the proximity to Japan. As the engineers and scientists who were trained in the late 1950s and 1960s in the United States started returning home in the late 1960s and 1970s, their familiarity with US machines and equipments slowly led to the replacement of Japanese machines and equipments with US machines and equipments. R&D and technology imports are two important windows of technology adoption in many developing countries. But the success of late industrialization ultimately depends on the country’s indigenous technological capacity to absorb new technologies at the right time. In general, technology buyers in developing countries are given multiple choices of different technologies by technology sellers in advanced countries for a given plant construction or processing know-how. Usually, the choice of the right technology at the right price and at the right time is the most crucial part of the success of the project. Without indigenous technological capacity, industries in developing countries cannot make the optimal choice of technology. In the case of Korea, this role of choosing the right technology at the right time was left to entrepreneurs and engineers, not to bureaucrats. Most engineers were foreign-educated, and consulted domestic R&D centers to acquire knowledge of the technology in question. In other words, the indigenous technological capacity was itself a human capital. Even though it is difficult to identify statistically the growth of indigenous technological capacity, the patent statistics can provide us with one source of indicators. According to statistics compiled by the Korea Patent Office, the number of patent applications increased exponentially from 1948 (169 cases) to 1960 (611 cases), 1980 (5,070 cases) and 1997 (92,734 cases). The composition by applicant’s nationality is as follows: 1948 (Korean 100%), 1960 (Korean 89.2%, USA 2.7%, West Germany 1.6%), 1980 (Korean 24.5%, USA 22.7%, Japan 32.0%), and 1997 (Korean 72.6%, USA 7.9%, Japan 12.0%,
17
Productivity performance
Germany 2.5%). In summary, Japan and the United States were the two dominant foreign patent applicants, but the Korean share, which once declined to the level of 24.5% in 1980, was kept up at over 70% in the mid-1990s. This is one indication of indigenous technology build-up. There are two additional indicators for the development of indigenous technological capacity. One is the status of national technical certificates, and the other is the status of vocational training. According to the Ministry of Labor‘s Yearbook of Labor Statistics, total national technical certificate holders increased from 122,833 persons in 1978 to 541,544 persons in 2000. The composition in 1978 by kinds of national certificates was craftsman (54.8%), industrial engineer (24.6%), assistant craftsman (11.9%), engineer (8.5%), and professional engineer (0.3%). It changed in 2000 to craftsman (78.0%), industrial engineer (10.2%), assistant craftsman (2.2%), engineer (9.0%), professional engineer (0.4%), and master craftsman (0.1%). This indicates that, while professional engineers and engineers certificate holders have not increased much in recent years because the market demand for their service is limited, the supply of craftsman certificate holders has increased significantly, both in numbers and in shares. Research and development One of the maintained hypotheses that I would propose is that the main R&D activities in Korea were pioneered by the first generation of scientists and engineers who were educated and trained in the United States and Europe. They include the founding members of KAIST and the Korea Defense Research Institute, etc. Since, at that time, private firms’ R&D facilities were fragile and often lacked the right equipment, and facilities and financial compensations were also low, the bulk of major scientists and engineers therefore preferred the government think tanks. It was only in the 1990s that the prestigious private R&D centers run by major conglomerates could offer better salaries and non-salary remunerations. R&D activities at both government and private sector level need to be assessed. In general, R&D expenditure can be decomposed into two categories: public R&D and private R&D. In the case of Korea, the role of public R&D was dominant at the beginning of its development plan in the 1960s. However, public R&D could not satisfy the technology and engineering demand from private firms as the industrial structure was transformed from light industries to heavy and chemical industries during the 1970s. The private R&D, which was motivated by various tax incentives by the government, was oriented toward more application and adaptation technologies and engineering know-how. Therefore, there seems to have been a complementary relationship between public R&D and private R&D in Korea during the 1960s and 1970s. On the other hand, the role of private R&D started to dominate public R&D in Korea from the mid-1980s when Korea’s industrial policy shifted from direct industry-specific support policy to indirect functional support policy. It was also the time when major Korean conglomerates started investing in semi-conductors, higher-value-added steel and metal products, and machinery and equipments, including automobiles. In the 1990s, public R&D played an important role in the telecommunication industries: ETRI (Electronic Telecommunication Research Institute) and KISDI (Korean Information
18
Republic of Korea
Society Development Institute) are representative examples. And public R&D and private R&D started with not only complementary elements but also competitive elements. The differential role of public R&D and private R&D in the evolution of Korea’s R&D policy needs to be carefully examined, and its relationship with productivity performance in key sectors should be evaluated. For example, according to the Ministry of Science and Technology and Electronics and Telecommunications Research Institute, the R&D expenditure on Information and Telecommunication took 20 percent of total R&D expenditure and 0.39 percent of GDP in 1991, but increased by the year 2000 to 49.2 percent and 1.32 percent respectively. The sector’s R&D expenditure was decomposed between public and private by a ratio of 18 percent and 82 percent respectively in 1991, but changed to a ratio of 10 percent and 90 percent in 2000. Overall, R&D expenditure shows a remarkable upward trend, both in terms of the absolute amount being put in and the relative share of GDP as shown in the Appendix Table A4. The total expenditure increased from 1.2 billion Won (0.24% of GDP) in 1963 to 13,848 billion Won (2.67% of GDP) in 2000. The sustained productivity growth was made possible by building up the country’s own indigenous technological capacity through a division of work between public R&D and private R&D. The number of R&D institutes increased from 72 in 1963 to 2,856 in 1996, and R&D manpower increased from 1,750 persons to 132,023 persons during the same period. In 1996, 11.7 percent of R&D manpower was with research institutes, 34.3 percent was with universities, and the remaining 54 percent was with private firms. The decomposition of R&D expenditure by function shows: basic R&D (18.2%), applied R&D (28.9%) and product development (53.0%) in 1983, and basic R&D (12.6%), applied R&D (24.3%) and product development (63.1%) in 2000 as shown in the Appendix Table A4. In recent years, the relative weight of R&D expenditure in product development has become larger than basic or applied R&D. This indicates that private R&D expenditure has become more important than public R&D, and that Korea’s R&D has become a more commercially-oriented expenditure.
Technology transfer
Regarding technology import policy, Korea adopted the promotion of R&D and technology imports as a prime policy to enhance productivity increase which can be linked to a good export performance. Korea’s development strategy from the very beginning of the 1960s aimed at inducing syndicate loans from the World Bank, the Asian Development Bank, and commercial banks, and then reallocating them to project-qualified companies through government-controlled banks such as the Korea Development Bank, the Korea Small and Medium Enterprise Bank, the Korea Export and Import Bank, etc. Therefore, the role of direct foreign investment was relatively insignificant, which was different from the development strategies of Singapore, Hong Kong, and Taiwan. Under this system, the project-awarded qualified companies had to meet the government standard of export performance and cost-benefit requirements by substantially improving productivity performance. They had relatively little time for endogenous R&D effort, and had to rely on imported technology. Most imported technology was in the form of
19

Productivity performance
imported know-how and manuals which come with the purchase of imported machinery and equipments. Later on, most imported technologies were in the form of purchased licensing agreements and intellectual property rights. But most firms had to invest in a minimum of R&D in order to build their own technology-adoption capacity, typically by building their own laboratories and sending their engineers abroad for further training. Indigenous R&D came much later as most firms accumulated enough adoption technology. Therefore, the government policy of aiming at the promotion of R&D and a liberal technology import policy must have had a positive effect on the productivity performance of project-awarded firms. According to Science and Technology Yearbook by the Ministry of Science and Technology, the number of technology import cases reported was 285 during 1967-1971: electrical & electronics (65 cases), refinery & chemical (59 cases), and machinery (58 cases), among other industries. The number increased sharply during the period of Korea’s investment in heavy and chemical industries (1972-1976) to a total of 434 cases: machinery (116 cases), refinery and chemical (85 cases), and electrical & electronics (84 cases). However, as the Korean economy started to increase investment in technology intensive sectors such as semi-conductor and IT sectors from the mid-1980, the industrial composition also changed. The total number of technology import cases (5,830 cases) during the period of 1985-1996 is decomposed as electrical and electronics (2,016 cases, 34.6%), machinery (1,714 cases, 29.4%) and refinery & chemical (979 cases, 16.8%). In terms of statistics on technology-licensing payments by countries, the United States was the dominant donor country during 1962-1966 with US$0.5 million (71.4%) out of a total of US$.0.7 million. After the diplomatic relationship with Japan was restored in the mid-1960s, Japan became the second largest technology supplier: During 1967-1972, a total of US$26.6 million was paid as a technology fee to the United States (US$11.0 million, 41.4%) and Japan (US$10.5 million, 39.5%). In 1996, just before the financial crisis of 1997, the total technology fee payment reached a record high level of US$2,297.2 million with decomposition by the United States (US$1,160.0 million, 50.5%) and Japan (US$723.9 million, 31.5%). So the United States and Japan continued to be the two dominant suppliers of technology to Korean industries.
3.3 Investment in human capital, physical capital, infrastructure
Korea’s policies affecting productivity can be categorized as (1) input-driven policies such as investment promotion, export-subsidy, and mass education policy; (2) R&D and technology-import policy; and (3) policies aimed at improving the overall socio-economic infrastructure. The mechanism of input-driven policies and productivity performance needs to be examined in depth because it is the core of the policy-productivity relationship, knowing that the Korean economy has been the beneficiary of input-driven policies rather than that of total factor productivity increase. First, on the theoretical side, I would explain the mechanism as a regulatory equilibrium in which monopolistic competition across industries prevails. As I have outlined in Pyo (2000), in such an imperfect competition model, the role of government serves two purposes: exit and entry regulator for each
20

Republic of Korea
monopolistic competition market, and performance-monitor for the distribution of policy loans though government-controlled financial intermediaries. I hypothesize that one of the key success elements in Korea’s input-driven policies is the fact that the government relied on the conglomerates’ export performance as the prime target criteria for awarding next round projects and further policy loan allocations. In other words, they have avoided their own type of subjective judgment system, which quite often entails bureaucratic corruption and political favoritism. In fact, one of the main reasons behind the 1997 financial crisis in Korea was the the failure to implement deregulation in financial industries by using an appropriate financial supervision mechanism. As outlined in Pyo (2000), the system of regulatory equilibrium with tight government control on the entry-exit of firms and financial intermediaries could be no longer maintained in the early 1990s as Korea went through a turbulent period of transition from authoritarian military regimes to a more democratic one. In what follows, we review determinants of input-driven productivity growth from, in turn, human capital, labor supply, physical capital and infrastructure.
Human capital
In terms of human capital accumulation, we should note a remarkable feature in the history of modern Korea. This is the introduction of mass-education in primary schools at unprecedented rates and at a time of starvation and political unrest. According to Kimura (1986), the overall primary enrolment ratio for boys in 1911, at the end of the Yi Dynasty, was 15.2-19.1 percent, and a survey of national illiteracy conducted by the colonial government as part of the population census in 1930 showed overall illiteracy rates of 50.4 percent for males and 89.8 percent for females. The primary school enrolment ratio, which has been frequently used as a proxy for human capital in recent growth literature, has been raised twice in a remarkable way in the modern history of Korea. The first jump occurred during the 1930s after the Colonial Government of Imperial Japan adopted a conciliatory policy to integrate Koreans with mainland Japanese. They started introducing the Japanese system of education in place of the traditional apprenticeship-like Korean system called Seodang. By 1940, the primary school enrolment ratio ascended to about 60 percent and 30 percent for boys and girls respectively. But a survey conducted by the post-colonial government in 1945 found that 77 percent of adults over 13 years old still did not have the skills of reading and writing in the Korean language, Hangul. The US military government and the succeeding Rhee government had to make intensive efforts to eradicate adult illiteracy. The second jump occurred around 1957 when the Rhee government started introducing the American system of mass education, and the primary school enrollment ratio ascended to a level of 70% without too much differential between boys and girls. By 1960, the primary school enrolment ratio had reached 99.8 percent as shown in the Appendix Table A4. However, the composition of population by educational attainment (25 years old and over) in 1966 shows that 79.6 percent of the population were primary school graduates or under, and only 3.7 percent were college graduates and over. Thus the initial condition of educational attainment in Korea in the 1960s can be summarized as the vast expansion of primary education with very limited higher education. On the other
21

Productivity performance
hand, Korea adopted an education policy in which public education played a greater role in primary and secondary education than in tertiary education. The college-level education was left for competition between public and private colleges and universities. The hypothesis that I put forward here is that the beneficiaries of mass education in the 1930s became the manager classes, and those of mass education in the 1950s became the major force of production and office work in the later development periods of 1960s and 1970s. This seemingly two-tier system of human capital was the core of Korea’s success in late industrialization, and distinguishes it from other developing countries. As shown in Appendix Table A4, the composition of the population of 25 years old and over by educational attainment was: primary school graduates and under (79.6%), middle school graduates (11.1%), high school graduates (5.6%) and college graduates and over (3.7%) in 1966, and the corresponding rates became 23.0%, 13.3%, 39.4% and 24.3% in 2000. So the fast and large-scale expansion of primary school education in the late 1950s was instrumental to developing an indigenous R&D capacity, enhancing technology adoption skills, and building up human capital through advances into higher education. As I have shown in Pyo (1998), the role of human capital in Korea in its earlier development stage was as a productive input rather than as accumulated knowledge to provide externality. The growth miracle of South Korea is not a miracle but the result of sustained accumulation and use of human capital.
Labor supply Considering the unfavorable initial conditions such as lack of natural resources, high population density, existing twin gaps, and war-devastated socio-economic infrastructures by the early 1960s, the Korean government had to rely on a relatively abundant labor force to start up its engine for late development from 1962. Other than educational indicators, the initial conditions in Korea around the early 1960s were far from being favorable. The unemployment rate was high (8.1%) in 1963 and the dominant portion (63.0%) of the population was still left in agriculture, forestry and fishing. Since the primary sector’s production share in the 1963 GDP was only 43.4 percent, the economy was dominated by a low-productivity primary sector. The employment statistics by industry shows a typical pattern of rural-urban migration and primary-manufacturing shift during the period of 1960-1974. As the economy passed the Lewisian turning point and the period of unlimited supply of labor was over around 1974, the unemployment rate was reduced from 8.1 percent in 1963 to 5 percent in 1974. The proportion of employed persons in the primary sector declined very fast from 63 percent in 1963 to 34.0 percent in 1980 and 10.9 percent in 2000, while that of manufacturing increased quickly between 1963 and 1980 from 7.9 percent to 21.6 percent but remained flat until 2000 (20.2%). The shift in the labor supply from the primary sector to the secondary sector was made possible by various tax and subsidy incentives provided to manufacturing export industries. For example, there were tax incentives and, at times, subsidies in the construction of dormitory housing for plant workers and in the supply of wages-in-kind
22
Republic of Korea
such as free or low-cost meals and clothing etc. Many elementary workers, particularly women employees, found the dormitory life safer and more convenient with modern facilities such as TV sets and refrigerators. Of course, the primary motivation of the labor shift came from higher wages and salaries and job security in manufacturing. In the primary sector of agriculture and fishery, there was widespread disguised unemployment and the employment in the sector was very much cyclical and seasonal so that rural workers started dreaming of obtaining secured employment in an urban setting. Various OJT programs offered by firms eliminated the fear of urban employment on the part of migrating workers from rural areas. In summary, the pattern of labor supply in Korea during the last four decades can be characterized as follows. At the first stage (1960-1974), the vent-for-surplus type quantity of labor supply, helped by the rapid expansion of primary education, dominated the scene. Also at this stage, the shift was made from the primary sector to the secondary sector, helped by rural-urban migration. Then, in the second stage (1975-1987), there was a major intra-industrial labor shift within manufacturing from labor-intensive manufacturing to heavy and chemical manufacturing, as shown in Row 6 of the Appendix Table A4. In the third stage (1988-2000), as the Korean economy moved into a more information- and technology-intensive structure and service-oriented economy, the quality of labor rather than the quantity became more important than before.
Physical capital
The rate of growth in physical capital in Korea during the last four decades is truly an unprecedented one. UNIDO’s estimate of 11.21 percent annual growth is quite similar to my own estimate of 11.39 percent, even though the method of estimation is different. I have used the polynomial benchmark equation method linking four benchmark years’ data rather than the perpetual estimation method which assumes a 13.3 percent depreciation rate. My estimates of the economic depreciation rate for the aggregate capital stock were lower than 13.3 percent: 9.4 percent during 1977-1987 and 7.8 percent during 1987-1997. The growth rate in Korea was higher than the growth rate (10.3%) of gross capital stock in Japan in its high growth period (1964-1985) and that of net stock in Taiwan (1960-1987), as I noted in Pyo (1996, Table 4). Such a rapid accumulation of physical capital can be made possible under two conditions: One was a sustained continuation of high rates of return, and the other was a continued rise in the savings rate, in particular the private savings rate. As observed in Pyo and Nam (1999), Korea’s before-tax gross rate of return (gross operating surplus/ gross capital stock) was as high as 33.7% in 1971, higher than Japan’s gross rate of return (31.2%), which led Harberger to term the two economies “outliers”. At the same time, the two economies maintained savings rates higher than the OECD average. Even though both Japan and Korea experienced the rapid decline of rate of return from 1975 and from 1985 respectively, and their rates ultimately converged to the OECD average level by early 1990s, they had met these two conditions for the rapid accumulation of physical capital.
The high rates of return in Korea during the 1970s and the1980s were made possible by the combination of two factors. One factor was the relative suppression of labor movement and wage increases, and the continued incentive for internal corporate-retained
23
Productivity performance
earnings through a low-dividend policy. The other factor was households’ preference for higher savings and lower consumption for educational purposes, and investment in housing to guard themselves from hyperinflation. The expansion of primary education during late 1950s had opened up the possibility of moving up the ladder of higher education for many beneficiaries of primary education. They had been taught about the virtue of savings for higher education and for securing housing. The private savings rate in 1960 was only 5 percent, but this more than doubled within a decade and more than tripled within two decades. The gross savings rate increased from 9.0 percent in 1960 to 18 percent in 1970, 24.4 percent in 1980 and 32.4 percent in 2000. The domestic gross investment ratio started off at 10.0 percent in 1960 but increased fast to the level of 36.2 percent in 1980, exceeding the gross domestic savings rate, but then fell to 28.3 percent in 2000. The sustainable productivity growth in Korea over four decades since 1960 was made possible by the sustained growth of gross domestic savings, particularly private domestic savings, which were channeled into sustained domestic investment. Otherwise, Korea might have experienced foreign debt problems, as many Latin American countries did in the 1980s. According to the Economic Planning Board’s Main Economic Indicators (1980), out of total gross domestic capital formation (100%), the share of government savings declined from 37.8 percent in 1960 to 19.4 percent in 1979, while the share of households’ and non-profit organizations’ savings increased from – 16.9 percent to 29.2 percent. Williamson (1977) pointed out that Korean households’ financial savings were low because of the government’s low interest rate policy and high inflation rates, which made the real interest rate low.
However, they saved in the form of housing without mortgage loans and other forms of savings in non-financial intermediaries. The allocation of capital through credit control and policy loan schemes in the earlier period and the more liberalized financial system in the later period must have contributed to the accumulation of physical capital because the waste of capital was closely monitored both by government and by banks controlled by the government.
Infrastructure There was very little infrastructure in the early 1960s, too, as a consequence of the devastating Korean War, as summarized in the Appendix Table A4. The number of telephone subscribers per 100 persons was only 0.3 persons, the ratio of running water supply was only 16.8 percent, the electric power consumption per capita was only 46 Kwh, and the number of registered motor vehicles per 1,000 persons was only 1.3 vehicles. However, the Korean government allocated long-term and lower-interest loans from international lending institutions through the Korea Development Bank and the Korea Housing Bank, etc., to public corporations and enterprises such as the Korea Highway Corp., the Korea Railroad Corp., the Korea Electric Power Corp., and the Korea Marine and Port Management Corp., etc. The provision of social infrastructure was not always adequate because the demand for social overhead services always exceeded their supply
24

Republic of Korea
since the speed of growth in other sectors such as manufacturing, export service, import service, and transportation and telecommunication was tremendously fast. The public corporations and enterprises which provided utility services and other social overhead services were closely monitored and evaluated by the government ministries in charge of the sector. From the mid-1980s their salaries and other benefit systems were linked to their performance, which was evaluated by an independent commission. They also began to be privatized from the mid-1990s to increase their efficiency. In general, there was no major bottleneck in the provision of social overhead services to support manufacturing activity, particularly in the supply of water, electric power and other vital services such as telecommunications. The electric power consumption per capita in 2000 became 5,067 Kwh, the water supply ratio reached 87.1 percent, main telephone lines in operation per 100 persons reached 44.1 in 2000, which is comparable level with that of Japan (55.8 in 1999), and mobile telephone subscribers per 100 persons reached 54.9, which exceeded that of Japan (49.4).
3.4 Institutions, integration and invariants
The recent growth literature such as Hall and Jones (1999) and Rodrik (2003), goes beyond a mechanical explanation of factor accumulation for productivity growth, and emphasizes the importance of deep determinants such as geography, integration and institutions. However, these deep determinants are frequently historical endowments, and set initial conditions that cannot be altered by the development authorities at the time of launching a development plan.
Historical endowments and initial conditions
Korea had remained a hermit kingdom under the Lee Dynasty up until 1910 when it was annexed to Imperial Japan as a colony. The colonial experience under Japanese rule had a tremendous effect on Korea’s post-1945 development and the initial conditions at the time of launching the successive Five-Year Development Plans under President Park in 1962. There have been both positive and negative evaluations of Korea’s colonial experience and its impacts on late industrialization. Some have argued that the forced annexation by Imperial Japan had deprived Koreans of the opportunity for the indigenous formation of a capitalist state and had ultimately invited the division of the Korean peninsula between North Korea and South Korea as a consequence of the emerging Cold War. They argue that modernization and industrialization under Japanese colonial rule served the imperialistic purpose and, therefore, these produced distorted growth without national capitalism. On the other hand, others have argued that, even though there was massive human rights violation and oppression, the colonial government of Japan had introduced mass-education in primary schools and had planted a form of industrialization through breeding manufacturing and laying out social overhead capital. The Korean experience after the turbulent period of independence in 1945, the establishment of the Republic of Korea in South Korea in 1948, and the Korean War during 1950-1953 all affected the initial conditions at the time of the development
25
Productivity performance
planning stage and the pattern of late industrialization. There was very little physical capital to start with in 1962, due to the complete discontinuity in investments during the period of 1942-1953. There was war preparation by the Japanese Government (1942-1945), which was followed by turmoil and massive immigration following independence in 1945. Then the Korean War broke out in 1950 with devastating effects on both physical and human capital. Even after the Korean War, the Korean Government had to rely on US aid to avoid starvation and carry out minimum reconstruction from the devastating war. Korea’s historical endowments and initial conditions in the early 1960s can be characterized as typical twin gaps, an investment-savings gap and a foreign exchange gap. In 1960, the domestic gross investment ratio was 10.0 percent, while the gross savings ratio and the private savings ratio were 9.0 percent and 5.0 percent respectively. The ratio of imports to GDP was 12.7 percent, while the ratio of exports was only 4.1 percent. Therefore, one can conclude that Korea’s initial conditions in the early 1960s were typical of an economy trapped in twin gaps. It has been often the case that the political economy of Korea’s economic development was ignored or treated as an exogenous factor. For example, the role of dictatorship in economic development has not been fully addressed. While the social and institutional set-up in Korea in the 1960s and 1970s certainly require an in-depth study of the interaction of politics and economics, we have not paid due attention to the impact of political suppression on economic development. The period of economic development (1961-1979) under President Park after he consolidated power through a coup on May 16, 1961 can be characterized as development under a typical development dictatorship. Its regime can be defined as an authoritarian regime. The period under President Chun (1980-1987) and President Roh (1988-2002), both with military backgrounds, can be characterized as a semi-authoritarian regime with a lesser degree of dictatorship but still with the mode of an authoritarian regime in planning and implementing development policies. The role of dictatorship in economic development in Korea has been controversial, as has that of the Japanese colonial rule. The positive aspect of dictatorship is that it mobilizes resources easily and allocates them among strategic sectors efficiently if there is relatively little corruption. However, for two reasons it cannot continue for a sustained period of time, even though it did so over three decades in the case of Korea. One is the so-called Lipset phenomenon that economic growth ultimately invites democracy, as I discussed at length in Pyo (1993). The other is the tendency that absolute dictatorship is endangered by corruption and collusion between government and business. Therefore, the dictatorship could be a necessary evil at certain earlier stages of economic development. But the longer it stays, the deeper its distortionary effects on entire sectors of the economy and it would, therefore, take a longer period of time to recover itself and restore the growth momentum. This could be a lesson for China, which has been growing quickly under an authoritarian regime.
26
Republic of Korea
Integration
At the time of launching the economic development plans, Korea’s integration with the world economy was very shallow and fragile. It was somewhat land-locked by Communist China, the Soviet Union, and North Korea in the cold war era. Trade with Japan had been lagging because of a sour relationship with the country in the past; a full diplomatic relationship with Japan was restored only in 1963. The United States was regarded as the source of foreign aid rather than as a trading partner. In 1961, the shares of exports (US$38.6 million) and imports (US$103.1 million) in GNP (US$2,103 million) were only 1.8 percent and 4.9 percent respectively. A gross savings rate of 11.7 percent was decomposed by a domestic savings rate of 2.9 percent and a foreign savings rate of 8.6 percent. Investment from abroad was US$47.4 million during the five-year period of 1962-1966, of which US$25 million (52.7%) was from the United States.
However, by end of the First Five-Year Economic Development Plan in 1966, exports and imports increased to the level of US$253.7 million and US$673.2 million respectively, or by about 5 times and 6.6 times respectively from the 1961 level. Thus, Korea’s main window of integration was exports and imports. The export promotion policy under the slogan of “Export First” could not be maintained without an increase in imports because of the lower domestic contents of most export items at the time. But it opened the window to integrating Korea into the world market. Integration through trade was followed by technology imports to support export-oriented manufacturing and commercial loans and foreign direct investments throughout the 1970s and 1980s.
The success of Korea’s integration by exporting can be viewed in terms of a combination of many factors: the availability of both unskilled labor at the earlier stage and skilled labor at the later stage through the expansion of the education system and credit rationing in favor of policy loans in the sectors strategically chosen. But at the same time, it should be emphasized that the transparency of a well-monitored export system itself was the most important element in the mechanics of self-generating export performance. The export regime adopted by the Park government during 1962-1979 was, basically, an incentive system in favor of well-performing exporters whose performance are judged not by the corrupted bureaucrats but by the international market, which demands a system of transparency. It also let entrepreneurship grow because, without it, an export market cannot be developed and maintained. One of the most important means of integration was education and training abroad, and the brain drain in the earlier period and the reverse brain drain in the later period. Even though there are few statistics on the magnitude of education abroad and the brain drain, a recent report by the Bank of Korea provides a startling statistic. The report estimates the total expenses of education and training in foreign countries, including living expenses of accompanying families, as US$6 billion in 2003, which exceeds by over three times the official remittance (US$1.85 billion) reported in the balance of payments. This amount is about one-third of the total household expenditure on education (22.2 trillion Won – US$ 18.6 billion at the average exchange rate of 1,191.9 Won per US dollar). In terms of economic integration with other countries through free trade agreements (FTA), Korea has been a latecomer. An FTA with Chile in 2003 was the first, and an FTA
27

Productivity performance
with Japan is at an initiation stage. However, integration by joining the OECD and the WTO in the mid-1990s has influenced the nation tremendously. As I have argued in Pyo (2000), the 1997 financial crisis in Korea was the consequence of adjustment failure under pressure by the WTO and the OECD to open up the domestic economy in both trade and finance. It was more or less an institutional failure due to lax bank supervision of corporate financing and mismanagement of short-term debt.
3.5 Competition, social dimension and environment
Korea has maintained a competitive environment in social mobility through education. It has also pursued egalitarian social and economic policies which may have helped productivity growth. The constant inflow of scientists and engineers from abroad was made possible as Korea’s economic development passed the Lewisian turning-point in the mid-1970s and since then followed sustainable long-term high-growth. In the background of such constant inflow lies the mass-education but very competitive education system. In such a social environment, promoting one’s human capital was commensurate with promoting one’s physical and financial wealth. On the other hand, in terms of industrial policy, the government has deliberately introduced limited competition by lowering entry barriers over time and by monitoring market failures by major conglomerates in order to maximize the efficiency of limited resources, as I have outlined in Pyo (2000). In other words, the government has played the role of competition promoter and supervisor through government-controlled banks, which are part of a quasi-internal organization. In this regard, the system has promoted monopolistic competition across industries. That is why one observes in Korea a larger number of automobile manufacturers, telecommunication equipment producers, mobile phone companies and so on than those normally observed in many developing countries or smaller advanced countries. For example, in automobiles there were at least three producers, and in electronics there were always more than three competitors. In the case of the semiconductor industry, Samsung entered the market in the early 1980s, following the Japanese semiconductor manufacturers. But then the Korean government allowed market entry by Lucky-Gold Star (LG) and Hyundai to promote competition. Such an example is not limited to export industries. The monopoly of the Korean Airline Group in the airline business was broken when the government allowed the second airline, Asiana’s, market entry in the mid-1980s. In the case of mobile telecommunication, the government tried to break the monopoly of SK in cellular phone service by issuing another license to a cellular operator called Shinsegi and then introduced further competition by issuing licenses to three PCS service providers. The bureaucrats wanted to avoid such blame that they are bribed or lobbied by a certain business conglomerate. Together with an abundant reserve labor force with a minimum education level, the social environment in a relatively egalitarian state seems to have interacted positively toward gearing up to launch an economic development plan. As outlined in Pyo (1996), the ruling class in the colonial period was discredited after Korea gained independence from
28
Republic of Korea
Japan, and most landowners lost power after the land reform in 1949 and the subsequent Korean War. The Korean social environment in the early 1960s was pretty much a classless society in which the average household regarded a better education for their children as the best investment for upward social mobility. The Confucian tradition in favor of education must have acted positively, too, but it should be noted that the household’s choice of educational investment was a rational economic choice rather than a cultural or religious one. The parents expected higher rates of return on the education of their children because in a classless society upward social mobility is determined by education. While there was a strong notion that Korea started off in the early 1960s as a relatively egalitarian society, the rapid accumulation of capital after the launching of the development plan could have made income distribution worse than before. There are no reliable statistics for income distribution in the 1970s and early 1980s. The Family Income and Expenditure Survey by the National Statistical Office provided an index of concentration (Gini Coefficient) starting from 1985 and the Urban Wage Earners’ Households Income survey starting from 1993. These two sources of income distribution statistics show a conflicting pattern. The Family Income and Expenditure Survey Gini coefficient improved from 0.345 in 1985 to 0.295 in 1996, just before Korea’s financial crisis of 1997, as shown in the Appendix Table A4. On the other hand, the latter Gini coefficient deteriorated from 0.281 in 1993 to 0.291 in 1996 and 0.317 in 2000. The latter Gini coefficient seems more reliable because it reflects the impact of a financial crisis on income distribution: in general, a financial crisis worsens income distribution because of the increase in unemployment and high interest policy ensuing after the crisis, which makes the rich richer and the poor poorer because the former have financial assets while the latter have financial debts. Alternatively, we can examine the trend of labor income share in both the aggregate economy and manufacturing as an indirect indicator of functional income distribution. The share of labor income in the aggregate economy estimated by the Bank of Korea shows an increasing trend from 1953 (0.27) to 1960 (0.39), 1980 (0.51) and 2000 (0.59). My estimate of the labor income share in manufacturing also shows a steady upward trend but with some fluctuation from 1953 (0.42) to 1960 (0.49), 1980 (0.58), 1996 (0.66) and 2000 (0.52). The reduction of the labor income share from 1996 to 2000 reflects the impact of the financial crisis in 1997 and is consistent with the worsened Gini coefficient of urban wage earners’ household income. At the same time, it is a manifestation of the factor price equalization theorem in the long-run that as a relatively labor-abundant country engages in free trade, the wage increases relative to the price of capital: the free trade benefits the relatively abundant factor of the trading country.
Other social network policies include a minimum wage law, which was adopted in the early 1980s after 20 years of carrying out economic development plans. They also include a labor relations law and welfare policy for the handicapped, and for households below the absolute-poverty income level. Even though these welfare policies still lag far behind industrial nations, they must have helped in improving the overall socio-economic infrastructure and improving productivity at family level. Looking at labor union statistics from the Appendix Table A4, we note that the numbers of trade unions and trade union members increased between 1981 and 2000 from 2,141 to
29
Productivity performance
5,698 and from 967,000 persons to 1,527,000 persons respectively. However, the union membership rate declined from 20.8 percent to 12.0 percent during the same period. Both the number of labor dispute cases and the working days lost improved from the peak year of 1988 to 2000. Lastly, policies aimed at improving the overall socio-economic infrastructure may include the Social Overhead Capital (SOC) Policy, the Land and Rural Development Policy and the Education and other Social Network Policy. The Korean government has directed most project loans from international public lending institutions such as the World Bank and the Asian Development Bank to the Social Overhead Capital Sector (highways, port facilities, railroad, water supply and highways, and hospitals and other health facilities), through public enterprises because their loans tend to be long-term loans with lower interest rates. The Land and Rural Development Policy aimed at avoiding excessive urbanization, particularly in the Seoul metropolitan area, in order to reduce inflation in land and housing prices. The New Village Movement under President Park aimed at improving agricultural productivity by carrying out a rural development program.
3.6 Issues specific to Korea
Korea-specific factors such as the historical legacy coming from the Japanese colonial period (1910-1945) and the division of the Korean peninsula and the resulting national preoccupation with security issues should be addressed. Political environment and security issues should be added to provide a broader picture of Korea’s unique development history. The defense budget took 53.7 percent of the Korean government expenditure in 1953, 35.0 percent in 1960, 20.0 percent in 1990 and 11.2 percent in 1999. At the time of launching the Economic Development Plan in the early 1960s, the defense budget was a burden to the economy. At times, the constant confrontation with North Korea was used as a means of political suppression by authoritarian regimes and suppression of trade union movements. However, the security issue had some positive aspects in lifting up the overall productivity of the economy. For example, the national conscription system might have deprived Korean youths of their opportunity to advance to the next rung on the ladder of learning and training, but it also provided them with a minimum general education to read and write and, most of all, discipline as workforce. The vent-for-surplus type supply of labor force was the cornerstone of Korea’s rapid industrialization. But it was only a part of the necessary conditions. There must be interaction in a market economy between government and entrepreneurs. The government established after a military coup by President Park in 1961 lacked the legitimacy of a democratically elected government. They therefore sought to restore the popularity of their regime by carrying out economic development plans successfully. In other words, their political stability depended on economic prosperity, and most of all they had to create jobs for the urban unemployed and the vast disguised unemployed in the rural sector.
30

Republic of Korea
Economic development and late industrialization is often a complex interaction between endogenous historical heritages and imported institutional elements. It involves more than mechanical income-growth dynamics. Therefore, we want to go beyond the traditional explanations of the determinants of the free market system and search for more cultural and historical factors. The reason is that without expanding the boundaries of our research we may not be able explain the rising sentiments of anti-market movements and pro-socialist policy doctrines under increasingly unwarranted egalitarianism in recent years in Korea. Recent researches on history and culture have argued that religious practices and beliefs have important consequences for economic development. They have argued that explanations for economic growth should go further to include a nation’s culture. We have tended to ignore or underestimate the cultural and religious aspects of entrepreneurship, which is the core of free enterprise system. As Barro and McCleary (2003) have demonstrated, religiosity affects economic growth and, in turn, the pattern of economic growth will affect religiosity. For example, the percentage of the population with religious beliefs in Korea increased from 42.6 percent in 1985 to 53.6 percent in 1999, while per capita GNP increased from US$2,242 to US$9,438. According to the Social Statistics Survey by the National Statistical Office, there is religious pluralism in Korea: the decomposition of religion is Buddhism (49.0%), Protestantism (34.7%), Catholicism (13.0%), Confucianism (1.3%), and others (2.0%). Such pluralism in religion combined with other cultural heritages must have affected not only work ethics but also entrepreneurship. During the process of rapid economic development, the Korean people used to think that the remarkable achievement of growth was mainly due to either the government’s planning or the work ethics of the ordinary workers, without realizing the role of the entrepreneur in finding business opportunities. They regarded the free-enterprise system as basically an implanted system, and viewed it as a free good in a capitalist society. In recent years, while there is ample evidence of the benefits of the free enterprise system, some anti-market and anti-business sentiment has been growing among civil activists, intellectuals, and union leaders. We have begun to realize that the free enterprise system is not free. The free enterprise system and entrepreneurship are like the two sides of a coin: without one, the other cannot survive. As I argued before, one of the main reasons why Korea could grow so fast under a dictatorship was because the dictatorship was relatively less-corrupted and it pursued export promotion, maintaining a certain degree of transparency in who got what and how. Through this system, entrepreneurship in Korea could be nurtured, making it one of the most successful stories of recent industrialization. The current situation could become worse, as many international consulting organizations ascribe the poor performance in national competitiveness to an environment and institutions hostile to business activities. This hostile environment inside Korea is a fatal problem for further growth, as international economies become more integrated: Korean firms tend to stop investing domestically, and foreign investments do not flow into Korea.
In order to assess the strengths and weaknesses of Korea’s development strategy and identify the policy-side determinants of Korea’s productivity performance during the four
31

Productivity performance
decades of 1960-2000, we need to review policy documents and directives by major ministries such as the Economic Planning Board (now the Ministry of Finance and Economy), the Ministry of Trade and Industry, and the Ministry of Science and Technology etc. We also need to refer to policy survey literatures published by various government think tanks such as the Korea Development Institute (KDI), the Korea Institute of Industrial Economy and Technology (KIET) and the Korea Institute of International Economic Policy (KIEP) etc. We discuss these policy issues in the following chapter. Ranking relative importance of determinants
As outlined above, each determinant of productivity must have played a different role in productivity growth and its rapid convergence. Among numerous determinants which must have mutually interacted, I would, without hesitation, rate human capital determined by historical precondition as the most important determinant. The enlargement of primary education and upward mobility in the education system are the key elements in improving the nation’s stock of human capital. Human capital enhances knowledge, absorptive capacity, indigenous R&D efforts, and institutional environments. The second most important determinant is the maturity of social institutions and political stability. Without maturity and stability in socio-economic institutions, a development program cannot be maintained. We can find numerous histories of failure in development programs in modern world history. Most of them failed not because there was a lack of physical capital or resources but because there was social disruption and political instability.
32

Republic of Korea
IV. Discussion of policies with effect on productivity
4.1 Direct productivity-enhancing policies
There have been policies that have had a direct impact on productivity increase in the Republic of Korea. Even though the modes of such policies varied over time, they have attempted the promotion of R&D, the adoption of new technology, and industrial restructuring or targeting from the lower-productivity sector to the higher-productivity sector. As we have outlined in the previous chapter, the policy direction taken by the Korean government during the period of 1953-1961 was the promotion of import-substituting manufacturing by means of allocating foreign exchange earned through foreign aid. There were, therefore, very few direct productivity-enhancing policies during the period of 1953-1961. The trend continued even after the formal launching of the Five-Year Economic Development Plan in 1962. From 1962 to 1981, most productivity-enhancing policies were of the second type: targeting the strategic export-promoting sector, designating certain areas as Export Processing Zones (EPZ), and a series of trade policies designed to promote export industries. There was very little policy attempt to improve R&D facilities and technology adoption until the early 1980s. It is well known that increased spending on R&D can lead to the discovery of new technologies or the development of new products that contribute to higher productivity. But in many developing countries, R&D can be wasted because of the lack of an R&D infrastructure and motivation for an indigenous R&D effort. Korea was no exception. It was only after experiencing two-rounds of oil crisis and the first year of negative real GDP growth (-2.1%) in 1980 that the new government of the post-Park regime realized the limitation of extensive growth based on factor accumulation and capacity expansion under the so-called “ Heavy and Chemical Industrialization Policy ”, and started to seek new sources of growth. According to MCI, the policy targets announced in February 1982 included export promotion with enhanced value-added, the upgrading and rationalizing of industrial structure, and the enhancement of industrial competitiveness through maintaining balanced growth among different sectors. Most R&D policies were formulated by the Ministry of Science and Technology (MOST) in consultation with the Economic Planning Board (EPB) and the Ministry of Commerce and Industry (MCI), so that there were checks and balances among ministries on R&D expenditure. By the end of March 1982, MOST had selected a total of 108 special R&D projects which were to be carried out by 80 private firms (a total of US$7.2 million) and 28 government research institutions or enterprises (a total of US$18.7 million). In June 1982, MOST announced a Five-Year R&D Plan for Fine Chemical Industries, selecting 200 projects in five areas of specialization (a total of US$62.8 million of private funds and US$77.5 million of government funds).
33
Productivity performance
In February 1984, the government announced a plan to co-fund, with the private sector, a total of US$100 million by 1988, aimed at promoting basic R&D. In March of the same year, the Ministry of Finance announced that it would provide R&D funds not only to hardware manufacturers but also to software manufacturers. In September, the Bank of Korea announced that it would increase financial support to small and medium industries (SMI) who adopted technology innovation plans and new technology development. In January 1985, the Ministry of Finance announced an ambitious plan of mobilizing a total of US$243.7 million as R&D funds for technology development from five financial institutions including the Korea Development Bank (KDB) and the National Investment Fund (NIF). In August 1986, MCI announced a plan to support software industries by funding them as infant industries through the Industrial Development Fund (IDF) in order that they could prepare for import liberalization and intellectual property rights issue. On the other hand, MOST announced a plan to spend a total of US$126.2 million as a special R&D expenditure in three representative technology-intensive frontier industries: the fine chemical, semi-conductor and new material industries. In November 1986, MCI selected a total of 219 manufacturing processes which were in need of urgent R&D projects (837 cases), and announced that it would support those selected R&D projects and that they were to be completed in two years by 1988.
4.2 Indirect productivity-enhancing policies
One of the most important and effective productivity-enhancing policies was the incentive system for export promotion. After the First-Five Year Economic Development Plan was launched in January 1962 by President Park, who had consolidated power after a military coup in May 1961, MCI introduced an Export-Import Link System in January 1963. The system was designed to give incentives and favors to those who actually exported, by giving them a license to import, which was often a lucrative business. In March 1965, MCI announced an import licensing system, based on installment payments, for equipments of export industries. A series of policies were followed to promote export. In March 1963, MCI asked exporters to report export cases to them where they were suffering from delayed transportation and bottlenecks in cargo shipping. In September 1964, the bill for Export Industrial Complex was passed in the National Assembly. In April 1965, the Monetary Board of the Bank of Korea established rules and regulations on opening letters of credit to raw material imports for export-processing, and construction and equipments for export industries. Japanese private commercial loans to the value of US$20 million, which was a part of the concessionary terms and conditions of restoring diplomatic relations with Japan. This was allocated to purchasing raw materials and machinery and equipments for export processing. There were also sector-specific indirect policies to provide overall social overhead capital and financial capital to strategic industries. In July 1967, the first year of the Second Five-Year Economic Development Plan, the Government selected Pohang and Ulsan as industrial complex areas for the steel and petrochemical industries respectively. In November 1967, the Government decided to invest a total of 64.4 billion Won (foreign
34

Republic of Korea
loan of US$190 million and a domestic loan of 34.8 billion Won) for the construction of the First Steel Manufacturing Plant. In July 1968, MCI announced that it would promote the electronics industry by earmarking 900 million Won from the 1969 budget. In January 1969, MCI realigned export specialization industries as 10 industries, including electronics, by supporting a total of US$60 million of foreign capital and 973 million Won of domestic capital. In June 1969, MCI announced a Basic Plan for the Promotion of the Electronics Industry under the Electronics Promotion Law. In June 1970, a total of 51 electronics items were selected for development in 1970 and provided with1.13 billion Won from the Electronics Development Fund. In September 1969, EPB designated the city of Masan as an Export Processing Zone (EPZ), inviting foreign capital into labor-intensive industries. In November 1970, MCI added shipbuilding as a strategic export industry, and decided to increase the capacity to 100,000-ton level by 1971, and to consolidate small and medium–sized shipbuilders to make them competitive. In April 1973, MCI drafted a long-term promotion plan for the shipbuilding industry by providing 145.8 billion Won so that domestic demand could be filled by domestic supply by 1976 and that Korea would become the 10th largest shipbuilding nation. In February 1972, MCI designated the machinery industry as a target industry for localization and import substitution. It selected a total of 1,549 items for the promotion of domestic production by providing a Machinery Industry Promotion Fund. In July 1972, MCI selected 13 import-substituting industries such as oil products, paints, office machines and ceramics, with the aim of transforming them into export industries to diversify exports. In May 1973, the government established Guidelines for Foreign Capital Inducement for the Development of Heavy and Chemical Industries (HCI). The Guidelines stipulated the ratio of own capital to borrowed capital to be at a minimum 30:70, and that, in the case of joint ventures, the equity share of foreign investment could not exceed 50 percent. Subsequently, in August of the same year, the Government decided to induce foreign capital of US$10 billion for the development of HCI, and created the National Investment Fund by issuing a National Investment Bond to maximize the mobilization of domestic resources for HCI. In September the Government designated four industrial development areas (Onsan, Changwon, Yeosu and Kwangyang) for HCI. In October, it changed Korea Export Promotion Ltd., which was a government enterprise, into a general trading company (GTC). Later, major business groups followed it, establishing their own GTCs as window firms for export marketing, finance and foreign investment. According to a domestic financial plan drafted in February 1974, the share of HCI would be 68.4 percent while the remainder (31.6%) would go to light manufacturing sector. In November 1981, the government decided to build the Second Integrated Steel Plant in Kwangyang by 1988 by investing a total of US$2.7 billion (domestic investment of US$1.6 billion and a foreign loan of US$1.1 billion).
On the question of labor policy, the cabinet approved the Decree on Labor Dispute Coordination for Foreign Investment Companies in December 1969 to induce foreign capital. The Korean economy was approaching the end of its unlimited labor supply in the early 1970s. The government, therefore, introduced a comprehensive on-the-job training
35

Productivity performance
(OJT) program in May 1973 to help firms overcome the shortage of skilled labor during the Third Five-Year Development Period (1972-1976). The experience of the second oil shock and the first negative growth in 1980 in the political instability following the assassination of President Park meant that the entire HCI plans needed to be reevaluated. The turning point in Korea’s industrial policy came in 1983 when the government switched from direct industrial promotion to an indirect and functional support system. In other words, the new industrial support system was designed to avoid sector-specific industrial promotion and a targeting strategy, and to introduce more competition through import liberalization. Under the new paradigm of industrial policy, the government, for example, instead of supporting specific industries such as cement and steel manufacturing, supported investments in energy-saving machinery and equipments by introducing a variety of financial-incentive and tax-incentive systems. At the same time, the relative importance in industrial targeting was switched from capital-intensive industries to technology-intensive industries. Samsung started investing in semi-conductor manufacturing in order to catch up with Japanese firms, and the Korean government allowed LG and Hyundai to enter into the semi-conductor market to promote competition. There was also active support for the software industries in order to promote technology-intensive industries. As a conclusion on the link between government policy and productivity enhancement, the experience of Korea provides us with clear evidence of the positive role of the government in promoting productivity through both direct policies such as public R&D expenditure and indirect policies based upon subsidies and other incentive systems. But the set of government policies aimed at promoting productivity needs to be coordinated in terms of timing and internal checks and balances. The implementation of such policies at the right time is one of the most important aspects. For example, high educational capacity can be a necessary condition but not a sufficient condition for large-scale public R&D expenditure. At the beginning of industrial development, technological diffusion rather than technological innovation could be more important and practical so that large-scale public R&D can be launched at a later stage of development when an R&D infrastructure is built and genuine motivation emerges for an indigenous R&D effort, as Korea waited until the early 1980s. 4.3 The Political economy and institutional aspects
Both public and private institutions were set up by interest groups reflecting the political economy of development plans at the time they were established. For example, the Federation of Korean Industries (FKI) was established in January 1961 by bigger business groups and conglomerates. The military coup in May 16, 1961 made the drafting of economic development plan inevitable because the new government had to establish its legitimacy by appealing to the public on the basis that their coup was necessary to help save the nation’s economy. Economic development rather than a full genuine democracy was advanced as the foremost national goal.
The military government, which had frozen all financial institutions on May 16, started to allow financial transactions on May 18, and introduced a series of reform measures. They announced basic economic policy plans on May 31 and the First Five Year Economic Development Plan (1962-1966) on July 22. They also introduced a series of populist
36
Republic of Korea
policies such as the High-interest Loan Rescheduling Scheme for Agriculture and Fishery, which was designed to soothe farmers and fishers who were suffering from high-interest curb-market loans. They also introduced the Illegal Assets Liquidation Act, which was forced upon a few business groups which were suspected of accumulating assets by rent-seeking and political connections. On the institutional side, the military government introduced several reform measures. They created the Economic Planning Board (EPB) to implement an economic development plan. They also established the Agricultural Cooperative Federation and the Small and Medium Enterprise Bank in 1961. In February 1962, Ulsan Industrial Area was designated and its construction started. On June 10, the Emergency Monetary Reform Measure was announced by redenominating the currency unit from 10 Hwan to 1 Won to curb hyperinflation and identify the tax base. In 1965, the government started introducing environmental measures to protect the environment as the economic development plan got underway. In May it announced a Seven-Year Forestry Development Plan as part of the Second Five-Year Economic Development Plan, and the installation of 100,000 street lighting in rural areas within the year. In June the Ministry of Construction drafted a ten-year master plan for the development of water resources, including the construction of multi-purpose dams for generating electric power, and a flood control system. In June 1970, as part of the Third Five-Year Economic Development Plan, the Integrated Energy Development Plan was drafted and included atomic power plant (600,000 KW). In December 1970, the government decided to put up 314 billion Won for the 10 years from 1971 to develop the four largest river basin areas as part of a water management policy. In March 1976, MCI announced a plan to raise the electrification rate of rural areas from 65 percent to 77 percent by allocating fiscal and financial funds of 5.6 billion Won. These policies aimed at balanced growth between urban and rural areas in an attempt to mitigate the impact of rapid urbanization and industrialization. The government also introduced several measures for foreign trade and foreign capital inducement. In March 1966, the Korea-Japan Trade Agreement was signed, and in July the Foreign Capital Inducement Act, which integrated several decrees and laws, was passed by National Assembly. In March 1967, the government decided to join GATT. In June 1968, it signed tariff concession schedules for 18 items through the GATT Representative Office. In January 1968, MCI announced a plan to introduce an export insurance system. In June 1969, the Korea Export Import Bank was established to finance the medium and long-term financing of exports and imports. In February 1972, EPB announced a plan to improve the balance of payments by switching from a direct tax system on an item-by-item basis to indirect regulation through tariffs, exchange rates and import support. In 1973, the government abolished special tariff measures, and introduced a flexible tariff system and abolished the direct tax exemption policy for export industries. The ex ante tariff exemption on raw material imports for export processing was switched to an ex post tariff rebate system. In April 1986, the government changed the approval system for foreign capital inflow to a registration system, and enlarged the scope of the positive system under which the list of permissible items was identified. In order to promote competition among big firms, the Fair Trade Act was introduced in October 1971. In 1981, the Fair Trade Commission designated a total of 666 firms in 14
37
Productivity performance
industries as restricted from forming cartels. In June 1985, the government required Chaebols to register their cartels in order to avoid their excessive concentration of power. At the present time, the Fair Trade Commission remains a powerful watchdog against large conglomerates and Chaebols. The transition from an authoritarian or semi-authoritarian regime to a democratic one was far from smooth. At times Korea had to go through a very turbulent period, both politically and economically. As I observed in Pyo (2000), a distinguishing feature of export-led growth in Korea was its unique industrial structure. The government policy protected bureaucrats from accusations of being linked to one or two conglomerates’ interest but, at the same time, provided big conglomerates with irresistible incentives for horizontal diversification. The phenomenon of ‘too big to fail’ set in because big conglomerates themselves were stockholders of many financial institutions and the moral hazard in financial institutions started eroding their competitiveness. The top thirty conglomerates were producing over half of Korea’s GNP, and the top five conglomerates’ share was as much as one-third of the country’s total production. The business groups called ‘chaebol’ in Korea many look quite similar to the Japanese ‘zaibatsu’, but they are different in many respects. First, Korean chaebols had to rely on developing the export market more intensively than the Japanese firms because their domestic market size was less than 5 per cent of the Japanese domestic market size in 1975 (US$20.9 billion, as against US$499 billion, in terms of GNP) and less than 9 per cent in 1995 (US$453 billion, as against $5156 billion, in terms of GNP). As a result, two types of zaibatsu could coexist in Japan: one a highly specialized technology leader in multinational markets (for example, Toyota, Sony and Toshiba) and the other a business group of horizontally diversified firms (for example, the Mitsubishi group, the Mitsui group, the Sumitomo group and the Fuji group). But, in Korea, only the latter type (for example, Samsung, Hyundai and Lucky-Goldstar) could be established because specialization was riskier than diversification in the oligopolistic setting with the government regulation on entry and exit. In addition, diversification through cross-shareholding could generate higher economies of scale in a limited domestic market. Second, the way the business groups are governed in Korea is quite different from that in Japan. As a result of dissolution of zaibatsu under the MacArthur administration, there were few dominant family groups which could own and manage zaibatsu. The corporate ownership structure in Japan is a more diversified one than that in Korea, and the role of institutional investors is much more important in Japan than in Korea. As a result, the decision-making process and corporate governance in Japan are much more consensus-based than those in Korea. Such a difference in ownership structure and governing pattern could make a substantial difference to the outcome of the excess competition because a more consensus-based system can survive better than an authoritarian owner-management system at the time of policy failure, and can protect itself from over-extension through a built-in system of checks and balances.
38
Republic of Korea
V. Concluding remarks
Since the early 1990s, the model of monopolistic competition across industries in Korea has been subject to change, both domestically and internationally. First of all, the so-called ‘Lipset phenomenon’ has arrived on the sociopolitical scene in Korea, as outlined in Pyo (1993). The country’s success in export-led growth brought about increasing demands for democracy, and the transition from an authoritarian regime to a democratic one has been turbulent rather than smooth. The increasing demand for higher wages and benefits by organized labor through, at times, violent disputes and strikes placed an extra burden on firms’ efforts at restructuring and ‘downsizing’. But most important of all, in the face of increasing domestic and foreign competition, some monopolistic competitors carried out a series of ill-fated pre-emptive strategic investments. As anticipated in Pyo et al, (1996), the potential impact of the World Trade Organization (WTO) in a general-equilibrium context became much greater than those in a partial-equilibrium context. One typical manifestation of such an impact was over-investment in non-tradable sectors and pre-emptive investment in some tradable sectors. Considering the current market trend towards deregulation and privatization, it was difficult for the government to discourage this entry. Even though it did not materialize, owing to the objections by the government and the subsequent financial turmoil, we could have seen another pattern of oligopolistic competition in the steel industry, too. Many Korean firms in the automobile industry and the semi-conductor industry tried to put themselves in strategic positions in the global market. They seemed to take the view that there was an increasing demand for their products from emerging markets and transition economies. They regarded their products as not necessarily top-quality goods but as reasonably priced, competitive products in such markets. Their success or failure depended on their income-generating capacities because they had to pay back the interest and principals of the loans they had borrowed from domestic and foreign banks. This game of high-yield high-risk in strategic markets was to determine the substantiality of export-led growth in Korea. Such a game could not have been maintained if there was no moral hazard in the financial sector and if the government was strong enough to insulate its bureaucrats from the distributive politics among chaebols and other interest groups, including labor unions. But neither condition was met. In addition, the owner-management corporate governance without consensus building and internal checks and balances resulted in over-investment in existing business and caused excessive competition against a background of moral hazard in the financial sector and lax banking supervision by weak government. In my judgment, this was the most fundamental cause of the financial crisis in Korea. A recent report by the Independent Evaluation Office (IEO) of the IMF (2003) has characterized the financial crisis of 1997 in East Asia as a new type of balance of payments crisis, which was triggered by massive capital inflows followed by sudden capital outflows. In particular, the report has noted that the nature of the crisis in Korea and Indonesia was “twin crises” in which the external crisis coincided with a banking crisis. We can identify South Korea, Indonesia, Malaysia, Thailand, and the Philippines as five Asian-Crisis countries, and Japan, Hong Kong, Singapore, Taiwan, and China as five East Asian non-crisis countries.
39

Productivity performance
The overall assessment of the macroeconomic performance of Asian-Crisis countries is that the rebound of growth over the period of 1999-2000 slowed down in the subsequent period of 2001-2003, mainly because of stagnant demand for domestic investment across all the crisis-inflicted economies. In particular, the domestic investment in machinery and equipment was very disappointing. For example, in the case of Korea, its average annual growth rate was 17 percent during the pre-crisis period of 1994-1996 and became negative during the crisis-years of 1997(- 9.6%) and 1998(- 42.3%). Then the average annual growth rate became explosively positive in 1999 (36.8%) and 2000 (33.6%), but suddenly dropped in 2001 (-9.0%), 2002 (7.5%) and 2003 (-1.2%). There are two main issues at hand in examining the investment trend in the post-recovery period in Asian-Crisis countries. One issue is whether the stagnation in investment is a permanent phenomenon and, therefore, the period of the “East Asian Miracle” is over. The other issue is why the volatility of investment was so large during the post-crisis period of 1999-2003. In order to resume sustainable growth and renew the productivity convergence, Korea needs to find a new paradigm and system under drastically changed social and political landscapes. The Korean economy has been struggling to find such a path under a non-authoritarian regime. It may take much longer time than expected because under the current mode of globalization, relying on market mechanism seems to be the only solution for a small open economy like that of Korea.
40

Republic of Korea
Bibliography
Baumol William J., Richard R. Nelson, and Edward N. Wolff eds., Convergence of Productivity:Cross-National Studies and Historical Evidence, Oxford University Press, New York, 1994
Barro Robert J. and Rachel M. McCleary, “Religion and Economic Growth”, manuscript, April 8, 2003 International Monetary Fund, The IMF and Recent Capital Account Crises: Indonesia, Korea, Brazil, Independent Evaluation Office, Washington DC, 2003 Kimura, Mitsuhiko, Education and its Socio-economic Backgrounds in Pre-colonial Korea: Sodang in Contrast with Terakoya in Japan, Discussion Paper No. 8, The Institute of Industrial Sciences, Nagoya Gakuin University, November 1986 Lee, Sang Chul, The Implementation of Import Substitution Policy, 1953-1961, in Ahn Byung Jik ed. Industrialization in Korea (in Korean), Seoul National University Press, 2001 Lucas, Robert E., “Making a Miracle,” Econometrica 61: 251-72, 1993 Nurkse, R., Equilibrium and Growth in the World Economy, Cambridge: Harvard University Press, 1961 Pyo, Hak K., “Export-Led Growth, Domestic Distortions, and Trade Liberalization: The Korean Experience During the 1980s”, Journal of Asian Economics, Vol. 1 No. 2 JAI Press, 1990 Pyo, Hak K., “The Transition in the Political Economy of South Korean Development”, Journal of North East Asian Studies, 12 (4), Transaction Periodical Consortium, 1993 Pyo, Hak K., “A Time-Series Test of the Endogenous Growth Model with Human Capital”, in Growth Theories in Light of the East Asian Experience edited by Takatoshi Ito and Anne O. Krueger, NBER-East Asia Seminar on Economics, Volume 4, The University of Chicago Press, Chicago and London, 1995 Pyo, Hak K., “The East Asian Miracle or Myth: A Reconciliation between the Conventional View and the Contrarian Proposition”, Economic Bulletin, Ministry of Finance and Economy, Republic of Korea and Korea Development Institute, March 1996 Pyo, Hak K., K. H. Kim and I. Cheong, “Foreign Import Restrictions, WTO Commitments, and Welfare Effects: The Case of Republic of Korea”, Asian Development Review, 14(2), Asian Development Bank, Manila, 1996 Pyo, Hak K., “A Time-Series Test of the Endogenous Growth Model with Human Capital” in Growth Theories in Light of the East Asian Experience edited by T. Itoh and Anne O. Krueger, The University of Chicago Press, 1998
41
Productivity performance
Pyo, Hak K., “Economic Growth in Korea (1911-1999): A Long-term Trend and Perspective”, in Seoul Journal of Economics, Seoul, Spring 2001 Pyo, Hak K., “Excess Competition, Moral Hazard, and Industrial Trauma in Korea (1997-1998)”, in the Aftermath of the Asian Crisis, D. Dasgupta, U. Dadush and M. Uzan eds., Edward Elgar Publishing, Cheltenham UK, 2000 Pyo, Hak K., “Interdependency in East Asia and the Post-Crisis Macroeconomic Adjustment in Korea”, Seoul Journal of Economics, Volume 17 Number 1, Spring 2004 Rodrik, D., A. Subramanian and F. Trebbi (2002), “Institutions Rule: the Primacy of Institutions over Integration and Geography in Economic Development”, IMF Working Paper WP/02/189, International Monetary Fund (Washington, D. C.) Rodrik, D. (ed.), In Search of Prosperity: Analytic Narratives on Economic Growth, Princeton University Press, Princeton, 2003 Williamson, Jeffrey G., “Have Koreans Saved ‘Too Little’ in the Past and Will They Do So in the Future?”, Korea Development Institute Consultant Report, July 1977.
42

Rep
ublic
of K
orea
A
nnex
1
Ta
ble
A1
Es
timat
es o
f TFP
gro
wth
rate
s fr
om n
atio
nal a
ccou
nts
G
DP
Gro
wth
rate
(%)
Labo
r Gro
wth
rate
(%)
Cap
ital G
row
th ra
te (%
) α
1
α−
M
α
1M
α−
A
(%)
MA(%
)
Yea
r A
ggre
gate
(D
Y)
Man
ufac
ture
(D
MY
) A
ggre
gate
(D
L)
Man
ufac
ture
(D
ML)
A
ggre
gate
(D
K)
Man
ufac
ture
(D
MK
) Sh
are
of L
abor
In
com
e (S
L)
Shar
e of
C
apita
l Inc
ome
(SK
)
Man
ufac
ture
Shar
e of
Lab
or
Inco
me
(SLM
)
Man
ufac
ture
Shar
e of
Cap
ital
Inco
me
(SK
M)
TFP
Gro
wth
ra
te
(DTF
P)
Man
ufac
ture
TFP
Gro
wth
rate
1953
-
- -
- -
- 0.
269
0.
731
0.42
0 0.
580
- -
1954
5.
60
18.1
0
- -
4.20
11
.06
0.32
8
0.67
2 0.
451
0.54
9 -
- 19
55
4.50
21
.30
-
- 5.
06
11.4
8 0.
314
0.
686
0.44
4 0.
556
- -
1956
-1
.30
15
.20
-
- 5.
47
11.5
0 0.
298
0.
702
0.43
6 0.
564
- -
1957
7.
60
7.10
-
- 6.
14
11.8
3 0.
316
0.
684
0.44
5 0.
555
- -
1958
5.
50
10.3
0
- -
5.15
10
.54
0.35
6
0.64
4 0.
467
0.53
3 -
- 19
59
3.90
9.
20
- -
5.01
10
.12
0.40
3
0.59
7 0.
492
0.50
8 -
- 19
60
1.20
8.
20
- -
5.15
10
.01
0.39
0
0.61
0 0.
485
0.51
5 -
- 19
61
5.90
4.
00
- -
5.01
9.
65
0.36
0
0.64
0 0.
469
0.53
1 -
- 19
62
2.10
11
.70
-
- 6.
74
11.1
7 0.
377
0.
623
0.47
8 0.
522
- -
1963
9.
10
16.1
0
- -
8.50
12
.74
0.32
0
0.68
0 0.
447
0.55
3 -
- 19
64
9.70
9.
90
1.77
4.
71
6.66
10
.73
0.29
3
0.70
7 0.
433
0.56
7 4.
47
1.78
19
65
5.70
20
.50
5.
24
19.2
8 8.
40
12.3
1 0.
332
0.
668
0.45
4 0.
546
-1.6
5 5.
03
1966
12
.20
17
.30
2.
59
6.95
13
.32
17.0
9 0.
344
0.
656
0.46
0 0.
540
2.57
4.
88
1967
5.
90
21.6
0
3.53
20
.07
14.4
3 18
.05
0.38
3
0.61
7 0.
481
0.51
9 -4
.35
2.58
19
68
11.3
0
27.2
0
4.94
14
.14
36.6
0 31
.09
0.39
1
0.60
9 0.
486
0.51
4 -1
2.92
4.
34
1969
13
.80
21
.60
2.
44
5.57
12
.23
18.0
0 0.
404
0.
596
0.49
2 0.
508
5.52
9.
72
1970
8.
80
19.9
0
3.51
3.
94
11.3
2 16
.41
0.41
2
0.58
8 0.
472
0.52
8 0.
70
9.38
19
71
8.60
18
.50
3.
36
4.92
10
.76
16.9
1 0.
414
0.
586
0.48
4 0.
516
0.90
7.
40
1972
4.
90
14.3
0
4.26
6.
04
10.1
2 15
.79
0.40
6
0.59
4 0.
451
0.54
9 -2
.84
2.91
19
73
12.3
0
29.3
0
5.28
20
.21
11.3
9 21
.37
0.40
8
0.59
2 0.
473
0.52
7 3.
40
8.48
19
74
7.40
16
.60
4.
28
13.2
3 11
.73
15.5
0 0.
391
0.
609
0.49
5 0.
505
-1.4
2 2.
22
1975
6.
50
12.9
0
2.34
9.
54
11.4
4 14
.05
0.40
2
0.59
8 0.
475
0.52
5 -1
.28
0.99
19
76
11.2
0
23.1
0
5.98
19
.53
12.2
0 13
.71
0.41
7
0.58
3 0.
497
0.50
3 1.
59
6.50
19
77
10.0
0
14.4
0
3.17
4.
44
13.5
2 17
.98
0.43
8
0.56
2 0.
530
0.47
0 1.
01
3.60
19
78
9.00
20
.80
4.
58
7.73
15
.62
16.8
0 0.
459
0.
541
0.55
7 0.
443
-1.5
5 9.
06
1979
7.
10
9.50
1.
41
3.71
14
.84
16.8
0 0.
486
0.
514
0.57
8 0.
422
-1.2
1 0.
27
1980
-2
.10
-0
.90
0.
59
-4.7
6 12
.21
14.3
0 0.
513
0.
487
0.57
9 0.
421
-8.3
5 -4
.16
19
81
6.50
9.
50
2.45
-3
.30
10.8
8 12
.98
0.50
9
0.49
1 0.
576
0.42
4 -0
.09
5.90
43
4
3
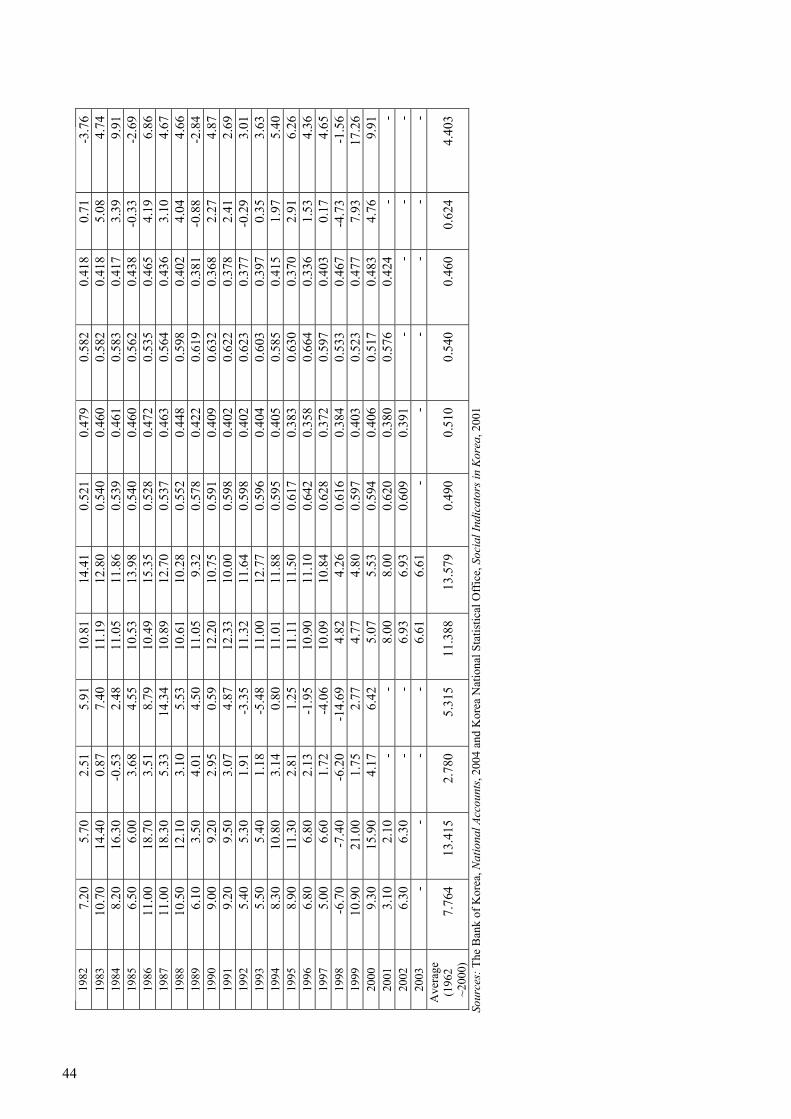
Pro
duct
ivity
per
form
ance
1982
7.
20
5.70
2.
51
5.91
10
.81
14.4
1 0.
521
0.
479
0.58
2 0.
418
0.71
-3
.76
19
83
10.7
0
14.4
0
0.87
7.
40
11.1
9 12
.80
0.54
0
0.46
0 0.
582
0.41
8 5.
08
4.74
19
84
8.20
16
.30
-0
.53
2.48
11
.05
11.8
6 0.
539
0.
461
0.58
3 0.
417
3.39
9.
91
1985
6.
50
6.00
3.
68
4.55
10
.53
13.9
8 0.
540
0.
460
0.56
2 0.
438
-0.3
3 -2
.69
19
86
11.0
0
18.7
0
3.51
8.
79
10.4
9 15
.35
0.52
8
0.47
2 0.
535
0.46
5 4.
19
6.86
19
87
11.0
0
18.3
0
5.33
14
.34
10.8
9 12
.70
0.53
7
0.46
3 0.
564
0.43
6 3.
10
4.67
19
88
10.5
0
12.1
0
3.10
5.
53
10.6
1 10
.28
0.55
2
0.44
8 0.
598
0.40
2 4.
04
4.66
19
89
6.10
3.
50
4.01
4.
50
11.0
5 9.
32
0.57
8
0.42
2 0.
619
0.38
1 -0
.88
-2.8
4
1990
9.
00
9.20
2.
95
0.59
12
.20
10.7
5 0.
591
0.
409
0.63
2 0.
368
2.27
4.
87
1991
9.
20
9.50
3.
07
4.87
12
.33
10.0
0 0.
598
0.
402
0.62
2 0.
378
2.41
2.
69
1992
5.
40
5.30
1.
91
-3.3
5 11
.32
11.6
4 0.
598
0.
402
0.62
3 0.
377
-0.2
9 3.
01
1993
5.
50
5.40
1.
18
-5.4
8 11
.00
12.7
7 0.
596
0.
404
0.60
3 0.
397
0.35
3.
63
1994
8.
30
10.8
0
3.14
0.
80
11.0
1 11
.88
0.59
5
0.40
5 0.
585
0.41
5 1.
97
5.40
19
95
8.90
11
.30
2.
81
1.25
11
.11
11.5
0 0.
617
0.
383
0.63
0 0.
370
2.91
6.
26
1996
6.
80
6.80
2.
13
-1.9
5 10
.90
11.1
0 0.
642
0.
358
0.66
4 0.
336
1.53
4.
36
1997
5.
00
6.60
1.
72
-4.0
6 10
.09
10.8
4 0.
628
0.
372
0.59
7 0.
403
0.17
4.
65
1998
-6
.70
-7
.40
-6
.20
-14.
69
4.82
4.
26
0.61
6
0.38
4 0.
533
0.46
7 -4
.73
-1.5
6
1999
10
.90
21
.00
1.
75
2.77
4.
77
4.80
0.
597
0.
403
0.52
3 0.
477
7.93
17
.26
20
00
9.30
15
.90
4.
17
6.42
5.
07
5.53
0.
594
0.
406
0.51
7 0.
483
4.76
9.
91
2001
3.
10
2.10
-
- 8.
00
8.00
0.
620
0.
380
0.57
6 0.
424
- -
2002
6.
30
6.30
-
- 6.
93
6.93
0.
609
0.
391
- -
- -
2003
-
- -
- 6.
61
6.61
-
- -
- -
- A
vera
ge
(196
2 ~2
000)
7.
764
13
.415
2.
780
5.31
5 11
.388
13
.579
0.
490
0.
510
0.54
0 0.
460
0.62
4 4.
403
44
Sour
ces:
The
Ban
k of
Kor
ea, N
atio
nal A
ccou
nts,
2004
and
Kor
ea N
atio
nal S
tatis
tical
Off
ice,
Soc
ial I
ndic
ator
s in
Kor
ea, 2
001
44

Rep
ublic
of K
orea
Ta
ble
A2.
1
Expo
rt p
erfo
rman
ce b
y go
ods
(%)
1953
19
54
1955
19
56
1957
19
58
1959
19
60
1961
A
gric
ultu
re, f
ores
try,
and
fish
ery
11.8
15.0
23.4
22.9
24
.321
.727
.729
.818
.7
Min
ing
73.9
61.9
51.5
59.4
53
.544
.244
.235
.738
.3M
anuf
actu
ring
14.3
23.1
25.1
17.7
22
.234
.028
.234
.542
.9To
tal
100.
010
0.0
100.
010
0.0
100.
010
0.0
100.
010
0.0
100.
0So
urce
: Hon
g, W
onta
ck (1
975)
, Fac
tor S
uppl
y an
d Fa
ctor
Inte
nsity
of T
rade
in K
orea
, Seo
ul: K
DI
Ta
ble
A2.
2
Impo
rts
of a
id b
y so
urce
s (U
nit:
mill
ion
US$
)
Yea
r EC
A &
SE
C
CR
IK
UN
KR
A
ICA
&
AID
PL
480
Sum
To
tal
Impo
rts
Aid
Impo
rts
1953
0.
215
8.8
29.6
5.6
0.0
194.
234
5.4
56.2
%19
54
0.0
50.2
21.3
82.4
0.0
153.
924
3.3
63.3
%19
55
0.0
8.7
22.2
205.
80.
0 23
6.7
341.
169
.4%
1956
0.
00.
322
.427
1.0
33.0
32
6.7
386.
184
.6%
1957
0.
00.
014
.132
3.2
45.5
38
2.8
442.
186
.6%
1958
0.
00.
07.
726
5.6
47.9
32
1.2
378.
284
.9%
1959
0.
00.
02.
520
8.3
11.4
22
2.2
303.
873
.1%
1960
0.
00.
00.
222
5.2
20.0
24
5.4
343.
571
.4%
1961
0.
00.
00.
015
6.6
44.9
20
1.5
421.
847
.8%
Tota
l 0.
221
8.0
120.
01,
743.
720
2.7
2,28
4.6
3,20
5.3
71.3
%So
urce
: The
Ban
k of
Kor
ea, 『
Econ
omic
Sta
tistic
al Y
earb
ook』
45
4
5

Pro
duct
ivity
per
form
ance
Tabl
e A
3 F
ive-
year
eco
nom
ic d
evel
opm
ent p
lan:
pla
n an
d pe
rfor
man
ce
Tabl
e A
3 F
ive-
year
eco
nom
ic d
evel
opm
ent p
lan:
pla
n an
d pe
rfor
man
ce
Ta
ble
A3.
1 T
he fi
rst f
ive-
year
eco
nom
ic d
evel
opm
ent p
lan:
pla
n an
d Pe
rfor
man
ce
Tabl
e A
3.1
The
firs
t fiv
e-ye
ar e
cono
mic
dev
elop
men
t pla
n: p
lan
and
Perf
orm
ance
1967
19
67
1968
19
68
1969
19
69
1970
19
70
1971
19
71
1967
~197
1 19
67~1
971
(ann
ual a
vera
ge)
(ann
ual a
vera
ge)
Type
Pl
an
Perf
orm
ance
Plan
Pe
rfor
man
cePl
an
Perf
orm
ance
Plan
Pe
rfor
man
cePl
an
Perf
orm
ance
Plan
Pe
rfor
man
ce
GD
P G
row
th R
ate
(%)
7.0
6.6
7.0
11.3
7.0
13.8
7.0
7.6
7.0
9.4
7.0
9.7
Popu
latio
n G
row
th R
ate
(%)
2.40
2.36
2.30
2.35
2.20
2.29
2.10
2.21
2.00
1.99
2.20
2.24
GD
P pe
r Cap
ita
Con
stan
t at 1
960
(Won
) 29
,960
32,1
1631
,337
34,8
9532
,809
38,7
5534
,383
40,8
2736
,069
45,1
97-
-
Con
stan
t at 1
975
(US
$)
-32
0-
348
-38
7-
408
-43
7-
-
Inve
stm
ent R
ate
(%)
17.9
20.2
18.5
24.7
19.1
30.8
19.7
28.1
19.9
28.1
19.0
26.4
Dom
estic
Sav
ings
Rat
e (%
) 8.
810
.89.
912
.111
.615
.513
.114
.114
.413
.211
.613
.1
Fore
ign
Savi
ngs R
ate
(%)
9.1
9.2
8.6
12.8
7.5
13.6
6.6
13.3
5.5
15.4
7.5
12.9
Stru
ctur
e of
Indu
strie
s
Agr
icul
ture
, for
estry
, and
fish
ery
(%)
36.6
37.5
36.0
34.2
35.3
33.2
34.6
30.4
34.0
28.8
--
Min
ing
and
man
ufac
turin
g (%
) 23
.415
.124
.216
.725
.117
.526
.019
.526
.820
.9-
-
Serv
ices
(%)
40.0
47.4
39.8
49.1
39.6
49.3
39.4
50.1
39.2
50.3
--
Cur
rent
acc
ount
s (C
urre
nt m
illio
n U
S $)
-1
16.3
-191
.9-1
26.8
-440
.3-1
15.0
-548
.6-1
02.6
-622
.5-9
5.8
-847
.5-
-
Expo
rts
300
335
360
486
420
658
480
882
550
1,13
2-
- Im
ports
72
590
978
41,
322
815
1,65
085
51,
804
894
2,17
8-
-
46
46

Rep
ublic
of K
orea
Tabl
e A
3.2
Th
e se
cond
five
-yea
r eco
nom
ic d
evel
opm
ent p
lan:
pla
n an
d pe
rfor
man
ce
1962
19
63
1964
19
65
1966
19
62~1
966
(ann
ual a
vera
ge)
Type
Pl
an
Perf
orm
ance
Plan
Pe
rfor
man
ce
Plan
Pe
rfor
man
cePl
an
Perf
orm
ance
Plan
Pe
rfor
man
cePl
an
Perf
orm
ance
GD
P G
row
th R
ate
(%)
5.7
4.1
6.4
9.3
7.3
8.9
7.8
8.1
8.3
11.9
7.1
8.5
Popu
latio
n G
row
th R
ate
(%)
2.88
2.85
2.85
2.84
2.82
2.84
2.78
2.70
2.74
2.50
2.81
2.75
GD
P pe
r Cap
ita
C
onst
ant a
t 196
0 (W
on)
9,82
410
,167
10,1
6310
,803
10,6
0511
,442
11,1
2312
,042
11,1
2613
,153
--
Con
stan
t at 1
975
(US
$)
-23
9-
247
-27
1-
280
-30
7-
-
Inve
stm
ent R
ate
(%)
20.1
12.4
23.0
18.1
24.1
13.5
23.3
13.2
22.7
18.2
22.6
15.1
Dom
estic
Sav
ings
Rat
e (%
) 3.
70.
87.
37.
010
.36.
512
.05.
812
.910
.59.
26.
1
Fore
ign
Savi
ngs R
ate
(%)
16.4
11.2
15.7
11.1
13.8
7.4
11.3
6.9
9.8
7.2
13.4
8.8
Stru
ctur
e of
Indu
strie
s
Agr
icul
ture
, for
estry
, and
fish
ery
(%)
36.3
33.4
36.0
32.5
35.4
35.1
34.7
32.3
34.0
31.7
35.3
33.0
M
inin
g an
d m
anuf
actu
ring
(%)
20.3
21.7
21.6
23.0
23.4
22.3
25.1
24.8
27.2
25.7
23.5
23.5
Se
rvic
es (%
) 43
.444
.942
.444
.541
.242
.640
.242
.938
.842
.641
.243
.5
Cur
rent
acc
ount
s (C
urre
nt m
illio
n U
S $)
-3
09.8
-292
.0-3
15.1
-402
.8-2
96.1
-211
.0-2
63.1
-198
.1-2
46.6
-250
.6-
-
Expo
rts
65.9
54.8
79.7
86.8
96.0
119.
112
1.6
175.
113
7.5
253.
7-
-
Impo
rts
456.
742
1.8
483.
956
0.3
486.
940
4.4
485.
045
0.0
492.
367
3.2
--
4
7
47

Pro
duct
ivity
per
form
ance
Tabl
e A
3.3
Th
e th
ird fi
ve-y
ear e
cono
mic
dev
elop
men
t pla
n: p
lan
and
perf
orm
ance
Ta
ble
A3.
3
The
third
five
-yea
r eco
nom
ic d
evel
opm
ent p
lan:
pla
n an
d pe
rfor
man
ce
19
77
1977
19
78
1978
19
79
1979
19
80
1980
19
81
1981
19
77~1
981
1977
~198
1 (a
nnua
l ave
rage
) (a
nnua
l ave
rage
) Ty
pe
Plan
Pe
rfor
man
cePl
an
Perf
orm
ance
Plan
Pe
rfor
man
cePl
an
Perf
orm
ance
Plan
Pe
rfor
man
cePl
an
Perf
orm
ance
GD
P G
row
th R
ate
(%)
10.0
10.3
9.0
11.6
9.0
6.4
9.0
-6.2
9.0
6.4
9.2
5.5
Popu
latio
n G
row
th R
ate
(%)
1.61
1.57
1.60
1.53
1.58
1.53
1.58
1.57
1.60
1.57
1.59
1.55
GD
P pe
r Cap
ita
Cur
rent
(In
thou
sand
Won
) 41
046
848
362
055
577
563
890
073
21,
095
--
Cur
rent
(US
$)
847
966
999
1,33
01,
147
1,54
61,
317
1,48
11,
512
1,60
7-
-
Con
stan
t at 1
975
(US
$)
-70
5-
776
-81
2-
750
-78
6-
-
Inve
stm
ent R
ate
(%)
27.0
31.0
26.3
37.8
25.9
41.8
25.9
33.7
26.0
33.2
26.2
35.5
Dom
estic
Sav
ings
Rat
e (%
) 22
.025
.323
.025
.724
.025
.025
.120
823
.122
.824
.223
.9
Fore
ign
Savi
ngs R
ate
(%)
5.0
6.2
3.4
11.0
1.9
16.8
0.8
12.3
-0.1
9.6
2.0
11.2
Stru
ctur
e of
Indu
strie
s
Agr
icul
ture
, for
estry
, and
fish
ery
(%)
22.3
222
21.3
19.1
20.3
19.2
19.4
15.9
18.5
19.6
--
Min
ing
and
man
ufac
turin
g (%
) 34
.930
.636
.532
.938
.033
.839
.535
.740
.931
.3-
-
Serv
ices
(%)
42.8
47.2
42.2
48.0
41.7
47.0
41.1
48.4
40.6
49.1
--
Cur
rent
acc
ount
s (C
urre
nt m
illio
n U
S $)
-6
3412
.3-2
37-1
,085
235
-4,1
5167
9-5
,321
1,17
2-4
,436
--
Expo
rts
9,70
010
,047
11,9
7012
,711
14,5
1915
,705
17,2
9217
,214
20,2
4220
,881
--
Impo
rts
10,1
3 310
,523
11,9
7514
,491
14,0
4319
,100
16,3
4521
,598
18,8
7224
,299
--
48
48

Rep
ublic
of K
orea
Tabl
e A
3.4
Th
e fo
urth
five
-yea
r eco
nom
ic d
evel
opm
ent p
lan:
pla
n an
d pe
rfor
man
ce
1972
19
73
1974
19
75
1976
19
72~1
976
(ann
ual a
vera
ge)
Type
Pl
an
Perf
orm
ance
Plan
Pe
rfor
man
cePl
an
Perf
orm
ance
Plan
Pe
rfor
man
cePl
an
Perf
orm
ance
Plan
Pe
rfor
man
ce
GD
P G
row
th R
ate
(%)
9.0
5.8
8.5
14.9
8.
5 8.
0 8.
5 7.
1 8.
5 15
.1
8.6
10.1
Popu
latio
n G
row
th R
ate
(%)
1.6
1.9
1.5
1.8
1.5
1.7
1.5
1.7
1.5
1.6
1.5
1.7
GD
P pe
r Ca
pi
ta
Con
stan
t at 1
970
(Won
) 94
,929
92
,783
10
1,47
7 10
4,70
6 10
8,47
4 11
1,53
1 11
8,95
6 11
7,11
7 12
3,95
1 13
2,74
8 -
-
Con
stan
t at 1
975
(US
$)
- 45
4 -
513
- 54
4 -
574
- 65
0 -
-
Inve
stm
ent R
ate
(%)
25.3
24
.2
24.8
26
.9
24.6
30
.7
24.7
29
.4
24.9
27
.6
24.9
27
.8
Dom
estic
Sav
ings
Rat
e (%
) 17
.7
13.2
18
.5
18.0
19
.4
17.9
20
.4
18.6
21
.5
23.1
19
.5
18.2
Fore
ign
Savi
ngs R
ate
(%)
7.6
9.5
6.36
8.
2 5.
2 14
.4
4.3
10.4
3.
4 6.
3 5.
4 9.
8
Stru
ctur
e of
Indu
s
tries
Agr
icul
ture
, for
estry
, and
fish
ery
(%)
26.1
27
.8
25.1
25
.7
24.2
25
.4
23.3
24
.9
22.4
24
.0
- -
Min
ing
and
man
ufac
turin
g (%
) 24
.0
22.3
25
.0
25.0
26
.0
26.6
26
.9
28.0
27
.9
29.5
-
-
Serv
ices
(%)
49.9
49
.9
49.9
49
.3
49.8
48
.0
49.8
47
.1
49.7
46
.5
- -
Cur
rent
acc
ount
s (C
urre
nt m
illio
n U
S $)
-5
91
-371
-5
44
-309
-4
72
-2,0
23
-421
-1
,887
-3
59
-314
-
-
Expo
rts
1,58
4 1,
677
2,02
7 3,
271
2,49
3 4,
515
2,97
5 5,
003
3,51
0 7,
815
- -
Impo
rts
2,42
8 2,
250
2,77
3 3,
837
3,14
4 6,
452
3,54
7 6,
674
3,99
3 8,
405
- -
49
4
9
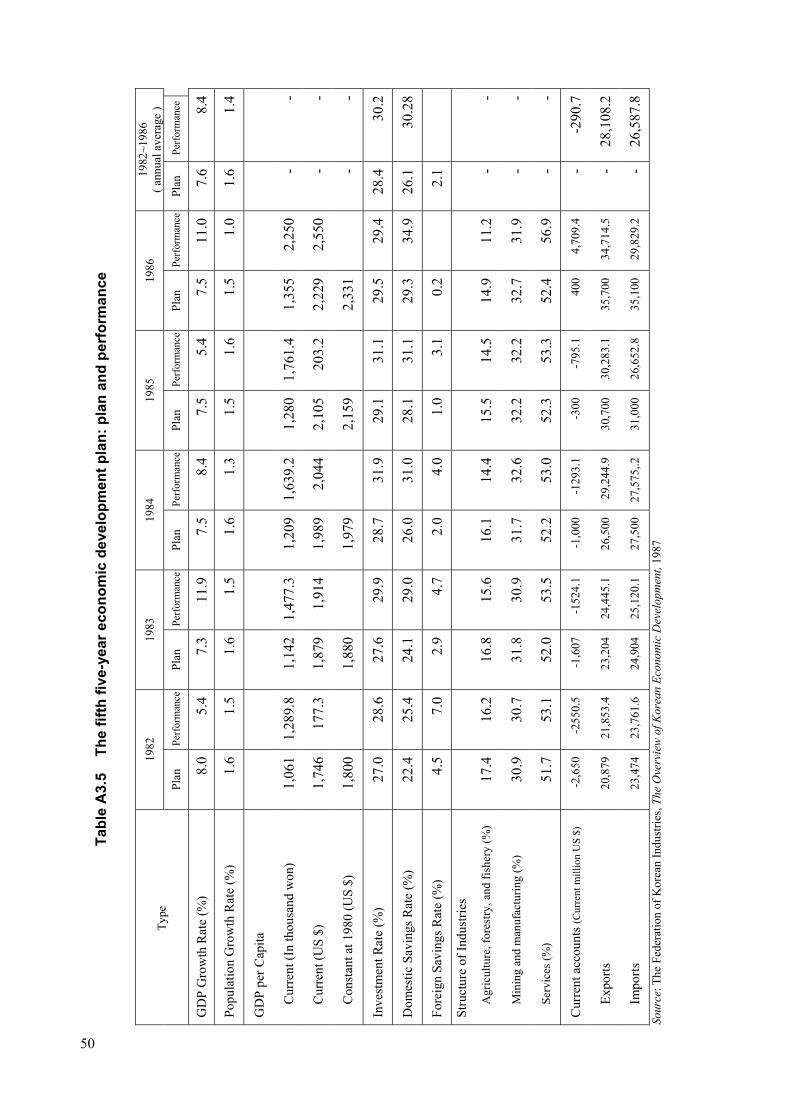
Pro
duct
ivity
per
form
ance
Ta
ble
A3.
5
The
fifth
five
-yea
r eco
nom
ic d
evel
opm
ent p
lan:
pla
n an
d pe
rfor
man
ce
1982
19
83
1984
19
85
1986
19
82~1
986
( ann
ual a
vera
ge )
Type
Pl
an
Perf
orm
ance
Plan
Pe
rfor
man
cePl
an
Perf
orm
ance
Plan
Pe
rfor
man
cePl
an
Perf
orm
ance
Plan
Pe
rfor
man
ce
GD
P G
row
th R
ate
(%)
8.0
5.4
7.3
11.9
7.5
8.4
7.5
5.4
7.5
11.0
7.6
8.4
Popu
latio
n G
row
th R
ate
(%)
1.6
1.5
1.6
1.5
1.6
1.3
1.5
1.6
1.5
1.0
1.6
1.4
GD
P pe
r Cap
ita
Cur
rent
(In
thou
sand
won
) 1,
061
1,28
9.8
1,14
21,
477.
31,
209
1,63
9.2
1,28
01,
761.
41,
355
2,25
0-
-
Cur
rent
(US
$)
1,74
617
7.3
1,87
91,
914
1,98
92,
044
2,10
520
3.2
2,22
92,
550
--
Con
stan
t at 1
980
(US
$)
1,80
01,
880
1,97
92,
159
2,33
1-
-
Inve
stm
ent R
ate
(%)
27.0
28.6
27.6
29.9
28.7
31.9
29.1
31.1
29.5
29.4
28.4
30.2
Dom
estic
Sav
ings
Rat
e (%
) 22
.425
.424
.129
.026
.031
.028
.131
.129
.334
.926
.130
.28
Fore
ign
Savi
ngs R
ate
(%)
4.5
7.0
2.9
4.7
2.0
4.0
1.0
3.1
0.2
2.1
Stru
ctur
e of
Indu
strie
s
Agr
icul
ture
, for
estry
, and
fish
ery
(%)
17.4
16.2
16.8
15.6
16.1
14.4
15.5
14.5
14.9
11.2
--
Min
ing
and
man
ufac
turin
g (%
) 30
.930
.731
.830
.931
.732
.632
.232
.232
.731
.9-
-
Serv
ices
(%)
51.7
53.1
52.0
53.5
52.2
53.0
52.3
53.3
52.4
56.9
--
Cur
rent
acc
ount
s (C
urre
nt m
illio
n U
S $)
-2
,650
-2
550.
5 -1
,607
-1
524.
1 -1
,000
-1
293.
1 -3
00
-795
.1
400
4,70
9.4
--2
90.7
Expo
rts
20,8
79
21,8
53.4
23
,204
24
,445
.1
26,5
00
29,2
44.9
30
,700
30
,283
.1
35,7
00
34,7
14.5
-
28,1
08.2
Impo
rts
23,4
74
23,7
61.6
24
,904
25
,120
.1
27,5
00
27,5
75,.2
31
,000
26
,652
.8
35,1
00
29,8
29.2
-
26,5
87.8
So
urce
: The
Fed
erat
ion
of K
orea
n In
dust
ries,
The
Ove
rvie
w o
f Kor
ean
Econ
omic
Dev
elop
men
t, 19
87
50
50

Republic of Korea
Table A4 Major social and economic indicators of Korea (1960-2000)
Social and Economic Indicators 1953 1960 1980 2000 1. Population Trend (In thousand persons)
Census Enumeration 24,989 37,436 46,136 Household (In thousand) 4,371 7,969 Average number of member (In persons) 5.6 4.5
Estimates of midyear population 20,5271 25,012 38,124 47,008 Male 10,083 1 12,551 19,236 23,667
Female 10,443 1 12,462 18,888 23,341
Sex ratio (per 100 female) 96.6 1 100.7 101.8 101.4
Population density (persons per sq. Km) 208.5 1 254.1 385.1 472.6
2. Summary of Economically Active Population Population 15-year old and over 14,5512 24,463 36,139
Economically active population 8,230 2 14,431 21,950
Employed 7,563 2 13,683 21,061
Unemployed 667 2 748 889
Non-economically active population 6,321 2 10,032 14,189
Unemployment rate (%) 8.1 2 5.2 4.1
3. Employed Persons by Industry (%) Agriculture, forestry and fishing 63.03 34.0 10.86 Mining and manufacturing 8.7 3 22.5 20.23
Manufacturing 7.9 3 21.6 20.15
Social overhead capital and other services 28.3 3 43.5 68.91
Construction 2.5 3 6.2 7.5 Wholesale & retail trade, restaurants & hotels 19.2 27.2 Transport, storage & communication 4.5 6.0
Finance, insurance, real estate & business, service 2.4 9.9
4. National Income (At current prices) GNI (US$ billion) 1.44 1.9 60.9 635.4 GDP (US$ billion) 1.3 2.0 62.2 457.4 Per Capita GNI (US$) 675 79 1,598 9,628
5. Growth rate by kind of economic activities 6(%) GNI 5.17 1.18 -5.3 3.6 GDP 5.6 7 1.2 8 -2.1 9.3
Agriculture, forestry and fishing 8.0 7 -2.1 8 -20.0 2.0 Mining and manufacturing 11.5 7 10.9 8 -1.2 15.7
Manufacturing 18.1 7 8.2 8 -1.6 15.9 Electricity, gas and water 22.7 7 -0.0 8 -0.5 14.0 Services 1.2 7 2.6 8 2.2 9.5
Producers of government and non-profit services 4.4 0.3
Social and Economic Indicators 1953 1960 1980 2000 6. Production Structure (% at current price)
Agriculture, forestry and fishing 47.3 36.8 14.7 4.7 Mining and manufacturing 10.1 15.9 29.7 31.6
Manufacturing 9.0 13.8 28.2 31.3 Electricity, gas and water 2.6 4.1 10.1 10.8 Services 40.0 43.2 36.0 43.1
1 1952 2 1963
3 1963 4 Gross National Products 5 Per Capita GNP 6 Series at 1995 constant prices 7 1954 8 Gross National Products
51
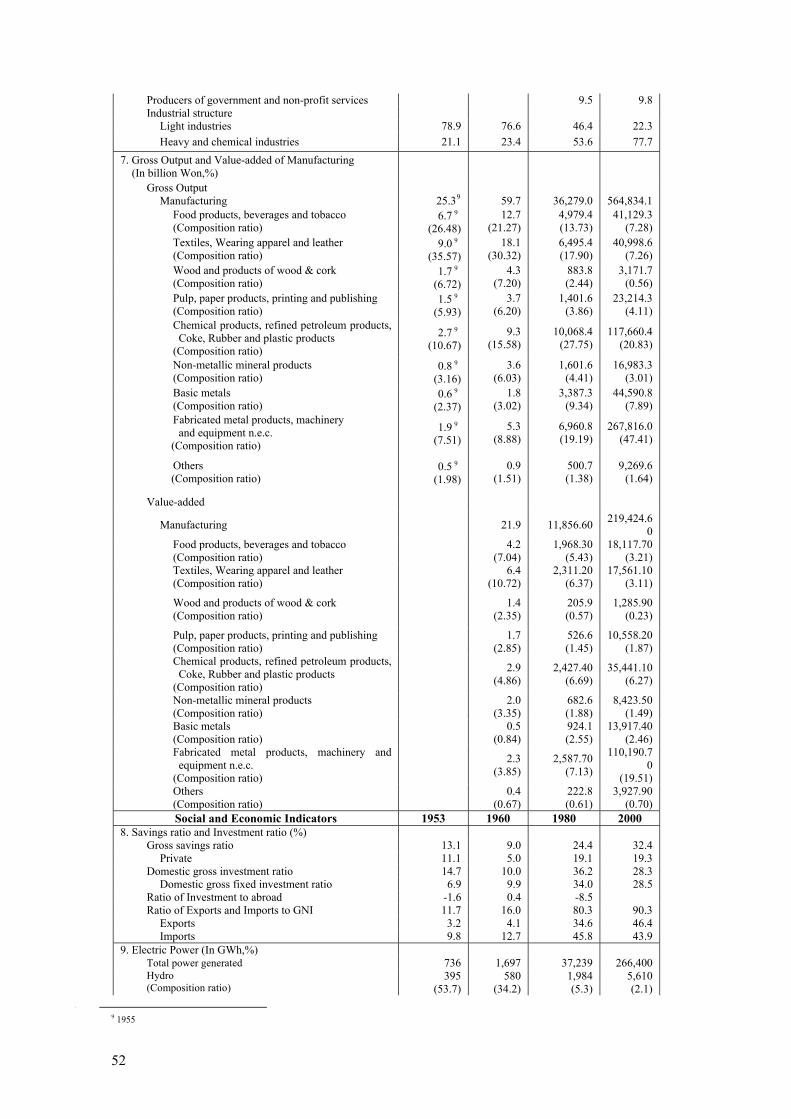
Productivity performance
Producers of government and non-profit services 9.5 9.8 Industrial structure
Light industries 78.9 76.6 46.4 22.3 Heavy and chemical industries 21.1 23.4 53.6 77.7
7. Gross Output and Value-added of Manufacturing (In billion Won,%)
Gross Output Manufacturing 25.39 59.7 36,279.0 564,834.1
Food products, beverages and tobacco (Composition ratio)
6.7 9
(26.48) 12.7
(21.27) 4,979.4 (13.73)
41,129.3 (7.28)
Textiles, Wearing apparel and leather (Composition ratio)
9.0 9
(35.57) 18.1
(30.32) 6,495.4 (17.90)
40,998.6 (7.26)
Wood and products of wood & cork (Composition ratio)
1.7 9
(6.72) 4.3
(7.20) 883.8 (2.44)
3,171.7 (0.56)
Pulp, paper products, printing and publishing (Composition ratio)
1.5 9
(5.93) 3.7
(6.20) 1,401.6
(3.86) 23,214.3
(4.11) Chemical products, refined petroleum products, Coke, Rubber and plastic products
(Composition ratio) 2.7 9
(10.67) 9.3
(15.58) 10,068.4
(27.75) 117,660.4
(20.83)
Non-metallic mineral products (Composition ratio)
0.8 9
(3.16) 3.6
(6.03) 1,601.6
(4.41) 16,983.3
(3.01) Basic metals (Composition ratio)
0.6 9
(2.37) 1.8
(3.02) 3,387.3
(9.34) 44,590.8
(7.89) Fabricated metal products, machinery and equipment n.e.c.
(Composition ratio) 1.9 9
(7.51) 5.3
(8.88) 6,960.8 (19.19)
267,816.0 (47.41)
Others (Composition ratio)
0.5 9
(1.98) 0.9
(1.51) 500.7 (1.38)
9,269.6 (1.64)
Value-added
Manufacturing 21.9 11,856.60 219,424.60
Food products, beverages and tobacco (Composition ratio) 4.2
(7.04) 1,968.30
(5.43) 18,117.70
(3.21) Textiles, Wearing apparel and leather (Composition ratio) 6.4
(10.72) 2,311.20
(6.37) 17,561.10
(3.11)
Wood and products of wood & cork (Composition ratio) 1.4
(2.35) 205.9 (0.57)
1,285.90 (0.23)
Pulp, paper products, printing and publishing (Composition ratio) 1.7
(2.85) 526.6 (1.45)
10,558.20 (1.87)
Chemical products, refined petroleum products, Coke, Rubber and plastic products
(Composition ratio) 2.9
(4.86) 2,427.40
(6.69) 35,441.10
(6.27)
Non-metallic mineral products (Composition ratio) 2.0
(3.35) 682.6 (1.88)
8,423.50 (1.49)
Basic metals (Composition ratio) 0.5
(0.84) 924.1 (2.55)
13,917.40 (2.46)
Fabricated metal products, machinery and equipment n.e.c.
(Composition ratio) 2.3
(3.85) 2,587.70
(7.13)
110,190.70
(19.51) Others (Composition ratio) 0.4
(0.67) 222.8 (0.61)
3,927.90 (0.70)
Social and Economic Indicators 1953 1960 1980 2000 8. Savings ratio and Investment ratio (%)
Gross savings ratio 13.1 9.0 24.4 32.4 Private 11.1 5.0 19.1 19.3
Domestic gross investment ratio 14.7 10.0 36.2 28.3 Domestic gross fixed investment ratio 6.9 9.9 34.0 28.5
Ratio of Investment to abroad -1.6 0.4 -8.5 Ratio of Exports and Imports to GNI 11.7 16.0 80.3 90.3
Exports 3.2 4.1 34.6 46.4 Imports 9.8 12.7 45.8 43.9
9. Electric Power (In GWh,%) Total power generated 736 1,697 37,239 266,400 Hydro (Composition ratio)
395 (53.7)
580 (34.2)
1,984 (5.3)
5,610 (2.1)
9 1955
52
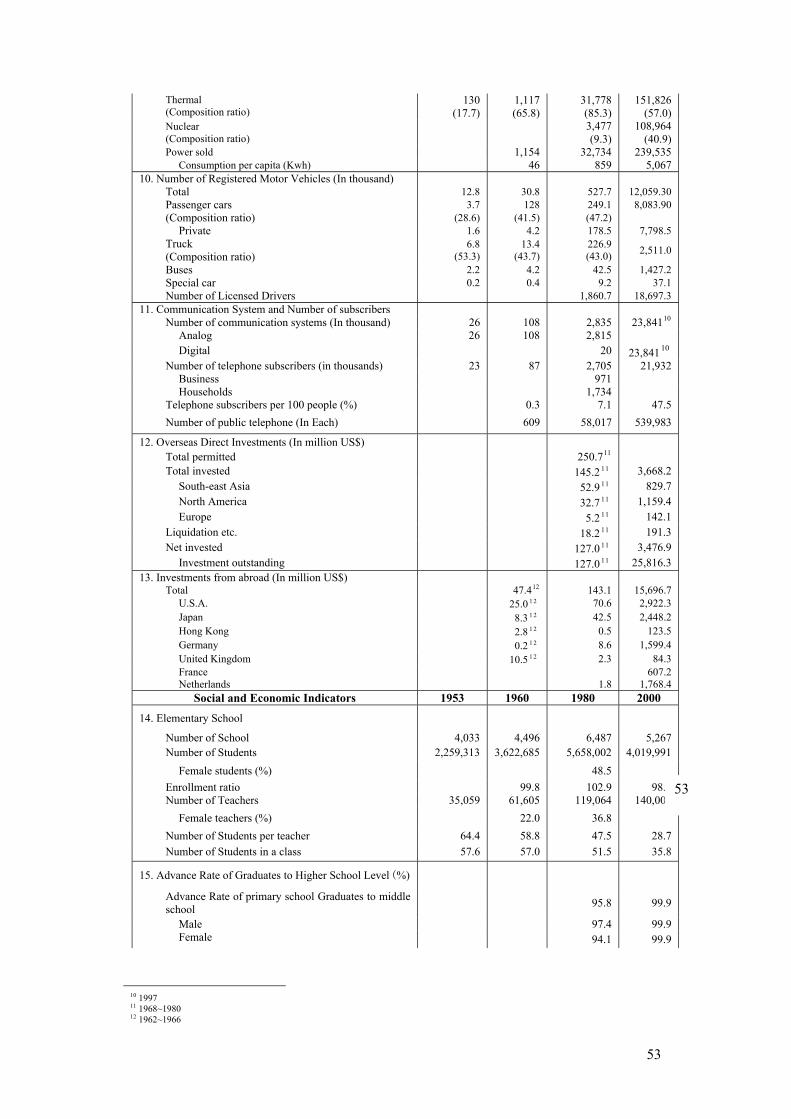
Republic of Korea
Thermal (Composition ratio)
130 (17.7)
1,117 (65.8)
31,778 (85.3)
151,826 (57.0)
Nuclear (Composition ratio) 3,477
(9.3) 108,964
(40.9) Power sold 1,154 32,734 239,535
Consumption per capita (Kwh) 46 859 5,067 10. Number of Registered Motor Vehicles (In thousand)
Total 12.8 30.8 527.7 12,059.30 Passenger cars 3.7 128 249.1 8,083.90 (Composition ratio) (28.6) (41.5) (47.2)
Private 1.6 4.2 178.5 7,798.5 Truck (Composition ratio)
6.8 (53.3)
13.4 (43.7)
226.9 (43.0) 2,511.0
Buses 2.2 4.2 42.5 1,427.2 Special car 0.2 0.4 9.2 37.1 Number of Licensed Drivers 1,860.7 18,697.3
11. Communication System and Number of subscribers 23,84110Number of communication systems (In thousand) 26 108 2,835
Analog 26 108 2,815 Digital 20 23,841 10
Number of telephone subscribers (in thousands) 23 87 2,705 21,932 Business 971 Households 1,734
Telephone subscribers per 100 people (%) 0.3 7.1 47.5 Number of public telephone (In Each) 609 58,017 539,983
12. Overseas Direct Investments (In million US$) Total permitted 250.711
3,668.2 Total invested 145.2 11 829.7 South-east Asia 52.9 11
1,159.4 North America 32.7 11 Europe 5.2 11 142.1
191.3 Liquidation etc. 18.2 11 3,476.9 Net invested 127.0 11
25,816.3 Investment outstanding 127.0 11 13. Investments from abroad (In million US$)
Total 47.412 143.1 15,696.7 U.S.A. 25.0 1 2 70.6 2,922.3 Japan 8.3 1 2 42.5 2,448.2 Hong Kong 2.8 1 2 0.5 123.5 Germany 0.2 1 2 8.6 1,599.4 United Kingdom 10.5 1 2 2.3 84.3 France 607.2 Netherlands 1.8 1,768.4
Social and Economic Indicators 1953 1960 1980 2000
14. Elementary School
Number of School 4,033 4,496 6,487 5,267 Number of Students 2,259,313 3,622,685 5,658,002 4,019,991
Female students (%) 48.5 Enrollment ratio 99.8 102.9 98.7 Number of Teachers 35,059 61,605 119,064 140,000
Female teachers (%) 22.0 36.8
53
Number of Students per teacher 64.4 58.8 47.5 28.7 Number of Students in a class 57.6 57.0 51.5 35.8
15. Advance Rate of Graduates to Higher School Level (%)
Advance Rate of primary school Graduates to middle school 95.8 99.9
Male 97.4 99.9 Female 94.1 99.9
10 1997 11 1968~1980 12 1962~1966
53

Productivity performance
Advance Rate of middle school Graduates to high school 70.213 84.5 99.6
Male 87.5 99.6 Female 80.8 99.6
Advance Rate of high school Graduates to higher education 29.8 13 23.7 68.0
Male 24.5 Female 22.5
16. Composition of Population by Education Attainment (25 Years Old & Over,%)
Primary School Graduates and Under 91.814 79.615 55.3 23.0 Male 86.0 1 4 68.9 1 5 42.8 15.1 Female 97.1 1 4 89.5 1 5 67.0 30.4
Middle school Graduates 5.3 1 4 11.1 1 5 18.1 13.3 Male 8.9 1 4 15.9 1 5 19.8 12.3 Female 2.0 1 4 6.6 1 5 16.5 14.3
High school Graduates 1.7 1 4 5.6 1 5 18.9 39.4 Male 2.7 1 4 8.5 1 5 25.4 41.6 Female 0.7 1 4 2.9 1 5 12.9 37.3
College, University Graduates and Over 1.3 1 4 3.7 1 5 7.7 24.3 Male 2.4 1 4 6.7 1 5 12.0 31.0 Female 0.3 1 4 1.0 1 5 3.6 18.0
17. Private Institutes (In each, person) Institutes 1,13616 5,023 57,935
Liberal arts & sciences course 214 16 381 14,043 Art course 193 16 1,485 26,160 Management business field 92 16 1,367 11,029
Attendants 52,009 16 411,162 7,772,909 Liberal arts & sciences course 117,618 1,388,333 Art course 52,808 987,610 Management business field 123,922 565,350
Instructors 13,332 135,637 Social and Economic Indicators 1953 1960 1980 2000
18. Public Education Cost per capita (In thousand Won)
Elementary Schools 4.717 118.5 2,023 Middle Schools 9.5 1 7 157.2 2,690 High Schools 19.7 1 7 149.7 2,841 Junior colleges 53.0 1 7 708.0 3,095
National & Public 50.4 1 7 893.3 2,471.018
Teacher’s College 44.2 1 7 1,114.0 6,449 College & university 68.3 1 7 1,036.3 5,526
4,673.8 18National & Public 93.3 1 7 1,198.2
19. Institutions and Personnel Engaged in R&D Research activity performance Institutions 7219 647 4,635
Research Institutes 124 173 University & College 202 268 Companies 321 4,194
Researchers 1,750 1 9 18,434 159,973 Research Institutes 4,598 University & College 8,695 50,155 Companies 5,141 70,431
Researchers per 10,000 0.6 1 9 4.8
13 1962 14 1955
15 1966 16 1965 17 1967 18 1997 19 1963
54

Republic of Korea
20. R&D Expenditures character of work (In billion Won) Total 1.220 621.721 13,848.5
2.67 Ratio to GDP (%) 0.24 2 0 0.97 21
Basic research (Composition ratio,%) 113 21
(18.2) 1,746.1 (12.61)
Applied research (Composition ratio,%) 179.4 21
(28.9) 3,370.1 (24.34)
Experimental development (Composition ratio,%) 329.4 21
(53.0) 8,732.3 (63.06)
21. Water supply
Water supply (In thousand) 3,45122 4,210 20,809 41,774
Water supply ratio (%) 16.8 54.6 87.1 Capacity (in thousand ton per day) 240 22 517 6,756 26,980 Water supply per person a day (liters) 65 22 99 256 380 Number of Regions with Water Supply (In each) 50 22 58 243 861
22. Distribution of Income (Gini Coefficient)
Family and Expenditure Survey 0.345 0.295
Urban Wage Earners’ Households 0.291 0.317
23. Labor Union Number of Unit unions 2,141 5,698 Union Members (1,000 persons) 967 1,527 Union Membership Rate (%) 20.8 12.0 Number of Labor Dispute Cases 1,873 250 Working Days Lost (Days) 5,400,837 1,893,563
Sources: Korea National Statistical Office, Social Indicators in Korea (2001), Korea Statistical Yearbook (2001), and Changes in Social and Economic Life in Korea during last Five Decades (1998)
20 1963 21 1983 22 1954
55