Embed Size (px)
Citation preview
KONE CMD 2013
Developing profitability and productivity
Henrik Ehrnrooth, CFO
September 24, 2013
Graph on slide 11
has been updated
February 18, 2015
Financial targets and profitability drivers
Agenda
Developing our maintenance business
Financial focus areas
Way forward
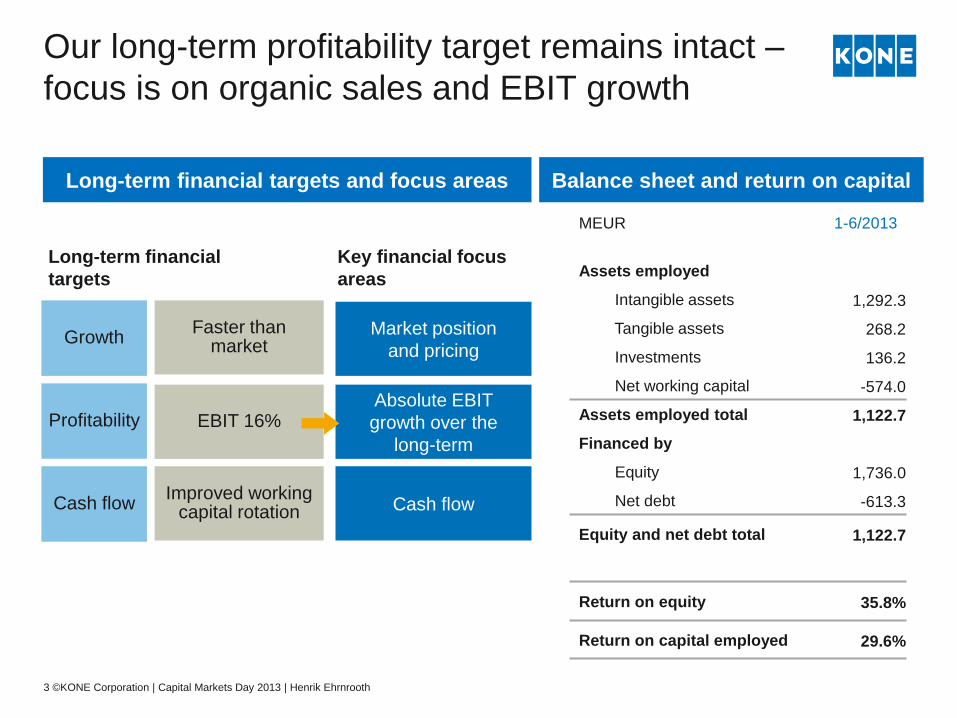
Market position
and pricing
Our long-term profitability target remains intact –
focus is on organic sales and EBIT growth
Faster than market
Key financial focus
areas
Long-term financial
targets
MEUR 1-6/2013
Assets employed
Intangible assets 1,292.3
Tangible assets 268.2
Investments 136.2
Net working capital -574.0
Assets employed total 1,122.7
Financed by
Equity 1,736.0
Net debt -613.3
Equity and net debt total 1,122.7
Return on equity 35.8%
Return on capital employed 29.6%
Profitability
Growth
EBIT 16% Absolute EBIT
growth over the
long-term
Cash flow Improved working
capital rotation Cash flow
Long-term financial targets and focus areas Balance sheet and return on capital
3 ©KONE Corporation | Capital Markets Day 2013 | Henrik Ehrnrooth

Good sales and EBIT growth, but margin trend has
been slightly negative due to clear changes in the
business
Note: Excluding one-time items.
For 2012, intangible asset amortizations related to GiantKONE burden the margin.
12m quarterly rolling EBIT margin, Q4/2005-Q2/2013
4 ©KONE Corporation | Capital Markets Day 2013 | Henrik Ehrnrooth
EBIT margin progression
Operational and fixed cost leverage
Quality and productivity
Growth in maintenance
0%
4%
8%
12%
16%
Q2/2013 2006
Business mix
Continued investment in areas
supporting growth
Prolonged market weakness in
South Europe and the US
Low margin orders from
2010—2011
Recent margin drivers

How do we progress towards our long-term
16% EBIT margin target
5 ©KONE Corporation | Capital Markets Day 2013 | Henrik Ehrnrooth
Right balance between growth and price
16%
long-term
margin target
Pricing
Quality of field operations
New product quality
Quality Maintenance
Installation
Fixed cost management and leverage
Productivity & costs
Maintenance growth through strong new
equipment market position
Operational leverage in all businesses
Growth

Continuous active development of pricing
Pricing Managing price and volume
Granular view of market prices Insight, systems data utilization
Value selling
Management of pricing
Brand perception
Competitiveness of product offering
Clear targets and incentives
Products
Competences
Management
6 ©KONE Corporation | Capital Markets Day 2013 | Henrik Ehrnrooth
Driving pricing development in a highly competitive environment
Process and competence development

How are we managing our costs to support
growth while driving efficiency
Footprint in Asia-Pacific
R&D
Process development & IT
Investing in areas supporting our growth
Areas to drive efficiency
Ensuring leverage from growth
Overall tight management of costs
Support function development and adjustment of operations programs progressing o Expected annualized cost savings of approximately
35 MEUR
o Current run rate 26 MEUR, expected to reach 30 MEUR by end of 2013
o EUR 35 million run rate expected to be achieved in H1 2014
7 ©KONE Corporation | Capital Markets Day 2013 | Henrik Ehrnrooth

Favorable raw material price development
continued during the first half of 2013
Source: LME, Shanghai Futures Exchange, American Metal Market, Steel Info, MEPS, Finnish Technology
Industries, Asian Metal, China Commodity Marketplace. Metal prices are averages of regional prices. 8 ©KONE Corporation | Capital Markets Day 2013 | Henrik Ehrnrooth
Index change of market prices, %
2010 2011 2012 1-6/
2013
Hot-rolled
steel 23% 19% -12% -2%
Stainless
steel 25% -1% -15% -6%
Copper 50% 14% -12% -4%
Rare
Earths 130% 439% -43% -47%
Aluminum 17% 7% -8% -6%
Brent Oil 31% 39% 1% -4%
Raw material price development Sourcing focus areas
GiantKONE included in our global
sourcing platform
Supplier quality
Gradual locking of material prices
for H1/2014

Majority of our sales are in other currencies
than the euro
9 ©KONE Corporation | Capital Markets Day 2013 | Henrik Ehrnrooth
Sales by currency in 1-6/2013 FX management
Other
USD/CAD
RMB
EUR
Transactional
Balance between sales and costs
provides good natural hedging
Translational
Changes in translation rates have
an impact on sales and EBIT,
approx. 35% of EBIT improvement
in 2012 was due to FX
Currently FX is a slight headwind
Turbulence in Indian and
Southeast Asian currencies does
not have a material impact

Financial targets and profitability drivers
Developing our maintenance business
Financial focus areas
Way forward

Absolute EBIT growth and improvement in
working capital have led to strong cash flow
11 ©KONE Corporation | Capital Markets Day 2013 | Henrik Ehrnrooth
High operative cash flow generation, 12 months rolling
Strong net working capital development, Q4/2008-Q2/2013
-600
-500
-400
-300
-200
-100
0
2010 2012 2011 2009 Q2
13
1,300
1,200
1,100
1,000
900
800
700
600
500
400
300
200
100
0
2010 2012 2011 2009 Q2
13
MEUR MEUR
12m rolling quarterly cash flow from operations (before financing items and taxes)
Other WC items
Inventories – advance payments

Working capital position has continued to
develop favorably
0
200
400
600
800
1 000
1 200
1 400
1 600
1 800
Q2
13
2012 2011 2010 2009
Accounts payable &
other non-IB liabilities
Advance payments received
Accounts receivable
& other non-IB assets
Total inventories
Assets Liabilities
MEUR
Working capital item development
12 ©KONE Corporation | Capital Markets Day 2013 | Henrik Ehrnrooth
WC rotation relative to sales
0
10
20
30
40
50
60
70
80
90
100
2012 Q2
13
2010 2011 2009
Accounts payable & other non-IB liabilities rotation
Accounts receivable & other non-IB assets rotation
Inventory rotation
Days
Note: Figures in both graphs are LTM average values

Our investments are geared towards growth
13 ©KONE Corporation | Capital Markets Day 2013 | Henrik Ehrnrooth
Capex increased due to Kunshan in 2012 Acquisitions remain a priority
51 49 50 50
53
29
37
119
52
4447
74
0
10
20
30
40
50
60
70
80
90
100
110
120
14
38
10
86
33
66
16
64
13
62
13
65
Amortization of acquisition-related intangible
assets
Capital expenditure excluding acquisitions
Depreciation
23
169
185
167
4660
0
20
40
60
80
100
120
140
160
180
200
H1/2013 2012 2011 2010 2009 2008
20 21 21
(Nr of acquisitions)
23
2008 2009 2010 2011 2012
21
H1/2013
MEUR MEUR
13

Cash flow has constantly improved through
improvement in all cash flow items
14 ©KONE Corporation | Capital Markets Day 2013 | Henrik Ehrnrooth
Cash flow statement
MEUR 1-6/2013 1-6/2012 1-12/2012
Operating income 403.2 307.6 791.4
Change in working capital before financing items and
taxes
181.6 97.8 193.4
Depreciation and impairment 38.4 43.0 86.0
Cash flow from operations before financial items and
taxes
623.2 448.4 1,070.8
Cash flow from financing items and taxes -85.3 -51.0 -128.7
Cash flow from operating activities 537.9 397.4 942.1
Cash flow from investing activities -64.7 -65.0 -220.2
Increase in equity (option rights) 3.8 29.7 29.7
Purchase of own shares -4.8 -36.9 -36.9
Profit distribution -448.3 -356.4 -740.8
Changes in non-controlling interests -6.6 - -1.5
Free cash flow 17.3 -31.2 -27.6

Financial targets and profitability drivers
Developing our maintenance business
Financial focus areas
Way forward

Fundamental growth of the maintenance
market
Global E&E base development in 2012
16 ©KONE Corporation | Capital Markets Day 2013 | Henrik Ehrnrooth
E&E base growth by area
(approx.)
Global E&E base
2012
>11m units
Removal from base Deliveries in 2011 Global E&E base
2011
~11m units
CAGR by area 2008-2012
Global 5.5%
EMEA 2%
North
America 1%
China 22%
Rest of
APAC 10%
Based on KONE’s estimates
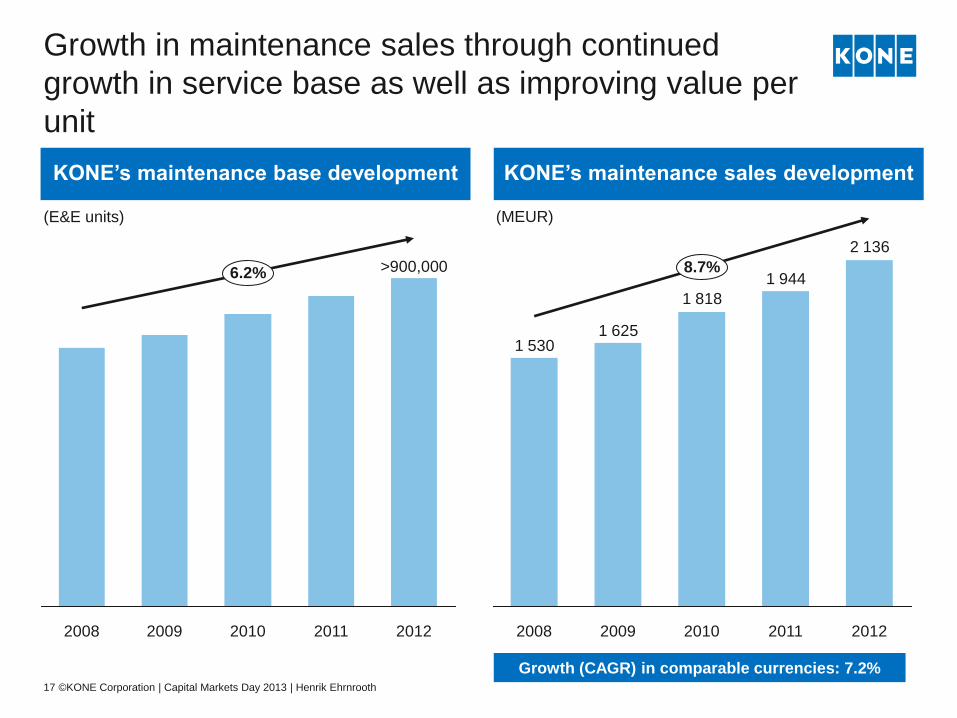
Growth in maintenance sales through continued
growth in service base as well as improving value per
unit
KONE’s maintenance sales development
17 ©KONE Corporation | Capital Markets Day 2013 | Henrik Ehrnrooth
2 136
1 944
1 818
1 6251 530
8.7%
2012 2011 2010 2009 2008
Growth (CAGR) in comparable currencies: 7.2%
KONE’s maintenance base development
>900,000
2011 2010 2009 2008 2012
6.2%
(E&E units) (MEUR)

Our maintenance base grows by different
means in different regions
Wins
Closing Lifts in
Service (LIS)
at end of year n-1
Other
Closing Lifts in
Service (LIS)
at end of year n
Conversions
Acquisitions
Losses
∆
Conversions
Primary way of growing maintenance base
Conversions in China key growth driver
going forward
Acquisitions
Focus to grow density
Establishing new operations (e.g. Israel in
2012)
Competition balance
Competition for existing units in service
Weak markets have increased churn
somewhat
Strong focus on customer retention and
sales activities to improve balance
Pricing
Escalations to cover labor and other cost
increases
Renegotiations
New conversion pricing
Material
18 ©KONE Corporation | Capital Markets Day 2013 | Henrik Ehrnrooth
Installation of
new equipment
Conversion into
maintenance base
First service period
typically 1-3 years

Measurement & control
Benchmarking
Competence development &
coaching
Developing productivity in maintenance
19 ©KONE Corporation | Capital Markets Day 2013 | Henrik Ehrnrooth
Maintenance
quality &
productivity
Performance management
Planning and prioritization of
work
Dispatching
Technology/Systems
Clear processes and tasks
Focus on improving quality
Maintenance methods
Growth through conversions,
acquisitions and competition
balance
Route optimization
Density
Fixed
costs
Field
costs
Material
Rough cost structure
in maintenance

Financial targets and profitability drivers
Developing our maintenance business
Financial focus areas
Way forward

We will continue building on our strengths
going forward
Continued good growth as a result of market share
gains and market growth driven by
global megatrends
Challenger attitude and consistent active
development of competitiveness
High-quality execution of a capital-light and
cash-generative business model Low amount of fixed assets required
Negative working capital
High return on invested capital
Strong market position in Asia brings growth
opportunities and strength in
service business brings stability
21 ©KONE Corporation | Capital Markets Day 2013 | Henrik Ehrnrooth