Embed Size (px)
Citation preview
The World Bank Research Observer, vol. 16, no. 2 (Fall 2001), pp. 199–218© 2001 The International Bank for Reconstruction and Development / the world bank 199
Productivity Growth and Sustainabilityin Post–Green Revolution Agriculture:
The Case of the Indian andPakistan Punjabs
Rinku Murgai, Mubarik Ali, and Derek Byerlee
This article attempts to determine the long-term productivity and sustainability of irrigatedagriculture in the Indian and Pakistan Punjabs by measuring trends in total factor produc-tivity for production systems in both states since the advent of the Green Revolution. Thesemeasurements over time and across systems have resulted in three major findings. First, therewere wide spatial and temporal variations between the two Punjabs. Although output growthand crop yields were much higher in the Indian Punjab, productivity growth was higher byonly a small margin. Moreover, the lowest growth in productivity took place during the ini-tial Green Revolution period (as opposed to the later intensification and post–Green Revolu-tion periods) and in the wheat-rice system in both states. The time lag between adoption ofGreen Revolution technologies and realization of productivity gains is related to learning-induced efficiency gains, better utilization of capital investments over time, and problems withthe standard methods of productivity measurement that downwardly bias estimates, particu-larly during the Green Revolution period. Second, input growth accounted for most of theoutput growth in both Punjabs during the period under study. Third, intensification, espe-cially in the wheat-rice system, resulted in resource degradation in both Punjabs. Data fromPakistan show that resource degradation reduced overall productivity growth from techni-cal change and from education and infrastructure investment by one-third. These findingsimply the need for policies that promote agricultural productivity and sustainability throughpublic investments in education, roads, and research and extension; and that reduce resourcedegradation by decreasing or eliminating subsidies that encourage intensification of inputs.
The Indo-Gangetic Plain of northern India and Pakistan has one of the largest con-centrations of poor people in the world. The agricultural sector, which employs morethan half the area’s 500 million inhabitants, has long been considered key to food
Pub
lic D
iscl
osur
e A
utho
rized
Pub
lic D
iscl
osur
e A
utho
rized
Pub
lic D
iscl
osur
e A
utho
rized
Pub
lic D
iscl
osur
e A
utho
rized
Pub
lic D
iscl
osur
e A
utho
rized
Pub
lic D
iscl
osur
e A
utho
rized
Pub
lic D
iscl
osur
e A
utho
rized
Pub
lic D
iscl
osur
e A
utho
rized
The World Bank Research Observer, vol. 16, no. 2 (Fall 2001)200
security and poverty alleviation for this population. Beginning in the mid-1960s,Green Revolution technologies were introduced in the area, including high-yieldingmodern varieties of rice and wheat, the area’s two major crops. This change wassupported by investment in irrigation and market infrastructure. As a result, the areaexperienced a dramatic increase in agricultural production, especially in India’sPunjab State and Pakistan’s Punjab Province.
But despite this promising beginning, the further intensification of input use sincethe adoption of Green Revolution technologies has provided lower marginal returns(Byerlee 1992); and the continued intensification of cropping has sometimes causeddegradation of the resource base in the form of salinization, overexploitation of ground-water, physical and chemical deterioration of the soil, and pest and disease problems(Fujisaka and others 1994; Siddiq 1994). Consequently, there is now great concernabout the potential for productivity growth in irrigated Green Revolution systems andtheir sustainability over the longer term.
The Debate about Agricultural Performance
Despite the evidence of sharply lower growth rates for food grain yields, there is con-siderable controversy about aggregate performance of the agricultural sector. Inparticular, good performance in nonfood crops—such as cotton in Pakistan; oilseeds,fruits, and vegetables in northwest India; and livestock in both countries—may haveoffset the slowdown in food grains.
Moreover, crop yields are only a measure of partial factor productivity, whereasoverall agriculture sector performance is generally measured by total factor produc-tivity (tfp). The tfp approach compares an index of output changes with an index ofinput changes, thus making it possible to attribute residual output growth to tech-nical progress, changes in input quality, and changes in the physical and economicenvironment. Experience from industrialized countries suggests that, over the longerrun, tfp in the agriculture sector should grow at 1.5 to 2 percent a year, and thatone- to two-thirds of that growth will be due to investment in research and extension.
Recent estimates of tfp for agriculture in Pakistan and northwestern India pro-vide conflicting conclusions. For Pakistan, two studies indicate negative tfp growthin the post–Green Revolution period, especially in the Punjab (Azam and others 1991;Ali and Velasco 1994). By contrast, another study (Khan 1994) concludes that tfp
in Pakistan grew sharply in the period 1980–92, at an annual rate of 2.1 percent,suggesting that the agricultural sector in that country performed well in recent years.For northwest India, there is little recent evidence on aggregate tfp growth, althoughthe few available studies generally indicate that it was positive (Kaur 1991; Sidhuand Byerlee 1991; Kumar and Rosegrant 1994; Evenson and others 1999). Theseconflicting results are due in part to the studies’ widely varying coverage of inputs
Rinku Murgai, Mubarik Ali, and Derek Byerlee 201
and outputs, methods of valuing inputs, index procedures used to estimate tfp, andlevels of disaggregation.
In addition, there is little quantitative evidence of the impact of resource degrada-tion on productivity growth. Thus, with the body of information that now exists, itis difficult to accurately assess productivity growth and sustainability under intensi-fication, and to reach definite policy conclusions about how best to ensure foodsecurity and alleviate poverty in the Indo-Gangetic Plain.
Objectives of the Study
The main objectives of this study are, first, to provide comparable estimates of tfp
growth in the Indian and Pakistan Punjabs since the advent of the Green Revolu-tion and, second, to relate productivity trends to changes in resource quality. Thearticle is organized as follows. The next section outlines the methodology. We thendescribe major trends in the agriculture sector, especially those related to productionperformance, input use, and resource degradation. We then present estimates of tfp
at the state level and by cropping system. In each case, we decompose output growthinto the contributions from growth in input use and growth in tfp. In the subsequentsection, we use detailed data on resource degradation in Pakistan to further decom-pose productivity trends into the effects of technology, resource degradation, humanresources, and infrastructure. The final two sections discuss policy implications andsummarize our main findings.
Methodology
Our approach is to estimate growth in tfp for three periods corresponding to differ-ent phases of technical change: (1) The Green Revolution period itself (1966–74),when input-responsive modern varieties of wheat and rice were widely adopted, lead-ing to an immediate and dramatic increase in production; (2) the input intensifica-tion period (1975–85 in India, 1975–84 in Pakistan), when the use of fertilizers andcapital inputs increased rapidly; and (3) the post–Green Revolution period (1986–94 in India, 1985–94 in Pakistan), when input use leveled off (Byerlee 1992).
We base our calculations (box 1) on district-level data on all inputs, outputs, andprices, collected from statistical agencies and secondary sources in both states. Thedata cover the period 1961–94 in India and 1966–94 in Pakistan. Input categoriesinclude land, labor, water, machinery, draught animals, fertilizer, and pesticide costs.To minimize aggregation bias in tfp, inputs of different qualities are valued by theprice of each quality type. Land is divided into irrigated and unirrigated, labor intoskilled and unskilled (based on the rural literacy rate in each district), water into canal
The World Bank Research Observer, vol. 16, no. 2 (Fall 2001)202
and tubewell, and fertilizer into individual nutrient sources (nitrogen, phosphorous,and potassium).
Outputs are aggregated into an output index using district-specific farm harvestprices for crops and market center–specific prices for livestock products.
These data are used to estimate tfp separately for different agro-ecological zones,defined in terms of cropping systems, to avoid the problem of aggregation acrossheterogeneous regions. This approach enables direct comparison of productivitytrends and helps determine whether productivity slowdown and environmental deg-radation are associated with particular cropping systems and ecologies. In India, thedistricts are divided into three cropping systems: wheat-rice, wheat-cotton, andwheat-maize. In Pakistan, they are divided into wheat-rice, wheat-cotton, wheat–mixed summer crops (often maize or sugarcane), and wheat-mungbean (or wheat-fallow). The district-level data are then aggregated to quantify tfp growth in termsof the dominant cropping pattern. For Pakistan, where we collected test results from1971–94 on the quality of groundwater and soil (organic matter, phosphorous con-tent, and soluble salts), productivity growth is also econometrically decomposed intothe effects of technology, resource degradation, human resources, and infrastructure.Disaggregated data on resource quality for the Indian Punjab and for the pre-1971years in Pakistan were not available.
Trends in Production, Input Use, and Resource Degradation
Table 1 describes the production record in the two Punjabs for the three major crops—wheat, rice, and cotton—during the Green Revolution, intensification, and post–Green Revolution periods. During the first period, modern wheat and rice varietieswere widely and rapidly adopted in both states. Wheat production increased by morethan 7 percent annually, with yield increases accounting for slightly more than half
Box 1. Calculating Change in Total Factor Productivity as a Result of the Green Revolution
Of the several ways to measure tfp using different rules for aggregating outputs and inputs (Alston and others1995), we use the chain-linked Tornqvist-Theil index, because it provides an exact measure of technicalchange for the linear homogenous translog production function with Hicks-neutral technical change (Diewert1976). tfp is obtained by taking the difference between the growth rates of the aggregate output and inputindices:
TFP ≈ ln(TFPt / TFPt–1) = [ln(QIt/QIt–1) – ln(XIt/XIt–1)] = Σt 1/2 (Rit + Rit–1)ln(Qit / Qit–1) – Σj 1/2 (Sjt + Sjt–1) ln(Xjt / Xjt–1)]
where QIt is the aggregate output index, XIt is the aggregate input index, and Rit and Sjt are the revenue shareof output i and cost share of input j at time t, respectively.
Rinku Murgai, Mubarik Ali, and Derek Byerlee 203
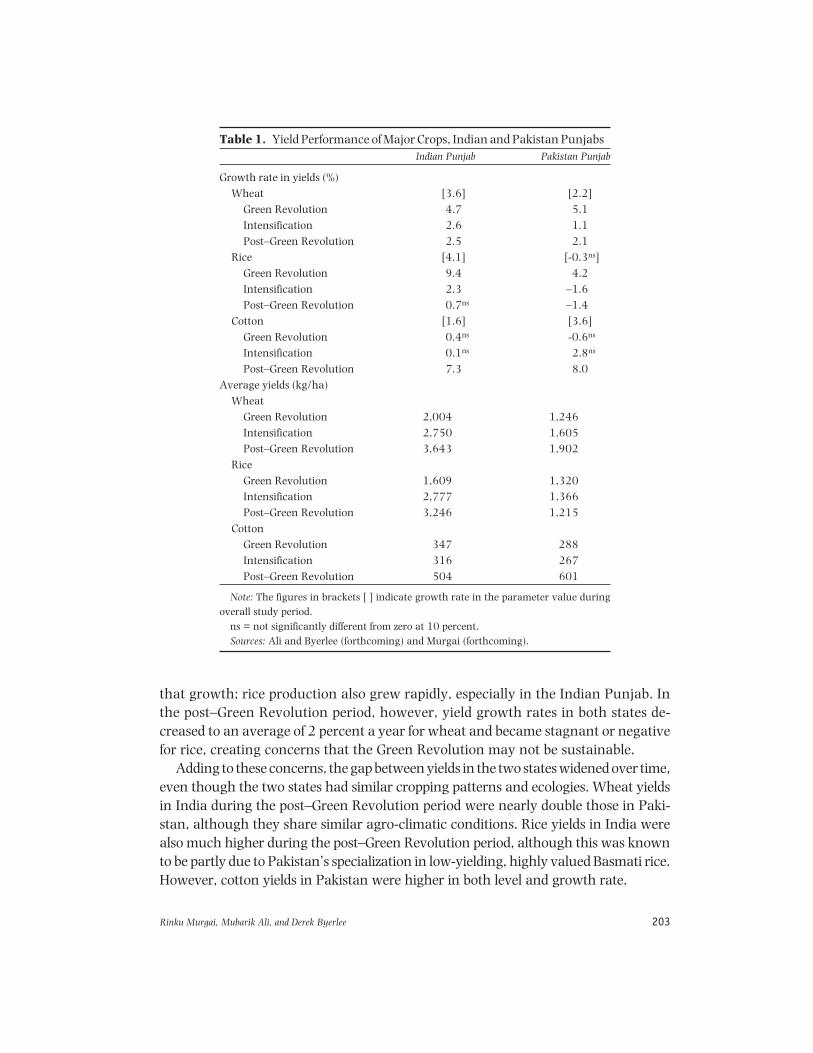
that growth; rice production also grew rapidly, especially in the Indian Punjab. Inthe post–Green Revolution period, however, yield growth rates in both states de-creased to an average of 2 percent a year for wheat and became stagnant or negativefor rice, creating concerns that the Green Revolution may not be sustainable.
Adding to these concerns, the gap between yields in the two states widened over time,even though the two states had similar cropping patterns and ecologies. Wheat yieldsin India during the post–Green Revolution period were nearly double those in Paki-stan, although they share similar agro-climatic conditions. Rice yields in India werealso much higher during the post–Green Revolution period, although this was knownto be partly due to Pakistan’s specialization in low-yielding, highly valued Basmati rice.However, cotton yields in Pakistan were higher in both level and growth rate.
Table 1. Yield Performance of Major Crops, Indian and Pakistan PunjabsIndian Punjab Pakistan Punjab
Growth rate in yields (%)Wheat [3.6] [2.2]
Green Revolution 4.7 5.1Intensification 2.6 1.1Post–Green Revolution 2.5 2.1
Rice [4.1] [-0.3ns]Green Revolution 9.4 4.2Intensification 2.3 –1.6Post–Green Revolution 0.7ns –1.4
Cotton [1.6] [3.6]Green Revolution 0.4ns -0.6ns
Intensification 0.1ns 2.8ns
Post–Green Revolution 7.3 8.0Average yields (kg/ha)
WheatGreen Revolution 2,004 1,246Intensification 2,750 1,605Post–Green Revolution 3,643 1,902
RiceGreen Revolution 1,609 1,320Intensification 2,777 1,366Post–Green Revolution 3,246 1,215
CottonGreen Revolution 347 288Intensification 316 267Post–Green Revolution 504 601
Note: The figures in brackets [ ] indicate growth rate in the parameter value duringoverall study period.
ns = not significantly different from zero at 10 percent.Sources: Ali and Byerlee (forthcoming) and Murgai (forthcoming).
The World Bank Research Observer, vol. 16, no. 2 (Fall 2001)204
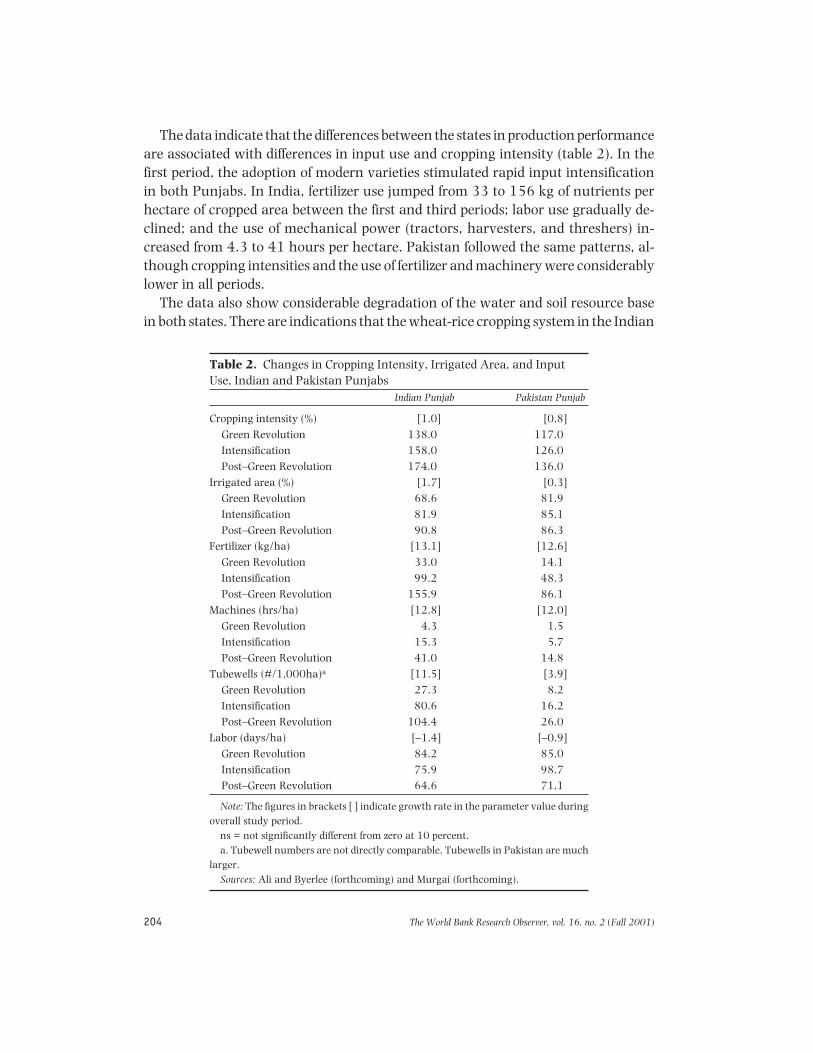
The data indicate that the differences between the states in production performanceare associated with differences in input use and cropping intensity (table 2). In thefirst period, the adoption of modern varieties stimulated rapid input intensificationin both Punjabs. In India, fertilizer use jumped from 33 to 156 kg of nutrients perhectare of cropped area between the first and third periods; labor use gradually de-clined; and the use of mechanical power (tractors, harvesters, and threshers) in-creased from 4.3 to 41 hours per hectare. Pakistan followed the same patterns, al-though cropping intensities and the use of fertilizer and machinery were considerablylower in all periods.
The data also show considerable degradation of the water and soil resource basein both states. There are indications that the wheat-rice cropping system in the Indian
Table 2. Changes in Cropping Intensity, Irrigated Area, and InputUse, Indian and Pakistan Punjabs
Indian Punjab Pakistan Punjab
Cropping intensity (%) [1.0] [0.8]Green Revolution 138.0 117.0Intensification 158.0 126.0Post–Green Revolution 174.0 136.0
Irrigated area (%) [1.7] [0.3]Green Revolution 68.6 81.9Intensification 81.9 85.1Post–Green Revolution 90.8 86.3
Fertilizer (kg/ha) [13.1] [12.6]Green Revolution 33.0 14.1Intensification 99.2 48.3Post–Green Revolution 155.9 86.1
Machines (hrs/ha) [12.8] [12.0]Green Revolution 4.3 1.5Intensification 15.3 5.7Post–Green Revolution 41.0 14.8
Tubewells (#/1,000ha)a [11.5] [3.9]Green Revolution 27.3 8.2Intensification 80.6 16.2Post–Green Revolution 104.4 26.0
Labor (days/ha) [–1.4] [–0.9]Green Revolution 84.2 85.0Intensification 75.9 98.7Post–Green Revolution 64.6 71.1
Note: The figures in brackets [ ] indicate growth rate in the parameter value duringoverall study period.
ns = not significantly different from zero at 10 percent.a. Tubewell numbers are not directly comparable. Tubewells in Pakistan are much
larger.Sources: Ali and Byerlee (forthcoming) and Murgai (forthcoming).
Rinku Murgai, Mubarik Ali, and Derek Byerlee 205
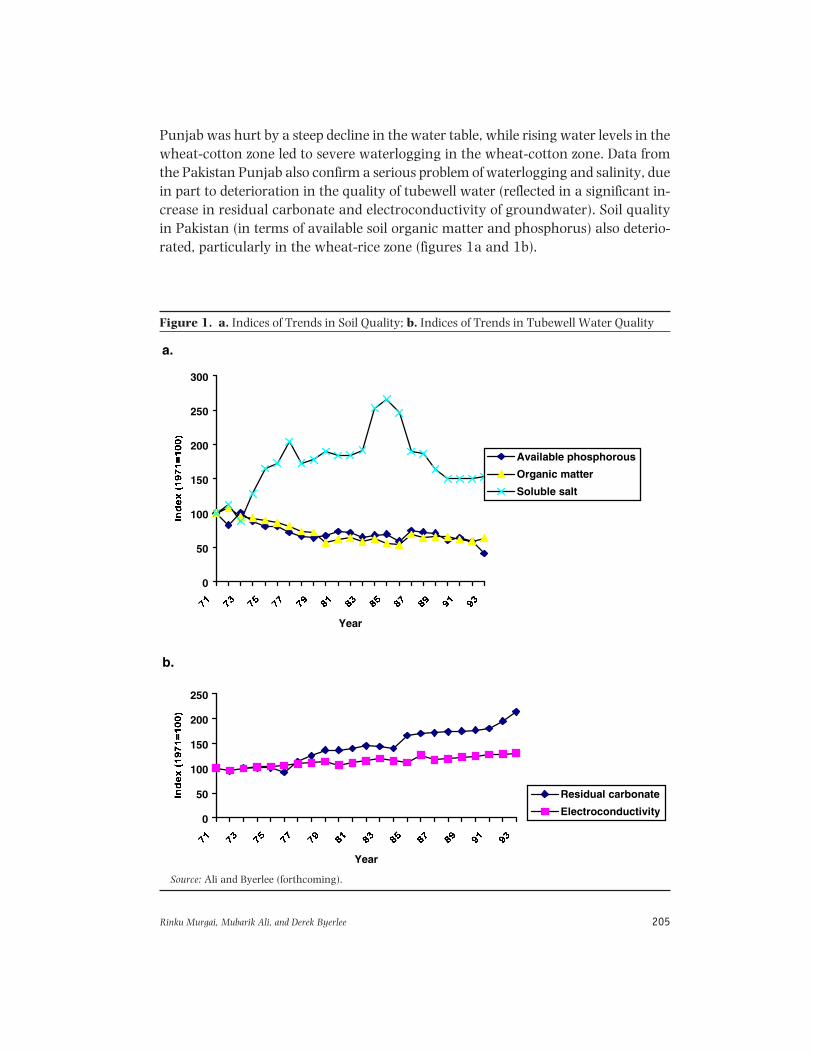
Punjab was hurt by a steep decline in the water table, while rising water levels in thewheat-cotton zone led to severe waterlogging in the wheat-cotton zone. Data fromthe Pakistan Punjab also confirm a serious problem of waterlogging and salinity, duein part to deterioration in the quality of tubewell water (reflected in a significant in-crease in residual carbonate and electroconductivity of groundwater). Soil qualityin Pakistan (in terms of available soil organic matter and phosphorus) also deterio-rated, particularly in the wheat-rice zone (figures 1a and 1b).
Source: Ali and Byerlee (forthcoming).
a.
0
50
100
150
200
250
300
Year
Available phosphorous
Organic matter
Soluble salt
b.
0
50
100
150
200
250
Year
Residual carbonate
Electroconductivity
Figure 1. a. Indices of Trends in Soil Quality; b. Indices of Trends in Tubewell Water Quality
The World Bank Research Observer, vol. 16, no. 2 (Fall 2001)206
Trend in TFP
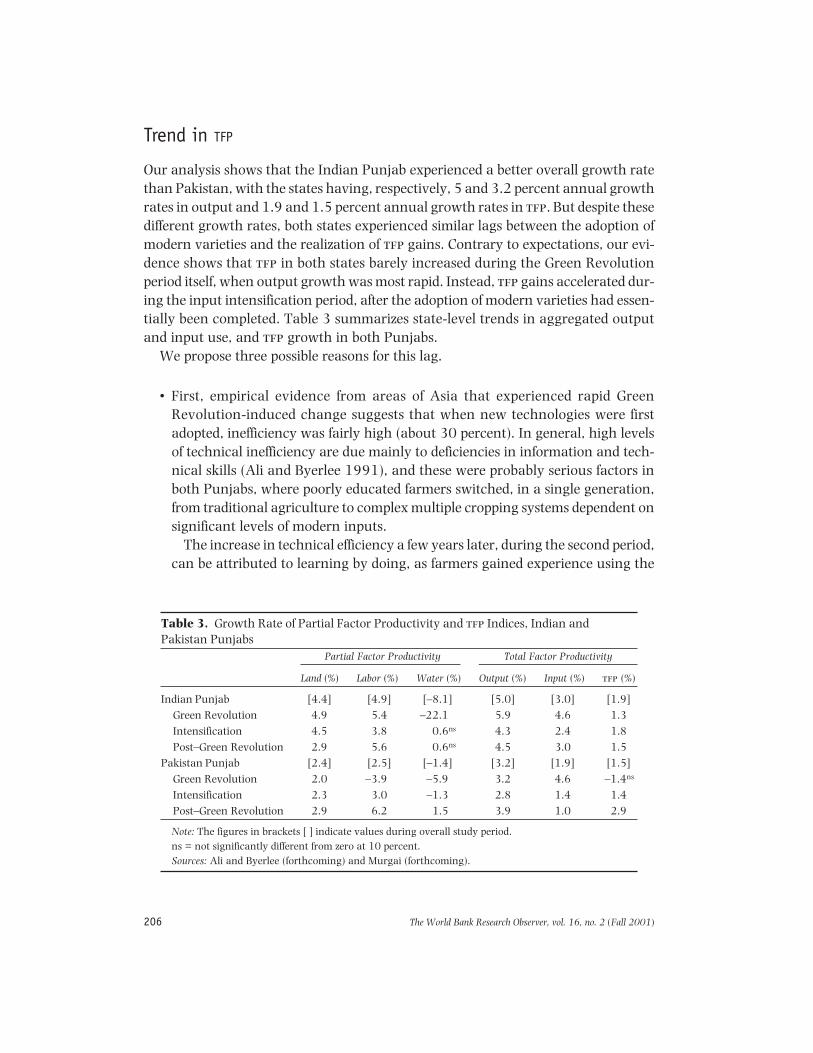
Our analysis shows that the Indian Punjab experienced a better overall growth ratethan Pakistan, with the states having, respectively, 5 and 3.2 percent annual growthrates in output and 1.9 and 1.5 percent annual growth rates in tfp. But despite thesedifferent growth rates, both states experienced similar lags between the adoption ofmodern varieties and the realization of tfp gains. Contrary to expectations, our evi-dence shows that tfp in both states barely increased during the Green Revolutionperiod itself, when output growth was most rapid. Instead, tfp gains accelerated dur-ing the input intensification period, after the adoption of modern varieties had essen-tially been completed. Table 3 summarizes state-level trends in aggregated outputand input use, and tfp growth in both Punjabs.
We propose three possible reasons for this lag.
• First, empirical evidence from areas of Asia that experienced rapid GreenRevolution-induced change suggests that when new technologies were firstadopted, inefficiency was fairly high (about 30 percent). In general, high levelsof technical inefficiency are due mainly to deficiencies in information and tech-nical skills (Ali and Byerlee 1991), and these were probably serious factors inboth Punjabs, where poorly educated farmers switched, in a single generation,from traditional agriculture to complex multiple cropping systems dependent onsignificant levels of modern inputs.
The increase in technical efficiency a few years later, during the second period,can be attributed to learning by doing, as farmers gained experience using the
Table 3. Growth Rate of Partial Factor Productivity and tfp Indices, Indian andPakistan Punjabs
Partial Factor Productivity Total Factor Productivity
Land (%) Labor (%) Water (%) Output (%) Input (%) tfp (%)
Indian Punjab [4.4] [4.9] [–8.1] [5.0] [3.0] [1.9]Green Revolution 4.9 5.4 –22.1 5.9 4.6 1.3Intensification 4.5 3.8 0.6ns 4.3 2.4 1.8Post–Green Revolution 2.9 5.6 0.6ns 4.5 3.0 1.5
Pakistan Punjab [2.4] [2.5] [–1.4] [3.2] [1.9] [1.5]Green Revolution 2.0 –3.9 –5.9 3.2 4.6 –1.4ns
Intensification 2.3 3.0 –1.3 2.8 1.4 1.4Post–Green Revolution 2.9 6.2 1.5 3.9 1.0 2.9
Note: The figures in brackets [ ] indicate values during overall study period.ns = not significantly different from zero at 10 percent.Sources: Ali and Byerlee (forthcoming) and Murgai (forthcoming).
Rinku Murgai, Mubarik Ali, and Derek Byerlee 207
new technologies; and also to an increase in human capital as education levelsrose in both states. Indeed, evidence from India suggests that Green Revolutiontechnological change directly increased the returns to education by spurringgreater private investment in schooling, particularly in states such as the Punjab(Foster and Rosenzweig 1996).
• A second reason for the lag in realizing tfp gains is that the introduction of mod-ern varieties was accompanied by significant capital investment by small farm-ers, particularly in tubewells, during the Green Revolution period. The tubewellsare likely to have been underutilized in the short run, until the newly createdcapacity could be exploited. Such underutilization of quasi-fixed inputs gener-ally leads to an underestimation of tfp gains during the period when investmentcosts are incurred, but tfp gains become observable as excess capacity is absorbed(Berndt and Fuss 1986).
• Third, low tfp growth during the Green Revolution relates in part to limitationsof the conventional method of productivity measurement when technical changeis biased toward saving one or more factors (Murgai forthcoming). When tech-nical change is biased in this sense, it is impossible to separate the contributionof technical change from that of factor accumulation, because part of the con-tribution of technical change is captured in changes in the factor shares used toaggregate inputs. In the case of land- and labor-saving technologies, conven-tional tfp calculations underestimate the contribution of technical change togrowth, particularly during the Green Revolution period.
In contrast to the first two periods, tfp growth slowed slightly in India—from 1.9to 1.5 percent—during the third period, while in Pakistan it rose sharply, to 2.9 per-cent, due partly to Pakistan’s gains in the livestock sector and partly to its large in-crease in cotton yields (from 267 kg/ha during intensification to 601 kg/ha duringthe post–Green Revolution period) and mungbean production. The strong perfor-mance of cotton and mungbean followed the introduction of modern varieties of bothcrops and a sharp increase in pesticide use, although the latter has proven techni-cally and environmentally unsustainable in recent years.
In India, by comparison, irrigated cotton was a much less important crop (Chan-mugam 1994; Kurosaki 1999). Until the reforms of 1994, quantity restrictions oncotton kept India’s domestic price below world prices, and nontariff barriers restrictedcotton imports (World Bank 1996). Varietal research for irrigated cotton in Indiaconsequently lagged, although rain-fed cotton has been very successful in the cen-tral part of the country. In addition, because of price policies favoring production forthe domestic market, the Indian Punjab produced only short-staple cotton for localconsumption, and the long-staple varieties produced by Pakistan for export werenever adapted to Indian conditions.
The World Bank Research Observer, vol. 16, no. 2 (Fall 2001)208
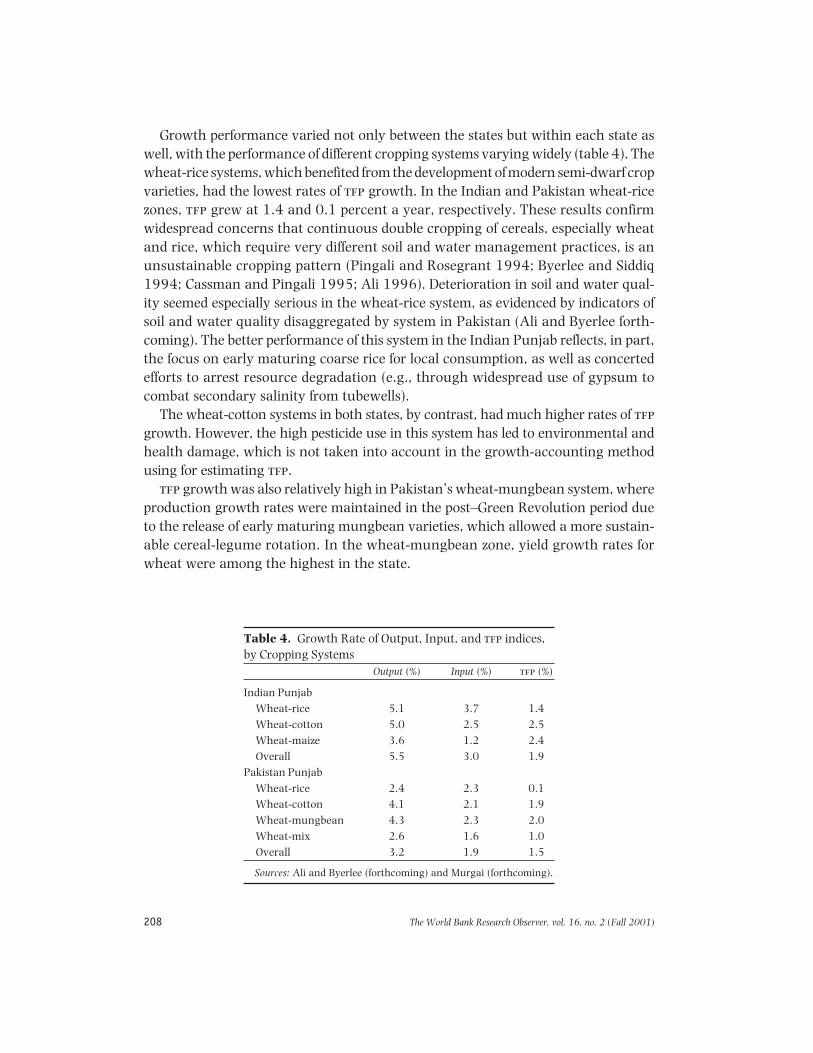
Growth performance varied not only between the states but within each state aswell, with the performance of different cropping systems varying widely (table 4). Thewheat-rice systems, which benefited from the development of modern semi-dwarf cropvarieties, had the lowest rates of tfp growth. In the Indian and Pakistan wheat-ricezones, tfp grew at 1.4 and 0.1 percent a year, respectively. These results confirmwidespread concerns that continuous double cropping of cereals, especially wheatand rice, which require very different soil and water management practices, is anunsustainable cropping pattern (Pingali and Rosegrant 1994; Byerlee and Siddiq1994; Cassman and Pingali 1995; Ali 1996). Deterioration in soil and water qual-ity seemed especially serious in the wheat-rice system, as evidenced by indicators ofsoil and water quality disaggregated by system in Pakistan (Ali and Byerlee forth-coming). The better performance of this system in the Indian Punjab reflects, in part,the focus on early maturing coarse rice for local consumption, as well as concertedefforts to arrest resource degradation (e.g., through widespread use of gypsum tocombat secondary salinity from tubewells).
The wheat-cotton systems in both states, by contrast, had much higher rates of tfp
growth. However, the high pesticide use in this system has led to environmental andhealth damage, which is not taken into account in the growth-accounting methodusing for estimating tfp.
tfp growth was also relatively high in Pakistan’s wheat-mungbean system, whereproduction growth rates were maintained in the post–Green Revolution period dueto the release of early maturing mungbean varieties, which allowed a more sustain-able cereal-legume rotation. In the wheat-mungbean zone, yield growth rates forwheat were among the highest in the state.
Table 4. Growth Rate of Output, Input, and tfp indices,by Cropping Systems
Output (%) Input (%) tfp (%)
Indian PunjabWheat-rice 5.1 3.7 1.4Wheat-cotton 5.0 2.5 2.5Wheat-maize 3.6 1.2 2.4Overall 5.5 3.0 1.9
Pakistan PunjabWheat-rice 2.4 2.3 0.1Wheat-cotton 4.1 2.1 1.9Wheat-mungbean 4.3 2.3 2.0Wheat-mix 2.6 1.6 1.0Overall 3.2 1.9 1.5
Sources: Ali and Byerlee (forthcoming) and Murgai (forthcoming).
Rinku Murgai, Mubarik Ali, and Derek Byerlee 209
Decomposition of Productivity Growth
Temporal and spatial differences in productivity growth, taken together, highlightthe potential roles of technological change, infrastructure and human capital, andresource degradation in determining tfp growth. Indeed, previous studies have re-lated tfp growth in the Indian and Pakistan agricultural sectors to technologicalchange (tied explicitly or implicitly to research investments), extension systems, in-frastructure investments, human capital endowments, and policy reform (Rosegrantand Evenson 1992; Kumar and Mruthyunjaya 1992; Fan and others 2000; Pingaliand Heisey 2001). However, there has, until now, been little effort to determine thequantitative impact of resource degradation on productivity growth.
Part of the problem has been the difficulty of agreeing on how to measure the im-pact of resource degradation on tfp. Some have argued that tfp measurement shouldincorporate changes in resource quality and externalities, such as water pollution(Herdt and Lynam 1992), while others measure tfp only with conventional inputsand consider resource stocks as a technical constraint that influences trends in tfp
(Squires 1992). We prefer the second approach, for three reasons. First, attempts toaccount for market failure and social costs, such as resource degradation, in estimatesof tfp violate the theoretical basis of those estimates (Byerlee and Murgai forthcom-ing). Second, it is difficult, in practice, to value changes in resource quality, evenwhere these changes can be physically quantified. Finally, in the medium term cov-ered by this article, farmers may not be able to observe resource degradation, andtherefore it is exogenous rather than endogenous to decisionmaking (see Policy Dis-cussion). Keeping these considerations in mind, we assess resource degradation con-cerns in detail by estimating a cost function for Pakistan that relates costs of produc-tion to human and physical infrastructure development, technological change, andresource quality.1 (As noted above, disaggregated data on resource quality for theIndian Punjab were not available.) We use the adult literacy rate to capture the ef-fect of changes in labor quality, and the inverse of the distance of a village from thenearest metal road to quantify the effect of improvement in physical infrastructure.The effect of technological change is proxied by two variables: (1) the proportion ofarea sown to modern wheat varieties, and (2) cropping intensity, which is a proxyfor adoption of modern summer crop varieties that shorten the growing period andthus allow for early planting of winter crops. The effect of resource degradation isestimated through measures of soil and water quality (phosphorus, organic matter,and soluble salts for soil or electroconductivity for water). Region-specific time-trenddummies are included to capture the remaining unspecified effects of technologicalchange, resource degradation, and change in resource productivity not included inthe function.
The coefficients estimated in the cost function are used to decompose productivitytrends into the effects of technological change, improvements in human resources
The World Bank Research Observer, vol. 16, no. 2 (Fall 2001)210
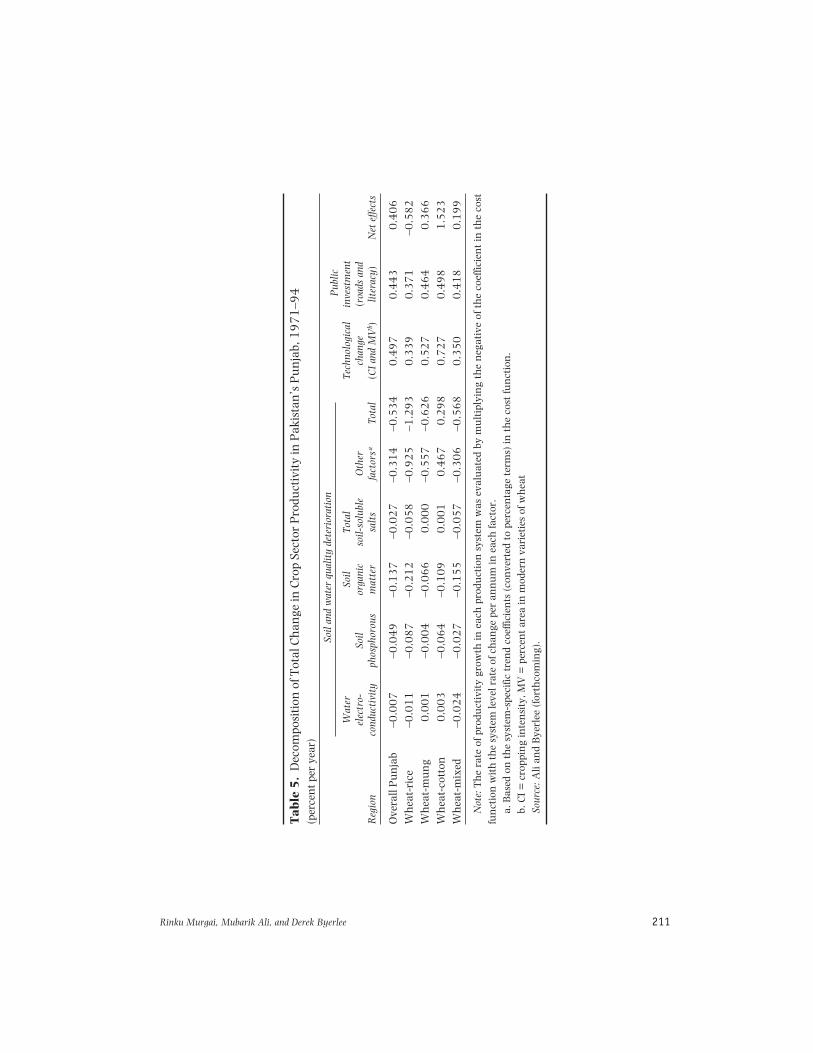
and infrastructure, and natural resource degradation. The decomposition was per-formed by multiplying the negative of the coefficient in the cost function by the sys-tem-level rate of change (in percent) per year for each variable included in the costfunction.
Based on this analysis, we found that, for the Pakistan Punjab, technological changeand improvements in human and physical infrastructure together produced an averagegrowth of 0.94 percent per year, with each accounting for about half the total—andthat resource degradation, in aggregate, lowered growth by 0.53 percent per year(table 5).2 The combined effect of technological change, improvements in human andphysical infrastructure, and resource degradation was negative in the wheat-ricesystem (i.e., there was an overall increase in unit cost), and the contribution of tech-nological change was highest in the wheat-cotton and wheat-mungbean systems.These results confirm the pattern found in the tfp estimates reported in the previoussections.
Soil and water degradation reduced productivity in all regions, highlighting theeffect of natural resource variables on productivity. In the wheat-rice system, resourcedegradation more than canceled the productivity-enhancing contributions of tech-nological change, education, and infrastructure. The unspecified “other factors”captured by coefficients on the regional time-trend variable also reduced productiv-ity quite strongly in all but the wheat-cotton system. These omitted variables includeresource degradation factors that were not measured, such as the development of pestcomplexes due to inappropriate use of pesticides and to monocropping of cereals. Moreresearch is needed to identify the management practices causing such a decline.Moreover, as massive public investment to control waterlogging and salinity is notincluded in the cost function, which relates only to private costs and returns, the ef-fect of these factors is probably underestimated.
Policy Discussion
Concerns about food security following the food crisis of the mid-1960s led the gov-ernments of India and Pakistan to concentrate resources in irrigated areas, such asthe Punjabs, which held promise for the greatest crop yield increases (Sims 1993).The subsequent gap in agricultural performance and in sources of growth betweenthe two states, despite quite similar agro-ecological potential, seems to relate to dif-ferences in nonprice policies toward agriculture, since price incentives, a major policyinstrument in both countries, were fairly similar.
At the core of the price policies was a strategy of massive subsidization of fertilizer,credit, power, and irrigation inputs. In India, subsidies on the four major inputs grewat 9 to 12 percent a year in real terms between 1981 and 1993, accounting for be-tween 2.2 and 2.7 percent of gross domestic product by the end of that period (Gulati
Rinku Murgai, Mubarik Ali, and Derek Byerlee 211
Tab
le 5
.D
ecom
posi
tion
of T
otal
Ch
ange
in C
rop
Sect
or P
rodu
ctiv
ity
in P
akis
tan
’s P
un
jab,
19
71
–94
(per
cen
t pe
r ye
ar)
Soil
and
wat
er q
ualit
y de
teri
orat
ion
Pub
licW
ater
Soil
Tota
lTe
chno
logi
cal
inve
stm
ent
elec
tro-
Soil
orga
nic
soil-
solu
ble
Oth
erch
ange
(roa
ds a
ndR
egio
nco
nduc
tivi
typh
osph
orou
sm
atte
rsa
lts
fact
orsa
Tota
l(C
I an
d M
Vb )
liter
acy)
Net
effe
cts
Ove
rall
Pu
nja
b–0
.00
7–0
.04
9–0
.13
7–0
.02
7–0
.31
4–0
.53
40
.49
70
.44
30
.40
6W
hea
t-ri
ce–0
.01
1–0
.08
7–0
.21
2–0
.05
8–0
.92
5–1
.29
30
.33
90
.37
1–0
.58
2W
hea
t-m
un
g0
.00
1–0
.00
4–0
.06
60
.00
0–0
.55
7–0
.62
60
.52
70
.46
40
.36
6W
hea
t-co
tton
0.0
03
–0.0
64
–0.1
09
0.0
01
0.4
67
0.2
98
0.7
27
0.4
98
1.5
23
Wh
eat-
mix
ed–0
.02
4–0
.02
7–0
.15
5–0
.05
7–0
.30
6–0
.56
80
.35
00
.41
80
.19
9
Not
e: T
he
rate
of p
rodu
ctiv
ity
grow
th in
eac
h p
rodu
ctio
n s
yste
m w
as e
valu
ated
by
mu
ltip
lyin
g th
e n
egat
ive
of t
he
coef
ficie
nt
in t
he
cost
fun
ctio
n w
ith
th
e sy
stem
leve
l rat
e of
ch
ange
per
an
nu
m in
eac
h fa
ctor
.a.
Bas
ed o
n t
he
syst
em-s
peci
fic t
ren
d co
effic
ien
ts (
con
vert
ed t
o pe
rcen
tage
ter
ms)
in t
he
cost
fun
ctio
n.
b. C
I =
cro
ppin
g in
ten
sity
, MV
= p
erce
nt
area
in m
oder
n v
arie
ties
of w
hea
tSo
urce
: Ali
and
Bye
rlee
(fo
rth
com
ing)
.
The World Bank Research Observer, vol. 16, no. 2 (Fall 2001)212
and Sharma 1995). Subsidies were also an important element of public spending inPakistan, but with a stronger bias toward large farmers (Sims 1986, 1993). Inputssubsidies in both countries were maintained well beyond an initial period when theymight have been economically justified to overcome farmers’ risk aversion and tosupport learning by doing. This was because once established, they were politicallydifficult to remove. In the Indian Punjab, where small and medium farmers whodominate the electorate were major beneficiaries, the subsidies became even moreentrenched than in Pakistan.
At the same time, however, output prices on basic food grains were taxed to main-tain low food prices. These controls on food marketing kept grain prices below worldprices—a problem compounded by overvalued exchange rates and tariff protectionof the nonagricultural sector in both states. Thus, despite the high subsidies, therewas a large net transfer of resources out of agriculture. Effective protection rates forfood grains over much of this period averaged between –33 and –50 percent (Faruqee1995; Gulati and Kelley 1999).
In any case, similar pricing strategies in the two states, along with empirical evi-dence on agricultural supply response and input elasticities from the Asian context,suggest that the differential performance between the states is more likely the resultof nonprice factors. This view is supported by other studies showing that investmentsin rural infrastructure, human capital, and research and extension play a dominantrole in influencing supply and productivity growth (Binswanger and others 1993;Fan and others 1999; Rao 1989).
Based on comparisons of public expenditures in agriculture in the two states andon the importance to growth of education and infrastructure, as evident from the costfunction analysis, India would be expected to have more rapid input use and produc-tivity growth than Pakistan, where the share of public resources allocated to agri-culture was lower (Choudhry and Faruqee 1995). Indeed, India did have more rapidproductivity growth, due to massive public investment in rural infrastructure, humancapital, and research and extension, and to the subsequent better quality of thosefactors. India’s greater investment in rural infrastructure meant, in particular, thatby the mid-1980s, all rural villages in the Indian Punjab were electrified, the densityof the road network was well above that of the Pakistan Punjab, and more than 90percent of the cropped area was irrigated (Fan and others 1999). In Pakistan, bycomparison, investment in education and rural infrastructure was much lower(Mujahid-Mukhtar 1991; Rosegrant and Evenson 1992; Faruqee 1995). India alsohad a relatively better developed network of agricultural research centers and uni-versities, especially in the northwest (Mruthyunjaya and Ranjitha 1998).
Given the relative importance, however, of nonprice incentives for growth, thetrend of expanding subsidies at the expense of productivity-enhancing investmentsraises concerns about the sustainability of growth over the long term if current price-based policies continue (Fan and others 1999). In Pakistan, the total share of public
Rinku Murgai, Mubarik Ali, and Derek Byerlee 213
resources allocated to agriculture has been declining, and irrigation-related expen-ditures have been particularly impaired, with a 4 percent annual rate of decrease(Ahmad and Kutcher 1992). In particular, continuous underinvestment in opera-tional and management costs has seriously reduced the efficiency of the irrigationsystem (Chaudhry and Ali 1989), resulting in such problems as regular breaches,excessive seepage, and limited water supplies for the tail reaches of distributaries.Research spending also fell in real terms in the 1990s and accounts for a falling shareof the agriculture budget (Choudhry and Faruqee 1995). Across the border in India,even though the share of public resources devoted to agriculture has risen steadilysince the early 1980s, subsidies to agriculture have increased three times faster thanother expenditures (World Bank 1996).
Apart from crowding out productivity-enhancing expenditures, input subsidieshave also been a major cause of overcapitalization, inefficient use of inputs, and ashift in cropping patterns toward water- and fertilizer-intensive crops, thus contrib-uting, in India, to soil degradation, salinity problems, and overexploitation of ground-water (Joshi and Tyagi 1994; Vaidyanathan 2000). In Pakistan, the subsidy on canalwater prices has led to inefficient use of water and has contributed to the waterloggingand salinity problem (Ahmad and Kutcher 1992). In addition, the flat rate structureof water and electricity prices, together with a subsidy on tubewell drilling withoutregulation of the number of tubewells, has distorted the efficient use of water (Johnson1989). Resource degradation is not, in itself, a reason for policy intervention if it isinternalized in producer decisionmaking. In this case, however, distorted policies haveled private and social costs to diverge.
Removal of price distortions in the form of input subsidies would be a major steptoward arresting resource degradation and encouraging more sustainable systems.It would also encourage higher productivity growth by freeing resources for high-priority public investments in rural infrastructure, education, and research and ex-tension. Since the early to mid-1990s, both Pakistan and India have initiated stepsto reduce price distortions in the agricultural sector, but these efforts have not yetbeen accompanied by an increase in public investments in agriculture.3
Arresting resource degradation will also require a concerted effort on several otherfronts. First, the shortage of public investment funds has led to considerable under-investment in establishing new drainage systems, which are central to resolving thewaterlogging and salinity problems. It may be argued that irrigation is a private goodand should gradually be handed over to private markets, but drainage is a public goodand will remain so, at least beyond the farmfield—and it is beyond the farmfield thatmost drainage investments are needed (World Bank 1994). New institutional struc-tures for irrigation are now being piloted in Pakistan; these approaches include thedevolution of water management to farmers’ organizations, and the establishmentof public utilities to operate and price water further up the system (Bandaragoda andFirdousi 1992). These measures, too, may help resolve resource degradation problems.
The World Bank Research Observer, vol. 16, no. 2 (Fall 2001)214
Second, halting resource degradation will require that research systems, whichhave been oriented toward developing technologies based on packages of moderninputs, place more emphasis on input-efficient and environmentally friendly prac-tices. This will require considerable location-specific research on such themes as in-tegrated pest and nutrient management and cropping systems. It will also requirediversifying rotations to include legumes and the use of conservation tillage. Manysuch practices are information intensive and will require much greater informationdissemination and extension efforts. Research systems in both states have shifteddirection toward these new priorities in the 1990s.
Finally, a large number of institutions in the two Punjabs have overlapping man-dates to address soil and water management problems in irrigated agriculture, and theirefforts are poorly coordinated. In the Pakistan Punjab alone, for example, nearly a dozeninstitutions are working on salinity problems. Information about land and water prob-lems is also institutionally dispersed, as is policymaking (John Mellor Associates andAsianics Agro-Develoment International 1994). It is important, therefore, to establisha central agency in each Punjab to regularly provide farmers and policymakers withcurrent information on the status of land and water resources in irrigated areas.
Conclusion
In examining the critical issue of long-term productivity and sustainability of irri-gated agriculture in the Indian and Pakistan Punjabs, this study confirms previousfindings that India experienced much higher and more rapid growth of yields for foodcrops. However, the results suggest that most of India’s higher growth was due tothe more rapid growth of inputs. Though overall productivity growth in the IndianPunjab was higher, it was not by a large margin.
The gap in input use and agricultural performance between the two states, despitequite similar agro-ecological potential, seems to relate to differences in nonprice poli-cies that encouraged much faster growth of input use in India than in Pakistan. Butwhile investment (both public and private) plays a central role in productivity growth,there was, in both Punjabs, a considerable lag between investment in infrastructureand Green Revolution inputs and the realization of productivity growth. This seems torelate in part to learning by doing and investment in human capital, which take timeto produce improvements in technical efficiency; and in part to the better utilization oflumpy capital investments over time, especially tubewell capacity. For policymakers,this lag suggests that a long-term commitment is needed to realize complementaritiesbetween investment in technologies and supporting infrastructure.
The results of this study also raise serious concerns about the long-term sustainabilityof intensive irrigated Green Revolution systems due to resource degradation. For Paki-stan, this study provides the first quantitative evidence of the impact of resource deg-
Rinku Murgai, Mubarik Ali, and Derek Byerlee 215
radation, which is estimated to reduce productivity growth by one-third overall, andin the case of wheat-rice, to practically cancel the effect of technological change. Theseresults, combined with the stagnation of cereal output in recent years, highlight theurgent need for measures that will arrest the problem of resource degradation andmaintain the Punjabs’ most valuable assets—their irrigated land base.
Notes
Rinku Murgai is an economist in the Development Economics Research Group of the World Bank; MubarikAli is an agricultural economist at the Asian Vegetable Research and Development Center; and DerekByerlee is a lead economist in the Rural Development Department of the World Bank. Rinku Murgai canbe reached via e-mail at [email protected], Derek Byerlee at [email protected], andMubarik Ali at [email protected].
This study summarizes the results of a study sponsored by the World Bank, “Total Factor Produc-tivity Growth in Post–Green Revolution Agriculture of Pakistan and Northwest India.” More detaileddiscussions of the India and Pakistan results can be found in Murgai (1997) and Ali and Byerlee (forth-coming), respectively. The authors thank the Research Support Board for funding and two anonymousreviewers for valuable comments.
1. We selected the dual (cost function) approach over the primal (production function) approachfor econometrically decomposing productivity growth, because the former has a number of advantages(Alston and others 1995). The use of factor prices, rather than their quantities, as explanatory vari-ables avoids problems of simultaneity that arise when input choices are endogenous with output. Fac-tor prices are more likely to be behaviorally exogenous to a producer. In addition, the dual approachallows estimation of a system of equations comprising the cost function and the system of factor shareequations, which results in greater efficiency.
2. Total annual productivity growth estimated through the econometric analysis is 0.41 percentfor 1971–94, lower than the 1.30 percent estimated through the index number approach for the cor-responding period, but with the same ranking by production system. There are several possible rea-sons for the difference in productivity growth obtained using the index number and econometric ap-proaches: (a) the tfp growth rate (primal) is computed with input levels held constant, whereas thecost function rate (dual) is computed with input level adjusted optimally to technological change (Antleand McGuckin 1993); (b) the productivity measure obtained from the cost function is net of factor sub-stitution, whereas the index number estimate includes the substitution effect (Ray 1982); and (c) notall the variables related to technological change could be included in the cost function, which there-fore might have underestimated technological progress.
3. Pakistan has eliminated its fertilizer subsidy, and India has removed credit subsidies but has yetto eliminate fertilizer subsidies. In India, as part of a broader liberalization program that started in 1991,the irrigation subsidy has also been marginally reduced, but at the expense of the quality and reliabil-ity of water delivery. Efforts to reduce the subsidy on rural power have been unsuccessful; in fact, thesubsidy has increased by 14 percent a year in real terms between 1991 and 1995 (World Bank 1996).Output markets for the main crops have also been liberalized in both countries, leading to an increasein the prices of rice and cotton in India, and of food grains in Pakistan.
References
The world “processed” describes informally reproduced works that may not be commonly availablethrough library systems.
The World Bank Research Observer, vol. 16, no. 2 (Fall 2001)216
Ahmad, M., and G. P. Kutcher. 1992. “Irrigation Planning with Environmental Considerations: A CaseStudy of Pakistan’s Indus Basin.” Technical Paper 166. World Bank, Washington, D.C. Processed.
Ali, M. 1996. “Quantifying the Socioeconomic Determinants of Sustainable Crop Production: An Ap-plication to Wheat Cultivation in the Tarai of Nepal.” Agricultural Economics 14:45–60.
Ali, M., and D. Byerlee. 1991. “Economic Efficiency of Small Farmers in a Changing World: A Surveyof Recent Evidence.” Journal of International Development 3(1):1–27.
———. Forthcoming. “Productivity Growth and Resource Degradation in Pakistan’s Punjab: A De-composition Analysis.” Economics Development and Cultural Change
Ali, M., and L. E. Velasco. 1994. “Intensification-Induced Resource Degradation: The Crop Produc-tion Sector in Pakistan.” Working Paper 94-14. International Rice Research Institute, Manila.Processed.
Alston, J. M., G. W. Norton, and P.G. Pardey. 1995. Science under Scarcity: Principles and practice forAgricultural Research Evaluation and Priority Setting. Ithaca, N.Y. and London: Cornell UniversityPress.
Antle, J. M., and T. McGuckin. 1993. “Technological Innovation, Agricultural Productivity, and En-vironmental Quality.” In G. A. Carlson, D. Zilberman, and J. A. Miranowski, eds., Agricultural andEnvironmental Resource Economics. New York: Oxford University Press.
Azam, Q. T., E. A. Bloom, and R. E. Evenson. 1991. “Agricultural Research Productivity in Pakistan.”Islamabad: Pakistan Agricultural Research Council and New Haven, Conn.: Yale University Press.
Bandaragoda, D. J., and G. R. Firdousi. 1992. “Institutional Factors Affecting Irrigation Performancein Pakistan: Research and Policy Priorities.” International Irrigation Management Institute, Co-lombo, Sri Lanka.
Berndt, E. R., and M. A. Fuss. 1986. “Productivity Measurement with Adjustments for Variation inCapacity Utilization and Other Forms of Temporary Equilibrium.” Journal of Econometrics 33:7–29.
Binswanger, H. P., S. R. Khandker, and M. R. Rosenzweig. 1993. “How Infrastructure and FinancialInstitutions Affect Agricultural Output and Investment in India.” Journal of Development Economics31:337–66.
Byerlee, D. 1992. “Technical Change, Productivity, and Sustainability in Irrigated Cropping Systemsof South Asia: Emerging Issues in the Post–Green Revolution Era.” Journal of International Develop-ment 4:477–96.
Byerlee, D., and A. Siddiq. 1994. “Has the Green Revolution Been Sustained? The Quantitative Im-pacts of the Seed-Fertilizer Technology in Pakistan Revisited.” World Development 22(9):1345–61.
Byerlee, D., and R. Murgai. Forthcoming. “Sense and Sustainability Revisited: The Limits of Total Fac-tor Productivity Measures of System Sustainability.” Agricultural Economics.
Cassman, K. G., and P. L. Pingali. 1995. “Extrapolating Trends from Long-Term Experiments to Farm-ers Fields: The Case of Irrigated Rice Systems in Asia.” In V. Barnett, R. Payne, and R. Steiner, eds.,Agricultural Sustainability: Economic, Environmental and Statistical Considerations. New York: JohnWiley and Sons.
Chanmugam, N. 1994. “Factors Influencing the Gap in Crop Productivity between the Indian andPakistani Punjabs.” M.S. thesis, Cornell University, Ithaca, N.Y.
Chaudhry, A. M., and M. Ali. 1989. Measuring Benefits to Operation and Maintenance Expenditure inthe Canal Irrigation System of Pakistan: A Simulation Analysis.” Agricultural Economics 3:199–212.
Choudhry, Y., and R. Faruqee. 1995. “Pakistan: Public Expenditure in Agriculture.” Report IDP-153.World Bank, Washington, D.C.
Diewert, W. E. 1976. “Exact and Superlative Index Numbers.” Journal of Econometrics 4:115–46.
Evenson, R. E., C. E. Pray, and M. W. Rosegrant. 1999. Agricultural Research and Productivity Growth inIndia. Research Report 109. International Food Policy Research Institute, Washington, D.C.
Rinku Murgai, Mubarik Ali, and Derek Byerlee 217
Fan, S., P. Hazell, and S. Thorat. 1999. Government Spending, Growth and Poverty: An Analysis of Inter-linkages in Rural India. Research Report 110. International Food Policy Research Institute, Wash-ington, D.C.
———. 2000. “Government Spending, Growth and Poverty in Rural India.” American Journal of Agri-cultural Economics 82(4): 1038–1051.
Faruqee, R. 1995. “Structural and Policy Reforms for Agricultural Growth: The Case of Pakistan.” Agri-cultural and Natural Resources Division, South Asia Department World Bank, Washington, D.C.
Foster, A. D., and M. R. Rosenzweig. 1996. “Technical Change and Human-Capital Returns and In-vestments: Evidence from the Green Revolution.” American Economic Review 86(4):931–53.
Fujisaka, S., L. Harrington, and P. Hobbs. 1994. “Rice-Wheat in South Asia: Systems and Long-TermPriorities Established through Diagnostic Research.” Agricultural Systems 46:169–87.
Gulati, A., and A. Sharma. 1995. “Subsidy Syndrome in Indian Agriculture.” Economic and PoliticalWeekly 30(39):A93–A102.
Gulati, A., and T. Kelley, 1999. Trade Liberalization and Indian Agriculture. New Delhi: Oxford Univer-sity Press.
Herdt, R. W., and J. K. Lynam. 1992. “Sustainable Development and the Changing Needs of InternationalAgricultural Research.” In D. R. Lee, S. Kearl, and N. Uphoff, eds., Assessing the Importance of Interna-tional Agricultural Research for Sustainable Development. Ithaca, N.Y.: Cornell University Press.
John Mellor Associates and Asianics Agro-Development International. 1994. Institutional Reforms toAccelerate Irrigated Agriculture. Government of Pakistan and World Bank, Washington, D.C.
Johnson, R. 1989. “Private Tubewell Development in Pakistan’s Punjab: Review of Past Public Pro-grams: Policies and Relevant Research.” International Irrigation Management Institute, Colombo,Sri Lanka.
Joshi, P. K., and N. K. Tyagi. 1994. “Salt-Affected and Waterlogged Soils in India: A Review.” JointStudy of the Indian Council of Agricultural Research, New Delhi and the International Food PolicyResearch Institute, Washington, D.C.
Kaur, P. 1991. Returns to Investment on Agricultural Research and Extension. Ph.D. thesis, Punjab Agri-cultural University, Ludhiana.
Khan, M. H. 1994. “The Structural Adjustment Process and Agricultural Change in Pakistan in the1980s and 1990s.” Simon Fraser University, Vancouver. Processed.
Kumar, P., and M. Rosegrant. 1994. “Productivity and Sources of Growth for Rice in India.” Economicand Political Weekly 29(53):183–88.
Kumar, P., and Mruthyunjaya. 1992. “Measurement Analysis of Total Factor Productivity Growth inWheat.” Indian Journal of Agricultural Economics 47(3): 451–58.
Kurosaki, T. 1999. “Agriculture in India and Pakistan, 1900–95: Productivity and Crop Mix.” Eco-nomic and Political Weekly (December):A160–A168.
Mruthyunjaya, and P. Ranjitha. 1998. “The Indian Agricultural Research System: Structure, CurrentPolicy Issues and Future Orientation.” World Development 26:1089–102.
Mujahid-Mukhtar, E. 1991. “The History of Agricultural Development and the Role of Policy: A Com-parison of the Two Punjabs (1849–1981).” Indian Economic Journal 38:39–61.
Murgai, R. 1997. “Diversity in Economic Growth and Technical Change: A Districtwise Disaggrega-tion of the Punjab and Haryana Growth Experience.” Ph.D. diss., University of California, Berkeley.
———. Forthcoming. “The Green Revolution and the Productivity Paradox: Evidence from the IndianPunjab.” Agricultural Economics.
Pingali, P. L., and M. W. Rosegrant. 1994. “Confronting the Environmental Consequences of the GreenRevolution in Asia.” Discussion Paper 2, Environment and Production Technology Division, Inter-national Food Policy Research Institute, Washington, D.C.
The World Bank Research Observer, vol. 16, no. 2 (Fall 2001)218
Pingali, P.L. and P. W. Heisey. 2001. “Cereal Crop Productivity in Developing Countries: Past Trendsand Future Prospects.” In J. M. Alston, P. G. Pardey, and M. J. Taylor, eds., Agricultural Science Policy:Changing Global Agendas. Baltimore: Johns Hopkins University Press, 56–84.
Rao, M. R. 1989. “Agricultural Supply Response: A Survey.” Agricultural Economics 3:1–22.
Ray, S. C. 1982. “A Translog Cost Function Analysis of U.S. Agriculture.” American Journal of Agricul-tural Economics 64:490–98.
Rosegrant, M. W., and R. E. Evenson. 1992. “Agricultural Productivity and Sources of Growth in SouthAsia,” American Journal of Agricultural Economics 74(3):757–61.
Siddiq, A. 1994. “Sustainability of the Indus Basin: Impact of Tertiary Salinity/Sodicity on Wheat Pro-ductivity, Damage Assessment and Future Public Policy.” Ph.D. diss., Department of AgriculturalEconomics, University of Illinois, Urbana-Champaign.
Sidhu, D. S. and D. Byerlee. 1991. “Technical Change and Wheat Productivity in Post–Green Revolu-tion Punjab.” Economic and Political Weekly 26(52):A159–A166.
Sims, H. 1986. “The State and Agricultural Productivity: Continuity versus Change in the Indian andPakistan Punjabs.” Asian Survey 26(4):483–500.
———. 1993. “Economic Imperatives, Political Risks and Modes of Action: Agricultural Policy Imple-mentation in India and Pakistan.” Journal of Developing Areas 27:145–62.
Squires, D. E. 1992. “Productivity Measurement in Common Property Resource Industries: An Appli-cation to the Specific Coast Trawl Fisheries.” rand Journal of Economics 23(2):221–36.
Vaidyanathan, A. 2000. “India’s Agricultural Development Policy.” Economic and Political Weekly35(20):1735–41.
World Bank. 1994. Pakistan Irrigation and Drainage: Issues and Options. Report 11884-PAK. World Bank,Washington, D.C.
———. 1996. India Country Economic Memorandum—Five Years of Stabilization and Reform: The Chal-lenges Ahead. Report 15882-IN. World Bank, Washington, D.C.