Embed Size (px)
Citation preview
Figure 12--Total green weight of all products was found by weighing all trucks on portable scales.
Production measurements--Production of the harvesting and processing system was measured in units of green weight (tons). Weight units are preferred to other units such as cords, board feet, or even cubic feet for biomass measurements be- cause all forms and parts of the tree can be consistently accounted for by weight. Very small trees cannot be measured by existing board-foot rules, and no other measurement adequately tracks limbs and tops. Also, many wood-handling systems are limited in how much weight they can lift, and equipment designers and operators can be more effective when they know how much actual weight is to be handled. Weight units can readily be converted to other units of measure when needed to aid communication. If desired, green weight may be adjusted for moisture content to reflect wood weight at a different moisture content, such as bone-dry units.
For this study, all products being taken from the processing site at the landing were weighed on portable truck scales (fig. 12). Each truck was weighed, both loaded and unloaded, so that the product net weight could be determined. The portable-scale results were corroborated with mill scales where the products were delivered. The net weights of each product were summed to give the individual production of logs, chips, and hogged fuel. The weights of all products were then summed to give the aggregated production (multiple-product yield) from the study blocks. Because the landing was cleared before and after each study period, the assumption was made that the total product weight 4 was equivalent to the weight of all trees handled by the feller-buncher and subsequently by the forwarder and also the mobile loader. Simi- larly, the weight of all chips was the production of the chipper and the debarker- delimber. The total hogged-fuel weight was the production of the shredder, and the production of saw logs was equal to the weight of the logs that were hauled out on log trucks.
4 Moisture loss was assumed to be negligible during the har- vesting and processing activities. Moisture is lost, however, because trees continue to transpire moisture when felled and left on the ground with their crowns intact. Moisture also evaporates during the chipping and shredding operations (as witnessed in visible evaporation from warm chips in freshly loaded vans). The extent of moisture loss from these sources is unknown.
13

Cost and Machine Rate Determinations
The cost of harvesting and processing these small-diameter trees was an important part of the study because the economics of stand conversion by using the central processing system and multiple-product marketing affects how and where the system may be applied.
A machine rate was calculated for each piece of equipment. The machine rate is defined as the hourly cost of ownership and operation for a machine or process, including investment amortization, consumables, and labor costs. The machine rate is based on a productive hour. This takes machine reliability (availability) and usage rate (ratio of productive time to scheduled time) into account. Costs of ownership (Mifflin 1980) were calculated for each piece of equipment, based on factors such as original investment, interest rates, salvage value, depreciation period, taxes, and insurance. Similarly, operating costs, including fuel and oil consumed plus labor and supervision expenses, were also calculated for each piece of equipment.
Productive costs of each machine were calculated by dividing machine rates by the corresponding production rates. Total productive costs of owning and operating the harvesting system were calculated by summing the productive costs of the two machines of that system. For the harvesting system, however, the productive costs of the individual machines are not additive because each machine processes a different percentage of woody materials; therefore, the productive cost of the processing sys- tem was calculated by summing the products of the productive cost of each machine and the quantity of materials handled by that machine, and then dividing that sum by the total weight of all woody products delivered. This is equivalent to dividing the total cost of all operations by the total weight of all products from the system.
The following computation methods and equations were used to calculate the values needed to satisfy the objectives of this study:
Production rates for each harvesting and processing operation were calculated by dividing the total production of each operation by the total productive time spent to do that operation during the study.
Machine rates for each piece of equipment were calculated with the equations below.
The productive-time ratio of each machine was calculated by dividing the produc- tive time of each machine by the scheduled time for that machine.
Machine availability was calculated from the equation below to quantify the reliabil- ity of the equipment during this study.
The productive cost for the total harvesting and processing system was calculated by dividing the total cost of all operations by the total weight of all products loaded onto trucks or vans for delivery to market.
14

Results and Discussion
Equipment Development
Computation equations follow:
Productive time (p-hr) = scheduled time - (idle, delay, and down times)
Productive time ratio (%) = productive time x 100 scheduled time
Machine availability (%) = (scheduled time - down time) x 100 scheduled time
Production rate (tons/p-hr)
tons of material processed productive time
Ownership cost ($/s-hr) = total annual ownership costs scheduled hours per year
Operating cost ($/p-hr) = hourly crew wages x (1 + supervision rate) + productive time ratio / 100
hourly fuel cost + hourly oil cost
Machine rate ($/p-hr) (hourly ownership cost) + hourly operating cost (productive time ratio)
Productive cost (S/ton) = (machine rate) = (total cost for job) (production rate) (total production)
System cost ($) = sum of (productive cost x production) for all equipment and personnel used in the system
System productive cost = system cost (S/ton) total tons of product
Several new pieces of equipment were designed and constructed to complete the prototype harvesting and processing system. In fact, four of the major components of the system were operated as first-of-their-kind prototypes. They are as follows:
1. Steep-slope feller-buncher 2. Multiple-stem debarker-delimber 3. Shredder 4. Conveyor-magnet system
The FB-1 steep-slope feller-buncher wa(. delivered to the study site by the manufac- turer about 6 months before the study fo: operator training and initial trials of the machine. When the study began, the operator seemed to be proficient, and the machine was functioning with a high degree of reliability.
15

Stand Inventory
Products
A prototype debarker-delimber for multiple stems (designed and built by Hermann Bros.) was used during the study. This machine uses chain-flails to remove bark and limbs. Chains were mounted on twin vertical shafts. The debarker-delimber had no built-in feed system. Feeding was accomplished by the mobile loader in conjunction with the grapple of the chipper. The mobile loader passed trees through the chain- flails until they exited the debarker-delimber within reach of the chippers grapple, which grasped the cleaned stems and fed them directly into the chippers feedworks.
The biomass shredder was also designed and fabricated by Hermann Brothers. It was put into service on the study area about 3 months before the study.
The magnet and its collecting bin were built and added to the processing system at the beginning of the processing study on block A. The debris conveyor system was introduced to the processing system a few days before the beginning of the study on block B. This support equipment was also designed and fabricated by the Hermann Brothers from commercially available components. The processing system was moved onto the prepared landing and was ready for production in about 2 hours. Each landing was about one third of an acre and was adjacent to a lower corner of a study block. Materials from about 40 acres of doghair stands were handled on each landing.
Table 2 lists the population of trees on each study block by diameter class. About half of the trees on each block were dead. The living trees were comprised of west- ern hemlock (33 percent), Douglas-fir (28 percent), redcedar (22 percent), true fir (16 percent), and alder (1 percent). About 78 percent of the trees on block A and 85 percent of the trees on block B had diameters of 6 inches or less. The stand inventory showed that block A contained 1,642 stems per acre and block B contained 2,283 trees per acre. A statistical analysis showed the standard error of the mean to be 151.8 trees per acre (9.3 percent) on bl~ck A and 200.7 trees per acre (8.8 per- cent) on block B. The mean stand diameter for all trees on both blocks was 4.1 inches. The canopy was closed with a typical live tree height of about 95 feet. This stand characterization is given to help compare doghair stands to stands in other areas.
During the study, most of the smaller, dead trees were not delivered to the process- ing site. Because of the extent of decay, they usually broke into short pieces during the felling process. Adjusting the stand exam for this situation by excluding dead trees under 4 inches, the estimated number of trees processed from block A was 896 per acre and 1,241 trees per acre from block B.
All trees taken from the study blocks were transported to the sorting and processing site at the landing. Materials were not allowed to accumulate at the landing. Depend- ing on their size and quality, the trees wer~ processed into three different products: saw logs, pulp quality chips, or hogged fuel (table 3).
16

Table 2--Number of stems per acre by diameter class for study blocks A and B
B l o c k A B l o c k B
D i a m e t e r
c l ass L i ve D e a d To ta l L i ve D e a d To ta l
I nches . . . . . . . N u m b e r o f s t ems p e r acre . . . . . . .
1 25 "271 2 9 6 104 * 6 5 4 758
2 3 8 * 3 0 4 3 4 2 167 * 2 8 8 4 5 5
3 62 "171 233 179 " 1 0 0 279
4 121 50 171 129 5 4 183
5 9 6 25 121 100 25 125
6 121 4 125 125 12 137
7 42 m 42 5 8 - - 58
8 71 - - 71 3 3 m 33
9 29 - - 29 38 - - 38
10 62 - - 62 3 8 4 42
11 25 ~ 25 25 ~ 25 1 2 5 0 - - 5 0 21 4 2 5
13 17 - - 17 8 - - 8
14 21 m 21 21 4 25
15 17 - - 17 17 - - 17
16 - - - - - - 29 - - 29
17 4 - - 4 25 - - 25
18 ~ - - - - 17 - - 17
19 . . . . . .
20 4 4 8 - - - -
21 . . . . . .
22 4 m 4 4 ~ 4
23 4 ~ 4 - - m
To ta l 8 1 3 8 2 9 1 ,642 1 ,138 1 ,145 2 , 2 8 3
* Most dead stems under 4 inches in diameter were left in the woods - - = No trees of that diameter observed in stand exams
17

Production Rates
Table 3~Product distribution a from study blocks by green tons per acre and percentage
Block A Block B
Product Tons/acre Percent Tons/acre Percent
Saw logs 45 16 60 21 Chips 147 53 157 53 Hogged fuel 84 31 76 26
Total 276 100 293 100
a No particular merchantability specifications were imposed on this system. This permitted the operator to adjust the product output to follow the market-dictated highest and best use on a near daily basis.
Table 4--Nominal daily production of the doghair harvesting and processing system
Product Block A Block B
Truckloads~day a
Saw logs 2 3 Clean chips 7 9 Hogged fuel 4 4
a Based on 10-hour workdays, 25 tons per log truck, 20 tons per chip or hogged-fuel van.
The overall-system-daily production rates are shown in table 4. These average rates are based on 10-hour workdays and net product weights of 25 tons per log truck and 20 tons per chip or hogged-fuel truck.
Table 5 summarizes the production rates of the harvesting and processing equipment on each study block. Note that the production rates refer to the individual pieces of equipment and not to the products or to the material-handling processes. The produc- tion rates of all equipment were higher on block B than on block A. Progress on a learning curve may have had a slight effect, and there were more trees and slightly larger trees on block B, but the main contributor to higher production rates was the addition of a conveyor system to the processing system at the landing. As materials flowed through the landing faster, the forwarder was able to deliver trees faster, there- by making more efficient use of its productive time. The time spent by the forwarder in roadway improvements also contributed to a higher production rate on block B.
18

Table 5--Production rates of harvesting and processing equipment on each study block
Machine Block A Block B
Tons/p-hP
Harvesting equipment: Feller-buncher 55 60 Forwarder 46 65
Processing equipment: Sorter-loader 30 42 Debarker-delimber 29 34 Chipper 29 34 Shredder 10 10.5
a Tons = green tons; p-hr = productive hour
Harvesting--The FB-1 (ATH-28) steep-slope feller-buncher was used to mechan- ically fell and simultaneously bunch the trees On both study blocks. Block A was felled in November 1986; block B was fe'led in January 1987. Forwarding was done entirely with a single forwarder (clam-bunk skidder, Timberjack 520A). Forwarding was done simultaneously with the processing operation, about 1 week after felling each block.
Cutting--Felling and bunching with the steep-slope feller-buncher progressed effi- ciently and effectively with the machine working both uphill and downhill. Butts of the trees were placed downhill for easy loading by the clam-bunk skidder. Because less rotation of the felling boom was required when working uphill, the production rate of the feller-buncher was about 40 percent higher on the uphill passes. The independ- ently pivoting, quad-track drive system of the feller-buncher gave it excellent mobil- ity over uneven terrain on all slopes encountered, which ranged between 20-35 per- cent in the stand and up to 60 percent in short stretches. The automatic leveling feature of the feller-buncher boom platform functioned well, keeping the operator from working in unnatural positions and allowing him and the machine to operate consistently and smoothly. The machine had high ground clearance (almost 3 feet), which enabled it to pass easily over many ground obstacles that would have im- peded travel of most woods machinery. The effective reach of the cutting head was about 60 feet fro m one side to the other, compared to a cutting path of about 40 feet by the conventional feller-bunchers used in the area.
19

The production rates of the feller-buncher on this test were 55 and 60 tons per pro- ductive hour, respectively, on blocks A and B. Based on data collected during the in- tense, hourly sample periods, the corresponding production rates in number of stems per productive hour were 195 and 225. The overall production rate on an area basis was 0.20 acres per productive hour on both blocks A and B. The feller-buncher aver- aged 2.27 stems per cycle on block A and 2.24 stems per cycle on block B. A limited observation (1 hour only) of relative production rates of uphill vs. downhill operation during the study on block B showed that the feller-buncher cut and bunched 124 cycles per productive hour during uphill operation and 87 cycles per productive hour during downhill operation. A cycle is defined here to be the felling, rotating, and bunching movements of the machine. A cycle was counted each time the trees held in the shear head were released onto the ground or a bunch. Table 6 shows the dis- tribution of piece count handled by the feller-buncher on each cycle. Over 40 percent of the cycles handled only one tree, and 80 percent of the cycles handled three or fewer trees.
The number of stems harvested, based on the observed production rate, was 9 per- cent higher than the number of trees based on the adjusted stand exam on block A and 13 percent lower on block B.
Table 7 summarizes the operational-time components of the feller-buncher on each study block. The 8-percent downtime on block A consisted of 34 minutes to replace a broken hydraulic hose on the felling head, 17 minutes total for checking and bleeding lines, and 34 minutes for operator breaks.
Table 6~Distribution of number of stems cut and bunched per turn by the feller. buncher
Frequency No. of stems per turn Block A Block B
Percent
1 41 43 2 25 21 3 14 16 4 11 10 5-8 9 10
20
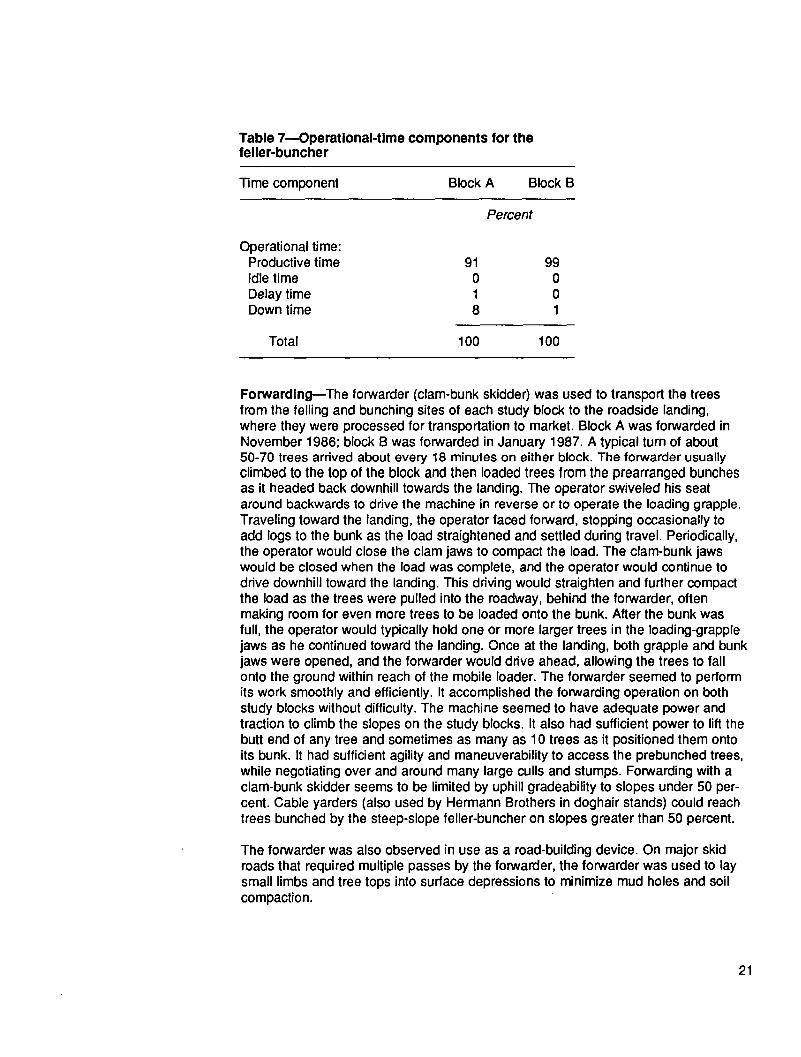
Table 7--Operational-time components for the feller-buncher
Time component Block A Block B
Percent
Operational time: Productive time 91 99 Idle time 0 0 Delay time 1 0 Down time 8 1
Total 100 100
Forwarding--The forwarder (clam-bunk skidder) was used to transport the trees from the felling and bunching sites of each study block to the roadside landing, where they were processed for transportation to market. Block A was forwarded in November 1986; block B was forwarded in January 1987. A typical turn of about 50-70 trees arrived about every 18 minutes on either block. The forwarder usually climbed to the top of the block and then loaded trees from the prearranged bunches as it headed back downhill towards the landing. The operator swiveled his seat around backwards to drive the machine in reverse or to operate the loading grapple. Traveling toward the landing, the operator faced forward, stopping occasionally to add logs to the bunk as the load straightened and settled during travel. Periodically, the operator would close the clam jaws to compact the load. The clam-bunk jaws would be closed when the load was complete, and the operator would continue to drive downhill toward the landing. This driving would straighten and further compact the load as the trees were pulled into the roadway, behind the forwarder, often making room for even more trees to be loaded onto the bunk. After the bunk was full, the operator would typically hold one or more larger trees in the loading-grapple jaws as he continued toward the landing. Once at the landing, both grapple and bunk jaws were opened, and the forwarder would drive ahead, allowing the trees to fall onto the ground within reach of the mobile loader. The forwarder seemed to perform its work smoothly and efficiently. It accomplished the forwarding operation on both study blocks without difficulty. The machine seemed to have adequate power and traction to climb the slopes on the study blocks. It also had sufficient power to lift the butt end of any tree and sometimes as many as 10 trees as it positioned them onto its bunk. It had sufficient agility and maneuverability to access the prebunched trees, while negotiating over and around many large culls and stumps. Forwarding with a clam-bunk skidder seems to be limited by uphill gradeability to slopes under 50 per- cent. Cable yarders (also used by Hermann Brothers in doghair stands) could reach trees bunched by the steep-slope feller-buncher on slopes greater than 50 percent.
The forwarder was also observed in use as a road-building device. On major skid roads that required multiple passes by the forwarder, the forwarder was used to lay small limbs and tree tops into surface depressions to minimize mud holes and soil compaction.
21

Observed production rates of the forwarder on this test were 46 and 65 tons per pro- ductive hour, respectively, on blocks A and B. Corresponding production rates in units of stems per productive hour were 161 and 244, based on earlier stem counts going into the prebunched piles. The production rate on an area basis was 0.17 acres per productive hour on blocks A and 0.22 acres per productive hour on block B. This production rate approximated the production rate of the feller-buncher, for the skid- ding distances of this study. The two machines worked well together in this respect. The feller-buncher operator always positioned the prebunched piles of trees with the maximum convenience of the forwarder operator in mind, that is, semi-herring bone fashion with the butts downhill. Harvesting sequence and travel routes were carefully planned by the operators and coordinated with the material flow needs of the process- ing system.
While study observations were being made, the forwarder provided a continual flow of trees for the processing system at the landing. The operator used slack demand times for nonproductive activities such as road maintenance, hydraulic hose replace- ments, and lunch breaks. The forwarder operator was observed to pace arrival times at the landing according to the stockpile of unprocessed trees. This was done by varying the route and distance traveled to load trees. When the stockpile was high, the forwarder loaded trees from the far end of the study block, bypassing some closer trees, which could later be quickly forwarded on demand when the stockpile was low. The operator also regularly bypassed some larger trees that were close to the landing to save them for times when a heavy load was needed at the landing. The larger trees were also used as load binders on top of bunks filled with many smaller trees. This practice secured the load for travel and improved the load density in the clam bunk.
The production rate of the forwarder is sensitive to the required travel distance. If the cutting unit were quite close or next to the landing, the forwarder could be expected to move trees faster than the feller-buncher could fell and bunch them; thus, the pro- duction rate of the forwarder might far exceed that of the processing system at the landing. On the other hand, as the travel distance increases, the forwarder would be slower than the feller-buncher; in this case, additional forwarders might be used to balance the harvesting operation so that trees arrive at the landing at the proper frequency to minimize idle time and delays of other processing equipment. For ex- ample, the average forwarding distance for each block during this study was about one quarter mile, and the forwarder spent roughly half of its productive time traveling. If the forwarding distance were doubled to one half mile, then the relative time spent traveling would increase to 67 percent, and the production rate could be expected to decrease to about two-thirds of the previous rate.
22
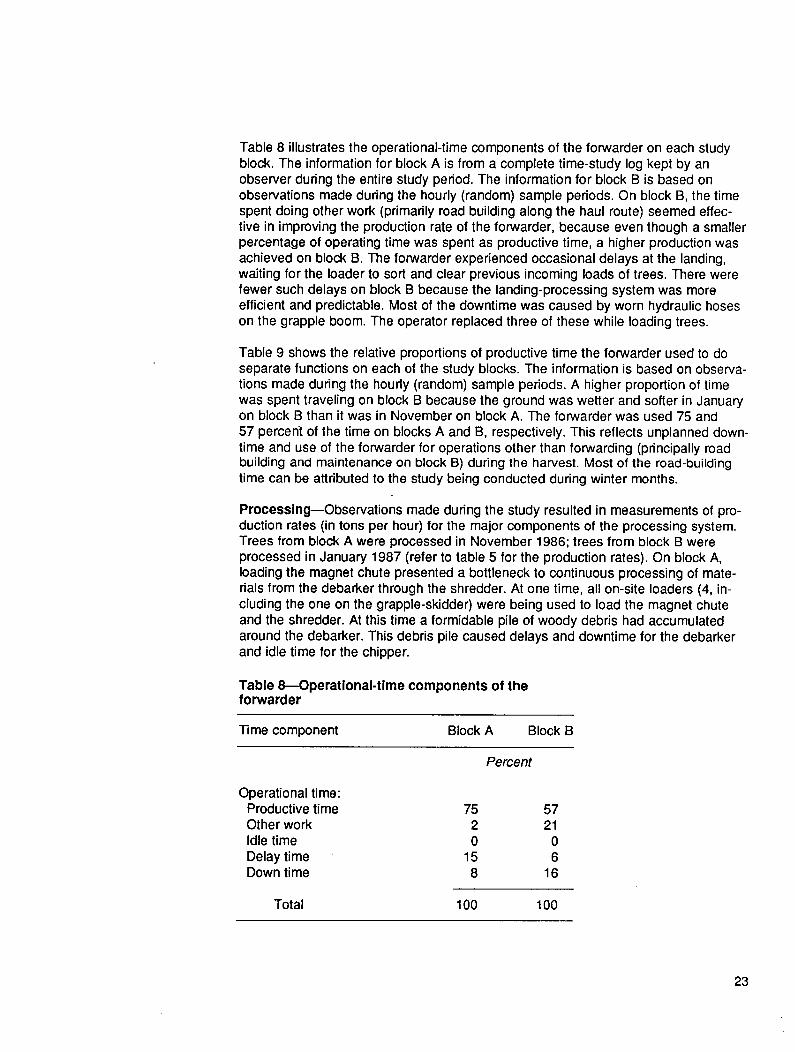
Table 8 illustrates the operational-time components of the forwarder on each study block. The information for block A is from a complete time-study log kept by an observer during the entire study period. The information for block B is based on observations made during the hourly (random) sample periods. On block B, the time spent doing other work (primarily road building along the haul route) seemed effec- tive in improving the production rate of the forwarder, because even though a smaller percentage of operating time was spent as productive time, a higher production was achieved on block B. The forwarder experienced occasional delays at the landing, waiting for the loader to sort and clear previous incoming loads of trees. There were fewer such delays on block B because the landing-processing system was more efficient and predictable. Most of the downtime was caused by worn hydraulic hoses on the grapple boom. The operator replaced three of these while loading trees.
Table 9 shows the relative proportions of productive time the forwarder used to do separate functions on each of the study blocks. The information is based on observa- tions made during the hourly (random) sample periods. A higher proportion of time was spent traveling on block B because the ground was wetter and softer in January on block B than it was in November on block A. The forwarder was used 75 and 57 percent of the time on blocks A and B, respectively. This reflects unplanned down- time and use of the forwarder for operations other than forwarding (principally road building and maintenance on block B) during the harvest. Most of the road-building time can be attributed to the study being conducted during winter months.
Processing--Observations made during the study resulted in measurements of pro- duction rates (in tons per hour) for the major components of the processing system. Trees from block A were processed in November 1986; trees from block B were processed in January 1987 (refer to table 5 for the production rates). On block A, loading the magnet chute presented a bottleneck to continuous processing of mate- rials from the debarker through the shredder. At one time, all on-site loaders (4, in- cluding the one on the grapple-skidder) were being used to load the magnet chute and the shredder. At this time a formidable pile of woody debris had accumulated around the debarker. This debris pile caused delays and downtime for the debarker and idle time for the chipper.
Table 8---Operational-time components of the forwarder
Time component Block A Block B
Percent
Operational time: Productive time 75 57 Other work 2 21 Idle time 0 0 Delay time 15 6 Down time 8 16
Total 100 100
23

Table 9reProductive-time components of the forwarder
Time component Block A Block B
Percent
Productive time: Travel 44 57 Loading 53 40 Unloading 3 3
Total 100 100
Sort ing--As the trees were delivered to the landing for processing by the forwarder, the mobile loader first set aside the saw logs and then separated the hogged-fuel material from the trees that could be processed into clean chips. This sorting process progressed rapidly, thereby allowing the loader to attend to its major role of feeding the debarker-delimber. Because the mobile loader handled all materials at least once, its production rate is based on the weight of all delivered products. Repeated handling of individual trees is not considered here. On block A, the production rate was 30 tons per productive hour for all functions performed by the mobile loader- sorter. The rate increased to 42 tons per productive hour on block B, where the material handling conveyor was in full operation.
During the observation periods, the percent of productive time spent in direct support of chips, saw logs, and hogged fuel was as follows: 74:15:12 and 78:12:10 on blocks A and B, respectively.
Clean-chip process--After clearing the incoming trees from the drop zone used by the forwarder, the loader moved into position next to the debarker-delimber to assist in the clean-chip operation. The loader would then typically feed one or two but sometimes as many as four trees into the debarker-delimber. As the cleaned stems emerged from the debarker-delimber, they were grabbed by the loading grapple attached to the chipper. The chipper operator continued to pull the trees through the chain-flail at a rate consistent with proper cleaning. The stems were then placed into the feed works of the chipper, which transformed the clean stems into clean chips and blew them into a waiting chip van. Bark content of less than 1 percent could easily be achieved with this method. The production rate of the chipper is the same as the production rate of the debarker in the clean-chip operation because both ma- chines process the same trees and the rate is based on the weight of the chips in the van. Twice during the study, the debarker was bypassed and the chipper proc- essed whole trees into hogged fuel. The chipper's production rate when producing hogged fuel was about 50 percent higher than its production rate for clean chips.
24
The production rate of the chipper was limited by the desired cleanliness of chips produced. The material feed rate of the chipper in linear feet per second was fixed because the feed rollers are geared directly to the chipping disc drive system. The chipper's production rate in tons per productive hour can only be increased by feed- ing larger trees or multiple trees (more basal area through the knives). When multiple trees are fed through the debarker, however, the effectiveness of the debarking chains is decreased, which results in higher bark content in the chips. Even though the debarker is designed to handle multiple stems, the typical load usually consisted of three or fewer trees during this study. This resulted in chips with a bark content of less than 2 percent, which was the goal of the operator.
From a block B sample observation of 504 loads of trees fed into the debarker- delimber, 87 percent of the loads were single trees, 11 percent were two trees at a time, and 2 percent were three or more trees.
Overall, the production rate of the chipper was 29 and 34 tons of pulp-quality chips per productive hour on blocks A and B, respectively.
Hogged-fuel process--The prototype shredder normally processed all materials that were not delivered as saw logs or clean chips into hogged fuel. Materials came from several sources: very small or unsound trees, repeatedly bucked by the chaser; limbs and trim ends from saw logs; limbs and broken tops discharged from the debarker- delimber; bark and fines discharged from the debarker-delimber; bark and other friable particles discharged by the chipper.
Observations on block B showed that an average of 70 loads per productive hour were dropped into the shredder hopper. Of these, 56 percent consisted of sawed stems and branches from the first and second categories above.
A conveyor belt lifted bark and limbs out of the debarker-delimber and discharged them onto another system 5 of two conveyors that continuously separated the mate- rials into three categories. Larger limbs usually overshot the second conveyor and were side cast directly in front of the conveyor that discharged materials from the debarker-delimber. Fine materials, including most of the bark, filtered down through openings in the top bed of the second conveyor and were delivered to a third con- veyor along with any metal chain pieces that occasionally became separated during operation. Branches that did not filter down through the top bed of the second conveyor were piled within easy reach of the shredder loading grapple. The third conveyor then lifted the fine materials and any possible chain particles to a chute that passed over a 1000-pound permanent magnet. The magnet was designed to trap chain particles to prevent damage to the sharp knives of the shredder. Fine wood particles that passed over the magnet were collected in a hopper that was regularly emptied by the shredder loading grapple, alternately with branches and other debris as listed above. The shredded hogged fuel was then blown into a waiting van.
5 The second and third conveyors were used on block B but not on block A. The added material-handling equipment im- proved production efficiency. Moreover, large quantities of materials did not accumulate during the day on block B. On block A, all three loaders were typically used at the end of each workday to load the shredder until the landing was cleaned.
25
Equipment Availability
The shredder operator opened the clam-shell doors of the hopper over the shredding drum each time a load was dropped in by the grapple. The doors can be seen in fig- ure 9. Materials from the conveyor system and the saw-log operation were small enough to easily fit into the shredder hopper. The small trees, however, had to be progressively bucked by a chaser with a chain saw to make hopper-length loads (4 to 5 feet long) for the grapple to drop into the hopper. This repeated bucking operation progressed faster than might have been expected because the shredder operator used the loading grapple to move the trees incrementally, in bunches, over a crosswise cull log. This enabled the chaser to buck many trees at a time without moving wood or binding the saw. The result was a clean landing with almost all woody materials being hauled out in a van or on a log truck.
The production rate of the hogged-fuel process was calculated based on the weight of hogged fuel leaving the site. The primary machine in the hogged-fuel process was the shredder, which handled all the hogged-fuel materials. The production rate of the shredder was 10 tons per hour on block A and 10.5 tons per hour on block B.
Even though materials destined for hogged fuel were also handled repeatedly by the sorter-loader and partially by the debarker-delimber, the chipper, the conveyor-magnet system, and the chaser, the hogged-fuel production rate was attributed to the shred- der because of its singular function. The other systems contributed to the production rate but were not specifically characterized by the amount of their contribution rela- tive to the contribution of the shredder or to the other products they handled. The interrelated functions of the processing equipment make simple assignments of costs equally difficult and arbitrary. No production rate was calculated for the conveyor system, though it clearly processed only hogged-fuel materials.
When the chipper was used without the debarker to produce hogged fuel, larger cross-sectional areas of trees (multiple stems) were fed into the chipper, increasing its effective production rate, without concern about bark content. One van on block A was tilled with 47,600 pounds of hogged fuel in 27 minutes, a hogged-fuel production rate of 52.9 green tons per productive hour for the chipper.
The results of equipment availability (or reliability) are presented in table 10. The study period was an extremely short time sample for predicting long-term reliability. The observed availabilities are useful for those wishing to accumulate these data with other reported data. All machines experienced relatively high availability, especially considering the minor amount of prior operating time on the three new prototype machines.
26

Table l O---Equipment-availability and productive-time ratios from doghalr harvesting and processing study
Equipment availability Productive-time ratio
Machine Block A Block B Block A Block B
Percent
Harvesting equipment: Feller-buncher 95 99 91 99 Forwarder 92 84 75 57
Processing equipment: Sorter-loader 98 100 93 86 Debarker-delimber 88 84 55 61 Chipper 90 93 58 60 Shredder 86 99 80 86
Productive-Time Ratio
The availability was higher on block B than on block A for every piece of equipment except the forwarder and the debarker-delimber. The forwarder suffered two hydrau- lic hose failures on block B, and the debarker-delimber was down for over 3 hours on block B with an immobile discharge conveyor. The availability of the shredder was significantly improved on block B. The discharge chute became clogged two times on block A because too much wet material (in the form of old cull logs) was dumped into the hopper at one time. This did not happen on block B, where wet materials were loaded alternately with the other materials. The additional conveyors helped smooth out delivery of fine materials to the shredder, and they separated limbs and fines, giving the shredder operator a selection of materials to load. Because of the material sorting action of the conveyor system, the magnet chute also rarely became clogged on block B.
The ratios of productive time are also reported in table 10. These ratios were used for calculating costs and production rates on the common basis of productive hours. The ratios may also be used by planners to estimate scheduled hours required to complete a future job.
The feller-buncher worked independently with high availability at a single task. Consequently, the productive-time ratio of the fel ler-buncher was consistently high.
The forwarder had production capacity to spare; therefore, the operator used some idle time to perform other useful work, such as skid road maintenance. This resulted in a relatively low productive-time ratio in spite of high availability.
Although the availability of the loader was 100 percent on block B, the loader had a lower productive-time ratio there than on block A. This is a result of the loader being delayed while the belt of the debarker-delimber was jammed.
27

Costs
Because of the disabling belt jam-up, described earlier, the debarker-dellmber lost productive time on block B. The results showed, however, an overall rise in productive-time ratio for the debarker on block B. This indicates the overall improve- ment in system availability on block B, which had the benefit of two additional con- veyors to move woody debris (principally limbs and bark) continuously from the debarker across the magnet chute for the shredder.
The jammed debarker left the chipper idle because it could not operate while the debarker was being serviced. Consequently, the productive-time ratio of the chipper was lower on block B than on block A. The chipper and the shredder were delayed for a few minutes every time a van was filled and an empty van was moved into position. '
The productive-time ratios for the chipper include the times when the chipper was used to produce hp,gged fuel instead of clean chips. The operator chose to do this on occasion to meet his hogged,fuel market demand, while balancing the flow of mate- rials arriving at the in-woods processing site.
The debarker was purposely idled for the time when the chipper was producing hogged fuel. Oh one occasion on block B, the chipper filled a van with hogged fuel in 36 minutes. The debarker was not needed for this operation. The debarker was out of production for a total of 2 hours and 22 minutes on that occasion to support this use of the chipper to produce hogged fuel: 37 minutes to reconfigure the debarker (remove its top) to bypass whole trees, 36 minutes to produce the load of hogged fuel, 32 minutes to restore the normal configuration, and another 37 minutes of re- lated delay before the debarker was restarted. Still, the productive-time ratio for the debarker-delimber was higher on block B.
The productive time ratio of the shredder was higher on block B, primarily because the shredder-feedstock handling system was improved by the added conveyors.
Machine rates were calculated for each piece of harvesting and processing equip- ment. The calculations include ownership and operation costs. They do not include costs associated with equipment move-in, set-up, overnight maintenance, or road and landing construction; company risk and profit are also excluded. Costs for the conveyor-magnet system 6 were included, but they accounted for only about $0.06 per ton of total product. No interest payments are included for the shredder and the debarker-delimber because funds for these machines were provided from extemal sources. Average yearly investment values were included, however. Machine rates, broken down by ownership and operating costs (with the exclusions noted above), are shown in table 11.
The productive costs of harvesting and processing are shown in table 12. These costs were calculated by combining the production results of table 5 with the cost results of table 11. The total productive cost was $9.52 and $7.80 per ton on blocks A and B, respectively.
8 Conveyors of this type cost about $20,000. They have negli- gible operating costs because they are all powered by ex- cess hydraulic power from other machinery, and no additional operator is required.
28

Table 11--Costs and machine rates for equipment used for harvesting and in-woods processing of small-diameter trees
Block A Block B
Own Operate Machine Own Operate Machine Machine cost cost rate cost cost rate
. . . . . . . . . . . . Do l la rs p e r p r o d u c t i v e h o u r . . . . . . . . . . . .
Harvesting equipment: Feller-buncher 46.86 26.05 72.91 43.07 24.35 67.42 Forwarder 35.71 29.58 65.29 46.98 37.66 84.64
Processing equipment: Sorter-loader 30.83 25.41 56.24 33.34 27.09 60.43 Debarker-delimber 15.04 2.10 17.14 13.56 2.10 15.66 Chipper 35.74 44.98 84.79 43.48 38.71 82.19 Shredder 44.51 32.06 76.57 41.41 30.38 71.79 Magnet-conveyor .32 0 .32 2.21 0 2.21
Table 12--Productive costs per green ton for equipment used for harvesting and In-woods processing of small-diameter trees
Machine Block A Block B Materials
. . . . . . $/TorP . . . . .
Harvesting equipment: Feller-buncher 1.33 1.13 Whole trees Forwarder 1.42 1.30 Whole trees
Total 2.75 2.43
Processing equipment: Sorter-loader 1.87 1.44 Debarker-delimber .59 .46 Chipper 2.92 2.42 Shredder 7.66 6.84 Magnet-conveyor .04 .23
Total b 6.77 5.37
Total system cost b 9.52 7.80
Mixed Whole trees Clean stems Mixed Bark and fines
a Each entry is based on the green tons of material processed by a particular machine ~for example: whole trees, clean stems, etc.).
The itemized productive costs of each component of the processing system are not additive because each machine processes only a portion of the total product output. Processing costs were calculated by summing the products of the cost per ton and the respective tonnage processed by each machine and then dividing that sum by the total weight of delivered products.
29

Conclusions
The productive costs incurred to process each product (such as, the clean-chip opera- tion) are difficult to calculate without arbitrary assignment of the costs of the multiple- purpose machines that operate as an integrated system for the good of the entire system. Therefore, productive costs of each machine are given (table 12), based on the weight of material handled by each machine. Productive costs of the total system based on prorated use of each machine for its respective proportion of products handled are also shown in table 12. Because the different pieces of equipment proc- ess different weights of material, and because some materials may be handled by more than one piece of equipment, the productive costs are not truly additive. These costs should be considered along with the percentage breakdown of the products produced (table 3). It would be incorrect to focus on only one product and attempt to isolate the unit cost of that product only. At the study site, all products are delivered by the system. Without all products being delivered, a harvest may not be feasible because of economics, environmental impacts, or other reasons discussed previ- ously. There could be no clean chips without the debarker; no hogged fuel without the collective inputs of materials from the sorting, saw log, and chipping operations; and no saw logs from these stands without a way to clean the harvest site and market the other products.
The steep-slope feller-buncher and clam-bunk-skidder harvesting system was well adapted to the stand and terrain conditions of this study. The feller-buncher func- tioned remarkably well, with lift capacity, power, and gradability to spare. The clam- bunk skidder kept pace with the felling and the processing production rates, with extra time to do other tasks such as skid road maintenance. Productive costs for harvesting the study blocks were $2.75 and $2.43 per ton on blocks A and B, respectively.
The in-woods, multiple-product processing system demonstrated a consistent ability to sort and process the small-diameter trees into a marketable mix of products. All machines had high reliability and high productive-time ratios. Average daily produc- tion was about three truck loads of logs, eight van loads of clean chips, and four vans of hogged fuel. Productive costs for processing the material from study blocks A and B were $6.77 and $5.37 per ton, respectively.
The mobile sorter-loader and the chipper appeared to be sized adequately for this application. These are regular, production-line equipment items, and their reliabilities were very high even though the chipper had very little operating time on it before this study started. The multi-stem debarker-delimber, the shredder, and the magnet- conveyor system were designed, fabricated, and used for the first time on this job; all worked well. Occasional system clogs were encountered, especially with large, unsound cull logs (shredder) or extremely dense crowns (debarker). These clogs were all overcome quickly, and the system operated nearly continuously. The added conveyors on block B enhanced the material-handling capabilities within the process- ing system.
The chipping operation could not proceed without the mobile loader because the loader was needed to insert trees into the debarker; chips were not produced while the loader tended to log trucks, for example, but log trucks were usually loaded during other slack times for the chipper, such as during knife or van changes. The interruptions were minimal, and an additional loader is probably not warranted.
30

Acknowledgments
Metric Equivalents
The total system-productive costs for harvesting and processing multiple products from the two study blocks in the doghair stand were $9.52 per ton in block A and $7.80 per ton in block B. The weight ratio of chips to total product weight was 53 per- cent on both blocks. Saw logs comprised 16 percent of the product weight on block A and 21 percent on block B. The remaining product was hogged fuel: 31 and 26 per- cent on blocks A and B, respectively. The actual mix of delivered products should be considered simultaneously with the total system-production costs because it is not reasonable to isolate the cost of producing individual products in an integrated sys- tem such as this. The important questions to answer are as follows: Is the system profitable? Would a different configuration be more profitable in this market? Would this or a different configuration be more profitable in a different market?
The relatively low productive costs of this system, coupled with short haul, local markets for all three products, and a continuing need for operations in similar stands, combine to make the system feasible. The substantial capitalization costs, however, can be justified only with adequate forest inventories and thorough planning.
This system or adaptations of it may be technically and economically suited to har- vest and process other stands of small-d=ameter trees, where total marketing is required to justify any harvest, and where it is desirable to collect the energy-wood component of the stand.
The authors express appreciation to the U.S. Department of Energy, Bonneville Power Administration, and the Olympic National Forest for their support of this and related studies. Excellent cooperation between the interested people of the Govern- ment and private agencies during the course of this study has resulted in its success- ful conclusion. Special acknowledgment is made to the Quilcene District, Olympic National Forest, particularly Bob Haase, District Ranger, and Clark Bainbridge, doghair project coordinator, who were helpful in applying their resources and staffs toward the goals of this effort. Special acknowledgment is also given to Hermann Brothers Logging and Construction Company, particularly Steve and Bill Hermann, for their enthusiasm and support; and to their field personnel and equipment opera- tors: Ron Hermann on the feller-buncher, Chris Rambo on the forwarder, John Pruss on the mobile loader, John Heikilla on the chipper, Gary Smith on the shredder, and Clay Halton, chaser, for their courtesy, concerns for safety, and other assistance in conducting this study.
1 inch = 2.54 centimeters 1 foot = 30.48 centimeters 1 mile = 1.609 kilometers 1 acre = 0.405 hectare 1 cubic foot = 0.0283 cubic meter (stere) 1 pound = 0.454 kilogram 1 ton = 0.907 metric tonne 1 gallon = 3.785 liters
31

Literature Cited
Appendix
Ownership Cost Information
Anon. 1986. Onestop debarker/chipper simplifies "doghair" harvest system. In: Biologue; 1985 December-1986 January; Portsmouth, NH: National Wood Energy Association: 12-13.
Howard, James O. 1987. Harvesting overstocked stands of small-diameter trees, Report No. 5: Energy values of whole-trees and crowns. Report to U.S. Depart- ment of Energy (Bonneville Power Administration). Portland, OR: U.S. Department of Agriculture, Forest Service, Pacific Northwest Research Station. 13 p.
Jennings, Wesley; May, Meredith; Sheehy, Gwen; Darling, Nancy. 1982. The Olympic National Forest soil resource inventory update report, 1982. Olympia, WA: U.S. Department of Agriculture, Forest Service, Olympic National Forest. [not paged].
Little, Susan N.; Waddell, Dale R. 1987. Highly stocked coniferous stands on the Olympic Peninsula: chemical composition and implications for harvest strategy. Res. Pap. PNW-RP-384. Portland, OR: U.S. Department of Agriculture, Forest Service, Pacific Northwest Research Station. 29 p.
Mifflin, Ronald W. 1980. Computer assisted yarding cost analysis. Gen. Tech. Rep. PNW-GTR-108. Portland, OR: U.S. Department of Agriculture, Forest Service, Pacific Northwest Forest and Range Exl: =.riment Station. 62 p.
The parameters used for calculating ownership costs are summarized in table 13 for the harvesting machines on both study blocks. Table 14 provides the ownership-cost summary for the sorter-loader and the debarker-delimber. Table 15 shows the ownership-cost summary for the chipper and the shredder.
Table 13--Equipment-ownership costs fur the feller-buncher and the forwarder
Feller-buncher Forwarder
Parameter Units Block A Block B Block A Block B
Original investment $ 328,000 a 328,000 a 206,000 206,000 Depreciation period Yrs 5 5 5 5 Annual utilization S-hrs/yr 2,000 2,000 2,000 2,000 Machine availability % 95 99 92 84 Productive-time ratio % 91 99 75 57 Salvage value % 10 10 10 10 Salvage value $ 32,800 32,800 20,600 20,600 Annual depreciation $/yr 59,040 59,040 37,080 37,080 Average yearly
investment $/yr 209,920 209,920 131,840 131,840 Interest rate % 10.75 10.75 10.50 10.50 Annual interest $/yr 22,566 22,566 13,843 13,843 Taxes, license,
and insurance $/yr 3,674 3,674 2,637 2,637
See footnote on following page.
32

Operating Cost Information
Table 13---continued
Feller-buncher Forwarder
Parameter Units Block A Block B Block A Block B
Scheduled hours S-hrs/job 17.25 17.3 25.1 27.6 Fixed costs S/job 735.66 737.67 698.96 672.18 Fixed costs per scheduled hour $/S-hr 42.64 42.64 26.78 26.78
Fixed costs per productive hour $/P-hr 46.86 43.07 35.71 46.98
a Estimated capital cost; not a market-derived value.
Table 14- -Equipment-ownership costs for the sorter-loader and the debarker-delimber
So~er-loader Debarker-delimber
Parameter Units Block A Block B Block A Block B
Original investment $ 230,000 230,000 85,000 a 85,000 a Depreciation period Yrs 5 5 5 5 Annual utilization S-hrs/yr 2,000 2,000 2,000 2,000 Machine availability % 98 100 88 84 Productive-time ratio % 93 86 55 61 Salvage value $ 20,000 20,000 5,000 5,000 Annual depreciation $/yr 42,000 42,000 16,000 16,000 Average yearly
investment $/yr 146,000 146,000 53,000 53,000 Interest rate % 9.00 9.00 0 0 Annual interest $/yr 13,140 13,140 0 0 Taxes, license,
and insurance $/yr 2,190 2,190 530 530 Scheduled hours S-hrs/job 30.95 28.0 28.5 26.4 Fixed costs S/job 887.34 802.76 235.70 218.33 Fixed costs per scheduled hour $/s-hr 28.67 28.67 8.27 8.27
Fixed costs per productive hour $/p-hr 30.83 33.34 15.04 13.56
a Estimated capital cost; not a market-derived value.
The parameters used for the calculation of operating costs are summarized in Table 16 for the harvesting machines on both study blocks. Table 17 provides the cost summary for the sorter-loader and the debarker-delimber, and Table 18 gives the operating-cost summary for the chipper and the shredder.
33

Table 15- - -Equ ipment -ownersh ip cos t s for the ch ipper and the shredder
Chipper Shredder
Parameter Units Block A Block B Block A Block B
Original investment $ 203,000 203,000 350,000 a 350,000 a Depreciation period Yrs 5 5 5 5 Annual utilization S-hrs/yr 2,000 2,000 2,000 2,000 Machine availability % 90 93 86 89 Productive-time ratio % 58 60 80 86 Salvage value $ 20,000 20,000 10,000 10,000 Annual depreciation $/yr 36,600 36,600 68,000 68,000 Average yearly
investment $/yr 129,800 129,800 214,000 214,000 Interest rate % 10.50 10.50 0 0 Annual interest $/yr 13,629 13,629 0 0 Taxes, license,
and insurance $/yr 1,947 1,947 3,210 3,210 Scheduled hours S-hrs/job 29.97 27.60 30.86 29.40 Fixed costs S/job 781.92 720.08 1,098.92 1,046.93 Fixed costs per scheduled hour $/s-hr 26.09 26.09 35.61 35.61
Fixed costs per productive hour $/p-hr 44.98 43.48 44.51 41.41
a Estimated capital cost; not a market-derived value.
Table 16 - -Equ ipment -opera t ing cos ts for the fe l le r -buncher and the fo rwarder
Feller-buncher Forwarder
Parameter Units Block A Block B Block A Block B
Total crew wage $/hr 11.50 11.50 11.50 11.50 Supervision % of wages 67 67 67 67 Fuel cost $/gal 0.61 0.61 0.61 0.61 Fuel consumption Gal/p-hr 6.5 6.5 5 5 Hourly fuel cost $/p-hr 3.96 3.96 3.05 3.05 Hourly oil cost $/p-hr .99 .99 .92 .92 Hourly labor costs $/p-hr 21.10 19.40 25.61 33.69 Hourly fuel and oil costs $/p-hr 4.95 4.95 3.97 3.97
Hourly operating cost $/p-hr 26.05 24.35 29.58 34.66
Machine rate $/p-hr 72.91 67.42 65.29 84.64
34

Table 17---Equipment-operating costs for the sorter-loader and the debarker-delimber
Sorter-loader Debarker-delimber
Parameter Units Block A Block B Block A Block B
Total crew wage $/hr 11.50 11.50 0 0 Supervision % of wages 67 67 67 67 Fuel cost $/gal .61 .61 .61 .61 Fuel consumption Gal/p-hr 6 6 3 3 Hourly fuel cost $/p-hr 3.66 3.66 1.83 1.83 Hourly oil cost $/p-hr 1.10 1.10 .27 .27 Hourly labor costs $/p-hr 20.65 22.33 0 0 Hourly fuel and oil costs $/p-hr 4.76 4.76 2.10 2.10
Hourly operating cost $/p-hr 25.41 27.09 2.10 2.10
Machine rate $/p-hr 56.24 60.43 17.14 15.66
Table 18--Equipment-operating costs for the chipper and the shredder
Chipper Shredder
Parameter Units Block A Block B Block A Block B
Total crew wage $/hr 11.50 11.50 11.50 11.50 Supervision % of wages 67 67 67 67 Fuel cost $/gal .61 .61 .61 .61 Fuel consumption Gal/p-hr 9 9 11 11 Hourly fuel cost $/p-hr 5.49 5.49 6.71 6.71 Hourly oil cost $/p-hr 1.21 1.21 1.34 1.34 Hourly labor costs $/p-hr 33.11 32.01 24.01 22.33 Hourly fuel and oil costs $/p-hr 6.70 6.70 8.05 8.05
Hourly operating cost $/p-hr 39.81 38.71 32.06 30.38
Machine rate $/p-hr 84.79 82.19 76.57 71.79
Glossary Ch ippe r - -A machine with sharp knives used for processing entire stems into pulp chips.
• Doghair--A term used in this report to describe dense stands of small-diameter trees that are overstocked and growing very slowly.
Feller-buncher--A machine used for severing trees from their stumps and arranging the severed stems into piles.
ForwardermSee skidder. The operator generally referred to his skidder as a forwarder because of the function it performed. Consequently, the terms are used interchangeably in this report, although a forwarder usually transports trees or tree segments without dragging any part of the tree.
35

Friable--Easily crumbled or pulverized.
Hogged fuel--Woody biomass that has been processed by a hammer hog, shredder, or similar comminution device so that it may be easily handled in bulk and burned for conversion into heat energy (also called hog fuel); usually comprised of low value or very small-diameter trees, cull logs, branches, and tree tops.
Landlng--A processing site usually adjacent to both the harvesting area and a surfaced roadway, accessible by both highway transport vehicles and forwarding equipment.
Loader--A machine used for lifting and moving trees and tree pads.
Machine rate--Hourly cost of owning and operating a piece of equipment.
Productive cost--Cost of owning a piece of equipment per unit of production in units of dollars per ton.
Shredder--A drum-type chipper built by Hermann Brothers for processing limbs, bark, small trees, and other woody biomass into hogged fuel.
Skidder--A ground-based machine that transports trees and tree parts from the stump to the landing.
Supervision rate~A fraction of the total crew wages that is charged to basic super- vision of labor and overhead, expressed as a decimal number, where 1.0 means 100 percent of wages. This rate includes unemployment insurance and other em- ployee overhead expenses.
Time:
Scheduled: Total work time when the equipment was allocated for operation on the study blocks. Scheduled time for all jobs during a year would total the annual-use hours for the equipment.
Operating: The inclusive time between the first moment of productive time until the machine shuts down for the day. Operating time includes all productive time, idle time, delay time, other work performed, and all downtime (planned and unplanned) during the operating day(s). For this study, warm-up and cool-down times and normal after-hour fueling and maintenance times were not included in operating time. Oper- ating time was recorded by an observer, unlike scheduled time which was estab- lished (allocated) before the operation began.
Productive: Scheduled time less all unproductive time segments, such as idle, delay, and down times.
Idle: Periods of time when equipment could not process material because no mate- rial was available from the previous process. (No workload.)
36

Delay: Periods of time when equipment could not complete material processing because the subsequent process was fully loaded and could not accept new material (bottleneck ahead).
Down: Periods of time when equipment was unavailable for productive work because of scheduled or nonscheduled interruptio'.'l of processing owing to mechanical or operator inability to proceed.
Turn--A complete work cycle, referring to a specific tree-harvesting process, such as (1) cutting a tree and positioning it on the ground or (2) loading felled trees and transporting them to a landing.
Forwarding--The process of moving trees and trees parts from the stump to a landing.
37

Lambert, Michael B; Howard, James O. 1990. Cost and productivity of technology for harvesting and in-woods processing small-diameter trees. Res. Pap. PNW-RP-430. Portland, OR: U.S. Department of Agriculture, Forest Service, Pacific Northwest Research Station. 37 p.
A study was conducted on the productivity and cost of an integrated harvesting and processing system operating in small-diameter timber (western hemlock-type) on the Olympic Peninsula of western Washington. The system uses a new steep-slope feller- buncher, a clam-bunk grapple-skidder (forwarder), a prototype chain-flail debarker- delimber, a chipper, a conveyor system, and a prototype shredder. The study showed that the system harvested and processed trees at a combined-system cost of $7.80 per green ton at a production rate of 455 green tons per day. The delivered product mix was 53 percent chips, 21 percent saw logs, and 26 percent hogged fuel by weight. The pro- ductivity and machine rate of each piece of harvesting and processing equipment and other data are given.
Keywords: Logging, whole-tree harvesting, feller-buncher, intensive harvesting, utilization, integrated harvesting, in-woods chipping, small-tree harvesting.
The Forest Service of the U.S. Department of Agriculture is dedicated to the principle of multiple use management of the Nation's forest resources for sustained yields of wood, water, forage, wildlife, and recreation. Through forestry research, cooperation with the States and private forest owners, and management of the National Forests and National Grasslands, it strives - - as directed by Congress n to provide increasingly greater service to a growing Nation.
The U.S. Department of Agriculture is an Equal Opportunity Employer. Applicants for all Department programs will be given equal consideration without regard to age, race, color, sex, religion, or national origin.
Pacific Northwest Research Station 319 S.W. Pine St. P.O. Box 3890 Portland, Oregon 97208-3890

U.S. Department of Agriculture Pacific Northwest Research Station 319 S.W. Pine Street P.O. Box 3890 Portland, Oregon 97208
BULK RATE POSTAGE + FEES PAID USDA-FS
PERMIT No. G-40
Official Business Penalty for Private Use, $300
do NOT detach label