Embed Size (px)
Citation preview

Cien. Inv. Agr. 38(1):15-29. 2011www.rcia.uc.cl
animal production
research paper Production systems, technical parameters and quality of bovine milk
producers in southern Chile
Jorge A. Pérez1
Escuela Medicina Veterinaria, Universidad Santo Tomás, Buena Vecindad 91, Puerto Montt, Chile.
Abstract
J. A. Pérez. 2011. Production systems, technical parameters and quality of bovine milk producers in southern Chile. Cien. Inv. Agr. 38(1): 15-29. Production information of 29 milk producers in the southern region of Chile was studied with the objective of characterizing and classifying different dairy production systems, evaluating various associations between quantitative and qualitative studied variables and analyzing the effect of the production system and the quality of bovine milk according to the month of the year that it was processed. The classification of production groups was based on the implementation of the exploratory multivariate technique, main components analysis and conglomerates or cluster analysis. The applied statistical model was: yijk = µ + Mi + SPj + MSPij + eijk, where yijk=dependent variables (fat, protein, count of somatic cells and colony forming units); µ=general average; Mi=effect of i-th month; SPj=effect of j-th productive system; MSPij=month-productive system interaction; eijk=random residual effect. The price per liter of milk paid to producer was discarded for the construction of groups, since they presented a low discriminatory power given a coefficient of less than 20 % variation. Different correlations between analyzed variables are discussed. Five production systems are described using the qualifying variables and original systems. In general, more intensive production systems presented lower values of fat (%) and protein (%), but showed greater superiority in the quality of sanitary milk than dairy farms with minor animal load. Regarding seasonality, as winter turns to spring, protein (%) associated with a decrease in the fat (%) increases, which determines an inverse relationship between both variables.
Key words: Cluster analysis, colony forming units, fat percentage, main components analysis, multivariable analysis, protein percentage, somatic cell.
Received December 22, 2009. Accepted January 17, 2011.Corresponding author: [email protected]
Introduction
Production systems are characterized by a clus-ter of quantitative and qualitative variables af-fecting the soil-plant-animal relationships and through the classification of these, as a whole, the profitability of agropecuarian farms can be
determined (Pérez, 2009). According to Bola-ños (1999) the characterization is the descrip-tion of the principal characteristics and multiple relationships of organizations; while the clas-sification refers to the determination and con-struction of feasible groups based on the char-acteristics currently observed.
The information obtained from a characteriza-tion and classification study is considered very useful in order to propose strategies to improve aspects with a higher incidence on the develop-

CIEnCIA E InVESTIgACIón AgRARIA16
ment of the studied cattle companies (Valerio et al., 2004). The relevance for determining typologies to classify dairy farms is illustrated by the possibility of implementing efficient gov-ernmental policies using their statistical projec-tions (Smith et al., 2002; gonzález, 2006).
Coronel and Ortuño (2005) indicated that the appropriate knowledge from the rural producer is the basis of any research and transference process, and estimates that the classification obtained allows the detection of strengths and weaknesses which contribute to determine de-sign priorities of economic development poli-cies for the zones under study.
On the other hand, current dairy producers face challenges to reach levels of technical and eco-nomical efficiency to run sustainable farms with-in uncertain national and world dairy markets. It is sought to get the technical parameters of milk compositional, sanitary, and hygienic quality in the sections of maximum allowance, according to the payment patterns for fresh milk from the different companies of the sector (Pérez, 2009b).
The quality of compositional milk (fat and pro-tein percentage) depends on multiple factors: genetics, seasonability, lactation days, cow age, birth season, sanitary status of the cow and nu-trition (ng-Kwai-Hang et al, 1984). The geo-graphical area, climate conditions and the lacta-tion period are known as seasonable changes af-fecting milk composition (Ozrenk and Selcuk, 2008). Calvache et al. (2009) concluded that the content of dairy solids across Chile shows a spe-cific seasonal pattern; the seasonal fluctuations are clearer and the solid content is higher as we head further south from the Metropolitan Re-gion; protein contents are more similar between zones during winter, but they are notoriously differentiated during spring and summer in the southern zone, which may be attributed to a positive effect of the pastured prairie. Likewise, the same authors concluded that the composi-tional changes are different in the case of the protein and milk fat, which demonstrates that they are affected by different factors.
The factors that may affect indicators of milk sanitary quality, like the count of somatic cells
(SCC) are: udder infection, amount of affected quarters or cows, cow age, lactation days, day variation, physiological variation, season and stress (Dohoo and Meek, 1982; Salsberg et al., 1984; Saran and Chaffer, 2000).
Quist et al. (2008) mentioned that the knowl-edge of the variability in the fat and protein per-centages, as well as in SCC is relevant in the decision making of program management in milk production.
Regarding the above, the present work is aimed to: characterize and classify different bovine milk production systems in the provinces of Llanqui-hue and Osorno in the South of Chile, evaluate the relationships existing among the variables studied, and analyze the effect of the productive system and the month of the year on milk quality (compositional, sanitary and hygienic).
Materials and methods
Technical information from 29 dairy produc-ers located in the province of Llanquihue and Osorno, in Southern Chile was collected, which were grouped in a Supplier Program of a dairy plant for the zone.
The methodology applied for the characteriza-tion and classification of dairy production sys-tems was described by Valerio et al. (2004). First, the selection of the sample and informa-tion processing were performed, which was obtained in 2008; then, the reduction of the variable dimension took place and finally, the classification and validation of types or groups were carried out.
A data base with different variables (quantita-tive and qualitative) to be analyzed, which is de-tailed in Table 1, was created. Variables V1 and V2 were obtained from the monthly settlements made to producers by the dairy plant. Variable V3 corresponds to all the milk produced in the farm, including the milk sent to the plant plus all the milk with other uses within the farm (milk for calves, consumption and others) dur-ing a calendar year (Fundación Chile, 2007).
17VOLUME 38 nº1 JAnUARY - APRIL 2011
The variables related to compositional (V5 and V6), sanitary (V7) and hygienic (V8) quality of milk were obtained from each of the biweekly reports provided to the producers for the twelve months in 2008, and were averaged according to the milk reception in the plant.
The proportion among liters sent to the plant in the four months, from spring to summer (no-vember, December, January, February) and in
the four months from fall to winter (May, June, July and August) was considered for the estima-tion of the summer-winter relation (V9), accord-ing to Fundación Chile (2007).
The farm surface (V11), the number of mass cows (V14) and the number of milk cows were obtained from direct surveys to the producers. The number of milk cows, according to the cited survey, was averaged with the figures obtained
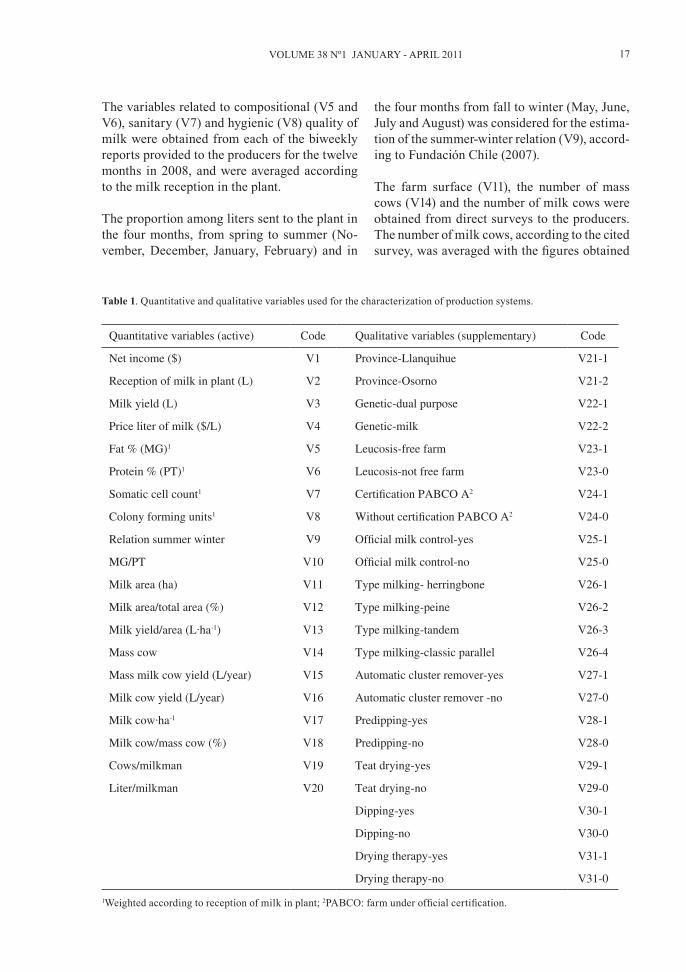
Table 1. Quantitative and qualitative variables used for the characterization of production systems.
Quantitative variables (active) Code Qualitative variables (supplementary) Code
Net income ($) V1 Province-Llanquihue V21-1
Reception of milk in plant (L) V2 Province-Osorno V21-2
Milk yield (L) V3 Genetic-dual purpose V22-1
Price liter of milk ($/L) V4 Genetic-milk V22-2
Fat % (MG)1 V5 Leucosis-free farm V23-1
Protein % (PT)1 V6 Leucosis-not free farm V23-0
Somatic cell count1 V7 Certification PABCO A2 V24-1
Colony forming units1 V8 Without certification PABCO A2 V24-0
Relation summer winter V9 Official milk control-yes V25-1
MG/PT V10 Official milk control-no V25-0
Milk area (ha) V11 Type milking- herringbone V26-1
Milk area/total area (%) V12 Type milking-peine V26-2
Milk yield/area (L·ha-1) V13 Type milking-tandem V26-3
Mass cow V14 Type milking-classic parallel V26-4
Mass milk cow yield (L/year) V15 Automatic cluster remover-yes V27-1
Milk cow yield (L/year) V16 Automatic cluster remover -no V27-0
Milk cow·ha-1 V17 Predipping-yes V28-1
Milk cow/mass cow (%) V18 Predipping-no V28-0
Cows/milkman V19 Teat drying-yes V29-1
Liter/milkman V20 Teat drying-no V29-0
Dipping-yes V30-1
Dipping-no V30-0
Drying therapy-yes V31-1
Drying therapy-no V31-0
1Weighted according to reception of milk in plant; 2PABCO: farm under official certification.

CIEnCIA E InVESTIgACIón AgRARIA18
in two to three visits made to each of the pro-ducers in the year under study. The number of milkmen was confirmed by those visits in order to estimate the variables V19 (cows/milkman) and V20 (production per milkman).
Variable V22 was classified in dual purpose ge-netics (V22-1) or specialized in milk production (V22-2), according to the phenotypical charac-teristics of the dairy livestock. Variables V23 and V24 were verified according to the official documents certified by Servicio Agrícola y Ga-nadero (SAg) and provided by the dairy plant. All the dairy farms under analysis were bru-cellosis and tuberculosis-free, therefore, these were not used as variables for differentiation.
Variables V25, V26 and V27 were categorized in the field visits to all the producers. Variable V26 (type of milking parlor) was classified to the descriptions by Buxadé (1996). Character-istics V28, V29, V30 and V31 were determined according to a protocol intended to evaluate the milking and mammary health procedures in the periodical visits to the parlors.
Statistical analysis
Production systems. The reduction of the vari-able dimensions was carried out determining the variation coefficients from each variable, the variables presenting a low discriminatory pow-er in the group construction were discarded. For this study, a variation coefficient higher than 20% was used as selection criteria. gonzález (2006) and Lores et al. (2008) used quantitative variables with discriminatory capacity, which had a variation coefficient equal or superior than 50 and 40%, respectively. Additionally, the association degree among the variables and those variables that were highly correlated was analyzed, which was determined by one of them following the multivariate technique, according to the quotes by Valerio et al. (2004).
The statistical analysis was made by applying the exploratory multivariate technique of prin-cipal components analysis (ACP) and also con-glomerates or cluster analysis (AC); therefore,
the programs XLSTAT (Addinsoft, new York, United States, 2009) and the Statistical Analysis System (SAS, United States, 2001) were used. In the case of SAS, the procedures used were PROC PRInCOMP and PROC CLUSTER.
The types obtained were contrasted with the types existing in order to ensure that these groups were true and not simply imposed by the method used. Then, a descriptive statistics analysis was made, including mean, median, first and third quartile.
Additionally, supplementary used qualitative variables were not part of the elaboration of the principal components. The ACP analysis projects these supplementary variables on the axis determined by the other variables (active); therefore, their relation with the active variables is observed (Escofier and Pagès, 1992, cited by gonzález, 2006).
Milk quality. The statistical model implemented was: yijk = µ + Mi + SPj + MSPij + eijk., where: yijk=dependent variables (% fat, % protein, SCC and CFU); µ=general average; Mi=effect of i-th month; SPk=effect of k-ith productive system; MSPijk= month-productive system interaction; eijk=random residual effect.
The statistical analysis was made by the proce-dure PROC gLM of the Statistical Analysis Sys-tem (SAS, United States, 2001). The data were subject to an analysis of variance to establish whether significant differences were present be-tween treatment means, and the Tukey-Kramer test was implemented as a procedure of multiple comparisons among all the media pairs.
Results and discussion
Production systems
The variables with higher discriminatory power were determined (Table 2), the bacterial count (V8) outstands among the rest. The quantitative variables V4, V5, V6 and V10 were discarded for the group construction as they each present a low discriminatory power due to a variation

19VOLUME 38 nº1 JAnUARY - APRIL 2011
coefficient lower than 20%. According to this, it is noteworthy that the price per liter of milk (V4), paid to the producer is not a variable dif-ferentiating the dairy production systems.
CER Los Lagos (2008) made a stratification of their producers by production level, obtaining minimum and maximum average sales prices of $180 and $202.67 (US$ 0.29 and US$ 0.32, in December 2008) per liter of milk, respectively. For the same year, Dünner (2009) quoted prices of $191, $197 and $200 (US$ 0.30, US$ 0.31 and US$ 0.32, in December 2008) per liter of milk for the producers, in order according to eco-nomical results, for the worst 25%, the average 50% and the best 25%, respectively.
Todoagro (2007) and Vidal (2009) related the margin (profit) per hectare according to the price paid per liter obtaining determination co-efficients (R2) of 0.0911 and 0.142, respectively. This is 9.11 and 14% of the total of the variance of the profit per hectare is explained by the price variability.
The frequencies of the qualitative variables are shown in Table 3. In general, and with at least 70% of frequency, the producers are from the province of Llanquihue, using dual purpose ge-netics, without certification PABCO A, without automatic cluster removers in the parlors, with-out predipping, but with dipping and drying therapy to the cows.
Table 2. Descriptive statistics of variables in study.
Variables Unit Media Mínimun Máximun CV1 (%)
V1 $ 112,566,196 13,144,026 389,686,126 77
V2 L 598,314 74,091 1,967,567 74
V3 L 599,894 79,028 1,969,027 73
V4 $/L 183.52 131.40 198.05 6.8
V5 % 3.60 3.38 3.86 3.5
V6 % 3.35 3.21 3.50 2.3
V7 SCC2 306,739 133,897 600,460 41
V8 CFU3 23,821 3,935 162,026 130
V9 2.4 1.0 4.5 37
V10 1.07 1.00 1.14 2.9
V11 Ha 106 24 200 43
V12 % 60 22 100 44
V13L·ha-1
5,564 1,331 11,538 50
V14Cows
170 25 350 48
V15L/year
3,330 1,452 7,276 38
V16L/year
4,900 2,293 9,879 34
V17cows·ha-1
1.2 0.3 2.2 41
V18%
69 32 95 22
V19cows/milkman
93 25 175 36
V20L/milkman
314,194 75,551 807,675 561Variation coefficient; 2somatic cell count; 3colony forming units.

CIEnCIA E InVESTIgACIón AgRARIA20
Table 3. Frequencies of qualitative variables1.
Variables Category n° %V21 1 23 79.3
2 6 20.7V22 1 21 72.4
2 8 27.6V23 1 16 55.2
0 13 44.8V24 1 3 10.3
0 26 89.7V25 1 19 65.5
0 10 34.5V26 1 8 27.6
2 12 41.43 2 6.94 7 24.1
V27 1 7 24.10 22 75.9
V28 1 3 10.30 26 89.7
V29 1 13 44.80 16 55.2
V30 1 28 96.60 1 3.4
V31 1 23 79.30 6 20.7
1The meaning of the qualitative variables are showed in the Table 1.
The results of the ACP are shown in Tables 4 and 5. The first factorial plane of the ACP cap-tures 64.6% of the variability present in the sample, that is, the percentage of total variabil-ity accumulated in the two first principal com-ponents reaches 64.6%. Variables V1, V2 and V3 had a correlation of 1.0 and V3 was selected as a representation of all of them. The qualita-tive variable locations (province), certification PABCO A, adhered to the official dairy control, teat drying use and dipping and drying therapy did not have a statistical significance with any of the active variables (Table 5).
Todoagro (2007) and Vidal (2009) indicated that the variable productions per hectare (liters of milk /ha), production by mass cow and ani-mal load (animal units /ha) explain, in different magnitudes, the analyzed profit per hectare of the milk exploitation. In this context, the associ-ations of different variables with V13 (milk pro-duction / surface), V15 (production mass cow) and V17 (animal load) were studied in the pres-ent work. Vidal (2009) obtained a R2 for milk production / surface, mass cow production, and animal load with net profitability per hectare of 0.18, 0.09 and 0.15, respectively for 2008.
Table 4. Principal components analysis: active variables correlation matrix.
Variables V3 V7 V8 V9 V11 V12 V13 V14 V15 V16 V17 V18 V19 V20
V3 1.01 -0.3 -0.3 -0.3 0.7 0.2 0.7 0.8 0.8 0.4 0.5 0.6 0.6 0.9
V7 1.0 0.3 0.5 -0.3 0.0 -0.2 -0.3 -0.3 -0.2 -0.2 -0.4 -0.3 -0.4
V8 1.0 0.4 -0.2 0.1 -0.3 -0.1 -0.5 -0.4 -0.2 -0.4 0.2 -0.3
V9 1.0 -0.4 0.2 -0.2 -0.2 -0.3 0.2 -0.3 -0.7 -0.2 -0.4
V11 1.0 0.4 0.1 0.7 0.4 0.0 0.0 0.5 0.6 0.6
V12 1.0 -0.2 0.0 0.2 0.3 -0.4 0.0 -0.1 0.1
V13 1.0 0.5 0.8 0.5 0.8 0.5 0.2 0.7
V14 1.0 0.4 0.0 0.6 0.6 0.8 0.7
V15 1.0 0.7 0.3 0.5 0.1 0.8
V16 1.0 -0.1 -0.1 -0.3 0.4
V17 1.0 0.7 0.5 0.5
V18 1.0 0.5 0.7
V19 1.0 0.7
V20 1.0
1The values in bold are different from 0 with a significance level alpha = 0.05.

21VOLUME 38 nº1 JAnUARY - APRIL 2011
The production per ha-1 (V13) correlated posi-tively with V3, V14, V15, V16, V17, V18, V20, V22-2, V26-1, V27-1 and V28-1 and negatively, with V22-1, V27-0 and V28-0 (Tables 4 and 5). It may be noted from the above, the positive ef-fect of fishbone parlor (V26-1) and the use of au-tomatic cluster removers (V27-1) with the milk production ha-1 (V13), based on the negative correlation between V26-1 (fishbone parlor) and V27-1 (use of automatic cluster removers), with the SCC (V7). In general, it may be said that the studied fishbone parlors are medium line type. garcés et al. (2006) estimated a highly signifi-cant correlation among the milking equipment with high milking lines and SCC (r=0.41). They indicated that the high line may have an effect on the SCC by milk reflux from the pipe to the collector, which may cause impacts from the milk drops on the health of the mammary gland.
The production per mass cow (V15) was associ-ated positively with the variables V3, V11, V13, V16, V18, V20, V22-2, V23-1, V26-1, V27-1 and V28-1 and negatively, with V8, V22-1, V23-0,
V26-2 y V28-0 (Tables 4 and 5). It is notewor-thy the mean to high correlation (r=0.4, P≤0.05) of production per mass cow with leucosis-free farm (V23-1).
The animal load (V17) correlated positively with the variables V3, V13, V14, V18, V19, V20, V26-1 and V28-1, and negatively with V12 and V28-0 (Tables 4 and 5). Additionally, it may be noted the non-existent relationship between this variable (V17) and the productions per cow (V15 y V16). Smith et al. (2002) and gonzález (2006) determined a correlation of 0.065 (signif-icant) and 0.097 (non significant) between ani-mal load and production per cow, respectively.
A variable to highlight is the summer / winter relation (V9) and its positive association with SCC (V7), that is, there may be a higher sum-mer-winter relation for higher SCC values. This means, mammary health problems affecting the general status of the cows could cause a de-lay on the reproductive activity. Córdova et al. (2008) mentioned that both clinical mastitis and
Table 5. Principal components analysis: active and additional variables correlation matrix.
Variables V3 V7 V8 V9 V11 V12 V13 V14 V15 V16 V17 V18 V19 V20V21-1 -0.1 0.1 0.0 0.0 -0.2 0.2 -0.1 -0.3 0.0 0.1 -0.2 -0.1 -0.3 -0.1V21-2 0.1 -0.1 0.0 0.0 0.2 -0.2 0.1 0.3 0.0 -0.1 0.2 0.1 0.3 0.1V22-2 0.61 -0.2 -0.1 -0.1 0.4 0.3 0.4 0.5 0.6 0.3 0.2 0.3 0.3 0.6V22-1 -0.6 0.2 0.1 0.1 -0.4 -0.3 -0.4 -0.5 -0.6 -0.3 -0.2 -0.3 -0.3 -0.6V23-1 0.3 -0.3 -0.2 -0.3 0.1 0.1 0.3 0.0 0.4 0.5 0.1 0.1 -0.2 0.2V23-0 -0.3 0.3 0.2 0.3 -0.1 -0.1 -0.3 0.0 -0.4 -0.5 -0.1 -0.1 0.2 -0.2V24-0 0.2 0.1 0.1 -0.2 0.3 0.2 0.0 0.2 0.1 -0.2 -0.1 0.1 0.3 0.3V24-1 -0.2 -0.1 -0.1 0.2 -0.3 -0.2 0.0 -0.2 -0.1 0.2 0.1 -0.1 -0.3 -0.3V25-0 -0.2 -0.1 0.4 0.3 -0.2 0.1 -0.1 -0.2 -0.1 0.1 -0.2 -0.3 -0.1 -0.1V25-1 0.2 0.1 -0.4 -0.3 0.2 -0.1 0.1 0.2 0.1 -0.1 0.2 0.3 0.1 0.1V26-1 0.7 -0.4 -0.2 -0.3 0.5 0.1 0.5 0.6 0.5 0.2 0.4 0.5 0.5 0.7V26-4 -0.2 0.0 -0.1 0.1 -0.2 0.2 -0.1 -0.3 0.0 0.2 -0.2 -0.2 -0.3 -0.2V26-2 -0.3 0.3 0.3 0.3 -0.1 0.0 -0.3 -0.1 -0.4 -0.3 -0.1 -0.3 -0.2 -0.4V26-3 -0.2 0.1 0.0 -0.3 -0.2 -0.4 -0.1 -0.3 0.0 -0.1 -0.1 0.0 0.0 0.0V27-1 0.7 -0.4 -0.2 -0.2 0.5 0.3 0.5 0.5 0.6 0.5 0.1 0.2 0.3 0.6V27-0 -0.7 0.4 0.2 0.2 -0.5 -0.3 -0.5 -0.5 -0.6 -0.5 -0.1 -0.2 -0.3 -0.6V28-1 0.6 0.1 -0.1 -0.1 0.2 0.1 0.7 0.2 0.7 0.4 0.4 0.4 0.0 0.5V28-0 -0.6 -0.1 0.1 0.1 -0.2 -0.1 -0.7 -0.2 -0.7 -0.4 -0.4 -0.4 0.0 -0.5V29-1 -0.1 0.2 0.3 0.2 -0.1 0.0 -0.2 -0.2 0.0 0.1 -0.3 -0.2 -0.2 -0.1V29-0 0.1 -0.2 -0.3 -0.2 0.1 0.0 0.2 0.2 0.0 -0.1 0.3 0.2 0.2 0.1V30-1 -0.1 0.2 0.1 0.2 -0.2 -0.1 0.0 -0.1 -0.1 0.1 -0.1 -0.3 -0.1 -0.2V30-0 0.1 -0.2 -0.1 -0.2 0.2 0.1 0.0 0.1 0.1 -0.1 0.1 0.3 0.1 0.2V31-1 0.2 -0.1 0.0 0.1 0.2 0.2 0.3 0.2 0.3 0.3 0.0 0.0 0.0 0.2V31-0 -0.2 0.1 0.0 -0.1 -0.2 -0.2 -0.3 -0.2 -0.3 -0.3 0.0 0.0 0.0 -0.2
1The values in bold are different from 0 with a significance level alpha = 0.05.

CIEnCIA E InVESTIgACIón AgRARIA22
subclinical mastitis are related to the stress of the milk cow and that association hinders its re-productive performance considerably (Schrick et al., 2001).
The summer-winter relationship is linked to the birth season and the year, as birth takes place late in the spring season, heat (i.e. drought) af-fects milk production negatively. Therefore, in summer months, a slight increase in the SCC along with decreased milk production could take place, which might be explained by a con-centration effect (Saran and Chaffer, 2000).
An additional aspect to be analyzed in the sum-mer / winter relationship (V9) is that as it in-creases, a lower proportion between milk cows and mass cows (V18) will have a lower value (r= -0.7, P≤0.05), due to a probable delay in the re-productive activity of the late birth in spring. Ad-ditionally, an association of -0.3 (non significant) was observed between V9 and V15 (production per mass cow). Smith et al. (2002) and gonzález (2006) determined significant correlations of -0.377 and -0.449, respectively, between the sea-sonability and the production per cow. Pérez et al. (2007) mentioned that earlier births are asso-ciated to higher productive levels because they reach longer and persistent lactation.
The milk cows / mass cow relation (V18) was associated negatively with SCC (V7) and bacte-rial count and (V8), which indicates that there will be more milk cows in relation to the mass cows as there are better indicators of sanitary and hygienic quality of milk. An increase on SCC may determine hasten drying and/or elim-inate cows by low production, which decreases milk cows as a consequence. ng-Kwai-Hang et al. (1984) determined that high SCC are associ-ated to low levels of milk production (r= -0.16). Alt (2005) determined a negative correlation between production by milk cow and SCC (r= -0.35, P=0.047) in the same geographical zone as the zone of the present study. Pedraza et al. (1999) concluded that milk production de-creases in heifers and cows in square mode of -0.77*Range + 0.014 *Range2 and -0.79*Range + 0.092 *Range2 kg day-1, respectively, for each increase range or somatic cells score (from 0 to 9). In regard to the association between the
milk cow / mass cow relationship (V18) and V8 (CFU/ml), any increase in bacterial counts may be an important predisposing factor for higher SCC (the correlation between V7 and V18 is 0.3), which might result on a lower proportion of milk cows / mass cow.
The milk exploitations were classified, deter-mining productive systems with the support of a dendrogram and the graphical representation from the principal component analysis (ACP). It is noteworthy that five groups reached the exist-ing groups to ensure that these types were true and not imposed by the method used.
Once the group typing was obtained and veri-fied, the types of production systems present in the zone under study were described, us-ing classificatory and original variables. Five groups were determined, well differentiated between each other, which are synthetically de-scribed in Tables 6 and 7, and Figures 1, 2 and 3. Pérez (2009c) determined a similar number of productive typologies, but with a lower number of variables (18 quantitative and 7 qualitative).
Productive system 1 (SP1)
They are the milk exploitations which were clearly identified in the dendrogram and the ACP graphical representation, representing only 7% of the farms analyzed (Table 6). This productive system represents the more intensive milk exploitations, which is reflected by a lower summer / winter relation (V9) and a higher milk production / surface, mass cow production, ani-mal load and milk cow / mass cow.
Smith et al. (2002) determined four production systems, the most intensive had averages for animal load of 1.3 UA ha-1, seasonability of 1.63 and productions of 4,790 liters/ cow/ year. Dün-ner (2009) described the characteristics of the best 25% of producers based on the economical analysis, which were: 127 hectares for the dairy sector, 277 mass cows, milk cow/ mass cow re-lation of 84 %, 1,754,347 liters of annual milk production , average sale price of $200/ liter of

23VOLUME 38 nº1 JAnUARY - APRIL 2011
Table 6. Variables averages in productives systems (SP) according to analysis of conglomerates.
Variable Unit SP1 SP2 SP3 SP4 SP5 Total
Producer n° 2 4 6 8 9 29
V1 $ 351,802,981 198,042,714 135,472,562 29,258,504 80,193,275 112,566,196
V2 L 1,789,268 1,035,425 731,384 167,689 433,452 598,314
V3 L 1,790,.728 1,036,885 732,844 169,584 434,912 599,894
V4 $/L 196.46 191.41 185.15 173.46 184.98 183.52
V5 % 3.54 3.62 3.61 3.57 3.62 3.60
V6 % 3.39 3.29 3.31 3.33 3.40 3.35
V7 SCC1 2 62,719 212,711 234,794 354,827 363,529 306,739
V8 CFU2 9,061 12,697 15,265 40,711 22,735 23,821
V9 1.9 2.1 2.3 2.9 2.3 2.4
V10 1.04 1.10 1.09 1.07 1.06 1.07
V11 Ha 170 152 113 72 97 106
V12 % 87 59 64 66 46 60
V13 L·ha-1 10,703 6,900 6,664 2,637 5,697 5,564
V14 cows 276 262 209 79 160 170
V15 L/year 6,628 4,051 3,648 2,293 2,985 3,330
V16 L/year 7,518 4,994 5,399 4,504 4,297 4,900
V17 cw3·ha-1 1.4 1.4 1.3 0.7 1.3 1.2
V18 % 88 82 70 55 70 69
V19 cows/m4 111 131 105 69 86 93
V20 L/m4 731,278 518,442 366,422 147,640 239,418 312,784
1Somatic cell count; 2colony forming units; 3cows; 4milkman.
Table 7. Frequencies (%) qualitative variables according to productive system (SP).
Variables Category SP1 SP2 SP3 SP4 SP5 Total
V21 1 100 75 50 100 78 792 0 25 50 0 22 21
V22 1 0 50 50 100 89 722 100 50 50 0 11 28
V23 1 100 50 67 38 56 550 0 50 33 63 44 45
V24 1 0 0 0 13 22 100 100 100 100 88 78 90
V25 1 50 100 67 50 67 660 50 0 33 50 33 34
V26 1 100 75 50 0 0 282 0 0 50 50 56 413 0 0 0 0 11 34 0 25 0 50 33 28
V27 1 100 50 50 0 0 240 0 50 50 100 100 76
V28 1 100 0 0 0 11 100 0 100 100 100 89 90
V29 1 100 25 0 63 56 450 0 75 100 38 44 55
V30 1 100 75 100 100 100 30 0 25 0 0 0 97
V31 1 100 75 83 50 100 790 0 25 17 50 0 21

CIEnCIA E InVESTIgACIón AgRARIA24
milk (US$ 0.32, by December 2008), animal load of 2.5 UA ha-1, 6,193 liters of production per mass cow, 1.3 of summer winter relation and production of 15,192 liters ha-1.
The farms working with this system (SP1) pre-sented the highest economic incomes obtaining the best prices per liter of milk paid to the pro-ducer, supported by the reception volumes of milk in plant, optimal parameters of SCC and CFU, and because they are farms free from bru-cellosis, tuberculosis and leucosis.
In regard to the qualitative variables, the farms grouped in SP1 used genetics special-ized in milk production (V22-2), they had fishbone parlors (V26-1) with automatic clus-ter removers (V27-1) and carried out predip-ping (V28-1). According to what was previ-ously expressed, variables V26-1 and V27-1 presented negative correlations with SCC (V7), which is coherent with milk sanitary and hygienic quality.
Productive system 2 (SP2)
The farms included in this system represented 14% of the total of farms studied, they are semi-intensive, with lower levels of V13, V15 and V18 and higher of V9 (cows / milkman), when they are compared with the farms in SP1. The lower milk production ha-1 and per mass cow may be explained because these farms have a season-ability of 2.1 (V9), 50% of the milk livestock are composed of double purpose races (V22-1), 75% have fishbone parlors (V26-1) with auto-matic cluster removers (V27-1). They presented
values of milk quality (V7 and V8) with which they achieved the maximum bonus level ac-cording to the payment patterns of the dairy plants in the zone. Additionally, they had a cow per milkman relation (V19) superior to 109 and inferior to 131, and 204 cows per milkman de-scribed for Chile, new Zealand and Australia, respectively (Carter and Vidal, 2009).
Productive system 3 (SP3)
This includes 20% of the exploitations ana-lyzed. They represent average values of the dif-ferent quantitative variables, close to the mean of the total of farms under study. They outstand by having a good compositional quality (V5, V6), and milk sanitary and hygienic quality (V7 and V8). They have the challenge of improving milk production per mass cow and the propor-tion of milk cows / mass cow.
Productive system 4 (SP4)
These are the smallest and more extensive milk farms due to their higher summer / winter re-lation (V9) with lower values of the technical parameters V13, V15, V17, V18, V19 and V20, and they present regular indicators of milk qual-ity (V7 and V8). These farms represent 28% of the dairy exploitations studied. From the total of dairy farms (in this group 8), 25% have a sea-sonability higher than 3.6, 25% do not exceed 1,915 liters of production mass cow and 75% have a milk cow / mass cow proportion of up to 64% (Figures 1, 2 and 3). All the above may ex-plain that they are the operations obtaining the
Table 8. Analysis of variance for statistical models (Probability > F).
Dependent variable Model R2 1 Month SP2 Month-SP
Fat <0.0001 0.41 <0.0001 0.0193 0.9988
Protein <0.0001 0.39 <0.0001 <0.0001 0.6802
SCC3 0.0003 0.29 0.4420 <0.0001 1.0
CFU4 0.8642 0.14 0.2439 0.0763 0.9632
1Determination coefficient; 2productive system; 3somatic cell count; 4colony forming units.

25VOLUME 38 nº1 JAnUARY - APRIL 2011
lowest purchase prices of milk paid to the pro-ducer, which are possibly the most vulnerable to pessimistic scenarios of the markets.
Smith et al. (2002) determined that the most extensive system an average animal load of 0.57 UA ha-1, a seasonability of 3.53 and a production per cow of 1,016 liters / cow / year. Dünner (2009) detailed in an economic study the characteristics of 25% of deficient produc-ers. They had a milking surface of 149 hect-ares, 243 mass cows, a milk cow / mass cow relation of 81 %, 1,373,697 liters of annual milk, an average price of $191 / liter of milk, a load of 1.8 UA ha-1, 5,066 liters of mass cow production, a summer winter relation of 1.5, and a production per hectare of 9,263 liters.
The farms in SP4 had double purpose cattle (V22-1). They are the least technified dairy sys-tems, as only 50% had modified fishbone par-lors (V26-2) and the other 50% classic parallel (V26-4). Additionally, they did not have auto-matic cluster removers.
Productive system 5 (SP5)
They represent the group of higher representation with 36% of the productive systems examined. The producers of this group had the best indicators of compositional quality (V5 and V6), but high values of SCC (V7). 25% of the dairies farms of this group did not exceed a mass cow production of 2,633 liters a year (Figure 2) and with a milk cows / mass cow relation of only 62 % (Figure 3).
5,980
3,541
2,836
1,915
2,633 2,422
0,000
1,000
2,000
3,000
4,000
5,000
6,000
7,000
8,000
1234 5T otal
Q1
Median
Q3
Mas
s m
ilk c
ow y
ield
(L/y
ear
)
Figure 2. Position statistics for the production cow mass (L/year) according to productive system (labeled data indicate Q1).
90 89
78
64
81 81
0
10
20
30
40
50
60
70
80
90
100
1 2 3 4 5 Total
Milk
cow
/mas
s co
w (
%)
Productive system
Q1
Median
Q3
Figure 3. Position statistics for the milk cow/mass cow (%) according to productive system (labeled data indicate Q3).
Milk quality
The results of the analysis of variance for the dif-ferent dependent variables are shown in Table 8, according to the statistical model implemented. The fat models, protein and SCC had a high sig-nificance. The productive system (SP) had a re-markable effect on the protein percentage, SCC and fat percentage and a tendency with CFU. The seasonability (month of the year) also af-fects fat and protein percentages.
The Least Square Means for the different depen-dent variables under study are shown in Table 9, according to the productive system. Only the means showing statistical differences are ana-lyzed below. In percentage of fat, the farms in SP1 showed values lower than the farms in SP3 and SP5, which may be explained by the higher production per mass cow of SP1. The increased volume of milk per animal normally entails di-minished total solids, even though the total kilos of protein and fat may be superior at the end of
2.42.7
3
3.6
2.5
3
0.0
0.5
1.0
1.5
2.0
2.5
3.0
3.5
4.0
1 2 3 4 5 Total
Rela
tions
hip
sum
mer
win
ter
Productive system
Q1
Median
Q3
Figure 1. Position statistics for the seasonality according to productive system (labeled data indicate Q3).

CIEnCIA E InVESTIgACIón AgRARIA26
lactation, if it is compared to lower production cows, with more concentrated milk. It may be also due to the genetics used, as the group in SP1 has genetics specialized on milk produc-tion (Table 7). Montaldo et al. (2009) mention fat values (%) for Holstein of 3.63% and 3.66% in Overo Colorado.
In regard to protein, the farms in SP1 and SP5 had higher levels than farms SP2 and SP3. The higher percentage of protein from milk plants in SP5 may be related to the genotypes used. Montaldo et al. (2009) indicated protein values for Holstein and Overo Colorado of 3.23% and 3.31%, respectively.
The highest variances among the different pro-ductive systems studied appear in milk sanitary quality (SCC). The farms in SP1, SP2 and SP3 had a better status of mammary health than the farms in SP4 and SP5, which may explain, among other reasons, the low productive levels for SP4 and SP5. Pérez (2009) studied similar productive systems in three seasons and deter-mined significant differences in the SCC and the bacterial counts from farms classified as SP1, in comparison to the farms in SP4 and SP5. That is, farms with more intensive productive sys-tems might have more effective routine milking procedures and cleaning equipment than milk systems with minor animal load. Remarkable control measures are: hygiene during milk-ing, teat disinfection (dipping), drying therapy, milking equipment functioning, elimination of chronic cases, control of purchased cows and heifers and nutrition of dry and lactating cows. Only 50% of the producers in the farms from system SP4 used drying therapy (Table 7).
The dynamics of the dependent variables studied according to the season of the year are shown in Table 10. It may be observed that the highest fat values would appear from March to July, with statistical significance and with a mean value of determination coefficient (R2=0.41). Calvache et al. (2009) determined that the fat percent-ages are higher in June in different regions of Chile: Valparaíso and the Metropolitan Region, 3.7%; Bío Bío, Maule and O’Higgins, 3.9%; Araucanía, Los Ríos and Los Lagos, 4.0%. In a three-year study with Holstein cattle in the United States, the highest levels in fat occurred in the fall and winter seasons (Wattiaux, 2008). ng-Kwai-Hang et al. (1984), Buxadé (1996) and Sargeant et al. (1998) mentioned that the season of the year affects milk composition, especially the fat content: the percentages in fat increase in periods of short days (fall).
The lowest fat contents occurred in October, which is coherent with data by Calvache et al. (2009). Wattiaux (2008) indicated that the di-minished milk fat may be explained by a low proportion of the acetate: propionate relation in the rumen, attributed to a higher amount of propionate. This amount is directly related to the higher contributions of non structural car-bohydrates recorded in spring in permanent prairies under pasture. It may be also associ-ated to a deficit of neutral detergent fiber in the ration of shepherding systems, which affects the acetate ruminal production negatively.
October seems to be critical by the dramatically decreased fat percentage and an increased pro-tein percentage, which determines an inverse relation between them, even with values lower
Table 9. Least Squares Means for fat, protein, Somatic cell count (SCC) and Colony forming units (CFU) according productive system (SP).
Productive system (SP) Fat (%) Protein (%) SCC1 CFU2
SP1 3.56 a3 3.38 a3 273,233 a3 9,995 a3
SP2 3.62 ab 3.26 b 219,475 a 12,927 a
SP3 3.66 b 3.31 bc 237,697 a 16,229 a
SP4 3.62 ab 3.34 ac 370,126 b 39,694 a
SP5 3.65 b 3.41 a 368,304 b 23,436 a1Somatic cell count. 2Colony forming units.3Different letters in each column indicate significant differences according to Tukey-Kramer test (P≤0.05).

27VOLUME 38 nº1 JAnUARY - APRIL 2011
than 1 (0.99 in October, Table 10). The maxi-mum value observed was 1.16 (March). Wat-tiaux (2008) indicated minimum values of 1.20, 1.28 and 1.20 and maximum values of 1.31, 1.36 and 1.39 for the races Pardo Suizo, Jersey and Holstein, respectively.
According to the above, we may conclude that the price per liter paid to the producer is not a variable which differentiates the production systems. A positive effect was obtained from fishbone parlor and the use of automatic cluster removers with the milk production ha-1, which may be explained by the negative correlation presented by these variables with the count of somatic cells. A higher summer-winter re-lation was associated to a smaller proportion
Table 10. Least Squares Means for fat, protein, SCC and CFU according to month in the year.
Month Fat (%) Protein (%) Mg/PT1 SCC2 CFU3
January 3.58 3.32 1.08 306,386 26,688
February 3.64 3.30 1.10 314,330 34,438
March 3.87* 3.35 1.16 309,595 11,637
April 3.82* 3.38* 1.13 297,881 12,189
May 3.71* 3.38* 1.10 292,097 15,213
June 3.66 3.34 1.10 289,477 14,886
July 3.70 * 3.28 1.13 296,651 20,000
August 3.56 3.27 1.09 307,625 23,316
September 3.46 3.33 1.04 320,485 47,736
October 3.40** 3.43* 0.99 252,866 9,203
november 3.49 3.43* 1.02 245,027 12,377
December 3.55 3.29 1.08 292,784 17,790
*=P≤0.05; **=P≤0.08: statistics tendency. 1Fat/protein. 2Somatic cell count. 3Colony forming units.
milk cows and mass cows and higher values of SCC and CFU. The production systems may be differentiated, among other indicators, by the animal load and by milk production ha-1. 28% of the producers studied (SP4) presented defi-cient production parameters, like low animal loads, milk production per hectare and mass cow production. In regard to milk quality, it may be concluded that the more intensive pro-duction systems presented lower values in fat (%) and protein (%) but showing superiority in the sanitary milk quality (SCC) than the most extensive exploitations. An increase of protein content (%) occurs from winter to spring, asso-ciated with a decreased fat percentage, which determines an inverse relation between both variables.
Resumen
J. A. Pérez. 2011. Sistemas productivos, parámetros técnicos y calidad de leche bovina de productores del sur de Chile. Cien. Inv. Agr. 38(1): 15-29. Se procesó información productiva de 29 productores de leche de la zona sur de Chile, con el fin de tipificar y caracterizar diferentes sistemas productivos lecheros, evaluar las asociaciones entre las variables cuantitativas y cualitativas estudiadas y analizar el efecto del sistema productivo y mes del año en la calidad de leche. La tipificación de grupos productivos se fundamentó en la aplicación de la técnica multivariable exploratoria análisis de componentes principales y análisis de conglomerados o cluster. El modelo estadístico aplicado fue: yijk = µ + Mi + SPj + MSPij + eijk, donde yijk=variables

CIEnCIA E InVESTIgACIón AgRARIA28
dependientes (materia grasa, proteína, recuento de células somáticas, y unidades formadoras de colonias); µ=promedio general; Mi= efecto del i-ésimo mes; SPj=efecto del j-ésimo sistema productivo; MSPij=interacción mes-sistema productivo; eijk=efecto residual aleatorio. El precio de litro de leche pagado a productor se descartó para la construcción de grupos, por presentar un bajo poder discriminatorio dado un coeficiente de variación menor a un 20%. Se explican las diferentes correlaciones entre las variables analizadas. Se describen cinco sistemas productivos haciendo uso de las variables clasificatorias y originales. En general, los sistemas productivos más intensivos presentaron menores valores en materia grasa (%) y proteína (%), pero mostraron una superioridad en calidad sanitaria de leche que las explotaciones lecheras más extensivas. Respecto a la época del año, de invierno a primavera se produce un aumento de la proteína (%) asociado a una disminución de la materia grasa (%) lo que determina una relación inversa entre ambas variables.
Palabras clave: análisis de componentes principales, análisis de conglomerados, análisis multivariable, porcentaje de materia grasa, porcentaje de proteína, recuento de células somáticas, unidades formadoras de colonias.
References
Alt, A. 2005. Análisis técnico económico de sistemas de producción de leche en base a la raza Overo Colorado en la Xª Región. Tesis para optar al título de Médico Veterinario. Facultad de Cien-cias Veterinarias, Universidad Austral de Chile, Valdivia, Chile, 23 pp.
Bolaños, O. 1999. Caracterización y tipificación de organizaciones de productores y productoras. XI Congreso nacional Agronómico/ I Congreso na-cional de Extensión. Costa Rica. 31 pp.
Buxadé, C. 1996. Producción vacuna de leche y carne. Ediciones Mundi-Prensa, Madrid, España, 1996, 89 pp.
Calvache, I., X. Valderrama, and R. Anrique. 2009. Variación en la concentración de grasa y pro-teína láctea en rebaños lecheros del centro y sur de Chile. XXXIV Reunión Anual de la Sociedad Chilena de Producción Animal, Pucón, Chile (Resumen). p. 237.
Carter, L., and R. Vidal. 2009. Características y productividad del recurso humano en lecherías chilenas. XXXIV Reunión Anual de la Sociedad Chilena de Producción Animal, Pucón, Chile (Resumen). p. 233.
CER Los Lagos. 2008. Estudio estructuras de precios y costos productores lecheros CER 2008. Avail-able online at: www.cerloslagos.cl (Website ac-cessed March 3, 2009).
Córdova, A., C. Córdova, M. Córdova, J. Saltijeral, C. Ruiz, V. Xolalpa, S. Cortés, and J. guerra. 2008. Efecto de la mastitis y el estrés sobre la re-producción de la vaca. Rev. Vet. 19 (2): 161-166.
Coronel, M., and S. Ortuño. 2005. Tipificación de los sistemas productivos agropecuarios en el área de riego de Santiago del Estero, Argentina. Prob-lemas del desarrollo. Revista latinoamericana de economía 36 (140): 63-88.
Dohoo, I. ,and A. Meek. 1982. Somatic cell counts in bovine milk. Can. Vet. J. 23: 119-125.
Dünner, R. 2009. Avances en la gestión económica de predios lecheros. XI Jornadas Chilenas de Buiatría, Osorno, Chile (Resumen). p. 27.
Fundación Chile. 2007. Manual de metodologías. gestión técnico económica en bovino de leche. Available online at: www.agrogestion.com (Website accessed July 1, 2008).
garcés, R., J. López, and R. Bruckmaier. 2006. Milk-ing machines on Chilean dairy farms and their ef-fects on somatic cell count and milk yield: a field study. Agricultura Técnica 66 (1): 31-40.
González, J. 2006. Caracterización y tipificación de sistemas productivos de leche en la Décima Región de Chile: un análisis multivariable. Tesis para optar al grado de Licenciado en Ingeniería en Alimentos, Universidad Austral de Chile, Valdivia, Chile.
Lores, A., A. Leyva, and M. Varela. 2008. Los do-minios de recomendaciones: establecimiento e importancia para el análisis científico de los agrosistemas. Cultivos tropicales 29 (3): 5-10.

29VOLUME 38 nº1 JAnUARY - APRIL 2011
Montaldo, H., C. Lizana, and C. Trejo. 2009. Pará-metros genéticos para características de produc-ción y composición de la leche, en poblaciones Holstein/Frisón y Overo Colorado en Chile. XI Jornadas Chilenas de Buiatría, Osorno, Chile (Resumen). p. 124.
Ng-Kwai-Hang, K., J. Hayes, J. Moxley, and H. Mo-nardes. 1984. Variability of test-day production and relation of somatic cell counts with yield and compositional changes of bovine milk. J. Dairy Sci. 67: 361-366.
Ozreng, E., and Selcuk, S. 2008. The effect of sea-sonal variation on the composition of cow milk in Van Province. Pakistan Journal of nutrition 7 (1): 161-164.
Pedraza, C., A. Mansilla, P. Fajardo, and H. Agüero. 1999. Cambios en la producción y composición láctea por efecto del incremento de células somáticas en leche de vacas. Agricultura Técnica 60 (3): 251-258.
Pérez, L., R. Anrique, and H. gonzález. 2007. Fac-tores no genéticos que afectan la producción y composición de leche en un rebaño de pari-ciones biestacionales en la Décima Región de Los Lagos, Chile. Agricultura Técnica 67 (1): 39-48.
Pérez, J. 2009a. Evaluación económica de siste-mas bovinos lecheros. XI Jornadas Chilenas de Buiatría, Osorno, Chile (Resumen). p. 122.
Pérez, J. 2009b. Efecto del sistema productivo y mes del año en la calidad composicional, sanitaria e higiénica de leche bovina. XXXIV Reunión An-ual de la Sociedad Chilena de Producción Ani-mal, Pucón, Chile (Resumen). p. 197.
Pérez, J. 2009c. Caracterización de sistemas produc-tivos bovinos lecheros en la provincia de Llan-quihue y Osorno, Chile. XXXIV Reunión Anual de la Sociedad Chilena de Producción Animal, Pucón, Chile (Resumen). p. 195.
Quist, M., S. LeBlanc, K. Hand, D. Lazenby, F. Mi-glior, and D. Kelton. 2008. Milking-to-milking
variability for milk yield, fat and protein percent-age, and somatic cell count. J. Dairy Sci. 91 (9): 3412-3423.
Salsberg, A., A. Meek, and S. Martin. 1984. So-matic cell counts: associated factors and rela-tionship to production. Can. J. Comp. Med. 48: 251-257.
Saran, A., and M. Chaffer. 2000. Mastitis y calidad de leche, Ediciones Inter-Médica, Buenos Aires, Argentina, 51 pp.
Sargeant, J., K. Leslie, M. Shoukri, S. Martin, and K. Lissemore. 1998. Trends in milk component production in dairy herds in Ontario: 1985-1994. Can. J. Anim. Sci. 78: 413-420.
Schrick, F., M. Hochett, A. Saxton, M. Lewis, H. Dowlen, and S. Oliver. 2001. Influence of sub-clinical mastitis during early lactation on repro-ductive parameters. J. Dairy Sci. 84 (6): 1407-1412.
Smith, R., V. Moreira, and L. Latrille. 2002. Carac-terización de sistemas productivos lecheros en la X Región de Chile mediante análisis multivari-able. Agricultura Técnica 62 (3): 375-395.
Todoagro. 2007. Resultados 2006 rubro leche. Gestión Agrícola 10: 5-12.
Valerio, D., A. García, R. Acero De La Cruz, A. Castaldo, J. Perea, and J. Martos. 2004. Metodología para la caracterización y tipifi-cación de sistemas ganaderos. Available online at: http://www.uco.es/zootecniaygestion/ (Web-site accessed July 24, 2009).
Vidal, R. 2009. Rentabilidad de los sistemas de pro-ducción de leche: factores que la influencian. Available online at: http://www.simposioproyec-ta.cl/2009/proyecta2009.html (Website accessed July 27, 2009).
Wattiaux, M. 2008. Factores que influencian el por-centaje y la producción de grasa y proteína en leche de vacas lecheras. Available online at: www.wisc.edu/dysci (Website accessed April 21, 2008).