Embed Size (px)
Citation preview

PRODUCTION, PRODUCTIVITY AND MARKET PARTICIPATION OF
SMALLHOLDER COWPEA PRODUCERS IN THE NORTHERN REGION OF GHANA
BY
EBENEZER KONDO
(10599347)
THIS THESIS IS SUBMITTED TO THE UNIVERSITY OF GHANA, LEGON IN
PARTIAL FULFILMENT OF THE REQUIREMENTS FOR THE AWARD OF MASTER
OF PHILOSOPHY DEGREE IN AGRICULTURAL ECONOMICS
DEPARTMENT OF AGRICULTURAL ECONOMICS AND AGRIBUSINESS
SCHOOL OF AGRICULTURE
COLLEGE OF BASIC AND APPLIED SCIENCES
UNIVERSITY OF GHANA
LEGON
JULY, 2018
University of Ghana http://ugspace.ug.edu.gh
i
DECLARATION
I, EBENEZER KONDO, author of this thesis do hereby declare that the work presented in this
thesis titled “PRODUCTION, PRODUCTIVITY AND MARKET PARTICIPATION OF
SMALLHOLDER COWPEA PRODUCERS IN THE NORTHERN REGION OF
GHANA”, was done entirely by me in the Department of Agricultural Economics and
Agribusiness, University of Ghana, Legon except where references of other people’s work was
duly acknowledged. This work has never been presented in part or in whole for any degree in this
University or elsewhere.
…………….………………….. Date………………….........
Ebenezer Kondo
(Student)
This thesis has been submitted for examination with our approval as supervisors.
………………………………… ……………………………
Prof. Daniel Bruce Sarpong Dr. Irene S. Egyir
(Major Supervisor) (Co-Supervisor)
Date……………………………… Date………………….........
University of Ghana http://ugspace.ug.edu.gh

ii
DEDICATION
This thesis is dedicated to my dear wife, Elsie Eleanora Amaki Odonkor and daughter Eliane
Horlali Kondo, who have been inspirational and source of encouragement to me throughout the
course of my studies.
University of Ghana http://ugspace.ug.edu.gh

iii
ACKNOWLEDGEMENTS
First and foremost, I wish to express my sincerest appreciation to the Almighty God for His
sufficient grace and favour throughout the period of writing this thesis. I wish to register my sincere
gratitude and appreciation to my academic supervisors: Prof. Daniel Bruce Sarpong and Dr. Irene
S. Egyir for working assiduously to give shape to this work, through their mentoring, guidance,
necessary comments and suggestions. I am also indebted to all lecturers of the Department of
Agricultural Economics and Agribusiness, University of Ghana for the support and advice offered
towards this work during seminar presentations and also to Prof. Samuel Anim of the Department
of Economics, University of Cape Coast whose advice and input had been very informative, I say
I thank you.
I am grateful to my friend Mr. Alhassan Nuhu Jinbaani of the Savannah Agricultural Research
Institute (SARI) of the Council for Scientific and Industrial Research (CSIR) for providing me
with leads for data collection. I am grateful also to the respective directors of the agricultural
departments in the Tolon, Kumbungu, Mion and Yendi Districts of the Northern Region for their
kind assistance in identification of the major cowpea producing communities in their districts.
Thanks also go to my field enumerators Mr. Haruna A. Yemyoliya, Mr Issaka Sampson David and
Mr. Eric Biney who are all teaching assistants at the University for Development Studies,
Nyankpala Campus. Your meticulous support in the field to collect data from all the communities
in the various districts is well acknowledged. I am also indebted to Mr. Richard Oppong-Adomako
for providing me with free accommodation during my stay in Tamale. Finally, I am grateful to all
who have in diverse ways contributed their quota towards the success of this thesis.
Ebenezer Kondo
University of Ghana http://ugspace.ug.edu.gh

iv
ABSTRACT
This thesis analysed the production, productivity and market participation of smallholder cowpea
producers in the Northern Region of Ghana. It estimated the factors influencing cowpea production
participation, productivity and market participation decisions. A multi-stage random sampling was
employed in selecting four major cowpea producing districts and communities. Purposive and
random sampling techniques were employed to select a sample of 300 respondents comprising of
240 cowpea producers and 60 non-producers from three communities in each district. A semi-
structured questionnaire guided the interviews. The Triple Hurdle Model (THM) functionally
comprising of first hurdle Probit, second hurdle Probit and third hurdle Truncated normal
regressions, was used to estimate the factors that influence cowpea production participation and
market participation decisions. The Instrumental Variable (IV) regression model was employed to
estimate the effect of intensity of market participation on productivity while controlling for
endogeneity. The results revealed that the major determinants of cowpea production and market
participation decisions, which are similar include gender, education, distance to nearest market,
own means of transportation, access to market information, proximity good road network, labour,
tractor services, value of livestock owned, access to improved cowpea seed, and extension
services. Determinants of cowpea land productivity are the proportion of harvest sold, educational
level of farmer, farm size, value of livestock, use of improved seed, access to credit and selling
price of cowpea. Two key recommendations emerge for local government: provision of market
spaces and good road infrastructure in order to reduce transaction costs and maintaining the free
compulsory basic education policy. For research institutions and the private sector, development
of more improved cowpea seed; investing in tractor hiring services and sale of improved cowpea
seed, will boost cowpea productivity and market participation in the Northern Region of Ghana.
University of Ghana http://ugspace.ug.edu.gh
v
TABLE OF CONTENTS
Content Page
DECLARATION i
DEDICATION ii
ACKNOWLEDGEMENTS iii
ABSTRACT iv
TABLE OF CONTENTS v
LIST OF TABLES viii
LIST OF FIGURES ix
LIST OF ACRONYMS x
CHAPTER ONE : INTRODUCTION 1
1.1 Background of the Study 1
1.2 Problem Statement 6
1.3 Objectives of the Study 10
1.4 Justification of the Study 10
1.5 Organisation of the Study 14
CHAPTER TWO: LITERATURE REVIEW 15
2.1 Introduction 15
2.2 Cowpea Production 15
2.2.1 Economic importance of cowpea production 15
2.2.2 Determinants of cowpea production 18
2.3 The Concept of Smallholder Farming 18
2.4 Agricultural Productivity 20
2.4.1 Definitions and concepts of agricultural productivity 20
2.4.2 Measurement of agricultural productivity 22
2.5 Market Participation 23
2.5.1 Concepts and definitions of market participation 24
2.5.2 Measurement of market participation and intensity of participation 26
2.5.3 Determinants of market participation and crop productivity 28
2.6 Methodological Issues in Market Participation and Crop Productivity 34
2.6.1 Linking market participation to productivity: the two-step approach 34
University of Ghana http://ugspace.ug.edu.gh

vi
2.6.2 The triple hurdle model of market participation 39
2.7 Key Conclusion on Literature Review 42
CHAPTER THREE: METHODOLOGY 43
3.1 Introduction 43
3.2 Theoretical Framework 43
3.3 Conceptual Framework 45
3.4 Analytical Framework of Market Participation and Productivity 47
3.5 Methods of Data Analyses 48
3.5.1 Analytical approach of the triple hurdle model (THM) market participation 49
3.5.3 Empirical models for the THM market participation 51
3.5.4 The instrumental variable regression model: 2SLS estimator 52
3.6 The Study Area 59
3.7 Methods of Data Collection 62
3.7.1 Sources and types of data 62
3.7.2 Sample size and sampling approach 63
CHAPTER FOUR: RESULTS AND DISCUSSION 65
4.1 Introduction 65
4.2 Descriptive Statistical Analyses of Farmer and Socio-economic Characteristics 65
4.2.1 Sampled distribution of smallholder cowpea households in the northern region 65
4.2.2 Farmer and socio-economic characteristics of sampled households 66
4.2.3 Distribution and summary statistics of the variables used in the analyses 70
4.2.4 Cowpea productivity and market participation characteristics of households 74
4.2.5 Cowpea productivity level and market participation per sampled district 75
4.2.6 Aggregate productivity and market participation of smallholder producers 78
4.3 Analytical Estimations of Cowpea Production, Productivity and Market Participation 78
4.3.1 Factors influencing smallholder farmers’ decision to produce cowpea 82
4.3.3 Factors influencing cowpea market participation and intensity of participation 86
4.3.3 The effect of intensity of market participation on productivity 92
University of Ghana http://ugspace.ug.edu.gh
vii
CHAPTER FIVE: SUMMARY, CONCLUSIONS AND RECOMMENDATIONS 98
5.1 Introduction 98
5.2 Summary of the Study 98
5.3 Conclusions of the Study 100
5.4 Recommendations of the Study 101
5.5 Suggestions for Future Research 103
REFERENCES 104
APPENDICES 120
University of Ghana http://ugspace.ug.edu.gh
viii
LIST OF TABLES
Table Page
Table 2.1: Top Five Cowpea Producing Regions in Ghana Averaged for 2013-2015 17
Table 3.1: Description of Dependent and Explanatory Variables used in the Analyses 54
Table 3.2: Sampled Districts, Communities and Sample Size 64
Table 4.1: Production and Market Participation Behaviour of Smallholder Farmers 66
Table 4.2: Farmer and Socio-economic Characteristics of Surveyed Households 68
Table 4.2: Farmer and Socio-economic Characteristics of Surveyed Households cont’d 69
Table 4.3: Description of Explanatory Continuous Variables used in Analyses 73
Table 4.4: Description of Explanatory Binary Variables used in the Analyses 74
Table 4.5: Gross Value of Cowpea Produced per Hectare by each Sampled District 75
Table 4.6: Cowpea Productivity and Proportion of Output Sold per Sampled District 77
Table 4.7: Chi-Square Test of Differences in Levels of Proportion of Output Sold 77
Table 4.8: Triple Hurdle Model (THM) Estimates of Cowpea Production, Market Participation
and Intensity of Market Participation 81
Table 4.8: Triple Hurdle Model (THM) Estimates of Cowpea Production, Market Participation
and Intensity of Market Participation cont’d 82
Table 4.9: Instrumental Variable Regression Estimates of Productivity with Endogenous
Intensity of Participation 95
Table 4.9: Instrumental Variable Regression Estimates of Productivity with Endogenous
Intensity of Participation cont’d 96
University of Ghana http://ugspace.ug.edu.gh
ix
LIST OF FIGURES
Figure Page
Figure 2.1: Cowpea Production Index of Ghana from 2006-2015 17
Figure 3.1: Conceptual Framework of Market Participation and Productivity 46
Figure 3.2: Analytical Framework of Market Participation and Productivity 47
Figure 3.3: Graphical Representation of the THM Market Participation 51
Figure 3.4: Map of the Study Area Showing Sampled Districts and Communities 62
Figure 4.1: Productivity Level and Proportion of Output Sold per Sampled District 76
University of Ghana http://ugspace.ug.edu.gh

x
LIST OF ACRONYMS
AATF African Agricultural Technology Foundation
ACET African Centre for Economic Transformation
AGRA Alliance for Green Revolution Africa
CAADP Comprehensive Africa Agriculture Development Programme
CERSGIS Centre for Remote Sensing and Geographic Information Services
CMP Cowpea Market Participation
CPP Cowpea Production Participation
CRI Crop Research Institute
CSIR Council for Scientific and Industrial Research
DHM Double Hurdle Model
ESRM Endogenous Switching Regression Model
FAO Food and Agriculture Organisation
FASDEP Food and Agriculture Sector Development Policy
FIML Full Information Maximum Likelihood Estimation
GCAP Ghana Commercial Agriculture Project
GLSS Ghana Living Standards Survey
GSGDA Ghana Shared Growth and Development Agenda
GSS Ghana Statistical Service
GSSP Ghana Strategy Support Programme
ICT Information Communication Technology
IFAD International Fund for Agricultural Development
IFPRI International Food Policy Research Institute
IITA International Institute of Tropical Agriculture
IMR Inverse Mills Ratio
IV Instrumental Variable
METASIP Medium Term Agriculture Sector Investment Plan
MoFA Ministry of Food and Agriculture
NGOs Non-Governmental Organsations
University of Ghana http://ugspace.ug.edu.gh
xi
OLS Ordinary Least Squares
PFJ Planting for Food and Jobs
PSIA Poverty and Social Impact Analysis
SARI Savannah Agricultural Research Institute
SPSS Statistical Package for Software System
SRID Statistics, Research and Information Directorate
SSA Sub-Saharan Africa
TC Transaction Cost
THM Triple Hurdle Model
2SLS Two Stage Least Squares
UN United Nations
VIF Variance Inflation Factor
WACCI West African Centre for Crop Improvement
University of Ghana http://ugspace.ug.edu.gh

1
CHAPTER ONE
INTRODUCTION
1.1 Background of the Study
Agricultural transformation worldwide has mostly become a significant component and the easiest
path to industrialisation and economic transformation (ACET, 2017; AGRA, 2016; Timmer, 2007,
1988). This agricultural transformation process is often characterised by better economic activities
with the resultant commercialisation by farmers (AGRA, 2016). Sub-Saharan African nations such
as Ghana, Nigeria, Malawi and Rwanda have all experienced accelerated agricultural growth
(Minde et al. 2008; Otsuka, 2016; Riddell & Westlake, 2006; Takeshima, 2010). Many African
countries are therefore beginning to look at agriculture through a transformational perspective,
hence prioritising the sector in their economic planning. A United Nations report indicates that
Sub-Saharan Africa’s (SSA) estimated population was 12.3 percent of the global figure in 2015,
and is anticipated to represent 21.7 percent in 2050 and further 34.0 percent in 2100 (UN, 2016).
However such fast population growth, particularly in rural communities is expected to adversely
impact agricultural transformation on the African continent in diverse ways. This increased growth
in population will also put mounting stress on African food systems to feed its burgeoning
population. Secondly, values of land and land markets development, especially in areas of
favourable market access is anticipated to rise, as land is sought for purposes other than agriculture
particularly for housing and other non-agricultural uses. Thirdly, as land resource becomes more
inhabited, land inheritance by young people for agricultural purposes becomes practically difficult
resulting in out-migration, demographic and labour market shifts that are already prevalent in
relatively densely populated areas in Africa (AGRA, 2016).
University of Ghana http://ugspace.ug.edu.gh
2
The transition of smallholder agriculture from subsistence to market-orientation has gained
prominence in the fields of development and agricultural economics over the last couple of years
(Hu & Rahman, 2015; Kem, 2017). The global understanding of this conversion from subsistence-
based agriculture to market-oriented agricultural production is of paramount significance. This
emanates from the fact that it enhances the livelihoods of agriculture dependent households in
developing countries (Wickramasinghe & Weinberger, 2013). Subsistence-based agriculture is
characterised by low productivity and food self-sufficiency and market-oriented agricultural
production is characterised by high productivity marketing surplus.
The contemporary Ghanaian agricultural policy space is anchored on four broad thematic pillars.
Firstly, improved seed production and promotion aimed at promoting domestic food production,
achieving food and nutrition security and improved income for farmers to curb growing
expenditure on food imports. Secondly, increased fertiliser usage to ensure high productivity in
the agricultural sector for sustainable job creation and increased food security. Thirdly, the
promotion and strengthening of market linkages to develop a well-structured market for
agricultural produce to improve income of smallholder farmers. Lastly, improved extension
services to deliver effective and efficient extension services to smallholder farmers to facilitate
food crop production (MoFA, 2017).
Successive governments have thus over the years, with the support of multiple NGOs, launched
various projects that stimulate agribusiness agendas and link farmers to markets ((Akpalu et al.
2015; Abdulai & Huffman, 2000; MoFA, 2011). Total factor productivity and annual growth in
agricultural value addition in Ghana from 2005-2012, was estimated to be around 3.56% and
1.44% respectively with reported poverty trends also declining gradually (AGRA, 2016; World
University of Ghana http://ugspace.ug.edu.gh
3
Bank, 2015). Therefore, in order to sustain and bolster these marginal gains achieved in the
agricultural sector, the country developed the Food and Agricultural Sector Development
Programme (FASDEP II) as a policy framework to engender more accelerated economic growth.
This policy framework envisions the agricultural sector to spur economic growth led by the private
sector that ensures increased productivity, and employment opportunities to reduce poverty (Abu,
et al. 2016; MoFA, 2007).
Ghana’s agriculture is smallholder dominated, with these farmers dwelling predominantly in rural
communities, and close to 90% of their land holdings are less than 2 hectares in size and they are
also resource poor (MoFA, 2011). Both regional and local agricultural policy frameworks and
agricultural strategies such as Comprehensive African Agricultural Development Programme
(CAADP), Food and Agriculture Sector Development Policy (FASDEP) and the Medium Term
Agriculture Sector Investment Plan (METASIP) have been accented to and developed by the
government of Ghana. The major objective of these policies are geared towards increased
productivity and smooth participation in the market by smallholder farmers to ensure food security.
The current flagship programme of government as far as agriculture is concerned is the “Planting
for Food and Jobs (PFJ)” programme. The programme aims at targeting interventions that dovetail
into a transformative goal of increasing the market orientation of the smallholder farming sector.
The programme is therefore designed to provide farmers with marketing support and inputs,
including high yielding seed varieties and targeting better transportation infrastructure in crop
growing areas.
Market participation as defined by Barrett (2008), indicates how farm households undertake the
production of goods and services for auto consumption or specialise in producing those goods in
University of Ghana http://ugspace.ug.edu.gh

4
which they have a comparative advantage in producing. These farmers consume some and sell the
excess for other goods and services that they desire but possess no such comparative advantage in
producing. The implication, therefore, is that participation in the market place is connected with
increased levels of productivity and food security (Asfaw et al. 2011; Barrett, 2008; World Bank,
2007).
In general, arguments for why participation in the market by smallholder farmers is essential to
improving household productivity and wellbeing of rural dwellers have been compartmentalised
into two (Barrett, 2008). The first is that, it gives farmers the leverage to concentrate on producing
goods in which they are experienced in producing, and trading the generated surplus for other
desirable goods and services for which they possesses no such comparative advantage. The other
argument is that, it enables them capture greater economies of scale and technology adoption
which, collectively, leads to a more rapid total factor productivity growth (Asfaw et al. 2012;
Barrett, 2008). Improving access to markets for smallholder farm households is a potential
pathway to enhancing their productivity levels.
Several studies conducted by authors such as Al-Hassan et al. (2006), Demeke & Haji (2014), Jari
& Fraser (2009), Omiti et al. (2009), Siziba et al. (2011) and Zamasiya et al. (2014) reported
higher earnings and chances of reducing extreme hunger, sustainable livelihoods, creation of the
necessary demand and gaining of better prices. Market participation again contributes to expanded
production, increased diversification in farming activities as well as adoption of modern
productivity enhancing technologies.
Contextualising the situation for the Northern Region of Ghana, the region has been identified as
one of the poorly endowed regions and the per capita income of the people fall far below the
University of Ghana http://ugspace.ug.edu.gh

5
national average (Marchetta, 2011). IFAD-IFPRI (2011) and Yirzagla et al. (2016) identify factors
such as land holding size, fewer marketed crops and location for the variation in market
participation rates and crop production in Ghana. They further argued that production and market
participation in some selected commodities such as cowpea by smallholder farmers tends to be
lowest in Northern Region of Ghana. The Northern Region is an agrarian region. However, it does
not have adequate market infrastructure, when compared to Greater Accra and Ashanti Regions.
Participation in food crop production is the dominant agricultural activity in the region accounting
for 70%-85% of agricultural output.
Cowpea production according to Langyintuo et al. (2003) and MoFA (2010), is the second most
important food legume crop grown in the region after groundnut, providing food security for many
households. Consumption of cowpea is higher than production in Ghana as evidenced in the
importation of the grain to augment local consumption (Franke & de Wolf, 2011; Langyintuo et
al. 2003). The total area under cultivation in Ghana currently stands at 163,000 hectares with the
Northern Region in particular leading the pack with about 46% of the total area under cultivation
in the country (MoFA-SRID, 2016). The region has total rural households of 212, 048 representing
90% of households involved in agriculture and smallholder farming, placing second to the Upper
East Region which has 93% of rural households involved in agriculture (MoFA-SRID, 2016).
According to GSS (2014), an estimated number of 362,333 households harvested the crop with
44% of these households selling the produce, thereby obtaining an annual harvest and sales values
of GHS105, 004.08 and GHS43,213.59 respectively of cowpea. Most parts of Ghana’s rural
households participating in an integrated agricultural markets are hampered by high transaction
cost and other external factors. This is a disincentive for commercialisation and technology
adoption by smallholder farmers.
University of Ghana http://ugspace.ug.edu.gh
6
1.2 Problem Statement
For economic growth in Africa, particularly in Ghana and other Africa countries, to be inclusive
and sustainable, there is the need to develop and increase the involvement of smallholder farmers
in the wider economy. Smallholder farming is undoubtedly the largest contributor to household
food security and nutrition needs of majority of the populace of these countries (Senbet, 2017).
The challenge therefore of feeding this population is not new, but recent agricultural innovations
and practices have underscored the fact of low productivity. Thus, productive agricultural practices
of smallholder farmers are cardinal in improving food and nutrition security needs and poverty
reduction in Ghana. However, these smallholder farmers are faced with markets that are imperfect
and high costs of transaction that considerably reduce their incentives for market participation.
This supply side constraint detract from their productivity and by extension their market
participation activities (Senbet, 2017). The challenge of market participation also arises as a result
of poor and inadequate infrastructure. The high transaction costs coupled with location, as well as
farmer specific attributes are also contributory factors to this low productivity and market
participation.
For many smallholder rural farming communities in Ghana and mostly in the Northern Region,
smallholder farmers lack the resources to help them overcome the cost outlays of entering the
market, such as assets and market information access (Novignon et al. 2017; Uchezuba et al.
2009). Barrett (2008) further posited that accumulation of private assets, availability of publicly
provided infrastructure and services are the preconditions to enable smallholder farmers transform
from being subsistence producers to higher marketable surplus producers. In this regard,
agricultural commercialisation in Africa, particularly in Ghana, necessitates the need for
University of Ghana http://ugspace.ug.edu.gh
7
smallholder farmers to improve, in order for them to produce enough marketable surplus and
participate in markets. Recent Ghana government policies such as the Ghana Shared Growth and
Development Agenda (GSGDA) and Food and Agriculture Sector Development Policy (FASDEP
II) lay emphasis on the integration of smallholder farmers to markets. However, deplorable roads
and poor transport systems have remained a key market access constraint (Hollinger & Staaz,
2015). Thus, increasing market participation, rural incomes and food security will require
smallholder cowpea farmers to understand the factors that influence cowpea production,
productivity and market participation.
Cowpea is an important food crop produced and consumed by most households in the Northern
Region. It is the second most important legume crop in terms of production capacity or volume
and area under cultivation after groundnut, but with higher domestic consumption levels than
groundnut. MoFA-SRID (2016) and Yirzagla et al. (2016), report that average farm-level
productivity on farm area basis is minimal, ranging between 0.6 Mt/ha to 1.25 Mt/ha representing
an achieved yield of 50%. These figures reveal that there is the potential for yield to increase to
between 1.2 Mt/ha to 2.5 Mt/ha if the appropriate production and market participation conditions
are available and accessible to these smallholder producers.
Mean annual production growth rates have also witnessed a declining fortune in recent years. From
2004-2009, the estimated mean annual production growth rate averaged over the six-year period
was 3.62%. This six-year growth rate figure however saw a sharp decline from the 2010-2015
production period to -3.77% (MoFA-SRID, 2016). With these low production volume and yield,
smallholder farmers are therefore unable to obtain high marketable surpluses to enable them
participate in the market, take advantage of economies of scale and increase land productivity.
University of Ghana http://ugspace.ug.edu.gh
8
Cowpea is a food security crop in Ghana with many farmers surviving on its production as a
business. Sales from their cowpea harvests enable farmers not to only buy supplemental cereal
grains such as rice (for domestic consumption), for which they may not have a comparative
advantage in producing in their localities, but also fertiliser and other inputs. This contributes to
safeguarding their food security through cowpea production. Household consumption and
marketing (selling) of cowpea harvest are reported at 46% and 40% respectively making it one of
the most widely consumed and traded legumes in the Northern Region ( Franke & de Wolf, 2011;
IFPRI, 2013).
However, smallholder cowpea producers in the Northern Region of Ghana have not been able to
out-scale production and intensified their participation in the market of the commodity which has
a global market share of approximately $1.13-2.81 billion (AATF, 2012) to improve their
livelihoods. This state of affairs has arisen as a result of poor logistical infrastructure rendering the
transportation of agricultural produce difficult leading to increased transaction cost in the
marketing process of cowpea. The resultant effect is that smallholder farmers’ ability to
commercialise and intensify production have been constrained culminating in low productivity
and low incomes by farmers (Abdulai & Huffman, 2000; Akpalu et al. 2015; Langyintuo et al.
2003; World Bank, 2011). That increased market participation decision influences the productivity
level of smallholder farmers in Ghana have not been fully and exhaustively studied and explored.
It is against this backdrop of the uncertain relationship between the production, productivity and
market participation of smallholder cowpea farmers that this study seeks to provide responses to
the following research questions:
University of Ghana http://ugspace.ug.edu.gh
9
1. What factors affect smallholder farmers’ decision to produce cowpea?
2. What factors influence the decision of cowpea farmers to participate in the market?
3. What factors influence the intensity of participation in the cowpea market by smallholder
farmers in the Northern Region?
4. To what extent does the intensity of participation affect the productivity of smallholder
cowpea farmers?
Based on the research questions above, the following broad hypotheses are investigated:
Hypothesis 1: Transaction cost variables influence cowpea production and market participation
decisions of smallholder producers.
Hypothesis 2: Intensity of market participation, measured as proportion of the volume of cowpea
output sold has a positive relationship with cowpea productivity.
University of Ghana http://ugspace.ug.edu.gh

10
1.3 Objectives of the Study
The major objective of the study is to analyse the production, productivity and market participation
of smallholder cowpea producers in the Northern Region of Ghana. The specific objectives are to:
1. Identify and analyse the factors affecting smallholder farmers’ decision to produce cowpea.
2. Identify and analyse the factors influencing cowpea farmers’ decision to participate in the
market.
3. Identify and analyse the factors that influence the intensity of participation in the cowpea
market by smallholder producers in the Northern Region.
4. Determine the effect of intensity of participation on productivity of smallholder cowpea
producers.
1.4 Justification of the Study
Market participation is a precursor to production and the ease of market participation opportunities
also justify smallholder farmers’ investment in agricultural production and productivity enhancing
technologies. This serves as a push factor in propelling smallholders to continue to increase
investments in more productive assets, inputs and farming practices. The absence of this constrain
smallholder farmer’s participation in the market due to price variation, and higher mark-up by
agents with monopsony market power (De Janvry et al. 1991). Subsequently, smallholder farmers,
are bound to be involved in subsistence agriculture and thus incapable to benefit from market
reforms. Subsistence production is often characterised by limited specialisation and elementary
technology, leading to low productivity and lower income. This situation has entrapped
smallholder cowpea farmers, relegating them to the lower levels of production, productivity and
market participation across Ghana and especially among those in the Northern Region of Ghana
University of Ghana http://ugspace.ug.edu.gh
11
(Akpalu et al. 2015). Higher production, productivity and market participation among smallholder
cowpea producers in the Northern Region of Ghana which accounts for nearly 50% of the national
production capacity of cowpea can only thrive in the face of lower agricultural related transaction
costs. These transaction costs such as searching, screening, and enforcement give rise to a
substantially higher smallholder production as well as participating in the agricultural commodity
markets (Tadesse & Shively, 2013). Obtaining reduced transaction costs are also responsible for
the proper integration of geographic markets, and perfect competition within these markets
(Barrett, 2008; Gabre-Madhin, 2001).
Public investment in physical and institutional infrastructures are expected to resolve the problem
of high transaction costs and also stimulate smallholder farmers to participate in the market,
thereby raising net returns to agricultural production (Barrett, 2008; Renkow et al. 2004).
Providing smallholder farmers with guaranteed markets for their farm output would, most likely
reduce distress sales and thus, improve revenue from sales for smallholder cowpea producers in
the Northern Region of Ghana. It has therefore been noted that having access to assured markets
for farm output is considered one of the most effective mechanisms for reducing poverty in
developing countries (Akpalu et al. 2017; 2015; Gelo et al. 2017; IFAD, 2010; 2003).
Barrett et al. (2009) and Lentz & Upton (2015) indicated that market participation is associated
with marketable surplus generation. The implication is that investment in technologies that
promote production and availability of productive assets will induce smallholder cowpea farmers
to participate in cowpea crop production. This will then engender increased productivity among
them and cause them to participate in the market. Additionally, prevailing market conditions can
also influence incentives to increase gross value of output produced and therefore in integrated
University of Ghana http://ugspace.ug.edu.gh

12
markets, the returns to higher volumes of production increase than they do in markets that are
isolated. Following from this, good infrastructure and strong institutions lower the cost of
transaction and that considerably improve agricultural production, productivity and market
participation decisions.
Lubungu et al. (2013), also identified proper market integration and its intensity by smallholder
farmers to be related to higher agricultural productivity, greater specialisation and higher
agricultural incomes. Smallholder market participation potentially contributes to food security
leading to poverty reduction as well as enabling better use of resources (IFAD, 2011; Timmer,
2005), contributes to commercialised production and vigorous change in production technology
(Romer, 1994). Therefore, achieving this proper integration could in turn facilitate structural
change in the Ghanaian agricultural landscape, thereby offering rural farmers the prospect to transit
from subsistence based agriculture into more specialised, market-oriented production systems
(Chenery et al. 1986; Kuznets, 1973; Lewis, 1954). Mazumdar (1987) also singled out agricultural
commercialisation as the way of motivating smallholder farmers to move into productive
agriculture rather than migrating out of the sector.
An efficient linkage of smallholder agricultural farmers to local and national agricultural markets
is a massive strategy towards achieving the agricultural related goals in the sustainable
development goals (UN, 2015; Wickramasinghe, 2015). The relevance of this paradigm shift is
that participation in the market by smallholders contributes towards agricultural growth, thereby
inducing structural transformation in an agricultural sector-led economy. The effect of this much-
needed structural transformation is the promotion of pro-poor growth and reducing the
phenomenon of food insecurity among agrarian households (Wickramasinghe, 2015). Olwande et
University of Ghana http://ugspace.ug.edu.gh
13
al. (2015) also indicated that an obvious mechanisms that will improve smallholder farmers’ living
conditions in less developed countries is to integrate them into markets so they can be efficient in
production and increase productivity.
In the World Development Report of 2008, it was contended that enhancing market participation
improves the productivity level of smallholder farmers, and that, it is the conduit to promoting pro-
poor growth in developing countries (World Bank, 2007). In this regard, introducing modern
agricultural innovations and technologies to smallholder cowpea farmers coupled with the
provision of various forms of governmental support from the relevant authorities will positively
impact on agricultural production systems in the Northern Region of Ghana. Though a gradual
shift is emerging in the structure of agricultural production system being transformed from
subsistence based to commercial agriculture in Ghana (Chapoto et al. 2013; MoFA-SRID, 2016),
this shift is very slow and involves only a negligible proportion of the Ghanaian smallholder farmer
population. The Ghanaian smallholder cowpea producer over the years do not only participate in
the production process but also participate in the market by selling some proportion of their
produce. Thus, the provision of production, productivity and market participating enhancing
services, facilities and infrastructures will accelerate the spate of agricultural commercialisation
and transformation in Ghana to ensure an inclusive economic growth.
The Ghana Commercial Agriculture Project (GCAP) and the national development plan both
underscore the need to graduate from a smallholder subsistence-based production system to one
that is characterised by a stronger market-based orientation (Abu, et al. 2016). Following from
that, the phase two of the Ghana Strategy Support Program (GSSP) seeks to proffer solution for
achieving this overarching goal of agricultural transformation for the country. As a result, one of
University of Ghana http://ugspace.ug.edu.gh
14
the key strategic policy research areas is markets and competitiveness. In line with the vision of
supporting farmers through the attainment of improved and reliable income through the planting
for food and jobs initiative, improving markets for smallholder farmers is integral to ensuring
higher land productivity. Akpalu et al. (2017) also emphasise the need for market participation
resulting from higher land productivity and the vice versa driving the agricultural transformation
agenda. This according to them has the ability to raise the incomes of subsistence, low input, low
productivity farming systems practised by farmers in the Northern Region in particular and Ghana
as a whole. To this end, boosting agricultural productivity and improving market participation of
smallholder cowpea producers is considered the most promising strategy to achieving pro-poor
growth, rural development and agricultural transformation in the Northern Region of Ghana.
1.5 Organisation of the Study
The study is organised into five chapters. Chapter One as described above details the introduction
of the topic area. It also includes problem statement with research questions and general
hypotheses, research objectives, justification of the study as well as organisation of the study.
Chapter Two presents a synthesised review of relevant literature as pertains to the topic. It
encompasses extensive review of empirical studies on cowpea production, productivity and market
participation of smallholder farmers. Chapter Three highlights the methodology employed in the
study. It includes the theoretical, conceptual and analytical frameworks, methods of data analyses,
the study area and methods of data collection. Results and discussion are presented in chapter four.
Finally, the summary of key findings, conclusions, recommendations and suggestions for further
research form the concluding chapter of the this thesis.
University of Ghana http://ugspace.ug.edu.gh
15
CHAPTER TWO
LITERATURE REVIEW
2.1 Introduction
This chapter reviews literature on theoretical and empirical studies pertaining to participation in
the market and agricultural productivity of smallholder producers. It begins by assessing the
economic value of cowpea production and the determinants of the probability of cowpea
production. The key terms and concepts such as smallholder farming, agricultural productivity and
market participation are defined. The precise appreciation of these terms is important in
understanding the analyses of cowpea production, productivity and market participation in the
study area. The chapter also reviews literature on the measurement and determinants of agricultural
productivity and market participation decisions. Finally, relevant literature on econometric models
that have been employed in empirical studies involving market participation and productivity are
also presented.
2.2 Cowpea Production
This section presents the status of cowpea production in Ghana, as well as factors influencing
smallholder farmers’ decision to produce cowpea.
2.2.1 Economic importance of cowpea production
Cowpea (Vigna unguiculata (L) Walp), is a grain legume crop. Its production constitutes an
important source of food, household income and as feed for livestock. Cowpea production is a key
component of tropical farming systems because of its ability to improve marginal lands through
nitrogen fixation and as cover crop (Danso, 2016). Langyintuo et al. (2013) also reported that
cowpea production is also a dependable asset that serves as income source for many smallholder
University of Ghana http://ugspace.ug.edu.gh
16
farmers and traders in sub-Saharan Africa. The grain is also a good protein source for humans,
while the haulm is an important source of livestock protein (Danso, 2016; Fatokun, 2002). Cowpea
is widely cultivated in Ghana under rain fed conditions, predominantly in the savanna and
transition zones (CRI, 2006; Danso, 2016) and about 91% of the cowpea produced in Ghana is
cultivated largely in the three savannah agro ecological zones of the country. Annual cowpea
production in Ghana is estimated at approximately 203,000 Metric tons (MoFA-SRID, 2016).
It is estimated that total cowpea grain produced in the world annually is valued at approximately
1.13billion to 2.81billion United States dollars (AATF, 2012). This therefore indicates that raising
the gross value of output produced per hectare or yield per hectare of the crop will consequently
increase the annual global production and revenue. The foregoing also indicates the economic
importance of cowpea to smallholder producers and hence factors that induce the production of
the commodity must be carefully analysed to boost production. Table 2.1 below details the major
cowpea producing regions in Ghana and their average production capacity for 2013-2015. These
regions together account for approximately 97% of the overall cowpea production in Ghana.
Figure 2.1 also shows the production index for the country from 2006-2015. Year 2016 to 2013
were calculated using average of 1996-97 as base year. Year 2014 and 2015 were calculated using
average of 2006 to 2010 as base year.
University of Ghana http://ugspace.ug.edu.gh

17
Table 2.1: Top Five Cowpea Producing Regions in Ghana Averaged for 2013-2015
Region Average Production
Capacity in (Mt)
Share of Sub-Total
(%)
Share of Overall Total
(%)
Northern 96,398.43 49.38 47.82
Upper West 73,951.80 37.88 36.69
Upper East 12,224.61 6.26 6.06
Brong Ahafo 7,681.87 3.93 3.81
Ashanti 4,978.32 2.55 2.47
Sub-Total 195,235.02
National Production
Capacity
201,574.57 96.85
Source: MoFA-SRID, 2016.
Figure 2.1: Cowpea Production Index of Ghana from 2006-2015
Source: MoFA-SRID, 2016.
0
50
100
150
200
250
300
350
400
450
500
2006 2007 2008 2009 2010 2011 2012 2013 2014 2015
Index
Production year
Cowpea Production Index
University of Ghana http://ugspace.ug.edu.gh

18
2.2.2 Determinants of cowpea production
Cowpea production refers to the volume of the commodity produced by smallholder farmers based
on the comparative advantage they have in deciding to be producers of the crop. A number of
factors have been identified in diverse empirical studies that encourage the probability of cowpea
production such that with the implementation of the right policies, non-producers can be induced
to also start producing. These include access to improved and high yielding seed varieties, distance
to market, proximity to an all-weather good road network, access to tractor services and farm size.
Other factors such as credit access, access to extension services, livestock owned, availability of
labour, smallholder farmer’s level of education, fertiliser and pesticide usage, as well as gender
have all been identified (Adipala et al., 2000; Lifeyo, 2017; Rios et al. 2009; Tabe-Ojong &
Mausch, 2017). Tabe-Ojong & Mausch (2017) for instance established that the relationship that
exists between farm size, livestock owned, and gender and chickpea adoption and market
participation in Ethiopia is significant and positive. Their findings proved that a negative
relationship exist between input use and age on chickpea production. Lifeyo (2017) reported a
negative relationship between proximity to good road network and common bean production in
Malawi. He further reported that the relationship that exists between distance to nearest market
and common production in Malawi is also negative.
2.3 The Concept of Smallholder Farming
The concept of smallholding does not lend itself to an exact definition. Vermeulen & Cotula (2010)
indicated that, the definition of smallholders differs from country to country and between agro-
ecological zones. In their categorisation of smallholder farmers, they aggregated those who
cultivate less than 1 hectare of land in dense population regions or localities, or cultivate 10
hectares and above in semi-arid areas as smallholders as also reported in (Abu et al. 2015).
University of Ghana http://ugspace.ug.edu.gh
19
According to Musah et al. (2014) and Ekboir et al. (2002), a smallholder in any region of Ghana
is working on a farm size that is less than 5 hectares. Chamberlin (2007) and IFPRI, (2007) also
noted that 70% of Ghanaian smallholder farmers have farm size of 3 hectares (ha) or smaller in
sizes. They further stated that the smallest mean land holdings are in the south, and it is about 2.3
ha at the coastal belts, but higher, that is, 4.0 ha in the northern savanna agro ecological zones. The
implication of possessing smaller farms is that production volumes of commodities produced
become less. For example, farm sizes of 2 ha or smaller produce on average 3.1 different types of
crops whereas those of 4 ha or larger produce 4.7 different types of crops. Chamberlin’s concept
of smallholding is premised on farm size, wealth, market orientation and production risk
susceptibility levels.
According to Ministry of Food and Agriculture (MoFA, 2011), smallholder farmers have less than
2 hectares farm size. The main argument is that smallholder farmers cultivate small plots of land.
In line with this, Dixon et al. (2004) view smallholder farmers as possessing limited assets base
compared to other farmers in the sector. Smallholder farmers are particularly vulnerable to climatic
and economic shocks. Furthermore, the Ghana Poverty and Social Impact Analysis (PSIA)
undertaken by Asuming-Brempong et al. (2004), their recommendation asserted that defining
smallholder farmers in Ghana must be based on different resource and risk conditions. They
contended that this is a better definition than just simply measuring landholdings. It is apparent
from the literatures above that the definition of smallholder farmers was premised on the size of
landholding. This might be due to the fact that, defining smallholders based on landholding was
the safest and less contentious way of describing them in empirical studies. Consequently, based
on the lessons from the literature, this study primarily defined a smallholder farmer based on farm
University of Ghana http://ugspace.ug.edu.gh

20
size or landholding. Therefore, the definition by the Ministry of Food and Agriculture (MoFA) of
a farm size or landholding of about 2 hectares as smallholding was used for this study.
2.4 Agricultural Productivity
This section explores the diverse definitions of the concept of agricultural productivity in empirical
studies. It also presents how the concept of agricultural productivity is measured in some empirical
studies.
2.4.1 Definitions and concepts of agricultural productivity
The term agricultural productivity has evoked different meanings and interpretations. The term
has also stimulated many contradictory interpretations with several scholars defining it with
reference to their disciplines and fields of practise. In the fields of agricultural geography and
agricultural economics, productivity in agriculture is therefore defined as output per unit input or
produce per unit of land size. Singh & Dhillion (2000) proposed yield per unit as the important
consideration in the definition of agricultural productivity. However, this definition has been
criticised by several authors saying it only considered land as a production factor. Following from
that, several authors have proposed an all-encompassing concept of agricultural productivity. The
productivity concept should constitute all the production factors such as labour, capital, water
management and other biotic factors (Dharmasiri, 2009).
Productivity in agriculture from the perspective of Shafi (1984), is the ratio of index of local farm
produce to the total farm input use index. Productivity therefore represents, ceteris paribus, the
effectiveness with which inputs are utilised in the production process. The concept sometimes too
is considered as the total efficiency with which a production system functions, while at other times
it is defined as a ratio of produce to resource collectively or separately expended on that
University of Ghana http://ugspace.ug.edu.gh

21
production. According to Dewett & Singh (1966), the term agricultural productivity must be
expressed in terms of the changing association between agricultural output and one other input,
such as land or labour or capital, with other corresponding factors remaining the constant. Their
definition indicates that agricultural productivity is rather a physical component instead of it being
a broad concept. In the view of Pandit (1965), the term agricultural productivity must be defined
from an economic perspective. He indicated that agricultural productivity is expressed as the
produce per unit of input or the art of achieving an increase in output from the same input or getting
the same output from a smaller input. Pandit again suggested that rises in agricultural productivity,
whether in the industrial or agricultural sectors, is usually borne out of an effective use of all or
some of the factors of production, namely; land, labour and capital. Saxon (1965), also perceived
productivity in agriculture as a visible relationship existing between produce and input which
results in that produce.
Horring (1964) studied agricultural productivity in expansive terms, to represent the ratio of
produce to some or all associated inputs. He further corroborated the views espoused by
Dharmasiri, (2009) that there are varying concepts of productivity which are dissimilar from each
other. Land, labour and capital are the various aspects of agricultural productivity. Due to
increasing human population, exceptional consideration has been given to land productivity than
the other forms of productivity. The reason is that land is perceived is a resource with different
natural attributes. Land receives diverse payments and this cost payments or rent vary
proportionally with regard to need and location. Labour productivity on the other hand denotes all
the services performed by humans, which does not involve decision making, while capital
represents resources employed in cultivation by the farmers that are non-labour related.
Production optimality from land is achieved with the application of relevant and accessible inputs.
University of Ghana http://ugspace.ug.edu.gh
22
Predictably, the inherent physical and chemical properties of land vary based on location with the
resultant variation on agricultural land use. Following from this, productivity of land is of outmost
importance in countries and locations with high agrarian populations such as the Northern Region
of Ghana. Horring (1964) further stated that in countries with scarce land resources, production
and productivity increases can only keep pace with economic growth per capita if yield per hectare
is raised. However, raising land productivity requires raising the national farm output rather than
just raising the yield of individual crops. Land productivity can also be raised by varying crop
production patterns to incline towards an intensive system of cultivation higher value crop like
cowpea to achieve higher productivity. The focus of the study therefore is on the productivity of
land.
2.4.2 Measurement of agricultural productivity
Several scholars have endeavoured quantifying agricultural productivity. The coefficient of
ranking method was introduced by Kendall as the procedure for agricultural productivity
measurement in 1939. The measurement of agricultural productivity usually involves a
relationship between inputs and outputs in agricultural production. Stamp (1958) used Kendall’s
approach for comparing agricultural productivity across countries. He further emphasised the
measurement of crop productivity in terms of per unit area. Measuring relative productivity in
terms of gross output of crops and livestock has also been reported in other empirical studies. For
instance, Hirsch (1943) proposed crop yield index as the basis of productivity measurement. His
measurement approach expressed the average of the yields of different crops on a farm or in a
locality relative to the yields of the same crops on another farm in another locality.
University of Ghana http://ugspace.ug.edu.gh
23
For their part Huntington and Valkenburg (l952) considered land productivity on the basis of acre
yields of eight crops grown very extensively in Europe. Makenzie (1962) on the other hand
measured productivity of production in Canadian agriculture by using the output coefficient
relative to input. For Sapre & Deshpande (1964), the weighted rank index is a more appropriate
measurement of productivity in the agriculture sector. The agricultural productivity coefficient
index computed based calorie levels of each crop was also introduced as agricultural productivity
measurement by (Shafi, 1984). Agricultural productivity has also been measured by expressing it
in terms of per unit area carrying capacity (Singh, 1972). Hussain, (1976), also developed the
method of converting farm production into cash values of a regional unit in production as a
productivity measure. Commen (l962) while working out the trends of productivity in agriculture
of the state of Kerala (India), measured productivity on the basis of yield per acre.
Other empirical studies by authors such as Strasberg et al. (1999) and Govereh & Jayne (1999) in
their studies of Kenyan and Zimbabwean farmers respectively, measured agricultural productivity
as the overall value of crop production per acre. For example, Rios et al. (2009) computed a
technical efficiency score as a measure of agricultural productivity. They argued that measurement
of productivity via technical efficiency considers both output and input levels. Agricultural
productivity is also the gross value of output produced per hectare according to (Gilligan, 1998;
Gebremedhin et al. 2017; Minten & Barrett 2008; Tabe-Ojong & Mausch, 2017).
2.5 Market Participation
This section defines the concept of market participation and examines its measurement. It also
identifies market participation determinants and as well as determinants of crop productivity. The
section also discusses the factors influencing smallholder farm household’s decision to participate
University of Ghana http://ugspace.ug.edu.gh

24
in the markets and how intensity of market participation affect the productivity of smallholder
cowpea farmers.
2.5.1 Concepts and definitions of market participation
Numerous definitions and operationalisation of the concept of market participation have emerged
in several empirical studies following the pioneering work of Goetz (1992). He indicated that
households typically are confronted with a dichotomous or two-stage decision problem. The first
decision is related to which direction to trade if a farmer decides to trade. The second decision
involves the quantity or volume of good to be traded based on participation as a purchaser or a
seller. Also, according to Latt & Nieuwoudt (1988) and Strasberg et al. (1999), market
participation can be termed as commercialisation giving rise to agricultural transformation.
Increased market participation or commercialisation implies the shift from subsistence farming to
market participation mode. Boosting participation in markets is necessary to sustain the linkage of
farmer to markets in order to increase purchase of agricultural produce to trigger income generating
opportunities (Pingali, 1997). From the point of view of Pingali, market participation is not merely
the marketing agricultural produce. He argued that agricultural market participation is achieved
when profit maximisation is the ultimate motive driving household’s product choice and input use
decisions.
In an agricultural market economy, participation in the market happens when smallholder farmers
stop being mostly subsistence or peasant and become more profit-oriented (Makhura et al. 2001).
According to Ana et al. (2008) market participation can be defined as sales portion of total produce
aggregated for all agricultural crop produced by a smallholder household. This crop production
according to him includes a combination of all annuals and perennials crops, industrial and crops
University of Ghana http://ugspace.ug.edu.gh
25
locally-produced, fruits and agro-forestry. Supporting Pingali’s assertions, Dawit et al. (2006)
posit that market participation involves three pillars. These include; input against produce, sales
against purchases, and the type of farming activity dichotomies. Meanwhile Moti et al. (2009)
insist that market participation considers input and output sides of production, and how farm
households simultaneously make production and marketing decisions.
Barrett (2008) indicated that the concept of market participation involves how smallholder farmers
undertake the production of goods and services for auto-consumption. He continued by saying that
the concept also involves how smallholder farmers specialise in the production of goods in which
they are skilled in producing, consuming some portion and selling the surplus for other goods they
are not skilled in producing. Hazell et al. (2007) found out that agricultural market participation in
terms of the intensity of participation in the output markets focuses primarily on cash incomes.
The following studies also all defined market participation as any market venture which promotes
the sale of produce (Holloway & Ehui, 2002; Key et al. 2000; Lapar et al. 2003). According to
Boughton et al. (2007), participation in the market is both a cause and an effect of economic
development. This he explained by indicating that market participation offers households the
chance to specialise according to comparative advantage and hence enjoy welfare gains through
trading. Market participation plays a substantial role in raising productivity and thereby enhancing
farm earnings of smallholder farmers (Asfaw et al. 2012; Barrett et al. 2012; Bellemare, 2012;
Chege, et al. 2015; Hernandez et al. 2007; Maertens, et al. 2012; Michelson, 2013; Muriithi &
Matz, 2015; Rao & Qaim, 2011; Rao, et al. 2012). All these authors defined market participation
as the proportion of sales by smallholder farmers conditional on the famer being a seller. Increased
participation in the market implies the shift from subsistence farming to a market engagement
University of Ghana http://ugspace.ug.edu.gh
26
mode. This frequent use of markets is undertaken for the purpose of exchanging products and
services (Mmbando, et al. 2015; Musah et al. 2014). Smallholder producer’s choice to participate
in agricultural markets is considered an essential determinants of household agricultural
productivity, level of commercialisation and kind of crop diversification practised on-farm (Asfaw
et al. 2012; Lipper et al. 2010; Lipper et al. 2006; Smale, 2006).
2.5.2 Measurement of market participation and intensity of participation
Goetz (1992) used the quantity or volume of produce traded as a measure of the intensity of market
participation. Ana et al. (2008), employed sales index as a measure of market participation. Rios
et al. (2009) also measured market participation using sales as a fraction of total output, aggregated
for all agricultural crop produced by a smallholder household and computed a sales index,
measured as equal to zero (=0) for a non-seller and greater than zero (> 0) for a seller. Their study
was the first of its kind to link intensity of market participation to productivity and established a
reverse causality between the two concepts whiles controlling for endogeneity. However, their
operationalisation of the concept of market participation truncates vital information since the
decision to produce the crops studied and the decision to sell them were not modeled in their
estimations.
They explained that households that sell nothing would have a zero sales index and index for those
who sell would be greater than unity. Following from Barrett (2008), two fundamental
measurement approaches can be deduced. He asserts that smallholder households partake in the
market principally either as sellers or buyers. Both decisions according to him are underpinned by
the optimisation theory where households seek to maximise utility subject to cash budget and
availability of non-tradable resources. Again from the point of view Barrett, partaking in the
University of Ghana http://ugspace.ug.edu.gh
27
market possess a demand side where households participate as buyers, and a supply side where
they act as sellers. Cazuffi & Mckay, (2012) and Makhura et al. (2001) also computed an index
as a proxy for market participation. However, their use of commercialisation index as an alternative
measure for market involvement has been perceived to possess some deficiencies and therefore
not an efficient indicator (Moti et al. 2009).
Burke et al. (2015) and Lifeyo (2017), viewed market participation as a three-stage phenomenon.
The first stage involves a production decision and conditional on a farmer being a producer, the
second stage involves the market participation decision where the farmer then decides to be a net
buyer, remain autarkic or be a net seller. They further indicated that the third and final stage is the
decisions regarding volumes or proportion of their net purchases and net sales which determines
their degree or intensity of market participation. However, although Gebremedhin et al. (2017)
and Tabe-Ojong & Mausch (2017) also operationalised market participation as a three-stage
process, their measurement of the concept did not involve the second stage net buyer, autarkic or
net seller specifications as used in Burke et al. (2015). Their market participation measurement
involved the decision to participate in production as the first stage, decision to market or sell as
the second stage. However, conditional on being a participant in the market as a seller, the
proportion or volume of output sold defines the third stage which also measures the intensity of
participation.
University of Ghana http://ugspace.ug.edu.gh

28
2.5.3 Determinants of market participation and crop productivity
Agricultural production in developing countries often occur in a constrained environment
characterised by low production volume, low productivity as well as prohibitive transaction costs
which slow down market participation (Novignon et al. 2017). These emanate from the insufficient
availability and access to public goods such as physical infrastructure namely roads, electricity,
and telecommunication networks and institutional infrastructure (Barrett, 2008; Francesconi &
Heerink, 2010; Gabre-Madhin, 2001; Gelo, et al. 2017). Evidence shows that the factors that affect
market participation and productivity are in broad categorisations and these include household
(farmer) characteristics, transaction costs and community characteristics. Other factors such as
resource endowments/institutional factors comprising of private assets, public assets/social capital,
location and market prices variables are also noted that affect market participation and
productivity. Cazzuffi & McKay (2012); Stifel et al. (2003), Masuku et al. (2001) and
Wickramasinghe, (2015) have all indicated that most studies have mainly dwelled on
understanding the role of costs associated with transaction and market failure in smallholder
decision making by taking into consideration their proximity or distality from a market source.
Other authors such as Key et al. (2000); Barrett (2008); Bellemare & Barrett (2006) also concluded
from their studies that differential resource or assets endowments facilitate participation in the
market. They therefore identified them as important factors underlying market participation
decision making as well as crop productivity increases among smallholders.
With regards to transaction costs variables affecting participation in the market place, Goetz (1992)
noted that such costs affect participation in the market through the labour-leisure trade-off
behaviour. He expounded that in markets that are not well developed, it is expensive to identify
opportunities for selling or trading. This poor market access can be explained in terms of
University of Ghana http://ugspace.ug.edu.gh

29
inadequate transportation system, long distance to markets, ethnicity or language barriers raising
the cost of observing prices in the market in order to make purchase decisions. This therefore
reduces the household’s leisure time as a result of the spending of more time in search for market
prices. Additionally, Cazzuffi & Mckay (2012), discovered a positive association existing between
partaking in the market and lower levels of transaction costs especially transport information costs
(Alene et al. 2008; Heltberg & Tarp, 2002; Ouma et al. 2010). However, contradictions emerged
from among some of these various specific studies. For instance, Siziba et al. (2011) found that
three of the transaction cost variables they measured; ICT index, distance to output markets and
market information (price information) positively influence market participation. They established
a positive effect of ICT index which measured the number of mobile phone subscriptions per 100
people and price information. They conclusion they drew from this observation is that the
provision of public infrastructure and services promote market participation and productivity.
With regards to the distance to market variable, they also interestingly observed a positive
relationship between longer distance to market and market involvement. They explained that this
can be possible provided better prices are offered in such markets. Studies by authors such as
Randela et al. (2008), Siziba et al. (2011) and Zamasiya et al. (2014) also observed a positive
relationship existing between distance to market and market participation, and also between
accessing market information and market participation. However, Olwande & Mathenge (2012)
and Omiti et al. (2009) found distance to market to be negatively related to market participation
among milk and kales; and milk and fruit producers respectively. Similarly, Lifeyo (2017) and
Martey et al. (2012) also found negative effect between distance to market and market participation
of smallholder common bean and cassava producers respectively. The argument backing this
University of Ghana http://ugspace.ug.edu.gh

30
observation was that, market distance represents a cost in getting to markets as it is an indicator of
travel time and hence a longer distance serves as a disincentive to participate in the market.
Wickramasinghe, (2015) also attempted to determine whether or not a major difference exists in
maize market entry and sales. He undertook this study among smallholder farmers who operated
pure-stands and those who operated mixed stands. His hypotheses were that households who
operate pure stands should expect to encounter lower and less significant transaction costs than
households who operate mixed-stands. He observed that for pure-stand farmers, transaction costs
variables such as distance to market and cost of transportation are significant and positive rather
than the expected negative sign. However for mixed-stands farming households, the same
transaction costs variables households were significant and negatively related to market
participation.
Wickramasinghe (2015) again observed that household resource endowment indicators such land
area, the number of productive household members (dependency ratio), soil quality, access to
irrigation services and farm implements significantly influenced market participation decisions.
Additionally, labour access, tractor services, usage of fertilizer and pesticide, extension services
are significant in regards to the proportion or volume of maize sales and therefore all indicating
signs of enhanced market participation. His conclusions were that access to resources greatly
determine the volume of maize produced and sold. However, in their triple hurdle model
estimations, Gebremedhin et al. (2017) identified resource endowment variables such as labour,
land and access to credit to be positively related to engagement in diary production, but population
density and off-farm income source were found to be negatively related. Gebremedhin et al.
(2017), also corroborated the findings of Burke et al. (2015) and identified previous investments,
University of Ghana http://ugspace.ug.edu.gh
31
access to own land and possession of assets to be positively related to production decisions among
diary producers in Kenya.
Other empirical evidence also show the relationship existing between market participation and
household characteristics and resource endowment variables (private assets/public assets). These
variables are noted to generally exhibit positive association with market participation (Boughton
et al. 2007; Cadot et al. 2006; Levinsohn & McMillan, 2007; Martey et al. 2012; Nyoro et al.
1999; Siziba et al. 2011; Stephens & Barrett, 2009; Zeller et al. 1998). Zamasiya et al. (2014) and
Siziba et al. (2011) further observed that private assets indicators including non-farm income,
ownership of radio and value of livestock owned were highly and positively significant with the
intensity of market participation in the grains market and productivity. Socioeconomic
characteristics such as age in studies by (Martey et al. 2012; Randela et al. 2008; Zeller et al. 1998)
education for example (Martey et al. 2012; Olwande & Mathenge, 2012; Omiti et al. 2009; Zeller
et al. 1998) and farm size for example (Martey et al. 2012).
With regards to gender, households headed by males participate more in the market, have higher
production volumes and productivity counterparts. Omiti et al. (2009) also observed that the
gender variable had a positive effect on market participation of various farm produce. Resource
endowment variables such as ownership of private assets like mobile phone or communication
instrument, own means of transportation such as bicycle, motor king etc. and membership in a
farmer-based organisation (Olwande & Mathenge, 2012; Reyes et al. 2012), and output for
example (Omiti et al. 2009) had a positive effect on market participation decisions. However,
dependency ratio or household size has been found to negatively affect market participation and
proportion of sales in studies by scholars such as (Olwande & Mathenge, 2012; Omiti et al. 2009;
University of Ghana http://ugspace.ug.edu.gh
32
Randela et al. 2008). In a stark contradiction, Randela et al. (2008) observed a negative effect of
farm size and ownership of livestock on market participation and proportion of sales.
Cadot et al. (2006) and Alene et al. (2008) all found that, the closer a farmer is to a main market
source, the greater their likelihood of market participation and generation marketable surplus as a
result of higher productivity. On the other hand, lack of market information impede market
participation by increasing the cost of bargaining and searching. In addition, poor road
infrastructure along with inadequate road networks noticeably impedes market participation.
Rainy seasons in many rural areas render roads virtually impassable thereby resulting in high costs
of transportation. The effect is that the price received by farmers are further reduced if buyers are
to provide transport in such situations. According to Obare et al. (2003), insufficient road
infrastructure is connected with poor development of markets through high transaction costs.
Consequently, the distal a household is away from main market source in a district, transaction
costs of obtaining information and travel time in getting to such market outlets are high. Likewise,
proximity to main towns and market centres indicates how short farmers have to travel to reach
sources of information (Makhura et al. 2001). Renkow et al. (2004) found that fixed transactions
costs, on average is relatively lower in areas with reliable motorised transport services but higher
for areas without reliable motorised transport services in a study conducted on Kenyan smallholder
households.
Other studies conducted in Asia also show that transaction costs have negative effect on market
participation of smallholder farmers. For example, in Peru, market participation was low among
smallholder potato producers because of the high transaction costs resulting in lower productivity
in places where formal markets are inaccessible (Maltsoglou & Tanyeri-Abur, 2005). Lappar et
University of Ghana http://ugspace.ug.edu.gh
33
al. (2003), also reported the decreasing effect of transaction costs on the production and market
participation of smallholder Pilipino smallholder livestock farmers. Similarly, Gebremedhin et al.
(2017) also reported of the same effect on the production and market participation of smallholder
livestock farmers in Ethiopia while Tabe-Ojong & Mausch (2017) also observed the same effect
on chickpea production and market participation among smallholder farmers in Ethiopia.
In yet another extremely interesting empirical analysis Asfaw et al. (2012) discovered the
determinants of produce and input market participation on pigeonpea diversity in Kenya. Their
study used cross-sectional data and connected market participation to household welfare and food
security. Their study revealed that input and produce market participation decisions and their
determinants are different. They identified participation in the output market to be influenced by
household’s socio and demographic characteristics, farm size and ownership of radio. The input
market participation was also determined by farm size, ownership of bicycle, and access to a
salaried income. Their study established a strong positive correlation of produce market
participation and pigeon pea diversity, while a negative relationship exists between input market
participation and pigeon pea diversity. Their results indicated that smallholder farmers who
participated in the produce market had significantly higher food security status than non-
participants.
In examining the effect of ICT-based market information and adoption of seed technologies in
Uganda, Kiiza & Pederson (2012) noted that the factors affecting the probability of access to
market participation include credit or loan access and membership in a farmer based organisation.
They also discovered that government awareness campaigns, wealth and distance to trading centres
or district capital negatively affect access to markets and production. They discovered that
University of Ghana http://ugspace.ug.edu.gh
34
participation in improved seed production had a positive and significant effect on productivity and
gross farm returns.
2.6 Methodological Issues in Market Participation and Crop Productivity
This section presents the empirical models for analysing the effect of market participation on
productivity of smallholder farmers. It also presents the model for identifying the factors that
influence smallholder farmers’ decision to produce cowpea, factors that influence smallholder
farmers’ decision to participate in the markets as well as determining the effect of productivity on
intensity of participation in the cowpea market.
2.6.1 Linking market participation to productivity: the two-step approach
In empirical studies of market participation in particular, several econometric models have been
applied. In practice, these studies characteristically adopt a two-step methodical approach. This
double-hurdle approach is appropriate or useful especially where the population being studied all
produce the crop or commodity which is under investigation (Cragg, 1971; Olwande & Mathenge,
2012; Omiti et al. 2009).Other studies assume a one-step procedure.
The motivation for using the two-step estimation framework is that market participation is often
perceived as a dual concept and processes following the pioneering work of (Goetz, 1992) and
later (Bellemare & Barrett, 2006). The operationalisation of the first decision process has to do
with whether a farm household would participate in the market or not. The second decision process
deals with the level of output with which to participate if the farm household decides in the first
stage. However, some other empirical studies by Omiti et al. (2009) and Martey et al. (2012) have
considered only a one step approach by concentrating on the second decision process. The three-
stage analytical approach has been advanced to handle the shortcomings of the two-tier approach
University of Ghana http://ugspace.ug.edu.gh

35
in situations where the population do not all produce the crop or commodity under investigation
(Burke et al. 2015; Gebremedhin et al. 2017; Lifeyo, 2017; Tabe-Ojong & Mausch, 2017).
Gebremedhin et al. (2017), Alene et al. (2008), and Olwande & Mathenge (2012), have all stated
that econometric models for the double-hurdle approach also include models such as Heckman’s
sample selection model for example (Goetz, 1992; Makhura, et al. 2001; Boughton et al. 2007;
Alene et al. 2008; Siziba et al. 2011), the two-tier/double hurdle models (e.g. Cragg, 1971;
Olwande & Mathenge, 2012; Reyes et al. 2012) and endogenous switching regression model (e.g.
Seng, 2016). The instrumental variable (two-stage least squares) regression approach (Rios et al.
2009).
The Heckman Selection Model
The Heckman sample selection model was introduced by Heckman (1979). The initial model was
based on wage offer functions given that some wage data was missing due to the outcome of
another variable – participation in the labour force. The procedure is easy for correcting sample
selection bias. Wooldridge (2002) argues that the sample selection bias can be seen as an omitted
variable in the sample selected which is corrected by using the Heckman model.
The Heckman model is made up of two equations to be estimated in two steps and therefore a
double hurdle. The first equation is known as the selection equation. This selection equation is
estimated using either a Probit or Logit model which estimates the probability that an individual
household either participates or does not participate in the market. The procedure involves the
prediction of an Inverse Mills Ratio (IMR), the purpose of which is to account for sample selection
in the study so that the estimates would not be biased. The second equation is known as the
outcome equation. The Ordinary Least squares (OLS) approach is used in estimating this outcome
University of Ghana http://ugspace.ug.edu.gh

36
equation. The OLS estimation is done with the inclusion of the IMR as an explanatory variable.
The first and the second models incorporate the same variables except that the second model
includes some other variables suggested by Wooldridge (2006) as exclusion restriction variables.
An obvious drawback of the Heckman’s sample selection model is that, the exclusion restriction
variable(s) be identified based exclusively on distributional assumptions (Sartori, 2003). He further
observed that the exclusion restriction assumption is also noted sensitive to the assumption of
bivariate normality (Winship & Mare, 1992). It is also observed that the rho parameter is also very
sensitive in some common applications (Sartori, 2003). The model also fails to incorporate
production decision in the estimation process.
Tobit – a Two-tier/Double Hurdle Model
Cragg (1971) developed the two tier/double hurdle model and it has since been the most prominent
technique adopted for most empirical studies on market participation. Cragg first proposed the
two-tier model as a general form of the Tobit model. The model allows for the possibility that a
factor might have diverse effects on the probability of acquisition and the size of acquisition.
Olwande & Mathenge (2012) view the two-tier/hurdle models as a type of corner solution outcome
which is sometimes denoted as censored regression. The model’s application to any empirical
study splits the study into two steps/stages. The first is an initial discrete probability of
participation model and conditional on participation, the second step is the decision made in
regards to the intensity of participation (Olwande & Mathenge, 2012). The first initial step is
modelled as a Probit analysis while the second step assumes varied functional distributions.
Though the simplest two step models assume Log normal distribution in the second stage, Cragg’s
double hurdle model assumes a truncated normal distribution. The merit of the truncated normal
University of Ghana http://ugspace.ug.edu.gh

37
distribution over the lognormal is that the Tobit model is nested in the truncated normal regression
thereby allowing the testing of the restrictions implied by the Tobit hypothesis against the two step
model (Olwande & Mathenge, 2012). This makes the double hurdle model theoretically plausible
than other two-tier models however both models are incapable for analysing situations where a
significant number of the sampled population are non-producers of a crop or commodity and it is
required that a production decision be modelled.
The Endogenous Switching Regression Model
The endogenous switching regression model (ESRM) was first described by Maddala (1983) and
has since been used in several empirical studies (Akpalu & Normanyo, 2014; Camara, 2017; Hu
& Schiantarelli’s 1998; Seng, 2016). This model is also a two-stage model designed to overcome
the restriction of the Tobit model. The estimation procedure in the endogenous switching
regression model is that a variable is able to influence the two stage decisions in different directions
(Alene et al. 2008; Seng, 2016). The first procedure or stage as suggested by Maddala (1983) is
the estimation of the selection equation, followed by the calculation of the selection correction
terms and then inserting them into the second stage outcome equations. With dichotomous
dependent variable, the second stage is a discrete choice model which has to be estimated using
maximum likelihood methods. However, the use of the Full Information Maximum Likelihood
(FIML) method to simultaneously estimate the selection and outcome equations of the endogenous
switching regression (Mmbando et al. 2015) is reported to be efficient than the two-step least
squares method (see e.g. Akpalu & Normanyo, 2014; Clougherty & Duso, 2015; Greene, 2000;
Lokshin & Sajaia, 2004; Seng, 2016). The drawback with this approach is that it also fails to take
into consideration the decision to produce.
University of Ghana http://ugspace.ug.edu.gh
38
The Two-Stage Least Squares (Instrumental Variable) regression
The main approach that has been used extensively in empirical studies to address endogeneity is
the two-stage least squares (instrumental variable) regression approach (see e.g. Babu et al. 2014;
Dunning, 2008; Greene, 2012; Rios et al. 2009; Staiger & Stock, 1997). Intensity of market
participation is potentially endogenous in the cowpea food crop productivity model and therefore
in order to overcome the problem of endogeneity, the Instrumental Variable (IV) approach using
the Two-Stage Least Squares (2SLS) estimator was employed. The alternative estimation
procedures was to employ the Ordinary Least Squares (OLS), the Heckman sample selection
model or the Tobit model. But all these estimation methods are limited in addressing the issue of
endogeneity that is perceived to be associated with the intensity of market participation (proportion
of sales) and productivity (gross value of output sold per hectare). The estimators associated with
these approaches would be biased and inconsistent. The instrumental variable approach allows for
the estimation of coefficients that are consistent and free from asymptotic bias from omitted
variables as well as measurement errors (Angrist & Krueger, 2001).
The foremost economist to employ the procedure was P.G. Wright. Wright (1928), who first
discussed the issue in the seminal application of instrumental variables in estimating the elasticities
of supply and demand for flaxseed, the source of linseed oil. Following from that, several other
Economists such as Goldberger (1972), Morgan (1990) and Bowden & Turkington (1984) have
all applied the instrumental variable procedure in diverse econometric analyses. According to
Angrist & Krueger, (2001), if there is more than one valid instrument, the coefficient of interest
can be estimated by two-stage least squares. While two-stage least squares and other instrumental
variables estimators are consistent and unbiased, the drawback of the approach is that it can also
result in biased and inconsistent estimates if invalid or weak instruments are used and the model
University of Ghana http://ugspace.ug.edu.gh

39
incorrectly specified leading to under or over identification issues. These estimation challenges
were addressed in this study by conducting the Durbin-Wu-Hausman test statistics and the joint
significance test of instruments validity. Rios et al. (2009), also employed the 2SLS followed by
a two-tailed Tobit models to establish a link between productivity and market participation. They
regressed productivity on a range of possible determinants of intensity of market participation, and
a variety of control variables drawn from the productivity literature.
The control variables include household characteristics, private and public assets and services
(resource endowments)/institutional factors, market prices and location. They used transaction
costs variables such as household’s ownership of means transportation and proximity to good road
network as instrumental variables.
The validity of each of this plausible instrumental variables, depends on the extent to which it is
related with a household’s productivity level only through their intensity of market participation
and not through any direct linkage to production. Though Rios et al. (2009) measured agricultural
productivity in terms of technical efficiency by computing technical efficiency scores as a measure
of productivity, cowpea productivity measurement for this study followed the works of Gilligan
(1998), Tabe-Ojong & Mausch, (2017) and Gebremedhin et al. (2017). They measured
agricultural productivity as the gross value of output produced per hectare.
2.6.2 The triple hurdle model of market participation
The triple hurdle market participation involved the decision to participate in production,
conditional on a farmer being a producer, decision to participate in the market, and conditional on
being a participant in the market, the proportion or volume of output sold. Most empirical studies
on market participation have operationalised the participation of households into output markets
University of Ghana http://ugspace.ug.edu.gh

40
as a two-stage decision process and either employed a sample selection model such as the
Heckman’s sample selection (see e.g. Alene et al. 2008; Bellemare & Barrett, 2006; Boughton et
al. 2007; Ouma et al. 2010). Other scholars have also employed a corner solution model notably
the endogenous switching regression models, restrictive Tobit model and the double hurdle models
(Camara, 2017; Goetz, 1992; Omiti et al. 2009).
The triple hurdle modelling approach starts modelling from production and implicitly assumes all
households in the study area to be either producers or potential producers. This assumption is
plausible if more than two crops are considered in the model and where all smallholder farmers
are actually producers of the crops under investigation. However, in the case of cowpea, not all
smallholder farmers in the study area are producers.
A significant number of smallholder farmers in the study area are non-produces even though they
have the potential or capacity to produce. All households (both producing and non-producing)
must be modelled such that any policy intervention which encourages producers to market may
also induce non-producers to begin producing and also participate in markets (Burke et al. 2015).
An extension of the DHM called the triple hurdle (THM) models such relationships by including
an additional tier for the production decision since the double hurdle model does not allow
explicitly for this possibility. Following from this, market participation studies are beginning to
take the shape and form of a TH model (see e.g. Gebremedhin et al. 2017; Okoye et al. 2016;
Tabe-Ojong & Mausch, 2017; Lifeyo, 2017) after the pioneering work of Burke et al. (2015) on
production of diary and market participation in Kenya.
Motivated by a major limitation of the DH which only modeled producer households, they
introduced the triple hurdle (TH) model which includes an initial stage of production to capture
University of Ghana http://ugspace.ug.edu.gh
41
non-producers. Burke et al. (2015) and Lifeyo (2017) operationalised their triple hurdle market
participation into the following distinct categorisations based on the works of Bellemare and
Barrett (2006). They modelled the production participation decision as a Probit model for the first
stage decision, conditional on a smallholder being a producer, market participation was categorised
as either a net buyer, autarkic or net seller and the factors connected with it were modelled using
an Ordered Probit. They then analysed the last hurdle of intensity of participation (measured as
net volumes bought by buyers, and net volumes sold by sellers) using two lognormal specifications
based on (Wooldridge, 2010).
Furthermore, Cameron & Trivedi (2005) also proposed either the log normal specifications or
Truncated regression for estimating the last hurdle in hurdle models. Following from that, other
studies by Gebremedhin et al. (2017) and Tabe-Ojong & Mausch (2017) operationalised the first
stage decision to produce using a Probit model. They operationalised the second stage market
participation decision by the producer smallholder farmers into market participants and non-
participants and the factors associated with it were also modelled using a Probit model. Finally,
conditional on partaking in the market as a seller, the level of participation (proportion of output
sold) was estimated using a Truncated regression model.
Tabe-Ojong & Mausch (2017), linked adoption of chick pea variety to market participation using
the triple hurdle model approach while controlling for heterogeneity and endogeneity in factors
associated with chick pea adoption that also potentially affect market participation. Though this
study followed the approach of Tabe-Ojong & Mausch (2017), productivity measurement followed
the approach by Govereh & Jayne (1999) and Strasberg et al. (1999). Therefore, for the analyses
of cowpea production, market participation and the intensity of participation conditional on
University of Ghana http://ugspace.ug.edu.gh
42
smallholder producers’ decision to sell and their level of productivity, in the Northern Region of
Ghana, the 3- stage or TH model was employed.
2.7 Key Conclusion on Literature Review
From the literature review, several studies were identified in relation to market participation and
smallholder farmers’ production. Current empirical studies on market participation are gradually
shifting away from the two-step analytical approaches to the three-step or triple hurdle models (see
e.g. Burke et al. 2015; Gebremedhin et al. 2017; Tabe-Ojong & Mausch, 2017; Lifeyo, 2017).
This 3-step approach is applicable in studying a crop like cowpea where a significant number of
smallholder farmers are non-producers.
University of Ghana http://ugspace.ug.edu.gh
43
CHAPTER THREE
METHODOLOGY
3.1 Introduction
This chapter describes the methodology of the study under the following: the theoretical
framework underpinning the study and the conceptual and analytical frameworks, the methods of
data analyses and data collection, and the a-priori theoretical expectations underlying the
identified explanatory variables. The chapter also provides a description of the study area.
3.2 Theoretical Framework
Market participation decisions usually results from the joint decision of production and
consumption. Therefore, the basic non-separable agricultural household production and
consumption model as developed by Singh et al. (1986) was employed. The key assumption
underlying this model is that market failure for both factor and product markets make the
production and consumption decisions of agricultural households non-separable (Sadoulet &
Janvry, 1995; Singh et al. 1986; Tabe-Ojong & Mausch, 2017). However, households maximise
their utility by choosing their level of consumption (𝑐𝑖), production volume (𝑞𝑖), productivity level
(𝑏𝑖), proportion of output available to be sold (𝑠𝑖), obtained in the production process with the
application of inputs (𝑥𝑘) and input price (𝑝𝑘) in production technology F. The household then
maximises this utility subject to available income/cash constraint, input and output quantity
balance, production technology, the market prices and a set of non-negativity constraints as
represented in the equations below.
University of Ghana http://ugspace.ug.edu.gh

44
𝑀𝑎𝑥𝐶𝑖 ,𝑞𝑖,𝑏𝑖,𝑠𝑖,𝑥𝑘
𝑈(𝑐, 𝑧𝑢) (3.1)
subject to
∑ 𝑝𝑖𝑚𝑁
𝑖=1 (𝑠𝑖 − 𝑏𝑖) − ∑ 𝑝𝑘𝑥𝑘𝑀𝑘=1 + 𝑌 ≥ 0 (3.2)
𝑞𝑖 − 𝑥𝑘 − 𝐶𝑖 + 𝑏𝑖 − 𝑠𝑖 + 𝐸𝑖 + 𝑇𝑖 = 0 (3.3)
𝐹(𝑞, 𝑥: 𝑧𝑝, 𝑧𝑚) ≥ 0 (3.4)
𝑝𝑖𝑚 is given (3.5)
𝐶𝑖 , 𝑞𝑖 , 𝑏𝑖 , 𝑠𝑖 , 𝑥𝑘 ≥ 0 (3.6)
𝑖 = 1, … 𝑁 𝑎𝑛𝑑 𝑘 = 1, … 𝑀
Where 𝑝𝑖𝑚 is the market price of cowpea i, 𝐸𝑖 denotes resource endowments/institutional factors,
transaction costs is represented by 𝑇𝑖. 𝑧𝑢, 𝑧𝑝 and 𝑧𝑚 are vectors of household production
characteristic, productivity measure and characteristic measuring the intensity of market
participation respectively. Y represents transfers and other incomes while F represents the
production technology of the household. The available farm production income and the revenue
from sales and other off-farm activities must be greater than or equal to the expenditure from
household purchases and inputs used in production. The input and output balance also suggest that
the total quantity consumed, used as input and sold in the market cannot exceed the quantities
produced, bought and the endowment of the household. The production technology constraint
refers to a production function that is well-behaved and relates all physical inputs to physical
output considering other production shifters.
Transaction costs (TC) have been identified to greatly impact market participation. For instance,
Alene et al. (2008), Barrett (2008) and Burke et al. (2015) have used the concept of transaction
cost to explain the market participation behaviour of farmers Transaction cost includes distance to
University of Ghana http://ugspace.ug.edu.gh
45
the nearest market and access to market information and ownership of means of transportation
(Sadoulet & Janvry, 1995). Therefore, assuming the influence of transaction costs is stated as
follows (𝑡𝑖𝑐(𝐴, 𝐺, 𝑍, 𝑌)) for trading in the market at a price 𝑝𝑖
𝑚 for each good i. Transaction costs
can either be proportional transaction cost (𝑃𝑇𝐶, 𝑡𝑖𝑝) or fixed transaction cost (𝐹𝑇𝐶, 𝑡𝑖
𝑓). These
costs are jointly dependent on private asset holding, 𝐴 (landownership, labour, off-farm-income,
access to improved cowpea seed, total output, household income, and livestock holding), public
assets and services vector 𝐺 (access to tractor for ploughing, extension, proximity to good road
network, credit) as well as household characteristics (e.g age, gender, dependency ratio, education,
farm size etc.), represented by the vector 𝑍.
3.3 Conceptual Framework
The conceptual framework presented in Figure 3.1 outlines the pathway that underpins smallholder
farmers’ market participation and productivity decision making. Smallholder farmers first and
foremost decide whether or not to be producers or non-producers of a commodity. Conditional on
the smallholder farmer deciding to be producers, it means they have the comparative advantage in
producing the commodity based on the theory of market participation. They then decide whether
or not to produce and sell in the market and be market participants or for household or auto-
consumption and be non-market participants. In some cases some of the smallholder producers
also participate in the market by buying from the market or from other producers. Conditional on
being a market participant, the final decision the household makes is in relation to the proportion
or volume of output to be sold or if they participate as buyers the proportion or volume of output
to be bought. In producing for trading or marketing purposes, some of the smallholders again
consume some of the produce obtained and trade or market the surplus from their production. It is
expected that in trading the surplus from their production volume, they generate income. The
University of Ghana http://ugspace.ug.edu.gh
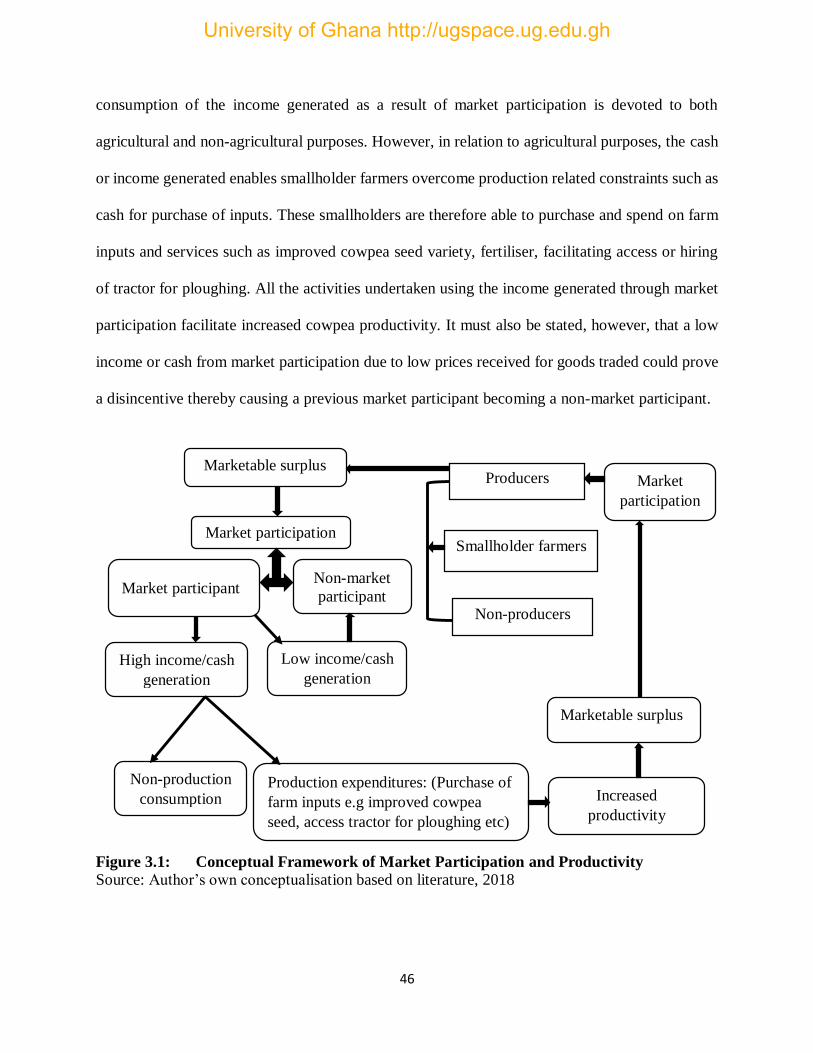
46
consumption of the income generated as a result of market participation is devoted to both
agricultural and non-agricultural purposes. However, in relation to agricultural purposes, the cash
or income generated enables smallholder farmers overcome production related constraints such as
cash for purchase of inputs. These smallholders are therefore able to purchase and spend on farm
inputs and services such as improved cowpea seed variety, fertiliser, facilitating access or hiring
of tractor for ploughing. All the activities undertaken using the income generated through market
participation facilitate increased cowpea productivity. It must also be stated, however, that a low
income or cash from market participation due to low prices received for goods traded could prove
a disincentive thereby causing a previous market participant becoming a non-market participant.
Figure 3.1: Conceptual Framework of Market Participation and Productivity
Source: Author’s own conceptualisation based on literature, 2018
Smallholder farmers
High income/cash
generation
Marketable surplus
Production expenditures: (Purchase of
farm inputs e.g improved cowpea
seed, access tractor for ploughing etc)
Non-production
consumption
Market
participation
Increased
productivity
Marketable surplus
Producers
Non-producers
Market participation
Non-market
participant Market participant
Low income/cash
generation
University of Ghana http://ugspace.ug.edu.gh

47
3.4 Analytical Framework of Market Participation and Productivity
Following from the conceptual framework in Figure 3.1, the analytical framework linked the
factors that influence cowpea production, productivity and market participation decisions.
Probability of cowpea production and market participation decisions was analysed simultaneously
using the triple hurdle model. Smallholders decide whether to be cowpea producers or non-
producers while also deciding either to be market participants or non-market participants.
Conditional on being a market participant, the intensity of participation or proportion of output
sold is determined. This intensity of market participation is hypothesised to affect productivity.
In Figure 3.2, the arrows from household characteristics, resource endowments (private and public
assets and service variables)/institutional factors, transactions costs, location variables, and market
price(s) are all hypothesised affect cowpea production, productivity and market participation
decisions.
Figure 3.2: Analytical Framework of Market Participation and Productivity
Source: Author’s own conceptualisation based on literature, 2018.
Smallholder
Farmers
Transaction Costs
Market Prices
Resource Endowments
(Private and Public
assets, and Services)
Household
Characteristics
Market Participation
Producers Non-producers
Productivity Location
Variables
University of Ghana http://ugspace.ug.edu.gh

48
3.5 Methods of Data Analyses
This section presents the description of analytical methods employed in achieving the specific
objectives of the study: i) Identifying the factors affecting smallholder farmers’ decision to
produce cowpea, ii) Identifying the factors that influence smallholder farmers’ decision to
participate in the cowpea markets and iv) Identifying the factors influencing the intensity of
participation in the cowpea market and, iv) Determining the extent to which smallholder farmers’
intensity of participation in the cowpea market affect their level of productivity.
However, the study is limited in scope. Burke et al. (2015) and Lifeyo (2017) theoretically
classified market participants in the output markets into three distinct categories: net sellers
(households with positive net sales), autarkic (households with zero net sales or households who
produce purposely for household consumption) and net buyers (households with negative net
sales). This study however lacked the required comprehensive data set in terms of quantity of
cowpea output bought from the market by respondents to perform such an estimation.
This study operationalised market participants as farmers with an aggregate supply of cowpea to
the market which is greater than zero, in other words farmers who are net sellers. Though the
proportion of non-cowpea producers in the sample was relatively small, it did not significantly
impact on the estimates obtained from the study since the sample size of sixty (60) which used for
non-producers in the estimations was statistically sufficiently large enough (Boss & Hughes-
Oliver, 2000). Additionally, the determination of which of the communities within the districts to
select was also informed by physical access and therefore the sample may be biased towards
households with relatively better market access.
University of Ghana http://ugspace.ug.edu.gh
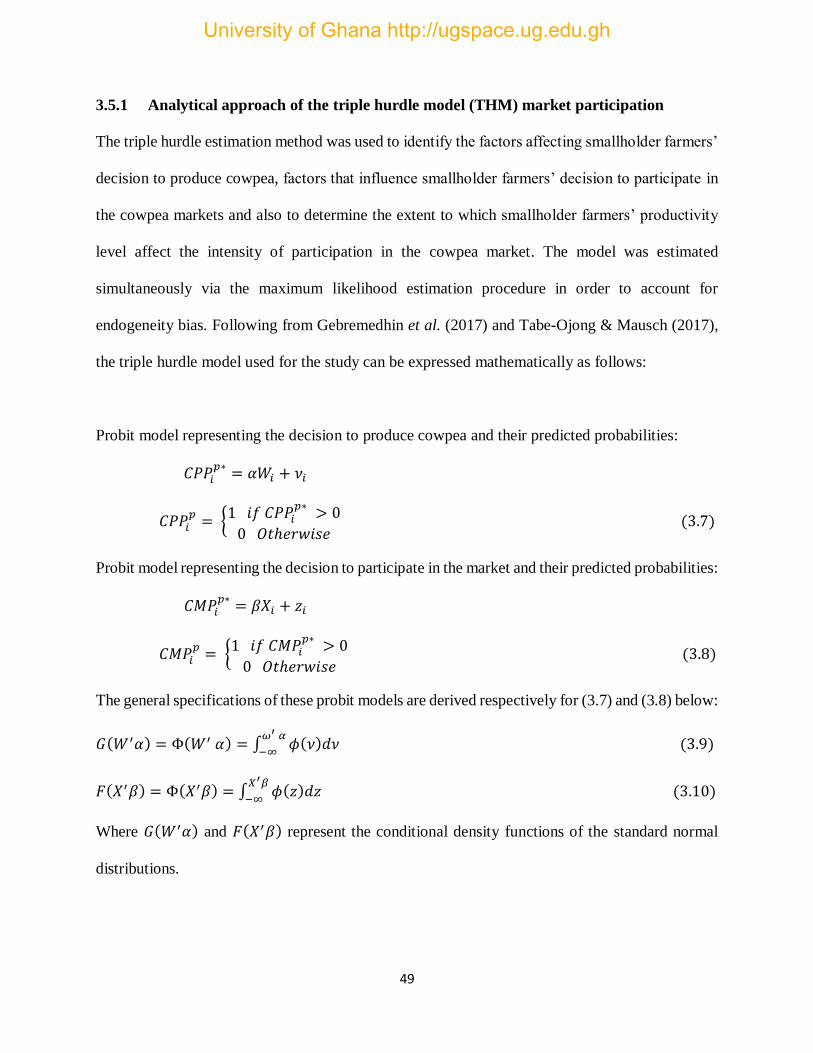
49
3.5.1 Analytical approach of the triple hurdle model (THM) market participation
The triple hurdle estimation method was used to identify the factors affecting smallholder farmers’
decision to produce cowpea, factors that influence smallholder farmers’ decision to participate in
the cowpea markets and also to determine the extent to which smallholder farmers’ productivity
level affect the intensity of participation in the cowpea market. The model was estimated
simultaneously via the maximum likelihood estimation procedure in order to account for
endogeneity bias. Following from Gebremedhin et al. (2017) and Tabe-Ojong & Mausch (2017),
the triple hurdle model used for the study can be expressed mathematically as follows:
Probit model representing the decision to produce cowpea and their predicted probabilities:
𝐶𝑃𝑃𝑖𝑝∗
= 𝛼𝑊𝑖 + 𝜈𝑖
𝐶𝑃𝑃𝑖𝑝
= {1 𝑖𝑓 𝐶𝑃𝑃𝑖𝑝∗
> 0
0 𝑂𝑡ℎ𝑒𝑟𝑤𝑖𝑠𝑒 (3.7)
Probit model representing the decision to participate in the market and their predicted probabilities:
𝐶𝑀𝑃𝑖𝑝∗
= 𝛽𝑋𝑖 + 𝑧𝑖
𝐶𝑀𝑃𝑖𝑝
= {1 𝑖𝑓 𝐶𝑀𝑃𝑖𝑝∗
> 0
0 𝑂𝑡ℎ𝑒𝑟𝑤𝑖𝑠𝑒 (3.8)
The general specifications of these probit models are derived respectively for (3.7) and (3.8) below:
𝐺(𝑊′𝛼) = Φ(𝑊′ 𝛼) = ∫ 𝜙(𝜈)𝑑𝜈 𝜔′ 𝛼
−∞ (3.9)
𝐹(𝑋′𝛽) = Φ(𝑋′𝛽) = ∫ 𝜙(𝑧)𝑑𝑧 (3.10)𝑋′𝛽
−∞
Where 𝐺(𝑊′𝛼) and 𝐹(𝑋′𝛽) represent the conditional density functions of the standard normal
distributions.
University of Ghana http://ugspace.ug.edu.gh

50
Truncated regression model of the intensity of participation in the market (proportion of sales):
𝐼𝑀𝑃𝑖∗ = 𝛿𝑉𝑖 + 𝑢𝑖
𝐼𝑀𝑃𝑖 = { 𝐼𝑀𝑃𝑖∗ 𝑖𝑓 𝐼𝑀𝑃𝑖
∗ > 0 𝑎𝑛𝑑 𝐼𝑀𝑃𝑖𝑝
= 1
0 𝑂𝑡ℎ𝑒𝑟𝑤𝑖𝑠𝑒 (3.11)
The general specification of the truncated regression model is also represented below:
Ε(𝑦|𝑦 > 0) = 𝑉′𝛿 + 𝜎𝜆 [𝑉′𝛿
𝜎] (3.12)
Where 𝐶𝑃𝑃𝑖𝑝∗
, 𝐶𝑀𝑃𝑖𝑝∗
and 𝐼𝑀𝑃𝑖∗ are the unobserved latent variables representing the probability
to participate in cowpea production, market participation and the intensity of participation or
proportion of volume of output sold respectively by the ith smallholder farmer. 𝑾 and 𝑿 represent
vector of exogenous variables that affect the likelihood of cowpea production and the probability
of selling in the market respectively, and 𝑽 a vector of exogenous variables hypothesised to be
associated with the intensity of market participation defined in terms of proportion of cowpea
harvest sold (marketed) by smallholder farmers with 𝛼, 𝛽 and 𝛿 representing their corresponding
parameter estimates. Equation (3.7) signifies the probability of producing cowpea, and it is a binary
choice of whether to produce cowpea or not. It assumes the value of 1 if the household produces
cowpea or 0 otherwise. Equation (3.8) also signifies the probability of participation in the market,
and it is a binary decision of either participating as a seller or not. It assumes the value of 1 if the
smallholder participates in the market as a seller or 0 otherwise. Equation (3.11) represents the
intensity of market participation which is the decision regarding the proportion of the volume of
cowpea harvest sold in the market. The dependent variable is measured as the proportion of
marketed quantity of production of cowpea by producers based on their level of productivity. The
graphical representation of the triple-hurdle model market participation is represented in Figure
3.3.
University of Ghana http://ugspace.ug.edu.gh

51
Regionally representative smallholder farmer sample
Stage 1
Probit [Cowpea Production decision]
Stage 2
Probit [Market Participation decision]
Stage 3 [Intensity of Participation decision]
Truncated Regression
Figure 3.3: Graphical Representation of the THM Market Participation
Source: Adapted from Gebremedhin et al. (2017) with modifications.
3.5.3 Empirical models for the THM market participation
The triple hurdle model is specified as a function of household characteristics (hc), transaction
costs (tc), resource endowments (re), market price (p) and location variables (l). The estimated
models are therefore depicted as follows:
𝐶𝑜𝑤𝑝𝑒𝑎 𝑃𝑟𝑜𝑑𝑢𝑐𝑡𝑖𝑜𝑛 𝑃𝑎𝑟𝑡𝑖𝑐𝑖𝑝𝑎𝑡𝑖𝑜𝑛 (𝐶𝑃𝑃) = (ℎ𝑐, 𝑡𝑐, 𝑟𝑒, 𝑝, 𝑙) (3.13)
𝐶𝑜𝑤𝑝𝑒𝑎 𝑀𝑎𝑟𝑘𝑒𝑡 𝑃𝑎𝑟𝑡𝑖𝑐𝑖𝑝𝑎𝑡𝑖𝑜𝑛 (𝐶𝑀𝑃) = (ℎ𝑐, 𝑡𝑐, 𝑟𝑒, 𝑝, 𝑙) (3.14)
𝐼𝑛𝑡𝑒𝑛𝑠𝑖𝑡𝑦 𝑜𝑓 𝑀𝑎𝑟𝑘𝑒𝑡 𝑃𝑎𝑟𝑡𝑖𝑐𝑖𝑝𝑎𝑡𝑖𝑜𝑛 (𝐼𝑀𝑃) = (ℎ𝑐, 𝑡𝑐, 𝑟𝑒, 𝑝, 𝑙) (3.15)
Non-cowpea producers
(𝐶𝑖=0)
Cowpea producers
(𝐶𝑖=1)
Non-cowpea market participant
(𝑂1𝑖=0 |𝐶𝑖 = 1)
Cowpea market participant
(𝑂1𝑖 = 1 |𝐶𝑖 = 1)
Proportion of output volume sold
𝐸(𝑂2𝑖|𝑂1𝑖 = 1 )
University of Ghana http://ugspace.ug.edu.gh
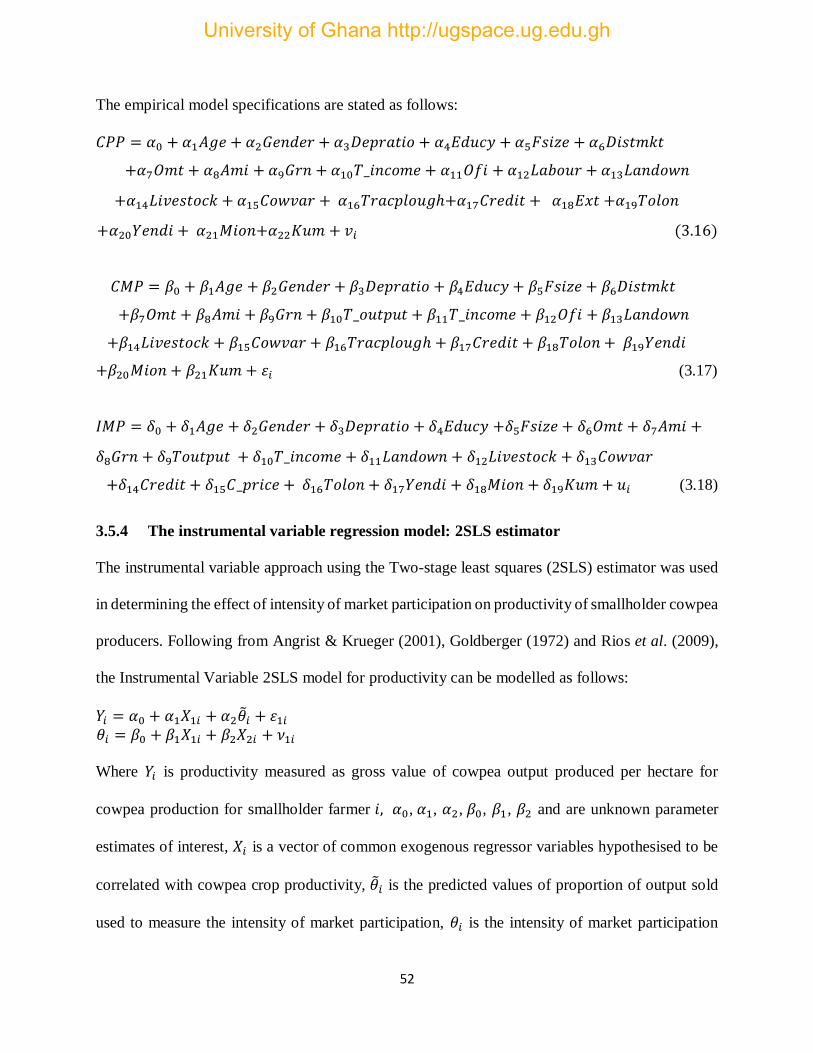
52
The empirical model specifications are stated as follows:
𝐶𝑃𝑃 = 𝛼0 + 𝛼1𝐴𝑔𝑒 + 𝛼2𝐺𝑒𝑛𝑑𝑒𝑟 + 𝛼3𝐷𝑒𝑝𝑟𝑎𝑡𝑖𝑜 + 𝛼4𝐸𝑑𝑢𝑐𝑦 + 𝛼5𝐹𝑠𝑖𝑧𝑒 + 𝛼6𝐷𝑖𝑠𝑡𝑚𝑘𝑡
+𝛼7𝑂𝑚𝑡 + 𝛼8𝐴𝑚𝑖 + 𝛼9𝐺𝑟𝑛 + 𝛼10𝑇_𝑖𝑛𝑐𝑜𝑚𝑒 + 𝛼11𝑂𝑓𝑖 + 𝛼12𝐿𝑎𝑏𝑜𝑢𝑟 + 𝛼13𝐿𝑎𝑛𝑑𝑜𝑤𝑛
+𝛼14𝐿𝑖𝑣𝑒𝑠𝑡𝑜𝑐𝑘 + 𝛼15𝐶𝑜𝑤𝑣𝑎𝑟 + 𝛼16𝑇𝑟𝑎𝑐𝑝𝑙𝑜𝑢𝑔ℎ+𝛼17𝐶𝑟𝑒𝑑𝑖𝑡 + 𝛼18𝐸𝑥𝑡 +𝛼19𝑇𝑜𝑙𝑜𝑛
+𝛼20𝑌𝑒𝑛𝑑𝑖 + 𝛼21𝑀𝑖𝑜𝑛+𝛼22𝐾𝑢𝑚 + 𝑣𝑖 (3.16)
𝐶𝑀𝑃 = 𝛽0 + 𝛽1𝐴𝑔𝑒 + 𝛽2𝐺𝑒𝑛𝑑𝑒𝑟 + 𝛽3𝐷𝑒𝑝𝑟𝑎𝑡𝑖𝑜 + 𝛽4𝐸𝑑𝑢𝑐𝑦 + 𝛽5𝐹𝑠𝑖𝑧𝑒 + 𝛽6𝐷𝑖𝑠𝑡𝑚𝑘𝑡
+𝛽7𝑂𝑚𝑡 + 𝛽8𝐴𝑚𝑖 + 𝛽9𝐺𝑟𝑛 + 𝛽10𝑇_𝑜𝑢𝑡𝑝𝑢𝑡 + 𝛽11𝑇_𝑖𝑛𝑐𝑜𝑚𝑒 + 𝛽12𝑂𝑓𝑖 + 𝛽13𝐿𝑎𝑛𝑑𝑜𝑤𝑛
+𝛽14𝐿𝑖𝑣𝑒𝑠𝑡𝑜𝑐𝑘 + 𝛽15𝐶𝑜𝑤𝑣𝑎𝑟 + 𝛽16𝑇𝑟𝑎𝑐𝑝𝑙𝑜𝑢𝑔ℎ + 𝛽17𝐶𝑟𝑒𝑑𝑖𝑡 + 𝛽18𝑇𝑜𝑙𝑜𝑛 + 𝛽19𝑌𝑒𝑛𝑑𝑖
+𝛽20𝑀𝑖𝑜𝑛 + 𝛽21𝐾𝑢𝑚 + 휀𝑖 (3.17)
𝐼𝑀𝑃 = 𝛿0 + 𝛿1𝐴𝑔𝑒 + 𝛿2𝐺𝑒𝑛𝑑𝑒𝑟 + 𝛿3𝐷𝑒𝑝𝑟𝑎𝑡𝑖𝑜 + 𝛿4𝐸𝑑𝑢𝑐𝑦 +𝛿5𝐹𝑠𝑖𝑧𝑒 + 𝛿6𝑂𝑚𝑡 + 𝛿7𝐴𝑚𝑖 +
𝛿8𝐺𝑟𝑛 + 𝛿9𝑇𝑜𝑢𝑡𝑝𝑢𝑡 + 𝛿10𝑇_𝑖𝑛𝑐𝑜𝑚𝑒 + 𝛿11𝐿𝑎𝑛𝑑𝑜𝑤𝑛 + 𝛿12𝐿𝑖𝑣𝑒𝑠𝑡𝑜𝑐𝑘 + 𝛿13𝐶𝑜𝑤𝑣𝑎𝑟
+𝛿14𝐶𝑟𝑒𝑑𝑖𝑡 + 𝛿15𝐶_𝑝𝑟𝑖𝑐𝑒 + 𝛿16𝑇𝑜𝑙𝑜𝑛 + 𝛿17𝑌𝑒𝑛𝑑𝑖 + 𝛿18𝑀𝑖𝑜𝑛 + 𝛿19𝐾𝑢𝑚 + 𝑢𝑖 (3.18)
3.5.4 The instrumental variable regression model: 2SLS estimator
The instrumental variable approach using the Two-stage least squares (2SLS) estimator was used
in determining the effect of intensity of market participation on productivity of smallholder cowpea
producers. Following from Angrist & Krueger (2001), Goldberger (1972) and Rios et al. (2009),
the Instrumental Variable 2SLS model for productivity can be modelled as follows:
𝑌𝑖 = 𝛼0 + 𝛼1𝑋1𝑖 + 𝛼2�̃�𝑖 + 휀1𝑖
𝜃𝑖 = 𝛽0 + 𝛽1𝑋1𝑖 + 𝛽2𝑋2𝑖 + 𝜈1𝑖
Where 𝑌𝑖 is productivity measured as gross value of cowpea output produced per hectare for
cowpea production for smallholder farmer 𝑖, 𝛼0, 𝛼1, 𝛼2, 𝛽0, 𝛽1, 𝛽2 and are unknown parameter
estimates of interest, 𝑋𝑖 is a vector of common exogenous regressor variables hypothesised to be
correlated with cowpea crop productivity, �̃�𝑖 is the predicted values of proportion of output sold
used to measure the intensity of market participation, 𝜃𝑖 is the intensity of market participation
University of Ghana http://ugspace.ug.edu.gh
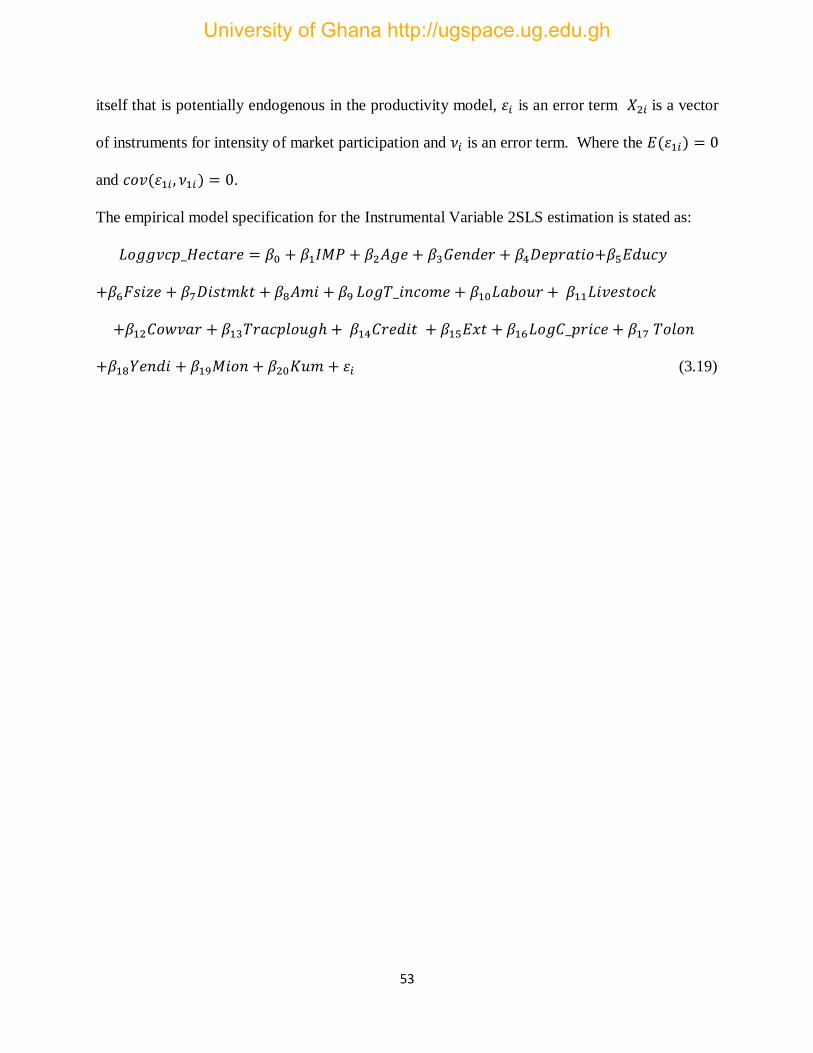
53
itself that is potentially endogenous in the productivity model, 휀𝑖 is an error term 𝑋2𝑖 is a vector
of instruments for intensity of market participation and 𝜈𝑖 is an error term. Where the 𝛦(휀1𝑖) = 0
and 𝑐𝑜𝑣(휀1𝑖 , 𝜈1𝑖 ) = 0.
The empirical model specification for the Instrumental Variable 2SLS estimation is stated as:
𝐿𝑜𝑔𝑔𝑣𝑐𝑝_𝐻𝑒𝑐𝑡𝑎𝑟𝑒 = 𝛽0 + 𝛽1𝐼𝑀𝑃 + 𝛽2𝐴𝑔𝑒 + 𝛽3𝐺𝑒𝑛𝑑𝑒𝑟 + 𝛽4𝐷𝑒𝑝𝑟𝑎𝑡𝑖𝑜+𝛽5𝐸𝑑𝑢𝑐𝑦
+𝛽6𝐹𝑠𝑖𝑧𝑒 + 𝛽7𝐷𝑖𝑠𝑡𝑚𝑘𝑡 + 𝛽8𝐴𝑚𝑖 + 𝛽9 𝐿𝑜𝑔𝑇_𝑖𝑛𝑐𝑜𝑚𝑒 + 𝛽10𝐿𝑎𝑏𝑜𝑢𝑟 + 𝛽11𝐿𝑖𝑣𝑒𝑠𝑡𝑜𝑐𝑘
+𝛽12𝐶𝑜𝑤𝑣𝑎𝑟 + 𝛽13𝑇𝑟𝑎𝑐𝑝𝑙𝑜𝑢𝑔ℎ + 𝛽14𝐶𝑟𝑒𝑑𝑖𝑡 + 𝛽15𝐸𝑥𝑡 + 𝛽16𝐿𝑜𝑔𝐶_𝑝𝑟𝑖𝑐𝑒 + 𝛽17 𝑇𝑜𝑙𝑜𝑛
+𝛽18𝑌𝑒𝑛𝑑𝑖 + 𝛽19𝑀𝑖𝑜𝑛 + 𝛽20𝐾𝑢𝑚 + 휀𝑖 (3.19)
University of Ghana http://ugspace.ug.edu.gh
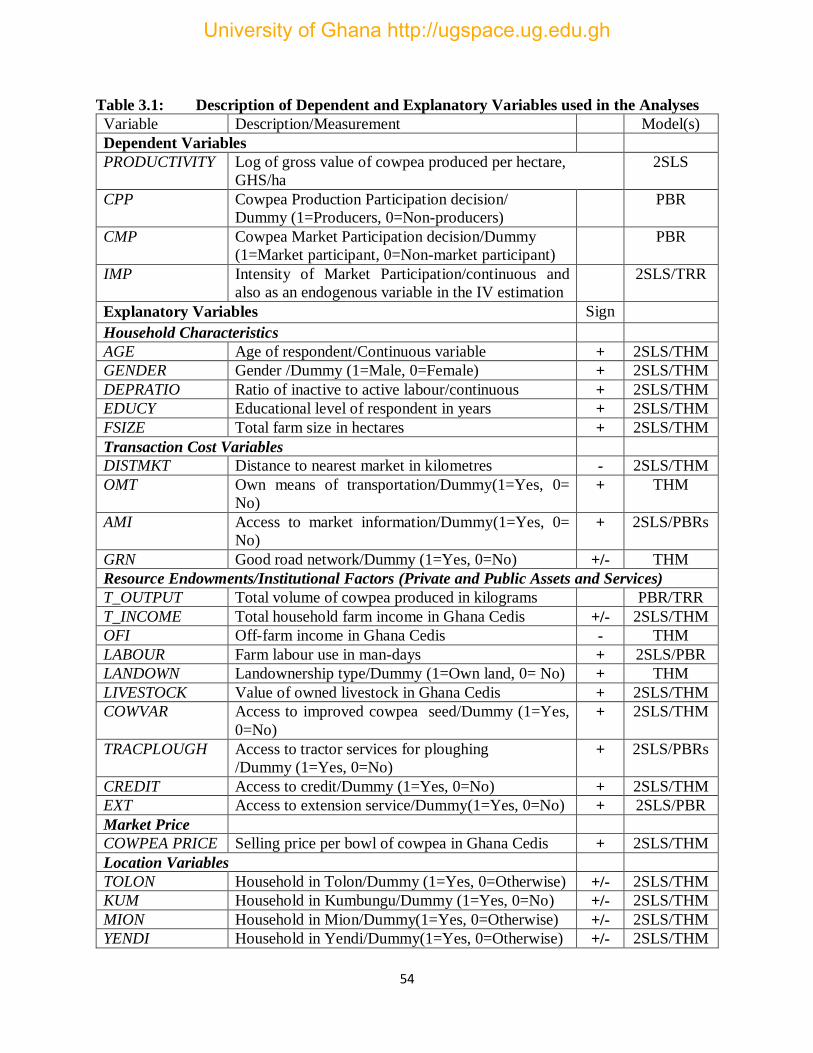
54
Table 3.1: Description of Dependent and Explanatory Variables used in the Analyses
Variable Description/Measurement Model(s)
Dependent Variables
PRODUCTIVITY Log of gross value of cowpea produced per hectare,
GHS/ha
2SLS
CPP Cowpea Production Participation decision/
Dummy (1=Producers, 0=Non-producers) PBR
CMP Cowpea Market Participation decision/Dummy
(1=Market participant, 0=Non-market participant) PBR
IMP Intensity of Market Participation/continuous and
also as an endogenous variable in the IV estimation 2SLS/TRR
Explanatory Variables Sign
Household Characteristics
AGE Age of respondent/Continuous variable + 2SLS/THM
GENDER Gender /Dummy (1=Male, 0=Female) + 2SLS/THM
DEPRATIO Ratio of inactive to active labour/continuous + 2SLS/THM
EDUCY Educational level of respondent in years + 2SLS/THM
FSIZE Total farm size in hectares + 2SLS/THM
Transaction Cost Variables
DISTMKT Distance to nearest market in kilometres - 2SLS/THM
OMT Own means of transportation/Dummy(1=Yes, 0=
No) + THM
AMI Access to market information/Dummy(1=Yes, 0=
No) + 2SLS/PBRs
GRN Good road network/Dummy (1=Yes, 0=No) +/- THM
Resource Endowments/Institutional Factors (Private and Public Assets and Services)
T_OUTPUT Total volume of cowpea produced in kilograms PBR/TRR
T_INCOME Total household farm income in Ghana Cedis +/- 2SLS/THM
OFI Off-farm income in Ghana Cedis - THM
LABOUR Farm labour use in man-days + 2SLS/PBR
LANDOWN Landownership type/Dummy (1=Own land, 0= No) + THM
LIVESTOCK Value of owned livestock in Ghana Cedis + 2SLS/THM
COWVAR Access to improved cowpea seed/Dummy (1=Yes,
0=No)
+ 2SLS/THM
TRACPLOUGH Access to tractor services for ploughing
/Dummy (1=Yes, 0=No) + 2SLS/PBRs
CREDIT Access to credit/Dummy (1=Yes, 0=No) + 2SLS/THM
EXT Access to extension service/Dummy(1=Yes, 0=No) + 2SLS/PBR
Market Price
COWPEA PRICE Selling price per bowl of cowpea in Ghana Cedis + 2SLS/THM
Location Variables
TOLON Household in Tolon/Dummy (1=Yes, 0=Otherwise) +/- 2SLS/THM
KUM Household in Kumbungu/Dummy (1=Yes, 0=No) +/- 2SLS/THM
MION Household in Mion/Dummy(1=Yes, 0=Otherwise) +/- 2SLS/THM
YENDI Household in Yendi/Dummy(1=Yes, 0=Otherwise) +/- 2SLS/THM
University of Ghana http://ugspace.ug.edu.gh
55
Household characteristics
Household characteristics are denoted by five controlled variables, which are, the age (AGE),
gender (GENDER), educational level (EDUY), dependency ratio (DEPRATIO) and farm size
(FSIZE). Age is expected to have positive association with production, participation in agricultural
market and productivity. The hypothesis is that older farmers are expected to be more experienced
in production and marketing decision making. Male smallholder farmers are perceived to have
more access to productive assets such as land, labour and capital which increases their production
capabilities and hence, a positive relationship is expected with production, productivity and market
participation. Educational attainment enhances smallholder farmers’ prospects of obtaining and
processing market information accurately (Makhura, et al. 2001) as well as adoption of
productivity enhancing techniques and thus, a positive relationship with production, market
participation and productivity are expected.
Dependency ratio is expected to positively influence productivity, decision to produce and market
participation since the lesser this ratio, the higher the availability of active labour force in the
household to engage in production and market participation activities. According to Olwande &
Mathenge (2012), farm size may have indirect positive impacts on productivity and market
participation. Larger farm size enables farmers to create marketable surpluses, surmount cash
constraints in situation where land can be used as collateral for credit, and permit farmers to
embrace improved technologies that increase productivity. Therefore positive relationship is
expected between farm size and productivity, decisions to produce and market participation
decisions.
University of Ghana http://ugspace.ug.edu.gh
56
Transaction costs variables
Transaction costs variables are the key market participation and intensity of participation
determining variables. These variables according to Key et al. (2000) are mostly not observable in
survey data and are therefore represented with proxy variables hypothesised to be observable
factors that represent them. Two of these variables were used as candidate instruments for the
intensity of market participation (proportion of output sold) hypothesised to be endogenous in the
productivity model, and they affect productivity only through participation in the market. These
variables include ownership of means of transportation (OMT) and proximity to all-weather good
road (GRN). The plausibility of each of these instrumental variable and their legitimacy is
dependent on the extent to which it is associated with farmers’ productivity through their
participation in the market and not any production relationship directly (Rios et al. 2009). These
two variables were used as instrumental variables in the 2SLS estimation and as explanatory
variables in the THM.
Other transaction costs variables such as access to market information (AMI) and distance to
nearest market (DISTMKT) are expected to affect production, productivity and market
participation. With distance to nearest market, the hypothesis is that, the longer the distance to the
nearest market, the lesser the production, selling orientation of the smallholder and hence the lower
will be their productivity. The rest of the variables are also expected to positively influence market
participation. For example, ownership of means of transportation reduces the marginal cost of
movement, access to market information also reduces the problem of information asymmetry in
the market place, viability of access roads influence the speed and cost of transportation. Literature
however, reports diverse inferences on the correlation between good road infrastructure and market
participation decisions. While some studies Boughton et al. (2007), Goetz (1992), Key et al.
University of Ghana http://ugspace.ug.edu.gh
57
(2000), Heltberg & Tarp (2001) and Renkow et al. (2004) report infrastructure as an influential
factor in market participation, studies by other authors such as (Lapar et al. 2003; Holloway &
Lapar 2007) indicate that infrastructure is not correlated with market participation decisions.
Moreover, this perceived relationship between infrastructure and sales-orientation is found to vary
among sellers and buyers (Goetz 1992; Key et al. 2000).
Resource endowments (private and public assets and services)/Institutional factors
Resource endowment factors of production measure the wealth of the farm households. Possession
of productive assets (private and public assets) and services are mentioned as important factors of
agricultural production (Rios et al. 2009; Schultz, 1964) and market participation (Boughton et al.
2007). Private and public assets variables and service variables used as controlled variables in both
models include total household production (T_OUTPUT), total household income (T_INCOME),
household off-farm income (OFI), and labour usage (LABOUR). The rest include possession of
own land by the household head (LANDOWN), value of owned livestock (LIVESTOCK), access to
credit (CREDIT) and access to extension services (EXT). Income obtained from trading activities
may influence market participation and productivity since farmers are able to devote some of this
income to production expenditure such as purchase of farm inputs. Therefore the effect of total
income on productivity and market participation decisions is expected to be indefinite. The greater
the volume of total output produced the greater the propensity to sell and therefore positive
relationship is expected between total output and market participation decisions. The higher the
value of off-farm income, the lesser the time apportioned to farming activities resulting in lower
production and market participation decisions (Rios et al. 2009).
University of Ghana http://ugspace.ug.edu.gh

58
The number of man-days (labour) expended on cowpea production activities can potentially
positively raise the productivity level of farmers and by extension their market participation
activities. Having secured rights to land is mostly promoted as an avenue for generating incentives
for farmers to invest in technologies and practices that engender land conservation and raise
productivity in the long-run (Pingali & Rosegrant, 1995; Rios et al. 2009). Consequently, having
own land for farming activities is likely to positively affect market participation decisions.
Similarly, value of owned livestock, access to credit and extension services are potential variables
that positively influence market participation and productivity (Minten & Barrett, 2008). It is
however expected that the more visits the extension service provider pays to the farmers, the more
likely the farmer would produce and increase productivity.
Access to improved cowpea variety for cultivation (COWVAR) and access to tractor for ploughing
(TRACPLOUGH) are also expected to positively influence productivity, the decision to produce
and market participation decisions.
District market price
District market prices of cowpea output denoted as (COWPRICE) is expected to positively affect
the intensity of smallholders farmers’ sales-orientation and productivity, as theorised by Key et al.
(2000) and Alene et al. (2008). This variable measures the selling price of cowpea in the market.
Location variables
The unobserved location-specific effects were controlled using the districts as dummy variables.
These dummies were incorporated in the models as controlled variables to address dissimilarities
in the overall disparities in economic and social conditions of the various communities. These
location-specific disparities refer to infrastructure, inaccessibility, resource endowment,
University of Ghana http://ugspace.ug.edu.gh

59
production potential and farming conditions across districts. The relationships the results from
these dummies revealed are to be explained by the specific characteristics and attributes of each
of the location following from Mmbando et al. (2015). The dummy for Tolon district (TOLON)
was used as a reference and was left out of the model to avoid the dummy variable trap. Tolon was
used as the reference variable because it was identified to be the largest producer of cowpea as
shown in the results in table 4.6.
3.6 The Study Area
The Northern Region is predominantly an agrarian region occupying an area of about 70,384
square kilometres making it the largest region accounting for 29.5% of the total land area of Ghana
and regarded as one of the poorest and least developed regions. The total population of the region
based on the Population and Housing Census of 2010 stood at 2,479,461 with females (1,249,574)
representing 50.6% and males (1,229,887) representing 49.6%. The region was described as the
fastest growing region in the country having a population increase of 38.1% between 2000 and
2010 more than the other region in the country. The mainstay of the people in the region is
agriculture evidenced by the fact that 71.2% of the economically productive group are engaged in
agriculture. They are largely subsistence food crop producers with most of the populace living in
rural areas. The major crops grown are maize, yam, groundnut, cowpea, rice, millet, sorghum and
soybeans. The region has twenty-five administrative districts. The study focused on four of these
administrative districts namely Tolon, Kumbungu, Mion and Yendi which are among the top ten
cowpea producing districts in the Northern Region (MoFA-SRID, 2016).
The Tolon district lies between latitudes 90 15` and 100 02` North and Longitudes 00 53`and10 25`
West. It shares boundaries to the North with Kumbungu, North Gonja to the West, Central Gonja
University of Ghana http://ugspace.ug.edu.gh

60
to the South, and Sagnarigu Districts to the East. According to the 2010 Population and Housing
Census, the District’s population stands at 72,990 comprising of 36,360 males and 36,630 females.
Agricultural production accounts for about 74% of the district’s labour force reflecting the agrarian
nature of the economy. According to the District Directorate of Agriculture, the total area
cultivated for cowpea in 2013 production season was 3,300 hectares with a yield of 2 metric tonnes
per hectare making it one of the most cultivated crops in the district. Marketing of farm produce
however remains a major challenge due to inaccessible farms and marketing centres.
The Kumbungu district shares boundaries to the North with Mamprugu/Moagduri district, Tolon
and North Gonja districts to the West, Sagnarigu District to the South and Savelugu/Nanton
Municipal to the East. The total population of the district is 55,412 with males representing 50.1%
and females 49.9%. The district is entirely made up of rural farming communities with most of
them having populations less than 500. Agricultural production is the main economic activity in
the district and is practised mainly on seasonal and subsistence level with a few engaged in
irrigation farming around the Bontaga Dam. Across the district, most people cultivate food crops
like maize, rice, groundnuts, yam, and cowpea among others. The problem of marketing of farm
produce is challenge facing most farmers in the district.
The Mion district is located in the Eastern corridor enclave of the Northern Region of the Republic
of Ghana. It shares boundaries with Yendi Municipal to the East, Tamale Metropolitan and
Savelugu Municipal to the West, Gushegu and Karaga to the North and Nanumba North and East
Gonja to the South. The population of the district, according to the 2010 Population and Housing
Census, is 81,812 with relatively more females (50.3%) than males (49.7%). The Economy of the
people is largely subsistence with agriculture being their main occupation with over 95% of the
University of Ghana http://ugspace.ug.edu.gh
61
people depending on agriculture for their livelihood. The major food crops cultivated include
maize, yam, rice, millet, groundnut, cowpea and soyabean.
The Yendi municipality is also located in the Eastern corridor enclave of the Northern Region. It
lies between Latitude 90–350 North and 00–300 West and 00–150 East. The Municipality shares
boundaries with six (6) other District Assemblies; to the East; Saboba District, Chereponi District
and Zabzugu District, to the South Nanumba North District, to the North Gushegu District and
Mion District to the West. According to the 2010 Population and Housing census, the population
of the Municipality is 117,780. Out of the total population, 50% are males and females (50%). The
majority of the people in the municipality are involved in subsistence agriculture with over 80
percent of the people depending on agriculture for their livelihood. Cultivation of cowpea is among
one of the numerous farming activities undertaken by the inhabitants of the municipality.
University of Ghana http://ugspace.ug.edu.gh

62
Figure 3.4: Map of the Study Area Showing Sampled Districts and Communities
Source: CERSGIS, University of Ghana, Legon, 2018.
3.7 Methods of Data Collection
This section presents the sources and types of data collected for the study. It also presents the
sampling approach adopted and the sample size used for the analyses.
3.7.1 Sources and types of data
Primary cross-sectional data were mainly used for the study. The primary data were collected using
a household survey semi-structured questionnaire administered through an interview of
smallholder cowpea producers and non-cowpea producers.
University of Ghana http://ugspace.ug.edu.gh

63
The questionnaire was designed to collect an extensive range of data on volume of cowpea
produced by producers, farmer characteristics such as age, gender, farm experience, and household
size, among others. Data on resource endowments that capture both public and private assets
variables, and services variables such as, off-farm income, access to tractor services for ploughing
and access to improved cowpea seed were also collected. Transaction costs variables including
distance to markets, ownership of means of transportation among others were also collected. Non-
cowpea producers were also identified and interviewed.
3.7.2 Sample size and sampling approach
The main population for the study comprised smallholder farmers (farmers who cultivate at most
2 ha of cowpea during the study period). All cowpea farmers who produced on more than 2 ha
land holding of cowpea are excluded from the sample and therefore not considered as a
smallholding. A cowpea farmer for the purpose of this study is a farmer who produces cowpea as
a monocrop or as an intercrop. A non-producer on the other hand is a farmer who does not produce
cowpea but has the potential to produce the crop. A sample size of 300 comprising of 240
producers and 60 non-producers were purposively and randomly sampled for the study. Sixty (60)
cowpea producers and fifteen (15) non-producers were selected from various communities in each
of the four (4) districts to make up the total sample size of three hundred (300). This sample size
was chosen partly for logistical considerations and it is large enough to make generalisations about
the population of interest in the Northern Region of Ghana.
A multi-stage sampling as well as key informants interview approaches were adopted for the study.
The multi-stage procedure is a three-stage; clustered, purposive and randomised sampling
procedure. The three stages involve selection of the districts, communities, and lastly, selection of
University of Ghana http://ugspace.ug.edu.gh
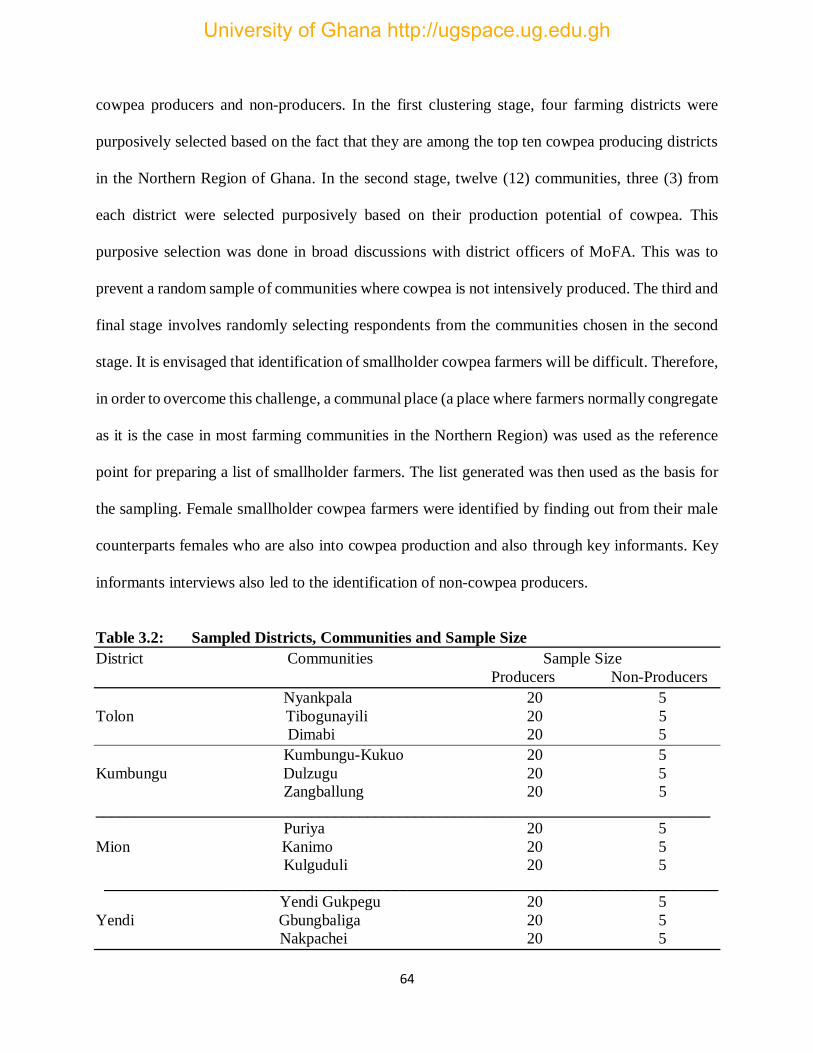
64
cowpea producers and non-producers. In the first clustering stage, four farming districts were
purposively selected based on the fact that they are among the top ten cowpea producing districts
in the Northern Region of Ghana. In the second stage, twelve (12) communities, three (3) from
each district were selected purposively based on their production potential of cowpea. This
purposive selection was done in broad discussions with district officers of MoFA. This was to
prevent a random sample of communities where cowpea is not intensively produced. The third and
final stage involves randomly selecting respondents from the communities chosen in the second
stage. It is envisaged that identification of smallholder cowpea farmers will be difficult. Therefore,
in order to overcome this challenge, a communal place (a place where farmers normally congregate
as it is the case in most farming communities in the Northern Region) was used as the reference
point for preparing a list of smallholder farmers. The list generated was then used as the basis for
the sampling. Female smallholder cowpea farmers were identified by finding out from their male
counterparts females who are also into cowpea production and also through key informants. Key
informants interviews also led to the identification of non-cowpea producers.
Table 3.2: Sampled Districts, Communities and Sample Size
District Communities Sample Size
Producers Non-Producers
Nyankpala 20 5
Tolon Tibogunayili 20 5
Dimabi 20 5
Kumbungu-Kukuo 20 5
Kumbungu Dulzugu 20 5
Zangballung 20 5
_____________________________________________________________________________
Puriya 20 5
Mion Kanimo 20 5
Kulguduli 20 5
_____________________________________________________________________________
Yendi Gukpegu 20 5
Yendi Gbungbaliga 20 5
Nakpachei 20 5
University of Ghana http://ugspace.ug.edu.gh

65
CHAPTER FOUR
RESULTS AND DISCUSSION
4.1 Introduction
This chapter presents the results and findings of the study. It begins with a detailed description of
the demographic and socioeconomic characteristics of cowpea producers in the Northern Region.
Detailed descriptions and summary statistics of continuous and binary variables used for the
analyses as well as farm and district characteristics are also presented. Also, productivity and
market participation characteristics in the Northern Region are discussed and presented. Finally,
the results of the determinants of cowpea productivity, production and market participation
decisions are identified and discussed.
4.2 Descriptive Statistical Analyses of Farmer and Socio-economic Characteristics
This section presents the descriptive analyses aspect of the results and discussion. It describes the
sample distribution of smallholder cowpea producing households in the region, the general farmer
and socio-economic characteristics of the sampled smallholder households. The section also
describes cowpea production, productivity and marketing characteristics of the respondents.
4.2.1 Sampled distribution of smallholder cowpea households in the northern region
The sampled distribution of smallholder cowpea households in the region includes 240 cowpea
producers and 60 non-producers. Ideally, there are expected to be more non-producers of cowpea
in the region than sampled. However, the figure of 60 used for the study is statistically reasonable
to make valid conclusions and inferences regarding cowpea production participation decision.
Eighty percent of the sampled smallholder farmers are producers and 20% are non-producers. All
of the interviewed cowpea producers are smallholder farmers with less or approximately 2 hectares
University of Ghana http://ugspace.ug.edu.gh

66
of farm size. Furthermore, of the 240 cowpea producers, 76.25% are market participants and
23.75% are non-participants. Table 4.1 displays these statistics.
Table 4.1: Production and Market Participation Behaviour of Smallholder Farmers
Cowpea Production and Market Participation Frequency Percentage
Cowpea production
Producer 240 80.00
Non-producer 60 20.00
Total 300 100.00
Cowpea market participation
Market participant 183 76.25
Non-market participant 57 23.75
Total 240 100.00
Source: Computation from Household Survey, 2018.
4.2.2 Farmer and socio-economic characteristics of sampled households
This section discusses the demographic and socio-economic attributes of cowpea producing
households. The characteristics discussed are age, gender, household size, religion, ethnicity,
educational attainment, experience in farming and farm size of household heads. The results of
these descriptive statistics are presented in table 4.2
Age Distribution of Household Heads
From Tables 4.2 and 4.3, the age of distribution of smallholder farmer households ranges from a
minimum of 18 to a maximum of 78. Majority 58.9% of households are within the age bracket of
18-35 years, 31.2% are between the age bracket of 36-40 years while 4.9% are respectively within
the age bracket of 51-60 and 60 and above years. Generally, 95% of the sample is within the
economically active age range 18-60. This presents prospects for developing agriculture in the
Northern Region. The mean age is about 36 years with majority of them falling in the 90th
percentile implying that family units in the Northern Region can be described as belonging to the
youthful category and within the economically active population age bracket. This has implication
University of Ghana http://ugspace.ug.edu.gh
67
for agricultural development since according to Polson & Spencer (1992), active smallholder
farmers are more amenable to adoption of technologies and innovations.
Gender of Household Heads
The result of gender distribution is displayed in table 4.2. About 90% of smallholder farmers are
males while about 10% are females. This finding is in line with the gender distribution of
households in Ghana where 65.3% are male dominated and 34.7% are dominated (GSS, 2012).
Household Size of Households
From tables 4.2 and 4.3, the mean household size of farm households in the region is about 13
people ranging from 3 to 45. This average household size is higher than the GSS-Ghana Population
and Housing Census (2012) average of 7.7 for the region and also higher than the 2012/2013 Ghana
Living Standards Survey (GLSS) Report (2014) average of 5.4 for the region. The reason for this
variation is attributed to the composition of the sample. Agriculture based households especially
smallholders are located in the rural areas where the household sizes are quite large. About 36%
of households have size between 6 to 10 people, 30% with size between 11-15 people, 23% having
size of over 15 while about 12% have size of between 1-5 people. Martey et al. (2012) reported
that, one potential for having large household size is that it frees up family labour for production.
Also, Abu et al. (2016) and Al-Hassan (2008) argue that large families enable household members
to earn additional income from non-farm activities. This notwithstanding, large household can
reduce the amount of marketable surplus a household can raise to participate in the market. This
is apparent in the observation of Abu et al. (2016) and Makhura et al. (2001) that the decision to
sell is preceded by a decision to consume.
University of Ghana http://ugspace.ug.edu.gh
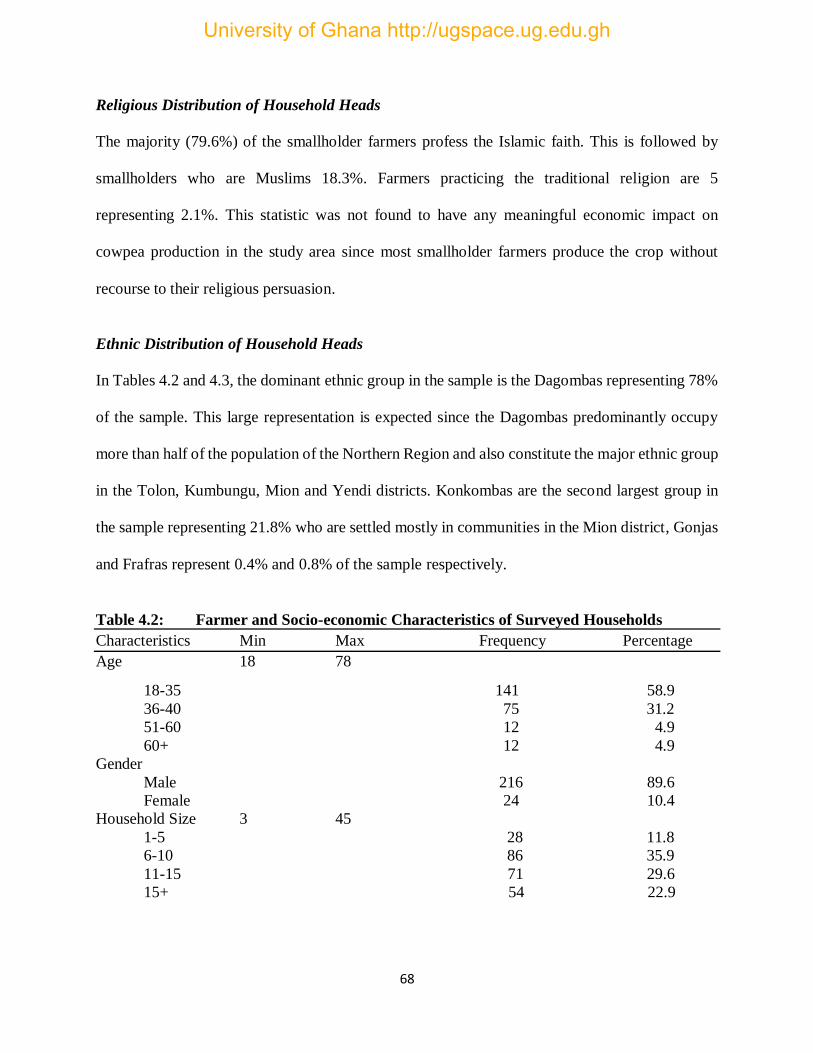
68
Religious Distribution of Household Heads
The majority (79.6%) of the smallholder farmers profess the Islamic faith. This is followed by
smallholders who are Muslims 18.3%. Farmers practicing the traditional religion are 5
representing 2.1%. This statistic was not found to have any meaningful economic impact on
cowpea production in the study area since most smallholder farmers produce the crop without
recourse to their religious persuasion.
Ethnic Distribution of Household Heads
In Tables 4.2 and 4.3, the dominant ethnic group in the sample is the Dagombas representing 78%
of the sample. This large representation is expected since the Dagombas predominantly occupy
more than half of the population of the Northern Region and also constitute the major ethnic group
in the Tolon, Kumbungu, Mion and Yendi districts. Konkombas are the second largest group in
the sample representing 21.8% who are settled mostly in communities in the Mion district, Gonjas
and Frafras represent 0.4% and 0.8% of the sample respectively.
Table 4.2: Farmer and Socio-economic Characteristics of Surveyed Households
Characteristics Min Max Frequency Percentage
Age 18 78
18-35 141 58.9
36-40 75 31.2
51-60 12 4.9
60+ 12 4.9
Gender
Male 216 89.6
Female 24 10.4
Household Size 3 45
1-5 28 11.8
6-10 86 35.9
11-15 71 29.6
15+ 54 22.9
University of Ghana http://ugspace.ug.edu.gh
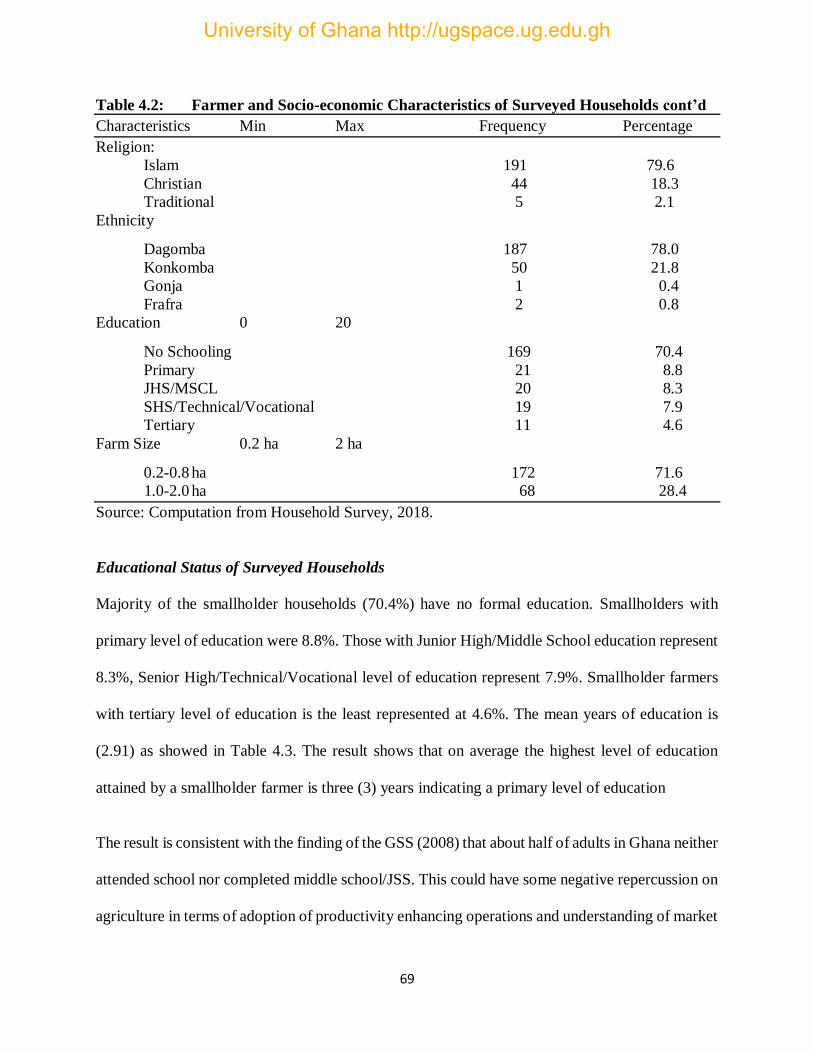
69
Table 4.2: Farmer and Socio-economic Characteristics of Surveyed Households cont’d
Characteristics Min Max Frequency Percentage
Religion:
Islam 191 79.6
Christian 44 18.3
Traditional 5 2.1
Ethnicity
Dagomba 187 78.0
Konkomba 50 21.8
Gonja 1 0.4
Frafra 2 0.8
Education 0 20
No Schooling 169 70.4
Primary 21 8.8
JHS/MSCL 20 8.3
SHS/Technical/Vocational 19 7.9
Tertiary 11 4.6
Farm Size 0.2 ha 2 ha
0.2-0.8 ha 172 71.6
1.0-2.0 ha 68 28.4
Source: Computation from Household Survey, 2018.
Educational Status of Surveyed Households
Majority of the smallholder households (70.4%) have no formal education. Smallholders with
primary level of education were 8.8%. Those with Junior High/Middle School education represent
8.3%, Senior High/Technical/Vocational level of education represent 7.9%. Smallholder farmers
with tertiary level of education is the least represented at 4.6%. The mean years of education is
(2.91) as showed in Table 4.3. The result shows that on average the highest level of education
attained by a smallholder farmer is three (3) years indicating a primary level of education
The result is consistent with the finding of the GSS (2008) that about half of adults in Ghana neither
attended school nor completed middle school/JSS. This could have some negative repercussion on
agriculture in terms of adoption of productivity enhancing operations and understanding of market
University of Ghana http://ugspace.ug.edu.gh

70
dynamics. Also, according to Minot et al. (2006) education is a means of entry into extra
employment activities especially in the non-farm sector. With majority of heads in the region
without formal education it can be postulated that most of these people would not be able to
sufficiently engage in formal non-farm activities. The low level of education exhibited by the
respondents could also affect negatively the prospects of engaging fully in the market and adopting
productivity enhancing technologies.
Farm Size
As indicated in Tables 4.2 and 4.3, the mean farm size under cowpea cultivation is 0.84 ha and a
minimum of 0.20 ha. The maximum farm size under cowpea production was found to be
approximately 2 ha. Majority (71.6%) of the farm sizes range between 0.2-0.8 ha, while farm sizes
between 1.0-2.0 ha represented 21.8%. Farm size of approximately 2 ha represented 28.4% of
smallholder cowpea farmer’s landholding distribution in the Northern Region of Ghana. These
distributions indeed shows the smallholding characteristic of cowpea farming in the Northern
Region, thereby becoming a disincentive for producing higher marketable surplus since according
to (Martey et al. 2012), higher farm sizes serve as an inducement to produce more marketable
surpluses.
4.2.3 Distribution and summary statistics of the variables used in the analyses
Tables 4.3 and 4.4 show the distribution and summary statistics of the variables used in the
analyses for cowpea production, productivity and market participation.
Distance to Market and Good Road Network
Table 4.3 shows that, the mean distance to the nearest main market for cowpea farmers in all the
four districts was found to be 7.45km with a corresponding standard deviation of 4.73km. The
University of Ghana http://ugspace.ug.edu.gh
71
shortest distance to market was found to be 2km with the longest distance being 20km. It is
therefore evident from this finding that cowpea farmers are quite far away from the marketing
centres. Furthermore, from Table 4.4, majority of the respondents (65%) indicated that the major
road linking their communities to the nearest market centre is not motorable or not in good shape.
Total Income and Cowpea Price
Total household income refers to the total amount of earnings a household possesses. The total
income possessed by the sampled smallholder farmers was found to be four hundred and seventy-
two thousand, eight-hundred and fifty-two Ghana Cedis (GHS 472, 852.00) with a mean income
of One thousand, nine hundred and seventy Ghana Cedis (GHS 1970.00). This amount was
obtained from the sale of total output of 82,461kg of cowpea grain. The minimum price farmers
obtained from the sale of a bowl (3kg) of cowpea is GHS 2.50 and the maximum price obtained
was found to be GHS 15.00 per bowl. The mean price was GHS 6.8 per bowl of cowpea.
Off-farm Income
The total off-farm income for the sampled farmers as indicated in table 4.3 was found to be Eighty-
two thousand and eighty Ghana Cedis (GHS 82,080.00) with a mean of approximately Three
hundred and thirty-two Ghana Cedis (GHS 342). This low participation in especially formal non-
farm income activities could have arisen as a result of the fact that majority of the smallholder
cowpea producers are without formal education.
Value of Livestock Owned
The result indicates that One hundred and ninety-five (195) of the smallholder farmers representing
approximately 81% owned livestock. The value of livestock owned by these farmers was found to
be Seventy-nine thousand, one hundred and sixty-eight Ghana Cedis (GHS 79,168.00) with a mean
University of Ghana http://ugspace.ug.edu.gh
72
value of Three hundred and thirty Ghana Cedis (GHS 330.00). Smallholder cowpea farmers in the
Northern Region are into diversified farming activities by also engaging in livestock production.
Ownership of Own Means of Transportation
Results from Table 4.3 show that majority of the sampled smallholder farmers (52%) had access
to their own means of transportation. These include motor-king, bicycle and motor bikes since
these equipment are the most populous means of transportation in the Northern Region. Having
access to own means of transportation facilitates movement to farm and marketing centres among
smallholder farmers in the Northern Region.
Access to Market Information
As indicated in table 4.3, it is obvious that majority of the smallholder farmers (67%) often access
market information relating to input and output prices in the market. This finding is supported by
the fact that majority of the farmers (88%) had access to mobile phone since it provides a major
means of communication and acquiring information. Therefore most cowpea farmers in the
Northern Region regularly access market information when it comes to making production and
market participation decisions.
University of Ghana http://ugspace.ug.edu.gh
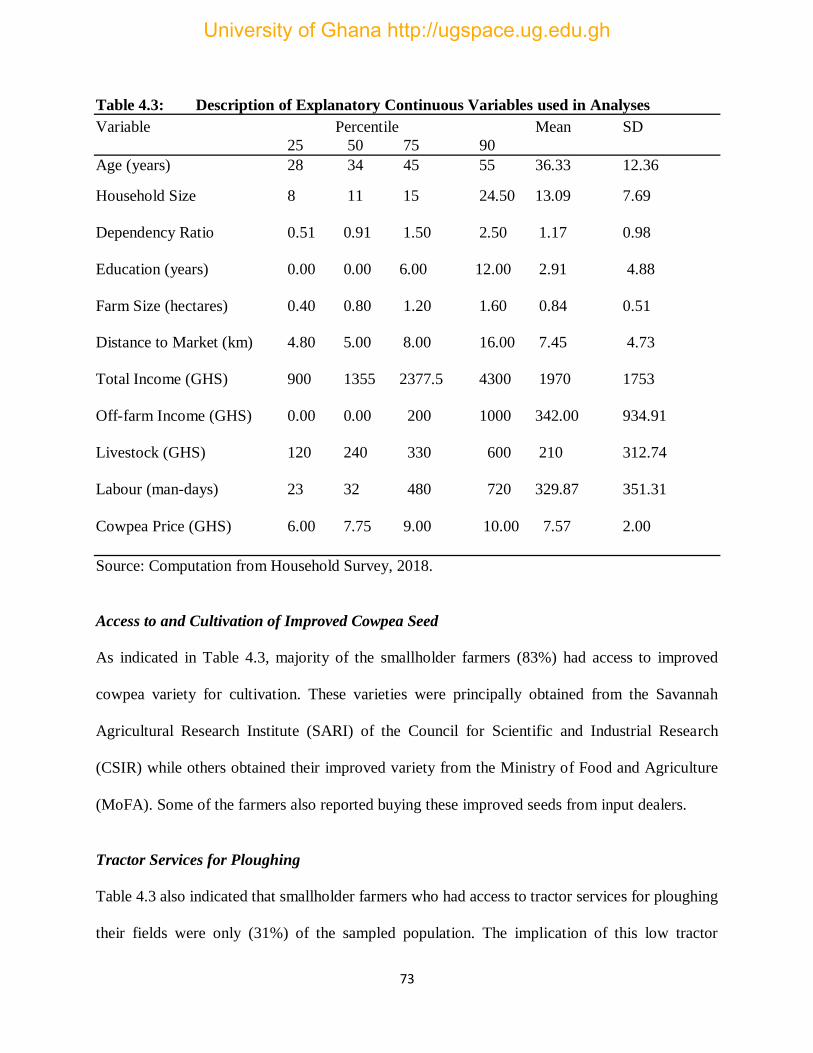
73
Table 4.3: Description of Explanatory Continuous Variables used in Analyses
Variable Percentile Mean SD
25 50 75 90
Age (years) 28 34 45 55 36.33 12.36
Household Size 8 11 15 24.50 13.09 7.69
Dependency Ratio 0.51 0.91 1.50 2.50 1.17 0.98
Education (years) 0.00 0.00 6.00 12.00 2.91 4.88
Farm Size (hectares) 0.40 0.80 1.20 1.60 0.84 0.51
Distance to Market (km) 4.80 5.00 8.00 16.00 7.45 4.73
Total Income (GHS) 900 1355 2377.5 4300 1970 1753
Off-farm Income (GHS) 0.00 0.00 200 1000 342.00 934.91
Livestock (GHS) 120 240 330 600 210 312.74
Labour (man-days) 23 32 480 720 329.87 351.31
Cowpea Price (GHS) 6.00 7.75 9.00 10.00 7.57 2.00
Source: Computation from Household Survey, 2018.
Access to and Cultivation of Improved Cowpea Seed
As indicated in Table 4.3, majority of the smallholder farmers (83%) had access to improved
cowpea variety for cultivation. These varieties were principally obtained from the Savannah
Agricultural Research Institute (SARI) of the Council for Scientific and Industrial Research
(CSIR) while others obtained their improved variety from the Ministry of Food and Agriculture
(MoFA). Some of the farmers also reported buying these improved seeds from input dealers.
Tractor Services for Ploughing
Table 4.3 also indicated that smallholder farmers who had access to tractor services for ploughing
their fields were only (31%) of the sampled population. The implication of this low tractor
University of Ghana http://ugspace.ug.edu.gh

74
ploughing access is that these farmers have to mostly depend on own labour and sometimes family
labour in clearing their fields thereby restricting their ability to expand production. This may also
significantly impact their level of productivity and market participation since possession of farm
assets had been identified as a means of enhancing agricultural productivity and commercialisation
(Asfaw et al. 2012; Wickramasinghe, 2015).
Table 4.4: Description of Explanatory Binary Variables used in the Analyses
Variable Mean SD
Gender 0.90 0.30
Own means of transportation 0.52 0.50
Access to market information 0.67 0.47
Proximity to good road network 0.35 0.47
Ownership of mobile 0.88 0.32
Ownership of radio 0.63 0.48
Land ownership Type 0.63 0.48
Access to credit 0.22 0.42
Access to extension services 0.65 0.48
Access to improved cowpea seed 0.83 0.38
Access to tractor services for ploughing 0.31 0.46
Source: Computation from Household Survey, 2018.
4.2.4 Cowpea productivity and market participation characteristics of households
Table 4.5 displays the summary of gross value of cowpea produced per hectare per sampled
districts. Tolon district had the higher level of farm productivity with a mean productivity of
1,618.88 Ghana Cedis per hectare as compared to the other districts with a mean productivity value
almost as twice that of the closest district Mion with 860.18 Ghana Cedis per hectare. The mean
University of Ghana http://ugspace.ug.edu.gh

75
productivity level found in Kumbungu and Yendi districts were respectively less than twice that
of Tolon. This heterogeneity in productivity levels is not attributable to differences in agro climatic
conditions since almost all districts in the Northern Region experience the same seasonal variations
in weather conditions.
The apparent causation could be that cowpea producers in Tolon district are more efficient in their
productions, produce higher output per farm size and obtain better value for their cowpea grains
than their counterparts from other parts of the region. Geographical variation arising as a result of
access to well-endowed input markets and technology opportunities could also be a factor.
Kumbungu district was however found to have the lowest level of cowpea productivity.
Table 4.5: Gross Value of Cowpea Produced per Hectare by each Sampled District
Source: Computation from Household Survey, 2018.
4.2.5 Cowpea productivity level and market participation per sampled district
Figure 4.1 and Table 4.6, show the summary of the resultant productivity level and proportion of
output sold in the markets. For Tolon and Mion districts, the higher the level of productivity the
greater the proportion of output sold in the markets. But the same conclusion cannot be made
between Kumbungu and Yendi. Though farmers in Kumbungu had lower level of productivity
than Yendi, they however had greater marketable surpluses than their counterparts from Yendi.
District Name Gross Value of Cowpea Produced (GHS/Ha) Mean Productivity
Tolon 97132.80 1618.88
Kumbungu 36142.80 602.38
Mion 51610.80 860.18
Yendi 39278.40 654.64
Total 224164.80 56041.20
University of Ghana http://ugspace.ug.edu.gh
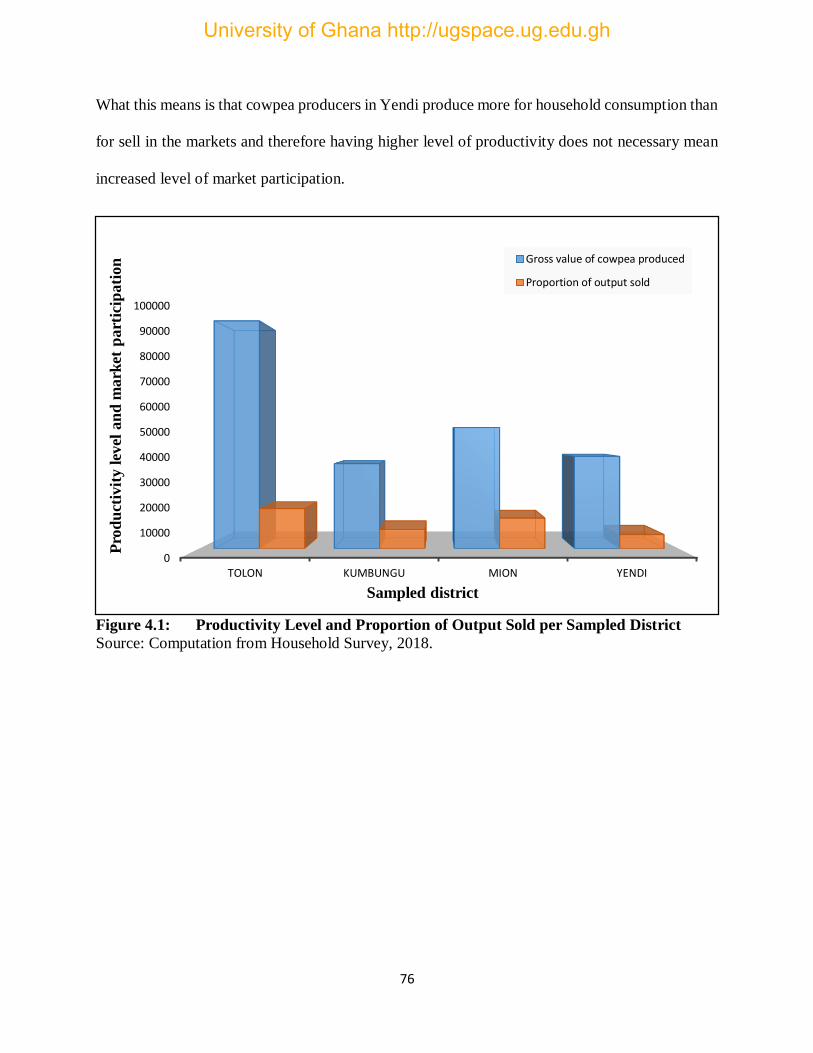
76
What this means is that cowpea producers in Yendi produce more for household consumption than
for sell in the markets and therefore having higher level of productivity does not necessary mean
increased level of market participation.
Figure 4.1: Productivity Level and Proportion of Output Sold per Sampled District
Source: Computation from Household Survey, 2018.
0
10000
20000
30000
40000
50000
60000
70000
80000
90000
100000
TOLON KUMBUNGU MION YENDI
Pro
du
ctiv
ity l
evel
an
d m
ark
et p
art
icip
ati
on
Sampled district
Gross value of cowpea produced
Proportion of output sold
University of Ghana http://ugspace.ug.edu.gh
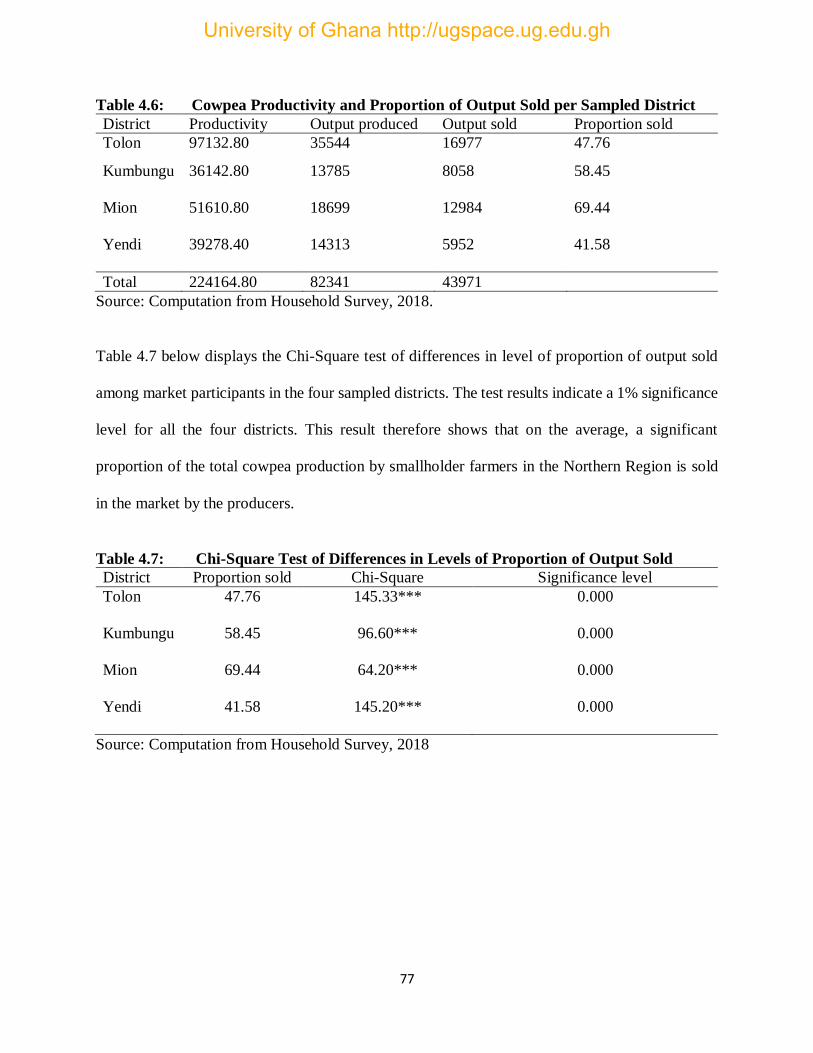
77
Table 4.6: Cowpea Productivity and Proportion of Output Sold per Sampled District
District Productivity Output produced Output sold Proportion sold
Tolon 97132.80 35544 16977 47.76
Kumbungu 36142.80 13785 8058 58.45
Mion 51610.80 18699 12984 69.44
Yendi 39278.40 14313 5952 41.58
Total 224164.80 82341 43971
Source: Computation from Household Survey, 2018.
Table 4.7 below displays the Chi-Square test of differences in level of proportion of output sold
among market participants in the four sampled districts. The test results indicate a 1% significance
level for all the four districts. This result therefore shows that on the average, a significant
proportion of the total cowpea production by smallholder farmers in the Northern Region is sold
in the market by the producers.
Table 4.7: Chi-Square Test of Differences in Levels of Proportion of Output Sold
District Proportion sold Chi-Square Significance level
Tolon 47.76 145.33*** 0.000
Kumbungu 58.45 96.60*** 0.000
Mion 69.44 64.20*** 0.000
Yendi 41.58 145.20*** 0.000
Source: Computation from Household Survey, 2018
University of Ghana http://ugspace.ug.edu.gh
78
4.2.6 Aggregate productivity and market participation of smallholder producers
The regional aggregate gross value of cowpea produced per hectare from Tolon, Kumbungu, Mion
and Yendi districts was computed to be 224,164.80 Ghana cedis per hectare. The aggregate market
participation of smallholder cowpea producing households from the data collected showed that the
marketed surplus ratio is 53.4%. These imply that 53% of the produce from cowpea were sold by
the sampled smallholder producers in the Northern Region during a planting season on average.
The average marketed surplus ratio for all crops and for only cowpea estimated by IFPRI (2011)
and Franke & de Wolf (2011) were 34% and 40% respectively for the Northern Region. Musah et
al. (2014), also reported a 24% surplus ratio for maize in the Upper West Region of Ghana. The
results indicate that the surplus ratio estimated for cowpea is therefore 19% point higher than the
average marketed surplus ratio estimated for all crops by IFPRI (2011), and 13% and 29% point
higher than the estimates by Franke & de Wolf (2011) and Musah et al. (2014) respectively. This
findings therefore show that cowpea is cultivated mostly for cash and not just as a staple for
household consumption in the Northern Region of Ghana.
4.3 Analytical Estimations of Cowpea Production, Productivity and Market
Participation
This section focuses on the analytical estimations aspect of the results and discussions. It begins
by testing for multicollinearity, heteroskedasticity and endogeneity in the variables used for the
estimations. It also presents results and discussions for the factors influencing smallholder farmers’
decision to produce cowpea and the factors influencing smallholder farmers’ decision to
participate in the markets. The results and discussions for the factors influencing the intensity of
market participation of smallholder cowpea producers are also presented. Finally, the section also
University of Ghana http://ugspace.ug.edu.gh

79
presents the results and discusses the effect of intensity of market participation on productivity of
smallholder cowpea producers in the Northern Region.
Test for multicollinearity and heteroskedasticity in the THM variables
Prior to the estimations, the variables used for the THM analysis were first checked for the possible
presence of multicollinearity and heteroskedasticity which are common phenomena in most
regression analysis. The Variance Inflation Factor (VIF) test for multicollinearity indicated a value
less than the critical value of 10 (Gujarati & Porter, 2009; Mmbando et al. 2015; Shiferaw et al.
2008), confirming that multicollinearity was absent. The Breusch-Pagan/Cook-Weisberg test for
heteroskedasticity was also conducted. The result indicated no presence of heteroskedasticity,
since the calculated 𝜒2 value of (2.75) was smaller than the tabulated 𝜒2 value of (3.84) at the 5%
level of significance and one degree of freedom following from Mmbando et al. (2015).
Though the triple hurdle model can be estimated separately using Heckman's (1979) method,
simultaneous estimation via the maximum likelihood method allows for easy calculation of
predictive margins and partial effects of explanatory variables (Gebremedhin et al. 2017).
Therefore the mixed-process regression approach which allows for different equations with
different kinds of dependent variables or response types to be fixed simultaneously was used
following from Roodman, (2011). The user written command, “cmp” by Roodman (2011) was
then used for fitting the estimation in Stata version 15.
The Triple Hurdle model also assumes that the error terms in the three models are uncorrelated.
To test this assumption a restricted model is estimated by setting the correlation among the error
term to zero and a likelihood ratio (LR) test was performed by comparing the unrestricted model
to the restricted model. The result from the likelihood ratio test indicates that the unrestricted model
University of Ghana http://ugspace.ug.edu.gh

80
is preferred to the restricted model χ² (4) = 286.92, p = 0.0000. In addition, the LR test of the
hypothesis that all regression coefficients are jointly equal to zero is also highly rejected. These
show that not accounting for the two-sample selection biases would result in wrong inferences
(Gebremedhin et al. 2017).
Following exclusion restrictions used in similar models (Azam et al. 2012; Boughton et al. 2007;
Burke et al. 2015; Gebremedhin et al. 2017), in identifying the second stage equation of the
decision to participate in the cowpea markets, labour measured in mandays was used as an
exclusion restriction variable. This variable was identified to be statistically significant in the
production model (p =0.026), but was conceptually and empirically irrelevant in stage two (market
participation decision model) (p = 0.490). Similarly, distance to nearest market was used as an
exclusion restriction variable to identify the third stage equation of intensity of market participation
in the output markets. Distance to market was statistically significant in stage 2 (p = 0.034), but
was not significant in stage 3 (p = 0.322).
Table 4.8 presents the maximum likelihood estimates of the three-stage cowpea production and
market participation decision models. Column (i) presents coefficient estimates for factors
associated with the probability of producing cowpea (stage 1). Column (ii) presents coefficient
estimates for participation in the cowpea market conditional on being a cowpea producer (stage
2). Column (iii) presents results of the cowpea supply function for cowpea market participating
producers (stage 3).
University of Ghana http://ugspace.ug.edu.gh
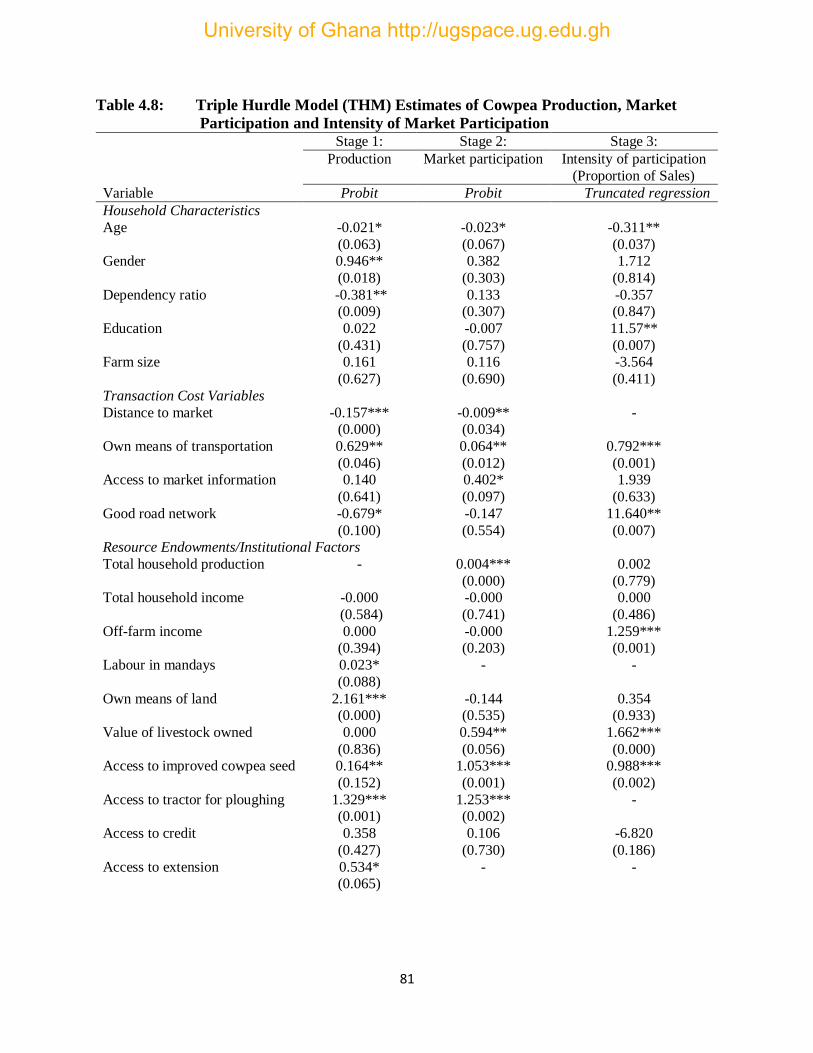
81
Table 4.8: Triple Hurdle Model (THM) Estimates of Cowpea Production, Market
Participation and Intensity of Market Participation Stage 1: Stage 2: Stage 3:
Production Market participation Intensity of participation
(Proportion of Sales)
Variable Probit Probit Truncated regression
Household Characteristics
Age -0.021*
(0.063)
-0.023*
(0.067)
-0.311**
(0.037) Gender 0.946**
(0.018)
0.382
(0.303)
1.712
(0.814)
Dependency ratio -0.381** (0.009)
0.133 (0.307)
-0.357 (0.847)
Education 0.022
(0.431)
-0.007
(0.757)
11.57**
(0.007) Farm size 0.161
(0.627)
0.116
(0.690)
-3.564
(0.411)
Transaction Cost Variables
Distance to market -0.157*** (0.000)
-0.009** (0.034)
-
Own means of transportation 0.629**
(0.046)
0.064**
(0.012)
0.792***
(0.001) Access to market information 0.140
(0.641)
0.402*
(0.097)
1.939
(0.633)
Good road network -0.679*
(0.100)
-0.147
(0.554)
11.640**
(0.007) Resource Endowments/Institutional Factors
Total household production - 0.004***
(0.000)
0.002
(0.779) Total household income -0.000
(0.584)
-0.000
(0.741)
0.000
(0.486)
Off-farm income 0.000 (0.394)
-0.000 (0.203)
1.259*** (0.001)
Labour in mandays 0.023*
(0.088)
- -
Own means of land 2.161*** (0.000)
-0.144 (0.535)
0.354 (0.933)
Value of livestock owned 0.000
(0.836)
0.594**
(0.056)
1.662***
(0.000) Access to improved cowpea seed 0.164**
(0.152)
1.053***
(0.001)
0.988***
(0.002)
Access to tractor for ploughing 1.329*** (0.001)
1.253*** (0.002)
-
Access to credit 0.358
(0.427)
0.106
(0.730)
-6.820
(0.186)
Access to extension 0.534* (0.065)
- -
University of Ghana http://ugspace.ug.edu.gh
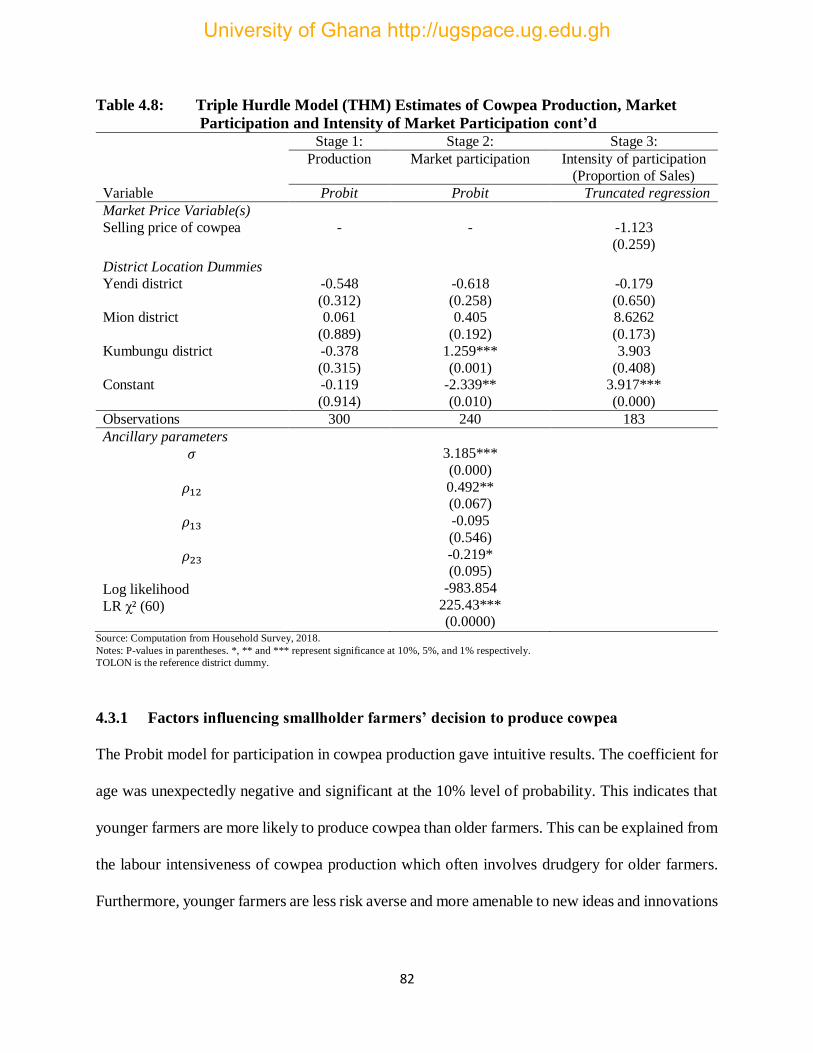
82
Table 4.8: Triple Hurdle Model (THM) Estimates of Cowpea Production, Market
Participation and Intensity of Market Participation cont’d Stage 1: Stage 2: Stage 3:
Production Market participation Intensity of participation
(Proportion of Sales)
Variable Probit Probit Truncated regression
Market Price Variable(s)
Selling price of cowpea - -
-1.123
(0.259)
District Location Dummies
Yendi district -0.548
(0.312)
-0.618
(0.258)
-0.179
(0.650) Mion district 0.061
(0.889)
0.405
(0.192)
8.6262
(0.173)
Kumbungu district -0.378
(0.315)
1.259***
(0.001)
3.903
(0.408) Constant -0.119
(0.914)
-2.339**
(0.010)
3.917***
(0.000)
Observations 300 240 183
Ancillary parameters
𝜎
𝜌12
𝜌13
𝜌23
Log likelihood
LR χ² (60)
3.185***
(0.000)
0.492** (0.067)
-0.095
(0.546)
-0.219* (0.095)
-983.854
225.43*** (0.0000)
Source: Computation from Household Survey, 2018.
Notes: P-values in parentheses. *, ** and *** represent significance at 10%, 5%, and 1% respectively.
TOLON is the reference district dummy.
4.3.1 Factors influencing smallholder farmers’ decision to produce cowpea
The Probit model for participation in cowpea production gave intuitive results. The coefficient for
age was unexpectedly negative and significant at the 10% level of probability. This indicates that
younger farmers are more likely to produce cowpea than older farmers. This can be explained from
the labour intensiveness of cowpea production which often involves drudgery for older farmers.
Furthermore, younger farmers are less risk averse and more amenable to new ideas and innovations
University of Ghana http://ugspace.ug.edu.gh

83
than older farmers and also have limited access to productive resources as reported by Awotide et
al. (2013), Tabe-Ojong & Mausch (2017), Gebremedhin et al. (2017) and Bezu & Holden (2014).
As expected, gender showed a positive relationship with cowpea production with male smallholder
farmers having a greater likelihood of engaging in cowpea production than female smallholder
farmers. Statistically, on an average a male smallholder farmers are 0.95% more likely to engage
in cowpea production than a female smallholder farmer. This could probably be attributed to the
labour intensive nature of cowpea production such as land preparation, planting, weeding, and
harvesting where men are able to overcome these arduous tasks better than females. They also
have more access to land and other productive farm assets than their female counterparts and
therefore the finding is not surprising.
Dependency ratio showed an unexpectedly negative relationship with cowpea production and
statistically significant at 5%. The result reveals that an increase in dependency ratio by an
additional member will likely decrease the probability of producing cowpea by 0.38%. This
finding indicates that most households have higher dependency ratio. The result also suggest that
household members are mostly within the inactive labour cohort and hence no additional labour is
emanating from the household to be channeled into cowpea production.
Distance to the nearest market centre was expectedly found to have negative effect on cowpea
production and statistically significant at 1%. This finding suggests that the longer the distance to
the input market centre from the farming community, the less likely the participation in cowpea
production. Statistically, an increase to the nearest input markets by a kilometre will reduce the
probability or likelihood of engaging in cowpea production by 0.16%. This finding also reveals
that long distances to input markets serve as a disincentive to farming households who cannot
University of Ghana http://ugspace.ug.edu.gh

84
easily travel to buy farm inputs. The results was found to be consistent with the findings of Lifeyo
(2017) who also reported of similar relationship between distance to nearest market centre and
common bean production in Malawi.
Ownership of own means of transportation was statistically significant at the 5% level of
significance with the result also revealing that farmers who possess their own means of
transportation are more likely to participate in cowpea production. The intuition is that these
farmers are able to leverage production since they are able to reduce both the transaction cost and
marginal cost of movement in getting to both the input and output markets.
Proximity to an all-weather good road network was found to have the expected sign. Smallholder
cowpea producers who are not near to a good road network are less likely to participate in cowpea
production. Statistically, smallholder cowpea producers who are far away from a good road
network linking to an output market are 0.68% less likely to engage in cowpea production. Bad
roads potentially increase travelling time and raise transportation or transaction costs. Binswanger
et al. (1993), identified that improved roads contribute directly to growth in agricultural output in
India.
As expected, labour used as a proxy to identify the market participation decision but irrelevant in
the intensity of participation hurdle turned out to have a positive and significant effect on the
probability of engaging in cowpea production. An additional increase in labour by a man-day by
a household raises the probability of engaging in cowpea production by 0.02%. The result supports
the assertion that labour is an important and critical factor of production. The finding is also
consistent with Gebremedhin et al. (2017) who found the same relationship between labour and
diary production in rural Ethiopia.
University of Ghana http://ugspace.ug.edu.gh

85
Having own land for cultivation of cowpea was found to be statistically significant at 1% and with
the expected sign. The result reveals that cowpea producers who had own land for production are
2% more likely to participate in cowpea production than farmers who depend on hired land or
family land for production. This finding indicates that farmers with own land do not share the
output with anyone and therefore had the privilege of utilising their land in a manner they deemed
fit. They can potentially increase production knowing they have no payment either in cash or in
kind to any land owner. The result is in contrast with Lifeyo (2017) who identified a negative
relationship between having access to own land and common bean production in Malawi.
Access to improved cowpea seed was also found to be significant at the 5% level of significance.
The finding suggests that smallholder farmers who had access to improved cowpea seed are more
likely to participate in cowpea production than farmers who do not have access to improved seed.
The descriptive statistics suggests that about 83% of the respondents across the four districts
accessed improved cowpea seed indicating the importance of making improved seed accessible
and available to these smallholder farmers.
Farmers who often accessed tractor services for ploughing their fields before cultivation are
approximately 1.3% more likely to participate in cowpea production than framers who had no
access to tractor services. This finding suggests that farmers who accessed tractor services are able
to reduce the time and the drudgery associated with manual weeding and clearing and therefore
the opportunity costs associated with non-access to tractor services for field preparation are
perceived to be greater and therefore serve as a disincentive in the production of cowpea in the
Northern Region of Ghana. This finding also shows the importance of availability of farm
equipment in cowpea production in particular and general agricultural production as a whole.
University of Ghana http://ugspace.ug.edu.gh
86
Access to extension services was also found to be statistically significant at the 10% significance
level and with the expected sign. The finding however suggests that smallholder cowpea farmers
who had access to extension services are 0.53% more likely to participate in cowpea production
than farmers who had no contacts with an extension agent. After production decision has been
made, extension services requirements are practically irrelevant as far as market participation
decisions are concerned
4.3.3 Factors influencing cowpea market participation and intensity of participation
The coefficient of age was statistically significant at the 10% significance level though it did not
support the a-priori theoretical expectation. The finding shows that on the average, an additional
increase in age of a smallholder cowpea producer reduces the likelihood of participating in markets
by approximately 0.02%. Conditional on the smallholder being a producer, and a participant in the
market, age also depicted a negative relationship with the proportion of output sold in the market,
by reducing the likelihood of sales by 0.3%. This result indicates that as smallholder farmers
advance in age, they become more autarkic minded (producing for household consumption) than
selling in the market. This is consistent with the findings of Goetz (1992), Tabe-Ojong & Mausch
(2017), and Burke et al. (2015).
Although not significant in the market participation decision hurdle, smallholder farmers’ level of
education showed a positive and significant effect on the proportion of cowpea harvest marketed
or sold. This can be attributed to the fact that advancement in education reduces search costs and
increases the processing of information, thus reducing the fixed transaction cost. Education also
increases social network which is vital for information access. This finding is in contrast with
University of Ghana http://ugspace.ug.edu.gh

87
Ouma et al. (2010) who identified a significantly negative impact of education on banana market
participation in Rwanda and Burundi.
The coefficient of distance to market was statistically negatively significant as expected. This
variable is included to proxy for fixed transaction costs and had a negative effect on the probability
of market participation decision hurdle but not on the proportion of sale for a given seller. The
result however indicates that each additional kilometre increase in the distance to the nearest
market centre reduces the likelihood of participating in the market by approximately 0.009%. This
supports the findings by Holloway et al. (2000), Holloway et al. (2004) for milk market
participation in Ethiopian highlands, Staal et al. (1997) in Ethiopia and Wickramasinghe (2015) in
Kenya. These findings also indicate that investment in market infrastructure is critical for market
participation. The result reveals that the longer the distance to output market, the lower the
likelihood of participating in the market by farmers. Theoretically, farm households located farther
from a marketing centre rely on home-produced goods over market-produced goods and hence
their degree of market participation reduces. Thus distance is a barrier to market participation
(Wickramasinghe et al. 2014).
Conditional on a smallholder being a producer, those with own means of transportation have a
0.6% probability of participating in the market, whiles conditional on being a market participant,
their intensity of market participation increases by 0.8%. This finding indicates that smallholder
farmers’ with own means of transportation are able to overcome the costs associated with market
entry and therefore increase their participation in the market.
Access to market information was found to have a positively significant effect on market
participation and at the 10% level of significance but insignificant in terms of the intensity of
University of Ghana http://ugspace.ug.edu.gh
88
market participation. This finding is supported by the fact that majority of the farmers (88% and
63%) had access to mobile phone and radio respectively which they depend on in acquiring market
information services. The result therefore indicate that farmers who had access to market
information are 0.4% more likely to participate in the market than those who had no access to
market information. This result is corroborated by the finding of Goetz (1992) who obtained
positive relationship between information and marketing behaviour of some selected households
in Sub-Saharan Africa.
The coefficient of proximity to an all-weather good road network was found to be insignificant
with the decision to participate in the market but had a positive and significant relationship with
the intensity of market participation. The results indicate that households in communities nearer
to a good road network (tarred road) had approximately 11.64% probability of marketing or selling
their cowpea harvest than households not closer to a good road network. The implication therefore
is that, having access to good road infrastructure reduces the transaction costs associated with
getting to markets thereby serving as a stimulus for cowpea production and marketing in the
Northern Region of Ghana.
Total output from cowpea production was found to be significant with market participation
decision at the 1% level of significance. However, conditional on being a market participant, the
correlation with the intensity of market participation was found to be insignificant. The
interpretation of this finding is that for every kilogram increase in output, market participation
decision is likely to increase by 0.004% supporting the findings of Tabe-Ojong & Mausch (2017).
Off-farm income unexpectedly showed a statistically positive relationship with intensity of market
participation but had no significant correlation with market participation. The result reveals that
University of Ghana http://ugspace.ug.edu.gh

89
an increase in a household’s off-farm income is likely to increase or encourage intensity of
participation in the markets. This could be as a result of the fact that farmers with increased off-
farm income activities had higher returns and are therefore encouraged to participate in the markets
in order to again maximise returns from their farming activities. This finding is inconsistent with
that of Seng (2016) who found a negative relationship with off-farm income activity and market
participation in Cambodia, Rios et al. (2009) in their study on specific reference to Vietnam as
well as Gebremedhin et al. (2017) in their study of small-ruminant production and marketing in
Ethiopia.
Probability of market participation and intensity of participation are both significant and increasing
with the possession of livestock. This shows that smallholder farmers with livestock are potentially
more likely to increase their marketable surplus, participate in the markets and also intensify their
participation. The intuition is that these farmers are more profit inclined and therefore prefer to
maximise returns from this diversification and spread the risks associated with crop and animal
production thinly across the two enterprises. Since smallholder farmers are risk averse,
diversification is the best option to keep earnings constant in the face of risks (Wickramasinghe et
al. 2014).
Probability of market participation is significant at the 1% level of significance and conditional on
being a seller, the intensity of market participation is also significant at 1%, and expectedly,
increasing in reference to access to and cultivation of improved cowpea seed. The results show
that smallholder farmers who accessed and cultivated improved cowpea variety are 1% more likely
to participate in the markets and also 1% more likely to sell their output in the market than
households that did not access and cultivate improved cowpea variety. The result is consistent with
University of Ghana http://ugspace.ug.edu.gh

90
the findings of Tabe-Ojong & Mausch (2017). Accessibility of improved cowpea seed is crucial
for increased market participation and intensity of participation among smallholder cowpea
farmers in the Northern Region of Ghana.
Access to tractor services for ploughing was also found to be positively correlated with market
participation but insignificant with the intensity of participation. The result indicates that
conditional on smallholder being a cowpea producer, those who had access to tractor services for
ploughing are 1% more likely to participate in the market than producers who had no access to
tractor services. Access to tractor services for ploughing is an important factor in smallholder
market participation decision making.
With regards to the district location variables, none was found to be significant in terms of cowpea
production meaning there is no statistically significant difference between locations relative to
Tolon. However, Kumbungu district was found to be significant at the 1% significance level in
relation to market participation decision but was insignificant as far as the intensity of market
participation was concerned. This finding shows that relative to Tolon, cowpea farmers in
Kumbungu are more likely to participate in the markets. Tolon district however showed a
decreasing relationship with the decision to participate in the market.
Furthermore, Tolon district was significant in terms of intensity of participation in the cowpea
markets in the Northern Region. The implication therefore is that cowpea farmers in the Tolon
district generate more marketable surpluses and therefore sell more proportion of their cowpea
harvest relative to producers in Yendi, Mion and Kumbungu districts as also evident in the
descriptive statistics. Additionally, these farmers might have benefited from pre-extension trials
University of Ghana http://ugspace.ug.edu.gh
91
and on-farm demonstrations and therefore are productive and produced more marketable surpluses
than their counterparts from the other sampled districts in the Northern Region.
Test for multicollinearity, heteroskedasticity and endogeneity in the IV regression
The instrumental variable regression model was also checked for possible presence of
multicollinearity. The estimated VIF values were less than the critical value of 10 (Gujarati &
Porter, 2009; Shiferaw et al. 2008), confirming that multicollinearity was not a problem. The
productivity model was also tested for heteroskedasticity by using the Breusch–Pagan/Cook–
Weisberg test. The result indicated no presence of heteroskedasticity, since the calculated 𝜒2 value
of (1.45) was smaller than the tabulated 𝜒2 value (3.84) at the 5% significance level and one degree
of freedom.
In estimating the effects of intensity of market participation on productivity, a test for endogeneity
and instruments validity were also carried out to establish whether indeed intensity of market
participation measured by the proportion of sales is truly endogenous in the productivity model.
The test result for possible endogeneity of proportion of sales in the productivity model indicates
that the Durbin (score) 𝜒2 (1) = 11.7937, p-value = 0.0006 and Wu-Hausman F (1,218) =11.2662,
p-value = 0.0009 are both highly significant and therefore the null hypothesis that all the variables
are exogenous is rejected, implying that proportion of sales is highly endogenous in the
productivity model, therefore endogeneity needs to be controlled for in the productivity model.
Additionally, the first-stage regression F-statistic for joint significance of instruments is highly
significant, F (2, 218) =144.88, p-value = 0.0000 and the Partial R-squared value (0.550 or 55%)
is far greater than the critical nominal 5% Wald test values and therefore the null hypothesis that
the instruments used for market participation (possession of own means of transportation and
University of Ghana http://ugspace.ug.edu.gh
92
proximity to good road network) are weak is also rejected. Therefore the instrumental variable
regression approach is used to estimate the effects of intensity of market participation on
productivity. The regression estimates are displayed in table 4.9.
4.3.3 The effect of intensity of market participation on productivity
The coefficient estimates of the 2SLS regression are presented in table 4.9. The results indicate
that, proportion of harvest sold, instrumented by the intensity of market participation variables is
a significant correlate of productivity while controlling for other exogenous variables. Statistically,
an increase in the proportion of output sold by a kilogram per cedi of sales, causes productivity or
the gross value of cowpea production per hectare to increase by approximately 72% while
controlling for other significant exogenous variables. This finding is consistent with that of Rios
et al. (2009) and Strasberg et al. (1999) who identified a positive relationship between productivity
and intensity of market participation.
Age of the smallholder farmer was found to be significant but rather had a decreasing or negative
effect on productivity. This could be explained by the fact that, proportion of older people in the
sample who might not be innovation inclined unlike the younger producers are less productive.
This supports the finding of Boughton et al. (2007) who estimated a negative coefficient for maize
productivity in Mozambique. Other literatures that support a negative estimated coefficient for age
are Siziba et al. (2011), Olwande & Mathenge (2012), Rios et al. (2009) and Reyes et al. (2012).
The educational attainment of the household head, measured as the number of years spent in school
had a positive effect on productivity and statistically significant at 5%. This means that a higher
level of education of the smallholder farmer is associated with a higher level of productivity. This
observation is consistent with the findings of Makhura et al. (2001), Enete & Igbokwe (2009),
University of Ghana http://ugspace.ug.edu.gh
93
Randela et al. (2008), Southworth & Johnston (1967), Schultz (1945) and Ofori (1973) who argued
that education will endow the household with better production and managerial skills which could
lead to increased productivity and higher output.
Farm size had the expected significantly positive effect on cowpea productivity. The result
indicates that the larger the farm size per capita, the more it allowed the smallholder farmer to raise
their productivity level. This result is in line with Rios et al. (2009) who found that Tanzania and
Vietnamese farmers with larger land per worker are more productive.
The value of livestock owned by a smallholder farmer was also found to have a significantly
positive relationship with cowpea productivity and significant at 1%. This finding suggests that
cowpea farmers with diversified agricultural productions are likely to raise their productivity levels
in order to maximise income from the sale of cowpea or maximise output for consumption in the
unlikely event that their livestock do not attract good market or when they are not ready for sale.
The result was found to be consistent with the findings by Minten & Barrett (2008) and Rios et al.
(2009) who found similar relationship between livestock owned and crop productivity in
Madagascar and Vietnam respectively.
Access to improved cowpea variety was also found to have the expected sign and significant at the
5% level of significance. The result indicates that cowpea farmers who had access to cowpea
variety for cultivation had approximately 40% higher level of productivity than farmers who had
no access to improved cowpea variety for cultivation. The result was found to be consistent with
Strasberg et al. (1999) who found similar relationship between hybrid seed cultivation per acre
and food crop productivity in Kenya.
University of Ghana http://ugspace.ug.edu.gh

94
As expected, access to credit was also found to depict a positive relationship with productivity and
significant at the 1% level of significance. This result indicates that for farmers who had access to
credit, their productivity level is approximately 8% higher than those who had no access to credit
for farming. This finding suggests that access to credit is pivotal in achieving higher productivity
levels of cowpea in the Northern Region.
The prevailing district level selling price of cowpea grain was also found to possess the expected
coefficient and significant at the 1% level of significance. The result indicates that for every cedi
(GHS) increase in the selling price of cowpea harvest per kilogramme, farmers’ level of
productivity is expected to increase by approximately 8%.
With regard to the location of smallholder producers, the coefficient for the variable indicating a
smallholder producer located in the Mion district is statistically significant and negatively related
to cowpea productivity as compared to a smallholder located in the Tolon district (reference
district) showing an approximately 63% lower level of productivity. Mion district is characterised
by poor infrastructure with remote communities from a well-developed agricultural research
station unlike Tolon where the Savannah Agricultural Research Institute (SARI) of the Council
for Scientific and Industrial Research (CSIR) is located.
Similarly, Kumbungu district also had a statistically significant relationship with productivity with
cowpea producers in that district having about 86% level of productivity relative to Tolon. This
maybe due to the fact that it is relatively a new district with inadequate infrastructure that directly
contributes to and promotes productivity.
University of Ghana http://ugspace.ug.edu.gh
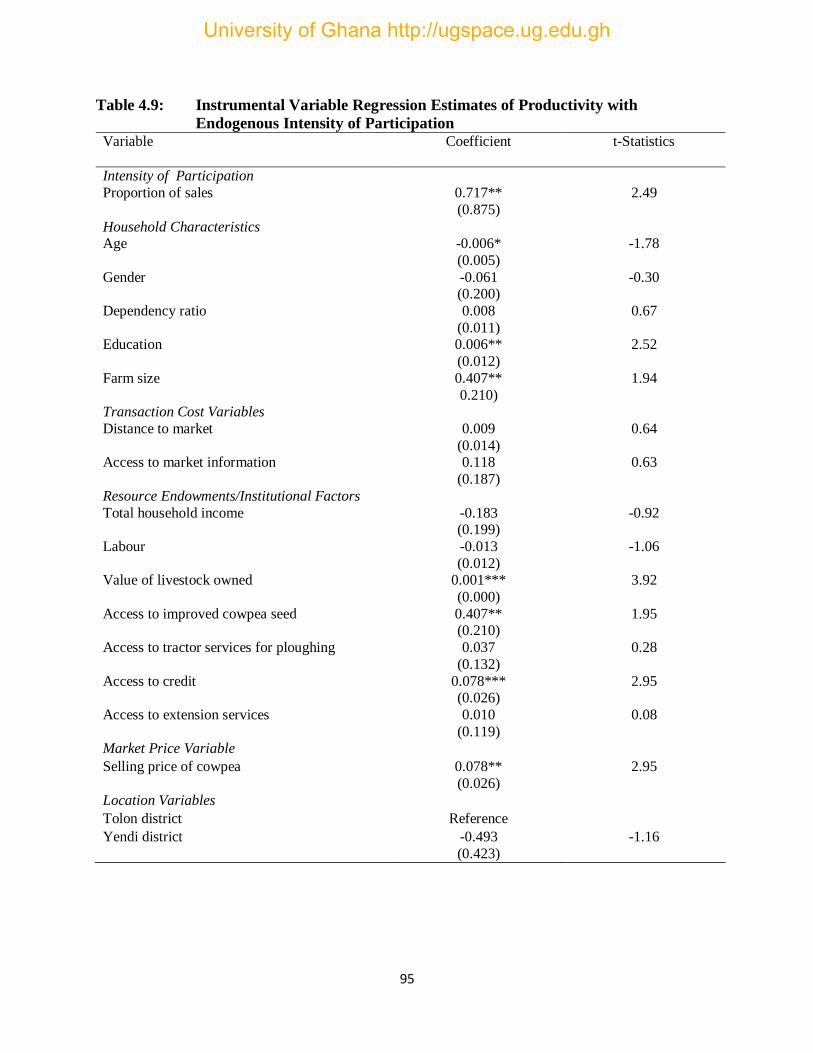
95
Table 4.9: Instrumental Variable Regression Estimates of Productivity with
Endogenous Intensity of Participation Variable Coefficient t-Statistics
Intensity of Participation
Proportion of sales 0.717**
(0.875)
2.49
Household Characteristics Age -0.006*
(0.005)
-1.78
Gender -0.061 (0.200)
-0.30
Dependency ratio 0.008
(0.011)
0.67
Education 0.006**
(0.012)
2.52
Farm size 0.407**
0.210)
1.94
Transaction Cost Variables
Distance to market 0.009
(0.014)
0.64
Access to market information 0.118
(0.187)
0.63
Resource Endowments/Institutional Factors
Total household income -0.183 (0.199)
-0.92
Labour -0.013
(0.012)
-1.06
Value of livestock owned 0.001***
(0.000)
3.92
Access to improved cowpea seed 0.407** (0.210)
1.95
Access to tractor services for ploughing 0.037
(0.132)
0.28
Access to credit 0.078*** (0.026)
2.95
Access to extension services 0.010
(0.119)
0.08
Market Price Variable
Selling price of cowpea 0.078**
(0.026)
2.95
Location Variables
Tolon district Reference
Yendi district -0.493
(0.423)
-1.16
University of Ghana http://ugspace.ug.edu.gh

96
Table 4.9: Instrumental Variable Regression Estimates of Productivity with
Endogenous Intensity of Participation cont’d Variable Coefficient t-Statistics
Kumbungu district -0.857***
(0.292)
-2.94
Constant 3.745*** (0.859)
4.36
Breusch-Pagan / Cook-Weisberg test for heteroscedasticity
𝜒2 (1) = 0.12
Prob > 𝜒 2 = 0.7250
Source: Computation from Household Survey, 2018.
Notes: Robust standard error in parentheses. *, ** and *** represent significance at 10%, 5%, and 1% level, respectively. Dependent variable is
the natural log of gross value of output produced per hectare.
Factors influencing cowpea production decision include: age, gender, dependency ratio, distance
to nearest market, own means of transportation, proximity to good road network, labour, access to
own land, access to improved cowpea seed, access to tractor for ploughing and extension services.
Factors influencing smallholder farmers’ decision to participate in the market include: age,
distance to nearest market, own means of transportation, access to market information, total
volume of output produced, livestock owned, access to and cultivation of improved cowpea seed
and the district location dummies Kumbungu and Tolon. Determinants of intensity of participation
in the output markets include: age, education, own means of transportation, proximity to an all-
weather good road network, off-farm income, livestock owned, access to and cultivation of
improved cowpea variety, and the district location dummy Tolon.
Overall determinants of cowpea production, market participation and intensity of market
participation include: age, gender, farm size, dependency ratio, education, distance to nearest
market, access to market information and ownership of own means of transportation. Other factors
include proximity to all- weather good road network, total output from cowpea production, off-
University of Ghana http://ugspace.ug.edu.gh

97
farm income, labour, access to own land, value of livestock owned and access to and cultivation
of improved cowpea variety. Also, access to tractor services for ploughing, extension services, and
district location dummies Tolon and Kumbungu were the other determinants.
Determinants of cowpea productivity include: proportion of sales, age, education, farm size,
livestock owned, access to and cultivation of improved cowpea seed, credit and selling price of
cowpea. District location dummies such as Tolon, Mion and Kumbungu also influenced cowpea
productivity.
From the stated hypotheses, it can be concluded that transaction cost variables notably distance to
market, own means of transportation, proximity to good road network as well as access to market
information separately influence cowpea production and market participation decisions. Intensity
of market participation also positively affect productivity and therefore the hypothesis that
intensity of market participation has a positive relationship with cowpea productivity can be
supported.
University of Ghana http://ugspace.ug.edu.gh

98
CHAPTER FIVE
SUMMARY, CONCLUSIONS AND RECOMMENDATIONS
5.1 Introduction
This chapter presents the major findings, the conclusions and the recommendations emanating
from the conclusions of the study. Suggestions for future research are also presented.
5.2 Summary of the Study
The study analyses the factors influencing cowpea production and market participation decisions
of smallholder farmers whiles also establishing the extent to which intensity of market
participation affects productivity. The estimations were carried out descriptively and analytically.
The Triple Hurdle Model (THM) which comprised of the first and second hurdles being Probit
models and the third hurdle a Truncated normal regression model, was used to identify the factors
influencing smallholder farmers’ decision to produce cowpea, participate in the market and the
intensity of participation. The simultaneous estimation procedure via the maximum likelihood
estimation accounts for endogeneity bias in the study. The instrumental variable regression model
was used to analyse the effect of intensity of market participation on productivity of smallholder
cowpea producers. The appropriate estimation tests were performed to ensure that the assumptions
underlying the instrumental variable regression using the Two-Stage Least Squares estimator
employed for the analysis are satisfied. The empirical results confirm the endogeneity of intensity
of market participation and was therefore instrumented.
The findings based on the descriptive analyses indicated that the regional aggregate gross value of
cowpea from the study was found to be 224,164.80 Ghana Cedis per hectare per production season.
University of Ghana http://ugspace.ug.edu.gh
99
The aggregate market participation of smallholder cowpea producing households revealed an
average marketed surplus ratio of 53%.
The factors influencing smallholder producers’ decision to participate in cowpea production
include: age of the household head, gender of the household head, dependency ratio, distance to
nearest market, own means of transportation, proximity to good road network, labour, possession
of own land for farming, access to improved cowpea seed, access to tractor services for ploughing
and the provision of extension services.
The factors identified to influence smallholder farmers’ decision to participate in the market are
age of the household head, distance to nearest market, own means of transportation, access to
market information, total volume of output produced, value of livestock owned, access to and
cultivation of improved cowpea seed, access to tractor services and the district location dummies
Kumbungu and Tolon.
Determinants of the intensity of participation in the cowpea market was found to include age of
the household head, education, own means of transportation, proximity to an all-weather good road
network, off-farm income, value of livestock owned, access to and cultivation of improved cowpea
variety, and the district location dummy Tolon.
Determinants of cowpea productivity also include the intensity of market participation measured
as the proportion of output sold hence the need to control for endogeneity. This finding means that
the more smallholder farmers participate in the markets, the higher their level of productivity.
Other determinants of cowpea productivity include: age, education, farm size, livestock owned,
University of Ghana http://ugspace.ug.edu.gh
100
access to and cultivation of improved cowpea variety, credit, selling price of cowpea and district
location dummies Tolon, Mion and Kumbungu.
5.3 Conclusions of the Study
Based on the above findings, the following conclusions are made. A strong argument can be
advanced that cowpea is gradually becoming a cash crop and not just a staple in the Northern
Region of Ghana since 53% of the total cowpea output is sold by smallholder farmers for income.
Smallholder farmers are encouraged to participate in cowpea production when distance to both
inputs and outputs markets are reduced and there is good road network linking communities to
facilitate mobility to and from the markets. Possession of own means of transportation and own
land for farming purposes also facilitate cowpea production. Farmers are also likely to participate
in cowpea production when they have easy access to improved seed, tractor and extensions
services.
The study also found out that smallholder farmers are likely to participate in the market conditional
on their production if transaction costs in participating in the market place are low as a result of
shorter distance to markets and access to market information. Additionally, smallholder farmers
with own means of transportation are likely to participate in the market because it leads to the
reduction in the marginal cost of movement. The findings also showed that value of livestock
owned, access to and cultivation of improved cowpea seed as well as tractor services stimulate
participation in the market.
The findings also revealed that conditional on participating in the market as a seller, smallholder
cowpea producers will intensify their participation when they are well educated either formally or
informally to enable them understand prevailing market dynamics. Also, ownership of means of
University of Ghana http://ugspace.ug.edu.gh
101
transportation, proximity to an all-weather good road network linking communities to marketing
centres will encourage them to intensify their market participation activities. Finally, involvement
in off-farm income generating activities, value of livestock owned and access to improved and
high yielding cowpea seed varieties which are drought, disease and pest resistant for cultivation
and readily available will encourage smallholder producers to intensify participation in the cowpea
market.
Smallholder cowpea producers’ intensity of market participation positively affects their level of
productivity. Therefore, the more smallholder farmers participate in the markets, the higher their
level of productivity. Other key determinants of cowpea productivity include educational level of
the household head, farm size cultivated, value of livestock owned and access to and cultivation
of improved cowpea seed. Other significant exogenous variables that influence productivity of
cowpea include educational level of the smallholder farmer, farm size cultivated, value of livestock
owned and access to and cultivation of improved cowpea seed. Formulation of policies to ensure
lower transaction costs among smallholder farmers will intensify their market participation
activities and hence accelerate poverty reduction among smallholder cowpea producers in the
Northern Region of Ghana.
5.4 Recommendations of the Study
Based on the conclusions of the study, the following recommendations are propounded.
Formulation of policies to increase production, productivity and market participation in order to
accelerate the promotion of pro-poor growth among smallholder cowpea producers and non-
producers in the Northern Region of Ghana since a significant proportion of cowpea produced in
the region is sold for income. Productivity promoting policies should be designed to encompass
University of Ghana http://ugspace.ug.edu.gh
102
formal educational training to enable smallholder cowpea producers understand and appreciate
how market functions.
Policy measures that ensure and promote agricultural diversification and easy access to inputs
should be put in place by the Ministry of Food and Agriculture. The ministry to also include
cowpea as one of the priority food crops under the flagship “Planting For Food and Jobs
programme” while the cowpea farmer field schools programme be intensified to assist farmers
produce more marketable surplus to induce non-cowpea producers to also start producing. The
ministry to also liaise with the private sector to ensure that provision of tractor hiring services are
readily made available to smallholder cowpea producers. The Ministry of Education should engage
with non-governmental and Farmer Based Organisations in the Northern Region to develop and
promote the “cowpea farmer business schools” concept to offer relevant skills and knowledge to
farmers. This is also likely to induce non-cowpea producers to start producing.
International and local scientific research institutions such as the International Institute of Tropical
Agriculture (IITA), Council for Scientific and Industrial Research (CSIR) and West African Centre
for Crop Improvement (WACCI) to develop and disseminate more improved cowpea varieties in
the Northern Region in particular and the country as a whole. The Central government should
intervene in facilitating farmers-to-markets linkage by developing adequate physical infrastructure
to support market connectivity and extension services.
The Ministry of Trade and Industry, and the local municipal and district assemblies to facilitate the
construction of modern markets in the major cowpea producing communities to ensure market
access in the Northern Region. The Road Transport Ministry and its subsidiary institutions such as
urban and feeder roads to build and maintain existing road networks to facilitate cowpea
University of Ghana http://ugspace.ug.edu.gh

103
production and marketing in the Northern Region. Though public investment in the provision of
public goods is essential, it is not sufficient to enable smallholder farmers enter markets.
Smallholder farmers therefore need to invest to acquire their own land and own means of
transportation in order to fully benefit from public infrastructure to sustain their cowpea production
ventures in particular and other crop farming operations in general.
5.5 Suggestions for Future Research
It is suggested for a future research to be undertaken that considers all the three distinct categories
of market participation namely, net sellers (households with positive net sales), autarkic
(households with zero net sales or households who produce purposely for household consumption)
and net buyers (households with negative net sales) in order to provide a more detailed dimension
of market participation. This suggested study should however be undertaken using a panel or
survey data in order to obtain a very large sample size for a national generalisation to be done.
University of Ghana http://ugspace.ug.edu.gh
104
REFERENCES
AATF. (2012). Policy brief on potentials and constraints of cowpea for food and poverty
alleviation. AATF, Nairobi, Kenya.
Abu, B.M., Issahaku, H. & Nkegbe, P.K. (2016). Farmgate versus market centre sales: a multi-
crop approach. Agricultural and Food Economics, 4(21).
Abu, B.M. (2015). Groundnut market participation in the Upper West Region of Ghana. Ghana
Journal of Development Studies, 12(1&2), 107-124.
ACET. (2017). African transformation report 2017: Agriculture powering Africa’s economic
transformation overview. ACET, Accra, Ghana
Adipala, E., Nampala, P., Karugi, J. & Isubikalu, P. (2000). A Review on Options for
Management of Cowpea Pests: Experiences from Uganda. Biomedical and Life Sciences
Integrated Pest Management Review 5(3), 185-196.
Abdulai, A. & Huffman, W. (2000). Structural adjustment and economic efficiency of rice farmers
in northern Ghana. Economic Development and Cultural Change, 48(3), 503-520.
Akpalu, W., Matshe, I. & Senbet, L.W. (2017). Effect of large-scale procurement on
smallholders: An overview. In Akpalu, W., Matshe, I. & Senbet, L.W. (Eds). Linking
smallholder farming to markets: Impact of purchase for progress report. Nairobi
University Press, Kenya.
Akpalu, W., Dias, P. & Mbizule, C. (2015). Improving smallholder farmer yield through
guaranteed market: The case of purchase for progress (P4P) in Ghana. In Akpalu, W.,
Matshe, I. & Senbet, L.W. (Eds). Linking smallholder farming to markets: Impact of
purchase for progress report. Nairobi University Press, Kenya.
Al-Hassan, S. (2008). Technical Efficiency of Rice Farmers in Northern Ghana. African
Economic Research Consortium, Nairobi. Research Paper, p. 178.
AGRA. (2016). Africa Agriculture Status Report 2016: Progress towards Agriculture
Transformation in Sub-Saharan Africa. AGRA, Nairobi, Kenya.
Akpalu, W. & Normanyo, A.K. (2014). Illegal fishing and catch potentials among small-scale
fishers: Application of an endogenous Switching regression model. Environment and
Development Economics, 19, 156-172.
Alene, A.D., Manyong, V.M., Omanya, G., Mignouna, H.D., Bokanga, M. & Odhiambo, G.
(2008). Smallholder market participation under transactions costs: Maize supply and
fertilizer demand in Kenya. Food Policy, 33(4), 318–328.
University of Ghana http://ugspace.ug.edu.gh
105
Al-Hassan, R. M., Sarpong, D. B. & Mensah-Bonsu, A. (2006). Linking Smallholders to
Markets. Ghana Strategy Support Program. Background Paper No. GSSP 0001
Ana, R., William, R., Masters, A. & Shively, G.E. (2008). Linkages between market
participation and productivity: results from a multi-country farm household sample.
A paper prepared for presentation at the American Agricultural Economics Association
Annual Meeting, Orlando, FL (July 27-29).
Angrist, J.D. & Krueger, A.B. (2001). Instrumental Variables and the Search for Identification:
From Supply and Demand to Natural Experiments. Journal of Economic Perspectives,
15(4), 69-85.
Asfaw, S., Amare, M., Lipper, L. & Davis, B. (2011). Welfare effects of market participation
under transaction costs: evidence from Tanzania. Working Paper, Agricultural
Development Economics Division, FAO.
Asfaw, S., Lipper, L., Dalton, J.T. & Audi, P. (2012). Market participation, on-farm crop
diversity and household welfare: micro-evidence from Kenya. Environment and
Development Economics 17, 579-601. Cambridge University Press.
Asuming-Brempong, S., Al-Hassan, R. M., Sarpong, D. B., George, T.M. K., Akoena, S. K. K.,
Owuraku, S.D., Mensah-Bonsu, A., Amegashie, D. P. K., Egyir, I. & Steve, A. (2004).
Poverty and Social Impact Analysis (PSIA) Studies for Ghana: Economic Transformation
of the Agricultural Sector. Final Report submitted to the National Development
Planning Commission (NDPC)/ Ministry of Food and Agriculture (MoFA), and DFID,
Ghana, for the “Economic Transformation of the Agriculture” Sector Study
Awotide, B.A., Diagne, A. & Awoyemi, T.T. (2013). Agricultural Technology Adoption, Market
Participation and Rural Farming Households’ Welfare in Nigeria. In 4th International
Conference of the African Association of Agricultural Economists, September 22-25
Hammamet, Tunisia.
Babu, S.C., Gajaran, S.N. & Sanyal, P. (2014). Food Security, Poverty and Nutrition Policy
Analysis: Statistical Methods and Applications, 2nd Edition, Elsevier Inc.
Barrett, C.B., Bell, R., Lentz, E.C. & Maxwell, D.G. (2009). Market information and food security
response analysis. Food Security, 151-168.
Barrett, C.B. (2008). Smallholder Market Participation: Concepts and Evidence from Eastern
and Southern Africa. Food Policy, 33, 299 - 317.
Barrett, C.B., Bachke, M.E., Bellemare, M.F., Michelson, H.C. & Narayanan, S. (2012).
Smallholder participation in contract farming: comparative evidence from five countries.
World Development, 40(4), 715–730.
University of Ghana http://ugspace.ug.edu.gh

106
Bellemare, M. F. (2012). As you sow, so shall you reap: the welfare impacts of contract farming.
World Development, 40(7), 1418-1434.
Bellemare, M.F & Barrett, C.B. (2006). An ordered tobit model of market participation:
evidence from Kenya and Ethiopia. American Journal of Agricultural Economics 88(2),
324-337.
Bezu, S. & Holden, S. (2014). Are rural youth in Ethiopia abandoning agriculture? World
Development, 64, 259-72.
Binswanger, H.P, Khandker, S.R. & Rosenzweig, M.R. (1993). How infrastructure and financial
institutions affect agricultural output and investment in India. Journal of development
economics 4, 337-366.
Boss, D.D. & Hughes-Oliver, J.M. (2000). How large does n has to be for Z and t intervals? The
American Statistician, 54(2), 121-128.
Boughton, D., Mather, D., Barrett, C. B., Benfica, R., Abdula, D., Tschirley, D. & Cunguara, B.
(2007). Market Participation by Rural Households in a Low-Income Country: An Asset-
Based Approach Applied to Mozambique. Faith and Economics, 50 (Fall 2007), 64–101.
Bowden, R. J. & Turkington, D.A. (1984). Instrumental Variables. Cambridge: Cambridge
University Press, Cambridge, United Kingdom.
Burke, W.J., Myers, R.J. & Jayne, T.S. (2015). A triple hurdle model of production and market
participation in Kenya’s diary market. American Journal of Agricultural Economics,
97(4), 1227-1246.
Burke, W. J. & Jayne, T. S. (2011). Econometric models of market participation. Prepared for
the ACTESA/COMESA training workshop on smallholder-led commercialisation and
poverty reduction: How to achieve it, Kigali, Rwanda. (April, 18-20).
Burke, W.J. (2009). Triple Hurdle Model of Smallholder Production and Market Participation in
Kenya’s Dairy Sector. Paper Submitted to Michigan State University in Partial Fulfillment
for the Degree of Master of Science.
Cadot, O., Dutoit, L. & Olarreaga, M. (2006). How costly is it for poor farmers to lift
themselves out of subsistence? World Bank Policy Research Working Paper 3881.
Camara, A. (2017). An Analysis of welfare effect of market participation of smallholder farm
households in Guinea. The Economic Research Guardian, 7(1), 2-23
Cameron, C.A. & Trivedi, P.K. (2005). Microeconometrics: Methods and Applications.
Cambridge University Press.
University of Ghana http://ugspace.ug.edu.gh

107
Cazzuffi, C. & McKay, A. (2012). Rice market participation and channels of sale in rural
Vietnam. In Selected Paper prepared for presentation at the International Association of
Agricultural Economists (IAAE) Triennial Conference, Brazil (18-24 August).
Chamberlin, J. (2007). Defining Smallholder Agriculture in Ghana: Who are smallholders,
what do they do and how are they linked with markets? Ghana Strategy Support Program.
Background Paper No. GSSP 0006.
Chamberlin, J., Diao X., Kolavalli, S. & Breisinger, C. (2007). Smallholder Agriculture in
Ghana. International Food Policy Research Institute (IFPRI). Ghana Strategy Support
Program. IFPRI Discussion Brief 3.
Chapoto, A., Mabiso, A. & Bonsu, A. (2013). Agricultural commercialisation, land expansion
and homegrown large-scale farms: insights from Ghana. IFPRI working paper 01286.
Washington, D.C.
Chege, C. G. K, Andersson, C. I. M, & Qaim, M. (2015). Impacts of supermarkets on farm
household nutrition in Kenya. World Development, 72, 394-407.
Chenery, H.B., Sherman, R. & Moises, S. (1986). Industrialization and Growth: A
Comparative Study. Oxford University Press, New York, NY.
Clougherty, J. & Duso, T. (2015). Correcting for self-selection based endogeneity in
management research: A review and empirical demonstration. Discussion Paper 1465,
Berlin.
Commen, M.A. (1962). Agricultural Productivity Trends in Kerala, Agricultural Situation in
India, 17(4), 333-36
Cragg, J.G. (1971). Some Statistical Models for Limited Dependent Variables with Application
to the Demand for Durable Goods. Econometrica, 39, 829–844.
CSIR-CRI. (2006). Crops Research Institute Annual Report.
Danso, J. (2016). Growth and yield of cowpea (vigna unguiculata) following nitrogen fertiliser
application inoculation. MPhil Thesis submitted to the Department of Crop and Soil
sciences, Kwame Nkrumah University of Science and Technology, Kumasi, Ghana.
Dawit, A., Gabre-Madhin, E. & Dejene, S. (2006). From farmer to market and market to farmer:
Characterizing smallholder commercialization in Ethiopia. In Paper submitted for
ESSP Policy Conference on Bridging, Balancing, and Scaling up: Advancing the Rural
Growth Agenda in Ethiopia. Addis Ababa, Ethiopia.
De Janvry, A., Fafchamps, M. & Sadoulet, E. (1991). Peasant household behaviour with
missing markets: some paradoxes explained. Economic Journal, 101, 1400-1417.
University of Ghana http://ugspace.ug.edu.gh
108
Demeke, L.B. & Haji, J. (2014). Econometric analysis of factors affecting market participation
of smallholder farming in Central Ethiopia. Munich Personal RePEc Archive (MPRA).
MPRA Paper No. 77024, UTC.
Dewett, K.K. & Singh, G. (1966). Indian Economics, Delhi, p. 66.
Dharmasiri, L. M. (2008). Measuring Agricultural Productivity Using the Average Productivity
Index (API): Sri Lanka Journal of Advanced Social Studies, 1(2), 26-42.
Dixon, J., Taniguchi, K., Wattenbach, W. & Tanyeri-Arbur, A. (2004). Smallholders,
globalization and policy analysis. Rome, FAO. AGSF Occasional Paper 5. Retrieved
from http://www.fao.org/docrep/007/y5784e/y5784e00.htm#Contents
Dunning, T. (2008). Model specification in instrumental variables-regression. Political Analysis,
16, 290-302.
Ekboir, J., Boa, K. & Dankyi, A. A. (2002). Impacts of No-Till Technologies in Ghana and Mexico
D.F.: CIMMYT.
Enete, A. A. & Igbokwe, E. M. (2009). Cassava Market Participation Decisions of Producing
Households in Africa. Tropicultura, 27(3), 129 - 136.
Fatokun, A.C. (2002). Breeding cowpea for resistance to insect pest; attempted crosses between
cowpea and Vigna vexillata. In C.A., Tawawali, S.A, Singh, B.B, Kormawa, P.M. &
Tamo, M. (Eds). Challenges and opportunities for enhancing sustainable cowpea
production. Fatokun International Institute for Tropical Agriculture (IITA) Ibadan,
Nigeria, 52-61.
Fogny, N., Joseph, M., Kennedy, G., Martin-Prevel, Y. & Torheim, L.E. (2010). Simple food
group diversity indicators predict micronutrient adequacy of women’s diets in 5 diverse,
resource-poor settings. Journal of Nutrition 140: 2059S–2069S
Francesconi, G. and N. Heerink. (2010). Ethiopian agricultural cooperatives in an era of global
commodity exchange: does organisational form matter? Journal of African Economies,
20, 153-77.
Franke A.C. & de Wolf, J.J. (2011). N2Africa Baseline Report. Report N2Africa project,
www.N2Africa.org.
Gabre-Madhin, E.Z. (2001). Market institutions, transaction costs, and social capital in the
Ethiopian grain market. Washington, D.C. Research Report 124. International Food Policy
Research Institute.
Gebremedhin, B., Shiferaw, K., Tegegne, A., Gizaw, S. & Hoekstra, D. (2017). An analysis of
milk production, butter marketing and household use of inputs in rural Ethiopia. LIVES
Working Paper 26. Nairobi, Kenya: International Livestock Research Institute (ILRI).
University of Ghana http://ugspace.ug.edu.gh
109
Gebremedhin, B., Shiferaw, K., Tegegne, A., Gizaw, S. & Hoekstra, D. (2017). A triple-hurdle
model of small-ruminant production and marketing in the highlands of Ethiopia:
Implications for commercial transformation. African Journal of Agricultural and
Resource Economics, 12(3), 257-270.
Gelo, D., Muchapondwa, E. & Shimeles, A. (2017). Return to investments in agricultural
cooperatives: evidence from a rational experiment. In Akpalu, W., Matshe, I. & Senbet,
L.W. (Eds.). Linking smallholder farming to markets: impact of purchase for progress
report. Nairobi University Press, Kenya.
Goetz, S. J. (1992). A Selectivity Model of Household Food Marketing Behavior in Sub-Saharan
Africa. American Journal of Agricultural Economics 74(2), 444-452
Goldberger, A. S. (1972). Structural Equation Methods in the Social Sciences. Econometrica,
40(6), 979–1001.
Govereh, J., Jayne, T.S. & Nyoro, J. (1999). Smallholder Commercialization, Interlinked
Markets and Food Crop Productivity: Cross-Country Evidence in Eastern and Southern
Africa. Unpublished, Department of Agricultural Economics and Department of
Economics, Michigan State University.
Greene, W.H. (2012). Econometric Analysis, 7th ed. Pearson Education, Incorporation, Prentice
Hall, One Lake Street, Upper Saddle River, NJ 07458, New York.
Greene, W.H. (2000). Econometric Analysis, New York: Macmillan Publishing.
GSS. (2008). Ghana Living Standards Survey, GLSS Round 5. Accra – Ghana
GSS. (2012). Ghana Population and Housing Census Summary Report, Accra – Ghana
GSS. (2014). Ghana Living Standards Survey, GLSS Round 6. Accra – Ghana
Gujarati, D.N. & Porter, D.C. (2009). Basic Econometrics. 5th edition, McGraw-Hill/Irwin,
New York
Hazell, P.B.R., Poulton, C., Wiggins, S. & Doward. A. (2007). The Future of small farms for
poverty reduction and growth. 2020 Discussion paper 42. Washington D.C: International
Food Policy Research Institute.
Heckman, J., Ichimura. H., Smith, J. & Todd, P. (1979). Characterizing selection bias using
experimental data. Econometrica, 66(5), 1017–1098.
Heltberg, R. & Tarp, F. (2002). Agricultural Supply Response and Poverty in Mozambique.
Food Policy, 27(1), 103-124.
Hernandez, R., Reardon, T. & Berdegue, J. (2007). Supermarkets, wholesalers, and tomato
growers in Guatemala. Agricultural Economics, 36(3), 281–290.
University of Ghana http://ugspace.ug.edu.gh
110
Hirsch, H.G. (1943). Crop Yield Index. Journal of Farm Economics, 25(3), 583.
Hollinger, A. & Staaz, J. M. (2015). Agriculture Growth in West Africa: Market and policy
drivers. Co-published by ADB and FAO, Rome- Italy.
Holloway, G., Nicholson, C., Delgado, C., Staal, S. & Ehui, S. (2004). A revised Tobit
procedure for mitigating bias in the presence of non-zero censoring with an
application to milk-market participation in the Ethiopian highlands. Agricultural
Economics, 31, 97-106.
Holloway, G., Nicholson, C., Delgado, C., Staal, S. & Ehui, S. (2000). Agro industrialization
through institutional innovation transaction costs, cooperatives and milk-market
development in the east-African highlands. Agricultural Economics, 23, 279-288.
Holloway, G. & Ehui, S. (2002). Expanding market participation among smallholder livestock
producers: A collection of studies employing Gibbs sampling and data from the
Ethiopia highlands. Socio-economic and Policy Research Working Paper 48. ILRI,
Nairobi, Kenya.
Holloway, G., Barrett, C. B. & Ehui, S. (2005). The Double-Hurdle Model in the Presence of
Fixed Costs. Journal of International Agricultural Trade and Development, 1:17–28.
Horring, J. (1964). Concept of productivity measurement on a National Scale, OECD,
Documentation in Food and Agriculture, 27, 10.
Hu, Z. & Rahman, S. (2015). Economic drivers of contemporary smallholder agriculture in a
transitional economy: A case of Hu village from southwest China. Singapore journal
of tropical agriculture, 36, 324-341.
Hu, X. & Schiantarelli, F. (1998). Investment and capital market imperfections: A switching
regression approach using U.S. firm panel data. Review of Economics and Statistics
80, 466-479
Huntington, E. & Valkenburg, S. V. (1952). Europe, New York, p. 102.
Hussain, M. (1976). Systematic Agricultural Geography. New Delhi: Rawat.
IFAD. (2011). Rural Poverty Report 2011: New Realities, New Challenges: New Opportunities
for Tomorrow’s Generation. IFAD, Rome.
IFAD. (2010). Rural Poverty Report. Rome: Quintily.
IFAD. (2003). Promoting market access for the rural poor in order to achieve the Millennium
Development Goals. Round table Discussion Paper for the 25th Anniversary Session of
IFAD’s Governing Council.
University of Ghana http://ugspace.ug.edu.gh
111
IFAD-IFPRI. (2011). Agricultural commercialization in northern Ghana. Innovative Policies
on Increasing Access to markets for High-Value Commodities and Climate Change
Mitigation. IFAD-IFPRI Partnership Newsletter
IFPRI. (2013). Agricultural commercialisation, land expansion and homegrown large-scale
farms: insights from Ghana. IFPRI working paper 01286. Washington, D.C.
IFPRI (2007). Smallholder agriculture in Ghana. Ghana Strategy Support Program. Discussion
Brief No.3.
Jari, B. and Fraser, G.C.G. (2009). An analysis of institutional and technical factors influencing
agricultural marketing amongst smallholder farmers in the Kat River Valley, Eastern Cape
Province, South Africa. African Journal of Agricultural Research, 4(11), 1129 - 1137.
Kem, S. (2017). Commercialisation of smallholder agriculture in Cambodia: Impact of cassava
boom on rural livelihoods and agrarian change. PhD Thesis submitted to the School of
Agriculture and Food Science, University of Queensland, Australia. Retrieved from
https://espace.library.uq.edu.au/data/UQ_686596/s4311897_final_thesis.pdf
Kendall, M. G. (1939). The Geographical Distribution of Crop Production in England. Journal
of the Royal Statistical Society, 162, 24 - 28.
Key, N., Sadoulet, E. & de Janvry, A. (2000). Transaction Costs and Agricultural Household
Supply Response. American Journal of Agricultural Economics 82, 245-59.
Kiiza, B. & Pederson, G. (2012). ICT-based market information and adoption of agricultural
seed technologies: insights from Uganda. Telecommunications Policy, 36(4), 253 - 259.
Kuznets, S. (1973). Modern economic growth: findings and reflections. American Economic
Review. 63(3), 247-258.
Langyintuo, A.S., Lowenberg-Deboer, J., Faye, M., Lambert, D., Ibro, G., Moussa., B. Kergna, A.
Kushwaha, S., Musa, S. & Ntoukam, G. (2003). Cowpea Supply and Demand in West and
Central Africa. Field Crops Research, 82, 215 – 231
Lapar, M.L., Holloway, G. & Ehui, S. (2003). Policy options promoting market participation
among smallholder livestock producers: a case study from the Philippines. Food Policy
28(3), 187-211.
Latt, E. A., & Nieuwoudt, W.L. (1988). Identification of plot size effects on commercialisation
of small scale agriculture in KwaZulu-Natal. Development Southern Africa 15(3), 371-
382.
Lentz, E. and J. Upton. (2015). P4P Impact Assessments: Synthesis of Preliminary Findings.
World Food Program, Rome.
University of Ghana http://ugspace.ug.edu.gh

112
Levinsohn, J.A. & McMillan, M. (2007). Does food aid harm the poor? Household evidence
from Ethiopia. Globalisation and Poverty. University of Chicago Press, Chicago. USA.
Lewis, A.W. (1954). Economic development with unlimited supplies of labor. Manchester
School, 22(2), 139-191.
Lifeyo, Y. (2017). Market participation of smallholder common bean producers in Malawi.
IFPRI Strategy Support Program. Working Paper Number 21, Malawi.
Lipper, L., Anderson, C.L., & Dalton, T.J. (Eds). (2010). Seed Trade in Rural Markets:
Implications for Crop Diversity and Agricultural Development, Rome: FAO and London:
Earthscan
Lipper, L., Cavatassi, R. & Winters, P. (2006). Seed supply and the on-farm demand for
diversity: a case study from Eastern Ethiopia, in M. Smale (Ed.), Valuing Crop
Biodiversity: On Farm Genetic Resources and Economic Change, Wallingford: CABI
Publishing, pp. 223 - 250.
Lokshin, M. & Sajaia, Z. (2004). Maximum likelihood estimation of endogenous switching
regression models. Stata Journal, 4(3), 282–289.
Lubungu M., Burke, W.J. & Sitko, N. (2013). Analysis of the soya bean value chain in Zambia’s
Eastern Province. Working Paper 74 May 2013, Indaba Agricultural Policy Research
Institute (IAPRI).
Maddala, G.S. (1983). Limited-dependent and qualitative variables in econometrics.
Cambridge University Press, Cambridge.
Maertens, M., Minten, B. & Swinnen J. (2012). Modern food supply chains and development:
evidence from horticulture export sectors in Sub-Saharan Africa. Development Policy
Review, 30(4), 473-479.
Mackenzie, W. (1962). The Impact of Technological Change on the Efficiency of Production
in Canadian Agriculture, Canadian Journal of Agricultural Economics, 1, 41.
Makhura, M., Kirsten, J. & Delgado, C. (2001). Transaction costs and smallholder participation
in the maize market in the Northern Province of South Africa. Seventh Eastern and
Southern Africa Regional Maize Conference, 11-15 February, Pretoria, South Africa.
Maltsoglou, I. & Tanyeri-Abur, A. (2005). Transaction costs, institutions and smallholder Market
integration: Potato Producers in Peru. ESA Working Paper No. 05-04
Marchetta, F. (2011). On the Move: Livelihood Strategies in Northern Ghana. Post-Doctorante
CNRS, Clermont Universite, France.
University of Ghana http://ugspace.ug.edu.gh
113
Martey, E., Al-hassan, R. M. & Kuwornu, J. K. M. (2012). Commercialization of smallholder
agriculture in Ghana: A Tobit regression analysis. African Journal of Agricultural
Research, 7(14), 2131-2141. Retrieved from http://www.academicjournals.org/AJAR
Masuku, M.B., Makura, M.T. & Rwelamira, J.K. (2001). Factors affecting market decisions in
the maize supply chain among smallholder farmers in Swaziland. Agrekon 40(4), 698-
707.
Mazumdar, D. (1987). Rural-urban migration in developing countries. In first ed. Mills, E.S.
(Ed.), Handbook of Regional and Urban Economics, (Chapter 28). Elsevier, 2, 1097-1128.
North- Holland.
Mellor, J. (1976). The new economics of growth: A strategy for India and the developing world.
Ithaca: Cornell University Press.
Michelson, H.C. (2013). Small farmers, NGOs, and a Walmart world: welfare effects of
supermarkets operating in Nicaragua. American Journal of Agricultural Economics,
95(3), 628-649
Minde, I., Jayne, T.S., Crawford, E., Ariga, J. & Govereh. J. (2008). Promoting fertilizer use
in Africa: current issues and empirical evidence from Malawi, Zambia, and Kenya.
Washington, DC: United States Agency for International Development.
Minot, N., Kherallah, M. & Berry, P. (2000). Fertilizer Market Reform and the Determinants
of Fertilizer Use in Benin and Malawi. Washington, D.C. International Food Policy
Research Institute, MSSD Discussion Paper No. 40, October
Minten, B. & Barrett, C.B. (2008). Agricultural technology, productivity and poverty in
Madagascar. World Development, 36(5), 797-822.
Mmbando, F. E., Wale, E. Z. & Baiyegunhi, L. J. S. (2015). Determinants of smallholder
farmers’ participation in maize and pigeonpea markets in Tanzania. Agrekon 54(1), 96-
119.
MoFA. (2017). Draft work plan for Ministry of Food and Agriculture: Planting for food and jobs
campaign. Retrieved from http://agricinghana.com/wp-content/uploads/2017/05/PFJ-Draft-
WorkPlan_Agricinghana.pdf
MoFA. (2011). Agriculture in Ghana. Facts and figures (2010). Statistics, Research and
Information Directorate (SRID). Accra, Ghana
MoFA. (2010). Ministry of Food and Agriculture: Cropped area for major crops in Ghana:
Statistics, Research and Info. Directorate (SRID). In Mohan Raj, K.E. Dashiell and L.E.N.
Jackai (Eds). IITA, Ibadan, Nigeria, pp. 1-11.
University of Ghana http://ugspace.ug.edu.gh

114
MoFA-SRID. (2016). Ministry of Food and Agriculture-Statistics, Research and Information
Directorate. Agriculture in Ghana: Facts and Figures 2015, Accra-Ghana
MoFA. (2007). Ministry of Food and Agriculture: Food and Agriculture Sector Development
Policy II (FASDEP II), Accra – Ghana.
MoFA. (2016). Ministry of Food and Agriculture: Agricultural Sector Progress Report 2015,
Accra-Ghana.
Morgan, M. S. (1990). The History of Econometric Ideas. Cambridge: Cambridge University
Press, United Kingdom.
Moti, J., Gebremedhin, B. & Hoeskstra, D. (2009). Smallholder commercialization: Processes,
determinants and impact. Discussion Paper No. 18. Improving Productivity and Market
Success (IPMS) of Ethiopian Farmers Project, ILRI (International Livestock Research
Institute), Nairobi, Kenya, 55.
Muriithi, B. W. & Matz, J. A. (2015). Welfare effects of vegetable commercialization:
evidence from smallholder producers in Kenya. Food Policy, 50, 80-91.
Musah, A.B., Osei-Asare, Y.B. & Seini, W. (2014). Market participation of smallholder maize
farmers in the Upper West Region of Ghana. African Journal of Agricultural Research,
9(31), 2427-2435.
Novigon, J., Frempong, R. B. & Afoakwah, C. (2017). Access to markets, food security and
poverty in Ghana. In Akpalu, W., Matshe, I. & Senbet, L.W. (Eds.). Linking smallholder
farming to markets: impact of purchase for progress report. Nairobi University Press,
Kenya.
Nyoro, J. K., Kiiru, M. W. & Jayne, T. S. (1999). Evolution of Kenya’s maize marketing
systems in the post-liberalisation era. Tegemeo Institute of Agricultural Policy and
Development Working Paper 2A.
Obare, G.A., Omamo, S.W. & William, J.C. (2003). Smallholder production structure and rural
roads in Africa: The case of Nakuru District, Kenya. Agricultural Economics 28(3),
245-254.
Ofori, I. M. (1973). Factors of Agricultural Growth in West Africa. ISSER, University of Ghana,
Legon, Accra, Ghana.
Okello, J.J., Kirui, O.K. & Gitonga, Z. (2012). A Triple Hurdle Analysis of the Use Electric-
Based Agricultural Market Information Services: The Case of Smallholder Famers in
Kenya. University of Nairobi, College of Agriculture and Veterinary Sciences.
University of Ghana http://ugspace.ug.edu.gh
115
Olwande, J. & Mathenge, M. (2012). Market Participation among Poor Rural Households in
Kenya. In Paper Presented at the International Association of Agricultural Economists
Triennial Conference, Brazil. (18-24 August).
Olwande, J., Smale, M., Mathenge, M. K., Place, F. & Mithöfer, D. (2015). Agricultural
marketing by smallholders in Kenya: A comparison of maize, kale and dairy. Food
Policy, 52, 22-32.
Omiti, J. M., Otieno, D. J., Nyanamba, T. O. & McCullough, E. (2009). Factors influencing
the intensity of market participation by smallholder farmers: A case study of rural and
peri-urban areas of Kenya. African Journal of Agricultural and Resource Economics,
3(1), 57–82.
Otsuka, K. (2016.) Transforming African Agriculture by Promoting Improved Technology and
Management Practices. Background Paper for the 2017 African Transformation Report.
Accra, Ghana: ACET.
Ouma, E., Jagwe, J., Aiko, G. O. & Abele, S. (2010). Determinants of smallholder farmers’
participation in banana markets in Central Africa the role of transaction costs.
Agricultural Economics, 42(2), 111-122.
Pandit, A.D. (1965). Application of productivity concept to Indian agriculture, Agricultural
Productivity, 6(2), 187.
Pingali, P. (1997). From subsistence to commercial production systems: The transformation of
Asian agriculture. American Journal of agricultural Economics 79(2), 628-634.
Pingali, P.L. & Rosegrant, M.W. (1995). Agricultural Commercialization and Diversification:
Processes and Policies, Food Policy 20(3), 171-85.
Polson, R. A. & Spencer, D. S. C. (1992). The Technology Adoption Process in Subsistence
Agriculture: The Case of Cassava in Southwestern Nigeria. Agricultural System, (36), 65-
78.
Randela, R., Alemu, Z. G. & Groenewald, J. A. (2008). Factors enhancing market participation
by small-scale cotton farmers. Agrekon, 47(4), 451–469.
Rao, E.J.O., Brümmer, B. & Qaim, M. (2012). Farmer participation in supermarket channels,
production technology, and efficiency: the case of vegetables in Kenya. American
Journal of Agricultural Economics, 94(4), 891-912.
Rao, E.J.O. & Qaim, M. (2011). Supermarkets, Farm Household Income, and Poverty: Insights
from Kenya. World Development, 39(5), 84-796.
Renkow, M., Hallstrom, D.G. & Karanja, D.D. (2004). Rural infrastructure, transactions costs
and market participation in Kenya. Journal of Development Economics 73(3), 349-367.
University of Ghana http://ugspace.ug.edu.gh

116
Reyes, B., Donovan, C., Bernsten, R. & Maredia, M. (2012). Market participation and sale of
potatoes by smallholder farmers in the central highlands of Angola: A Double Hurdle
Approach. In Selected Paper prepared for presentation at the International Association
of Agricultural Economists (IAAE) Triennial Conference, Brazil. (18-24 August).
Riddell, P. J. & Westlake, M. (2006). Demand for products of irrigated agriculture in sub-
Saharan Africa. Rome, Italy: FAO.
Rios, R.A., Shively, G.E. & Masters, W.A. (2009). Farm productivity and market participation:
Evidence from LSMS Data: Paper presented at the International Association of
Agricultural Economics Conference, Beijing, China, (August 16-22).
Romer, P.M. (1994). The origins of endogenous growth. Journal of Economic Perspectives.
8(1), 3-22.
Roodman, D. (2011). Estimating fully observed recursive mixed-process models with cmp.
Stata Journal, 11(2), 159-206.
Sapre, S. G., & Deshpande, V. D. (1964). The Inter-District Variations in Agricultural
Efficiency in Mahrashtra State. Indian Journal of Agricultural Economics, 19, 242-
252.
Sartori, A.E. (2003). An Estimator for Some Binary-Outcome Selection Models without
Exclusion Restrictions. Political Analysis, 11, 111-138.
Saxon, E. A. (1965). Concept of Productivity. Agricultural Productivity, 6,112 - 120.
Schultz, T.W. (1964). Transforming Traditional Agriculture. (1983 ed). Chicago: University of
Chicago Press.
Schultz, T. W. (1945). Agriculture in an unstable Economy. McGraw-Hill Book Company Inc.,
New York.
Senbet, L.W. (2017). Linking smallholder farming to markets: impact of purchase for progress
report. Nairobi University Press, Kenya
Seng, K. (2016). The effects of market participation on farm households’ food security in
Cambodia: Endogenous switching approach. MPRA Paper No. 69669.
Shafi, M. (1984). Agricultural Productivity and Regional Imbalances. New Delhi: Concept
publishing company.
Sharpe, D.L. & Abdel-Ghany, M. (1999). Identifying the Poor and Their Consumption
Patterns. Family Economics and Nutrition Review 12(2), 14-25.
University of Ghana http://ugspace.ug.edu.gh

117
Shiferaw, B.A., Kebede, T.A. & You, L. (2008). Technology adoption under seed access
constraints and the economic impacts of improved pigeonpea varieties in Tanzania.
Agricultural Economics, 39, 309-323.
Singh, I., Squire, L. & Strauss, J. (1986). Agricultural Household Models: Extensions,
Applications and Policy, Baltimore and London, The John Hopkins University Press
for the World Bank.
Singh, J. & Dhillion, S. S. (2000). Agricultural Geography (2nd ed.) New Delhi: Tata McGraw
Hill.
Singh, J. (1972). A New Technique for Measuring Agricultural Productivity in Haryana, India.
The Geographer, 19, 15 - 33.
Siziba, S., Kefasi, N., Diagne, A., Fatunbi, A.O. & Adekunle, A.A. (2011). Determinants of
cereal market participation by sub-Saharan Africa smallholder farmer. Learning Publics
Journal of Agriculture and Environmental studies, 2(1), 180-193.
Smale, M. (ed.) (2006). Valuing Crop Biodiversity: On Farm Genetic Resources and Economic
Change, Wallingford: CABI Publishing.
Southgate, D., Graham, D. & Tweeten, L. (2007). The world food economy. Oxford:
Blackwell.
Southworth, H. M. & Johnston, B. F. (1967). Agricultural Development and Economic Growth.
Cornell University Press, U.K
Staal, S., Delgado, C. & Nicholson, C. (1997). Smallholder dairying under transactions costs in
East Africa. World Development. 25, 779-794.
Staiger, D. & Stock, J.H. (1997). Instrumental variables regression with weak instruments.
Econometrica, 65(3), 557-586.
Stamp, L. D. (1958). The Measurement of Land Resources. The Geographical Review, 48(1),
110-116.
Stephens, E. C. & Barrett, C. B. (2009). Incomplete Credit Markets and Commodity Marketing
Behavior. Cornell University Working Paper.
Stifel, D., Minten, B. & Dorosh, P. (2003). Transactions costs and agricultural productivity:
Implications of isolation for rural poverty in Madagascar. MSSD discussion paper No.
56. IFPRI, Washington-USA
Strasberg, P.J., Jayne, T.S., Yamano, T., Nyoro, J., Karanja, D. & Strauss, J. (1999). Effects
of Agricultural Commercialization on Food Crop Input Use and Productivity in Kenya.
MSU International Development Working Paper No.71, Michigan State University.
University of Ghana http://ugspace.ug.edu.gh

118
Tabe-Ojong Jr, M.P. & Mausch, K. (2017). Impacts of improved chicken pea adoption on
smallholder production and commercialisation. Tropentag, Bonn, Germany. September,
20-22
Tadesse. G. & Shively, G. (2013). Repeated transaction in rural grain markets of Ethiopia.
Journal of Development Studies, 49, 1172–87.
Takeshima, H. (2010). Agricultural mechanization and the smallholder farmers in Nigeria.
South Asia, 97(99), 20-30.
Timmer, C.P. (2007). The Structural transformation and the changing role of agriculture in
economic development: Empirics and implications. Wendt Lecture, October 30,
American Enterprise Institute, Washington, DC.
Timmer, C. P. (2005). Agriculture and pro-poor growth: An Asian perspective. Centre for Global
Development, Working paper No. 63.
Timmer, C.P. (1988). The Agricultural Transformation. In H. Cheney and T.N. Srinivasan, (Eds.)
Chapter 8. Handbook of Development Economics, 1, 275-331, Amsterdam, Elsevier
Uchezuba, I.D., E. Moshabele, & D. Digopo. (2009). Logistical estimation of the probability of
mainstream market participation among small-scale livestock farmers: a case study of the
Northern Cape Province. Agrekon, 48(2), 171-183
UN, (2016). World Urbanization Prospects, the 2014 Revision. New York: United Nations.
Available at https://esa
UN, (2015). Report of the United Nations conference on sustainable development. Rio de
Janeiro, Brazil & New York (A/CONF.216/16).
Vermeulen, S. & Cotula, L. (2010). Making the most of agricultural investment: A survey of
business models that provide opportunities for smallholders. IIED/FAO/IFAD/SDC,
London/Rome/Bern. ISBN: 978-1-84369-774-9.
Wickramasinghe, U. (2015). Production Specialisation and Market Participation of Smallholder
Agricultural Households in Developing Countries. In Balisacan, A., Chakravorty, U. &
Ravago, M-L. (Eds). Sustainable Economic Development, 349-367. Elsevier Inc.
Wickramasinghe, U., Omot, N., Patiken, A.D. & Ryan, J. (2014). Market participation of
smallholder agricultural households in Papua New Guinea. CAPSA Working Paper No.
108.
Wickramasinghe, U. & Weinberger, K. (2013). Smallholder Market Participation and
Production Specialization: Evolution of thinking, issues and policies. CAPSA-ESCAP,
Working paper 107.
University of Ghana http://ugspace.ug.edu.gh

119
Winship, C. & Mare, R.D. (1992). Models for Sample Selection Bias. Annual Review of
Sociology, 18, 327–50.
Wooldridge, J. (2010). Econometric Analysis of Cross Section and Panel Data, MIT Press,
Second Edition.
Wooldridge, J.M. (2006). Introductory Econometrics: A Modern Approach. (Third Ed.). South-
Western College Publishing.
Wooldridge, J.M. (2002). Econometric Analysis of Cross Section and Panel Data. Massachusetts
Institute of Technology, Cambridge, Massachusetts, London, England.
World Bank. (2015). World Development Indicators. The World Bank, Washington, DC, USA
World Bank. (2011). Logistics Performance Index, 2011. World Bank. Washington, DC, USA
World Bank (2007). World Development Report 2008: Agriculture for development: Overview,
The World Bank, Washington, DC, USA.
Wright, P. G. (1928). The Tariff on Animal and Vegetable Oils. New York: MacMillan
Yirzagla, J., Atokple, I.D.K., Haruna, M., Kusi, F., Suguri, I. & Muntari, A. (2016). Scaling out
Cowpea Production in Northern Ghana: Community Seed Production Scheme. Pan
African Grain Legume and World Cowpea Conference, Livingstone, Zambia
Zamasiya, B., Mango, N., Nyikahadzoi, K. & Siziba, S. (2014). Determinants of soybean market
participation by smallholder farmers in Zimbabwe. Journal of Development and
Agricultural Economics, 6(2), 49-58.
Zeller, M., Diagne. A. & Mataya, C. (1998). Market access by smallholder farmers in Malawi:
implications for technology adoption, agricultural productivity and crop income.
Agricultural Economics, 19, 219-229
University of Ghana http://ugspace.ug.edu.gh

120
APPENDICES
Appendix 3.1: Questionnaire for Household Survey
This questionnaire is to solicit information on the thesis title: Production, Productivity and
Market Participation of Smallholder Cowpea Producers in the Northern Region of Ghana.
All information provided will be treated as confidential and will be used solely for the purpose of
the study.
Interviewer___________________________________ Date of interview ______/______/2018
Location (District Name) __________________ Population of District _________
Community/Village_________________________________ Questionnaire Number _______
Farmer: Cowpea Producer [ ] Non-producer [ ]
Section A: Household Demographic and Socioeconomic Characteristics
Responses to be provided by the household decision maker
Farmer Characteristics
Name of respondent Age Gender Household Size Tel. No
Dependency ratio: No. of persons (children 0-15 years and adults above 64years)______
No. of persons (16-64 years of age) ____________________
What is your level of education? ___________________
Years spent to reach current level of education? ______________________________
Number of people chronically ill in the past month __________________________
1. How many years have you spent farming cowpea? ____________________
2. Indicate your source of labour? 01 = Own labour [ ] 02 = Family labour [ ]
University of Ghana http://ugspace.ug.edu.gh

121
3. 03 = Hired labour [ ] 04 = Others [ ] please specify _____________________
4. Are you a member of any farmer based organisation? 01 = Yes [ ] 02 = No [ ]
(If No move to Q6)
5. If yes, give the name of the FBO _________________________________
6. How often does the association meet to discuss issues related to cowpea production? 01=
Weekly [ ] 02 = Fortnightly [ ] 03 = Monthly [ ] 04 = Quarterly [ ] 05 = Annually
[ ]
7. If No, why _____________________________________________
8. Please kindly indicate your ethnicity ________________________________
9. What is your religion? 01 = Christian [ ] 02 = Islam [ ] 03 = Traditional [ ]
04 = Others [ ], specify ___________________
10. Farm Size
Amount of land size devoted to cowpea production in acres __________________
Do you own the land devoted to cowpea production? 01 = Yes [ ] 02 = No [ ]
If no, how do you pay for it? 01 = Cash [ ] 02 = Produce [ ] 03 = Others [ ],
specify _____________
What is the land ownership type? 01 = Own land [ ] 02 = Family land [ ] 03 =
Hired land [ ] 04 = Others [ ], specify ___________________________
Do you intercrop cowpea with other crops? 01 = Yes [ ] 02 = No [ ]
If yes, which crops do intercrop with cowpea? _________________________________
Non-Cowpea Income
Do you engage in other crop farming apart from cowpea? 01 = Yes [ ] 02 = No [ ]
(If no move Q.10)
If yes, indicate the crops
________________________________________________________
If you engaged in other crop farming activities for income indicate below
No. Tick Source of Farm Income Activity Amount
(GHS)
1 Food Crops: e.g cassava, maize, millet, yam, sorghum,
groundnut, rice, tomato, pepper etc.
2 Cash crops: e.g soybeans, cotton, tobacco etc.
University of Ghana http://ugspace.ug.edu.gh
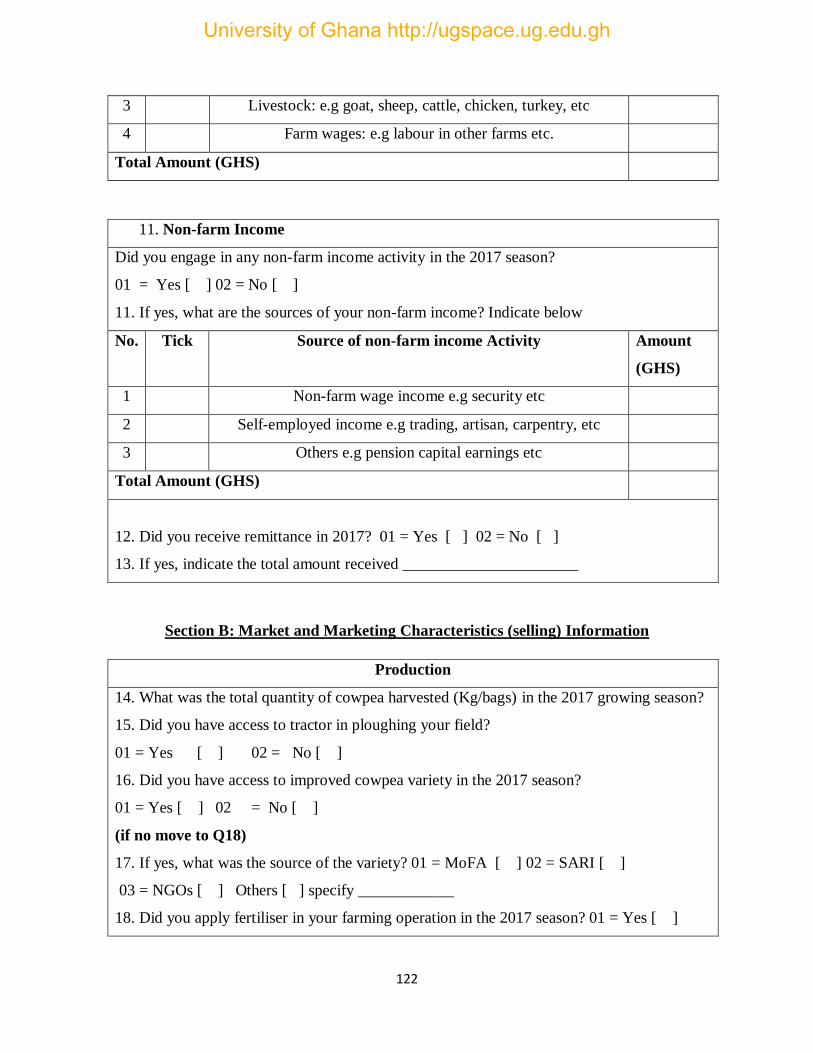
122
3 Livestock: e.g goat, sheep, cattle, chicken, turkey, etc
4 Farm wages: e.g labour in other farms etc.
Total Amount (GHS)
11. Non-farm Income
Did you engage in any non-farm income activity in the 2017 season?
01 = Yes [ ] 02 = No [ ]
11. If yes, what are the sources of your non-farm income? Indicate below
No. Tick Source of non-farm income Activity Amount
(GHS)
1 Non-farm wage income e.g security etc
2 Self-employed income e.g trading, artisan, carpentry, etc
3 Others e.g pension capital earnings etc
Total Amount (GHS)
12. Did you receive remittance in 2017? 01 = Yes [ ] 02 = No [ ]
13. If yes, indicate the total amount received ______________________
Section B: Market and Marketing Characteristics (selling) Information
Production
14. What was the total quantity of cowpea harvested (Kg/bags) in the 2017 growing season?
15. Did you have access to tractor in ploughing your field?
01 = Yes [ ] 02 = No [ ]
16. Did you have access to improved cowpea variety in the 2017 season?
01 = Yes [ ] 02 = No [ ]
(if no move to Q18)
17. If yes, what was the source of the variety? 01 = MoFA [ ] 02 = SARI [ ]
03 = NGOs [ ] Others [ ] specify ____________
18. Did you apply fertiliser in your farming operation in the 2017 season? 01 = Yes [ ]
University of Ghana http://ugspace.ug.edu.gh
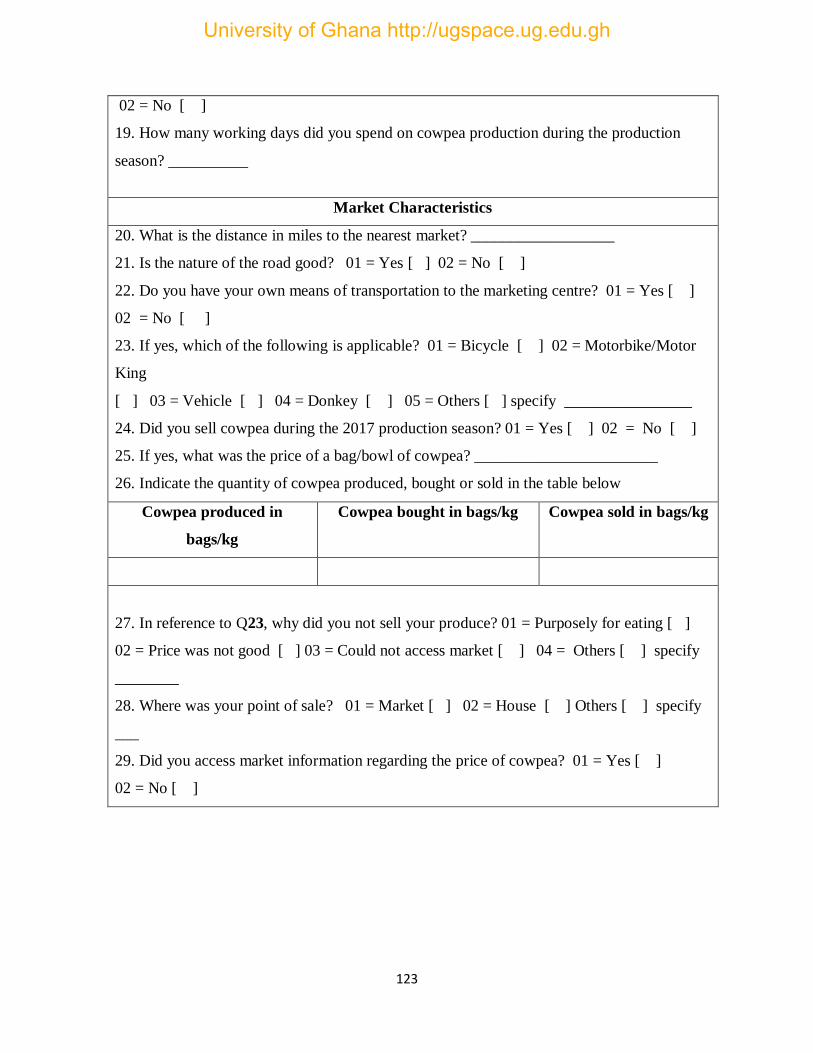
123
02 = No [ ]
19. How many working days did you spend on cowpea production during the production
season? __________
Market Characteristics
20. What is the distance in miles to the nearest market? __________________
21. Is the nature of the road good? 01 = Yes [ ] 02 = No [ ]
22. Do you have your own means of transportation to the marketing centre? 01 = Yes [ ]
02 = No [ ]
23. If yes, which of the following is applicable? 01 = Bicycle [ ] 02 = Motorbike/Motor
King
[ ] 03 = Vehicle [ ] 04 = Donkey [ ] 05 = Others [ ] specify ________________
24. Did you sell cowpea during the 2017 production season? 01 = Yes [ ] 02 = No [ ]
25. If yes, what was the price of a bag/bowl of cowpea? _______________________
26. Indicate the quantity of cowpea produced, bought or sold in the table below
Cowpea produced in
bags/kg
Cowpea bought in bags/kg Cowpea sold in bags/kg
27. In reference to Q23, why did you not sell your produce? 01 = Purposely for eating [ ]
02 = Price was not good [ ] 03 = Could not access market [ ] 04 = Others [ ] specify
________
28. Where was your point of sale? 01 = Market [ ] 02 = House [ ] Others [ ] specify
___
29. Did you access market information regarding the price of cowpea? 01 = Yes [ ]
02 = No [ ]
University of Ghana http://ugspace.ug.edu.gh
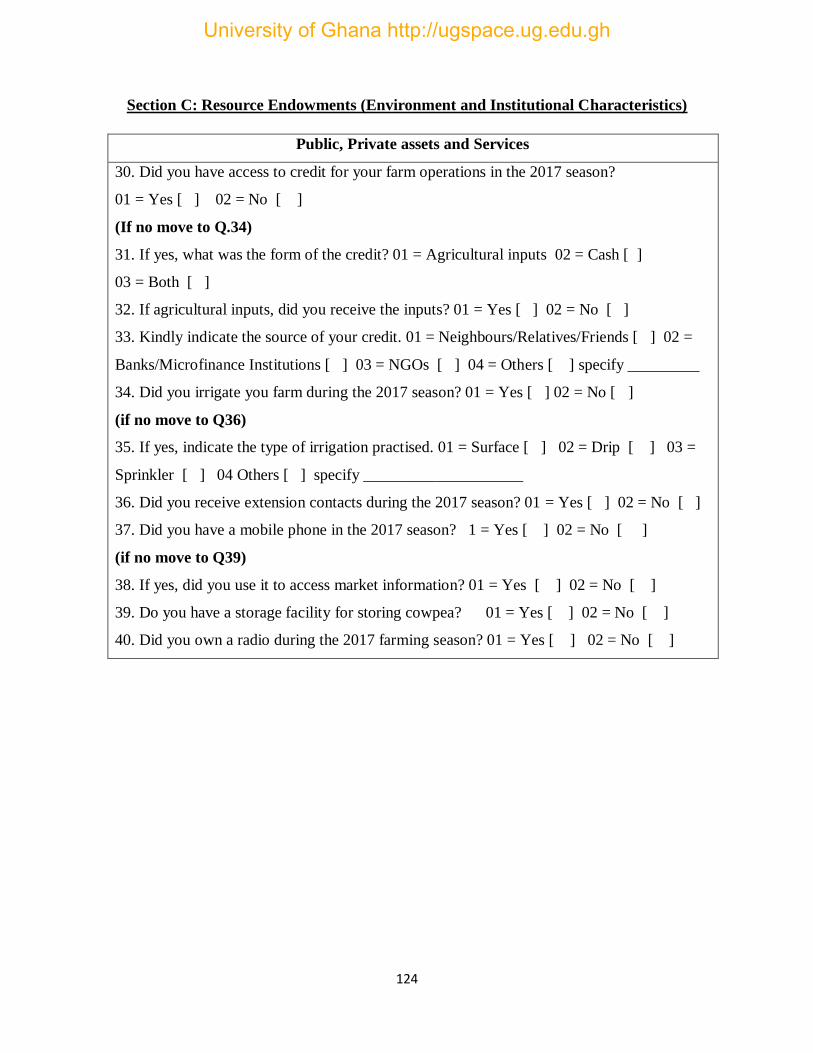
124
Section C: Resource Endowments (Environment and Institutional Characteristics)
Public, Private assets and Services
30. Did you have access to credit for your farm operations in the 2017 season?
01 = Yes [ ] 02 = No [ ]
(If no move to Q.34)
31. If yes, what was the form of the credit? 01 = Agricultural inputs 02 = Cash [ ]
03 = Both [ ]
32. If agricultural inputs, did you receive the inputs? 01 = Yes [ ] 02 = No [ ]
33. Kindly indicate the source of your credit. 01 = Neighbours/Relatives/Friends [ ] 02 =
Banks/Microfinance Institutions [ ] 03 = NGOs [ ] 04 = Others [ ] specify _________
34. Did you irrigate you farm during the 2017 season? 01 = Yes [ ] 02 = No [ ]
(if no move to Q36)
35. If yes, indicate the type of irrigation practised. 01 = Surface [ ] 02 = Drip [ ] 03 =
Sprinkler [ ] 04 Others [ ] specify ____________________
36. Did you receive extension contacts during the 2017 season? 01 = Yes [ ] 02 = No [ ]
37. Did you have a mobile phone in the 2017 season? 1 = Yes [ ] 02 = No [ ]
(if no move to Q39)
38. If yes, did you use it to access market information? 01 = Yes [ ] 02 = No [ ]
39. Do you have a storage facility for storing cowpea? 01 = Yes [ ] 02 = No [ ]
40. Did you own a radio during the 2017 farming season? 01 = Yes [ ] 02 = No [ ]
University of Ghana http://ugspace.ug.edu.gh

125
University of Ghana http://ugspace.ug.edu.gh