Embed Size (px)
Citation preview
International Journal of Research Studies in Agricultural Sciences (IJRSAS)
Volume 5, Issue 7, 2019, PP 18-36
ISSN No. (Online) 2454–6224
DOI: http://dx.doi.org/10.20431/2454-6224.0507003
www.arcjournals.org
International Journal of Research Studies in Agricultural Sciences (IJRSAS) Page | 18
Analysis of Production Efficiency, Productivity Variances and
Resource Allocation among Smallholder Farmers of Soybean
Producers: Evidence from Benishangul-Gumuz Region Ethiopia
Regasa Dibaba Wake1*
, Mesay Yami1, Adam Bekele
2
1Ethiopian Institute of Agricultural Research, Assosa Agricultural Research Center, Assosa, Ethiopia
1Ethiopian Institute of Agricultural Research, Sebeta Fishery Research Center, Sebeta, Ethiopia
2 Ethiopian Institute of Agricultural Research, Addis Ababa, Ethiopia
1. INTRODUCTION
Soybean is among the important pulse crops grown in different parts of Ethiopia as stable food and
income generation source. The country has immense potentials for soybean production and
popularized in different parts of the country with multiple food and economic advantages for small-
scale farmers. It is used as food for home consumption, raw materials for local factories and feed for
animal as indicated by Abebe (2017) and Sisay (2017). According to Tinsley (2009) and Adelodun
(2011) soybean crop has relatively high protein content (about 40%) with a good balance of the
essential amino acids, unsaturated and non-cholesterol fatty acid (approximately 20%) and contains
vitamins such as thiamine, niacin, riboflavin, choline, vitamins E and K, which are necessary for
normal body growth and development.
Many efforts have been done in improving soybean varieties development and/or adaptation with different agronomic and other management options since 1950 in the Ethiopian agricultural
production systems; Addisu et al. (2016). Assosa agricultural research center also made great effort to
Abstract: The technical, allocative and economic efficiency in soybean production among small-holders in
Benishangul-Gumuz region was estimated using the stochastic frontier production function analysis. The
main objective of the study was to explore ways likely to increase productivity of soybean among small-holder
farmers in the region through a better use of the factors employed in soybean production. The study were used primary data collected from a sample of 266 soybean producer farmers of Assosa and Bambasi districts
through administration of structured questionnaire. Multi-stage random sampling technique was employed to
select sample respondents. The respondents were randomly selected from nine villages of the two districts
where the scaling-up of soybean technologies being introduced. Descriptive statistics were used to analyze
socioeconomic characteristics while the stochastic frontier production function was used, in order to estimate
the level of technical, allocative and economic efficiencies among sample farmers. The results further
revealed the existence of inefficiencies in soybean production among farmers in the study area. The mean
technical efficiency of soybean producer farmers was found to be 72.81% while the average efficiency of
allocative and economic were 55.13% and 40.08%, respectively. On the determinants of inefficiency, the
study found that educational level, farming experience, distance to cooperative and input center significantly
reduce the technical inefficiencies among soybean farmers, whereas distance to main road, access to credit, frequency of extension contacts, farming experience and ownerships to tropical livestock unit decreases
allocative inefficiency of soybean among producers. On the other hand, educational level, frequency of
extension contact, experience in farming, distance to cooperative and input center significantly reduce
economic inefficiencies among soybean producer farmers in study area. The result emphasize the need for
building rural infrastructure, adult education and training of farmers in FTC and demonstration new
technologies, institutional support of credit services and increasing frequency of extension and improving
livestock health and nutritional improvements in the study area.
Keywords: Soybean, Small-holder farmers, Efficiency, Stochastic frontier, Benishangul-Gumuz region
*Corresponding Author: Regasa Dibaba Wake, Ethiopian Institute of Agricultural Research, Assosa
Agricultural Research Center, Assosa, Ethiopia
Analysis of Production Efficiency, Productivity Variances and Resource Allocation among Smallholder
Farmers of Soybean Producers: Evidence from Benishangul-Gumuz Region Ethiopia
International Journal of Research Studies in Agricultural Sciences (IJRSAS) Page | 19
generate, promote and disseminated this technology in potential production areas of western Ethiopia, particularly in the Benishangul-Gumuz Region for more than ten years. Assosa zone is among the
areas where this technology was introduced and disseminated to improve food security and income of
smallholder farmers. In the area smallholder farmers who are currently producing the soybean are
preparing different recipes with different types of cereal and vegetable crops use as parts of their stable foods. In this area soybean is widely produced by the majority of small-holder farmers and
playing a crucial and diverse role in the diets of community, cash generation and enhancing soil
fertility. This study is mainly concerned with combination of resources and cost minimization targeting optimum production. Identifying inefficiency in soybean production helps small-holder
farmers producing soybean to use their inputs efficiently thereby helping in minimizing the already
scarce resources in the region. Moreover, the study is designed to help find solutions which would promote increases in soybean productivity as well as overall output.
1.1. General Objective
The main objective of this study is to evaluate the technical, allocative and economic efficiency and
identify factors that explain the variations in inefficiency of Soybean production in the study area.
1.2. Specific Objectives
1. To determine the level of technical, allocative and economic efficiency of soybean production
among small-holders in the study area
2. To evaluate the main determinants of efficiency among soybean producers of small-holders in the
region.
1.3. Concept of Efficiency in the Production
The simple and straight forward way of measuring efficiency of a farm could be yield per hectare.
However, given output is a function of multiple inputs in the reality, this is very simplistic way of
measurement in that it only considers a single input of production, land. The other technique is to use
the conventional econometric analysis, which generally assumes that all producers always achieve to
optimize their production process. However, there are discrepancies between production amount and
production values even if the farm have identical technological constraints. This depends upon
different productive capabilities and less favorable utilization resources by some farms (Burhan et al. 2009).
In economics and other fields a farmer’s efficiency can be viewed in terms of technical efficiency, allocative efficiency and economic efficiency. In order to be economically efficient, a farmer must
first be technically efficient and this is just one component of overall economic efficiency. Profit
maximization requires farmers to produce the maximum output given the level of inputs employed
(i.e. be technically efficient), use the right mix of agricultural inputs in light of the relative price of each input (i.e. be input allocative efficient) and produce the right mix of outputs given the set of
prices (i.e. be output allocative efficient) (Kumbhaker and Lovell 2000). Efficiency can be considered
in terms of the optimal combination of inputs to achieve a given level of output (an input orientation), or the optimal output that could be produced given a set of inputs (an output-orientation).
Farrell (1957) identified three types of efficiency: technical efficiency, allocative efficiency, and economic efficiency. Technical efficiency (TE) refers to the ability of a decision making unit by small-holder farmers to produce the maximum feasible output from a given bundle of inputs, or the
minimum feasible amounts of inputs to produce a given level of output. The former definition is
referred to as output-oriented TE, while the latter definition is referred to as input oriented TE. A firm
is said to be technical efficient in its production when it produces maximum quantity of output from a given set of input resource. Allocative efficiency (AE) refers to the ability of a technically efficient
decision making unit to use inputs in proportions that minimize production costs given input prices.
Allocative efficiency is calculated as the ratio of the minimum costs required by the decision making unit to produce a given level of outputs and the actual costs of the decision making unit adjusted for
TE. Allocative Efficiency is the firm’s ability to use inputs in optimal proportions given their
respective prices and production technology. Economic efficiency (EE) is the product of both technical efficiency and allocative efficiency. Thus, a decision making unit (farmer) is economically
efficient if it is both technically and allocative efficient. Economic efficiency is calculated as the ratio
of the minimum feasible costs and the actual observed costs for a decision making unit/farmers.
Analysis of Production Efficiency, Productivity Variances and Resource Allocation among Smallholder
Farmers of Soybean Producers: Evidence from Benishangul-Gumuz Region Ethiopia
International Journal of Research Studies in Agricultural Sciences (IJRSAS) Page | 20
2. MATERIALS AND METHODS
Study area: The study area covers one of the main soybean production potential of the country. It is
located in western part of Ethiopia that extends to the Sudanese border. Benishangul-Gumuz region is
located 661 km West of Addis Ababa. The study area is located at 9◦ 30′- 11◦ 30′ latitude in the North
and 34◦ 20′- 36◦ 30′ longitudes in the East. It is bordered with the Sudan in the West, Amhara regional state in the North, Oromia regional state in the East and South East and Gambella regional state in the South.
The regions have three administrative zones, and one special district. Plain undulating slopes and
mountains characterize the topography of the region. The altitude of the region ranges mainly between 580-2731meters above sea level. The region is highly characterized by its ethnic diversity. It is
endowed with various resources that if properly utilized can significantly contribute to the economic
development of the country. Hence the study has been conducted at Assosa and Bambasi districts of Assosa zone which have the best practice and concentration areas for soybean production in the region.
2.1. Sample Size and Sampling Procedure
2.1.1. Sample Size Determination
Determination of the sample size followed a proportionate to size sampling methodology as specified by Kothari (2004) and is calculated as:
2
2 pq
e
Zn (1)
Where; n= required sample size
2Z = confidence level at 95% (standard value of 1.96)
p = estimate of small-holder soybean producer farmers which is at 0.78. This was an assumption that
78% of household participates in soybean production in the study area.
q = this is the weighting variable given by 1- p
2e = margin of error at 5% (standard value of 0.05)
2
2 pq
e
Zn 266
05.0
0.22*0.78 96.12
2
(2)
2.1.2. Sampling Procedure
The study was conducted in Benishangul-Gumuz region of the country with considering population of
all soybean producers in the region. A multi-stage sampling technique was employed for the purpose of this study data needs. The first stage of the sampling involved selection of districts from the region
where the survey was conducted. They included Assosa and Bambasi districts which were selected
based on their soybean production potentials and accessibility. The second stage involved simple
random selection of 9 rural villages or kebeles (4 from Assosa and 5 from Bambasi districts) that were sampled for the study. Finally, the third stage involved random selection of soybean producers from
each community/village level, giving a total sample size of 266 soybean producers (90 for Assosa and
176 for Bambasi). The number of kebeles/villages and farmers chosen from Bambasi district were
more because of its large potential of soybean producers and experiences relative to Assosa district.
2.2. Methods and Types of Data Collection
This study involved the use of both primary and secondary data sources. The primary data was collected in a field survey by direct interview with soybean producing farmers in the study area for the
2009 (2016/2017) cropping season. Secondary data which acted as supplementary data was collected
from different sources. Information was also obtained from journals, books, and the internet. The
socio-economic data collected included sex of respondent, age, marital status and educational levels and other demographic and institutional factors. Production information collected included size of
farmland owned, land tenure system, size of land under soybean production, labour used in
production, varieties of seed planted, amount of seed used, prices of input used (seeds and fertilizer)
Analysis of Production Efficiency, Productivity Variances and Resource Allocation among Smallholder
Farmers of Soybean Producers: Evidence from Benishangul-Gumuz Region Ethiopia
International Journal of Research Studies in Agricultural Sciences (IJRSAS) Page | 21
and seasonal yields. Access to credit and extension services were also among production information (number of visits), amount of fertilizers used. Data about constraints faced by soybean farmers was
also collected.
2.3. Methods of Data Analysis
The measures of central tendency using descriptive statistics (mean, percentage, range, etc.) is used to summarize the variables in the model and describe the study area. Econometric model; stochastic
production frontier model, is used to estimate the production function, determine the determinants of
inefficiency and estimate the level of efficiency. Given that we are considering a developing country setting where by the main concern is output shortfall rather than input over use, preference has been
given to primal or output oriented approach of measuring efficiency.
3. ECONOMETRIC ANALYSIS
3.1. Model Specification of Stochastic Frontier Function
Stochastic production frontier approach requires a prior specification of the functional form. Cobb-
Douglas production function is selected for this study for several reasons. Foremost it was selected
due to its simplicity and the logarithmic nature of the production function that makes econometric estimation of the parameters a simple matter. It is also very parsimonious with respect to degrees of
freedom and it is convenient in interpreting elasticity of production. The linear functional form of
Cobb Douglas production function used for this study is given by:
k
j
iijji
1
0 lnln (3)
iii u
Where: j = 1…k inputs; i= ith
soybean producer/number of farmers in the study; (ln)Yi =natural log of
soybean output/yield of the ith farmer; ijX = is a vector of actual j
th inputs quantities used by the i
th
farmer; = is a vector of unknown parameters/vector production coefficients to be estimated, i =
disturbance term composed of vi(random error term/random effect) and ui (error term related with
technical inefficiency).
Aigner et al. (1977) proposed the log likelihood function for the model in equation (3) assuming half
normal distribution for technical inefficiency effects ( iu ). They expressed the likelihood function
using λ parameterization, where λ is the ratio of the standard errors of the non-symmetric to
symmetric error term (i.e. v/σuσλ ). However, Battese and Corra (1977) proposed that the γ
parameterization, where )/( 222
uvu , to be used instead of λ. The reason is that λ could be any
non-negative value while γ ranges from zero to one and better measures the distance between the
frontier output and the observed level of output resulting from technical inefficiency. However, there
is an association between γ and λ. According to Bravo and Pinheiro (1997) gamma (γ) can be
formulated as:
)1/( 22 (4)
According to Battese and Corra (1977) the log likelihood function of the model is specified as:
N
1i
2
i22
iN
1i
2 ε2σ
1
γ1
γ
σ
γε Φ-1lnlnσ
2
πln
2
N)ln(L
(5)
Where; ikkiii zlnlnln is the residual of (3); N= is the number of observation; Φ is
the standard normal distribution, 222
uv , and 22 / v are variance parameters. The
minimization of (5) with respect to ,2 , and solving the resulting partial derivatives
simultaneously, produces the ML estimates of ,2 , .
The existence of inefficiency can be tested using γ parameter and can be interpreted as the percentage
of the variation in output that is due to technical inefficiency. Likewise the significance of2 indicate
whether the conventional average production function adequately represent the data or not.
Analysis of Production Efficiency, Productivity Variances and Resource Allocation among Smallholder
Farmers of Soybean Producers: Evidence from Benishangul-Gumuz Region Ethiopia
International Journal of Research Studies in Agricultural Sciences (IJRSAS) Page | 22
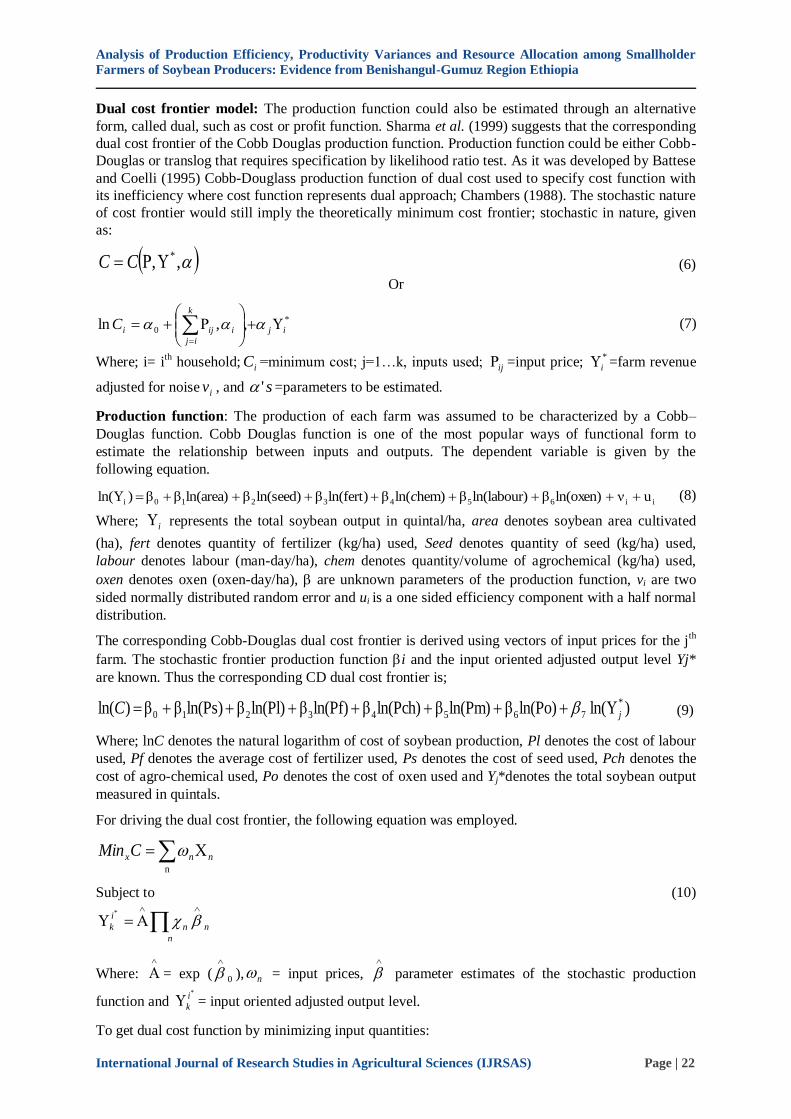
Dual cost frontier model: The production function could also be estimated through an alternative
form, called dual, such as cost or profit function. Sharma et al. (1999) suggests that the corresponding
dual cost frontier of the Cobb Douglas production function. Production function could be either Cobb-
Douglas or translog that requires specification by likelihood ratio test. As it was developed by Battese
and Coelli (1995) Cobb-Douglass production function of dual cost used to specify cost function with
its inefficiency where cost function represents dual approach; Chambers (1988). The stochastic nature
of cost frontier would still imply the theoretically minimum cost frontier; stochastic in nature, given
as:
,, * CC (6)
Or
*
0 ,,ln ij
k
ij
iijiC
(7)
Where; i= ith household; iC =minimum cost; j=1…k, inputs used; ij =input price;
*
i =farm revenue
adjusted for noise iv , and s' =parameters to be estimated.
Production function: The production of each farm was assumed to be characterized by a Cobb–
Douglas function. Cobb Douglas function is one of the most popular ways of functional form to
estimate the relationship between inputs and outputs. The dependent variable is given by the
following equation.
ii6543210i uνln(oxen)βln(labour)βem)hln(βln(fert)βln(seed)βln(area)β β )ln( c (8)
Where; i represents the total soybean output in quintal/ha, area denotes soybean area cultivated
(ha), fert denotes quantity of fertilizer (kg/ha) used, Seed denotes quantity of seed (kg/ha) used,
labour denotes labour (man-day/ha), chem denotes quantity/volume of agrochemical (kg/ha) used,
oxen denotes oxen (oxen-day/ha), are unknown parameters of the production function, vi are two
sided normally distributed random error and ui is a one sided efficiency component with a half normal
distribution.
The corresponding Cobb-Douglas dual cost frontier is derived using vectors of input prices for the jth
farm. The stochastic frontier production function i and the input oriented adjusted output level Yj*
are known. Thus the corresponding CD dual cost frontier is;
)ln(ln(Po)βln(Pm)βln(Pch)βln(Pf)βln(Pl)βln(Ps)ββ )ln( *
76543210 jC (9)
Where; lnC denotes the natural logarithm of cost of soybean production, Pl denotes the cost of labour
used, Pf denotes the average cost of fertilizer used, Ps denotes the cost of seed used, Pch denotes the
cost of agro-chemical used, Po denotes the cost of oxen used and Yj*denotes the total soybean output
measured in quintals.
For driving the dual cost frontier, the following equation was employed.
nnxCMin n
Subject to (10)
n
n
n
i
k
*
Where:
= exp ( 0
), n = input prices,
parameter estimates of the stochastic production
function and *i
k = input oriented adjusted output level.
To get dual cost function by minimizing input quantities:
Analysis of Production Efficiency, Productivity Variances and Resource Allocation among Smallholder
Farmers of Soybean Producers: Evidence from Benishangul-Gumuz Region Ethiopia
International Journal of Research Studies in Agricultural Sciences (IJRSAS) Page | 23
nn
n
ik
C
*ik
HY w),*
( (11)
Where: , nn
nnn
n
1
H and
1
n
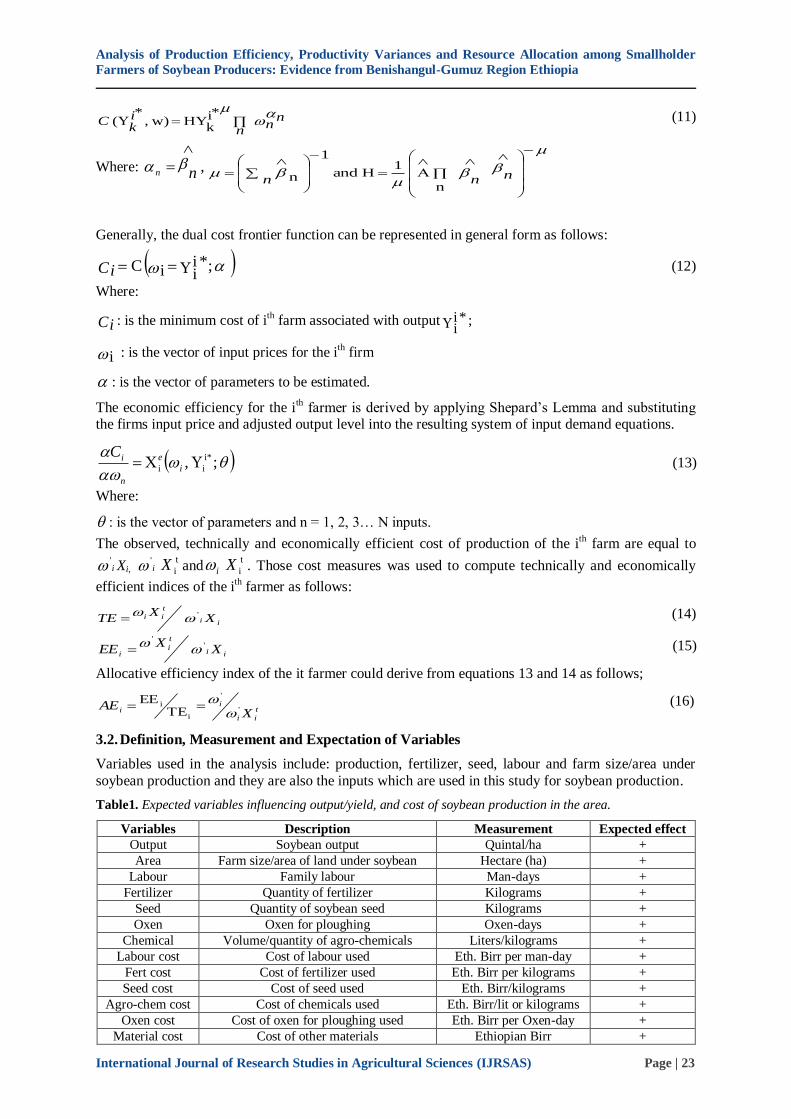
Generally, the dual cost frontier function can be represented in general form as follows:
;*ii
i C Ci (12)
Where:
Ci : is the minimum cost of ith farm associated with output *i
i;
i : is the vector of input prices for the ith firm
: is the vector of parameters to be estimated.
The economic efficiency for the ith farmer is derived by applying Shepard’s Lemma and substituting
the firms input price and adjusted output level into the resulting system of input demand equations.
; , i*
ii i
e
n
iC (13)
Where:
: is the vector of parameters and n = 1, 2, 3… N inputs.
The observed, technically and economically efficient cost of production of the ith farm are equal to
i' Xi, i
't
iX and it
iX . Those cost measures was used to compute technically and economically
efficient indices of the ith
farmer as follows:
ii
t
ii XX
TE '
(14)
ii
t
ii X
XEE '
'
(15)
Allocative efficiency index of the it farmer could derive from equations 13 and 14 as follows;
t
ii
ii X
AE '
'
i
i TE
EE
(16)
3.2. Definition, Measurement and Expectation of Variables
Variables used in the analysis include: production, fertilizer, seed, labour and farm size/area under
soybean production and they are also the inputs which are used in this study for soybean production.
Table1. Expected variables influencing output/yield, and cost of soybean production in the area.
Variables Description Measurement Expected effect
Output Soybean output Quintal/ha +
Area Farm size/area of land under soybean Hectare (ha) +
Labour Family labour Man-days +
Fertilizer Quantity of fertilizer Kilograms +
Seed Quantity of soybean seed Kilograms +
Oxen Oxen for ploughing Oxen-days +
Chemical Volume/quantity of agro-chemicals Liters/kilograms +
Labour cost Cost of labour used Eth. Birr per man-day +
Fert cost Cost of fertilizer used Eth. Birr per kilograms +
Seed cost Cost of seed used Eth. Birr/kilograms +
Agro-chem cost Cost of chemicals used Eth. Birr/lit or kilograms +
Oxen cost Cost of oxen for ploughing used Eth. Birr per Oxen-day +
Material cost Cost of other materials Ethiopian Birr +
Analysis of Production Efficiency, Productivity Variances and Resource Allocation among Smallholder
Farmers of Soybean Producers: Evidence from Benishangul-Gumuz Region Ethiopia
International Journal of Research Studies in Agricultural Sciences (IJRSAS) Page | 24
Output is the quantity of soybean produced by each household in the 2016/17 cropping season measured in quintals.
Labour is measured as man-day used in soybean production by the farmers in the study area and in
this case it was considering family labour and casual labour used during the stated cropping season.
Farm size is the area which was cultivated for soybean production during the period defined by sample farmers and it is measured in hectares. Output which is the dependent variable in the
estimation of production functions, is measured in quintals and inputs refers to explanatory variables
used in the estimation of production functions.
Fertilizer refers to the quantity of chemical fertilizer applied on soybean plot in kg per ha during the
2016/17 cropping season. Thus, fertilizer was assumed to be the quantity of inorganic fertilizers that
was purchased and applied per hectare of land by soybean producers during the period under considered and was measured in kilograms. Fertilizer is expected to have a positive effect on yield,
but when overdose happens it can lead to low yield or total crop failure. Seed was a measure of the
quantity of soybean seeds in kilograms used in 2016/17 cropping season.
Seed is the quantity in kilograms of soybean seed planted by each soybean producer farmer per hectare of land under soybean cultivation during the 2016/17 cropping season. Seed are the backbone
of agricultural production. Moreover, determinants of inefficiency refers those socioeconomic,
institutional, production, and biological variables, chosen in reference to former studies and logical reasoning, are used in identifying the determinants of inefficiency.
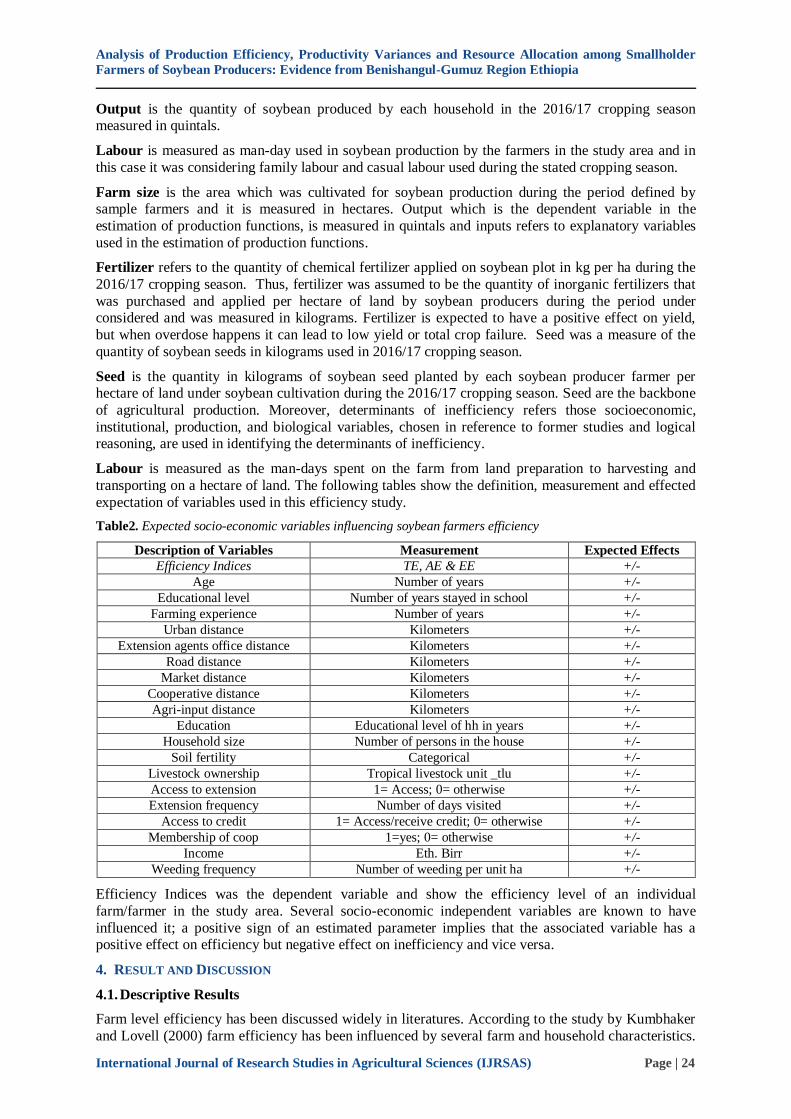
Labour is measured as the man-days spent on the farm from land preparation to harvesting and
transporting on a hectare of land. The following tables show the definition, measurement and effected
expectation of variables used in this efficiency study.
Table2. Expected socio-economic variables influencing soybean farmers efficiency
Description of Variables Measurement Expected Effects
Efficiency Indices TE, AE & EE +/-
Age Number of years +/-
Educational level Number of years stayed in school +/-
Farming experience Number of years +/-
Urban distance Kilometers +/-
Extension agents office distance Kilometers +/-
Road distance Kilometers +/-
Market distance Kilometers +/-
Cooperative distance Kilometers +/-
Agri-input distance Kilometers +/-
Education Educational level of hh in years +/-
Household size Number of persons in the house +/-
Soil fertility Categorical +/-
Livestock ownership Tropical livestock unit _tlu +/-
Access to extension 1= Access; 0= otherwise +/-
Extension frequency Number of days visited +/-
Access to credit 1= Access/receive credit; 0= otherwise +/-
Membership of coop 1=yes; 0= otherwise +/-
Income Eth. Birr +/-
Weeding frequency Number of weeding per unit ha +/-
Efficiency Indices was the dependent variable and show the efficiency level of an individual
farm/farmer in the study area. Several socio-economic independent variables are known to have
influenced it; a positive sign of an estimated parameter implies that the associated variable has a positive effect on efficiency but negative effect on inefficiency and vice versa.
4. RESULT AND DISCUSSION
4.1. Descriptive Results
Farm level efficiency has been discussed widely in literatures. According to the study by Kumbhaker
and Lovell (2000) farm efficiency has been influenced by several farm and household characteristics.
Analysis of Production Efficiency, Productivity Variances and Resource Allocation among Smallholder
Farmers of Soybean Producers: Evidence from Benishangul-Gumuz Region Ethiopia
International Journal of Research Studies in Agricultural Sciences (IJRSAS) Page | 25
The age, sex, education level, household size, access to credit and extension services, membership of cooperative, farming experience for agricultural cultivation and soybean production and institutional
access to farmers, frequency of extension contacts with development agents in their localities and soil
fertility condition are the characteristics that were analyzed for the purpose of this study. With respect
to sample distribution of farmers that collected from 266 soybean producers of the study area were analyzed.
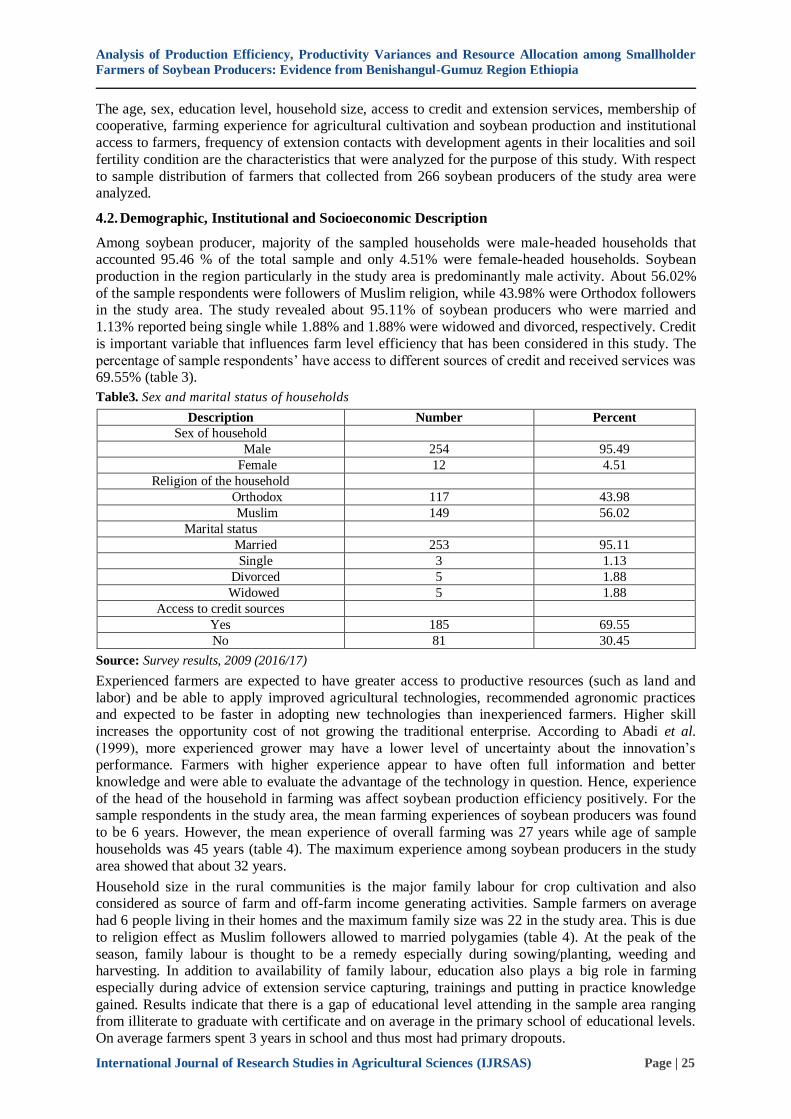
4.2. Demographic, Institutional and Socioeconomic Description
Among soybean producer, majority of the sampled households were male-headed households that accounted 95.46 % of the total sample and only 4.51% were female-headed households. Soybean
production in the region particularly in the study area is predominantly male activity. About 56.02%
of the sample respondents were followers of Muslim religion, while 43.98% were Orthodox followers in the study area. The study revealed about 95.11% of soybean producers who were married and
1.13% reported being single while 1.88% and 1.88% were widowed and divorced, respectively. Credit
is important variable that influences farm level efficiency that has been considered in this study. The
percentage of sample respondents’ have access to different sources of credit and received services was 69.55% (table 3).
Table3. Sex and marital status of households
Description Number Percent
Sex of household
Male 254 95.49
Female 12 4.51
Religion of the household
Orthodox 117 43.98
Muslim 149 56.02
Marital status
Married 253 95.11
Single 3 1.13
Divorced 5 1.88
Widowed 5 1.88
Access to credit sources
Yes 185 69.55
No 81 30.45
Source: Survey results, 2009 (2016/17)
Experienced farmers are expected to have greater access to productive resources (such as land and
labor) and be able to apply improved agricultural technologies, recommended agronomic practices and expected to be faster in adopting new technologies than inexperienced farmers. Higher skill
increases the opportunity cost of not growing the traditional enterprise. According to Abadi et al.
(1999), more experienced grower may have a lower level of uncertainty about the innovation’s performance. Farmers with higher experience appear to have often full information and better
knowledge and were able to evaluate the advantage of the technology in question. Hence, experience
of the head of the household in farming was affect soybean production efficiency positively. For the sample respondents in the study area, the mean farming experiences of soybean producers was found
to be 6 years. However, the mean experience of overall farming was 27 years while age of sample
households was 45 years (table 4). The maximum experience among soybean producers in the study
area showed that about 32 years.
Household size in the rural communities is the major family labour for crop cultivation and also considered as source of farm and off-farm income generating activities. Sample farmers on average
had 6 people living in their homes and the maximum family size was 22 in the study area. This is due
to religion effect as Muslim followers allowed to married polygamies (table 4). At the peak of the
season, family labour is thought to be a remedy especially during sowing/planting, weeding and
harvesting. In addition to availability of family labour, education also plays a big role in farming
especially during advice of extension service capturing, trainings and putting in practice knowledge
gained. Results indicate that there is a gap of educational level attending in the sample area ranging from illiterate to graduate with certificate and on average in the primary school of educational levels.
On average farmers spent 3 years in school and thus most had primary dropouts.
Analysis of Production Efficiency, Productivity Variances and Resource Allocation among Smallholder
Farmers of Soybean Producers: Evidence from Benishangul-Gumuz Region Ethiopia
International Journal of Research Studies in Agricultural Sciences (IJRSAS) Page | 26
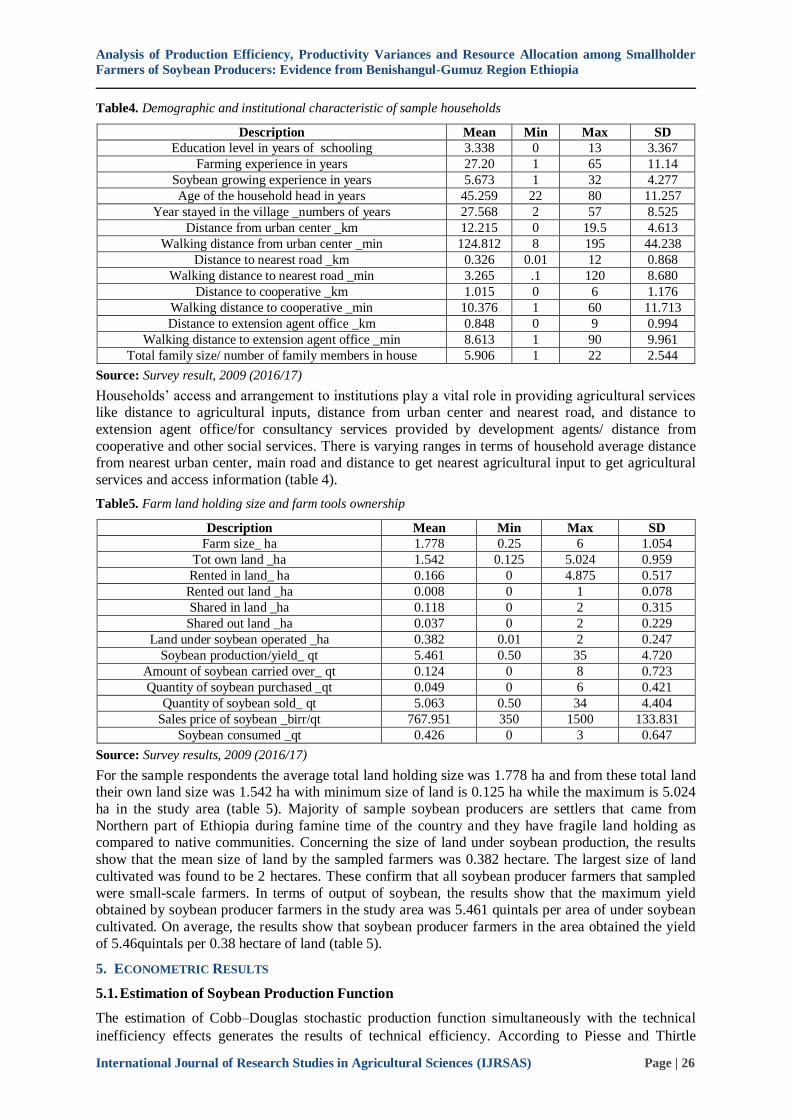
Table4. Demographic and institutional characteristic of sample households
Description Mean Min Max SD
Education level in years of schooling 3.338 0 13 3.367
Farming experience in years 27.20 1 65 11.14
Soybean growing experience in years 5.673 1 32 4.277
Age of the household head in years 45.259 22 80 11.257
Year stayed in the village _numbers of years 27.568 2 57 8.525
Distance from urban center _km 12.215 0 19.5 4.613
Walking distance from urban center _min 124.812 8 195 44.238
Distance to nearest road _km 0.326 0.01 12 0.868
Walking distance to nearest road _min 3.265 .1 120 8.680
Distance to cooperative _km 1.015 0 6 1.176
Walking distance to cooperative _min 10.376 1 60 11.713
Distance to extension agent office _km 0.848 0 9 0.994
Walking distance to extension agent office _min 8.613 1 90 9.961
Total family size/ number of family members in house 5.906 1 22 2.544
Source: Survey result, 2009 (2016/17)
Households’ access and arrangement to institutions play a vital role in providing agricultural services like distance to agricultural inputs, distance from urban center and nearest road, and distance to
extension agent office/for consultancy services provided by development agents/ distance from
cooperative and other social services. There is varying ranges in terms of household average distance from nearest urban center, main road and distance to get nearest agricultural input to get agricultural
services and access information (table 4).
Table5. Farm land holding size and farm tools ownership
Description Mean Min Max SD
Farm size_ ha 1.778 0.25 6 1.054
Tot own land _ha 1.542 0.125 5.024 0.959
Rented in land_ ha 0.166 0 4.875 0.517
Rented out land _ha 0.008 0 1 0.078
Shared in land _ha 0.118 0 2 0.315
Shared out land _ha 0.037 0 2 0.229
Land under soybean operated _ha 0.382 0.01 2 0.247
Soybean production/yield_ qt 5.461 0.50 35 4.720
Amount of soybean carried over_ qt 0.124 0 8 0.723
Quantity of soybean purchased _qt 0.049 0 6 0.421
Quantity of soybean sold_ qt 5.063 0.50 34 4.404
Sales price of soybean _birr/qt 767.951 350 1500 133.831
Soybean consumed _qt 0.426 0 3 0.647
Source: Survey results, 2009 (2016/17)
For the sample respondents the average total land holding size was 1.778 ha and from these total land their own land size was 1.542 ha with minimum size of land is 0.125 ha while the maximum is 5.024
ha in the study area (table 5). Majority of sample soybean producers are settlers that came from
Northern part of Ethiopia during famine time of the country and they have fragile land holding as compared to native communities. Concerning the size of land under soybean production, the results
show that the mean size of land by the sampled farmers was 0.382 hectare. The largest size of land
cultivated was found to be 2 hectares. These confirm that all soybean producer farmers that sampled
were small-scale farmers. In terms of output of soybean, the results show that the maximum yield obtained by soybean producer farmers in the study area was 5.461 quintals per area of under soybean
cultivated. On average, the results show that soybean producer farmers in the area obtained the yield
of 5.46quintals per 0.38 hectare of land (table 5).
5. ECONOMETRIC RESULTS
5.1. Estimation of Soybean Production Function
The estimation of Cobb–Douglas stochastic production function simultaneously with the technical
inefficiency effects generates the results of technical efficiency. According to Piesse and Thirtle
Analysis of Production Efficiency, Productivity Variances and Resource Allocation among Smallholder
Farmers of Soybean Producers: Evidence from Benishangul-Gumuz Region Ethiopia
International Journal of Research Studies in Agricultural Sciences (IJRSAS) Page | 27
(2000), the parameter sigma-squared lies between 0 and 1; with a value equal to 0 implying that
technical inefficiency is not present and a value close or equal to 1 implying that the frontier model is
appropriate. The value of the sigma-square indicates the goodness of fit and correctness of the
specified assumption of the composite error terms distribution. The value of sigma-squared (0.42) is
statistically significant at 1% significance level, which implies about 42% of the residual variation is
due to the inefficiency effect. Since the Wald chi-square statistic is significant at 1% level, we reject
the null hypothesis that there is absence of inefficiency in favour of presence of inefficiency.
The dependent variable in the estimation of stochastic production function for soybean outputs
produced in quintals analyzed on the six major inputs with some of log-transformed. The major inputs
were area of farm land under soybean, amount of soybean seed used, quantity of fertilizer applied,
volume/quantity of agro-chemicals used, labour and oxen power. The stochastic frontier model
estimates both the trans-log functional forms of production function and variables of technical
inefficiency simultaneously by using the first stage estimation approach.
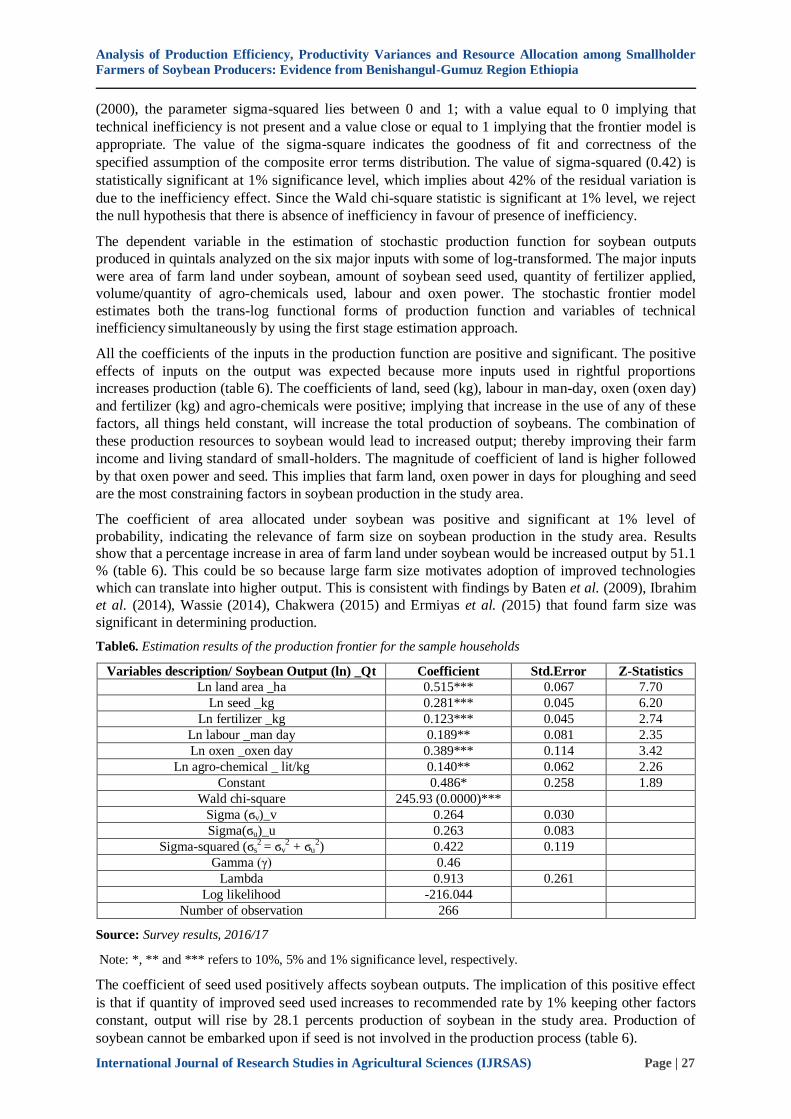
All the coefficients of the inputs in the production function are positive and significant. The positive
effects of inputs on the output was expected because more inputs used in rightful proportions
increases production (table 6). The coefficients of land, seed (kg), labour in man-day, oxen (oxen day)
and fertilizer (kg) and agro-chemicals were positive; implying that increase in the use of any of these
factors, all things held constant, will increase the total production of soybeans. The combination of
these production resources to soybean would lead to increased output; thereby improving their farm
income and living standard of small-holders. The magnitude of coefficient of land is higher followed
by that oxen power and seed. This implies that farm land, oxen power in days for ploughing and seed
are the most constraining factors in soybean production in the study area.
The coefficient of area allocated under soybean was positive and significant at 1% level of
probability, indicating the relevance of farm size on soybean production in the study area. Results
show that a percentage increase in area of farm land under soybean would be increased output by 51.1
% (table 6). This could be so because large farm size motivates adoption of improved technologies
which can translate into higher output. This is consistent with findings by Baten et al. (2009), Ibrahim
et al. (2014), Wassie (2014), Chakwera (2015) and Ermiyas et al. (2015) that found farm size was
significant in determining production.
Table6. Estimation results of the production frontier for the sample households
Variables description/ Soybean Output (ln) _Qt Coefficient Std.Error Z-Statistics
Ln land area _ha 0.515*** 0.067 7.70
Ln seed _kg 0.281*** 0.045 6.20
Ln fertilizer _kg 0.123*** 0.045 2.74
Ln labour _man day 0.189** 0.081 2.35
Ln oxen _oxen day 0.389*** 0.114 3.42
Ln agro-chemical _ lit/kg 0.140** 0.062 2.26
Constant 0.486* 0.258 1.89
Wald chi-square 245.93 (0.0000)***
Sigma (ϭv)_v 0.264 0.030
Sigma(ϭu)_u 0.263 0.083
Sigma-squared (ϭs2 = ϭv
2 + ϭu2) 0.422 0.119
Gamma (γ) 0.46
Lambda 0.913 0.261
Log likelihood -216.044
Number of observation 266
Source: Survey results, 2016/17
Note: *, ** and *** refers to 10%, 5% and 1% significance level, respectively.
The coefficient of seed used positively affects soybean outputs. The implication of this positive effect
is that if quantity of improved seed used increases to recommended rate by 1% keeping other factors
constant, output will rise by 28.1 percents production of soybean in the study area. Production of
soybean cannot be embarked upon if seed is not involved in the production process (table 6).
Analysis of Production Efficiency, Productivity Variances and Resource Allocation among Smallholder
Farmers of Soybean Producers: Evidence from Benishangul-Gumuz Region Ethiopia
International Journal of Research Studies in Agricultural Sciences (IJRSAS) Page | 28
The amount of fertilizer applied is important for enhancing soybean production. The estimated coefficient of fertilizer used was positive and significant at 1% probability level. This agrees with
expectation that as the quantity of fertilizer used increases, yield increases as well. This indicating that
soybean output can be increased by 12.3 % with a percentage increase in quantity of recommended
fertilizer used keeping other factors constant (table 6). Even though, the soybean does not require much fertilizer since it improves soil fertility by converting and fixing nitrogen from the atmosphere
into the soil, some amount of nitrogen fertilizer would be applied as starter particularly on fertility
degraded farm land areas. This agree with the findings of Baten et al. (2009), Ibrahim et al. (2014), Wassie (2014), Chakwera (2015) and Ermiyas et al. (2015) that found fertilizer significantly increase output.
The estimated coefficient of labour was found to be positive and statistically significant at 5% level. This implies that labour is a significant factor that influences soybean output in the study area. The
output can therefore, be increased by 18.9 percent with a percentage increase in labour if other inputs
are held constant. This indicates that as labour used in the production of soybean increases, quantity of soybean produced increase.
The coefficient of oxen power (measured oxen-day) used by soybean producing farmers was positive and significant relationship with soybean output (table 6). The coefficient of oxen power was significant at 1% level of significance, and the positive production elasticity implies by 1% increase in
oxen power, the level of teff output can increase by 38.9 percents in the study area.
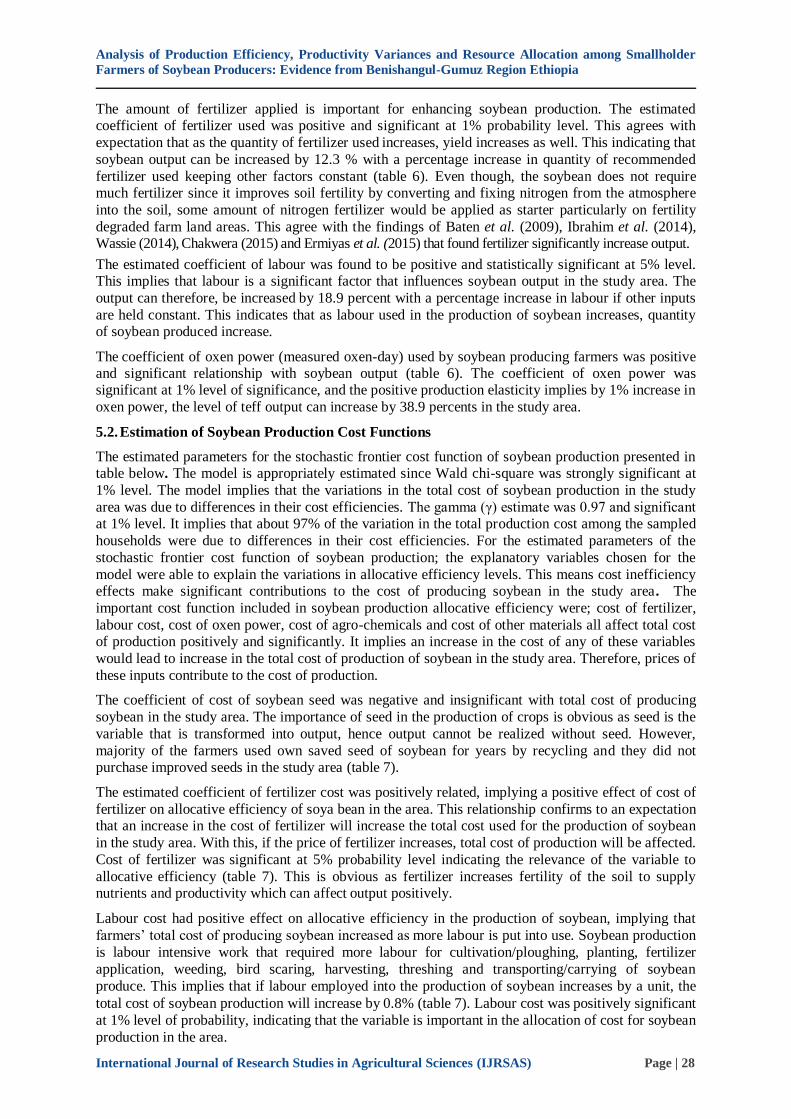
5.2. Estimation of Soybean Production Cost Functions
The estimated parameters for the stochastic frontier cost function of soybean production presented in table below. The model is appropriately estimated since Wald chi-square was strongly significant at
1% level. The model implies that the variations in the total cost of soybean production in the study
area was due to differences in their cost efficiencies. The gamma (γ) estimate was 0.97 and significant at 1% level. It implies that about 97% of the variation in the total production cost among the sampled
households were due to differences in their cost efficiencies. For the estimated parameters of the
stochastic frontier cost function of soybean production; the explanatory variables chosen for the
model were able to explain the variations in allocative efficiency levels. This means cost inefficiency effects make significant contributions to the cost of producing soybean in the study area. The
important cost function included in soybean production allocative efficiency were; cost of fertilizer,
labour cost, cost of oxen power, cost of agro-chemicals and cost of other materials all affect total cost of production positively and significantly. It implies an increase in the cost of any of these variables
would lead to increase in the total cost of production of soybean in the study area. Therefore, prices of
these inputs contribute to the cost of production.
The coefficient of cost of soybean seed was negative and insignificant with total cost of producing
soybean in the study area. The importance of seed in the production of crops is obvious as seed is the
variable that is transformed into output, hence output cannot be realized without seed. However,
majority of the farmers used own saved seed of soybean for years by recycling and they did not purchase improved seeds in the study area (table 7).
The estimated coefficient of fertilizer cost was positively related, implying a positive effect of cost of
fertilizer on allocative efficiency of soya bean in the area. This relationship confirms to an expectation that an increase in the cost of fertilizer will increase the total cost used for the production of soybean
in the study area. With this, if the price of fertilizer increases, total cost of production will be affected.
Cost of fertilizer was significant at 5% probability level indicating the relevance of the variable to
allocative efficiency (table 7). This is obvious as fertilizer increases fertility of the soil to supply nutrients and productivity which can affect output positively.
Labour cost had positive effect on allocative efficiency in the production of soybean, implying that
farmers’ total cost of producing soybean increased as more labour is put into use. Soybean production
is labour intensive work that required more labour for cultivation/ploughing, planting, fertilizer
application, weeding, bird scaring, harvesting, threshing and transporting/carrying of soybean
produce. This implies that if labour employed into the production of soybean increases by a unit, the
total cost of soybean production will increase by 0.8% (table 7). Labour cost was positively significant
at 1% level of probability, indicating that the variable is important in the allocation of cost for soybean
production in the area.
Analysis of Production Efficiency, Productivity Variances and Resource Allocation among Smallholder
Farmers of Soybean Producers: Evidence from Benishangul-Gumuz Region Ethiopia
International Journal of Research Studies in Agricultural Sciences (IJRSAS) Page | 29
Table7. Estimation results of the stochastic cost frontier
Variables Coefficient Std.Error Z-Statistics
Ln cost of seed -0.001 0.001 -1.24
Ln cost of fertilizer 0.111** 0.048 2.33
Ln cost of agro-chemical 0.009*** 0.004 2.56
Ln labour cost 0.008*** 0.001 9.56
Ln oxen cost for ploughing 0.007*** 0.001 8.58
Cost of other materials 0.003*** 0.001 3.89
Ln output 0.084*** 0.020 4.13
Constant 2.621 6.747 0.39
Wald Chi-Square 235.86 (0.000)***
Gamma (γ) 0.97
Sigma-squared (ϭs2 ) 7.633 0.870
Lambda 5.339 2.527
Log likelihood -526.501
N 266
Source: Survey results, 2016/17
Note: ** and *** refers to 5% and 1% significance level, respectively
As small-holder farmers, the farmers in the study area practiced cultivation of farm land by using
oxen power, heifers and donkey draught power for ploughing, planting/row making, and cultivation
purpose. This farming activities required cost of operation particularly for those haven’t their own
oxen. An estimated positive coefficient of cost of oxen power shows direct effect on cost allocation.
The positive relationship of cost of oxen for ploughing farm land and cost allocation indicates that an
increase in cost of oxen for cultivation will result to an increase in total cost of production for soybean
in the area. Cost of oxen power was significant at 1% level of probability for producing soybean,
indicating that the cost of oxen for ploughing farm land is very pertinent in the cultivation of soybean
in the study area.
Increase in the cost of materials like sacks, cart for carrying produce, hand tools, knapsack rent would
bring about increase in the total cost of production of soybean in the area. The positive sign of the
variable indicates that the cost of other materials can increase the total cost of production by 0.3 % if
the cost of those materials increased by 1% holding other factors constant. The cost of other materials
was significant at 1% level of probability signifying the importance of materials to the production of
soybean.
Another important input in terms of its effect on the soybean production is the amount/volume of
chemicals applied during soybean production among small-holder farmers in the study area. An
addition of one percent of amount/volume of agro-chemical application increases output by 0.9
percent (table 7). This implies that increase in the amount/volume of agro-chemical use holding other
inputs constant, will increase soybean output.
5.3. Estimation of Technical, Allocative and Economic Efficiencies of Soybean Producers
Technical efficiency: The mean technical efficiency level among soybean producer farmers found in
the study area was 72.81%, and ranges from 45.3 to 89.4% (table 8). This implies that if the average
soybean producer wants to achieve the technical efficiency of the most efficient group, the farmers
could achieved 19.56% input saving [i.e., 1-(72.8/89.39) x100]. Similarly, the most inefficient farmer
reveals cost saving of about 50.35% [i.e., 1-(45.28/89.39) x100]. From technical efficiency
estimation, there is evidence that most of smallholder soybean farmers can improve their technical
efficiency by 72.81% while they can make best use of roughly 27% without requiring additional
inputs and a need of new production technology. Thus, the average level of technical efficiency
confirm that there is an opportunity to increase efficiency on average by 27.20% if inputs allocated
properly. This study is consistent with the result of Amaza et al. (2010), Chimai (2011), Abba (2012),
Dawit et al. (2013), Endrias et al. (2013), Getahun (2014), Getachew and Bamlak (2014), Hussain et
al. (2014), Wassie (2014).
Analysis of Production Efficiency, Productivity Variances and Resource Allocation among Smallholder
Farmers of Soybean Producers: Evidence from Benishangul-Gumuz Region Ethiopia
International Journal of Research Studies in Agricultural Sciences (IJRSAS) Page | 30
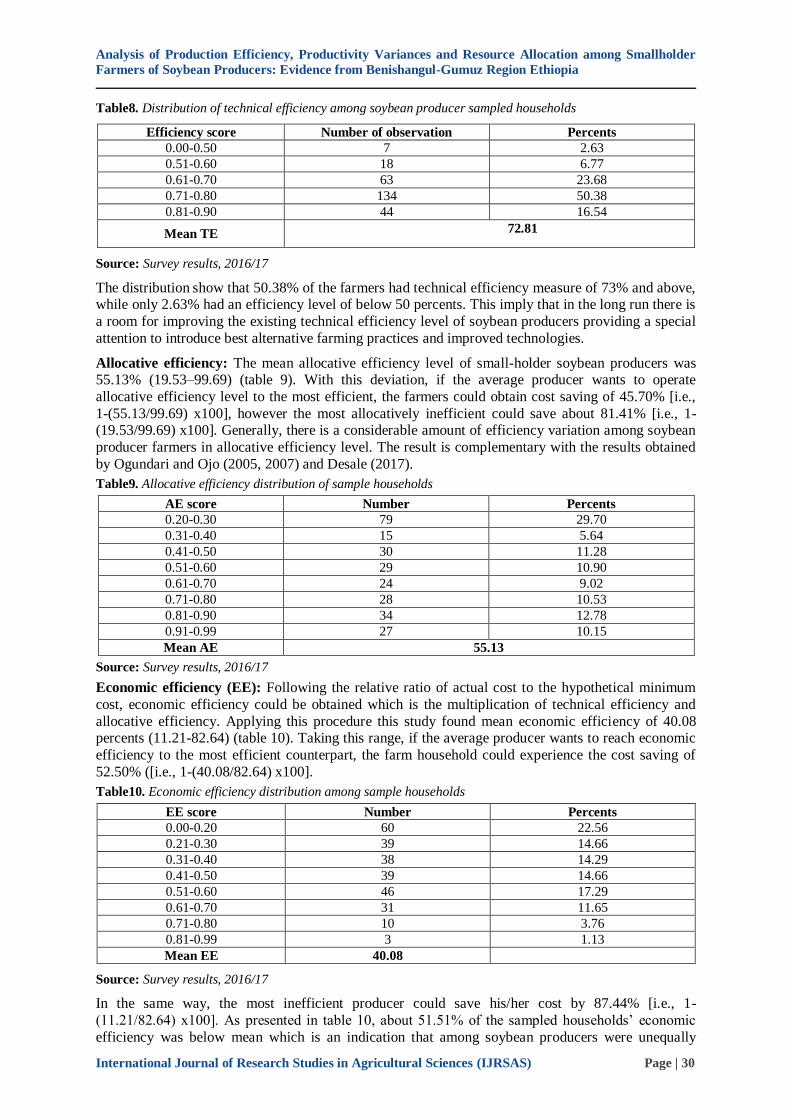
Table8. Distribution of technical efficiency among soybean producer sampled households
Efficiency score Number of observation Percents
0.00-0.50 7 2.63
0.51-0.60 18 6.77
0.61-0.70 63 23.68
0.71-0.80 134 50.38
0.81-0.90 44 16.54
Mean TE 72.81
Source: Survey results, 2016/17
The distribution show that 50.38% of the farmers had technical efficiency measure of 73% and above,
while only 2.63% had an efficiency level of below 50 percents. This imply that in the long run there is
a room for improving the existing technical efficiency level of soybean producers providing a special
attention to introduce best alternative farming practices and improved technologies.
Allocative efficiency: The mean allocative efficiency level of small-holder soybean producers was 55.13% (19.53–99.69) (table 9). With this deviation, if the average producer wants to operate
allocative efficiency level to the most efficient, the farmers could obtain cost saving of 45.70% [i.e.,
1-(55.13/99.69) x100], however the most allocatively inefficient could save about 81.41% [i.e., 1-(19.53/99.69) x100]. Generally, there is a considerable amount of efficiency variation among soybean
producer farmers in allocative efficiency level. The result is complementary with the results obtained
by Ogundari and Ojo (2005, 2007) and Desale (2017).
Table9. Allocative efficiency distribution of sample households
AE score Number Percents
0.20-0.30 79 29.70
0.31-0.40 15 5.64
0.41-0.50 30 11.28
0.51-0.60 29 10.90
0.61-0.70 24 9.02
0.71-0.80 28 10.53
0.81-0.90 34 12.78
0.91-0.99 27 10.15
Mean AE 55.13
Source: Survey results, 2016/17
Economic efficiency (EE): Following the relative ratio of actual cost to the hypothetical minimum
cost, economic efficiency could be obtained which is the multiplication of technical efficiency and
allocative efficiency. Applying this procedure this study found mean economic efficiency of 40.08 percents (11.21-82.64) (table 10). Taking this range, if the average producer wants to reach economic
efficiency to the most efficient counterpart, the farm household could experience the cost saving of
52.50% ([i.e., 1-(40.08/82.64) x100].
Table10. Economic efficiency distribution among sample households
EE score Number Percents
0.00-0.20 60 22.56
0.21-0.30 39 14.66
0.31-0.40 38 14.29
0.41-0.50 39 14.66
0.51-0.60 46 17.29
0.61-0.70 31 11.65
0.71-0.80 10 3.76
0.81-0.99 3 1.13
Mean EE 40.08
Source: Survey results, 2016/17
In the same way, the most inefficient producer could save his/her cost by 87.44% [i.e., 1-
(11.21/82.64) x100]. As presented in table 10, about 51.51% of the sampled households’ economic
efficiency was below mean which is an indication that among soybean producers were unequally
Analysis of Production Efficiency, Productivity Variances and Resource Allocation among Smallholder
Farmers of Soybean Producers: Evidence from Benishangul-Gumuz Region Ethiopia
International Journal of Research Studies in Agricultural Sciences (IJRSAS) Page | 31
efficient; implying there was more variability in their attainment. The mean economic efficiency found in this study is similar with the results of Endrias et al. (2013), Myo et al. (2012) Dawit etal.
(2013), and Berhan (2015).
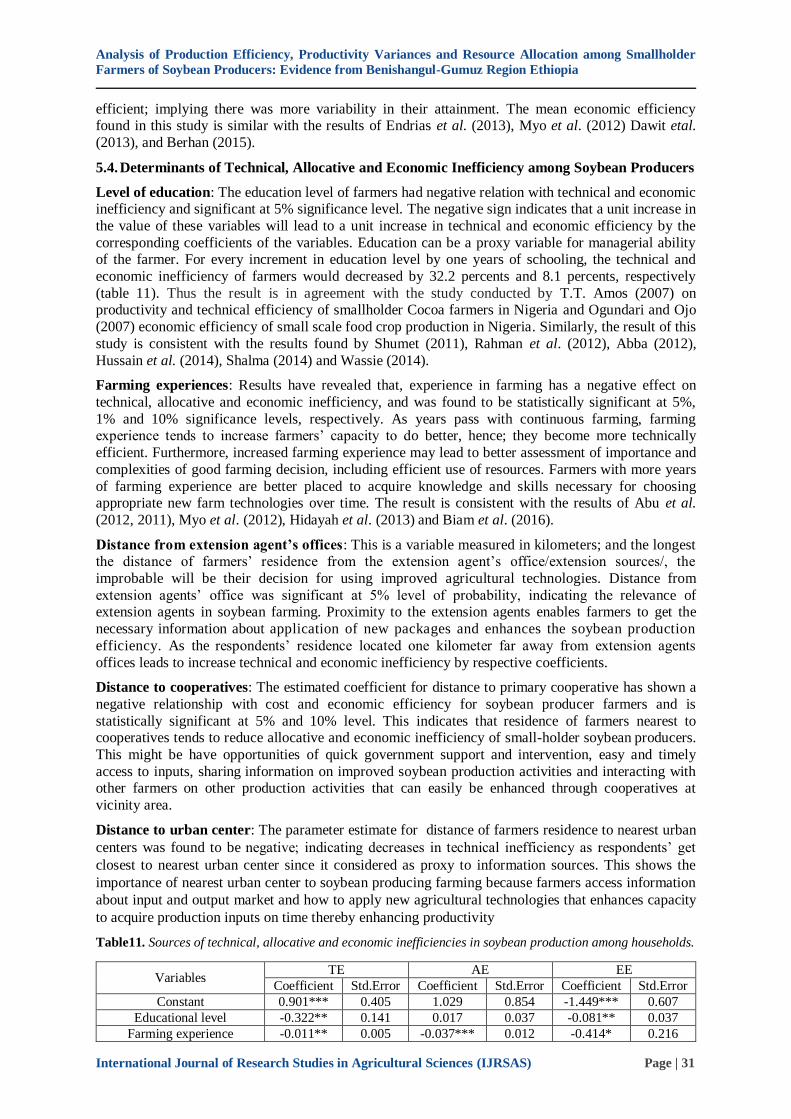
5.4. Determinants of Technical, Allocative and Economic Inefficiency among Soybean Producers
Level of education: The education level of farmers had negative relation with technical and economic inefficiency and significant at 5% significance level. The negative sign indicates that a unit increase in
the value of these variables will lead to a unit increase in technical and economic efficiency by the
corresponding coefficients of the variables. Education can be a proxy variable for managerial ability of the farmer. For every increment in education level by one years of schooling, the technical and
economic inefficiency of farmers would decreased by 32.2 percents and 8.1 percents, respectively
(table 11). Thus the result is in agreement with the study conducted by T.T. Amos (2007) on productivity and technical efficiency of smallholder Cocoa farmers in Nigeria and Ogundari and Ojo
(2007) economic efficiency of small scale food crop production in Nigeria. Similarly, the result of this
study is consistent with the results found by Shumet (2011), Rahman et al. (2012), Abba (2012),
Hussain et al. (2014), Shalma (2014) and Wassie (2014).
Farming experiences: Results have revealed that, experience in farming has a negative effect on
technical, allocative and economic inefficiency, and was found to be statistically significant at 5%,
1% and 10% significance levels, respectively. As years pass with continuous farming, farming
experience tends to increase farmers’ capacity to do better, hence; they become more technically
efficient. Furthermore, increased farming experience may lead to better assessment of importance and
complexities of good farming decision, including efficient use of resources. Farmers with more years
of farming experience are better placed to acquire knowledge and skills necessary for choosing appropriate new farm technologies over time. The result is consistent with the results of Abu et al.
(2012, 2011), Myo et al. (2012), Hidayah et al. (2013) and Biam et al. (2016).
Distance from extension agent’s offices: This is a variable measured in kilometers; and the longest the distance of farmers’ residence from the extension agent’s office/extension sources/, the
improbable will be their decision for using improved agricultural technologies. Distance from
extension agents’ office was significant at 5% level of probability, indicating the relevance of extension agents in soybean farming. Proximity to the extension agents enables farmers to get the
necessary information about application of new packages and enhances the soybean production
efficiency. As the respondents’ residence located one kilometer far away from extension agents
offices leads to increase technical and economic inefficiency by respective coefficients.
Distance to cooperatives: The estimated coefficient for distance to primary cooperative has shown a
negative relationship with cost and economic efficiency for soybean producer farmers and is
statistically significant at 5% and 10% level. This indicates that residence of farmers nearest to cooperatives tends to reduce allocative and economic inefficiency of small-holder soybean producers.
This might be have opportunities of quick government support and intervention, easy and timely
access to inputs, sharing information on improved soybean production activities and interacting with other farmers on other production activities that can easily be enhanced through cooperatives at
vicinity area.
Distance to urban center: The parameter estimate for distance of farmers residence to nearest urban
centers was found to be negative; indicating decreases in technical inefficiency as respondents’ get
closest to nearest urban center since it considered as proxy to information sources. This shows the
importance of nearest urban center to soybean producing farming because farmers access information
about input and output market and how to apply new agricultural technologies that enhances capacity
to acquire production inputs on time thereby enhancing productivity
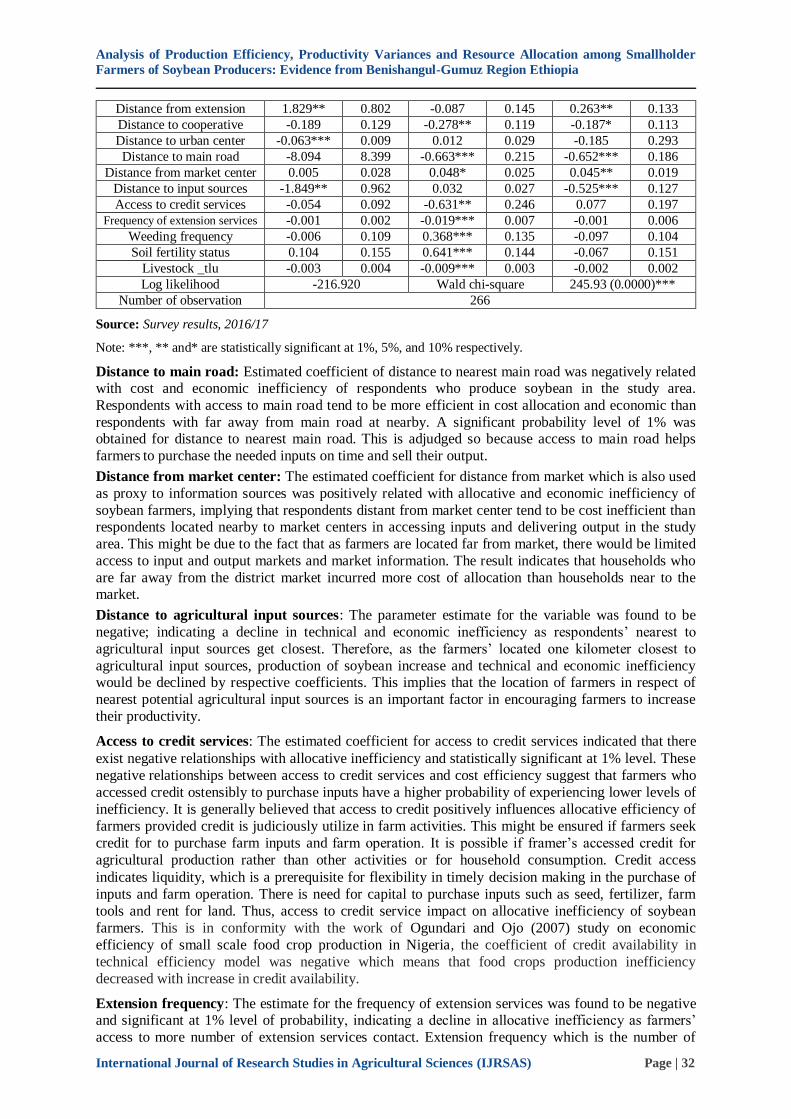
Table11. Sources of technical, allocative and economic inefficiencies in soybean production among households.
Variables TE AE EE
Coefficient Std.Error Coefficient Std.Error Coefficient Std.Error
Constant 0.901*** 0.405 1.029 0.854 -1.449*** 0.607
Educational level -0.322** 0.141 0.017 0.037 -0.081** 0.037
Farming experience -0.011** 0.005 -0.037*** 0.012 -0.414* 0.216
Analysis of Production Efficiency, Productivity Variances and Resource Allocation among Smallholder
Farmers of Soybean Producers: Evidence from Benishangul-Gumuz Region Ethiopia
International Journal of Research Studies in Agricultural Sciences (IJRSAS) Page | 32
Distance from extension 1.829** 0.802 -0.087 0.145 0.263** 0.133
Distance to cooperative -0.189 0.129 -0.278** 0.119 -0.187* 0.113
Distance to urban center -0.063*** 0.009 0.012 0.029 -0.185 0.293
Distance to main road -8.094 8.399 -0.663*** 0.215 -0.652*** 0.186
Distance from market center 0.005 0.028 0.048* 0.025 0.045** 0.019
Distance to input sources -1.849** 0.962 0.032 0.027 -0.525*** 0.127
Access to credit services -0.054 0.092 -0.631** 0.246 0.077 0.197
Frequency of extension services -0.001 0.002 -0.019*** 0.007 -0.001 0.006
Weeding frequency -0.006 0.109 0.368*** 0.135 -0.097 0.104
Soil fertility status 0.104 0.155 0.641*** 0.144 -0.067 0.151
Livestock _tlu -0.003 0.004 -0.009*** 0.003 -0.002 0.002
Log likelihood -216.920 Wald chi-square 245.93 (0.0000)***
Number of observation 266
Source: Survey results, 2016/17
Note: ***, ** and* are statistically significant at 1%, 5%, and 10% respectively.
Distance to main road: Estimated coefficient of distance to nearest main road was negatively related with cost and economic inefficiency of respondents who produce soybean in the study area.
Respondents with access to main road tend to be more efficient in cost allocation and economic than
respondents with far away from main road at nearby. A significant probability level of 1% was obtained for distance to nearest main road. This is adjudged so because access to main road helps
farmers to purchase the needed inputs on time and sell their output.
Distance from market center: The estimated coefficient for distance from market which is also used
as proxy to information sources was positively related with allocative and economic inefficiency of
soybean farmers, implying that respondents distant from market center tend to be cost inefficient than respondents located nearby to market centers in accessing inputs and delivering output in the study
area. This might be due to the fact that as farmers are located far from market, there would be limited
access to input and output markets and market information. The result indicates that households who
are far away from the district market incurred more cost of allocation than households near to the market.
Distance to agricultural input sources: The parameter estimate for the variable was found to be
negative; indicating a decline in technical and economic inefficiency as respondents’ nearest to
agricultural input sources get closest. Therefore, as the farmers’ located one kilometer closest to
agricultural input sources, production of soybean increase and technical and economic inefficiency would be declined by respective coefficients. This implies that the location of farmers in respect of
nearest potential agricultural input sources is an important factor in encouraging farmers to increase
their productivity.
Access to credit services: The estimated coefficient for access to credit services indicated that there
exist negative relationships with allocative inefficiency and statistically significant at 1% level. These
negative relationships between access to credit services and cost efficiency suggest that farmers who
accessed credit ostensibly to purchase inputs have a higher probability of experiencing lower levels of
inefficiency. It is generally believed that access to credit positively influences allocative efficiency of
farmers provided credit is judiciously utilize in farm activities. This might be ensured if farmers seek
credit for to purchase farm inputs and farm operation. It is possible if framer’s accessed credit for
agricultural production rather than other activities or for household consumption. Credit access
indicates liquidity, which is a prerequisite for flexibility in timely decision making in the purchase of
inputs and farm operation. There is need for capital to purchase inputs such as seed, fertilizer, farm
tools and rent for land. Thus, access to credit service impact on allocative inefficiency of soybean
farmers. This is in conformity with the work of Ogundari and Ojo (2007) study on economic
efficiency of small scale food crop production in Nigeria, the coefficient of credit availability in
technical efficiency model was negative which means that food crops production inefficiency
decreased with increase in credit availability.
Extension frequency: The estimate for the frequency of extension services was found to be negative and significant at 1% level of probability, indicating a decline in allocative inefficiency as farmers’
access to more number of extension services contact. Extension frequency which is the number of
Analysis of Production Efficiency, Productivity Variances and Resource Allocation among Smallholder
Farmers of Soybean Producers: Evidence from Benishangul-Gumuz Region Ethiopia
International Journal of Research Studies in Agricultural Sciences (IJRSAS) Page | 33
days farmers visited by developments agents and agricultural experts in a year/months. This shows the importance of extension contacts with soybean farmers in conveying agricultural information and
application of new packages of technologies for enhancing production of soybean because it creates
capacity to acquire updated information and production inputs on time thereby enhancing
productivity. Extension workers play a central role in informing, motivating, and educating farmers about available technology.
Weeding frequency: Number of weeding was also among the significant variables in determining
allocative inefficiency of soybean farmers. The result indicated that weeding improves the level of allocative efficiency of soybean growing farmers of the study area. Hence, there is a possibility to
increase the yield of soybean through advising farmers to protect their soybean field from weeds.
Thus, it decrease the allocative inefficiency of soybean producer farmers as more time of days engaged for weed control.
Soil fertility status: The coefficient for soil fertility was positive and had a significant influence on
allocative efficiency. The farmers who allocate fertile land were having good efficiency. Moreover,
farm land found in the study area might be degraded due to over year cultivation and this required inorganic fertilizers and other soil fertility improvements measures. Allocation of poor soil fertility for
soybean production would be increase the allocative inefficiency. Therefore, decline in soil fertility
could be taken as cause for significant output loss.
Tropical livestock unit: The coefficient for livestock holding (TLU) was negative and had a
significant effect on allocative inefficiency, which confirms the considerable contribution of livestock
in soybean production. If unit increase for this factor in the production of soybean are increased the
allocative inefficiency would be decreased by the coefficients.
6. CONCLUSION
The study was set to characterize soybean producer farmers in Assosa zone of Benishangul-Gumuz
region; estimate the level of technical, allocative and economic efficiency and find out the factors
influencing their inefficiency among small-holder farmers. The study was carried out on a sample of
266 soybean producer farmers selected using a multi-stage sampling technique. In the stochastic
frontier production, the production inputs, particularly farm size, labour, improved seed, fertilizer and
oxen power were positive and significant effect on soybean production. The positive effects of inputs
on the soybean output was expected because more inputs used in rightful proportions increases
production.
Cost of fertilizer, labour cost, cost of oxen power and cost of other materials all affect total cost of
production positively and significantly, meaning an increase in the cost of any of these variables
would lead to increase in the total cost of production of soybean in the study area. Therefore, prices of
these inputs contribute to the cost of production. The average technical, allocative and economic
efficiency for small-holder soybean producer farmers were 72.8%, 55.13% and 40.08%, respectively
in the study area. It implies that farmers are not operating on the production frontier which is to the
maximum efficiency level, suggesting that considerable potential exist for increasing soybean
production with current available technology and resources to farmers.
RECOMMENDATIONS AND POLICY IMPLICATIONS The study has concluded that there is substantial exists of inefficiencies among soybean producing
farmers in the study area that reduces productivity of soybean. Given the empirical findings of this
study, the following recommendations are suggested:
Production factors/farm inputs such as farm land, seed, fertilizer, agro-chemical, labour, and oxen power were the major inputs influencing the production of soybean in the study area. Furthermore,
these inputs should be made available on time, in right quantities and at affordable prices to the
farmers’ through government organizations and respective stakeholders in agriculture. Concerned bodies should give due attention for technology introduction that assistance for labour demanding
activities.
The provision of adequate rural infrastructural facilities such as nearest main roads and nearby input
center and other social amenities should be the principal attention of government decision making.
Analysis of Production Efficiency, Productivity Variances and Resource Allocation among Smallholder
Farmers of Soybean Producers: Evidence from Benishangul-Gumuz Region Ethiopia
International Journal of Research Studies in Agricultural Sciences (IJRSAS) Page | 34
This will encourage rural-urban linkage that provide agricultural raw materials to industry and also promote good investment climate for agricultural development activities in the study area.
There is need for government through micro-finance, cooperatives and other financial institutions to make small-holder farmers based farm activity support credit availability that center the needs of
farmers. Therefore, respective stakeholders should make available soft loans to the farmers to enable
them acquire needed inputs on time and in the right quantity.
Extension services frequency was also found to be significantly reduce allocative inefficiencies
among soybean farmers. Thus, there is need to increase the frequency of extension service contacts with development agents of farmers by agricultural offices and NGO’s.
Efforts should be made to improve farmers’ basic education, since education was found to affect farmers’ technical and economic inefficiency of soybean farmers. This can be achieved through
increased extension contact and production based training, non-formal education and farmer-based
organizations that promote farmer education and awareness. Training and awareness creation programs through farmers training center method as well as result demonstrations should be arranged
before the implementation of the newly introduced technologies.
Stakeholders in agricultural sector should make efforts to address primary farmers’ cooperatives and
capacitate with financial, human resources and agricultural input supply to farmers at their localities.
This is because cooperatives used as entry point to sharing information on agricultural production activities and founding interaction with other farmers.
Appropriate livestock packages need to be introduced and promoted in the study area in order to make farmers used livestock as liquid asset sources and draught power for cultivation and household assets
building mechanisms. This might be, through improved veterinary service, feed and water
development as deemed necessary.
REFERENCES
[1] Abadi AK, Pnnel DJ (1999). A Conceptual Frame Work of Adoption of an Agricultural Innovation.
Agricultural Economics, University of Western Australia, Perth, 2(9): 145-154.
[2] Abba, W (2012). Technical Efficiency of Sorghum Production in Hong Local Government Area of
Adamawa State, Nigeria. Russian Journal of Agricultural and Socio Economic Sciences, 6 (6).
[3] Abu, GA, Abah, D, Okpachu SA (2011). Analysis of cost and return for sesame production in Nasarawa
State: Implication for sustainable development in Nigeria. Sustainable Development in Africa Journal,
13(3): 238-249.
[4] Abu GA, Ater PI, Abah D (2012). Profit efficiency among sesame farmers in Nasarawa State, Nigeria.
Current Research Journal of Social Sciences, 4(4): 261-268.
[5] Aigner D J, Lovell CK, Schmidt P (1977). Formulation and Estimation of Stochastic Frontier Function
Models. Journal of Econometrics, 6: 21-37.
[6] Amaza PS, Udoh EJ, Abdoulage T, Kamara AY (2010). Analysis of technical efficiency among
community based seed producers in the Savannas of Borno State, Nigeria. Journal of Food, Agriculture and Environment, 8(2): 1073-1079.
[7] Asad AS, Baig IA, Ayaz S, Mahmood N (2014). Impact of resource management on the development of
arid area productivity and livelihood: A case study of Rawalpindi district. Journal of Scholarly
Agricultural Science, 4(2): 90-96.
[8] Baten MA, Anton AK, Mohammad AH (2009). Modeling technical inefficiency effects in a stochastic
frontier production function for panel data. African Journal of Agricultural Research, 4(12): 1374-1382.
[9] Battese GE, Coelli TJ (1992). Frontier Production Functions, Technical Efficiency and Panel Data: With
Application to Paddy Farmers in India. Journal of Productivity Analysis 3: 387-399.
[10] Battese GE, Coelli TJ (1995). The Model for Technical Inefficiency Effects in Stochastic Frontier
Production Function for Panel Data. Empirical Economics 20: 325-332.
[11] Battese GE, Corra GS (1977). Estimation of a Production Frontier Model with application to the Pastoral
Zone of Eastern Australia‖. Australian Journal of Agricultural Economics. 21: 16a– 17a.
[12] Battese GE, Sohail, Malik J, Manzoor A Gill (1996). An Investigation of Technical Inefficiencies of
Production of Wheat Farmers in Four Districts of Pakistan.‖ Journal of Agricultural Economics, 47 (1): 37-49.
[13] Berhan Tegegne (2015). Determinants of technical, allocative and economic efficiencies among onion
producing farmers in irrigated agriculture: Empirical evidence from Kobo district, Amhara region,
Ethiopia. African Journal of Agricultural research, 10(20): 2180-2189.
Analysis of Production Efficiency, Productivity Variances and Resource Allocation among Smallholder
Farmers of Soybean Producers: Evidence from Benishangul-Gumuz Region Ethiopia
International Journal of Research Studies in Agricultural Sciences (IJRSAS) Page | 35
[14] Biam CK, Okorie A, Nwibo SU (2016). Economic efficiency of small-scale soya bean farmers in Central
Agricultural Zone, Nigeria: A Cobb-Douglas stochastic frontier cost function approach. Journal of
Development and Agricultural Economics, 8(3): 52-58.
[15] Bravo-Ureta BE, Pinheiro AE (1997). Technical, economic, and allocative efficiency in peasant farming:
evidence from the Dominican Republic. The Developing Economies, 35(1):48–67.
[16] Burhan O, Ceylan RF, Hatice K (2009). A Review of Literature on Productive Efficiency in Agricultural
Production. Journal of Applied Sciences Research, 5(7): pp 796-801.
[17] Chambers RG (1988). Applied Production Analysis: A Dual Approach. Cambridge Syndicate University
Press, Cambridge, Malaysia.
[18] Chakwera SJ (2015). A survey on technical, allocative, and economic efficiency of maize production using
the parametric stochastic frontier production function. African Journal of Agricultural Economics and
Rural Development, 3(6): 237-245.
[19] Chimai BC (2011). Determinants of technical efficiency in small-scale sorghum farming in Zambia. MSc
Thesis, Ohio State University, Ohio, USA.
[20] Coelli TJ (1995). Recent Developments in Frontier Estimation and Efficiency Measurement. Australian J. of Agric. Econ., 39: 219–45.
[21] Coelli TJ, Rao DS P, O’Donnell CJ, Battese GE (2005). An introduction to efficiency and productivity
analysis. Springer, New York, United States of America. 349pp.
[22] Desale Gebretsadik (2017). Technical, Allocative and Economic Efficiencies and Sources of Inefficiencies
among Large-scale Sesame Producers in Kafta Humera District, Western Zone of Tigray, Ethiopia: Non-
parametric approach. International Journal of Scientific & Engineering Research, 8 (6):1-21.
[23] Dawit Kelemework, Jerey HD, Esendugue GF (2013). Productivity and Efficiency of Small-scale
Agriculture in Ethiopia. Selected paper prepared for presentation at the Southern Agricultural Economics
Association (SAEA) Annual Meeting: February 3-5, 2013, Orlando, Florida.
[24] Ermiyas Mekonen, Endrias Geta, Belaineh Legesse (2015). Production efficiency of sesame in Selamago
district of South Omo Zone, Southern Ethiopia. Current Research in Agricultural Sciences, 2(1): 8-21.
[25] Farrell M (1957). Measurement of Productive Efficiency. Journal of the Royal Statistical Society 120 (3):
253-290.
[26] Farre R, Grabowski R, Grasskopt S (1985). Technical Efficiency of Philippine Agriculture. Applied
Economics, 17: 205–14
[27] Geta E, Bogale A, Kassa B, Eyasu E (2013). Productivity and Efficiency Analysis of Smallholder Maize
Producers in Southern Ethiopia. Journal of Hum. Ecol, 41(1): pp 67-75.
[28] Getachew Magnar, Bamlak Alamirew (2014). Analysis of technical efficiency of small-scale maize
growing farmers of Horo Guduru Wollega Zone, Ethiopia: A Stochastic Frontier Approach. Science
technology and arts research journal, 3(3): 204-212.
[29] Getahun Gemechu (2014). Off-Farm Income and Technical Efficiency of small-scale Farmers in Ethiopia:
Stochastic Frontier Analysis. MSc Thesis, Swedish University of Agricultural Sciences (SLU), Uppsala, Sweden.
[30] Hidayah I, Nuhfil H, Ratya A, Budi S (2013). Production and cost efficiency analysis using frontier stochastic approach: A case on paddy farming system with integrated plant and resource management
(IPRM) approach in Buru district Maluku Province Indonesia. Economics and Sustainable Development
Journal, 4(1): 78-85.
[31] Hussain N, Ali S, Miraj N, Sajjad M (2014). An estimation of technical efficiency of garlic production in
Khyber Pakhtunkhwa, Pakistan. International Journal of Food and Agricultural Economics, 2(2): 169-178.
[32] Ibrahim UW, Umar ASS, Ahmed B (2014). Technical efficiency and its determinants in water melon
production in Borno State, Nigeria. Journal of Economics and Sustainable Development, 5(27): 205-2011.
[33] Kothari CR (2004). Research Methodology: Methods and Techniques New Delhi: Wisley Eastern.
[34] Myo NA (2012). Production and economic efficiency of farmers and millers in Myanmar rice industry.
Institute of Developing Economies, Japan External Trade Organization, 471: 261-8545.
[35] Ogundari K, Ojo SO (2007). Economic efficiency of small-scale food crop production in Nigeria: A
stochastic frontier approach. Journal of Social Science, 14(2): 123-130.
[36] Ogundari K, Ojo SO (2005). The determinant of technical efficiency in mixed crop food production in
Nigeria. A stochastic approach. pp. 159-164. Proceeding of the 1st annual conference on development in
agriculture and biological science of Nigeria, 21st April, 2005. School of Agriculture and Agricultural
Technology, Federal University of Technology, Akure, Nigeria.
[37] Rahman K, Mia M, Bhuiyan M (2012). A stochastic frontier approach to model technical efficiency of rice
farmers in Bangladesh: An empirical analysis. Scientific Journal Krishi Found. 10(2): 9-19.
Analysis of Production Efficiency, Productivity Variances and Resource Allocation among Smallholder
Farmers of Soybean Producers: Evidence from Benishangul-Gumuz Region Ethiopia
International Journal of Research Studies in Agricultural Sciences (IJRSAS) Page | 36
Citation: Regasa Dibaba Wake, et.al, “Analysis of Production Efficiency, Productivity Variances and Resource Allocation among Smallholder Farmers of Soybean Producers: Evidence from Benishangul-Gumuz
Region Ethiopia” International Journal of Research Studies in Agricultural Sciences (IJRSAS), 2019; 5(7), pp.
18-36, http://dx.doi.org/10.20431/2454-6224.0507003
Copyright: © 2019 Authors. This is an open-access article distributed under the terms of the Creative
Commons Attribution License, which permits unrestricted use, distribution, and reproduction in any medium,
provided the original author and source are credited.
[38] Shalma HJ (2014). Economic analysis of soya bean production under Sasakawa global 2000 project in
Kaduna state, Nigeria. MSc Thesis, Ahmadu Bello University, Zaria, Nigeria.
[39] Shumet Asefa (2011). Analysis of technical efficiency of crop producing small-scale farmers in Tigray,
Ethiopia. MPRA Paper No., 40461.
[40] T. T. Amos (2007). An Analysis of Productivity and Technical Efficiency of Smallholder Cocoa Farmers
in Nigeria. J. Soc. Sci., 15(2): 127-133.
[41] Wassie Solomon (2012). Application of stochastic frontier model on agriculture: Empirical evidence in
wheat producing areas of Amhara Region, Ethiopia. BoD-Books on demand publishing, Gutenbergring,
Germany.