Embed Size (px)
Citation preview
1
Production of renewable fuels from algae
By
Harvind Kumar Reddy
Ph.D. Advisor: Dr. Shuguang Deng
Ph.D. Comprehensive Report
Department of Chemical Engineering
New Mexico State University
Las Cruces, New Mexico 88003
December 9, 2012
2
Table of Contents
Abstract:
Abstract: Production of renewable fuels from algae ....................................................................... 6
I. Project Background &Literature Review ................................................................................ 7
1.1 Production of algal biofuels ............................................................................................. 8
1.1.1 Mechanical extraction/ cell disruption methods ........................................................... 8
1.1.2 Solvent extraction ......................................................................................................... 9
1.1.3 Supercritical CO2 extraction ....................................................................................... 10
II. Preliminary Results (a). Direct conversion of algal biomass to biodiesel under supercritical
ethanol conditions ......................................................................................................................... 12
2.1 Objective ............................................................................................................................. 12
2.2 Experimental ....................................................................................................................... 13
2.2.1 Materials and methods .................................................................................................. 13
2.2.2 Characterization of Nannochloropsis salina algal biomass ......................................... 14
2.2.3 Experimental procedure ................................................................................................ 15
2.3 Results and discussions ....................................................................................................... 16
2.3.1 Influence of algae to ethanol (wt./vol.) ratio ................................................................ 16
2.3.2 Influence of reaction time ............................................................................................. 17
2.3.4 Regression analysis....................................................................................................... 19
2.3.5 TGA analysis of algal biomass ..................................................................................... 20
2.3.6 TEM analysis of algal biomass ..................................................................................... 21
2.3.7 Analysis of fatty acid ethyl esters with GC-MS and FT-IR ......................................... 22
2.3.8 Summary ....................................................................................................................... 24
III. Preliminary Results (b) ........................................................................................................... 26
Subcritical Water Extraction of Lipids from Wet Algal Biomass to Produce Biofuels ............... 26
3.1 Introduction ......................................................................................................................... 26
3
3.2Literature review .................................................................................................................. 26
3.3 Objective .......................................................................................................................... 27
3.4Experimental ........................................................................................................................ 28
3.4.1. Materials and instruments ............................................................................................ 29
3.4.2 Analytical methods ....................................................................................................... 29
3.4.3. Experimental procedure ............................................................................................... 31
3.4.4Experimental design ...................................................................................................... 33
3.5Results and discussion .......................................................................................................... 36
Subcritical water extraction of bio-crude from wet algal biomass ........................................ 36
3.5.1 Influence of process parameters on extraction of bio-crude in conventional heating
subcritical water extraction .................................................................................................... 37
3.5.2 Influence of process parameters on extraction of bio-crude in microwave assisted
subcritical water extraction .................................................................................................... 39
3.6Extraction efficiency and material balance .......................................................................... 41
3.6.1 Extraction efficiency..................................................................................................... 41
3.6.2 Material balances .......................................................................................................... 43
3.7Biomass and bio-crude analysis ........................................................................................... 44
3.7.1 Biomass characterization .............................................................................................. 44
3.7.2 Bio-crude characterization ............................................................................................ 46
3.7.3 Thermal behavior of algal biomass and bio-crude ....................................................... 48
3.8Development of byproducts ................................................................................................. 50
3.9 Conclusions ............................................................................................................................. 51
IV Future work .............................................................................................................................. 52
4.1 Hydrothermal liquefaction (HTL) – Literature ................................................................... 52
4.2 Objective 1 & Research Approaches .................................................................................. 59
4.3 Life cycle analysis (LCA) – Literature ............................................................................... 60
4
4.4 Objective 2& Research Approaches ................................................................................... 61
4.5 Algal aviation biofuel– Literature ....................................................................................... 62
4.6 Objective & Research Approaches: .................................................................................... 63
V. References ................................................................................................................................ 65
List of Figures and Tables
Figure 1: Experimental protocol ................................................................................................... 15
Figure 2: FAEE yield against (a) algae to ethanol (wt/vol) ratio, (b) reaction time and (c) reaction
temperature ................................................................................................................................... 18
Figure 3: Contour plots of experimental factors over FAEE yield ............................................... 20
Figure 4: Thermogravimetric (TGA) and differential thermogravimetric (DTG) curves of wet
algal biomass ................................................................................................................................. 21
Figure 5: TEM images of (a) several algal cells from rehydrated powder containing large,
electron-dense oil droplets (arrows) representing lipid droplets as well as other cellular
organelles. (b) Image of residual cellular materials following extraction .................................... 22
Figure 6: (a) GC chromatogram of crude biodiesel, (b) FT-IR spectra of petroleum diesel, algal
FAEE and algal FAME ................................................................................................................. 24
Figure 7: Process protocol of subcritical water extraction from wet algal biomass ..................... 32
Figure 8: Algal bio-crude and pure algal oil ................................................................................. 33
Figure 9: Contour plots of experimental parameters on bio-crude ............................................... 39
Figure 10: Yields of bio-crude, FAME content in bio-crude and extraction efficiencies of
respective methods ........................................................................................................................ 43
Figure 11: TEM images of algal biomass (a) Fresh algal biomass; (b) conventional SCW LEA;
(c) MW-SCW LEA ....................................................................................................................... 46
Figure 12: FT-ICR analysis of lipid extracts (a) positive ion ESI (b) negative ion ESI ............... 47
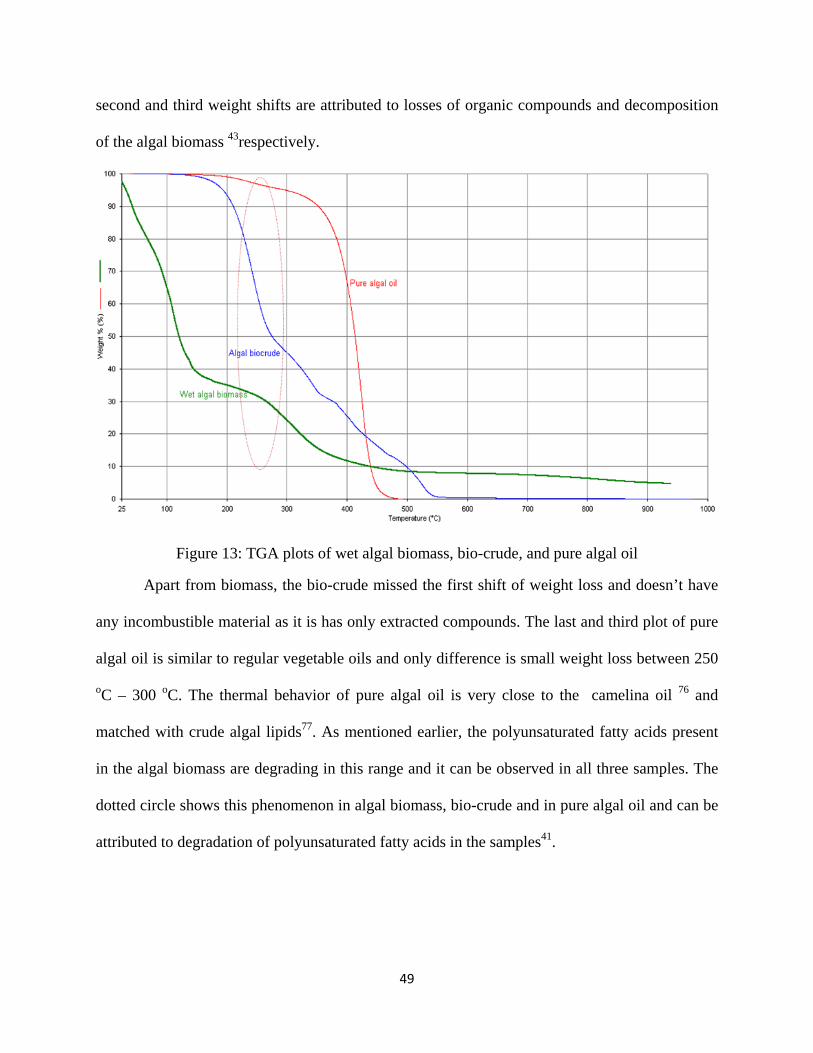
Figure 13: TGA plots of wet algal biomass, bio-crude, and pure algal oil ................................... 49
Figure 14: Yields of products in HTL a) pure water b) base b) acid medium .............................. 56
Figure 15: Product distribution of HTL experiments of different species of microalgae ............. 57
5
Figure 16: Distribution of world refinery production in 2006 ...................................................... 62
Table 1: Comparison of sources of biodiesel for 50% needs of US ............................................... 8
Table 2: Fatty acid profile of Nannochloropsis salina (as % of methyl esters) ........................... 14
Table 3: Experimental design and results of conventional heating subcritical water extraction .. 35
Table 4: Experimental design and results of conventional heating subcritical water extraction .. 36
Table 5: Extraction calculations of Folch, conventional SCW and MW-SCW methods ............. 42
Table 6: Material balances of Conventional SCW and MW-SCW methods ................................ 44
Table 7: Elemental characteristics of fresh biomass, LEA of conventional SCW and LEA of
MW-SCW ..................................................................................................................................... 45
Table 8: Bio oil yields and heating values .................................................................................... 53
Table 9: Effect of temperature on gas composition ...................................................................... 53
Table 10: Biochemical composition of algal strains ..................................................................... 55
Table 11: Nutrient analysis of process water compared to standard BBM growth media ........... 58
Table 12: Dry weights of harvested algae at the end of growth media ......................................... 58
6
Abstract: Production of renewable fuels from algae
The need for finding solutions to develop renewable and sustainable energy sources,reduce the
dependence on fossil fuels, mitigate or reduce CO2emissions and to possibly create new job
opportunities enforcedmany countries around the world to initiate research and development
programs to develop various kinds of renewable energy sources. Biofuels are one of those
renewable fuel sources developed to fuel the transportation sector to replace conventional
petroleum based fuels.Due to widespread research and development programs from last two
decades, significant progress has been made in the field of biofuels. The first and second
generation biofuels are produced from various food crops and plant seed oils. Algae has been
identified as a the potential sourceto produce biofuels, which can replace transportation fuels
derived from fossil energy sources due to various advantages than the previous two generation
feed stocks. The ability to produce high amounts of oil, efficiency in harvesting solar energy,
adaptability to different climatic conditions and capability to produce valuable byproducts makes
algae as a potential source for renewable energy source. In the present work the key
concentration is directed towards producing renewable biofuels from algal biomass. To produce
biofuels in a single step from wet algal biomass we demonstrated supercritical ethanolysis
method. Due to various reasons we changed our course towards extraction of oils/lipids from
biomass using water as a solvent. Subcritical water has been studied for the extraction of lipids
from wet algal biomass through two different heating mechanisms.
7
I. Project Background &Literature Review
In light of the problems with depleting fossil fuels, fluctuating oil prices, and mitigation of the
CO2 emissions, creation of new job opportunities, there are numerous development programs of
renewable energy sources are going on around the globe. Biofuels became one of the important
renewable energy sources, particularly for the transportation purposes. As a renewable energy
source, biomass is identified as one of the sources of energy and industrial scale biomass based
energy production could improve the socioeconomics of many underdeveloped societies and
countries along with the conscience of environmental protection1, 2. Biofuels can be classified
into three generations based upon their feed stock source. In the first generation of biofuels
bioethanol was produced from corn and sugar cane crops. The major debated problem with
bioethanol is “Food vs. Fuel”, as some of the sources are being directly influencing the food
supply chain. The second generation biofuel is biodiesel produced from various plant seed oils,
animal fats and waste cooking oil sources. Jatropha, palm oil, sunflower oil and soya bean oil are
few of the oil sources which have been using to produce biodiesel at commercial scale. The
production of biodiesel from these sources has led to some pressure on the domestic markets and
production is often carried out at very low capacities due to shortage of the sources3. The other
major concerns with these feed stocks are sustainable production of the fuel on long term, oil
productivity and area of land required to fulfill the needs of transportation sector. In the case of
USA to satisfy the requirement of 50% of total transportation fuels, the productivity of oil and
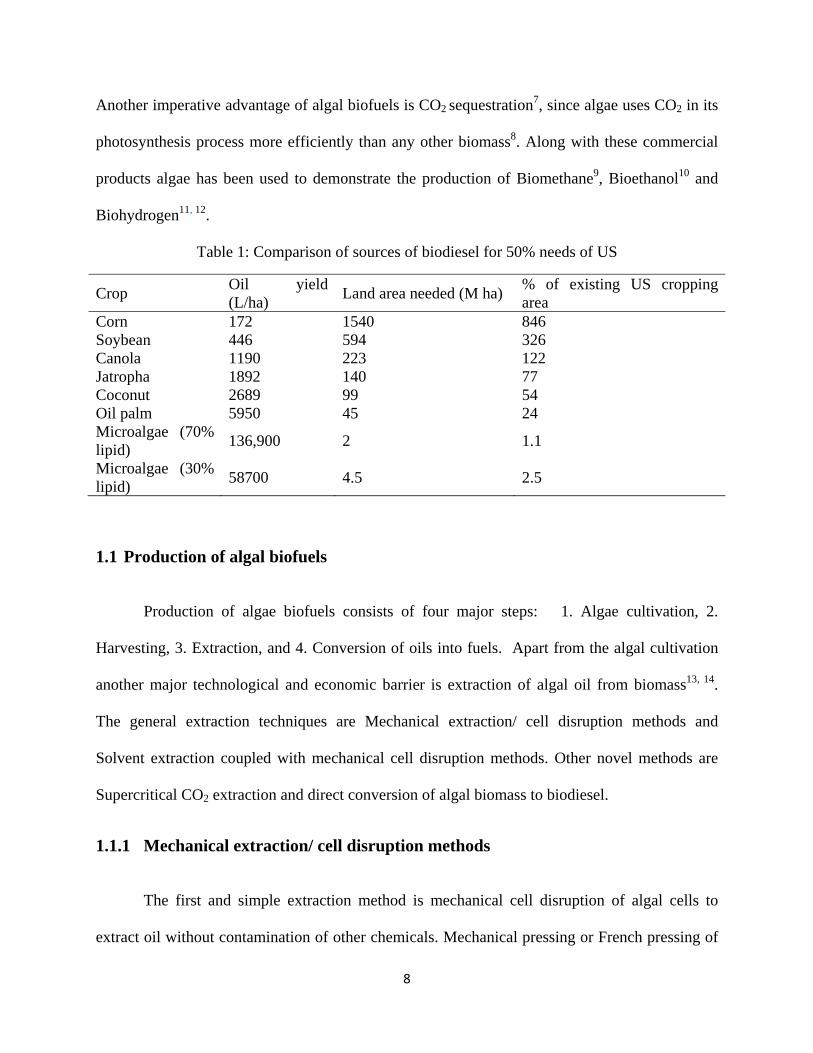
land needed for the cultivation of some feed stocks4 have been shown in Table 1. As shown in
Table 1, we can see that the depending on the species, algae can produce great volumes of oil in
small are of land in shorter periods of time. The other advantages of algae are, algae arean
alternative source for valuable compounds such as proteins, amino acids and carbohydrates5, 6.
8
Another imperative advantage of algal biofuels is CO2 sequestration7, since algae uses CO2 in its
photosynthesis process more efficiently than any other biomass8. Along with these commercial
products algae has been used to demonstrate the production of Biomethane9, Bioethanol10 and
Biohydrogen11, 12.
Table 1: Comparison of sources of biodiesel for 50% needs of US
Crop Oil yield (L/ha)
Land area needed (M ha) % of existing US cropping area
Corn 172 1540 846 Soybean 446 594 326 Canola 1190 223 122 Jatropha 1892 140 77 Coconut 2689 99 54 Oil palm 5950 45 24 Microalgae (70% lipid)
136,900 2 1.1
Microalgae (30% lipid)
58700 4.5 2.5
1.1 Production of algal biofuels
Production of algae biofuels consists of four major steps: 1. Algae cultivation, 2.
Harvesting, 3. Extraction, and 4. Conversion of oils into fuels. Apart from the algal cultivation
another major technological and economic barrier is extraction of algal oil from biomass13, 14.
The general extraction techniques are Mechanical extraction/ cell disruption methods and
Solvent extraction coupled with mechanical cell disruption methods. Other novel methods are
Supercritical CO2 extraction and direct conversion of algal biomass to biodiesel.
1.1.1 Mechanical extraction/ cell disruption methods
The first and simple extraction method is mechanical cell disruption of algal cells to
extract oil without contamination of other chemicals. Mechanical pressing or French pressing of
9
dry algal lumps involves pressurizing the algal biomass to high-pressure, where the cell walls are
ruptured to releases the oil similar to oil extraction from seeds or nuts through mechanical
pressing. Homogenization through bead or ball milling is a process to disintegrate the alga cells
which takes place in a jacketed chamber or vessel. The shear forces created by the high velocity
beads which moves radially causes the disruption of cells15. Cell disruption in this method
depends on factors like residence time, cell concentration, chamber volume, bead volume and
number of rotations. All these mechanical cell disruption are usually combined with the solvent
extraction to improve the extraction efficiency. Along with the mechanical methods new
pretreatment techniques ultra-sonication, microwave also getting attention. In ultra-sonication &
microwave pretreatments, the biomass will be treated in a sonication16/microwave17 chamber
prior to solvent extraction.
1.1.2 Solvent extraction
Solvent extraction is a common practice used to extract oils from the algal biomass and
other biomasses. The solvent should be selected based on efficiency, selectivity towards the
different classes of lipids and ability of solvent to prevent any possible degradation of lipids. In
order to achieve maximum extraction, the linkages between the lipids and other organelles of the
algae cells which are connected with van der Waals interactions, hydrogen bonding and covalent
bonding should be broken18. The most common solvents used for extraction are n-hexane,
chloroform, petroleum ether, methanol, ethanol, isopropanol, dichloromethane and mixture of
any of these solvents depending upon method and desired class selection of lipids. The
conventional solvent extraction methods are Bligh and dyer, folch19, soxhlet extraction20. The
steps involved in the solvent extraction at micro level were explained by halim et al. When the
algal cells interacted with the organic solvents, these solvents penetrate through the cell wall and
10
interact with the selective class of lipids depending upon its dielectric constant to form a solvent-
lipid complex. This complex diffuses in to the bulk solvent due to the concentration gradient
continues until this process reaches equilibrium13. The solvent extraction methods shows a lot of
variability depending upon the organic solvent (dielectric constant) used and biological matrix
being used in selection of different class of lipids20, 21. The cell wall and its composition and
solvents dielectric constant could be the reasons for these variable extraction properties of
individual methods13. These solvent extraction methods have been slightly modified by many
researchers to improve the kinetics of the extraction process often called as accelerated solvent
extraction (ASE). Kauffmann and christen reviewed these accelerated solvent extraction
techniques involving microwave heating and pressurized solvent extraction. In the microwave
assisted extraction (MAE) the acceleration is achieved by faster disruption of weak hydrogen
bonds the dipole rotation of the molecules caused by electromagnetic radiation. In pressurized
solvent extraction (PSE) the higher temperature and pressure accelerates the extraction process
as the high temperature accelerates the extraction kinetics, high pressure keeps the solvent in
liquid state and forces the solvent to pass through the pores of the matrix thoroughly22. When
coupled with the cell disruption techniques described earlier the solvent extraction will be very
faster and utilizes small amounts of solvents23.
1.1.3 Supercritical CO2 extraction
Commercial applications of supercritical CO2 extraction dates back to early 1990’s.
Supercritical extraction is being used in food and pharmaceutical industries due to its range of
selectivity of compounds, non-toxic nature, and easy separation24. The principle behind this
technology is, when fluids crosses both critical temperature and critical pressure they attains
11
properties of both gases and liquids. This state of the fluid is called supercritical state of fluid,
and it exhibits mass transfer properties of gas and solvent properties of liquid with greater
diffusion coefficients25.
Because of the lower critical point at 31.1oC and 72.9 atm carbon dioxide became preferred fluid
for extraction applications. The solvent properties of supercritical fluid can be modified by
altering extraction pressure and the extraction temperature. As an example target compounds like
pigments, proteins and neutral lipids can be extracted at their respective extraction temperature
and pressure, where they interact with the solvents13, 26, 27. Due to its high selectivity, lower
toxicity, chemical inertness and high purity of the extracted compounds, supercritical CO2
extraction is being used in many pharmaceutical, nutraceutical and food industries worldwide24.
12
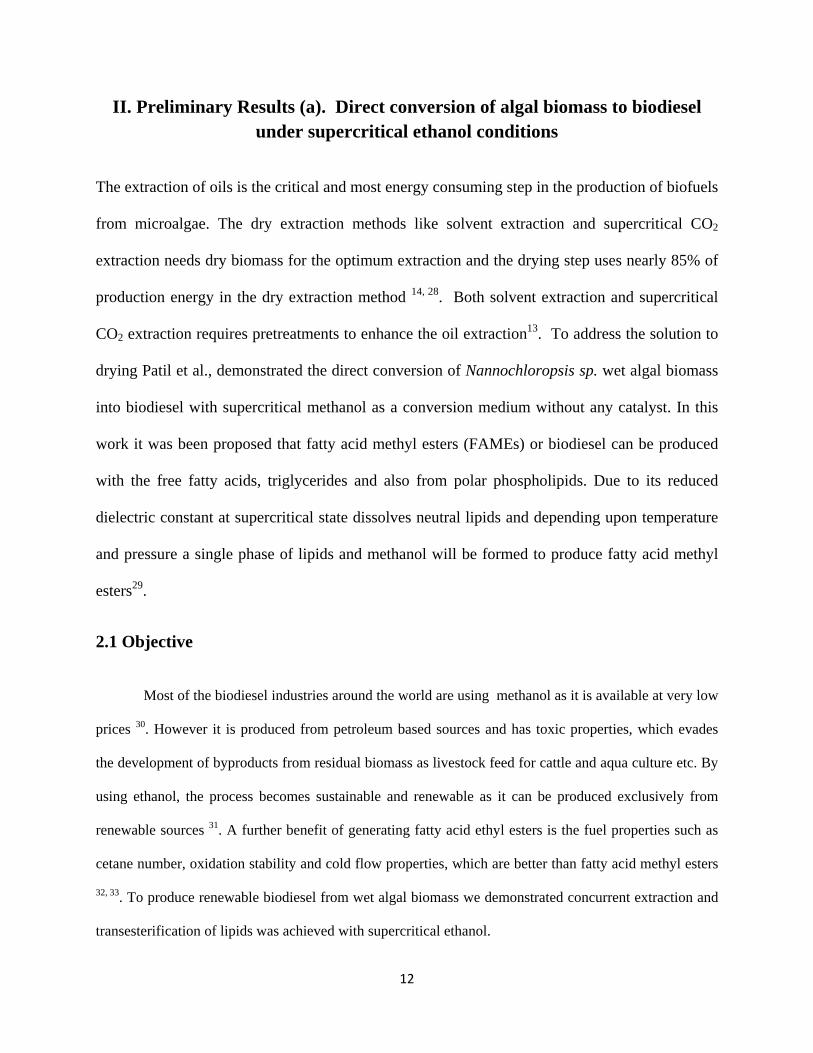
II. Preliminary Results (a). Direct conversion of algal biomass to biodiesel under supercritical ethanol conditions
The extraction of oils is the critical and most energy consuming step in the production of biofuels
from microalgae. The dry extraction methods like solvent extraction and supercritical CO2
extraction needs dry biomass for the optimum extraction and the drying step uses nearly 85% of
production energy in the dry extraction method 14, 28. Both solvent extraction and supercritical
CO2 extraction requires pretreatments to enhance the oil extraction13. To address the solution to
drying Patil et al., demonstrated the direct conversion of Nannochloropsis sp. wet algal biomass
into biodiesel with supercritical methanol as a conversion medium without any catalyst. In this
work it was been proposed that fatty acid methyl esters (FAMEs) or biodiesel can be produced
with the free fatty acids, triglycerides and also from polar phospholipids. Due to its reduced
dielectric constant at supercritical state dissolves neutral lipids and depending upon temperature
and pressure a single phase of lipids and methanol will be formed to produce fatty acid methyl
esters29.
2.1 Objective
Most of the biodiesel industries around the world are using methanol as it is available at very low
prices 30. However it is produced from petroleum based sources and has toxic properties, which evades
the development of byproducts from residual biomass as livestock feed for cattle and aqua culture etc. By
using ethanol, the process becomes sustainable and renewable as it can be produced exclusively from
renewable sources 31. A further benefit of generating fatty acid ethyl esters is the fuel properties such as
cetane number, oxidation stability and cold flow properties, which are better than fatty acid methyl esters
32, 33. To produce renewable biodiesel from wet algal biomass we demonstrated concurrent extraction and
transesterification of lipids was achieved with supercritical ethanol.
13
In the present work a concurrent extraction and transesterification of lipids was achieved
with supercritical ethanol. The dielectric constant of the ethanol decreases into the range of
organic solvents with increasing temperature34which enables extraction of lipids from the
biomass. Above critical conditions the exothermic hydrogen bonding in ethanol shifts towards
free monomer similar to methanol34, 35, which enables ethanol to perform transesterification of
triglycerides to fatty acid ethyl esters and diglycerides. Subsequently these diglycerides are
converted to fatty acid ethyl esters and monoglycerides which in turn further converted to fatty
acid ethyl esters. Along with the triglycerides fatty acid ethyl esters may also be derived from
polar phospholipids and free fatty acids29.
2.2 Experimental
2.2.1 Materials and methods
Nannochloropsis Salina wet algal biomass was obtained from Solix biofuels (Fort
Collins, CO) for experiments. Ethyl heptadecanoate (C17) from Sigma Aldrich was used as an
internal standard for GC-MS analysis. Absolute, anhydrous ACS/USP grade ethanol from
PHARMCO-AAPER (Shelbyville, KY) was obtained from NMSU chemistry lab stock room.
Hexane used for sample preparation in GC-MS analysis was purchased from Acros Organics
(Morris Plains, NJ). SPE silica columns for the purification of crude FAEE’s were purchased
from Thermo Scientific (Waltham, MA). The supercritical ethanol transesterification was
performed in PARR 4593 stainless steel bench top reactor accompanied by a 4843 controller unit
and were manufactured by Parr Instrument Company (Moline, Illinois, USA). A model H-7650
transmission electron microscope (Hitachi High-Technologies America, Pleasanton, CA), was
used for imaging of algal biomass in thin sections. Thermogravimetric analysis (TGA) of wet
14
algal biomass was performed using Perkin Elmer Pyris 1 TGA (Perkin Elmer Inc., USA)
instrument.
2.2.2 Characterization of Nannochloropsis salina algal biomass
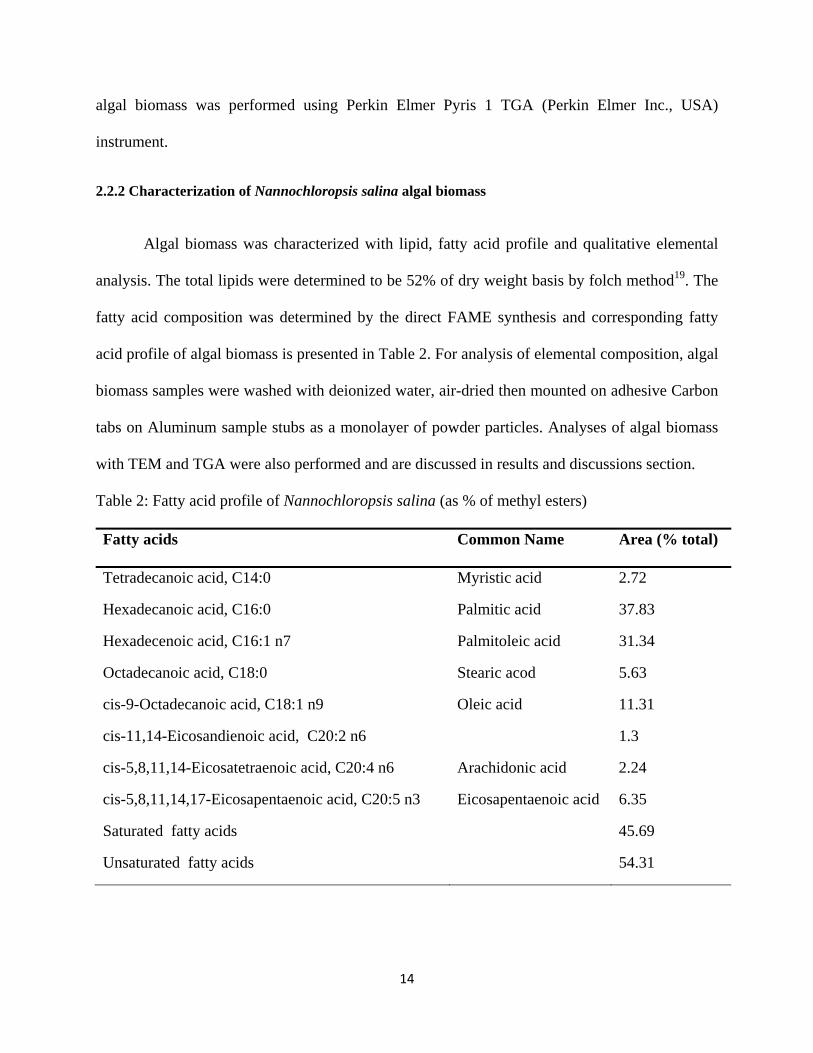
Algal biomass was characterized with lipid, fatty acid profile and qualitative elemental
analysis. The total lipids were determined to be 52% of dry weight basis by folch method19. The
fatty acid composition was determined by the direct FAME synthesis and corresponding fatty
acid profile of algal biomass is presented in Table 2. For analysis of elemental composition, algal
biomass samples were washed with deionized water, air-dried then mounted on adhesive Carbon
tabs on Aluminum sample stubs as a monolayer of powder particles. Analyses of algal biomass
with TEM and TGA were also performed and are discussed in results and discussions section.
Table 2: Fatty acid profile of Nannochloropsis salina (as % of methyl esters)
Fatty acids Common Name Area (% total)
Tetradecanoic acid, C14:0 Myristic acid 2.72
Hexadecanoic acid, C16:0 Palmitic acid 37.83
Hexadecenoic acid, C16:1 n7 Palmitoleic acid 31.34
Octadecanoic acid, C18:0 Stearic acod 5.63
cis-9-Octadecanoic acid, C18:1 n9 Oleic acid 11.31
cis-11,14-Eicosandienoic acid, C20:2 n6 1.3
cis-5,8,11,14-Eicosatetraenoic acid, C20:4 n6 Arachidonic acid 2.24
cis-5,8,11,14,17-Eicosapentaenoic acid, C20:5 n3 Eicosapentaenoic acid 6.35
Saturated fatty acids 45.69
Unsaturated fatty acids 54.31
15
2.2.3 Experimental procedure
Experiments were conducted with four grams of wet algal biomass containing 60% water
in a 100 mL PARR micro reactor under supercritical ethanol conditions. To analyze the effects
of the variable parameters, experiments were conducted in three batches by keeping one of the
parameter as variable and the remaining two parameters constant. The range for algae to ethanol
(wt./vol.) ratio was 1:6 -1:15, reaction times from 2 – 30 minutes, reaction temperature from
245oC – 270oC and the pressure was maintained well above the critical point (1200 -1350 psi) in
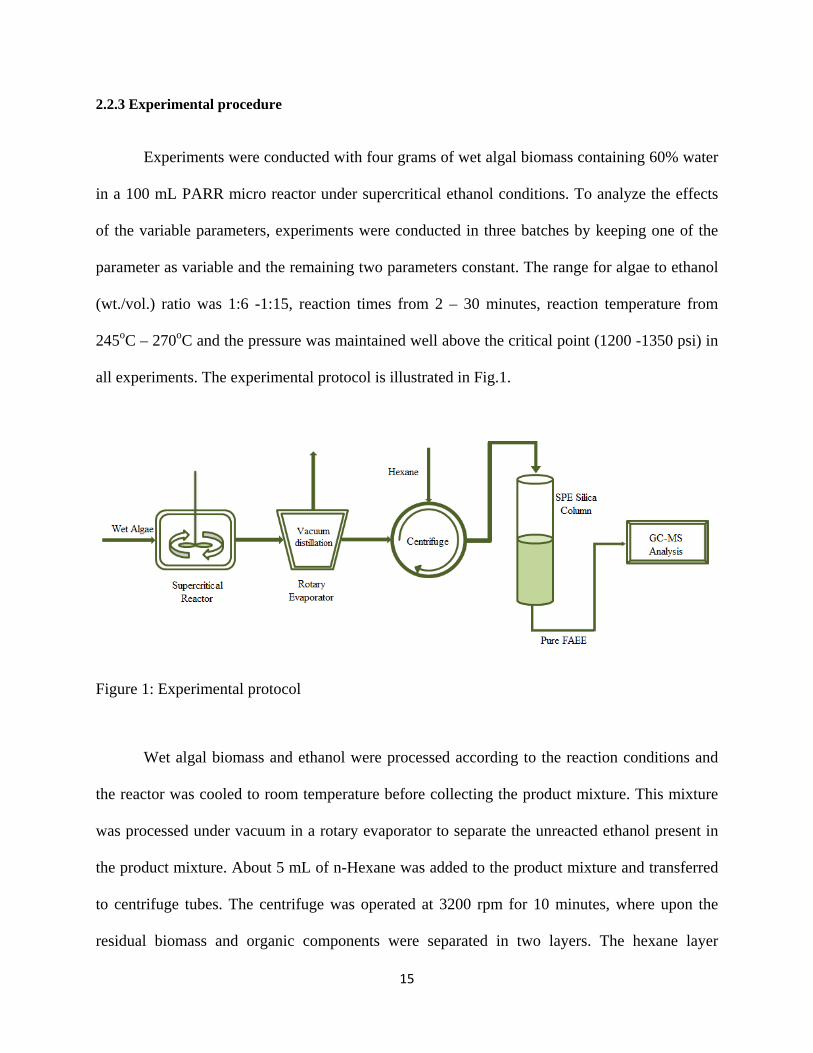
all experiments. The experimental protocol is illustrated in Fig.1.
Figure 1: Experimental protocol
Wet algal biomass and ethanol were processed according to the reaction conditions and
the reactor was cooled to room temperature before collecting the product mixture. This mixture
was processed under vacuum in a rotary evaporator to separate the unreacted ethanol present in
the product mixture. About 5 mL of n-Hexane was added to the product mixture and transferred
to centrifuge tubes. The centrifuge was operated at 3200 rpm for 10 minutes, where upon the
residual biomass and organic components were separated in two layers. The hexane layer
16
containing organic components was purified in short SPE silica columns to elute only neutral
components which were analyzed in GC-MS.
After purification with SPE silica columns, the product was analyzed with GC-MS. For
quantification of fatty acid ethyl esters an internal standard ethyl heptadecanoate (C17) was
added to the samples quantitatively. The fatty acid ethyl esters were quantified by taking the ratio
of total peak areas of the fatty acid ethyl esters to peak area of the internal standard 36.
2.1.4 Statistical analysis
The experiments were analyzed to study the nature of the variation of FAEE yield over the
various experimental factors such as algae to ethanol ratio (wt./vol.), reaction time (min.), and
reaction temperature (oC). The experiments were originally designed to study the individual
effects of the experimental factors on yield. A quadratic model was used to fit the data and tested
for significance. The analysis of variance over the quadratic model was conducted with 95%
confidence level.
2.3 Results and discussions
2.3.1 Influence of algae to ethanol (wt./vol.) ratio
In this single step supercritical ethanol transesterification reaction, excess ethanol was
used in order to drive the reaction in favor of formation of fatty acid ethyl esters29. To
investigate the effect of algae to ethanol (wt./vol.) ratio in the present work this ratio was varied
from 1:6 to 1:15 while the other parameters were kept constant at 260oC and 20 minutes of
reaction time. The yield of fatty acid ethyl esters was increased initially to 1:9 ratios (Fig. 2a),
but beyond this ratio fatty acid ethyl ester yield decreased significantly. This phenomenon was
also observed previously when producing palm oil fatty acid methyl and ethyl esters because of
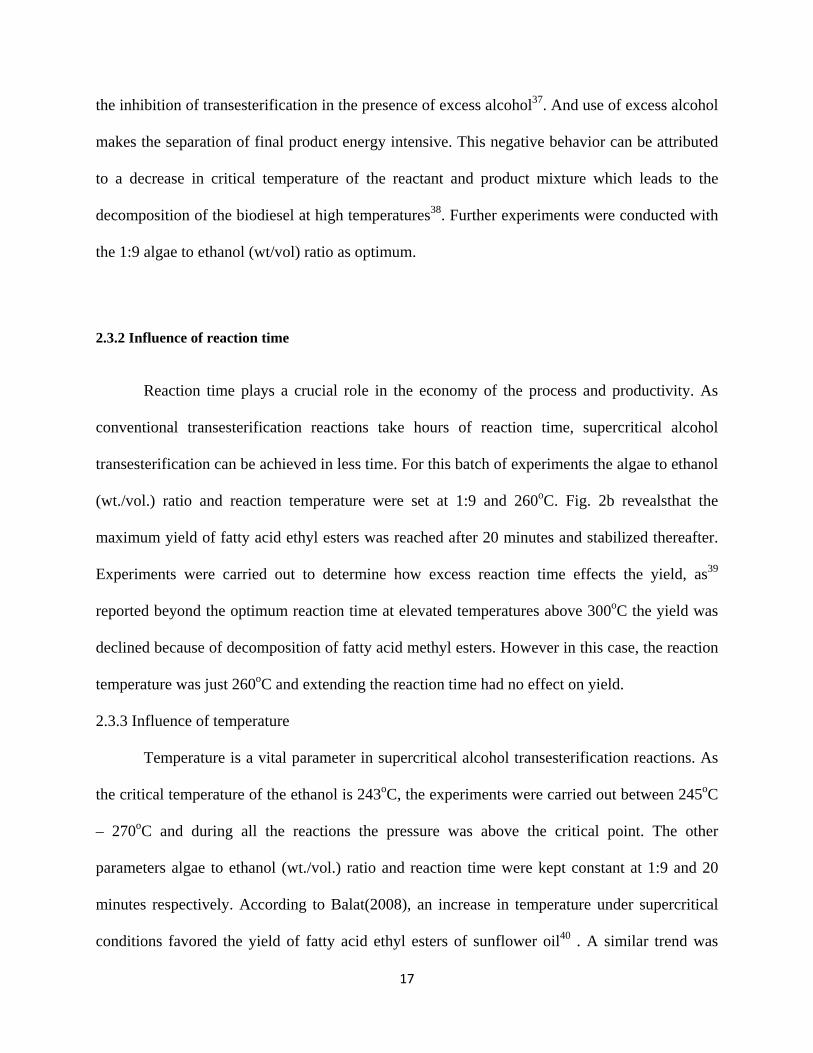
17
the inhibition of transesterification in the presence of excess alcohol37. And use of excess alcohol
makes the separation of final product energy intensive. This negative behavior can be attributed
to a decrease in critical temperature of the reactant and product mixture which leads to the
decomposition of the biodiesel at high temperatures38. Further experiments were conducted with
the 1:9 algae to ethanol (wt/vol) ratio as optimum.
2.3.2 Influence of reaction time
Reaction time plays a crucial role in the economy of the process and productivity. As
conventional transesterification reactions take hours of reaction time, supercritical alcohol
transesterification can be achieved in less time. For this batch of experiments the algae to ethanol
(wt./vol.) ratio and reaction temperature were set at 1:9 and 260oC. Fig. 2b revealsthat the
maximum yield of fatty acid ethyl esters was reached after 20 minutes and stabilized thereafter.
Experiments were carried out to determine how excess reaction time effects the yield, as39
reported beyond the optimum reaction time at elevated temperatures above 300oC the yield was
declined because of decomposition of fatty acid methyl esters. However in this case, the reaction
temperature was just 260oC and extending the reaction time had no effect on yield.
2.3.3 Influence of temperature
Temperature is a vital parameter in supercritical alcohol transesterification reactions. As
the critical temperature of the ethanol is 243oC, the experiments were carried out between 245oC
– 270oC and during all the reactions the pressure was above the critical point. The other
parameters algae to ethanol (wt./vol.) ratio and reaction time were kept constant at 1:9 and 20
minutes respectively. According to Balat(2008), an increase in temperature under supercritical
conditions favored the yield of fatty acid ethyl esters of sunflower oil40 . A similar trend was
18
observed in this case, the yield of fatty acid ethyl esters were increased steadily up to 265oC and
fall down at 270oC and these results were shown in Fig. 2c. The decrease in yield at 270oC can
be attributed to the thermal degradation of unsaturated fatty acids41 present in the algal biomass.
Identical results have been reported by other researchers and observed shift in carbon bonding at
270oC reaction temperature in algal biomass through FT-IR analysis29. Nevertheless the high
percentage of unsaturated fatty acid ethyl esters hinder the oxidation stability of the biodiesel32.
Figure 2: FAEE yield against (a) algae to ethanol (wt/vol) ratio, (b) reaction time and (c) reaction temperature
19
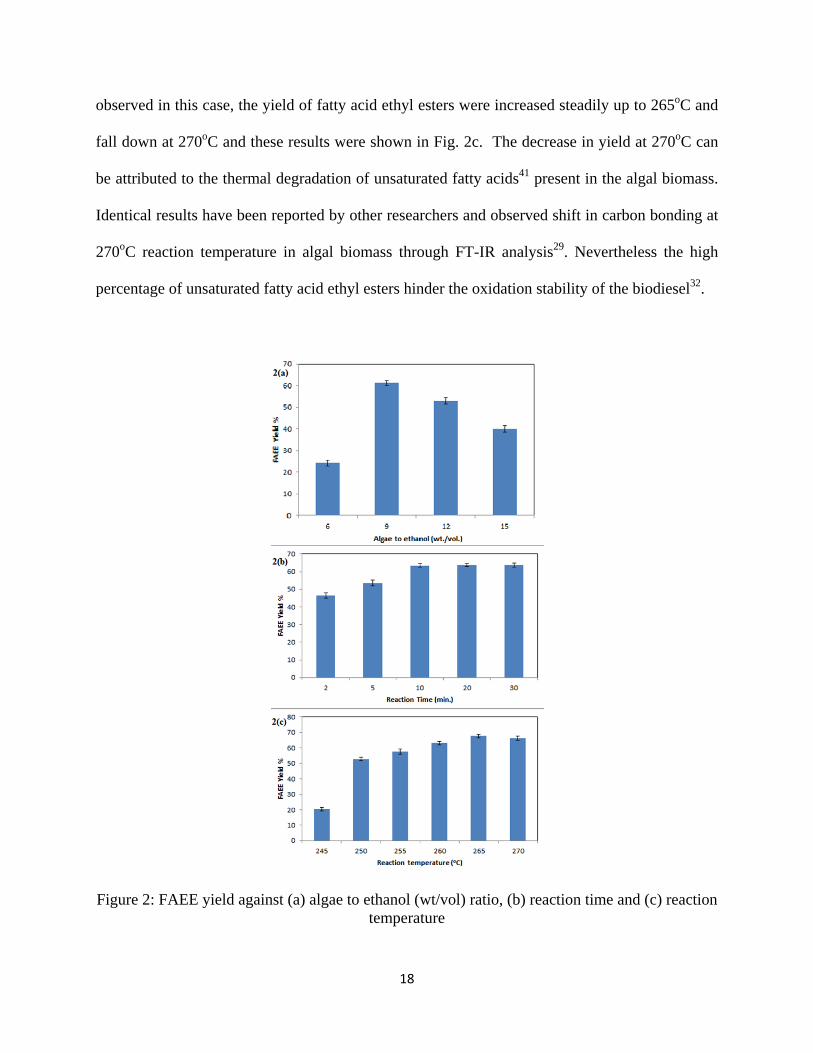
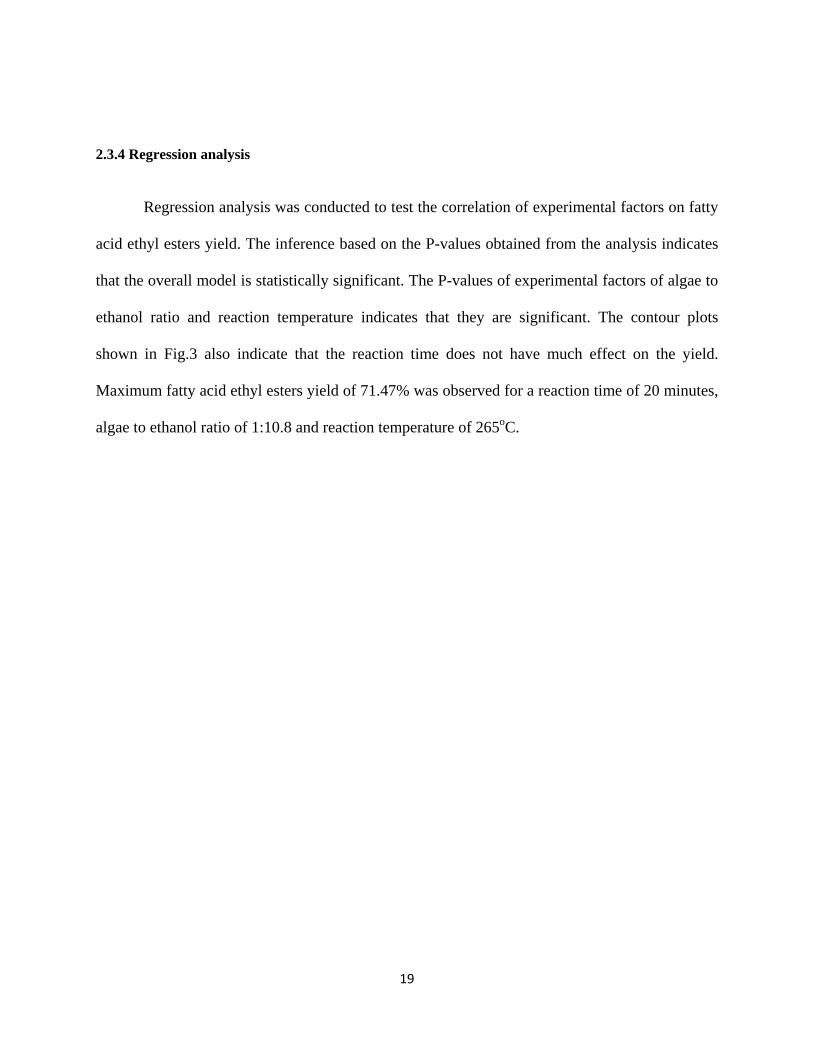
2.3.4 Regression analysis
Regression analysis was conducted to test the correlation of experimental factors on fatty
acid ethyl esters yield. The inference based on the P-values obtained from the analysis indicates
that the overall model is statistically significant. The P-values of experimental factors of algae to
ethanol ratio and reaction temperature indicates that they are significant. The contour plots
shown in Fig.3 also indicate that the reaction time does not have much effect on the yield.
Maximum fatty acid ethyl esters yield of 71.47% was observed for a reaction time of 20 minutes,
algae to ethanol ratio of 1:10.8 and reaction temperature of 265oC.
20
Figure 3: Contour plots of experimental factors over FAEE yield
2.3.5 TGA analysis of algal biomass
In thermogravimetric analysis (TGA) of wet algal biomass, the samples were heated from
25 to 950 ºC at constant heating rate of 10 ºC/min in nitrogen atmosphere at a constant purge rate
of 20 mL/min at the pan. The thermogravimetric plots in linear and differential form for wet
algal biomass are shown in Fig.4. The biomass has undergone three phases of weight loss, one
between 100 - 140oC, the second at 250oC – 300oC and a third loss around 350oC-500oC. The
first shift represents weight loss caused by dehydration of the biomass sample. Nearly 60%
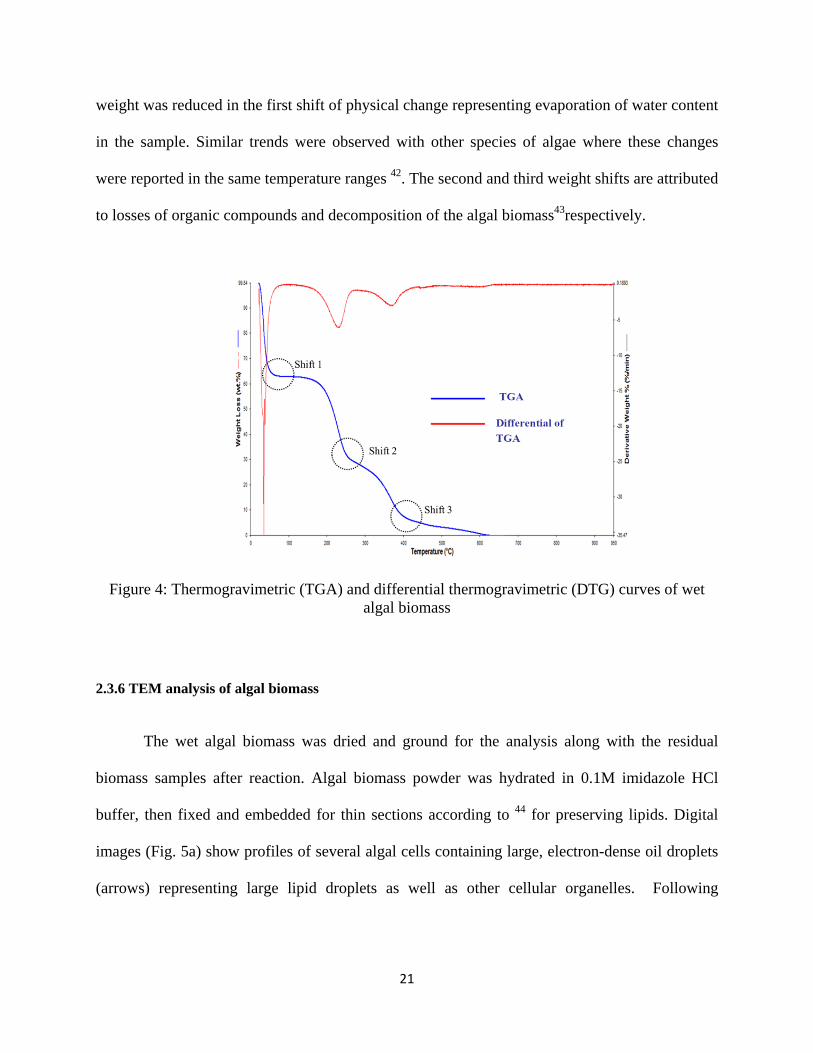
21
weight was reduced in the first shift of physical change representing evaporation of water content
in the sample. Similar trends were observed with other species of algae where these changes
were reported in the same temperature ranges 42. The second and third weight shifts are attributed
to losses of organic compounds and decomposition of the algal biomass43respectively.
Figure 4: Thermogravimetric (TGA) and differential thermogravimetric (DTG) curves of wet algal biomass
2.3.6 TEM analysis of algal biomass
The wet algal biomass was dried and ground for the analysis along with the residual
biomass samples after reaction. Algal biomass powder was hydrated in 0.1M imidazole HCl
buffer, then fixed and embedded for thin sections according to 44 for preserving lipids. Digital
images (Fig. 5a) show profiles of several algal cells containing large, electron-dense oil droplets
(arrows) representing large lipid droplets as well as other cellular organelles. Following
22
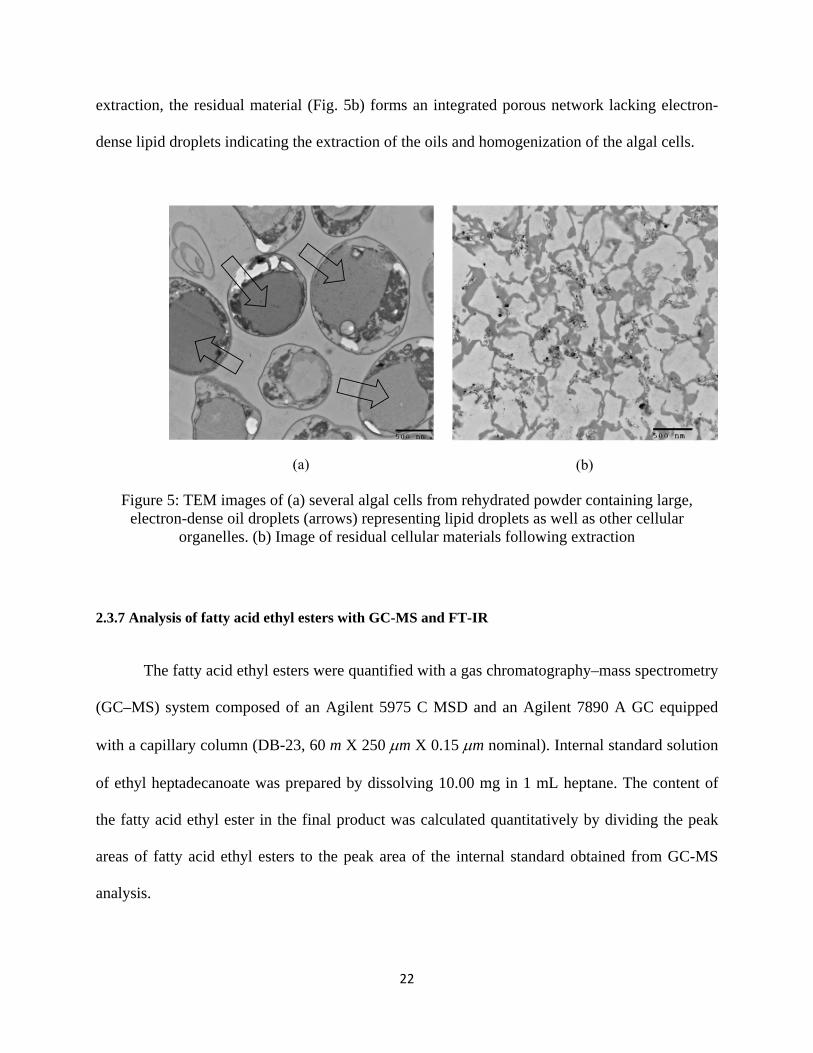
extraction, the residual material (Fig. 5b) forms an integrated porous network lacking electron-
dense lipid droplets indicating the extraction of the oils and homogenization of the algal cells.
Figure 5: TEM images of (a) several algal cells from rehydrated powder containing large, electron-dense oil droplets (arrows) representing lipid droplets as well as other cellular
organelles. (b) Image of residual cellular materials following extraction
2.3.7 Analysis of fatty acid ethyl esters with GC-MS and FT-IR
The fatty acid ethyl esters were quantified with a gas chromatography–mass spectrometry
(GC–MS) system composed of an Agilent 5975 C MSD and an Agilent 7890 A GC equipped
with a capillary column (DB-23, 60 m X 250 m X 0.15 m nominal). Internal standard solution
of ethyl heptadecanoate was prepared by dissolving 10.00 mg in 1 mL heptane. The content of
the fatty acid ethyl ester in the final product was calculated quantitatively by dividing the peak
areas of fatty acid ethyl esters to the peak area of the internal standard obtained from GC-MS
analysis.
23
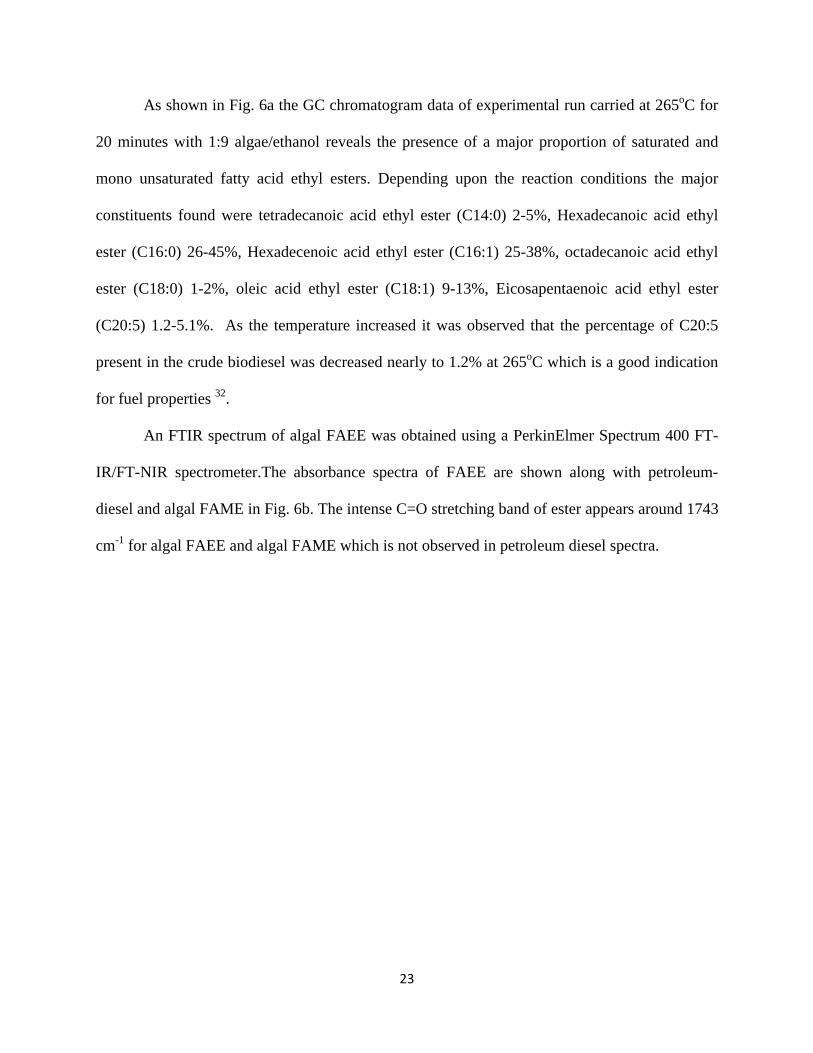
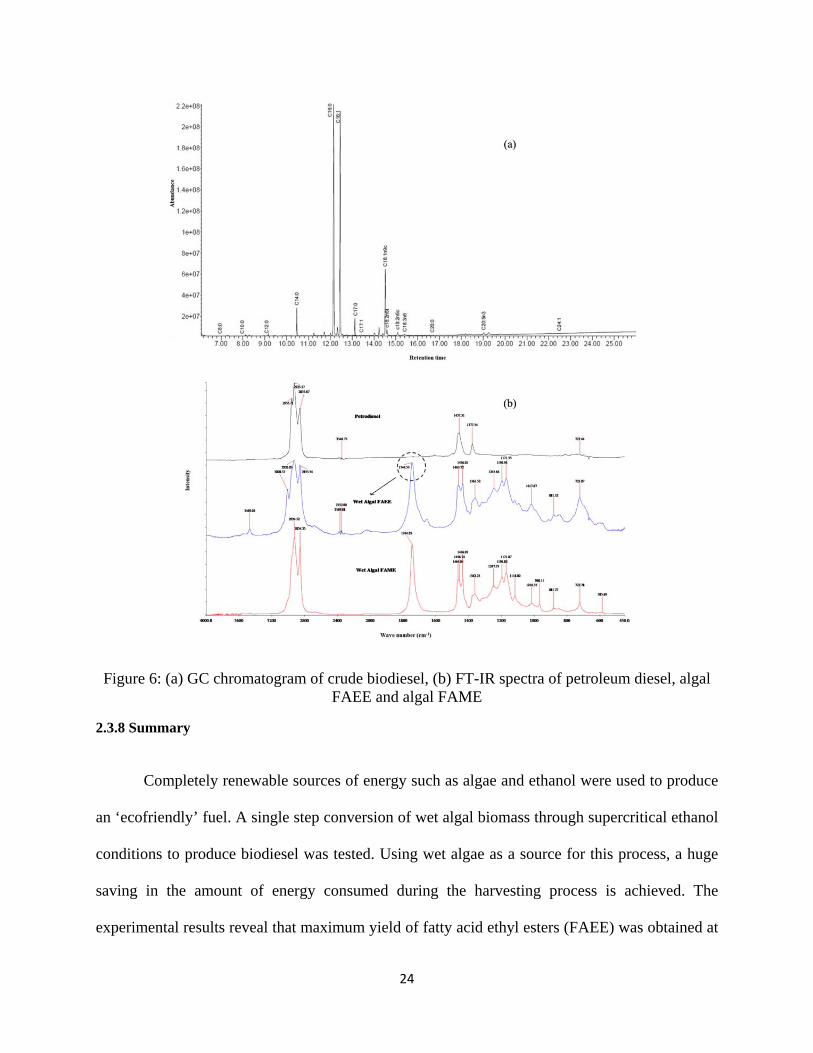
As shown in Fig. 6a the GC chromatogram data of experimental run carried at 265oC for
20 minutes with 1:9 algae/ethanol reveals the presence of a major proportion of saturated and
mono unsaturated fatty acid ethyl esters. Depending upon the reaction conditions the major
constituents found were tetradecanoic acid ethyl ester (C14:0) 2-5%, Hexadecanoic acid ethyl
ester (C16:0) 26-45%, Hexadecenoic acid ethyl ester (C16:1) 25-38%, octadecanoic acid ethyl
ester (C18:0) 1-2%, oleic acid ethyl ester (C18:1) 9-13%, Eicosapentaenoic acid ethyl ester
(C20:5) 1.2-5.1%. As the temperature increased it was observed that the percentage of C20:5
present in the crude biodiesel was decreased nearly to 1.2% at 265oC which is a good indication
for fuel properties 32.
An FTIR spectrum of algal FAEE was obtained using a PerkinElmer Spectrum 400 FT-
IR/FT-NIR spectrometer.The absorbance spectra of FAEE are shown along with petroleum-
diesel and algal FAME in Fig. 6b. The intense C=O stretching band of ester appears around 1743
cm-1 for algal FAEE and algal FAME which is not observed in petroleum diesel spectra.
24
Figure 6: (a) GC chromatogram of crude biodiesel, (b) FT-IR spectra of petroleum diesel, algal FAEE and algal FAME
2.3.8 Summary
Completely renewable sources of energy such as algae and ethanol were used to produce
an ‘ecofriendly’ fuel. A single step conversion of wet algal biomass through supercritical ethanol
conditions to produce biodiesel was tested. Using wet algae as a source for this process, a huge
saving in the amount of energy consumed during the harvesting process is achieved. The
experimental results reveal that maximum yield of fatty acid ethyl esters (FAEE) was obtained at
25
265oC, with 20 minutes of reaction time and 1:9 algae to ethanol (wt./vol.) ratio. Statistical
analysis of the data suggests a quadratic correlation between the experimental factors and the
FAEE yield. Also, regression analysis showed that a maximum yield of 71.47% can be achieved
at a reaction time of 20 minutes, algae to ethanol (wt./vol.) ratio of 1:10.8 and reaction
temperature of 2650C. Thermogravimetric analysis (TGA) revealed the various ranges of
temperature at which dehydration, degradation of organic compounds, and decomposition of
biomass occurs.
26
III. Preliminary Results (b)
Subcritical Water Extraction of Lipids from Wet Algal Biomass to Produce Biofuels
3.1 Introduction
In the previous chapter direct production of biodiesel from wet algal biomass was
demonstrated. But these supercritical processes are energy intensive making the entire process
less energy efficient and demands high capital investments. In order make the production of algal
biofuels sustainable, valuable co-products must be recovered from the algal biomass before
conversion45. Hydrothermal liquefaction (HTL) or subcritical water extraction (SCW) is another
way to produce biofuels.
3.2Literature review
Water is identified as an environmentally benign, non-toxic medium, with selective
extraction or reaction capabilities and is a readily available green solvent. The process of
converting biomass in HTL is performed at medium-temperatures (200-400 oC) and high
pressure, and it produces a liquid product called bio-crude or bio-oil. The reduction of the
dielectric constant makes water a suitable solvent for small organic compounds, as its dielectric
constant drops from 80 at room temperature to 40 at 200 oC. The solubility of organic matter
begins to increase rapidly at about 200 oC, and this enhanced solubility for organic compounds is
provided by a homogeneous single-phase medium for organic synthesis in subcritical water46.
Subcritical water extraction has been demonstrated for the extraction of bioactive components
from Haematococcus pluvialis microalga47, antioxidant compounds from rosemary plants48,
mannitol from olive leaves49, Neutraceutical compounds from citrus pomaces50, and essential
27
oils from coriander seeds51. Continuous extraction of medicinal plant oils through subcritical
water extractionis reported to be very high compared to conventional solvent extraction
methods52. In HTL, macromolecules present in the biomass are subjected to hydrolysis, which
degrades them into smaller molecules. During this process, a substantial part of the oxygen in the
biomass is removed by dehydration or decarboxylation 53-56. The successful use of water as a
“green” solvent in previous studies indicated that SCW extraction of lipids from microalgae is an
environmentally friendly alternative to traditional solvent-based extraction methods.
Along with conventional heating, we integrated a more energy efficient microwave
assisted heating57 step in the SCW method for the extraction of lipids. Microwave assisted
extraction is a fairly new technology which has greater selectivity towards desired compounds
and a faster and better recovering capacity than traditional methods58. In this novel process, the
resistance offered by the solution to the passing electrophoretic migration of ions of
electromagnetic field causes friction between molecules resulting in the generation of heat59.
Along with external heat, the water inside the cell body evaporates and bursts cell walls making
extraction of cellular contents much easier23, 60-62. There have been successful demonstrations of
the extraction of essential oils from the leaves of murraya koenigii61, tanshinones from Salvia
miltiorrhiza bunge63, taxanes from taxus biomass64, and phenolic compounds from tea
residues65. Essential oils from plant materials66 have also been reported and in all cases
microwave extraction methods have produced equal or greater extraction yields. In this study we
demonstrated that SCW extraction through conventional and microwave heating methods which
are more selective towards neutral lipids.
3.3 Objective
28
Our previous work was focused on producing biodiesel directly from wet algal biomass.
In this process we intentionally tried to reduce the polyunsaturated fatty acid ethyl esters to
maintain the fuel properties. But as many researchers identified byproducts are major economical
benefactors in algal biofuels. And supercritical processing conditions demands much
complicated infrastructure and energy, which makes production of biofuels less profitable. In
order to address this issue in this work we performed two green extraction processes, namely
conventional heating subcritical water extraction (C-SCW) and microwave assisted subcritical
water extraction (MW-SCW), which are both energy efficient extraction methods to obtain
neutral lipids from wet algal biomass (Nannochloropsis salina). After carefully evaluating
preliminary results, central composite designs were employed to study the effects of extraction
temperature, extraction time, and biomass loading on bio-crude yield. The results of these
experiments directed us to optimize the process parameters to achieve maximum yield. Further
experiments were conducted at optimized conditions to validate the extraction processes. These
entire path finding experiments were performed by using stored N. salina algal biomass for SCW
method as freshly harvested biomass was not available at the time of experiments. The
microwave assisted extraction experiments and optimized condition C-SCW experiments were
conducted with freshly harvested algal biomass, N. salina, harvested from the NMSU photo
bioreactor facility. Folch extraction and FAMEs quantitation by GC/MS are used to compare
lipid yield for each method. Produced bio-crudes were also analyzed by FT-ICR MS for
qualitative compositional description. Material balances for two methods are presented. The lipid
extracted algae (LEA) were analyzed for its nutrient value and calorific value. Thermal behavior
of algae, bio-crude and pure algal oil was found through Thermo gravimetric analysis (TGA).
3.4Experimental
29
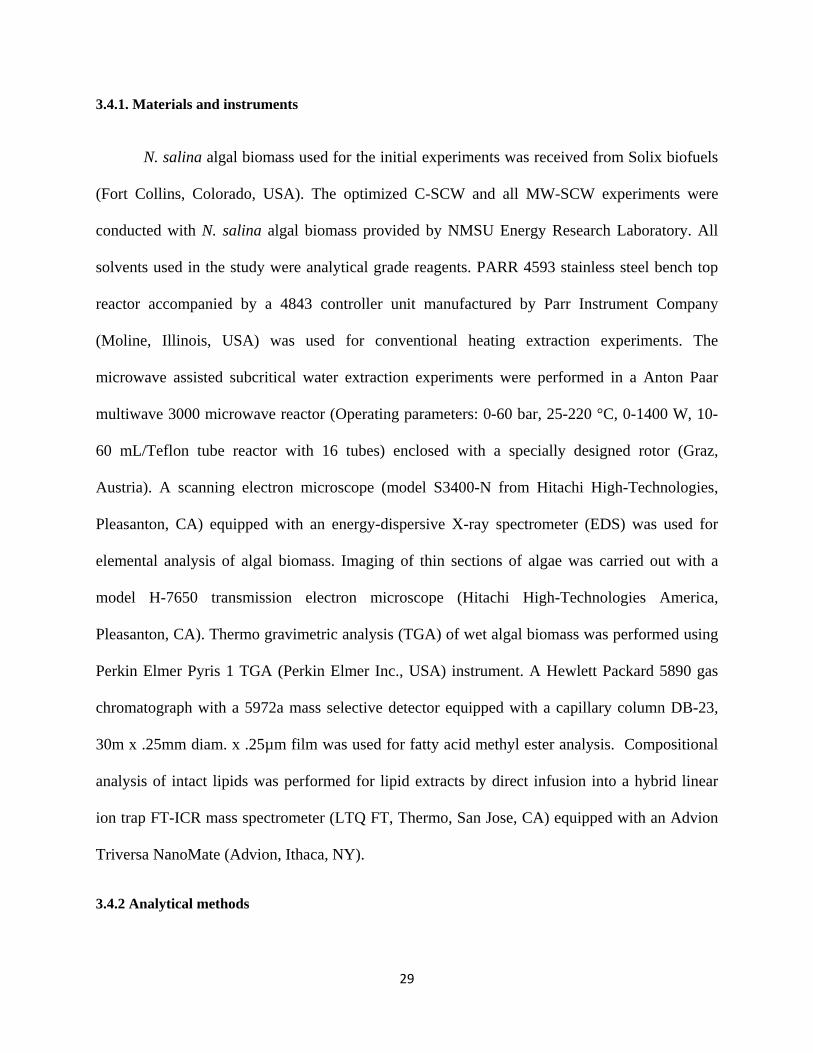
3.4.1. Materials and instruments
N. salina algal biomass used for the initial experiments was received from Solix biofuels
(Fort Collins, Colorado, USA). The optimized C-SCW and all MW-SCW experiments were
conducted with N. salina algal biomass provided by NMSU Energy Research Laboratory. All
solvents used in the study were analytical grade reagents. PARR 4593 stainless steel bench top
reactor accompanied by a 4843 controller unit manufactured by Parr Instrument Company
(Moline, Illinois, USA) was used for conventional heating extraction experiments. The
microwave assisted subcritical water extraction experiments were performed in a Anton Paar
multiwave 3000 microwave reactor (Operating parameters: 0-60 bar, 25-220 °C, 0-1400 W, 10-
60 mL/Teflon tube reactor with 16 tubes) enclosed with a specially designed rotor (Graz,
Austria). A scanning electron microscope (model S3400-N from Hitachi High-Technologies,
Pleasanton, CA) equipped with an energy-dispersive X-ray spectrometer (EDS) was used for
elemental analysis of algal biomass. Imaging of thin sections of algae was carried out with a
model H-7650 transmission electron microscope (Hitachi High-Technologies America,
Pleasanton, CA). Thermo gravimetric analysis (TGA) of wet algal biomass was performed using
Perkin Elmer Pyris 1 TGA (Perkin Elmer Inc., USA) instrument. A Hewlett Packard 5890 gas
chromatograph with a 5972a mass selective detector equipped with a capillary column DB-23,
30m x .25mm diam. x .25µm film was used for fatty acid methyl ester analysis. Compositional
analysis of intact lipids was performed for lipid extracts by direct infusion into a hybrid linear
ion trap FT-ICR mass spectrometer (LTQ FT, Thermo, San Jose, CA) equipped with an Advion
Triversa NanoMate (Advion, Ithaca, NY).
3.4.2 Analytical methods
30
3.4.2.1 Conventional lipid extraction
Conventional lipid extraction was performed by the Folch method (Folch et al., 1957).
For this procedure, dried algal samples (0.1 g) were extracted in triplicate for 30 min with 2 mL
of chloroform/methanol (2:1 v/v) at 25 °C with continual vortexing. Extracts were centrifuged
and the supernatant removed. Extraction was repeated and combined supernatants were
evaporated in pre-weighed vials under a steam of nitrogen. All lipid extracts were stored under
nitrogen at -20 °C for FT-ICR MS analysis.
3.4.2.2. GC/MS FAME analysis
FAME (fatty acid methyl esters) analysis was performed by direct methylation of 50 mg
of dry tissue or bio-crude which is weighed and placed in 12 mL glass tube. Next, 10 µL of
glycerol tritridecanoate (13:0 FAME standard at 20 mg/mL in Hexane) as internal standard was
added to each sample vial. Then 5 mL of 0.2 N KOH in MeOH was added and each sample was
vortexed for 20 seconds. These samples were placed in hot water bath at 65oC for ten minutes
and vortexed for 30 seconds. These last two steps were repeated three times total. To stop the
reaction, 1 mL of 1M Acetic Acid was added to each sample and then vortexed each sample for
20 seconds. 2 mL of Hexane with internal standard (methyl tricosanoate at 50 mg/ L in Hexane)
was added to each sample vial. Each sample was vortexed for 20 seconds and two phases are
separated by centrifugation. The top hexane layer was taken for the GC-MS analysis. Helium
was used as the carrier gas with a 2 µl injection volume. The temperature ramp started at 80 oC
and ramped 20 oC/min to 220 oC and held for 6 minutes for a total run time of 13.3 minutes. The
instrument was tuned with a standard spectra auto tune method, and a calibration curve was
made from a Supelco 37 Comp. FAME mix 10mg/ml in CH2Cl2. The total lipids were
31
determined by folch method 19 and the lipid profile is analyzed with direct FAME method as
described above. For analysis of elemental composition, algal biomass samples and lipid
extracted algae samples were washed with D.I water, air-dried then mounted on adhesive Carbon
tabs on Aluminum sample stubs as a monolayer of powder particles. Elemental spectra of
biomass particles were collected at 15 kV using the SEM-EDS microanalysis system.
3.4.3. Experimental procedure
In all experiments we used constant volume of feed (80 mL for conventional and 60 mL
for MW-SCW) with varying biomass loading. Samples were prepared according to the biomass
loading by adding sufficient D.I water. Then the samples were fed in to the reactor or reactor
tubes and the temperature maintained as per the experimental plan. The reactors were cooled
down after completion of the experiment and all the product mixture was transferred into a
separation funnel and 15 mL of n-hexane is added. 5 mL more n-hexane was used to wash the
agitator to free any bio-crude globules adhered to it and transferred to the separation funnel. The
mixture was thoroughly stirred with disposable spatula and left for 15 min for settling. Then
water layer was collected for the material balance measurements and hexane layer containing
bio-crude and LEA was transferred to centrifuge tubes. Bio-crude and LEA biomass were
separated in centrifuge tubes, which were operated at 3200 rpm for 5 min. The less dense hexane
layer, which contains lipids, was separated from LEA and transferred into weighed rotary
evaporator flask. The rotary evaporator was operated at 70 oC under vacuum to remove the
hexane from bio-crude. Weight of the bio-crude is calculated after subtracting the flask weight
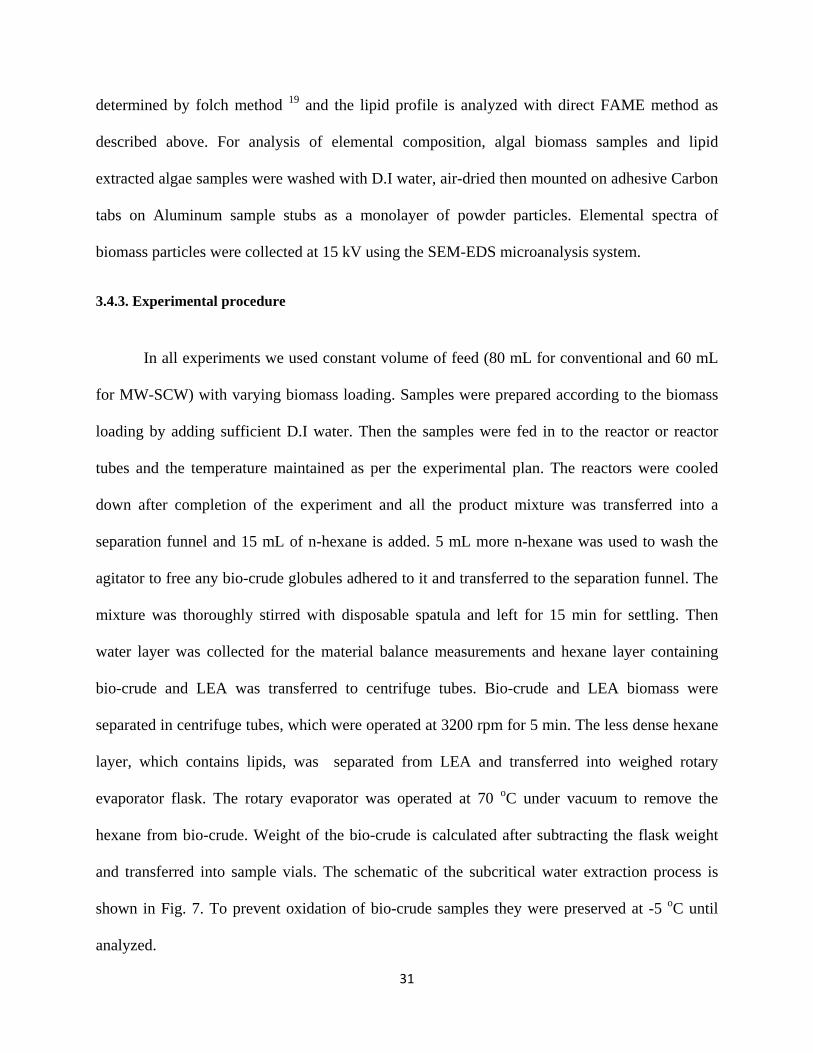
and transferred into sample vials. The schematic of the subcritical water extraction process is
shown in Fig. 7. To prevent oxidation of bio-crude samples they were preserved at -5 oC until
analyzed.
32
Figure 7: Process protocol of subcritical water extraction from wet algal biomass
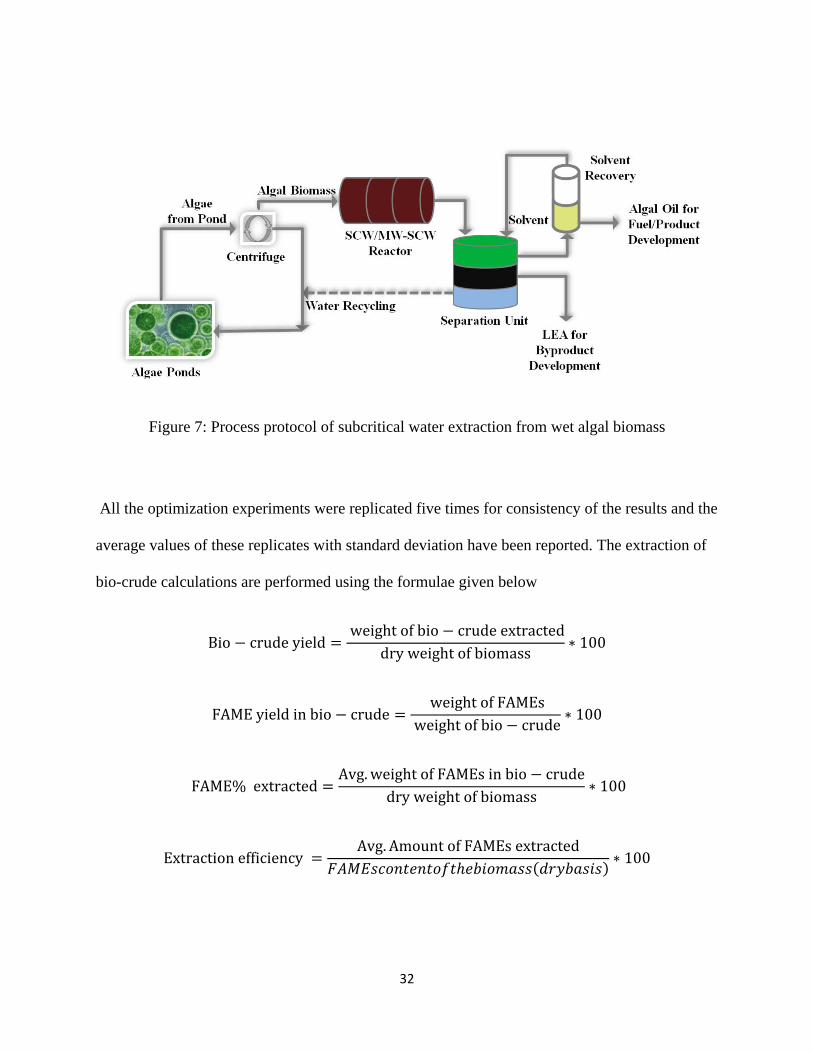
All the optimization experiments were replicated five times for consistency of the results and the
average values of these replicates with standard deviation have been reported. The extraction of
bio-crude calculations are performed using the formulae given below
Bio crudeyieldweightofbio crudeextracted
dryweightofbiomass∗ 100
FAMEyieldinbio crudeweightofFAMEs
weightofbio crude∗ 100
FAME%extractedAvg.weightofFAMEsinbio crude
dryweightofbiomass∗ 100
ExtractionefficiencyAvg. AmountofFAMEsextracted
∗ 100
33
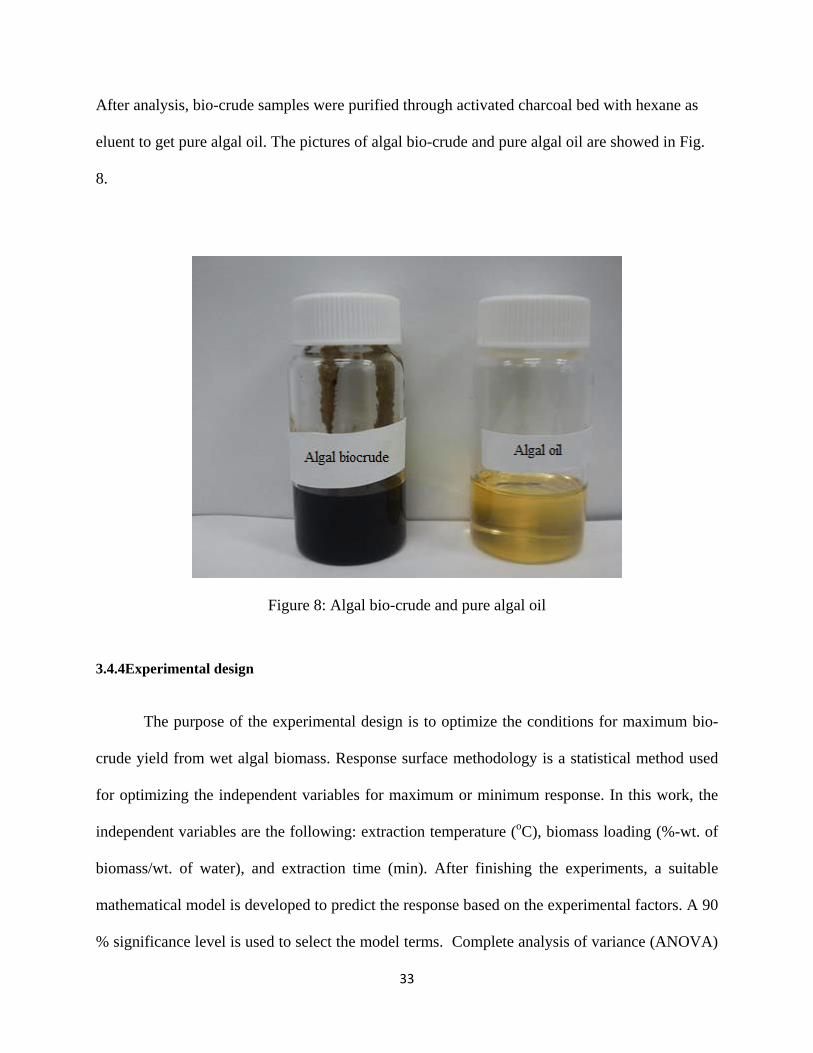
After analysis, bio-crude samples were purified through activated charcoal bed with hexane as
eluent to get pure algal oil. The pictures of algal bio-crude and pure algal oil are showed in Fig.
8.
Figure 8: Algal bio-crude and pure algal oil
3.4.4Experimental design
The purpose of the experimental design is to optimize the conditions for maximum bio-
crude yield from wet algal biomass. Response surface methodology is a statistical method used
for optimizing the independent variables for maximum or minimum response. In this work, the
independent variables are the following: extraction temperature (oC), biomass loading (%-wt. of
biomass/wt. of water), and extraction time (min). After finishing the experiments, a suitable
mathematical model is developed to predict the response based on the experimental factors. A 90
% significance level is used to select the model terms. Complete analysis of variance (ANOVA)
34
is done using Minitab v16.1.0 and the contour plots explaining the response surface were
obtained using Matlab v7.12.0.635 (R2011a).
There is no extraction achieved at temperatures below 160 oC. The bio-crude yield
increases as the temperature is increased to 240 oC, but by-products start degrading to
undesirable compounds in the extracted bio-crude. Hence a temperature range between 160 oC
and 240 oC is used to for optimizing the sub-critical water extraction process. Due to limitations
in operating conditions of the microwave, the microwave assisted subcritical water experiments
are conducted between the temperature range 160 oC and 220 oC. Preliminary studies indicated
that maximum bio-crude yield is achieved during an extraction time from 15 to 30 min.
Circumscribed central composite design is used to design the experiments between the
experimental factors such as extraction temperature, extraction time, and biomass loading at
three levels namely; low (-1), central (0), and high (1). This type of central composite design
uses points outside the design space (-1.68, 1.68 levels) which provide a good estimate over the
entire design space. There are a total of 20 experiments as shown in Table 3for conventional sub-
critical water extraction and in Table 4, 16 experiments for microwave assisted sub-critical water
extraction, which are completely randomized to eliminate any systematic errors.
35
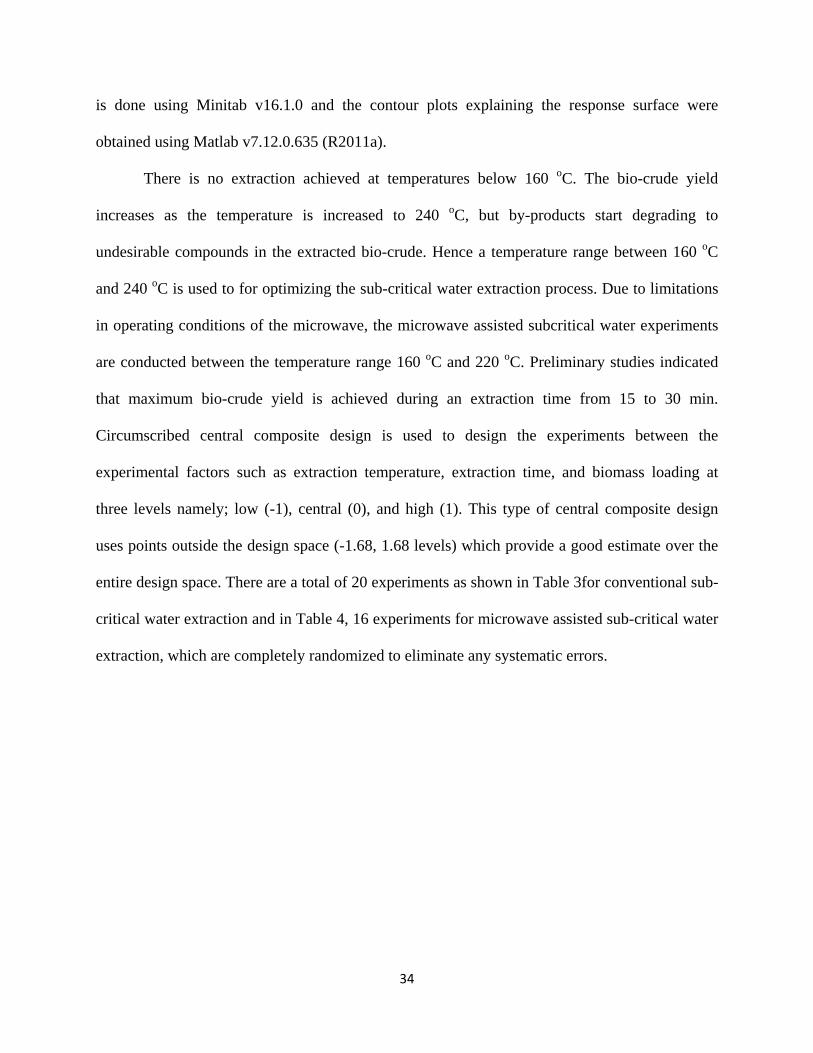
Table 3: Experimental design and results of conventional heating subcritical water extraction
Conventional heating subcritical water extraction
Exp.
run Temp
Extraction Time
(min.) Biomass loading
yield (%) of bio
crude(dry wt. basis)
1 215.00 9.89 7.50 45.84
2 180.00 30.00 5.00 42.44
3 215.00 22.50 7.50 49.82
4 273.86 22.50 7.50 39.70
5 215.00 22.50 7.50 46.21
6 180.00 15.00 5.00 33.60
7 250.00 15.00 5.00 41.08
8 180.00 15.00 10.00 38.56
9 215.00 22.50 11.70 42.85
10 215.00 22.50 3.30 54.96
11 156.14 22.50 7.50 3.95
12 180.00 30.00 10.00 36.65
13 215.00 22.50 7.50 45.06
14 250.00 30.00 10.00 42.04
15 215.00 22.50 7.50 45.90
16 215.00 22.50 7.50 42.42
17 215.00 22.50 7.50 49.50
18 250.00 15.00 10.00 44.10
19 250.00 30.00 5.00 43.92
20 215.00 35.11 7.50 47.04
36
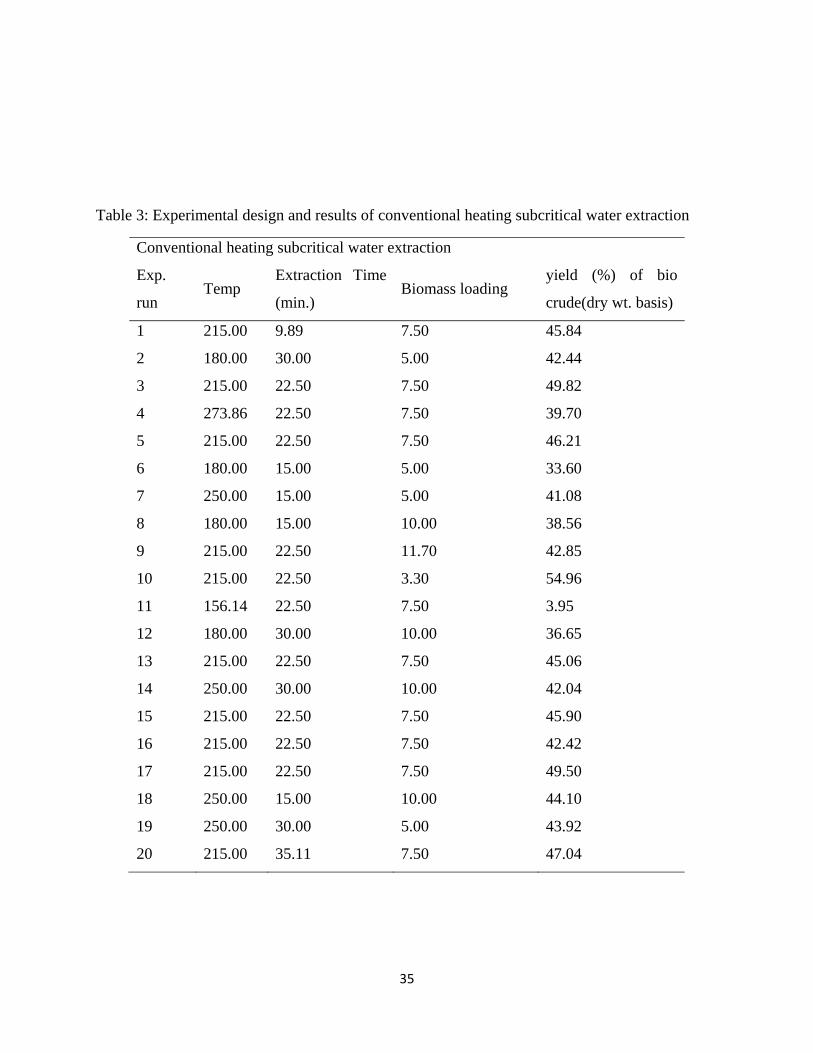
Table 4: Experimental design and results of conventional heating subcritical water extraction
Microwave assisted subcritical water extraction
Exp.
run Temp
Extraction Time
(min.) Biomass loading
yield (%) of bio
crude(dry wt. basis)
1 185.00 10.00 30.00 22.51
2 185.00 20.00 10.00 23.68
3 167.50 10.00 30.00 24.07
4 168.00 20.00 30.00 25.71
5 185.00 30.00 10.00 25.87
6 220.00 10.00 20.00 26.58
7 220.00 10.00 30.00 27.71
8 168.00 30.00 30.00 29.60
9 185.00 30.00 20.00 34.36
10 220.00 30.00 20.00 34.78
11 185.00 20.00 20.00 36.35
12 185.00 30.00 30.00 36.84
13 220.00 30.00 30.00 38.17
14 185.00 20.00 30.00 39.05
15 220.00 20.00 20.00 39.37
16 220.00 20.00 30.00 39.51
3.5Results and discussion
Subcritical water extraction of bio-crude from wet algal biomass
Both SCW and MW-SCW have been carried out according to the design of experiments
and process parameters were optimized for maximum bio-crude extraction. The optimized
37
process parameters have been taken as standard process parameters for the final experiments and
the extraction results have been compared to the conventional solvent extraction method i.e.,
Folch extraction.
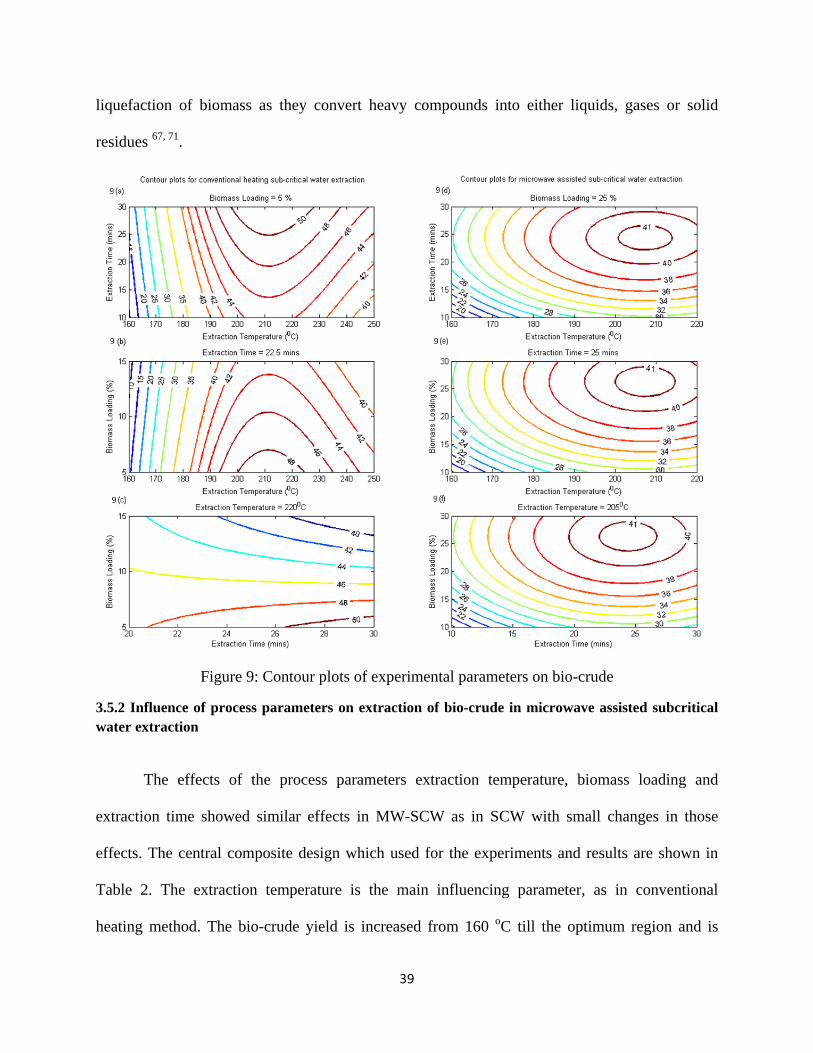
3.5.1 Influence of process parameters on extraction of bio-crude in conventional heating subcritical water extraction
Based on the preliminary experimental results, a central composite design and results as
shown in Table 1 is used to study the effect of extraction temperature (156 oC -250 oC),
extraction time (10-35 min.), and biomass loading (3-11.7%) on bio-crude yield and to optimize
the extraction parameters. The contour plots of results shown in Fig. 9 demonstrate the influence
of the parameters. Extraction temperature is the major influencing factor on bio-crude extraction,
which varies the polarity of the water 46, 67. Fig. 9a shows that extraction yield is increased with
increase in the temperature until it crosses the optimum region border and this is attributed to the
decreased polarity of water. The decreased polarity of water at this temperature is caused by
breaking of hydrogen bonds between water molecules which increases the miscibility between
lipids and water 53. This property of water also makes the separation very easy when the process
temperatures are reduced to room temperature. The yield of bio-crude is decreased beyond the
optimum region with increase in temperature. Hydrolysis is predominant reaction in this region
of temperature, and we want to extract neutral lipids in their original form, so we chose the lower
temperature 220 oC as optimum temperature. Hydrolysis of polysaccharides and cellulose
compounds is reported in this same range which forms small water soluble compounds and
further increase in temperature beyond 260 oC causes repolymerization reaction of these water
soluble compounds to form oil products, which increases the bio-oil yield 68. Similar behavior is
reported by Zhou et al., 69 in hydrothermal liquefaction of macroalgae Enteromorpha prolifera to
38
bio-oil, who obtained nearly 22 % of bio-oil yield at 300 oC. Hydrolysis of TAG’s is observed at
240 oC in preliminary experiments with FT-ICR analysis (data not shown). To preserve any
valuable co-products such as poly unsaturated fatty acids, proteins, and other nutrients, no
experiments were performed above 260 oC. The degradation of polyunsaturated fatty acids is
observed in TGA analysis and will be discussed in that section. The systematic optimization of
temperature range is established for the extraction of neutral lipids with this design, which is
necessary for the extraction of respective class of compounds 70. Many researchers performed the
hydrothermal liquefaction of micro algae 71, 72; however biomass loading has not been studied
extensively. But dewatering is also an energy intensive step in algal biofuels production 13,
therefore we examined the biomass loading as a parameter. In the present work we found that the
biomass loading is the second major influencing parameter in subcritical water extraction
process. Fig. 9b shows the effect of biomass loading on the extraction of bio-crude yield. The
extraction of bio-crude is increased with decreasing biomass loading and reached maximum at 5
% of biomass loading. The lesser biomass loading or higher solvent ratios, i.e., water ratios
increases the liquid yields possibly because of the denser solvent environment 67. However, we
chose the biomass loading as 7.5 % as lower biomass loading may need excessive amounts of
heat energy for the extraction process. Extraction time is next influential parameter on extraction
of bio-crude. The yield of bio-crude was increased from start of the extraction process and
reached maximum around 30 min and the effect of extraction time on bio-crude yield is shown in
Fig. 9c. Even though 25 min. of extraction time is chosen as optimum time for extraction,
extended extraction times may cause a decrease in the bio-oil yield as the secondary and tertiary
reactions like hydrolysis and repolymerization are always crucial factors in hydrothermal
39
liquefaction of biomass as they convert heavy compounds into either liquids, gases or solid
residues 67, 71.
Figure 9: Contour plots of experimental parameters on bio-crude
3.5.2 Influence of process parameters on extraction of bio-crude in microwave assisted subcritical water extraction
The effects of the process parameters extraction temperature, biomass loading and
extraction time showed similar effects in MW-SCW as in SCW with small changes in those
effects. The central composite design which used for the experiments and results are shown in
Table 2. The extraction temperature is the main influencing parameter, as in conventional
heating method. The bio-crude yield is increased from 160 oC till the optimum region and is
40
shown in Fig. 9d. Similar kind of results are reported by Shuntaro 65 et al., the extraction of
phenolic compounds is increased with increase in temperature. The decrease in dielectric
constant or decreased polarity is caused by the breaking of hydrogen bonds between water
molecules at higher temperatures which increases solubility of lipids in water 53. In microwave
assisted heating method the heat and mass transfers occurs in the same direction, i.e., from the
sample to the solvent medium, but in conventional heating the heat energy is transferred from
medium to the sample biomass and mass transfer occurs from sample biomass cells to outside
medium. The heat transfer mechanism in conventional heating depends on the thermal
conductivity of the sample and solvent, convective currents make it a slow process, where in
microwave heating due to the volumetric heating the heat transfer process is very fast and rapid
62. The following influencing parameter after temperature is biomass loading. Differing with the
conventional heating method in microwave heating method the yield of bio-crude is increased
with increasing biomass loading from lower amounts. Contour plot showed in Fig. 9e revealed
that the optimum extraction is achieved at 25 – 29 % biomass loading and 25 % is chosen as
optimum value. The higher amount of solvent may decrease the extraction yields, because of the
less stirring of the solvent by microwaves 59. The higher solvent volumes decreases the
probability of penetrating microwaves through the biomass may also the reason for the decrease
in extraction yields at lower biomass loading. Extraction time is the next influencing parameter
on the bio-crude extraction. Fig. 9f shows that the bio-crude yields are increased with an increase
in time through the optimum region, but further increase in extraction time decreased the bio-
crude yield. Similar results are reported in the extraction of pesticides in water 73 and in the
extraction of extraction of zearalenone from wheat and corn 74. The degradation of thermo labile
compounds might be reason behind the decrease of the extraction yields59. As discussed in
41
conventional heating method the secondary and tertiary reactions seems to be another reason for
the decrease in bio-crude yield at prolonged extraction times. Even with 25 min. of extraction
time the more amounts of water soluble compounds are extracted from the algae in microwave
assisted subcritical water extraction and will be discussed in next section.
3.6Extraction efficiency and material balance
3.6.1 Extraction efficiency
This research was intended to achieve maximum extraction of neutral lipids with less
energy spending for extraction. For that, we compared our subcritical water extraction methods
to established Folch extraction method in terms of their extraction efficiencies based on the total
FAME content of a direct transesterfication of the algal biomass. All the experimental results at
this stage are an average of five replicates data of same conditions. Both the C-SCW and MW-
SCW extractions displayed higher bio-crude yield (as determined by FAME quantitation and
gravimetric measurement) than the Folch extraction method. Among the three methods, the MW-
SCW method extracted more bio-crude and maximum FAME content than the other methods.
The conventional SCW extraction is able to extract nearly 70 % of the FAME content from the
wet algal biomass. The extraction results obtained in two methods are presented in Table 5.
42
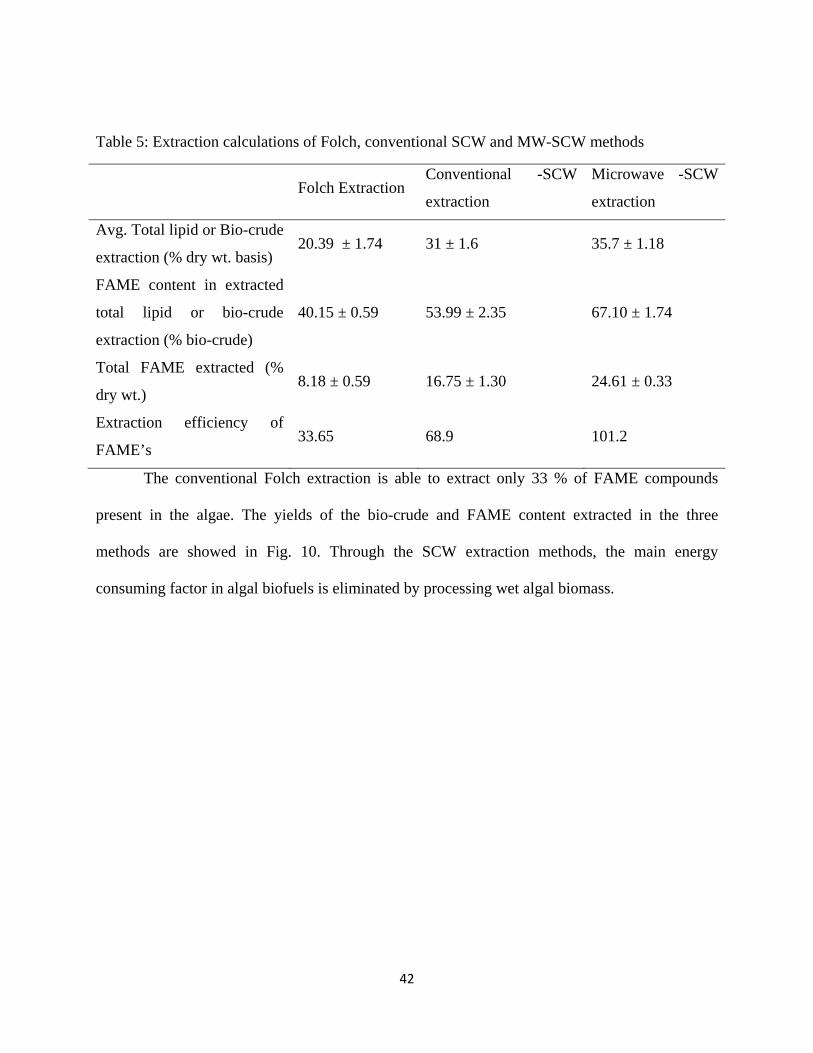
Table 5: Extraction calculations of Folch, conventional SCW and MW-SCW methods
Folch Extraction Conventional -SCW
extraction
Microwave -SCW
extraction
Avg. Total lipid or Bio-crude
extraction (% dry wt. basis) 20.39 ± 1.74 31 ± 1.6 35.7 ± 1.18
FAME content in extracted
total lipid or bio-crude
extraction (% bio-crude)
40.15 ± 0.59 53.99 ± 2.35 67.10 ± 1.74
Total FAME extracted (%
dry wt.) 8.18 ± 0.59 16.75 ± 1.30 24.61 ± 0.33
Extraction efficiency of
FAME’s 33.65 68.9 101.2
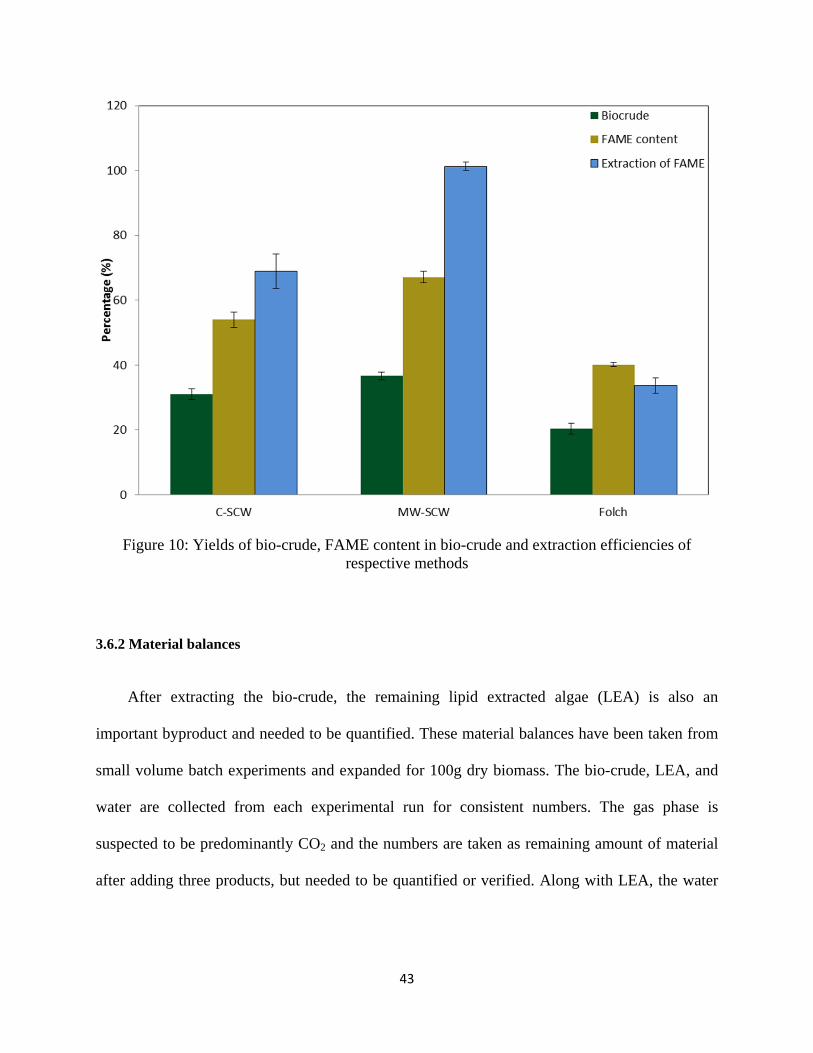
The conventional Folch extraction is able to extract only 33 % of FAME compounds
present in the algae. The yields of the bio-crude and FAME content extracted in the three
methods are showed in Fig. 10. Through the SCW extraction methods, the main energy
consuming factor in algal biofuels is eliminated by processing wet algal biomass.
43
Figure 10: Yields of bio-crude, FAME content in bio-crude and extraction efficiencies of respective methods
3.6.2 Material balances
After extracting the bio-crude, the remaining lipid extracted algae (LEA) is also an
important byproduct and needed to be quantified. These material balances have been taken from
small volume batch experiments and expanded for 100g dry biomass. The bio-crude, LEA, and
water are collected from each experimental run for consistent numbers. The gas phase is
suspected to be predominantly CO2 and the numbers are taken as remaining amount of material
after adding three products, but needed to be quantified or verified. Along with LEA, the water
44
soluble compounds also form considerable amounts of mass in the process. The material
balances of the sub critical extraction through two methods are tabulated in Table 6.
Table 6: Material balances of Conventional SCW and MW-SCW methods
Bio-crude
(g) LEA (g)
Water soluble
compounds
(g)
Gaseous
products
(g)
Calorific
value
(MJ/Kg)
Crude
protein %
C-SCW 31 ± 1.6 27 ± 1.3 39 ± 0.9 2.83 ± 1.3 24.94 45.6
MW-SCW 35.7 ± 1.18 12 ± 1.1 51.2 ± 1.7 0.2 ± 1.2 21.9 28.5
The amount of LEA and water soluble compounds greatly varied in two methods. In both
methods, the water soluble compounds are extracted more than the bio-crude, but these numbers
have quite big difference. As shown in the table in conventional heating method more LEA
biomass is retained compared to the MW-SCW method. This could be a result implicated from
the direct heating of the biomass through the water medium in the later method; the reaction
temperature is achieved by microwave heating. In an opposite manner, more water soluble
compounds are extracted in MW-SCW than conventional heating method. The preliminary
nutrient analysis and calorific values of LEA also proves that MW-SCW has extracted most of
the compounds both in bio-crude and water phase. The residual water seems to be containing
more compounds, and will be studied in future work.
3.7Biomass and bio-crude analysis
3.7.1 Biomass characterization
The freshly harvested N. salina from photo bioreactors has been analyzed for its fatty
acid profile by direct FAME method described in the analytical methods section. The major fatty
acids detected are hexadecanoic acid, C16:0 (29.71 %); hexadecenoic acid, C16:1n7 (41.91 %);
45
cis-9-Octadecanoic acid, C18:1n9c (9.9 %); cis-5,8,11,14,17-Eicosapentenoic acid, C20:5n3
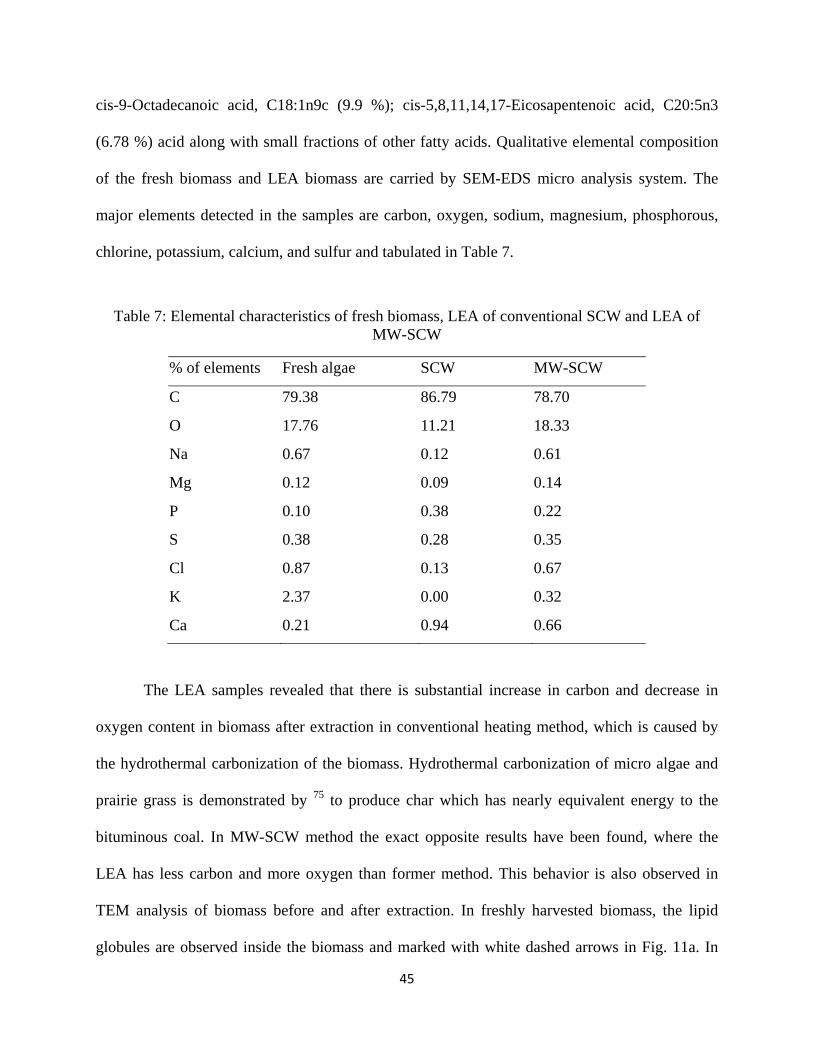
(6.78 %) acid along with small fractions of other fatty acids. Qualitative elemental composition
of the fresh biomass and LEA biomass are carried by SEM-EDS micro analysis system. The
major elements detected in the samples are carbon, oxygen, sodium, magnesium, phosphorous,
chlorine, potassium, calcium, and sulfur and tabulated in Table 7.
Table 7: Elemental characteristics of fresh biomass, LEA of conventional SCW and LEA of MW-SCW
% of elements Fresh algae SCW MW-SCW
C 79.38 86.79 78.70
O 17.76 11.21 18.33
Na 0.67 0.12 0.61
Mg 0.12 0.09 0.14
P 0.10 0.38 0.22
S 0.38 0.28 0.35
Cl 0.87 0.13 0.67
K 2.37 0.00 0.32
Ca 0.21 0.94 0.66
The LEA samples revealed that there is substantial increase in carbon and decrease in
oxygen content in biomass after extraction in conventional heating method, which is caused by
the hydrothermal carbonization of the biomass. Hydrothermal carbonization of micro algae and
prairie grass is demonstrated by 75 to produce char which has nearly equivalent energy to the
bituminous coal. In MW-SCW method the exact opposite results have been found, where the
LEA has less carbon and more oxygen than former method. This behavior is also observed in
TEM analysis of biomass before and after extraction. In freshly harvested biomass, the lipid
globules are observed inside the biomass and marked with white dashed arrows in Fig. 11a. In
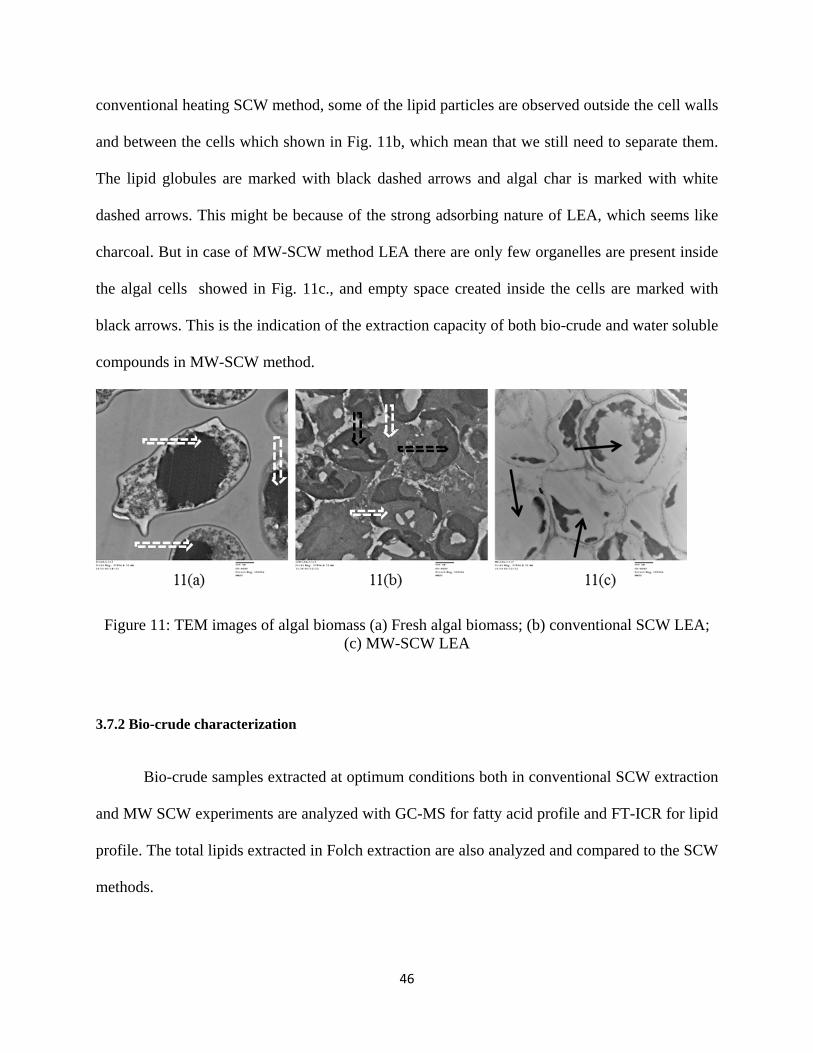
46
conventional heating SCW method, some of the lipid particles are observed outside the cell walls
and between the cells which shown in Fig. 11b, which mean that we still need to separate them.
The lipid globules are marked with black dashed arrows and algal char is marked with white
dashed arrows. This might be because of the strong adsorbing nature of LEA, which seems like
charcoal. But in case of MW-SCW method LEA there are only few organelles are present inside
the algal cells showed in Fig. 11c., and empty space created inside the cells are marked with
black arrows. This is the indication of the extraction capacity of both bio-crude and water soluble
compounds in MW-SCW method.
Figure 11: TEM images of algal biomass (a) Fresh algal biomass; (b) conventional SCW LEA; (c) MW-SCW LEA
3.7.2 Bio-crude characterization
Bio-crude samples extracted at optimum conditions both in conventional SCW extraction
and MW SCW experiments are analyzed with GC-MS for fatty acid profile and FT-ICR for lipid
profile. The total lipids extracted in Folch extraction are also analyzed and compared to the SCW
methods.
47
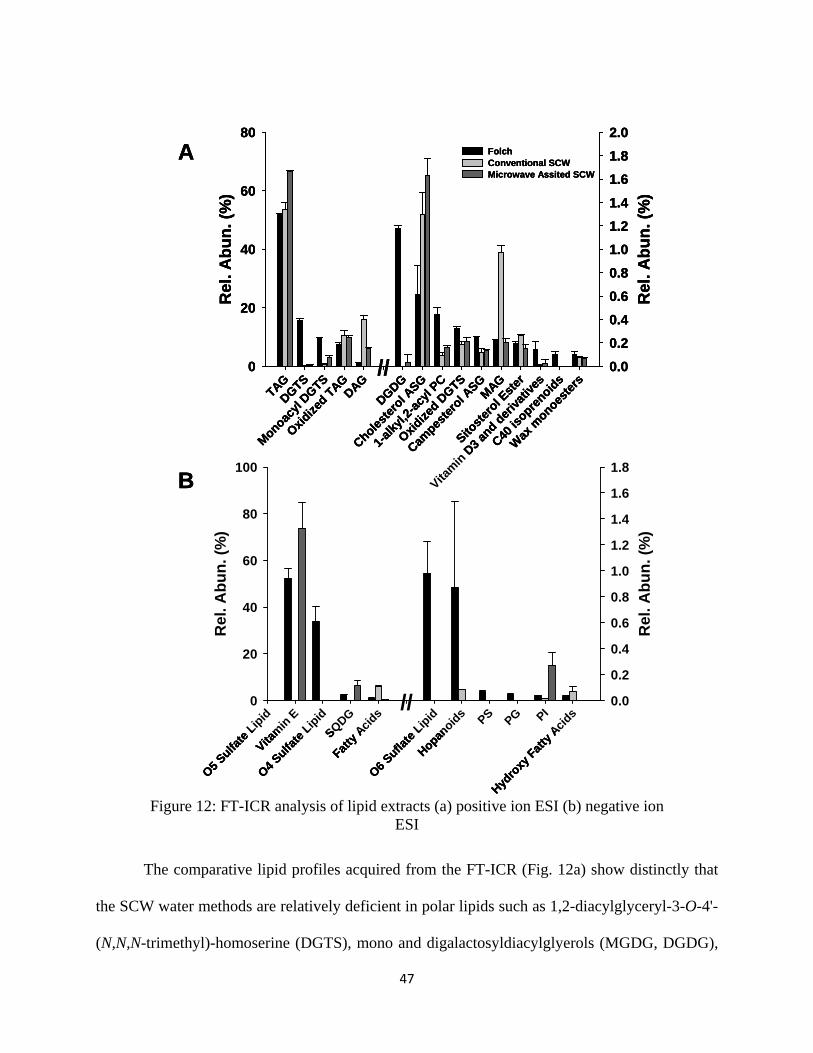
The comparative lipid profiles acquired from the FT-ICR (Fig. 12a) show distinctly that
the SCW water methods are relatively deficient in polar lipids such as 1,2-diacylglyceryl-3-O-4'-
(N,N,N-trimethyl)-homoserine (DGTS), mono and digalactosyldiacylglyerols (MGDG, DGDG),
O5 Sulfa
te L
ipid
Vitam
in E
O4 Sulfa
te L
ipid
SQDG
Fatty
Aci
ds
O6 Sufla
te L
ipid
Hopanoid
s PS PG PI
Hydro
xy F
atty
Aci
ds
Rel
. Ab
un
. (%
)
0
20
40
60
80
100
Rel
. Ab
un
. (%
)
0.0
0.2
0.4
0.6
0.8
1.0
1.2
1.4
1.6
1.8
TAG
DGTS
Monoac
yl D
GTS
Oxidize
d TAG
DAG
DGDG
Cholest
erol A
SG
1-al
kyl,2
-acy
l PC
Oxidize
d DGTS
Campes
tero
l ASG
MAG
Sitost
erol E
ster
Vitam
in D
3 an
d der
ivat
ives
C40 is
oprenoid
s
Wax
monoes
ters
Rel
. A
bu
n.
(%)
0
20
40
60
80
Rel
. A
bu
n.
(%)
0.0
0.2
0.4
0.6
0.8
1.0
1.2
1.4
1.6
1.8
2.0FolchConventional SCWMicrowave Assited SCW
A
B
//
//
O5 Sulfa
te L
ipid
Vitam
in E
O4 Sulfa
te L
ipid
SQDG
Fatty
Aci
ds
O6 Sufla
te L
ipid
Hopanoid
s PS PG PI
Hydro
xy F
atty
Aci
ds
Rel
. Ab
un
. (%
)
0
20
40
60
80
100
Rel
. Ab
un
. (%
)
0.0
0.2
0.4
0.6
0.8
1.0
1.2
1.4
1.6
1.8
TAG
DGTS
Monoac
yl D
GTS
Oxidize
d TAG
DAG
DGDG
Cholest
erol A
SG
1-al
kyl,2
-acy
l PC
Oxidize
d DGTS
Campes
tero
l ASG
MAG
Sitost
erol E
ster
Vitam
in D
3 an
d der
ivat
ives
C40 is
oprenoid
s
Wax
monoes
ters
Rel
. A
bu
n.
(%)
0
20
40
60
80
Rel
. A
bu
n.
(%)
0.0
0.2
0.4
0.6
0.8
1.0
1.2
1.4
1.6
1.8
2.0FolchConventional SCWMicrowave Assited SCW
A
B
//
//
Figure 12: FT-ICR analysis of lipid extracts (a) positive ion ESI (b) negative ion ESI
48
phosphotidylcholines (PC), phosphotidylserine (PS) and phosphotidylglycerols (PG). The Folch
extracts show greater diversity of lipid species while both SCW extraction methods indicate an
enrichment of triacylglycerols. The conventional SCW method showed an increase of di- and
monoacylglycerols. The increased ratio of DAG to TAG indicates partial hydrolysis of glycerol
lipid acyl chains under these conditions. The analysis of the negative ion mass spectra supports
the observation of hydrolysis by detection of free fatty acids (Fig 12b).
Both SCW methods also showed an increase in cholesterol acylated sterol glycoside
(ASG) which has been shown to be problematic in biodiesel generated from the incomplete
transesterfication of ASG, as well as sterol glycosides (SG), and sterol esters (SE). The MW-
SCW extraction showed higher amounts of phosphotidylinositiol (PI) and vitamin E than either
the conventional SCW or solvent based Folch extraction. Of interesting note is limited detection
of C40 isoprenoids in the both the MW-SCW and SCW extracts.
3.7.3 Thermal behavior of algal biomass and bio-crude
Thermo gravimetric analysis (TGA) of wet algal biomass, bio-crude and purified algal oil
is performed to analyze the thermal behavior of biomass, bio-crude, and algal oil. The samples
are heated from 25 oC to 950 ºC at a constant heating rate of 10 ºC/min in nitrogen atmosphere
and at a constant purge rate of 20 mL/min at the pan. The linear plots of TGA for wet algal
biomass, bio-crude, and pure algal oil are shown in Fig.13.The biomass has undergone three
phases of weight loss, one between 100 – 140 oC, the second at 250 oC – 300 oC and a third loss
around 350 oC-500 oC. The first shift represents weight loss caused by dehydration of the
biomass sample. Nearly 60-65 % weight is reduced in the first shift of physical change
representing evaporation of water content in the sample. Similar trends were observed with other
species of algae where these changes were reported in the same temperature ranges 42. The
49
second and third weight shifts are attributed to losses of organic compounds and decomposition
of the algal biomass 43respectively.
Figure 13: TGA plots of wet algal biomass, bio-crude, and pure algal oil
Apart from biomass, the bio-crude missed the first shift of weight loss and doesn’t have
any incombustible material as it is has only extracted compounds. The last and third plot of pure
algal oil is similar to regular vegetable oils and only difference is small weight loss between 250
oC – 300 oC. The thermal behavior of pure algal oil is very close to the camelina oil 76 and
matched with crude algal lipids77. As mentioned earlier, the polyunsaturated fatty acids present
in the algal biomass are degrading in this range and it can be observed in all three samples. The
dotted circle shows this phenomenon in algal biomass, bio-crude and in pure algal oil and can be
attributed to degradation of polyunsaturated fatty acids in the samples41.
50
3.8Development of byproducts
As discussed earlier, the development of valuable byproducts is necessary for the
sustainable production of algal biofuels. One valuable byproduct is eicosapentaenoic acid (EPA),
which is an omega-3 fatty acid with medicinal applications like treatment of certain coronary
heart disease, blood platelet aggregation, and abnormal cholesterol levels 78. In our conventional
heating SCW process, the EPA is in the form of free fatty acids which can be easily separated
before the conversion of algal oil into fuels. The LEA nearly has 23.4% of FAME content after
extraction and 45.6% of crude protein in conventional heated SCW. This high amount of FAME
content should be separated to produce more oil which increases the overall extraction
efficiency. The LEA produced from MW-SCW has 28.5% crude protein. The LEA has very
high amounts of crude protein after extraction, which makes it a good animal feed source.
Otherwise, the recoverable protein can be extracted for commercial human food applications as
per the demand. The LEA can also be fired along with coal in power generation because of their
higher calorific values. The gasification of the LEA could be used to make syngas, which can be
further converted into valuable industrial chemical products 79. The other applications are water
purification 80 and soil remediation 81.
Last but not the least the residual water, which contains hydrolyzed organic compounds,
should be analyzed for potential applications and needs to be analyzed thoroughly. Our future
research will also be directed towards the analysis of residual water and its potential applications.
51
3.9 Conclusions
Extraction of oils from algal biomass is the most energy intensive step in algal biofuels
production making it “Achilles heel” of the algal biofuel production. In this work, we
demonstrated an ecofriendly green extraction process through two methods of heating and
achieved maximum efficiencies. The results achieved in this process are far superior to the
conventional solvent extraction and the process is energy efficient as wet algae has been used as
feedstock. This process is a potential alternative for the present industrial scale extraction
methods, particularly for algal oil extraction. The process parameters are not high compared to
many green extraction processes and could be easily developed into a continuous flow process.
The conventional heating subcritical extraction process can be easily established with present
technology available. MW-SCW is also more energy efficient than conventional heating method
and the technology should be developed to launch this kind of extraction plant at industrial scale.
Along with the algal oil, various byproducts and their applications have been identified.
52
IV Future work
4.1 Hydrothermal liquefaction (HTL) – Literature
In our prior work we demonstrated the extraction of neutral lipids from wet algal biomass
“Nannochloropsis Salina”using subcritical water (or) mild hydrothermal liquefaction (HTL)
conditions. As we should note, the optimized extraction conditions may be applicable only for
this species. As per US DoE, there are 300 suitable species which were identified over a period
of time out of 3000 strains for biofuel production. Each and every species will have their unique
physical and biochemical properties, which are also depends on the cultivating and harvesting
conditions82. In general the major compounds found in the biomass are carbohydrates, lignin,
protein and lipids in different proportions depending on type and species of particular biomass83.
The oxygen present in the biomass is removed by dehydration, where oxygen is removed in the
form of water, and by decarboxylation, 83which removes oxygen in the form of carbon dioxide53.
The degradation of basic chemical compounds in hydrothermal media yields bio-oil or bio-crude
and differs with process conditions. The cleavage of bonds occurs at high temperatures to
fragment the basic compounds and reactions like hydrolysis, repolymerization controls the bio-
oil yield depending on the process conditions56, 67. There are few literary works, which were
published by the researchers in the field of hydrothermal liquefaction of algal biomass. Brown et
al., demonstrated the hydrothermal liquefaction and gasification of Nannochloropsis sp. to
produce bio-oil and gaseous products72. They varied the temperature of the process from 200oC
to 500oC and noted down the bio oil yields. These results have been shown in table 8, along with
the theoretical high heating values calculated on the basis of Dulong formula with elemental
analysis.
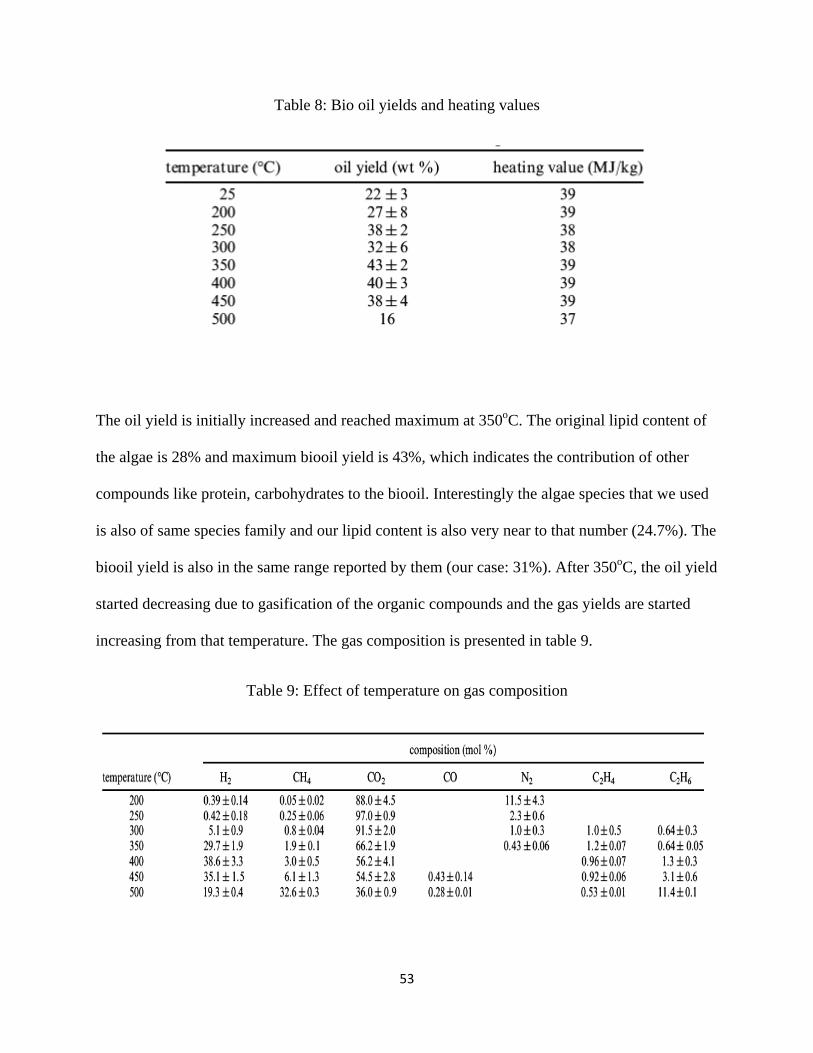
53
Table 8: Bio oil yields and heating values
The oil yield is initially increased and reached maximum at 350oC. The original lipid content of
the algae is 28% and maximum biooil yield is 43%, which indicates the contribution of other
compounds like protein, carbohydrates to the biooil. Interestingly the algae species that we used
is also of same species family and our lipid content is also very near to that number (24.7%). The
biooil yield is also in the same range reported by them (our case: 31%). After 350oC, the oil yield
started decreasing due to gasification of the organic compounds and the gas yields are started
increasing from that temperature. The gas composition is presented in table 9.
Table 9: Effect of temperature on gas composition
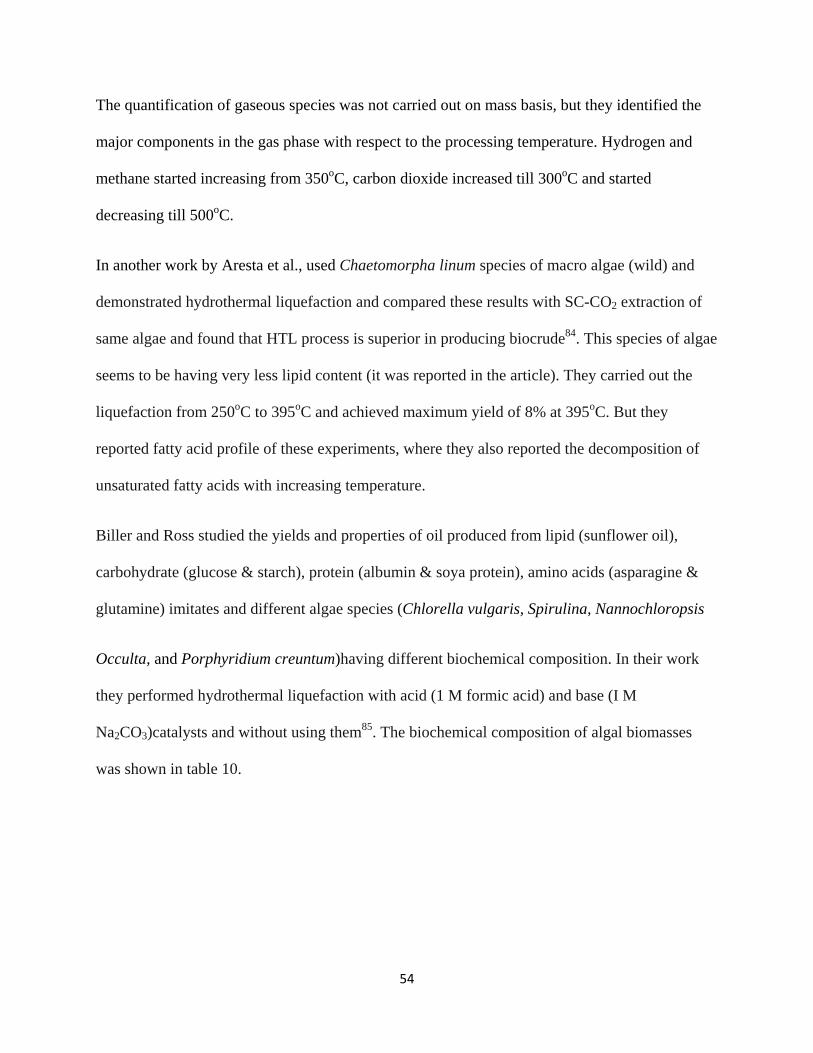
54
The quantification of gaseous species was not carried out on mass basis, but they identified the
major components in the gas phase with respect to the processing temperature. Hydrogen and
methane started increasing from 350oC, carbon dioxide increased till 300oC and started
decreasing till 500oC.
In another work by Aresta et al., used Chaetomorpha linum species of macro algae (wild) and
demonstrated hydrothermal liquefaction and compared these results with SC-CO2 extraction of
same algae and found that HTL process is superior in producing biocrude84. This species of algae
seems to be having very less lipid content (it was reported in the article). They carried out the
liquefaction from 250oC to 395oC and achieved maximum yield of 8% at 395oC. But they
reported fatty acid profile of these experiments, where they also reported the decomposition of
unsaturated fatty acids with increasing temperature.
Biller and Ross studied the yields and properties of oil produced from lipid (sunflower oil),
carbohydrate (glucose & starch), protein (albumin & soya protein), amino acids (asparagine &
glutamine) imitates and different algae species (Chlorella vulgaris, Spirulina, Nannochloropsis
Occulta, and Porphyridium creuntum)having different biochemical composition. In their work
they performed hydrothermal liquefaction with acid (1 M formic acid) and base (I M
Na2CO3)catalysts and without using them85. The biochemical composition of algal biomasses
was shown in table 10.
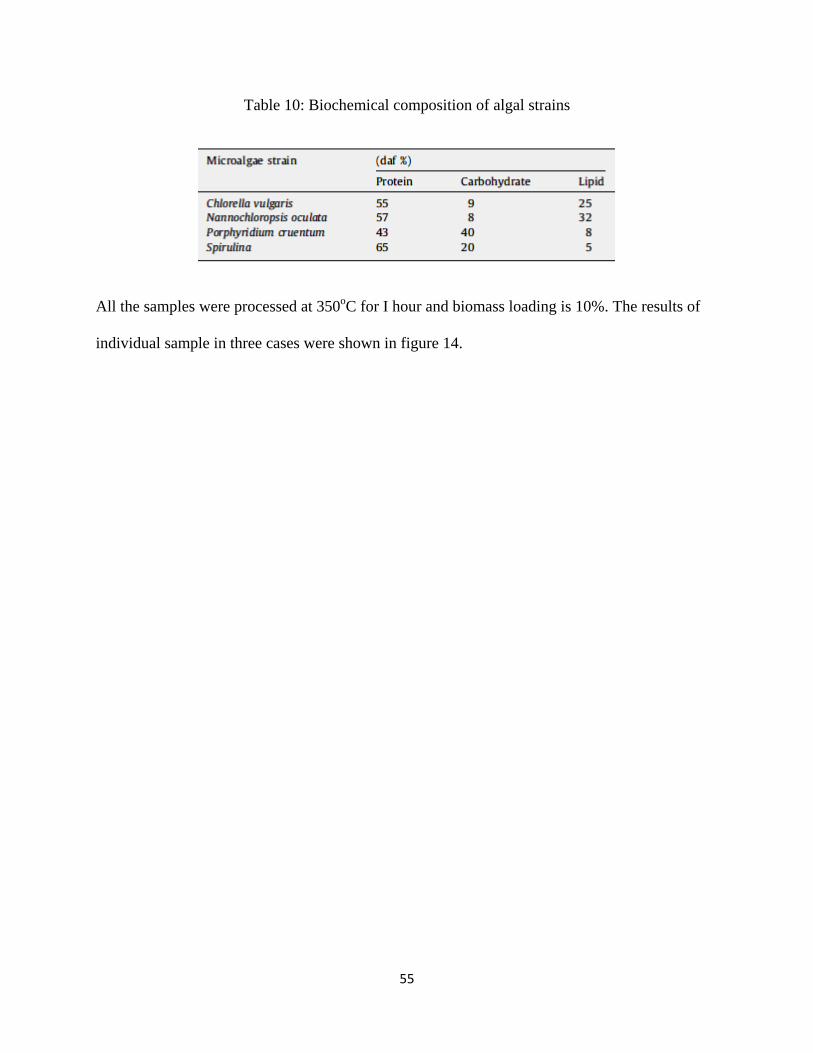
55
Table 10: Biochemical composition of algal strains
All the samples were processed at 350oC for I hour and biomass loading is 10%. The results of
individual sample in three cases were shown in figure 14.
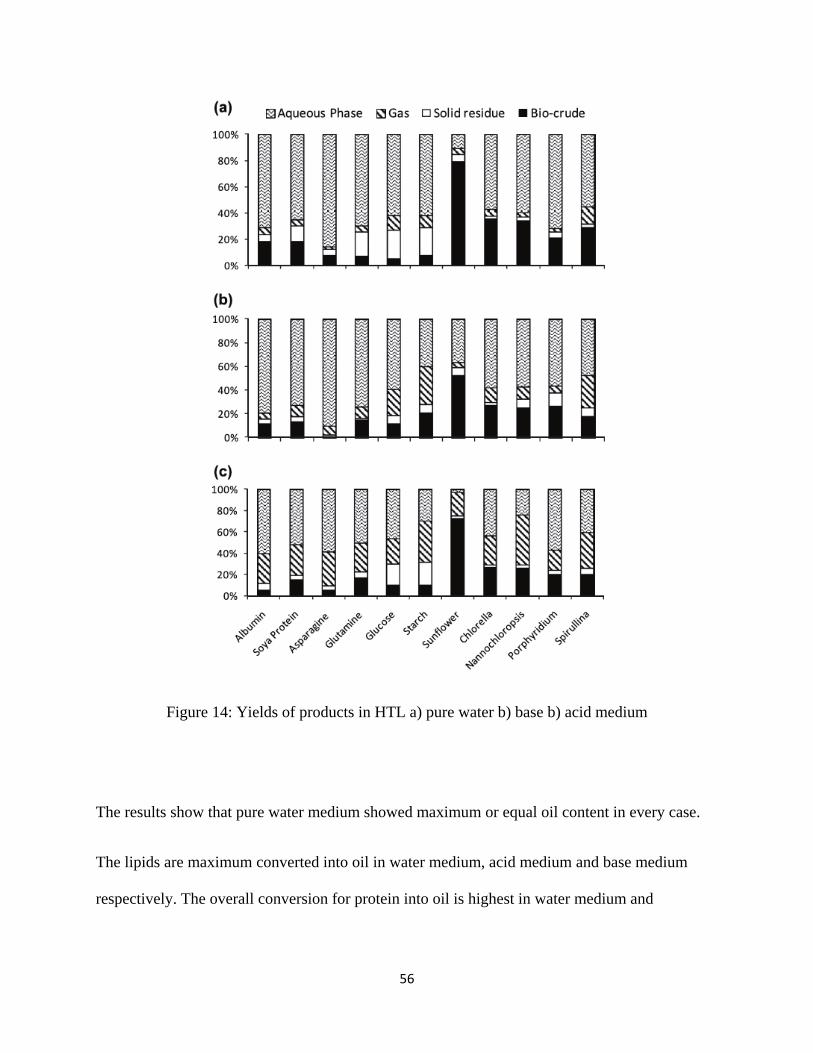
56
Figure 14: Yields of products in HTL a) pure water b) base b) acid medium
The results show that pure water medium showed maximum or equal oil content in every case.
The lipids are maximum converted into oil in water medium, acid medium and base medium
respectively. The overall conversion for protein into oil is highest in water medium and
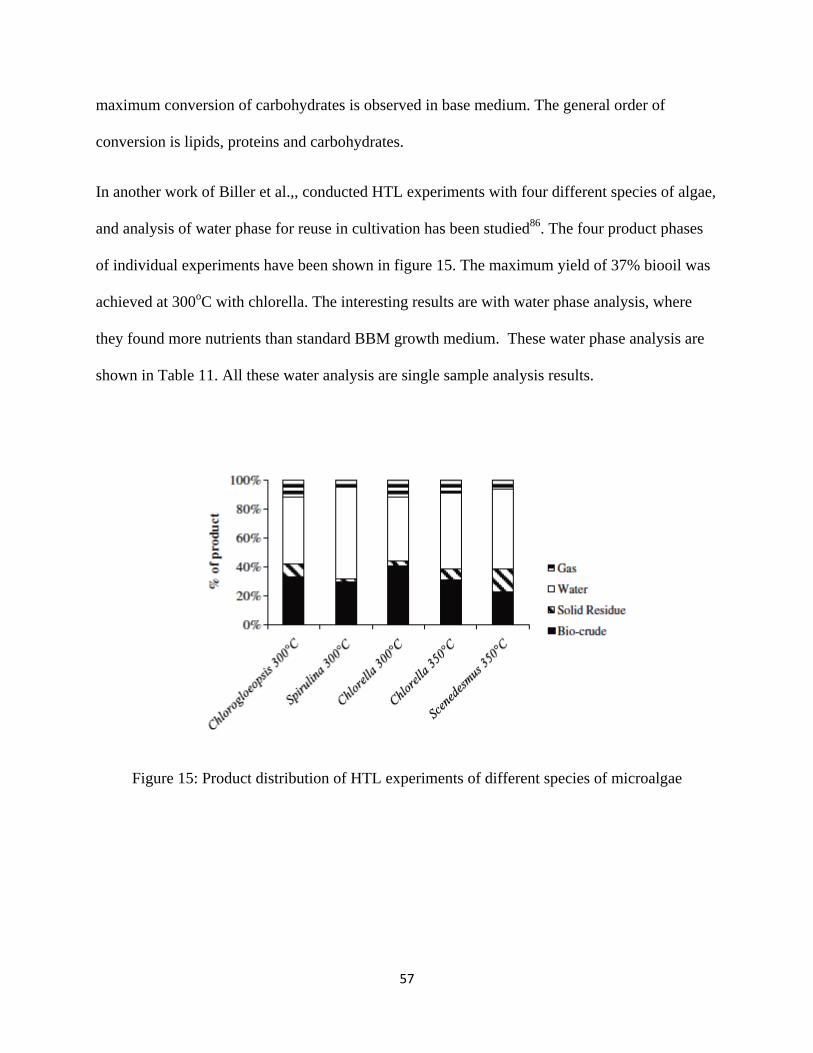
57
maximum conversion of carbohydrates is observed in base medium. The general order of
conversion is lipids, proteins and carbohydrates.
In another work of Biller et al.,, conducted HTL experiments with four different species of algae,
and analysis of water phase for reuse in cultivation has been studied86. The four product phases
of individual experiments have been shown in figure 15. The maximum yield of 37% biooil was
achieved at 300oC with chlorella. The interesting results are with water phase analysis, where
they found more nutrients than standard BBM growth medium. These water phase analysis are
shown in Table 11. All these water analysis are single sample analysis results.
Figure 15: Product distribution of HTL experiments of different species of microalgae
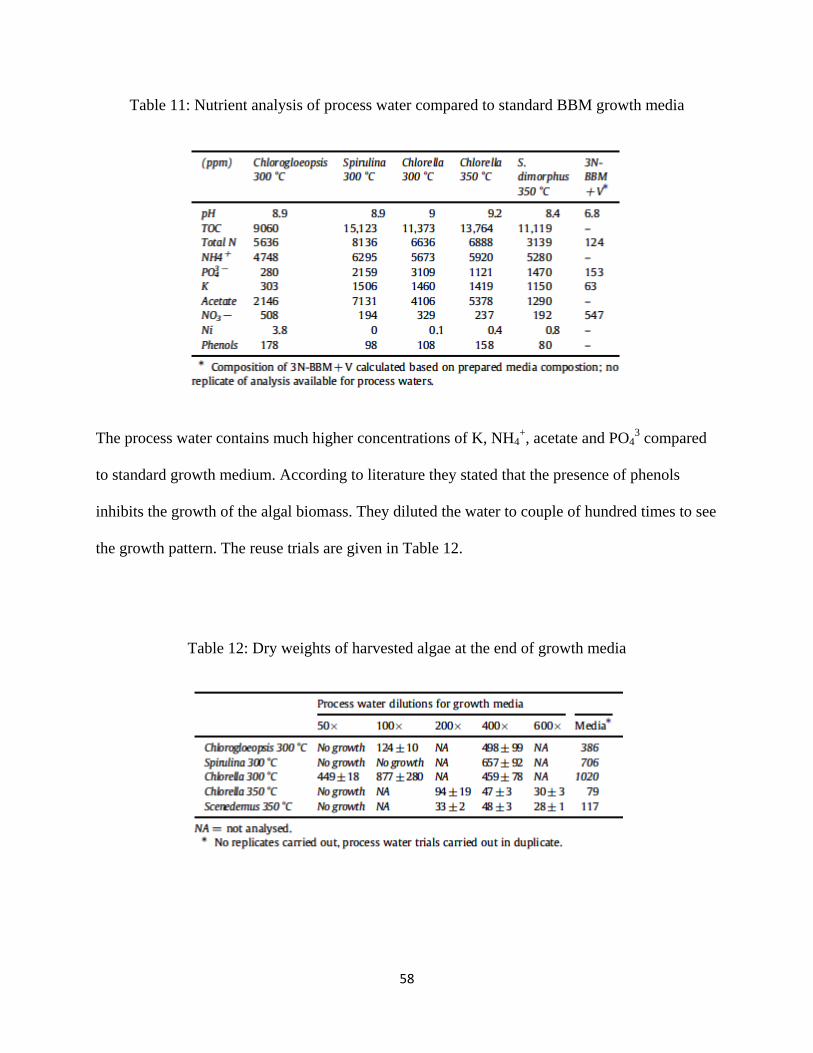
58
Table 11: Nutrient analysis of process water compared to standard BBM growth media
The process water contains much higher concentrations of K, NH4+, acetate and PO4
3 compared
to standard growth medium. According to literature they stated that the presence of phenols
inhibits the growth of the algal biomass. They diluted the water to couple of hundred times to see
the growth pattern. The reuse trials are given in Table 12.
Table 12: Dry weights of harvested algae at the end of growth media
59
All the literature cited above have showed us a nice path to follow for HTL of algae. But all the
articles are having some lapses like, single species study, or single temperature study etc., Based
on this literature we have planned our experiments to cover these lapses.
4.2 Objective 1 & Research Approaches
1. Conduction of HTL experiments from 180 – 320oC with 25oC interval of 4 species at
least. The liquefaction time is fixed at 1 hour.
2. Analysis of biocrude extracted in HTL experiments
a. FAME analysis for fatty acid profile
b. GC-MS analysis for identifying other hydrocarbon products
c. FT-ICR analysis for lipid class identification
d. Direct estimation of HHV values with bomb calorimeter
3. Mass balance and energy calculations
4. Analysis of water phase for nutrients analysis for potential reuse and to identify potential
inhibitors like phenols present in the water.
We are working with Dr. Khandan’s group on this work; we will conduct experiments
(water recycling) with at least one species.
5. Analysis of solid phase for its heating value, protein content before and after HTL
processing.
By conducting these experiments we can identify the possibilities of fractional liquefaction to
recover the valuable products (if present), with varying temperature steps similar to
petroleum refining. The time line for completion of these works may be April, 2013.
60
4.3 Life cycle analysis (LCA) – Literature
Life cycle analysis is an important tool to analyze or assess the impact of any product on the
industry and environment from “cradle to grave”. The basic steps followed in LCA studies are
a) Scoping
b) Quantitative data on direct and indirect material and energy balances (or activities)
c) Impact assessment (where effects of various parameters on the process, valuation will be
carried out)
d) Improvement assessment (Analysis of prioritization and policy alternatives).
The life cycle analysis has become an important tool in various industries from 1980’s87.
Many researchers used this life cycles analysis technique to study various parameters in algal
biofuels production. Production of algal biofuels consists of four major steps88, 28. They are
1. Algae cultivation
2. Harvesting
3. Extraction
4. Conversion.
Each of these steps has different technologies to perform the individual tasks. For example algae
cultivation was demonstrated with open raceways ponds, air lift reactors and photo bioreactors of
different designs. Likewise every step has many different techniques to fulfill the respective
objective. Many researchers have studied different products in algae biofuels life cycle analysis.
Khoo et al., studied the energy and CO2 analysis in production of algal biodiesel with the
available lab scale technologies developed at Institute of Chemical and Engineering Sciences
(ICES), Singapore28. In this work cultivation was carried out in photo bioreactors, harvesting
61
through coagulant flocculation with centrifugation, extraction with wet solvent extraction by
homogenizer assuming 100% solvent recovery and conventional Transesterification reaction to
produce biodiesel. With their assumptions (25% lipid content to 45% max.) and calculations they
found to produce 1 kg of biodiesel, 152 MJ/kg energy is required. In another work Sun et al.,
estimated the cost analysis of algal oil of different National labs, industries and academic
institutions research literatures with their individual production techniques. They estimated the
costs in three scenarios, 1. Base line, 2. Optimistic and 3. Maximum growth and lipid production
basis. There are numerous life cycle analysis articles published with individual approaches,
assumptions and available technologies to address various problems in biofuel production from
algae.
4.4 Objective 2& Research Approaches
Based on these literatures we planned to perform life cycle analysis of algal biodiesel production
with the different technologies developed at NMSU. Here at NMSU, we have active groups
working on cultivation, (identification of new species, designing new reactors for cultivation),
extraction & conversion.
1. In this work we will use the SCW & HTL extraction techniques as part of the LCA study
along with the latest developments achieved by the other groups at NMSU.
2. We will be more focused on energy and cost analysis to produce biodiesel from algal
biomass.
3. In the cost analysis we also planned to discuss the impact of byproducts on cost analysis.
These byproducts are poly unsaturated fatty acids (PUFA’s), lipid extracted algae (LEA)
as cattle feed, LEA as fuel for coal power plants and potential of LEA as a biosorbent of
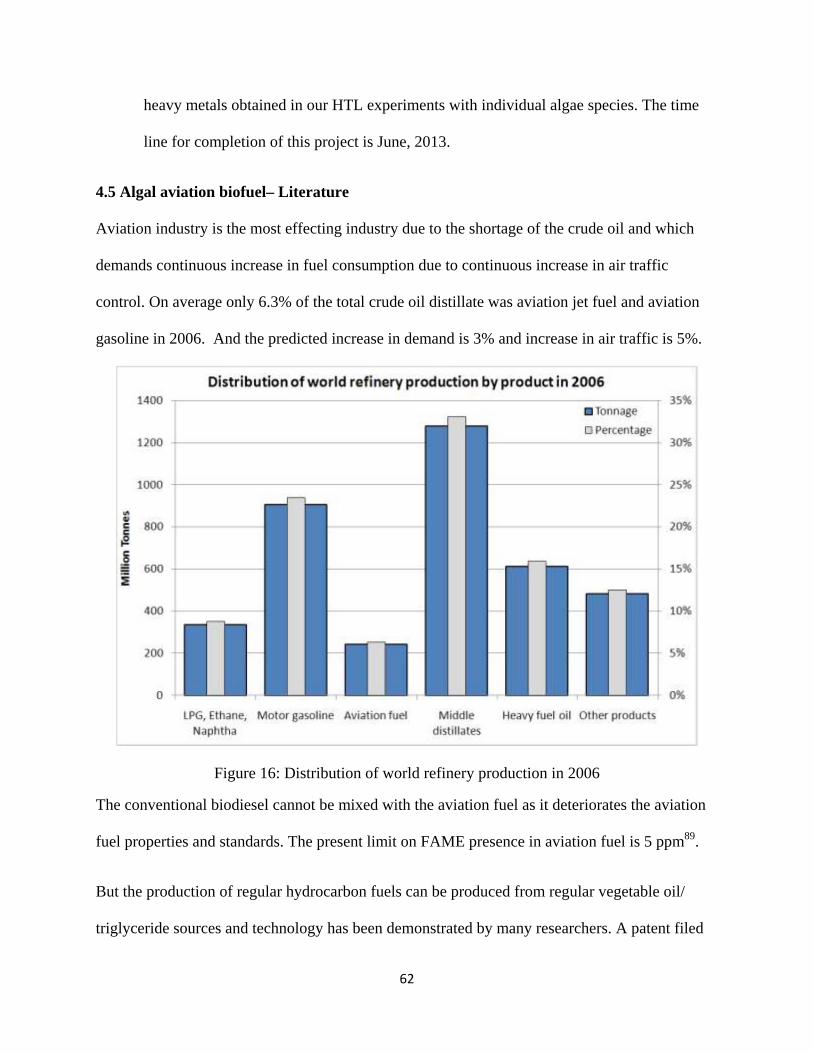
62
heavy metals obtained in our HTL experiments with individual algae species. The time
line for completion of this project is June, 2013.
4.5 Algal aviation biofuel– Literature
Aviation industry is the most effecting industry due to the shortage of the crude oil and which
demands continuous increase in fuel consumption due to continuous increase in air traffic
control. On average only 6.3% of the total crude oil distillate was aviation jet fuel and aviation
gasoline in 2006. And the predicted increase in demand is 3% and increase in air traffic is 5%.
Figure 16: Distribution of world refinery production in 2006
The conventional biodiesel cannot be mixed with the aviation fuel as it deteriorates the aviation
fuel properties and standards. The present limit on FAME presence in aviation fuel is 5 ppm89.
But the production of regular hydrocarbon fuels can be produced from regular vegetable oil/
triglyceride sources and technology has been demonstrated by many researchers. A patent filed
63
by Yao et al., described the production of hydrocarbon range fuels from vegetable oil in the
presence of CoMo (cobalt oxide and molybdenum trioxide) supported on Al2O3 through
hydrocracking at different processing conditions to produce different fuels90. In another patent
work Ginosar et al, demonstrated the production of jet fuel range hydrocarbons from crop seed
oils. They have used trilaurin as a replicate of triglycerides of regular oils. They used
platinum/rhenium catalyst supported on alumina. In this process the triglycerides can be
hydrocracked and reformed into straight chain alkanes of jet fuel range hydrocarbons at
appropriate processing conditions in one or two separate reactors. According to this patent this
process is self-reliant for heat and hydrogen91. Stella et al., demonstrated hydrocracking of
mixture of vacuum gas oil and sunflower oil in different proportions. They have used 3 different
proprietary catalysts to study the effectiveness of the catalysts and reaction temperature and
pressure with highly active catalyst. They observed the maximum conversion of the mixture at
390oCand it was more selective towards small number carbonmolecules. With increasing
temperature selectivity of diesel was decreased, due to hydro cracking of large molecules into
smaller molecules. They also observed 95% of the vegetable oil was converted into useful
molecules at optimum reaction conditions92. There are many of these kinds of research works in
the literature, but most of them are concerning the catalyst development.
4.6 Objective & Research Approaches:
After reviewing the literature we planned to use algal oil as a feedstock for the production of
aviation biofuel. But our aim is production of jet fuel range hydrocarbons by using commercially
available catalysts. The major objective will be drawing conclusions about the large scale
feasibility of algal aviation biofuels, with the information and knowledge obtained from from
HTL experiments and LCA of the algal biofuels.
64
Experimental plan:
1. Conducting experiments with camelina oil as feedstock in place of algal oil with
commercial catalyst available from BASF to find optimum process conditions.
2. Three cycles of experiments will be conducted to analyze the influence of reaction
temperature, pressure, and LHSV (liquid hourly space velocity).
3. The experimental conditions will be varied for reaction temperature 300-450oC with 50oC
interval, pressure 20 - 40 bar with 5 bar interval, and LHSV (liquid hourly space velocity)
0.5 – 2.0 with 0.5 interval.
4. Analysis of samples
a. GC-MS analysis of crude product with C6 – C28 alkane mix. as standard for
quantification
b. Distillation of crude product obtained at optimum conditions
c. Mass balance calculations will be performed o the basis of total oil input
%. 6 24
. ∗ 100
%. 8 16
. ∗ 100
5. Using algal oil to produce jet fuel range hydrocarbons at optimum conditions.
Time line for finishing this project is March, 2013.
65
V. References
1. J. Goldemberg and T. Johansson, World Energy Assessment Overview: 2004 Update, 2004.
2. A. Demirbas, Applied Energy, 2009, 86.
3. P. M. Schenk, S. R. Thomas-Hall, E. Stephens, U. C. Marx, J. H. Mussgnug, C. Posten, O. Kruse
and B. Hankamer, Bioenergy Research, 2008, 1, 20-43.
4. Y. Chisti, Biotechnology Advances, 2007, 25, 294-306.
5. J. Singh and S. Cu, Renewable & Sustainable Energy Reviews, 2010, 14, 2596-2610.
6. L. Brennan and P. Owende, Renewable & Sustainable Energy Reviews, 2010, 14, 557-577.
7. D. O. Hall, H. E. Mynick and R. H. Williams, Nature, 1991, 353, 11-12.
8. E. G. Shay, Biomass & Bioenergy, 1993, 4, 227-242.
9. P. Spolaore, C. Joannis-Cassan, E. Duran and A. Isambert, Journal of Bioscience and
Bioengineering, 2006, 101, 87-96.
10. J. M. Adams, J. A. Gallagher and I. S. Donnison, Journal of Applied Phycology, 2009, 21, 569-
574.
11. M. L. Ghirardi, J. P. Zhang, J. W. Lee, T. Flynn, M. Seibert, E. Greenbaum and A. Melis, Trends
in Biotechnology, 2000, 18, 506-511.
12. I. Akkerman, M. Janssen, J. Rocha and R. H. Wijffels, International Journal of Hydrogen
Energy, 2002, 27, 1195-1208.
13. R. Halim, M. K. Danquah and P. A. Webley, Biotechnology Advances, 2012, 30, 709-732.
14. L. Lardon, A. Helias, B. Sialve, J.-P. Stayer and O. Bernard, Environmental Science &
Technology, 2009, 43, 6475-6481.
15. J. Doucha and K. Livansky, Applied Microbiology and Biotechnology, 2008, 81.
16. B. Wiyarno, R. M. Yunus and M. M., in Journal of Applied Sciences, Editon edn., 2011, vol. 11,
pp. 3607-3612.
17. J.-Y. Lee, C. Yoo, S.-Y. Jun, C.-Y. Ahn and H.-M. Oh, Bioresource Technology, 2010, 101, S75-
S77.
18. A. R. Medina, E. M. Grima, A. G. Gimenez and M. J. I. Gonzalez, Biotechnology Advances,
1998, 16.
19. S. J. Iverson, S. L. C. Lang and M. H. Cooper, Lipids, 2001, 36, 1283-1287.
20. L. Xiao, S. A. Mjos and B. O. Haugsgjerd, Journal of Food Composition and Analysis, 2012, 25.
21. P. Kumari, C. R. K. Reddy and B. Jha, Analytical Biochemistry, 2011, 415, 134-144.
22. B. Kaufmann and P. Christen, Phytochemical Analysis, 2002, 13, 105-113.
66
23. P. Mercer and R. E. Armenta, European Journal of Lipid Science and Technology, 2011, 113,
539-547.
24. M. Perrut, Industrial & Engineering Chemistry Research, 2000, 39.
25. M. Herrero, A. Cifuentes and E. Ibanez, Food Chemistry, 2006, 98, 136-148.
26. R. L. Mendes, B. P. Nobre, M. T. Cardoso, A. P. Pereira and A. F. Palavra, Inorganica Chimica
Acta, 2003, 356.
27. M. Cooney, G. Young and N. Nagle, Separation and Purification Reviews, 2009, 38, 291-325.
28. H. H. Khoo, P. N. Sharratt, P. Das, R. K. Balasubramanian, P. K. Naraharisetti and S. Shaik,
Bioresource Technology, 2011, 102, 5800-5807.
29. P. D. Patil, V. G. Gude, A. Mannarswamy, S. Deng, P. Cooke, S. Munson-McGee, I. Rhodes, P.
Lammers and N. Nirmalakhandan, Bioresource Technology, 2011, 102, 118-122.
30. F. R. Ma and M. A. Hanna, Bioresource Technology, 1999, 70, 1-15.
31. M. Garcia, A. Gonzalo, J. Luis Sanchez, J. Arauzo and C. Simoes, Chemical Industry &
Chemical Engineering Quarterly, 2011, 17, 91-97.
32. G. Knothe, Fuel Processing Technology, 2005, 86, 1059-1070.
33. H. Joshi, B. R. Moser, J. Toler and T. Walker, Biomass & Bioenergy, 2010, 34, 14-20.
34. J. Lu, E. C. Boughner, C. L. Liotta and C. A. Eckert, Fluid Phase Equilibria, 2002, 198, 37-49.
35. S. Saka and D. Kusdiana, Fuel, 2001, 80, 225-231.
36. F. Ma, L. D. Clements and M. A. Hanna, Transactions of the Asae, 1998, 41, 1261-1264.
37. K. T. Tan, M. M. Gui, K. T. Lee and A. R. Mohamed, Journal of Supercritical Fluids, 2010, 53,
82-87.
38. K. T. Tan, M. M. Gui, K. T. Lee and A. R. Mohamed, Energy Sources Part a-Recovery
Utilization and Environmental Effects, 2011, 33, 156-163.
39. H. Imahara, E. Minami, S. Hari and S. Saka, Fuel, 2008, 87, 1-6.
40. M. Balat, Energy Sources Part a-Recovery Utilization and Environmental Effects, 2008, 30, 429-
440.
41. M. M. Gui, K. T. Lee and S. Bhatia, Journal of Supercritical Fluids, 2009, 49, 286-292.
42. W. M. Peng, Q. Y. Wu, P. G. Tu and N. M. Zhao, Bioresource Technology, 2001, 80, 1-7.
43. V. M. da Silva, L. A. Silva, J. B. de Andrade, M. C. da Cunha Veloso and G. V. Santos, Quimica
Nova, 2008, 31, 901-905.
44. S. Angermuller and H. D. Fahimi, Histochemical Journal, 1982, 14, 823-835.
45. R. H. Wijffels and M. J. Barbosa, Science, 2010, 330, 913-913.
46. P. E. Savage, Journal of Supercritical Fluids, 2009, 47, 407-414.
67
47. I. Rodriguez-Meizoso, L. Jaime, S. Santoyo, F. J. Senorans, A. Cifuentes and E. Ibanez, Journal
of Pharmaceutical and Biomedical Analysis, 2010, 51, 456-463.
48. E. Ibanez, A. Kubatova, F. J. Senorans, S. Cavero, G. Reglero and S. B. Hawthorne, Journal of
Agricultural and Food Chemistry, 2003, 51, 375-382.
49. S. M. Ghoreishi and R. G. Shahrestani, Journal of Food Engineering, 2009, 93, 474-481.
50. J.-W. Kim, T. Nagaoka, Y. Ishida, T. Hasegawa, K. Kitagawa and S.-C. Lee, Separation Science
and Technology, 2009, 44, 2598-2608.
51. M. H. Eikani, F. Golmohammad and S. Rowshanzamir, Journal of Food Engineering, 2007, 80,
735-740.
52. L. Gamiz-Gracia and M. D. L. de Castro, Talanta, 2000, 51, 1179-1185.
53. A. A. Peterson, F. Vogel, R. P. Lachance, M. Froeling, M. J. Antal, Jr. and J. W. Tester, Energy
& Environmental Science, 2008, 1, 32-65.
54. M. Moeller, P. Nilges, F. Harnisch and U. Schroeder, Chemsuschem, 2011, 4, 566-579.
55. B. Hu, K. Wang, L. Wu, S.-H. Yu, M. Antonietti and M.-M. Titirici, Advanced Materials, 2010,
22, 813-828.
56. S. S. Toor, L. Rosendahl and A. Rudolf, Energy, 2011, 36, 2328-2342.
57. J. D. Moseley and E. K. Woodman, Energy & Fuels, 2009, 23, 5438-5447.
58. O. Sticher, Natural Product Reports, 2008, 25, 517-554.
59. C. S. Eskilsson and E. Bjorklund, Journal of Chromatography A, 2000, 902, 227-250.
60. M. E. Lucchesi, J. Smadja, S. Bradshaw, W. Louw and F. Chemat, Journal of Food Engineering,
2007, 79, 1079-1086.
61. N. Erkan, Z. Tao, H. P. V. Rupasinghe, B. Uysal and B. S. Oksal, Natural Product
Communications, 2012, 7, 121-124.
62. S. Perino-Issartier, H. Zill e, M. Abert-Vian and F. Chemat, Food and Bioprocess Technology,
2011, 4, 1020-1028.
63. X. J. Pan, G. G. Niu and H. Z. Liu, Journal of Chromatography A, 2001, 922, 371-375.
64. M. J. I. Mattina, W. A. I. Berger and C. L. Denson, Journal of Agricultural and Food Chemistry,
1997, 45, 4691-4696.
65. S. Tsubaki, M. Sakamoto and J.-i. Azuma, Food Chemistry, 2010, 123, 1255-1258.
66. M. A. Vian, X. Fernandez, F. Visinoni and F. Chemat, Journal of Chromatography A, 2008,
1190, 14-17.
67. J. Akhtar and N. A. S. Amin, Renewable & Sustainable Energy Reviews, 2011, 15, 1615-1624.
68. Z. Fang, T. Minowa, R. L. Smith, T. Ogi and J. A. Kozinski, Industrial & Engineering Chemistry
Research, 2004, 43, 2454-2463.
68
69. D. Zhou, L. Zhang, S. Zhang, H. Fu and J. Chen, Energy & Fuels, 2010, 24, 4054-4061.
70. C. C. Teo, S. N. Tan, J. W. H. Yong, C. S. Hew and E. S. Ong, Journal of Chromatography A,
2010, 1217, 2484-2494.
71. S. Zou, Y. Wu, M. Yang, C. Li and J. Tong, Energy & Fuels, 2009, 23, 3753-3758.
72. T. M. Brown, P. Duan and P. E. Savage, Energy & Fuels, 2010, 24, 3639-3646.
73. H. P. Li, G. C. Li and J. F. Jen, Journal of Chromatography A, 2003, 1012, 129-137.
74. L. Pallaroni, C. von Holst, C. S. Eskilsson and E. Bjorklund, Analytical and Bioanalytical
Chemistry, 2002, 374, 161-166.
75. S. M. Heilmann, H. T. Davis, L. R. Jader, P. A. Lefebvre, M. J. Sadowsky, F. J. Schendel, M. G.
von Keitz and K. J. Valentas, Biomass & Bioenergy, 2010, 34, 875-882.
76. T. Muppaneni, H. K. Reddy, P. D. Patil, P. Dailey, C. Aday and S. Deng, Applied Energy, 2012,
94, 84-88.
77. P. D. Patil, H. Reddy, T. Muppaneni, A. Mannarswamy, T. Schuab, F. O. Holguin, P. Lammers,
N. Nirmalakhandan, P. Cooke and S. Deng, Green Chemistry, 2012, 14, 809-818.
78. R. A. Karmali, Nutrition, 1996, 12, S2-S4.
79. C. E. Brewer, K. Schmidt-Rohr, J. A. Satrio and R. C. Brown, Environmental Progress &
Sustainable Energy, 2009, 28, 386-396.
80. E. Sandau, P. Sandau and O. Pulz, Acta Biotechnologica, 1996, 16, 227-235.
81. J. A. Libra, Biofuels, 2011, 2, 71-106.
82. , U.S. Department of Energy, Office of Energy Efficiency and Renewable Energy, Biomass
Program, Editon edn., 2010.
83. O. Bobleter, Progress in Polymer Science, 1994, 19.
84. M. Aresta, A. Dibenedetto, M. Carone, T. Colonna and C. Fragale, Environmental Chemistry
Letters, 2005, 3, 136-139.
85. P. Biller and A. B. Ross, Bioresource Technology, 2011, 102.
86. P. Biller, A. B. Ross, S. C. Skill, A. Lea-Langton, B. Balasundaram, C. Hall, R. Riley and C. A.
Llewellyn, in Algal Research, Editon edn., 2012, vol. 1, pp. 70-76.
87. R. U. Ayres, Resources Conservation and Recycling, 1995, 14.
88. B. J. Gallagher, Renewable Energy, 2011, 36.
89. E. Nygren, K. Aleklett and M. Hook, Energy Policy, 2009, 37.
90. USA Pat., 2009.
91. USA Pat., 2010.
92. S. Bezergianni, A. Kalogianni and I. A. Vasalos, Bioresource Technology, 2009, 100.