Embed Size (px)
Citation preview
PRODUCTION OF HYDROGEN GAS
FROM BIOMASS WASTES USING
FLUIDIZED BED GASIFIER
Department of Chemical Engineering
National Institute of Technology
Rourkela-769008
A Thesis Submitted to the National Institute of Technology, Rourkela in
Partial Fulfillment for the Requirements of Master of Technology (Res.)
Degree
Submitted By
Mr.Rajesh Tripathy Roll No. 610CH601
Under the guidance of
Dr. (Mrs.) Abanti Sahoo
PRODUCTION OF HYDROGEN GAS FROM BIOMASS WASTES USING
FLUIDIZED BED GASIFIER
A Thesis Submitted to the
National Institute of Technology, Rourkela
In Partial Fulfillment for the Requirements
Of
Master of Technology (Res.) Degree
In
CHEMICAL ENGINEERING
By
Mr.Rajesh Tripathy
Roll No. 610CH601
Under the guidance of
Dr. (Mrs.) Abanti Sahoo
Department of Chemical Engineering
National Institute of Technology
Rourkela-769008
Department of Chemical Engineering
National Institute of Technology
Rourkela-769008
CERTIFICATE
This is to certify that M.Tech. ( Res.) thesis entitled, “Production of Hydrogen
Gas from Biomass Wastes Using Fluidized Bed Gasifier” submitted by Mr. Rajesh Tripathy
in partial fulfillments for the requirements of the award of Master of Technology ( Res.) degree
in Chemical Engineering at National Institute of Technology, Rourkela is an authentic work
carried out by him under my supervision and guidance. He has fulfilled all the prescribed
requirements and the thesis, which is based on candidate’s own work, has not been submitted
elsewhere.
Dr. (Mrs.) Abanti Sahoo
Department of Chemical Engineering,
National Institute of Technology,Rourkela - 769008,Odisha
ACKNOWLEDGEMENT
I feel immense pleasure and privilege to express my deep sense of gratitude and feel
indebted towards all those people who have helped, inspired and encouraged me during the
preparation of this report.
I am grateful to my supervisor, Prof. Abanti Sahoo, for her kind support, guidance
and encouragement throughout the project work, also for introducing to this topic.
I express my gratitude and indebtedness to Dr.B.K.Pal and Dr. H.M. Jena, for their
valuable suggestions and instructions at various stages of the work.
I would also like to thank HOD, Prof. R. K. Singh for his kind help to make this
report complete. I am also thankful to all the staff and faculty members of Chemical Engineering
Department, National Institute of Technology, Rourkela for their consistent encouragement.
I would also like to extend my sincere thanks to my colleague research scholars for
their unconditional assistance and support.
Last but not the least; I would like to thank whole heartedly my parents and family
members whose encouragement and unconditional support, both on academic and personal front,
enabled me to see the light of this day.
Thanking You,
Mr. Rajesh Tripathy
610CH601
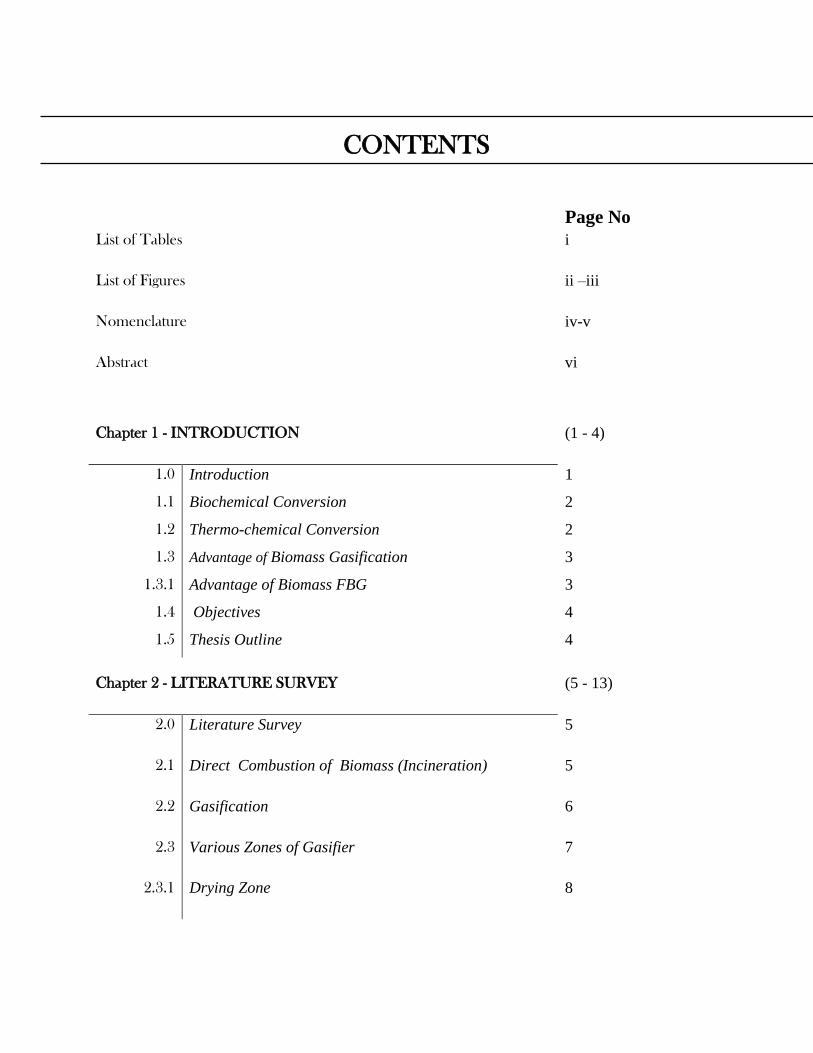
CONTENTS
Page No
List of Tables i
List of Figures ii –iii
Nomenclature iv-v
Abstract
vi
Chapter 1 - INTRODUCTION (1 - 4)
1.0 Introduction 1
1.1 Biochemical Conversion 2
1.2 Thermo-chemical Conversion 2
1.3 Advantage of Biomass Gasification 3
1.3.1 Advantage of Biomass FBG 3
1.4 Objectives 4
1.5 Thesis Outline 4
Chapter 2 - LITERATURE SURVEY (5 - 13)
2.0 Literature Survey 5
2.1 Direct Combustion of Biomass (Incineration) 5
2.2 Gasification 6
2.3 Various Zones of Gasifier 7
2.3.1 Drying Zone 8
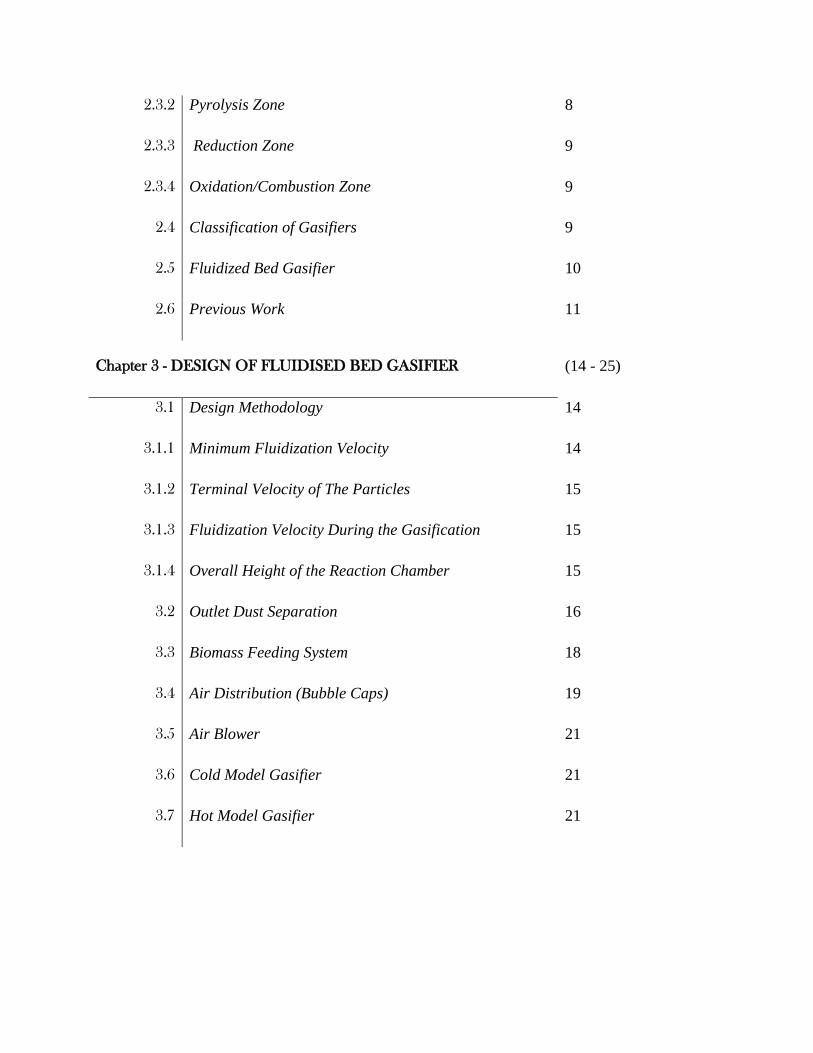
2.3.2 Pyrolysis Zone 8
2.3.3 Reduction Zone 9
2.3.4 Oxidation/Combustion Zone 9
2.4 Classification of Gasifiers 9
2.5 Fluidized Bed Gasifier 10
2.6 Previous Work 11
Chapter 3 - DESIGN OF FLUIDISED BED GASIFIER (14 - 25)
3.1 Design Methodology 14
3.1.1 Minimum Fluidization Velocity 14
3.1.2 Terminal Velocity of The Particles 15
3.1.3 Fluidization Velocity During the Gasification 15
3.1.4 Overall Height of the Reaction Chamber 15
3.2 Outlet Dust Separation 16
3.3 Biomass Feeding System 18
3.4 Air Distribution (Bubble Caps) 19
3.5 Air Blower 21
3.6 Cold Model Gasifier 21
3.7 Hot Model Gasifier 21

Chapter 4 – MATERIALS AND METHODS WITH ENERGY
CALCULATION
(26 - 36)
4.1 Materials 26
4.1.1 Collection, Sizing, Drying of Biomass Sample and Bed
Material
26
4.1.2 Different Parts of Experiment Setup 27
4.2 Methods
4.2.1 Analysis of Physical Properties 27
4.2.2 Preliminary Analysis of the Biomass Samples 27
4.2.3 Ultimate Analysis 28
4.2.4 Proximate Analysis 28
4.2.5 Operating Procedure 29
4.2.6 Output Measurement and Scope of Experiment 29
4.3 Chemical Formula of Biomass 30
4.4 Energy Balance and Mass Balance Calculations 32
Chapter 5 - ASPEN PLUS SIMULATION, EXPERIMENTAL
OBSERVATIONS AND RESULTS
(37 - 51)
5.1 ASPEN Plus Simulation 37
5.1.1 Assumptions 37
5.1.2 ASPEN Plus Model 37
5.1.3 Biomass Decomposition 37
5.1.4 Volatile Reactions 38
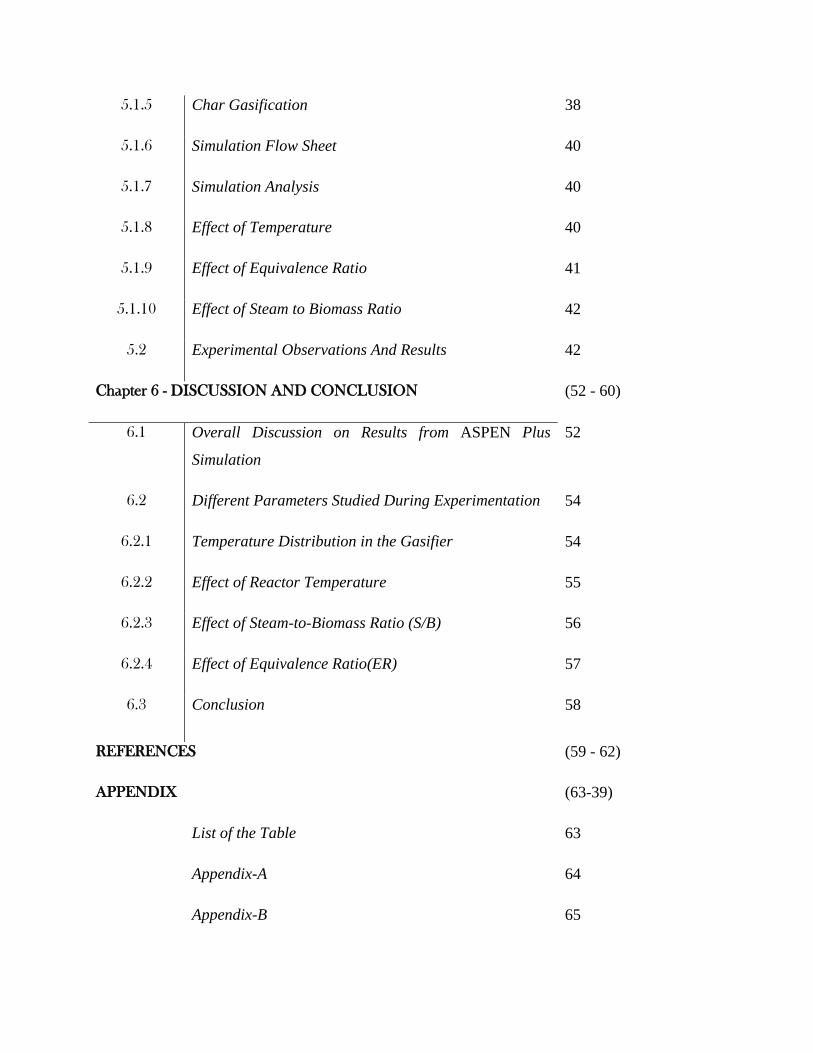
5.1.5 Char Gasification 38
5.1.6 Simulation Flow Sheet 40
5.1.7 Simulation Analysis 40
5.1.8 Effect of Temperature 40
5.1.9 Effect of Equivalence Ratio 41
5.1.10 Effect of Steam to Biomass Ratio 42
5.2 Experimental Observations And Results 42
Chapter 6 - DISCUSSION AND CONCLUSION (52 - 60)
6.1 Overall Discussion on Results from ASPEN Plus
Simulation
52
6.2 Different Parameters Studied During Experimentation 54
6.2.1 Temperature Distribution in the Gasifier 54
6.2.2 Effect of Reactor Temperature 55
6.2.3 Effect of Steam-to-Biomass Ratio (S/B) 56
6.2.4 Effect of Equivalence Ratio(ER) 57
6.3 Conclusion 58
REFERENCES (59 - 62)
APPENDIX (63-39)
List of the Table 63
Appendix-A 64
Appendix-B 65
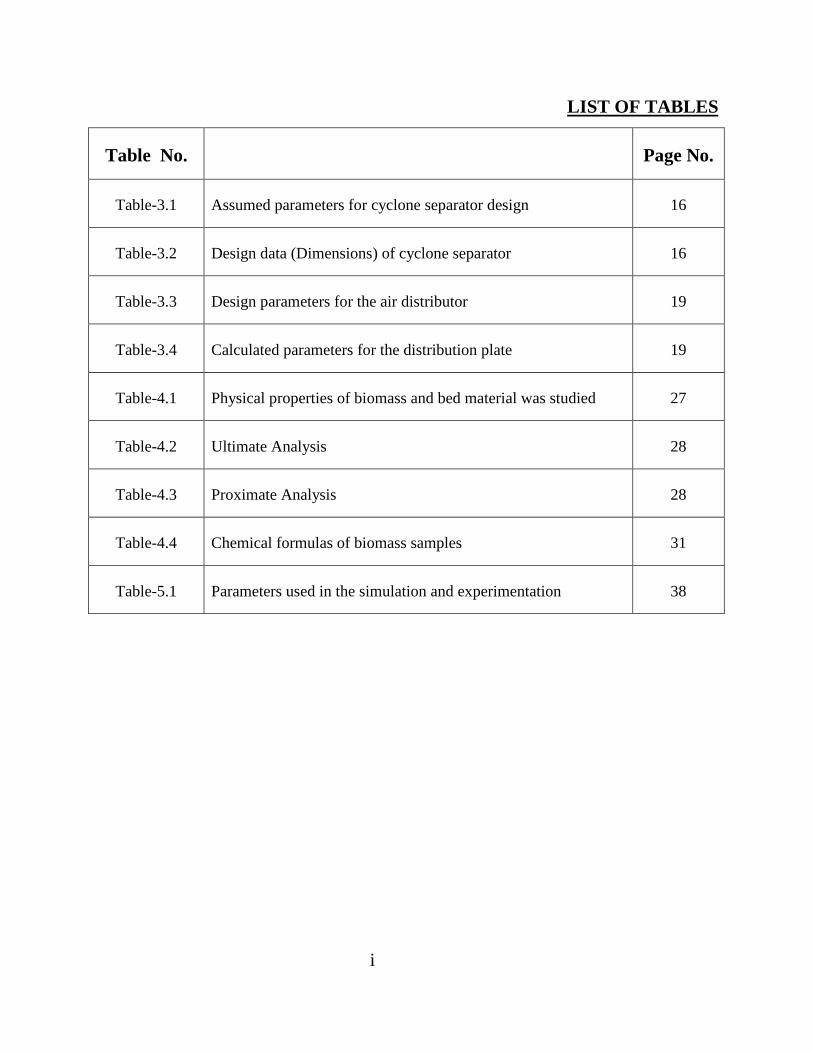
LIST OF TABLES
Table No. Page No.
Table-3.1 Assumed parameters for cyclone separator design 16
Table-3.2 Design data (Dimensions) of cyclone separator 16
Table-3.3 Design parameters for the air distributor 19
Table-3.4 Calculated parameters for the distribution plate 19
Table-4.1 Physical properties of biomass and bed material was studied 27
Table-4.2 Ultimate Analysis 28
Table-4.3 Proximate Analysis 28
Table-4.4 Chemical formulas of biomass samples 31
Table-5.1 Parameters used in the simulation and experimentation 38
i
LIST OF FIGURES
Fig. No. Page No.
Fig.-2.1 The schematic diagram of all these types of gasifiers 10
Fig.-3.1 Design of cyclone Separator 17
Fig.-3.2 Design of screw feeder 18
Fig.-3.3 Design of bubble cap and distributor arrangement 20
Fig.-3.4 Design of cold model fluidized bed gasifier 22
Fig.-3.5 Design of hot model fluidized bed gasifier 23
Fig.-3.6 Cold model fluidized bed gasifier (Laboratory Unit) 24
Fig.-3.7 Hot model fluidized bed gasifier (Laboratory Unit) 25
Fig.-4.1 Biomass sample used for experiment 27
Fig.-5.1 Flow-sheet of ASPEN Plus simulation for fluidized bed gasification. 39
Fig.-5.2 Simulated product gas composition versus temperature 40
Fig.-5.3 Simulated product gas composition versus equivalence ratio 41
Fig.-5.4 Simulated product gas composition versus steam to biomass ratio 42
Fig.-5.5 Temperature profile in different zones of the gasifier 43
Fig.-5.6 Composition of out let gas from gasifier for rice husk as feed
material
44
ii
Fig.-5.7 Composition of out let gas from gasifier for rice straw as feed
material
45
Fig.-5.8 Composition of out let gas from gasifier for saw dust as feed material 46
Fig.-5.9 Syn-gas composition for rice husk 47
Fig.-5.10 Syn-gas composition for rice straw 48
Fig.-5.11 Syn-gas composition for saw dust 49
Fig.-5.12 Comparison of yield of individual components among different feed
material
50
Fig.-5.13 Effect of S/B ratio on syn-gas composition for rice husk 51
Fig.-5.14 Effect of S/B ratio on syn-gas composition for rice straw 51
Fig.-5.15 Effect of S/B ratio on syn-gas composition for saw dust 51
Fig.-5.16 Comparison for effect of S/B ratio on individual components of syn-
gas for different feed materials
52
Fig.-5.17 Effect of equivalence ratio on syn-gas composition for rice husk 53
Fig.-5.18 Effect of equivalence ratio on syn-gas composition for rice straw 53
Fig.-5.19 Effect of equivalence ratio on syn-gas composition for saw dust 53
Fig.-5.20 Comparison for effect of equivalence ratio on individual component
of syn-gas for different feed materials
54
iii
NOMENCLATURE
D Screw outlet diameter, m
dp Mean particle size, m
g Acceleration due to gravity, m/sec2
h Fillet height ,m
H Expanded bed height, m
Hmf Bed height at minimum fluidization, m
Ht Overall height, m
ass flow rate of feed sample, kg/h
n Speed of screw, rpm
TDH Transport disengaging height, m
Uf Fluidization velocity, m/s
Ut Terminal velocity of particles, m/s
Umf Minimum fluidization velocity, m/s
S Step of screw, m
iv
GREEK SYMBOLS
ε Particle porosity
φ Sphericity
μ Viscosity of air, kg/m.s
ρ Density, kg/m3
Subscript
f Fluid
g Gas
p Particle
Abbreviation
S/B Steam to biomass ratio
ER Equivalence ratio
FBG Fluidized Bed Gasifier
BM Biomass
v
ABSTRACT
An energy efficient approach to hydrogen rich syn-gas production from biomass and
wastes is represented at relatively low temperature, around 6000C, in a continuous-feeding
fluidized bed Gasifier. The effects of different biomass materials, temperature, steam to biomass
ratio (S/B) and Equivalence Ratio (ER) on gas yield, gas composition, and carbon conversion
efficiency have been studied. Higher temperature contributed to higher gas yield and carbon
conversion. The steam introduction increased hydrogen yield by steam reforming and water gas
shift reaction. Rice husk, rice straw and rice straw were gasified in the present work.
Temperature during gasification was varied with 500-10000C. ER was varied within 0.15 to 0.35
and steam to biomass ratio was varied within 1.35 to 2.5. Minimum extra of 20% stoichiometric
air is required for satisfactory performance of gasifier. ASPEN plus simulation was also carried
out for optimization of process parameters. ASPEN plus simulation and experimental
observations were found to have very good approximation in most of the cases. Performance of
fluidized bed gasifier was satisfactory for ER within 0.25 to 0.35 and S/B ratio within 2 to 2.5.
Key words: Fluidized bed gasification, Syn-gas, Biomass, Steam to Biomass ratio, Equivalence
ratio and ASPEN Plus Simulation
vi

CHAPTER ONE
INTRODUCTION
Introduction
1
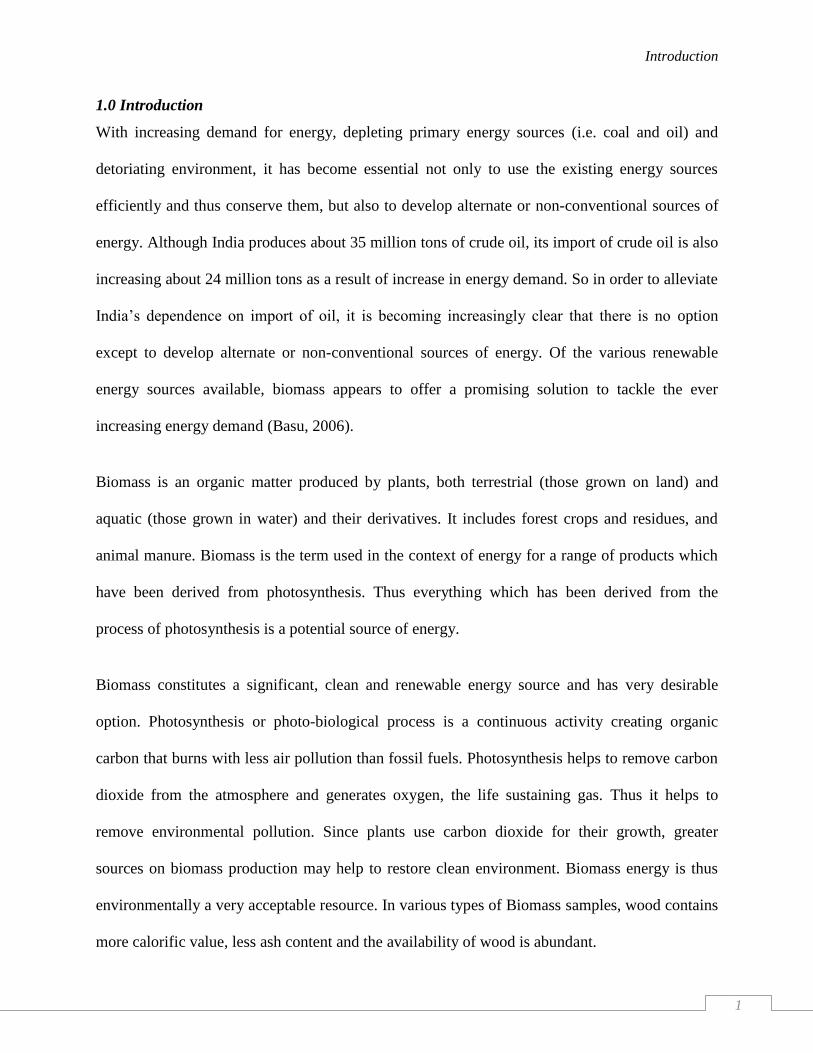
1.0 Introduction
With increasing demand for energy, depleting primary energy sources (i.e. coal and oil) and
detoriating environment, it has become essential not only to use the existing energy sources
efficiently and thus conserve them, but also to develop alternate or non-conventional sources of
energy. Although India produces about 35 million tons of crude oil, its import of crude oil is also
increasing about 24 million tons as a result of increase in energy demand. So in order to alleviate
India’s dependence on import of oil, it is becoming increasingly clear that there is no option
except to develop alternate or non-conventional sources of energy. Of the various renewable
energy sources available, biomass appears to offer a promising solution to tackle the ever
increasing energy demand (Basu, 2006).
Biomass is an organic matter produced by plants, both terrestrial (those grown on land) and
aquatic (those grown in water) and their derivatives. It includes forest crops and residues, and
animal manure. Biomass is the term used in the context of energy for a range of products which
have been derived from photosynthesis. Thus everything which has been derived from the
process of photosynthesis is a potential source of energy.
Biomass constitutes a significant, clean and renewable energy source and has very desirable
option. Photosynthesis or photo-biological process is a continuous activity creating organic
carbon that burns with less air pollution than fossil fuels. Photosynthesis helps to remove carbon
dioxide from the atmosphere and generates oxygen, the life sustaining gas. Thus it helps to
remove environmental pollution. Since plants use carbon dioxide for their growth, greater
sources on biomass production may help to restore clean environment. Biomass energy is thus
environmentally a very acceptable resource. In various types of Biomass samples, wood contains
more calorific value, less ash content and the availability of wood is abundant.
Introduction
2
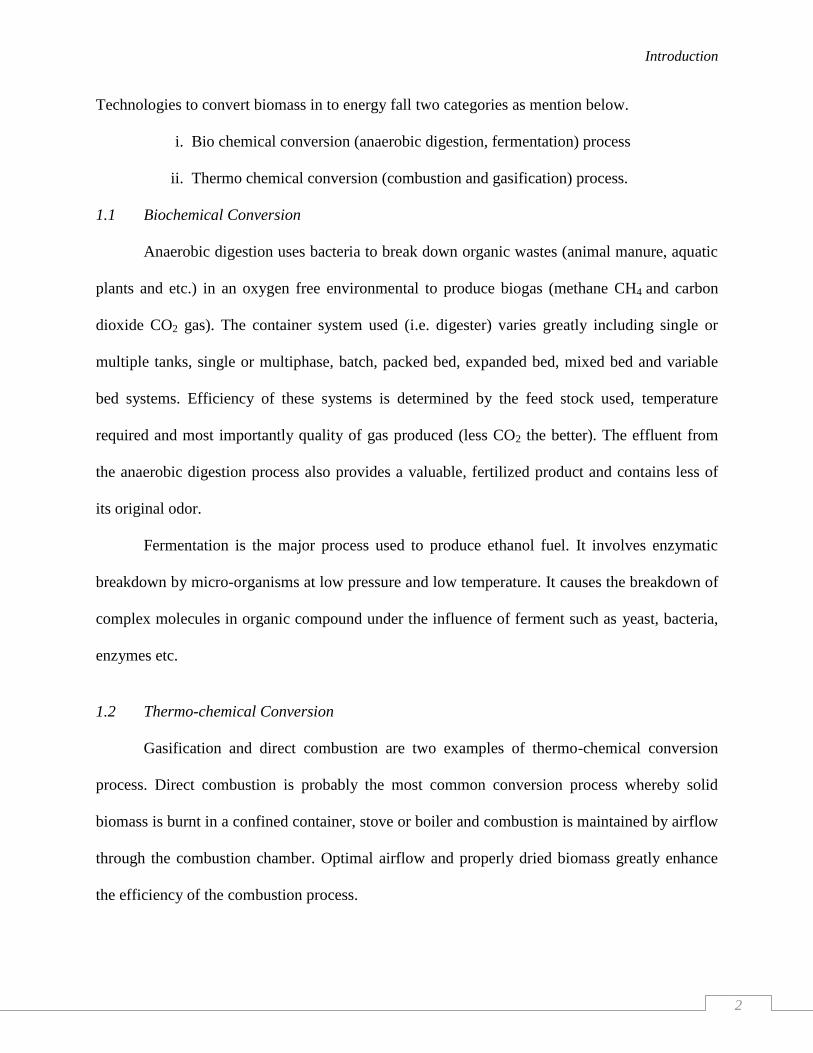
Technologies to convert biomass in to energy fall two categories as mention below.
i. Bio chemical conversion (anaerobic digestion, fermentation) process
ii. Thermo chemical conversion (combustion and gasification) process.
1.1 Biochemical Conversion
Anaerobic digestion uses bacteria to break down organic wastes (animal manure, aquatic
plants and etc.) in an oxygen free environmental to produce biogas (methane CH4 and carbon
dioxide CO2 gas). The container system used (i.e. digester) varies greatly including single or
multiple tanks, single or multiphase, batch, packed bed, expanded bed, mixed bed and variable
bed systems. Efficiency of these systems is determined by the feed stock used, temperature
required and most importantly quality of gas produced (less CO2 the better). The effluent from
the anaerobic digestion process also provides a valuable, fertilized product and contains less of
its original odor.
Fermentation is the major process used to produce ethanol fuel. It involves enzymatic
breakdown by micro-organisms at low pressure and low temperature. It causes the breakdown of
complex molecules in organic compound under the influence of ferment such as yeast, bacteria,
enzymes etc.
1.2 Thermo-chemical Conversion
Gasification and direct combustion are two examples of thermo-chemical conversion
process. Direct combustion is probably the most common conversion process whereby solid
biomass is burnt in a confined container, stove or boiler and combustion is maintained by airflow
through the combustion chamber. Optimal airflow and properly dried biomass greatly enhance
the efficiency of the combustion process.
Introduction
3
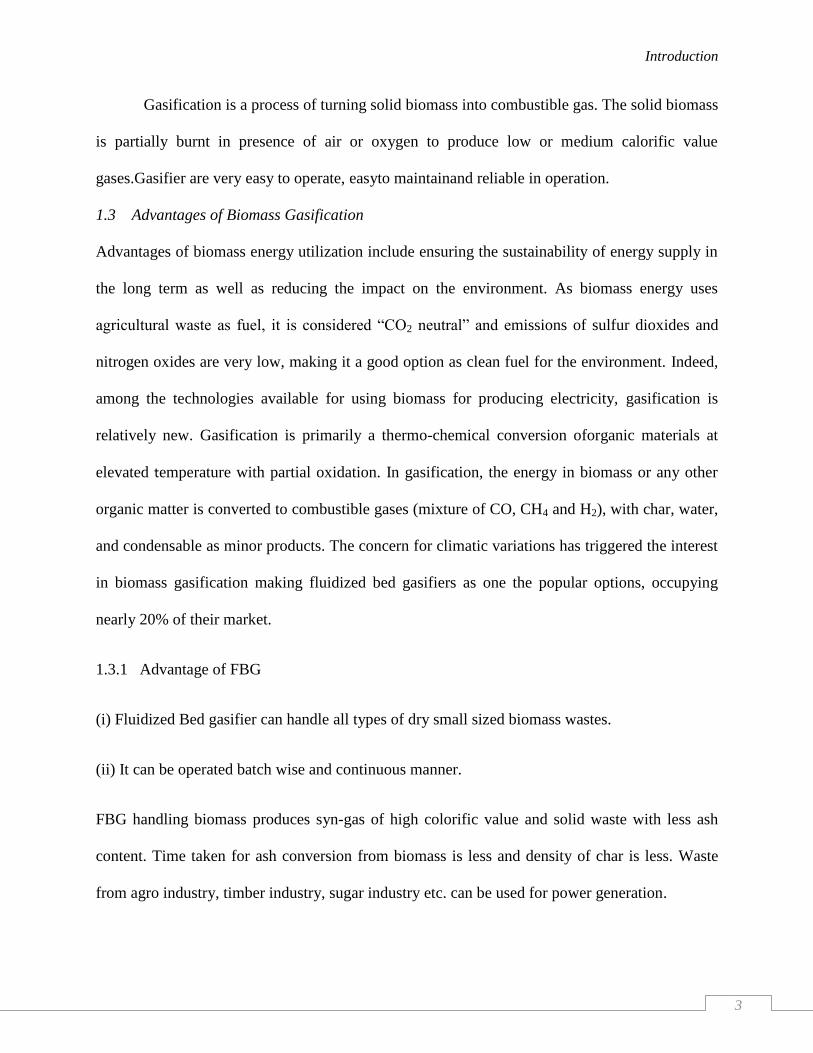
Gasification is a process of turning solid biomass into combustible gas. The solid biomass
is partially burnt in presence of air or oxygen to produce low or medium calorific value
gases.Gasifier are very easy to operate, easyto maintainand reliable in operation.
1.3 Advantages of Biomass Gasification
Advantages of biomass energy utilization include ensuring the sustainability of energy supply in
the long term as well as reducing the impact on the environment. As biomass energy uses
agricultural waste as fuel, it is considered “CO2 neutral” and emissions of sulfur dioxides and
nitrogen oxides are very low, making it a good option as clean fuel for the environment. Indeed,
among the technologies available for using biomass for producing electricity, gasification is
relatively new. Gasification is primarily a thermo-chemical conversion oforganic materials at
elevated temperature with partial oxidation. In gasification, the energy in biomass or any other
organic matter is converted to combustible gases (mixture of CO, CH4 and H2), with char, water,
and condensable as minor products. The concern for climatic variations has triggered the interest
in biomass gasification making fluidized bed gasifiers as one the popular options, occupying
nearly 20% of their market.
1.3.1 Advantage of FBG
(i) Fluidized Bed gasifier can handle all types of dry small sized biomass wastes.
(ii) It can be operated batch wise and continuous manner.
FBG handling biomass produces syn-gas of high colorific value and solid waste with less ash
content. Time taken for ash conversion from biomass is less and density of char is less. Waste
from agro industry, timber industry, sugar industry etc. can be used for power generation.
Introduction
4
In rural areas, biomass samples are readily available for which power problem can also easily be
solved with proper gasification technology.
1.4 Objectives
Objective of the present work has been framed in the following manner.
a) Design of FBG
b) Production of H2 from biomass using FBG
c) Effect of biomass type on syn-gas composition
d) To study the effect of different parameters such as Steam to Biomass Ratio, Equivalence
Ratio (ER) and temperature on composition of syn-gas.
e) To carry out ASPEN Plus simulation for further validation of the experimental data.
1.5 Thesis Outline
The present work has been documented in the form of a systematic report. The thesis report
comprises the following chapters.
i. Introduction
ii. Literature Survey
iii. Designing Fluidized Bed Biomass Gasifier.
iv. Materials and Methods with Energy Calculation
v. ASPEN Plus Simulation, Experimental Observations and Results
vi. Discussion and Conclusion

CHAPTER TWO [
LITERATURE SURVEY
Literature Survey
5
2.0 Biomass Energy Conversion
Biomass is abundantly available in all parts of the world. Need for environmentally clean energy
demands the use of biomass as an alternative source for renewable energy for which the biomass
is to be converted by special technologies.
There are mainly two methods commonly used for biomass energy conversion
i. Direct Combustion (Incineration)
ii. Gasification
2.1 Direct Combustion of Biomass (Incineration)
Combustion is the process of burning (rapid oxidation accompanied by heat and light).
Combustion also includes slow oxidation accompanied by little heat and no light. Incineration is
the process of burning completely to ashes. The process of combustion is applicable to solid
liquid and gaseous fuels. Combustion or burning is one of the most common processes in energy
technology and biomass conversion technology. Generally the combustion process is applied to
solid fuels including cultivated biomass and waste biomass. It is convenient and economical to
burn the solid, semi-dried biomass and obtain useful heat at the location of biomass source (e.g.
trees can be burnt at a site in the forest; sugar cane bagasse can be burnt near a sugar factory
site). The heat obtained from the combustion of biomass can be used for several useful processes
such as cooking, industrial heat requirements, steam generation, generation of electrical energy
from steam etc. However, when the energy is to be transported over a long distance, it is more
economical to convert the biomass into liquid or gaseous fuels and then transport them through
pipeline or by tanks and use the fuels in liquid or gaseous forms at the receiving end.
Alternatively the biomass is converted to electrical energy in a biomass thermal electrical power
plant and the energy is transmitted in electrical power to the load center (Corella et al. 2007).
Literature Survey
6
The applications of biomass combustion process cover a wide range of ratings from a
fraction of kilowatt (for cooking) to a few megawatts (in municipal waste-to-energy electrical
power plant).
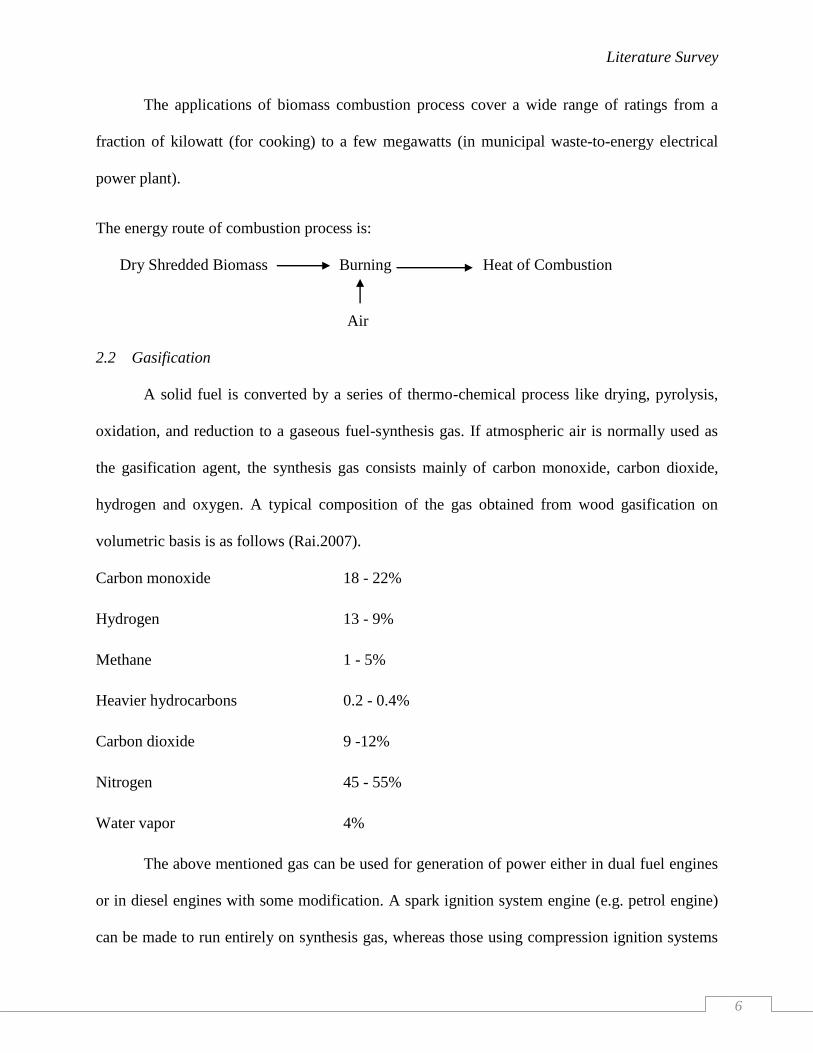
The energy route of combustion process is:
Dry Shredded Biomass Burning Heat of Combustion
Air
2.2 Gasification
A solid fuel is converted by a series of thermo-chemical process like drying, pyrolysis,
oxidation, and reduction to a gaseous fuel-synthesis gas. If atmospheric air is normally used as
the gasification agent, the synthesis gas consists mainly of carbon monoxide, carbon dioxide,
hydrogen and oxygen. A typical composition of the gas obtained from wood gasification on
volumetric basis is as follows (Rai.2007).
Carbon monoxide 18 - 22%
Hydrogen 13 - 9%
Methane 1 - 5%
Heavier hydrocarbons 0.2 - 0.4%
Carbon dioxide 9 -12%
Nitrogen 45 - 55%
Water vapor 4%
The above mentioned gas can be used for generation of power either in dual fuel engines
or in diesel engines with some modification. A spark ignition system engine (e.g. petrol engine)
can be made to run entirely on synthesis gas, whereas those using compression ignition systems
Literature Survey
7
engines (e.g. diesel engine) can be made to operate with about 60% - 80% fuel oil replacement
by the gas. In larger systems, the gas can be burnt directly (e.g. industrial oil fired boiler).
As mentioned earlier, complete combustion takes place with excess air or at least 100%
theoretical air, whereas gasification process takes place with excess carbon. The gasification of
solid fuels containing carbon is accomplished in an air sealed, closed chamber under slight
vacuum or pressure relative to ambient pressure. The fuel column is ignited at one point and
exposed to the air blast. The gas is drawn off at another location. Depending upon the positions
of air inlet and gas withdrawal point with reference to the fuel bed movement, three types of
gasifiers have been designed and operated to date. They are as follows: (a) up-draft gasifier, (b)
down-draft gasifier and (c) cross draft gasifier.
The advantages of a gasifier are:
i. It is very easy to operate the gasifier
ii. Its maintenance is easy
iii. It is simple in construction
iv. Reliable in operation
2.3Various Zones of Gasifier
The process of gasification taking place in various zones is distinguish and represented
by the variation of temperature and the process carried out in each zone. The zones are classified
as:
1. Drying zone
2. Pyrolysis zone
3. Reduction zone
4. Oxidation/ Combustion zone
Literature Survey
8
The reactions taking place in different zones are also required to be discussed. They are as
follows. Gasification involves a series of endothermic reactions supported by the heat produced
from the combustion reaction. Gasification yields combustible gases such as hydrogen, carbon
monoxide, and methane through a series of reactions. The following are four major gasification
reactions (Basu, 2006).
1. Water gas reaction
2. Boudouard reaction
3. Shift conversion
4. Methanation
Brief descriptions of the reactions in different zones are given below.
2.3.1 Drying Zone
The main operation in drying zone is the removal of moisture. The temperature prevailing in this
zone is 50°C-200°C. The radiant energy from the pyrolysis zone is the main energy for this zone.
In general this zone occupies more volume of a gasifier.
2.3.2 Pyrolysis Zone
Water gas reaction is the partial oxidation of carbon by steam, which could come from a host of
different sources, such as water vapor associated with the incoming air, vapor produced from the
evaporation of water, and pyrolysis of the solid fuel. Steam reacts with the hot carbon according
to the heterogeneous water gas reaction:
C + H2O = H2+ CO -131, 38 kJ/kg mol carbon
In some gasifiers, steam is supplied as the gasification medium with or without air or oxygen.
Literature Survey
9
2.3.3 Reduction Zone
The carbon dioxide present in the gasifier reacts with char to produce CO according to the
following endothermic reaction, which is known as the Boudouard reaction:
CO2 +C = 2CO -172, 58 kJ/mole carbon
2.3.4 Oxidation/combustion zone
Shift conversion and methanation are two major reactions taking place in this zone. The heating
value of hydrogen is higher than that of carbon monoxide. Therefore, the reduction of steam by
carbon monoxide to produce hydrogen is a highly desirable reaction.
CO + H2O = CO2+ H2 - 41, 98 kJ/mole carbon
This endothermic reaction, known as water–gas shift, results in an increase in the ratio of
hydrogen to carbon monoxide in the gas, and is employed in the manufacture of synthesis gas.
Methane also form in the gasifier through the following overall reaction:
C +2H2= CH4 +74, 90 kJ/mole carbon
This reaction can be accelerated by nickel-based catalyst at 11000C and 6 to 8 bar. Methane
formation is preferred especially when the gasification products are to be used as a feedstock for
other chemical processes.
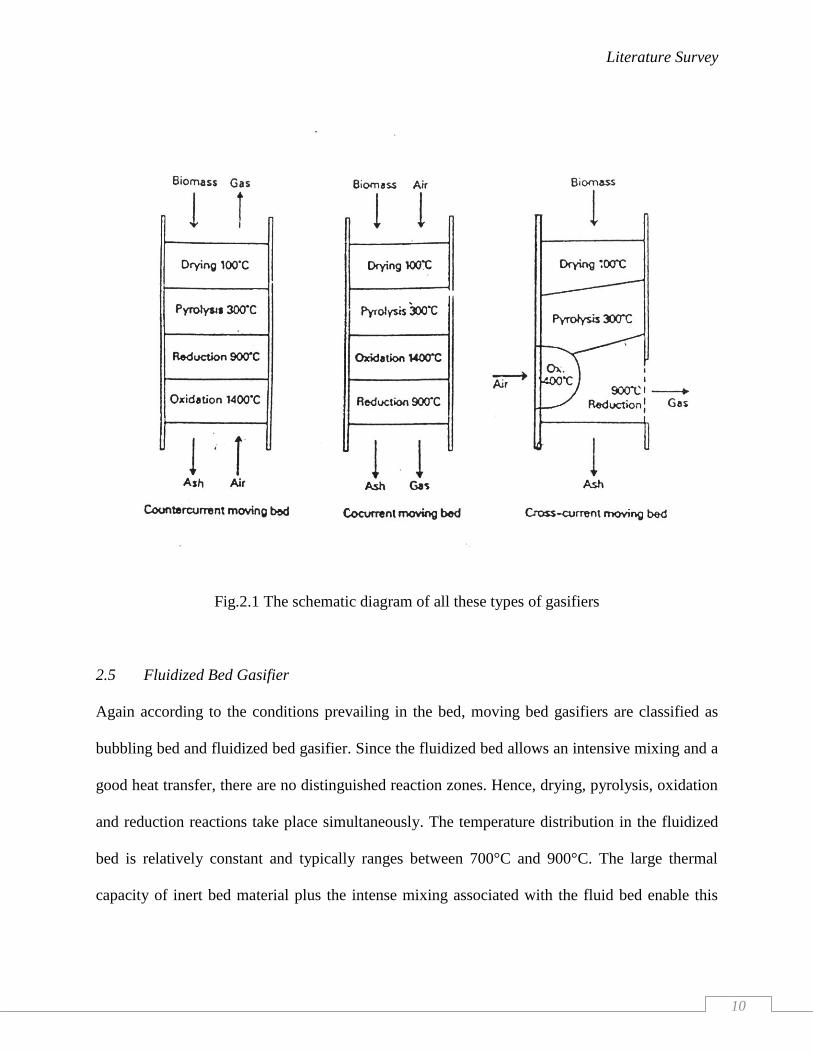
2.4 Classification of Gasifiers
Depending upon the bed movement, gasifiers are of two types i.e. fixed bed gasifier and moving
bed gasifiers. Again according to the mode of contact of feedstock and gasifying medium the
gasification system is classified in three categories as described in Fig.2.1. All these are as
moving bed type gasifiers with different type contacts as follows:
1. Counter current (Up-draught)
2. Co-current (Down-draught)
3. Cross current (Cross-draught)
Literature Survey
10
Fig.2.1 The schematic diagram of all these types of gasifiers
2.5 Fluidized Bed Gasifier
Again according to the conditions prevailing in the bed, moving bed gasifiers are classified as
bubbling bed and fluidized bed gasifier. Since the fluidized bed allows an intensive mixing and a
good heat transfer, there are no distinguished reaction zones. Hence, drying, pyrolysis, oxidation
and reduction reactions take place simultaneously. The temperature distribution in the fluidized
bed is relatively constant and typically ranges between 700°C and 900°C. The large thermal
capacity of inert bed material plus the intense mixing associated with the fluid bed enable this
Literature Survey
11
system to handle a much greater quantity and normally, a much lower quality of fuel(Li et al.
2004).
Fluidized bed Gasifiers are very easy to operate, easy to maintain, quick to start up, high
combustion efficiency, high output, rapid response to fuel input changes, uniform temperature in
the bed, low restart time, simple in construction and reliable in operation. Therefore the present
work is focused on Fluidized Bed Gasifier.
2.6 Previous Work
Ramirez et al. (2007) suggested on the basic design of a pilot scale Fluidized Bed Gasifier for
handling Rice Husk. According to them the gasifier was divided in seven parts or sub-systems
intending to produce an energetic gas. Experimental tests conducted with such a gasifier showed
that the developed procedure is adequate with a maximum deviation of 50% for the operational
performance variables.
Kumar et al. (2009) modified steam and air fluidized bench-scale FBG. The effects of furnace
temperature, steam to biomass ratio and equivalence ratio on gas composition, carbon conversion
efficiency and energy conversion efficiency of the product gas were studied by them.
Murakami et al. (2006) discussed on some process fundamentals for biomass gasification in dual
fluidized bed. The dual fluidized bed gasification technology is prospective because it produces
high calorie product gas, free of N2 even when air is used to generate the heat required for
gasification via in situ combustion. The necessary process fundamentals for development of a
bubbling fluidized bed (BFB) biomass gasifier coupled with pneumatic transported riser (PTR)
char combustor were also studied by them.
Natarajan et al. (1998) determined agglomeration tendencies of some common agricultural
residues in fluidized bed combustion and gasification system. It is observed that the combustion
zone temperature is in the order of 900 – 10000C as in moving bed gasifiers and 800-900
0C in

Literature Survey
12
fluidized bed gasifiers. The ashes of biomass feed stocks were observed to have ash fusion
temperatures in the range of 8000C to 1500
0C.
Rao et al. (2002) worked on thermo chemical characterization of various biomass samples using
down draft gasifier and fixed bed and fluidized bed gasifiers. They observed that producer gas
obtained is contaminated with tars, chars and ash particles to different degree depending upon
the reactor type and feed stock utilized. The moisture content varies over a wide range from
oven dry to about 90% on wet basis and ash content varies from 0.5 to 22%. Highest heating
value of 12-18 MJ.N/m3 was observed with producer gas.
Keijo (1995) studied co-combustion and gasification of various biomass samples using steam
gasification. Wood based fuel and waste agricultural wastes, waste paper etc. were used for heat
and power generation.
Schiffer et al. (1995) gasified different biomass samples including pulp and paper sludge to
municipal sludge. They used high temperature winkler (HTW) process where solid feed stocks
are gasified in a fluidized bed at elevated pressure using oxygen plus steam or air as gasification
agents. They observed that biomass and waste materials often incorporate a higher amount of
volatile matter, different proportions and compositions of inorganic matter having a significant
variety of physical properties in comparison with coal. Therefore, gasification or co-gasification
of peat, wood, sewage sludge has consequences with regard to feed stock preparation,
gasification behavior, corrosion, emissions and residues. Thus, they recommended that HTW
process is favorable for the conversion of Biomass.
Chern et al. (1998) used an empirical stoichiometric equation for wood chip gasification in a
commercial-scale moving bed downdraft gasifier. The equation is based on an analysis of overall
and elemental material balance for experimental data obtained with the gasifier. A
thermodynamic analysis of the gasifier has also been performed. Resultant empirical efficiencies
Literature Survey
13
of the gasifier have been evaluated for four different operating models at three different output
temperatures. The resultant empirical stoichiometry was found to be in agreement with the
experimental observations.
Warnecke (2000) carried out a comparative study on gasification process between fluidized and
fixed bed gasifier using different feed samples. Other aspects such as technology involved in the
process, energy consumption for the process, environmental problem caused by the process and
overall economy of the process were also analyzed by him. It was concluded that there is no
significant advantage with fixed bed gasifier or fluidized bed gasifier.

CHAPTER FOUR
MATERIALS AND METHODS WITH ENERGY CALCULATION
Materials and Methods with Energy Calculation
26
4.1 Materials
Different types of biomass are studied through proximate and ultimate analysis. These samples
are used in gasifier for production of hydrogen. The materials are required to be sized for using
in the fluidized bed gasifier.
4.1.1Collection, Sizing, Drying Of Biomass Sample and Bed Material
The following raw materials and bed materials have been used in the biomass gasification
experiments.
Raw material (Biomass samples): Saw dust, Rice husk, Rice straw
Bed material: Sand
Fluidizing Medium: Air supply
Gasification Medium: Steam supply
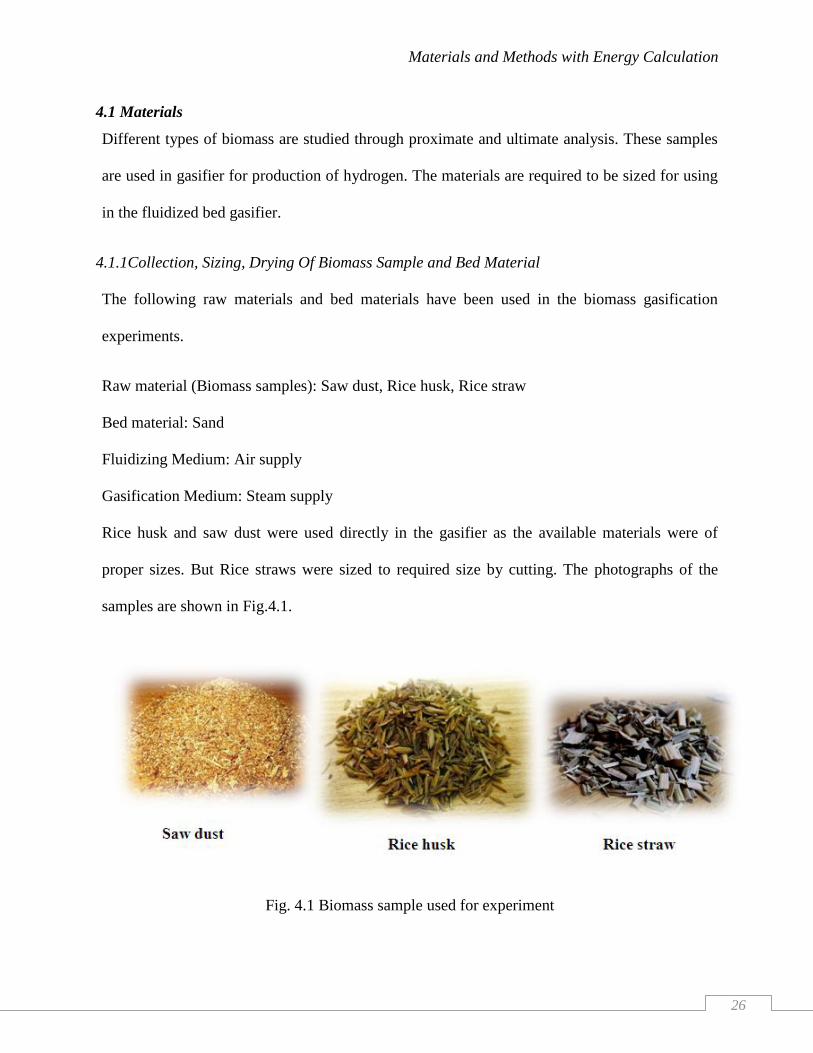
Rice husk and saw dust were used directly in the gasifier as the available materials were of
proper sizes. But Rice straws were sized to required size by cutting. The photographs of the
samples are shown in Fig.4.1.
Fig. 4.1 Biomass sample used for experiment
Materials and Methods with Energy Calculation
27
4.1.2 Different Parts of Experiment Setup
A blower with controlling valve is used for continuous air supply. A bubble cap air distributer is
provided at the bottom of gasifier. Two screw conveyers are provided, one for feeding the
biomass and second one is for feeding the bed materials. Arrangement for LPG supply and firing
point are also made. Three drainage points are located at different heights of the gasifier.
Detailed explanations have already been discussed in Chapter-3.
4.2 Methods
4.2.1 Analysis of Physical Properties
There are some other properties like bulk density, mean particle size, sphericity and porosity
which were required to be measured for experimentation. These were measured for the biomass
samples, which are as shown in Table - 4.1.
Table - 4.1Physical Properties of Biomass and bed material was studied
Property Mean particle size (mm) Apparent density (kg/m3) Porosity Sphericity
Bed material
Sand 0.38 2650 0.44 0.77
Biomass
Rice husk 0.53 426 0.81 0.37
Rice straw 2.6 153 0.46 0.56
Saw dust 0.81 244 0.7 0.45
4.2.2 Preliminary Analysis of the Biomass Samples
The following analyses have been carried out for the characterization of the different biomass
samples.
Ultimate analysis
Thermo gravimetric analysis (TGA)
Proximate analysis
Analysis of other properties
Materials and Methods with Energy Calculation
28
4.2.3 Ultimate analysis
Determination of total carbon, hydrogen, nitrogen, oxygen and sulfur percentages in the biomass
sample is carried out by its ultimate analysis. With the ultimate analysis for all these biomass
samples, the following results as shown in Table - 4.2 were obtained.
Table-4.2 Ultimate Analysis
Types of biomass Carbon (%) Hydrogen (%) Nitrogen (%) Sulfur (%) Oxygen (%)
Rice husk 38.45 4.96 0.82 0.18 55.59
Rice straw 36.6 4.55 0.47 0.21 58.17
Saw dust 45.78 5.32 0.18 0.07 48.65
4.2.4 Proximate analysis
Determination of moisture content, volatile matter, ash content and fixed carbon in the biomass
sample is known as the proximate analysis. The proximate analysis results for different biomass
samples give the following results which are listed in Table - 4.3.
Table - 4.3 Proximate Analyses
Biomass samples Moisture content (%) Volatile matter (%) Ash content (%) Fixed carbon (%)
Rice husk 7.34 56.37 15.83 20.46
Rice straw 9.38 69.53 3.04 18.05
Saw dust 8.8 87.57 1.94 16.45
4.2.5 Operating Procedure
Inert bed material is fed to the gasifier at first up to certain height. Biomass feed is fed
continuously by the screw conveyer carefully. A specified quantity of water is added into steam
generator for steam-generation. Feed stocks in the gasifier are then ignited by LPG to preheat the
Materials and Methods with Energy Calculation
29
bed material with in gasifier till the temperature reaches up to 550 - 6000C. The temperature of
the bed material within gasifier is increased gradually. By the time it reaches 8000C steam starts
pinching. When temperature at the neck and outer wall of furnace reaches 9000C gasifying
agents are driven into the gasifier and then the tests start up. The temperatures at 7 different
locations at different intervals of test are recorded. The gas yield is measured by a flow meter
simultaneously. Usually, the steady state is reached at around 15 minutes after startup and then
gas sampling is carried out at an interval of 10 minute. Every operating condition is repeated
twice to assure the reliability of the experimental results and the average of these observed
values are considered as the experimental results.
4.2.6 Output Measurement and Scope of Experiment
The aim of the present investigation is to improve and optimize the gasification efficiency by
varying the percentage of stoichiometric air and steam supply. Effect of equivalence ratio,
reaction temperature and steam to biomass ratio on the production as well as the composition of
syn-gas is also observed during the experimental work. Outputs from different biomass samples
used as feed material are also analyzed for future improvement.
Scope of this experiment is aimed to
i. Improve the calorific value of syn gas/Increase the percentage of H2 and CH4
ii. Reduce the char content in solid waste
iii. Make the process more economical and eco friendly
4.3 Chemical Formula of Biomass
The calculation of chemical formula is important to determine the stoichiometric amount of air
required for the combustion of the biomass samples. A sample calculation for finding the
chemical formula Rice husk is discussed below (Roy, 1994).
Materials and Methods with Energy Calculation
30
Sample calculation for chemical formula of Rice Husk:
Weight of rice husk sample =12.34 mg
Analysis of Biomass (in wt %): C= 38.45%, H= 4.96%, N= 0.82 %, S= 0.18%, O= 55.29%
(A) Using the composition of rice husk found from Ultimate analysis, the amount of different
elements in this sample are calculated as follows:
Amount of Carbon = (38.45×12.34)/100= 4.74
Amount of Hydrogen = (4.96×12.34)/100= 0.612
Amount of Nitrogen = (0.82×12.34)/100=0.101
Amount of Sulfur = (0.18×12.34)/100= 0.022
Amount of oxygen = (55.89×12.34)/100= 6.897
(B) Number of moles of different elements present in this sample is calculated as follows:
No. of moles of Carbon = 4.74/12= 0.395
No. of atoms of Hydrogen = 0.612/1= 0.306
No. of moles of Nitrogen = 0.101/14=0.0072≈0
No. of moles of Sulfur = 0.022/32= 0.000694
No. of moles of Oxygen= 6.89/16= 0.431
Hence the total no. of moles = 0.395+0.306+0.431+0.0072+0.000694=1.13989 1.14
(C) Number of moles= mass/molecular weight
Mass= 12.34 mg, Number of moles =1.14
Thus, molecular weight = mass / no. of moles= 12.34/1.14= 10.82
(D) Amount of Carbon = (10.82×38.45)/ 100= 4.16mg
Atoms of Carbon = 4.16/12= 0.3467
Amount of Hydrogen = (10.82×4.96)/100= 0.5367 mg
Materials and Methods with Energy Calculation
31
Atoms of Hydrogen = 0.5367/2= 0.268
Amount of Oxygen= (10.82×55.59)/100= 6.015 mg
Atoms of Oxygen= 6.015/16= 0.376
Amount of Nitrogen = (10.82×0.82)/100 = 0.088724 mg
Atoms of Nitrogen = 6.015/14 = 0.0061
Amount of Sulfur = (10.82×0.18)/100 = 0.019476 mg
Atoms of Sulfur = 0.019476/32= 0.000608
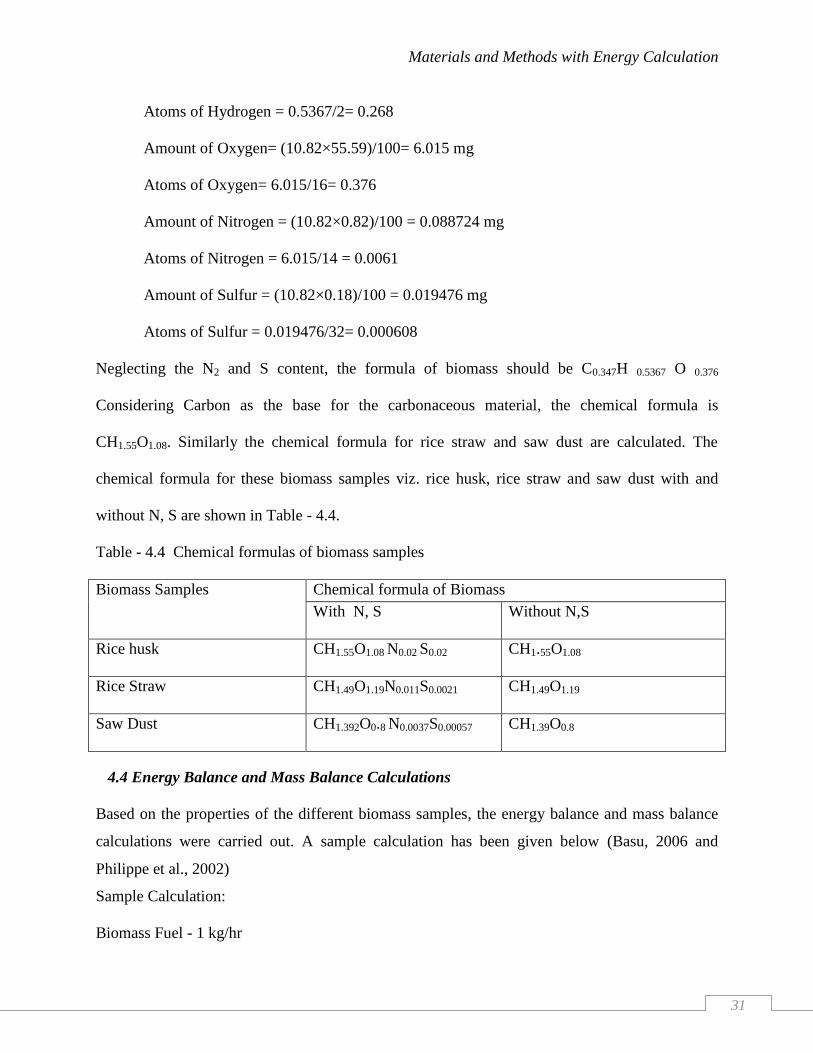
Neglecting the N2 and S content, the formula of biomass should be C0.347H 0.5367 O 0.376
Considering Carbon as the base for the carbonaceous material, the chemical formula is
CH1.55O1.08. Similarly the chemical formula for rice straw and saw dust are calculated. The
chemical formula for these biomass samples viz. rice husk, rice straw and saw dust with and
without N, S are shown in Table - 4.4.
Table - 4.4 Chemical formulas of biomass samples
Biomass Samples Chemical formula of Biomass
With N, S Without N,S
Rice husk CH1.55O1.08 N0.02 S0.02 CH1.55O1.08
Rice Straw CH1.49O1.19N0.011S0.0021 CH1.49O1.19
Saw Dust CH1.392O0.8 N0.0037S0.00057 CH1.39O0.8
4.4 Energy Balance and Mass Balance Calculations
Based on the properties of the different biomass samples, the energy balance and mass balance
calculations were carried out. A sample calculation has been given below (Basu, 2006 and
Philippe et al., 2002)
Sample Calculation:
Biomass Fuel - 1 kg/hr
Materials and Methods with Energy Calculation
32
Steam – 0.117 kg/kg of biomass
Moisture is 8%
Specific Humidity of air 0.01kg of moisture per kg of dry air.
Composition of Rice Husk (weight %)
H = 4.96 %, C = 38.45 %, N =0.82 %, O= 55.59 %, S = 0.18%
Product Syn gas:
H2 =12.28%, CH4 = 2.60%, CO = 9.2%, CO2 = 7.78%, N2 = 50%
Let dry air be supplied at 2.771kg / kg fuel
HHV=16.2 MJ/kg
Basis: 1 kg of fuel 0.8kg moisture, 0.92kg dry fuel
4.4.1 Material balance:
Nitrogen
Air contains 76.9% N2 by mass
So N2 from air= 0.769 ×2.771 = 2.130 kg N2/ kg BM
Total N2 supplied by air and fuel which carry 0.82% N2
= 2.130+ 0.0082 = 2.1390 kg N2 / kg BM
= 2.1390/28=0.0763 kg mol / kg BM
We know cleaned gas contains 50% N2.
Hence the amount of product gas produced
= 0.0763/ 0.5 = 0.1528 kg mol N2gas / kg BM
Oxygen
Oxygen supplied to gasifier is (with air)
= 0.2315 ×2.771= 0.6414 kg/kg BM
Materials and Methods with Energy Calculation
33
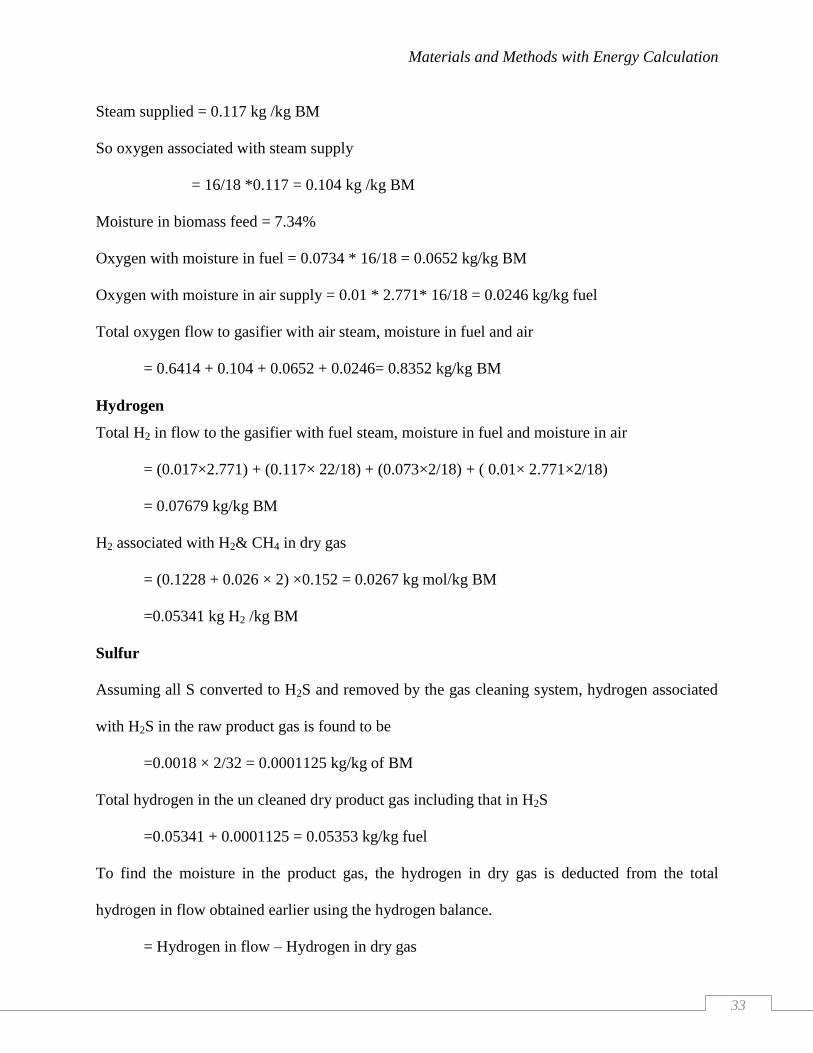
Steam supplied = 0.117 kg /kg BM
So oxygen associated with steam supply
= 16/18 *0.117 = 0.104 kg /kg BM
Moisture in biomass feed = 7.34%
Oxygen with moisture in fuel = 0.0734 * 16/18 = 0.0652 kg/kg BM
Oxygen with moisture in air supply = 0.01 * 2.771* 16/18 = 0.0246 kg/kg fuel
Total oxygen flow to gasifier with air steam, moisture in fuel and air
= 0.6414 + 0.104 + 0.0652 + 0.0246= 0.8352 kg/kg BM
Hydrogen
Total H2 in flow to the gasifier with fuel steam, moisture in fuel and moisture in air
= (0.017×2.771) + (0.117× 22/18) + (0.073×2/18) + ( 0.01× 2.771×2/18)
= 0.07679 kg/kg BM
H2 associated with H2& CH4 in dry gas
= (0.1228 + 0.026 × 2) ×0.152 = 0.0267 kg mol/kg BM
=0.05341 kg H2 /kg BM
Sulfur
Assuming all S converted to H2S and removed by the gas cleaning system, hydrogen associated
with H2S in the raw product gas is found to be
=0.0018 × 2/32 = 0.0001125 kg/kg of BM
Total hydrogen in the un cleaned dry product gas including that in H2S
=0.05341 + 0.0001125 = 0.05353 kg/kg fuel
To find the moisture in the product gas, the hydrogen in dry gas is deducted from the total
hydrogen in flow obtained earlier using the hydrogen balance.
= Hydrogen in flow – Hydrogen in dry gas
Materials and Methods with Energy Calculation
34
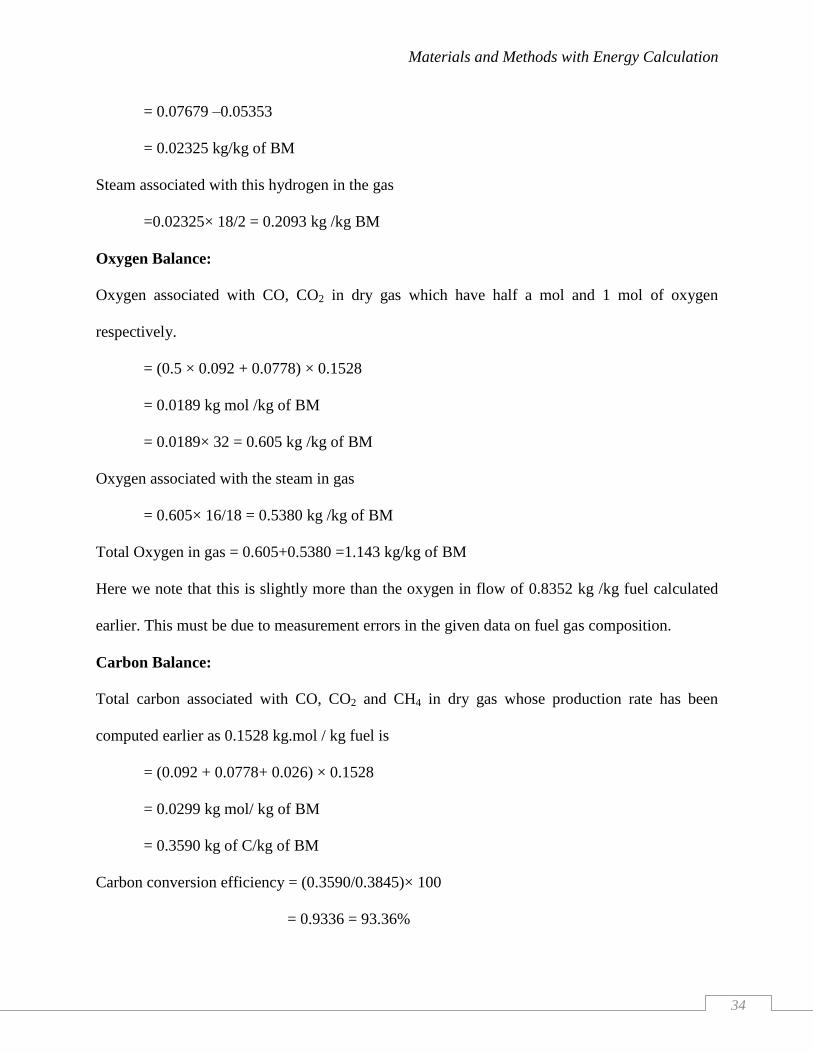
= 0.07679 –0.05353
= 0.02325 kg/kg of BM
Steam associated with this hydrogen in the gas
=0.02325× 18/2 = 0.2093 kg /kg BM
Oxygen Balance:
Oxygen associated with CO, CO2 in dry gas which have half a mol and 1 mol of oxygen
respectively.
= (0.5 × 0.092 + 0.0778) × 0.1528
= 0.0189 kg mol /kg of BM
= 0.0189× 32 = 0.605 kg /kg of BM
Oxygen associated with the steam in gas
= 0.605× 16/18 = 0.5380 kg /kg of BM
Total Oxygen in gas = 0.605+0.5380 =1.143 kg/kg of BM
Here we note that this is slightly more than the oxygen in flow of 0.8352 kg /kg fuel calculated
earlier. This must be due to measurement errors in the given data on fuel gas composition.
Carbon Balance:
Total carbon associated with CO, CO2 and CH4 in dry gas whose production rate has been
computed earlier as 0.1528 kg.mol / kg fuel is
= (0.092 + 0.0778+ 0.026) × 0.1528
= 0.0299 kg mol/ kg of BM
= 0.3590 kg of C/kg of BM
Carbon conversion efficiency = (0.3590/0.3845)× 100
= 0.9336 = 93.36%
Materials and Methods with Energy Calculation
35
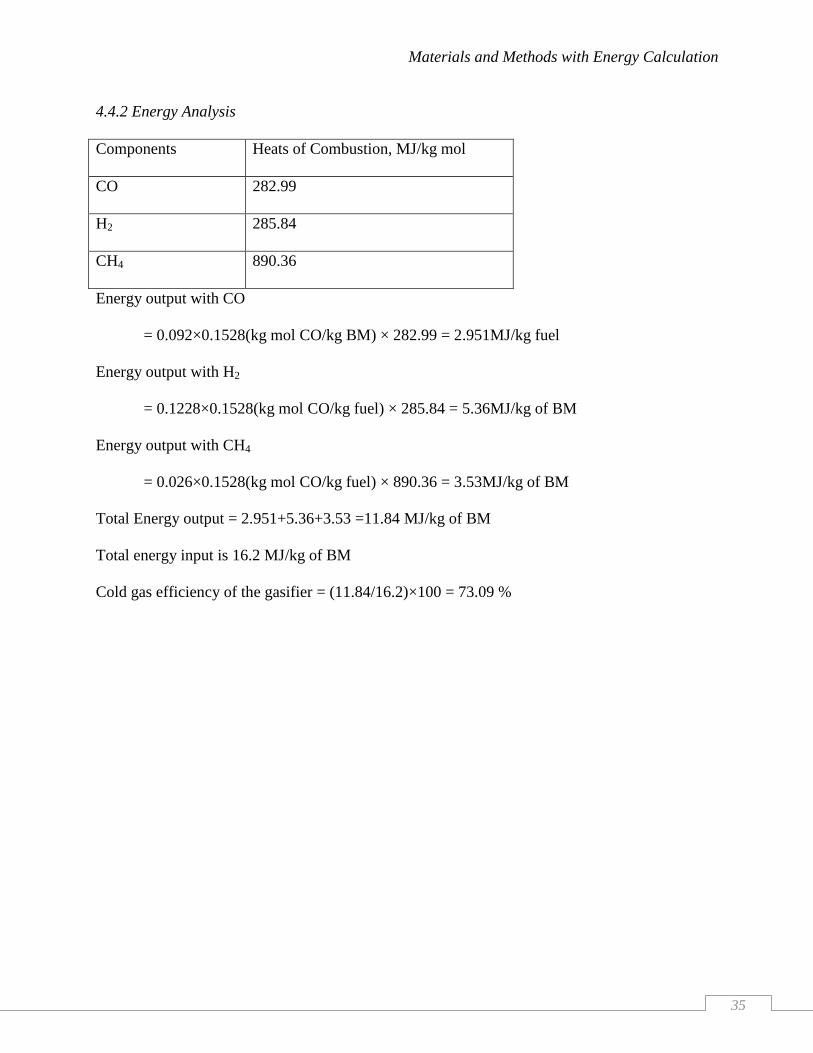
4.4.2 Energy Analysis
Components Heats of Combustion, MJ/kg mol
CO 282.99
H2 285.84
CH4 890.36
Energy output with CO
= 0.092×0.1528(kg mol CO/kg BM) × 282.99 = 2.951MJ/kg fuel
Energy output with H2
= 0.1228×0.1528(kg mol CO/kg fuel) × 285.84 = 5.36MJ/kg of BM
Energy output with CH4
= 0.026×0.1528(kg mol CO/kg fuel) × 890.36 = 3.53MJ/kg of BM
Total Energy output = 2.951+5.36+3.53 =11.84 MJ/kg of BM
Total energy input is 16.2 MJ/kg of BM
Cold gas efficiency of the gasifier = (11.84/16.2)×100 = 73.09 %

CHAPTER FIVE
ASPEN PLUS SIMULATION, EXPERIMENTAL OBSERVATIONS AND RESULTS
ASPENPlus Simulation Observations And Experiment Results
37
5.1 ASPEN Plus Simulation
ASPEN Plus simulator is used to model and predict the performance of a process which involves
the decomposition of the process into its constituent elements for performance study of
individual elements. It is also widely used to study and investigate the effect of various operating
parameters on various reactions. (Frederic et al., 2009 and Nikoo etal.,2008)
5.1.1 Assumptions
The following assumptions were considered in modeling in the gasification process
The gasification process is isothermal and steady state.
Biomass de-volatilization is instantaneous in comparison to char gasification.
The biomass particles are spherical and are not affected in course of the reaction.
All the gases are uniformly distributed within the emulsion phase.
Char consists of only carbon ash.
Char gasification starts in the bed and ends in the freeboard.
5.1.2 ASPEN Plus Model
Four different stages considered in ASPEN Plus simulation are decomposition of the feed,
volatile reactions, char gasification and gas solid separation.
5.1.3 Biomass Decomposition
The ASPEN Plus yield reactor, RYield was used to simulate the decomposition of the feed. It is
used when reaction stoichiometry is unknown or unimportant andreaction kinetic is unknown or
unimportant but yield distribution is known.In this step, biomass is converted into its
components which include carbon, oxygen,hydrogen, sulfur, nitrogen and ash by specifying the
quantities according to its ultimate analysis.
ASPENPlus Simulation Observations And Experiment Results
38
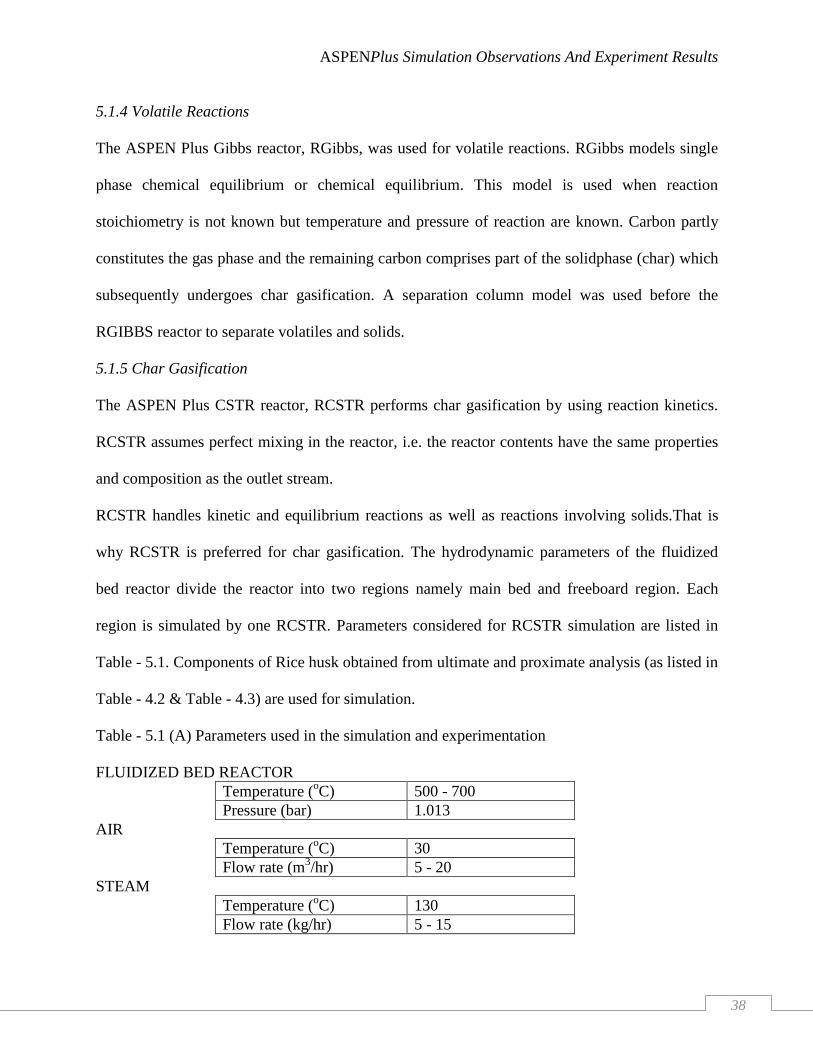
5.1.4 Volatile Reactions
The ASPEN Plus Gibbs reactor, RGibbs, was used for volatile reactions. RGibbs models single
phase chemical equilibrium or chemical equilibrium. This model is used when reaction
stoichiometry is not known but temperature and pressure of reaction are known. Carbon partly
constitutes the gas phase and the remaining carbon comprises part of the solidphase (char) which
subsequently undergoes char gasification. A separation column model was used before the
RGIBBS reactor to separate volatiles and solids.
5.1.5 Char Gasification
The ASPEN Plus CSTR reactor, RCSTR performs char gasification by using reaction kinetics.
RCSTR assumes perfect mixing in the reactor, i.e. the reactor contents have the same properties
and composition as the outlet stream.
RCSTR handles kinetic and equilibrium reactions as well as reactions involving solids.That is
why RCSTR is preferred for char gasification. The hydrodynamic parameters of the fluidized
bed reactor divide the reactor into two regions namely main bed and freeboard region. Each
region is simulated by one RCSTR. Parameters considered for RCSTR simulation are listed in
Table - 5.1. Components of Rice husk obtained from ultimate and proximate analysis (as listed in
Table - 4.2 & Table - 4.3) are used for simulation.
Table - 5.1 (A) Parameters used in the simulation and experimentation
FLUIDIZED BED REACTOR
Temperature (oC) 500 - 700
Pressure (bar) 1.013
AIR
Temperature (oC) 30
Flow rate (m3/hr) 5 - 20
STEAM
Temperature (oC) 130
Flow rate (kg/hr) 5 - 15
ASPENPlus Simulation Observations And Experiment Results
39
Table -5.1 (B) :GASIFICATION REACTIONS AND THEIR KINETIC PARAMETERS
Reactions Rate constant(sec-1
atm-1)
Activation energy
(kJ/mole of carbon)
C + H2O H
2 + CO 6474.7 13130
CO2
+ C 2CO 6474.7 17250
CO + H2O CO
2 + H
2 6474.7 4198
C + 2H2CH
4 6474.7 7481
C + 0.5 O2 CO 0.046 110.50
C + O2 CO
2 0.046 393.77
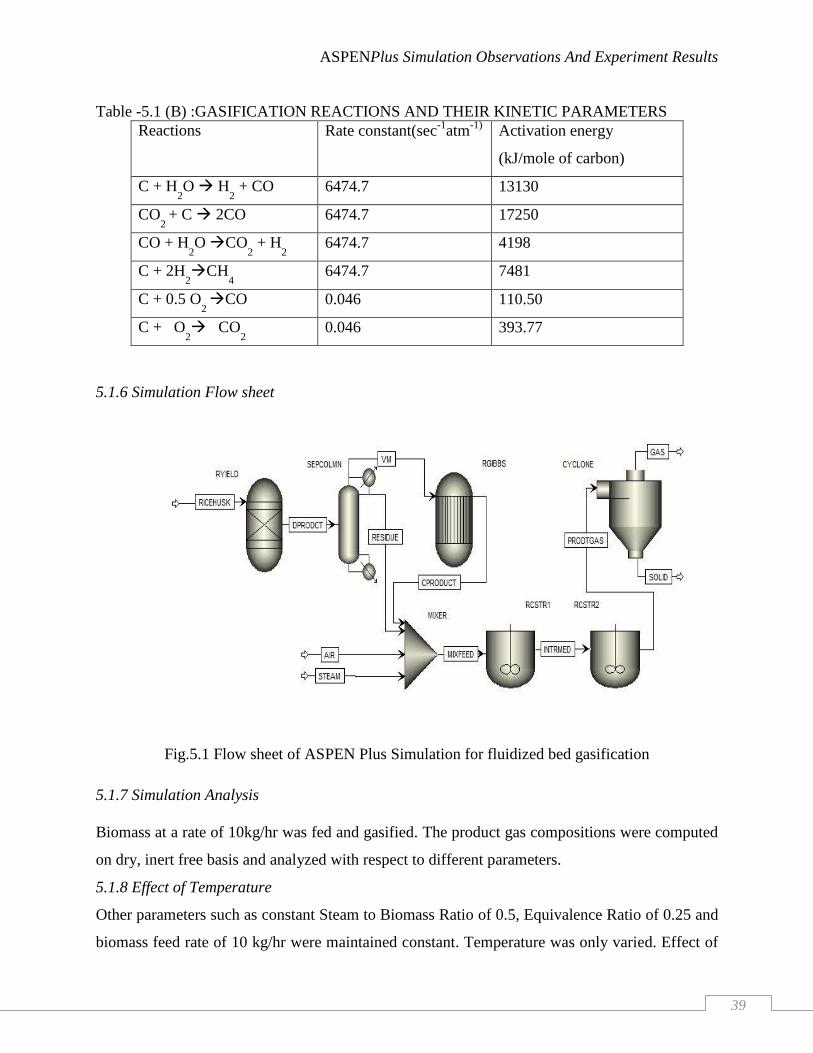
5.1.6 Simulation Flow sheet
Fig.5.1 Flow sheet of ASPEN Plus Simulation for fluidized bed gasification
5.1.7 Simulation Analysis
Biomass at a rate of 10kg/hr was fed and gasified. The product gas compositions were computed
on dry, inert free basis and analyzed with respect to different parameters.
5.1.8 Effect of Temperature
Other parameters such as constant Steam to Biomass Ratio of 0.5, Equivalence Ratio of 0.25 and
biomass feed rate of 10 kg/hr were maintained constant. Temperature was only varied. Effect of

ASPENPlus Simulation Observations And Experiment Results
40
temperature on product gas composition was studied by varying temperature within 500-7000C.
Observed data are listed in Table - A-1 (Appendix-A). Variation of product gas composition
against temperature has been shown in Fig. 5.2
Fig. 5.2 Simulated product gas composition versus temperature
5.1.9 Effect of Equivalence Ratio
Effect of ER on product gas composition was analyzed by varying E.R and keeping constant
Steam to Biomass Ratio at 0.5 and constant Temperature at 7000C, Biomass feeding rate at 10
kg/hr. Table - A-2 (Appendix-A) and variation of product gas composition against ER is shown
in Fig. 5.3.
Fig. 5.3 Simulated product gas composition versus equivalence ratio
ASPENPlus Simulation Observations And Experiment Results
41
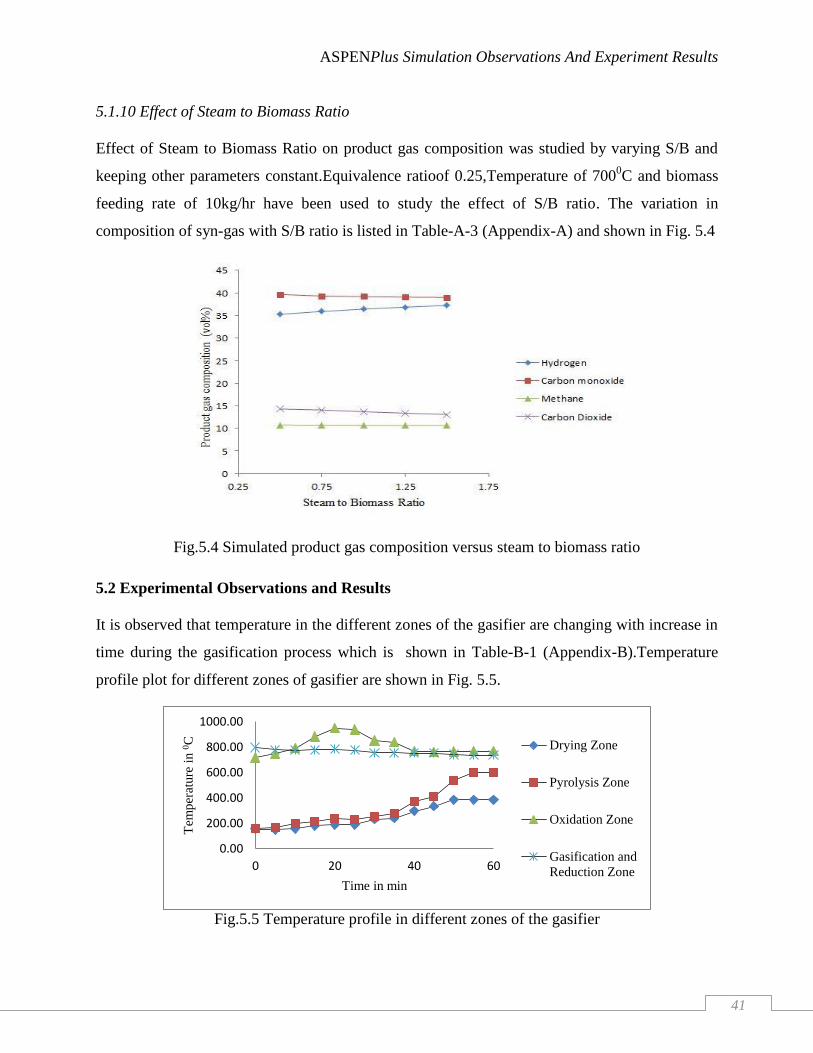
5.1.10 Effect of Steam to Biomass Ratio
Effect of Steam to Biomass Ratio on product gas composition was studied by varying S/B and
keeping other parameters constant.Equivalence ratioof 0.25,Temperature of 7000C and biomass
feeding rate of 10kg/hr have been used to study the effect of S/B ratio. The variation in
composition of syn-gas with S/B ratio is listed in Table-A-3 (Appendix-A) and shown in Fig. 5.4
Fig.5.4 Simulated product gas composition versus steam to biomass ratio
5.2 Experimental Observations and Results
It is observed that temperature in the different zones of the gasifier are changing with increase in
time during the gasification process which is shown in Table-B-1 (Appendix-B).Temperature
profile plot for different zones of gasifier are shown in Fig. 5.5.
Fig.5.5 Temperature profile in different zones of the gasifier
0.00
200.00
400.00
600.00
800.00
1000.00
0 20 40 60
Tem
per
ature
in 0
C
Time in min
Drying Zone
Pyrolysis Zone
Oxidation Zone
Gasification and
Reduction Zone
ASPENPlus Simulation Observations And Experiment Results
42
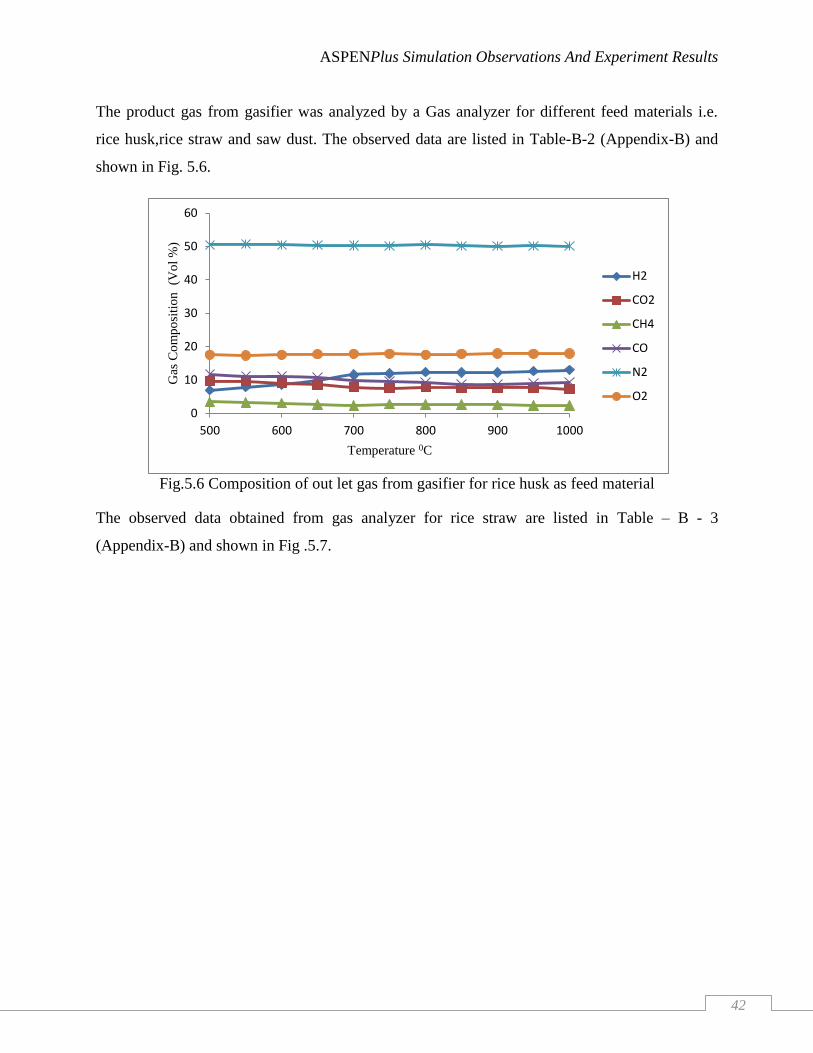
The product gas from gasifier was analyzed by a Gas analyzer for different feed materials i.e.
rice husk,rice straw and saw dust. The observed data are listed in Table-B-2 (Appendix-B) and
shown in Fig. 5.6.
Fig.5.6 Composition of out let gas from gasifier for rice husk as feed material
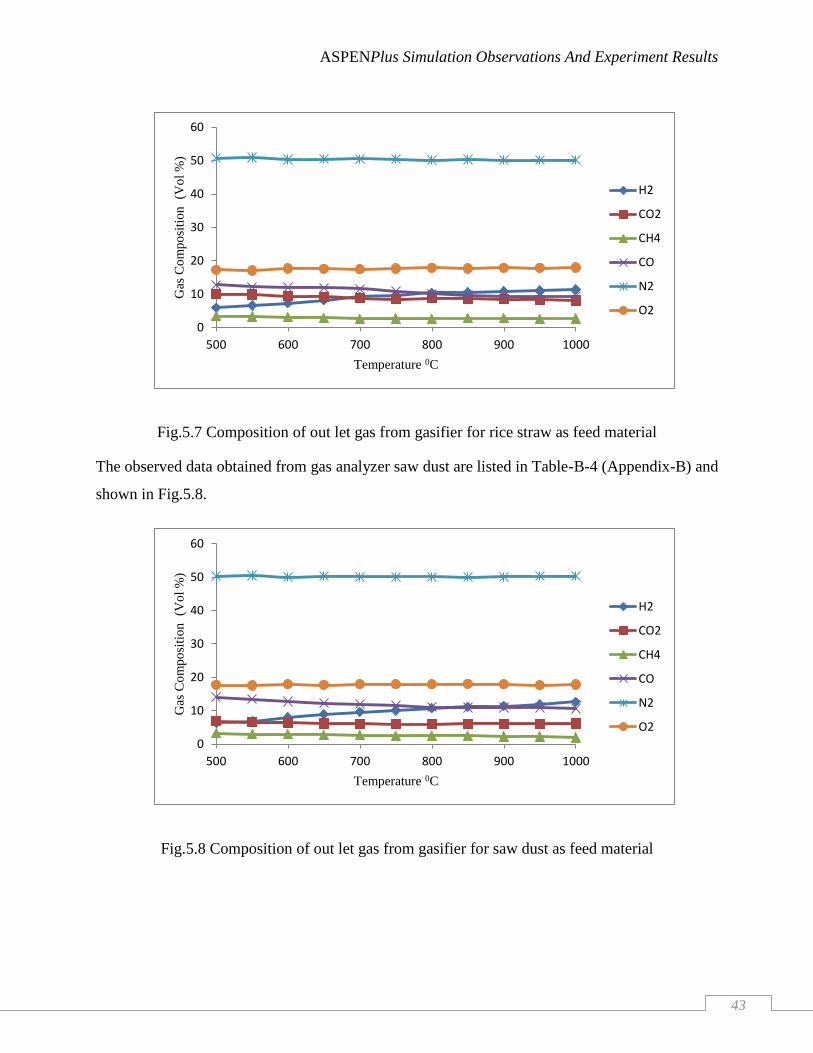
The observed data obtained from gas analyzer for rice straw are listed in Table – B - 3
(Appendix-B) and shown in Fig .5.7.
0
10
20
30
40
50
60
500 600 700 800 900 1000
Gas
Co
mp
osi
tio
n
(Vo
l %
)
Temperature 0C
H2
CO2
CH4
CO
N2
O2
ASPENPlus Simulation Observations And Experiment Results
43
Fig.5.7 Composition of out let gas from gasifier for rice straw as feed material
The observed data obtained from gas analyzer saw dust are listed in Table-B-4 (Appendix-B) and
shown in Fig.5.8.
Fig.5.8 Composition of out let gas from gasifier for saw dust as feed material
0
10
20
30
40
50
60
500 600 700 800 900 1000
Gas
Co
mp
osi
tio
n
(Vo
l %
)
Temperature 0C
H2
CO2
CH4
CO
N2
O2
0
10
20
30
40
50
60
500 600 700 800 900 1000
Gas
Co
mp
osi
tio
n
(Vo
l %
)
Temperature 0C
H2
CO2
CH4
CO
N2
O2
ASPENPlus Simulation Observations And Experiment Results
44
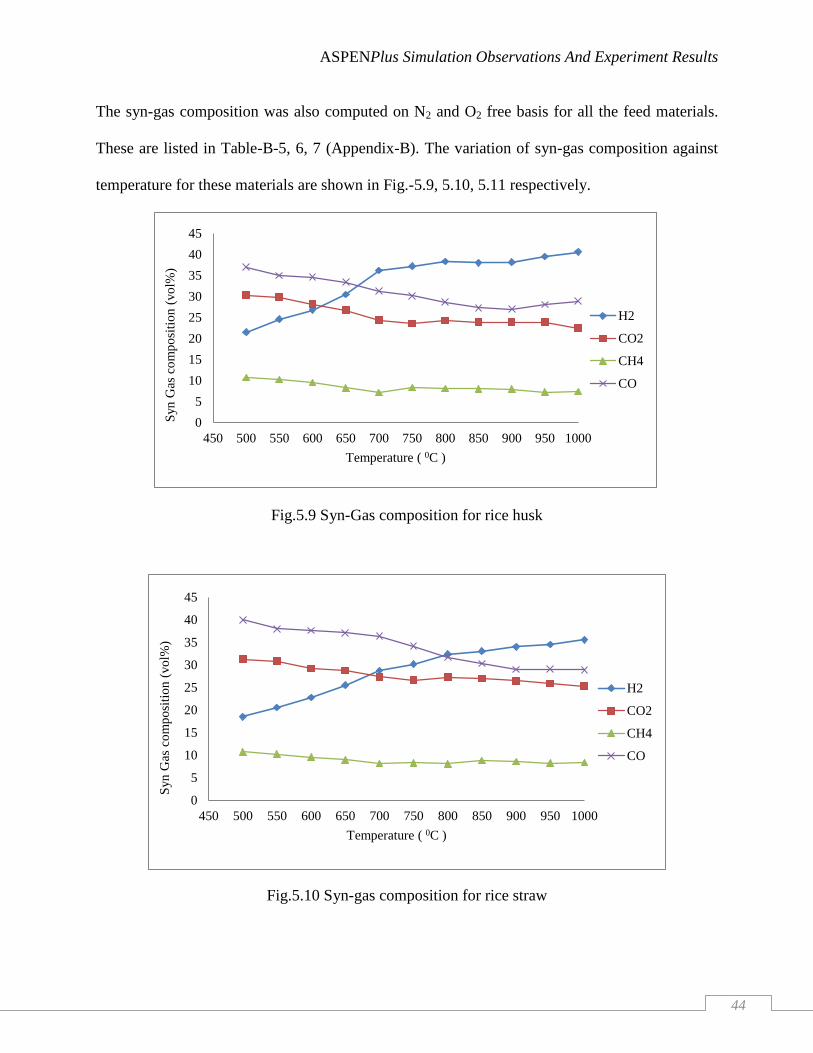
The syn-gas composition was also computed on N2 and O2 free basis for all the feed materials.
These are listed in Table-B-5, 6, 7 (Appendix-B). The variation of syn-gas composition against
temperature for these materials are shown in Fig.-5.9, 5.10, 5.11 respectively.
Fig.5.9 Syn-Gas composition for rice husk
Fig.5.10 Syn-gas composition for rice straw
0
5
10
15
20
25
30
35
40
45
450 500 550 600 650 700 750 800 850 900 950 1000
Syn G
as c
om
po
siti
on (
vo
l%)
Temperature ( 0C )
H2
CO2
CH4
CO
0
5
10
15
20
25
30
35
40
45
450 500 550 600 650 700 750 800 850 900 950 1000
Syn G
as c
om
po
siti
on (
vo
l%)
Temperature ( 0C )
H2
CO2
CH4
CO
ASPENPlus Simulation Observations And Experiment Results
45
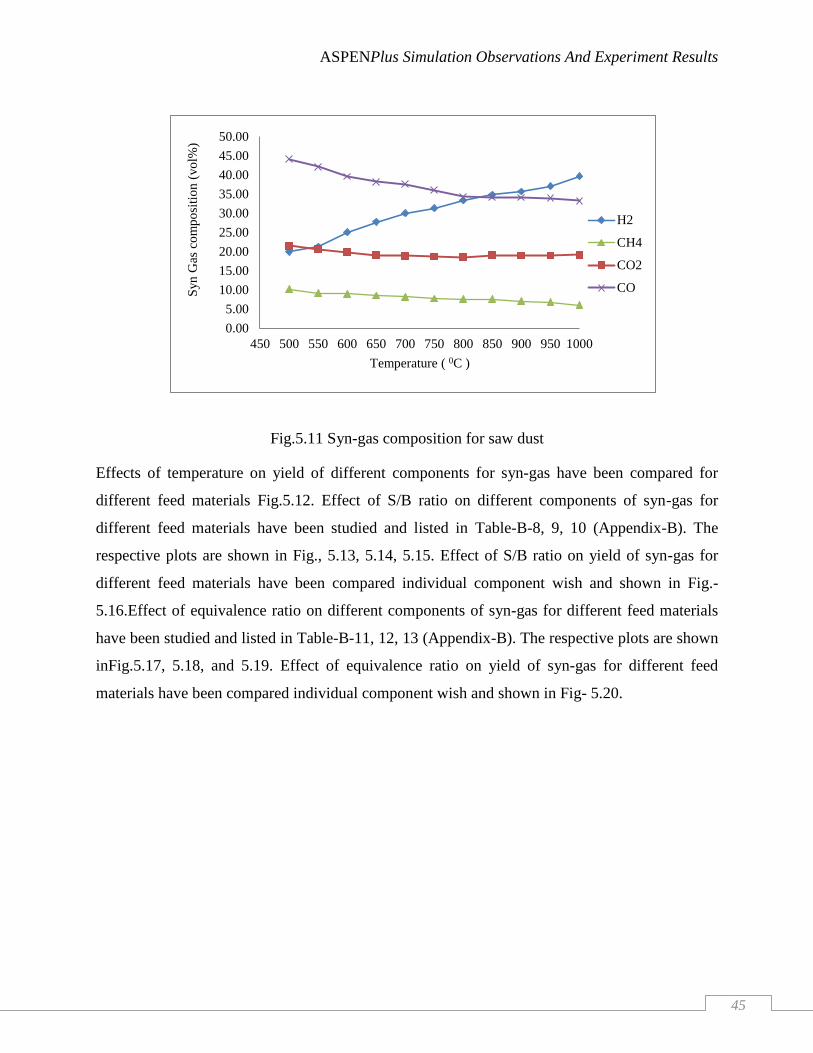
Fig.5.11 Syn-gas composition for saw dust
Effects of temperature on yield of different components for syn-gas have been compared for
different feed materials Fig.5.12. Effect of S/B ratio on different components of syn-gas for
different feed materials have been studied and listed in Table-B-8, 9, 10 (Appendix-B). The
respective plots are shown in Fig., 5.13, 5.14, 5.15. Effect of S/B ratio on yield of syn-gas for
different feed materials have been compared individual component wish and shown in Fig.-
5.16.Effect of equivalence ratio on different components of syn-gas for different feed materials
have been studied and listed in Table-B-11, 12, 13 (Appendix-B). The respective plots are shown
inFig.5.17, 5.18, and 5.19. Effect of equivalence ratio on yield of syn-gas for different feed
materials have been compared individual component wish and shown in Fig- 5.20.
0.00
5.00
10.00
15.00
20.00
25.00
30.00
35.00
40.00
45.00
50.00
450 500 550 600 650 700 750 800 850 900 950 1000
Syn G
as c
om
po
siti
on (
vo
l%)
Temperature ( 0C )
H2
CH4
CO2
CO
ASPENPlus Simulation Observations And Experiment Results
46
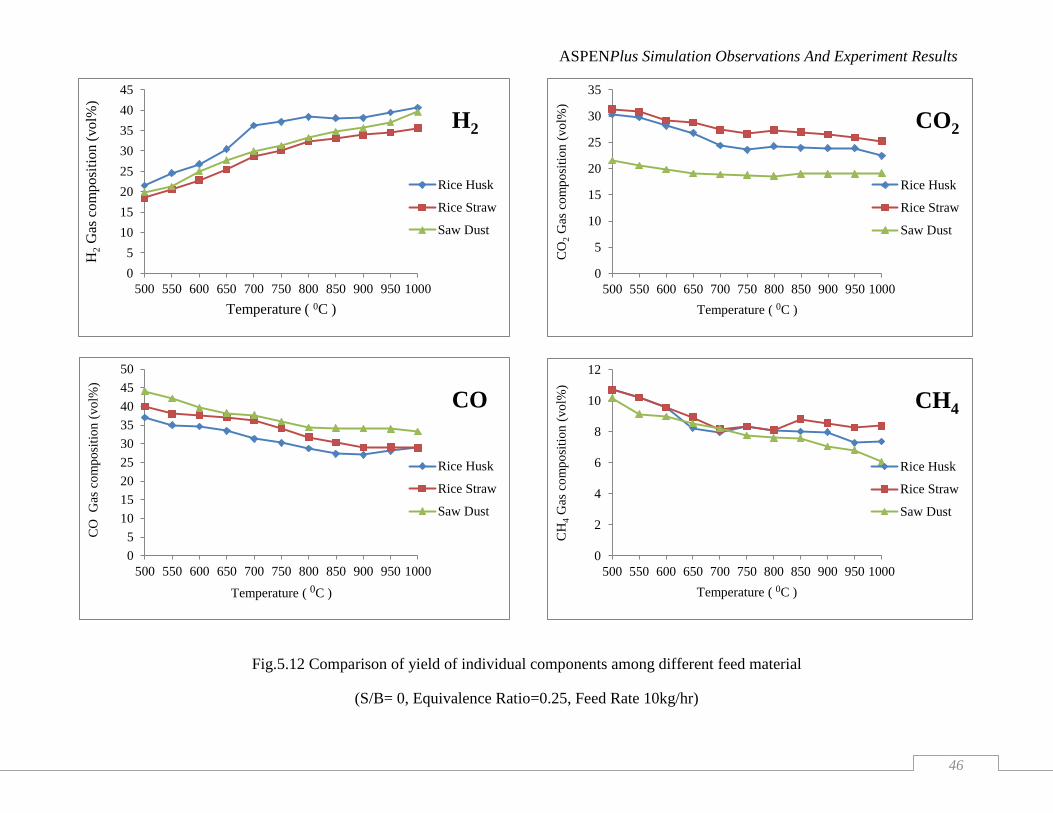
Fig.5.12 Comparison of yield of individual components among different feed material
(S/B= 0, Equivalence Ratio=0.25, Feed Rate 10kg/hr)
0
5
10
15
20
25
30
35
40
45
500 550 600 650 700 750 800 850 900 950 1000
H2 G
as c
om
posi
tion (
vo
l%)
Temperature ( 0C )
H2
Rice Husk
Rice Straw
Saw Dust
0
5
10
15
20
25
30
35
500 550 600 650 700 750 800 850 900 950 1000
CO
2 G
as c
om
po
siti
on (
vo
l%)
Temperature ( 0C )
CO2
Rice Husk
Rice Straw
Saw Dust
0
5
10
15
20
25
30
35
40
45
50
500 550 600 650 700 750 800 850 900 950 1000
CO
G
as c
om
po
siti
on (
vo
l%)
Temperature ( 0C )
CO
Rice Husk
Rice Straw
Saw Dust
0
2
4
6
8
10
12
500 550 600 650 700 750 800 850 900 950 1000C
H4 G
as c
om
po
siti
on (
vo
l%)
Temperature ( 0C )
CH4
Rice Husk
Rice Straw
Saw Dust
ASPENPlus Simulation Observations And Experiment Results
47
0
10
20
30
40
50
0.5 1 1.5 2 2.5
Syn G
as
Co
mp
osi
tio
n(V
ol
%)
S/B Ratio
H2
CO
CH4
CO2
0
5
10
15
20
25
30
35
40
45
50
0.5 1 1.5 2 2.5
Syn G
as C
om
po
siti
on(V
ol%
)
S/B Ratio
H2
CO
CH4
CO2
0
10
20
30
40
50
0.5 1 1.5 2 2.5Syn G
as C
om
po
siti
on(V
ol%
)
S/B Ratio
H2
CO
CH4
CO2
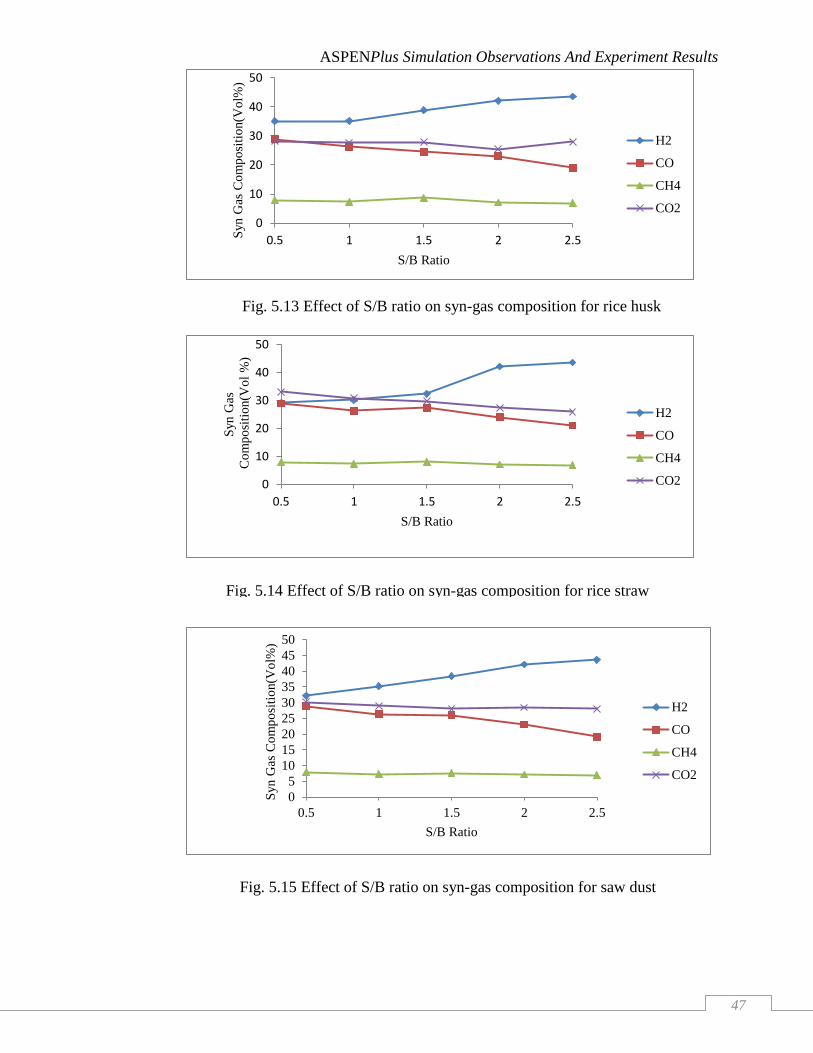
Fig. 5.13 Effect of S/B ratio on syn-gas composition for rice husk
Fig. 5.14 Effect of S/B ratio on syn-gas composition for rice straw
Fig. 5.15 Effect of S/B ratio on syn-gas composition for saw dust
ASPENPlus Simulation Observations And Experiment Results
48
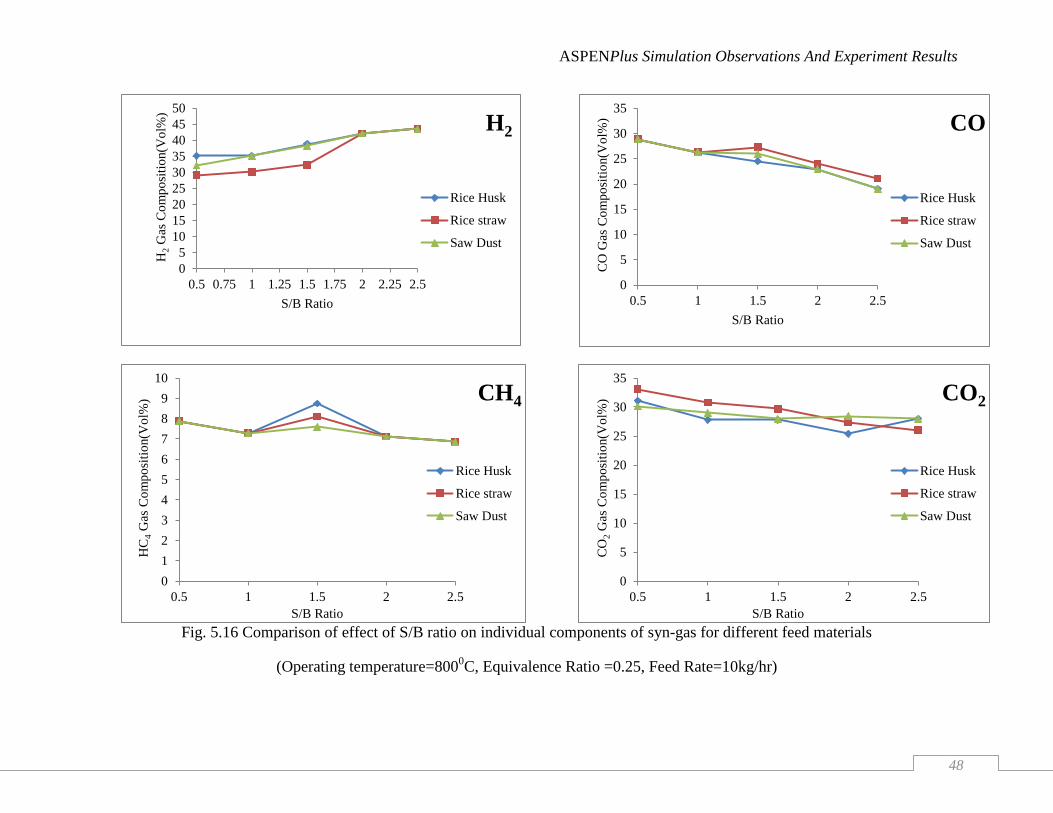
Fig. 5.16 Comparison of effect of S/B ratio on individual components of syn-gas for different feed materials
(Operating temperature=8000C, Equivalence Ratio =0.25, Feed Rate=10kg/hr)
0
5
10
15
20
25
30
35
40
45
50
0.5 0.75 1 1.25 1.5 1.75 2 2.25 2.5
H2 G
as C
om
po
siti
on(V
ol%
)
S/B Ratio
H2
Rice Husk
Rice straw
Saw Dust
0
5
10
15
20
25
30
35
0.5 1 1.5 2 2.5
CO
Gas
Co
mp
osi
tio
n(V
ol%
)
S/B Ratio
CO
Rice Husk
Rice straw
Saw Dust
0
1
2
3
4
5
6
7
8
9
10
0.5 1 1.5 2 2.5
HC
4 G
as C
om
po
siti
on(V
ol%
)
S/B Ratio
CH4
Rice Husk
Rice straw
Saw Dust
0
5
10
15
20
25
30
35
0.5 1 1.5 2 2.5 C
O2 G
as C
om
po
siti
on(V
ol%
) S/B Ratio
CO2
Rice Husk
Rice straw
Saw Dust
ASPENPlus Simulation Observations And Experiment Results
49
05
1015202530354045
0.15 0.2 0.25 0.3 0.35
Syn G
as
co
mp
osi
tio
n(V
ol
%)
ER
H2
CO
CH4
CO2
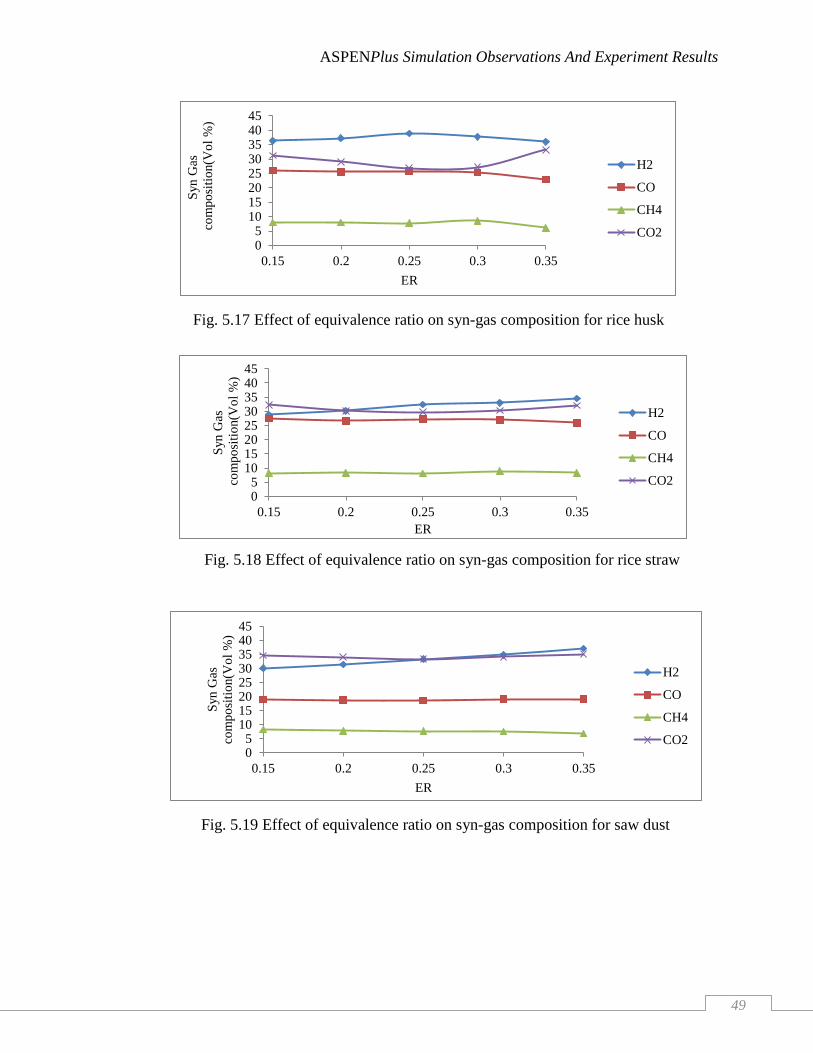
Fig. 5.17 Effect of equivalence ratio on syn-gas composition for rice husk
05
1015202530354045
0.15 0.2 0.25 0.3 0.35
Syn G
as
co
mp
osi
tio
n(V
ol
%)
ER
H2
CO
CH4
CO2
Fig. 5.18 Effect of equivalence ratio on syn-gas composition for rice straw
05
1015202530354045
0.15 0.2 0.25 0.3 0.35
Syn G
as
com
po
siti
on(V
ol
%)
ER
H2
CO
CH4
CO2
Fig. 5.19 Effect of equivalence ratio on syn-gas composition for saw dust
ASPENPlus Simulation Observations And Experiment Results
50
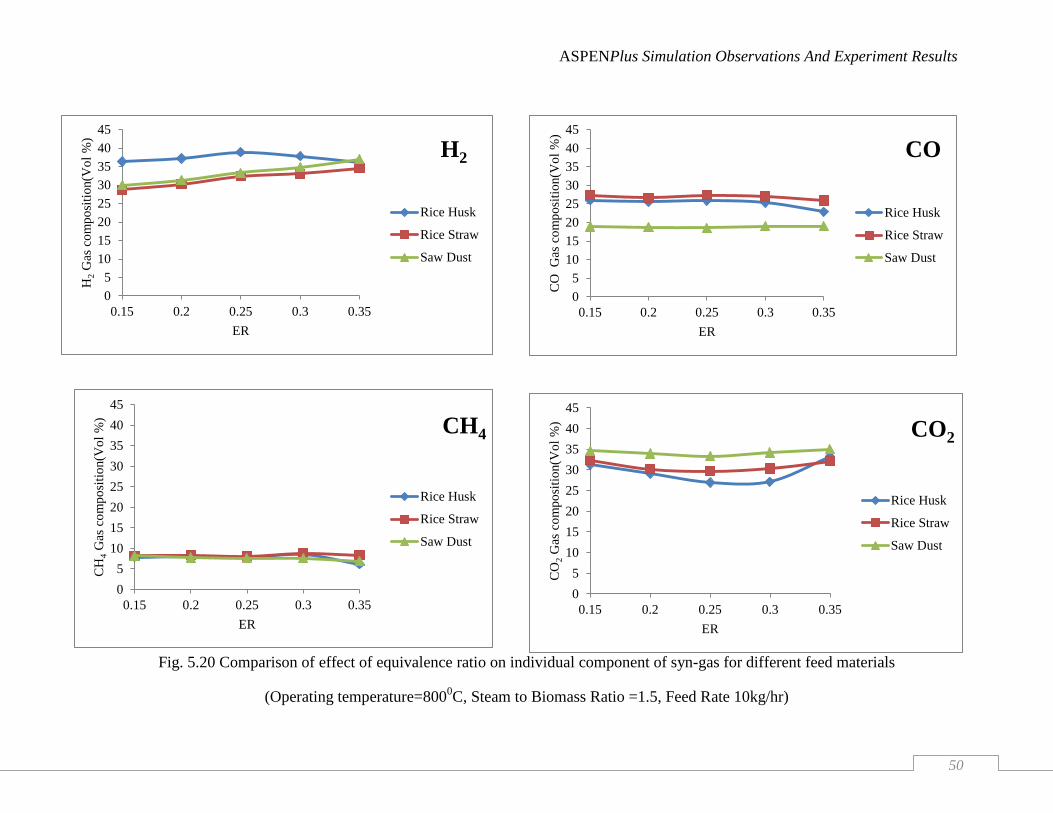
Fig. 5.20 Comparison of effect of equivalence ratio on individual component of syn-gas for different feed materials
(Operating temperature=8000C, Steam to Biomass Ratio =1.5, Feed Rate 10kg/hr)
0
5
10
15
20
25
30
35
40
45
0.15 0.2 0.25 0.3 0.35
H2 G
as c
om
po
siti
on(V
ol
%)
ER
H2
Rice Husk
Rice Straw
Saw Dust
0
5
10
15
20
25
30
35
40
45
0.15 0.2 0.25 0.3 0.35
CO
G
as c
om
po
siti
on(V
ol
%)
ER
CO
Rice Husk
Rice Straw
Saw Dust
0
5
10
15
20
25
30
35
40
45
0.15 0.2 0.25 0.3 0.35
CH
4 G
as c
om
po
siti
on(V
ol
%)
ER
CH4
Rice Husk
Rice Straw
Saw Dust
0
5
10
15
20
25
30
35
40
45
0.15 0.2 0.25 0.3 0.35
CO
2 G
as c
om
po
siti
on(V
ol
%)
ER
CO2
Rice Husk
Rice Straw
Saw Dust

CHAPTER SIX
DISCUSSION AND CONCLUSION
Discussion and Conclusion
53
6.0 Discussions
6.1 Overall Discussion on Results from ASPEN plus Simulation
The effect of different system parameters (viz. temperature,S/B,ER) on the yield of product gas
was studied using a fluidized bed gasifier. The experimentally observed data were validated
using ASPEN plus simulator. Experimental observations and simulated results were found to be
matching in most of the cases. But the concentration of the components were found to be
different in some cases.The reason may be the impractical assumptions made for ASPEN plus
simulation.
Since gasification is an endothermic reaction, the product gas composition is sensitive towards
temperature change. It is observed that the concentration of H2 increases with increase in
temperature. The concentration of CO remains almost constant over theentire range of
temperature i.e. 6000C-900
0C. Higher temperature provides more favorable condition for
cracking and steam reforming of methane. Therefore it is observed that the concentration of
methane decreases with increase in temperature and there is increase in concentration of
hydrogen. The CO2 concentration decreases with increase in temperature as higher temperature
favors endothermic formation of CO from CO2 via boudouard reaction.
Equivalence ratio is found to be the most important parameter of gasification. The effect of
equivalence ratio on product gas composition is studiedin the range 0.2 to 0.36 at 7000C with
steam to biomass ratio of 0.5. The Fig.-5.3 shows that concentration CO2 is directly proportional
to the equivalence ratio. With increase in equivalence ratio, complete combustion of carbon takes
place producing more CO2 and this leads to decrease in concentration of CO. Therefore less H2 is
Discussion and Conclusion
54
produced from water gas shift reaction leading to a decrease in concentration of H2. Methane
concentration remains almost constant over this range of equivalence ratio.
Steam to biomass ratio also plays an important role in gasification of biomass. The effect of
steam to biomass ratio on product gas composition was studied over the range of 0.5 - 1.5 at
7000C with equivalence ratio 0.26. Higher steam to biomass ratio favors more conversion of CO
to CO2 and H2 through water gas shift reaction.Thus with increase in steam to biomass ratio H2
and CO2concentration increases with a decrease in CO concentration in the product gas. Higher
steam to biomass also ratio provides more favorable condition for steam reforming of methane.
As a result methane concentration decreases with increase in steam to biomass ratio.
6.2 Different Parameter Studied in Experiment Setup
6.2.1Temperature Distribution in the Gasifier
Temperature distribution along the height of the gasifier is shown in Fig. 5.5. From Fig. 5.5 it is
found that the feed sample needs a longertime in the drying zone and pyrolysis zone to attain
high temperature thanin thecombustion and reduction zones. The reason may be that initially the
bed material is at room temperature. Feed along with the air is supplied to the gasifier for proper
fluidization before supplying the heat. Thus bed material is dried from room temperature to
required temperature and then subjected to pyrolysis. Therefore attainment of high temperature
in drying and pyrolysis zones are time taking. But attainment of high temperature in combustion
and reduction zone is not time taking as bed material is already at high temperature. At a
steadystate temperature of drying zone is about 1500C - 300
0C, while temperature of the
pyrolysis zone remains about 6000C. The steady temperatures of the pyrolysis zone, combustion
zone andreduction zone are 6000C, 700
0C – 1000
0C and 800
0C, respectively. From the
temperature curve of the combustion zone, it is found out that there appears a fluctuation, which
Discussion and Conclusion
55
isan occasional phenomenon and possibly caused by O2 deflagrating because of
localaccumulation. Reason may be the use of air as the gasifying agent which is air supplied by a
high power blower. This reveals that when a fluidized bed gasifier operates in normal
conditions,the flow of air should be changed step by step to avoid a sudden O2 accumulation
andassure operation safety at the startup stage of each run. Besides, a proper distribution of air
intakesystem is necessary to make air enter into the gasifier uniformly and avoid local
accumulation. As gases flows through the bed and biomass intermixing zone different reactions
occur in the different zones. In the drying zone, temperature is about150–3000C. In the
pyrolysiszone, temperature is about 6000C, pyrolysis of biomass results in the production of char,
tar and gas. In the combustion zone, because of the presence ofoxygen, oxidization reactions of
biomass pyrolysis products provides therequired heat for the whole gasification. In the reduction
and catalyst zones, secondary reactions of biomass pyrolysis andoxidization products take place,
i.e. cracking, reforming and tar decomposition. Nearly all these reactions are endothermic.
Therefore the temperature of reduction drops from 8000c to about 600
0C in this zone.Thus the
design of gasifier leads to a sudden expansion phenomenon which reduces the out let gas
temperature up to 45 - 550C although the gas is allowed to passthrough a high efficiency cyclone
separator to separate the dust particles.
6.2.2Effect of Reactor Temperature
It is known thattemperature plays an important role in gasification. In the present work, the
reactor temperature is increased from 500 to 10000C with 50
0C increments toinvestigate the
effect of temperature on gas compositionand hydrogen yield. The experimental results are
presented in Table-B-2, 3, 4 (Appendix-B) and Figure 5.6, 5.7, 5.8 for three different biomass
feeds. From Table-B-2, 3, 4 (Appendix-B); it is found out that the H2 concentrationincreases with

Discussion and Conclusion
56
temperature and that the content of CH4 and CO shows a decreasing trend with increase in
temperature which indicates that more CH4 and CO react with steam to produce additional H2
through these reactions. As Table-B-2, 3, 4 (Appendix-B) shows, there are still a large quantity
of CO in the syn-gas, from which it can be confirmed that shift reaction happens simultaneously
in the steam gasification process. Fig.5.12 indicates that under operating condition of S/B = 0
i.e. without steam supply, Equivalence Ratio = 0.25 and Feed Rate = 10kg/hr, hydrogen yield
increases from 21.50% to 40.58% for rice husk,18.49 % to 35.55% for rice straw and 19.93 % to
39.64% for saw dust in volume % on N2 and O2 free basis.
6.2.3 Effect of Steam-to-Biomass Ratio (S/B)
To study the effect of steam to biomass reaction on hydrogen yield. The steam rate was varied
from 0.5 to 2.5 while keeping all other conditions constant as Operating temperature =8000C,
Equivalence Ratio = 0.25 and Feed Rate 10kg/hr. The test results are presented in Table-B-8, 9,
10 (Appendix-B) and Fig.5.13, 5.14, 5.15 for Rice Husk, Rice Straw and Saw Dust respectively.
Over an S/B range of 2 to 2.5, hydrogen yield has a nearly linear increase. Syn-gas and hydrogen
yield begin to decrease when the S/B exceeds 2.5. This can be justified by the fact that additional
low temperature steam fed into the reactor causes the reaction temperature to decrease thereby,
causing the gas yield to decrease. Over an S/B range from 1.35 to 2.5, CO concentrations
decrease gradually, while the fraction of CO2 exhibits an opposite trend. This can be explained
by the fact that there are more steam reforming reactions of CO and CH4 taking place because of
the added steam.From Table-B-8, 9, 10 (Appendix-B), it can also be found that the hydrogen
concentration varies little over this S/B range in which the hydrogen concentration is observed to
be decreased with higher S/B. This difference possibly comes from the different operating
conditions. From the analysis of the data of varying S/B, it can be agreed that the introduction of
Discussion and Conclusion
57
steam in biomass steam gasification does benefit in increasing the gas and hydrogen yields.
However, excessive steam will lower the reaction temperature and cause gas and hydrogen yields
to decrease as Fig. 5.16 illustrates.
6.2.4 Effect of Equivalence Ratio(ER)
As it is known,equivalence ratio is defined as the actual oxygen-to-fuel ratio divided bythe
stoichiometric oxygen-to-fuel ratio needed for completecombustion. In the present study, ER is
varied from 0.15 to 0.35 by changing the air flow rate and keeping the other conditions constant
as Operating temperature = 800 0C, Steam to Biomass Ratio =1.5 and Feed Rate 10kg/hr. The
test results of varying ER are reported in Table-B-11, 12, 13(Appendix-B) and Fig.5.17, 5.18,
5.19 for Rice Husk, Rice Straw and saw dust respectively.Table-B-11, 12, 13(Appendix-B)
indicate that the hydrogen content varied littlein this range of the ER, while gas yield first
increases and then decreases with increase in ER. As a result, the hydrogen yield showed the
same trend with gas yield as shown in Fig.5.16. ER affects gasification temperature under the
condition of auto thermal operation. A higher value of ER corresponds to a higher gasification
temperature. In the present work ER is varied from 0.15 to 0.35. Heat is supplied to gasifier
initially for which it cannot compensate the heat loss caused by biomass pyrolysis and steam
reforming reactions. The operation temperature is not kept constant in the lower part of the
reactor. Therefore, the actual temperature of the steamgasification increases as ER is varied from
0.15 to 0.35. Therefore, more gas and hydrogen produced as ER changed from 0.15 to 0.35.
Correspondingly, the CO concentration experiences little decrease with almost constant trend as
ER increases from 0.15 to 0.35 while the CO2 concentration shows an opposite trend. When ER
is varied from 0.25 to 0.35, oxidation reaction becomes more significant than steam gasification
reaction because of the increased oxygen content. Through the above analysis, it is understood
Discussion and Conclusion
58
that it is not feasible to apply a too small or a too large ER on biomass air-steam gasification. An
ER, too small will lower reaction temperature, which is not favorable for biomass steam
gasification. An ER too large will consume the more produced H2 through the oxidation
reaction.
6.3 Conclusion
In general 20% of stoichiometric air is required for gasification which gives certain percentage of
efficiency. The increase in stoichiometric air percentage increases the percentage of efficiency.
Varying the types of wood also affects the percentage of efficiency. Therefore by varying the
percentage of stoichiometric air and wood the performance of gasifier can be studied and thus
the gasification efficiency can be optimized. Biomass gasification offers the most attractive
alternative energy system. Most preferred fuels for gasification have been charcoal and biomass.
However biomass residues are the most appropriate fuels for on-farm systems and offer the
greatest challenge to researchers and gasification system manufacturers. Most extensively used
and researched systems have been based on downdraft gasification. However it appears that for
fuels with high ash content fluidized bed combustion may offer abetter solution. At present no
reliable and economically feasible system exists. Biggest challenge of gasification systems lies in
developing a reliable and economical gas purification system. The increase of air supply up to
certain percentage reduces the percentage of char content and increase the temperature of the
producer gas. The increase of air supply up to certain percentage thus increases the percentage of
CH4 which contains more colorific value. Thus using biomass as fuel will cause no damage to
the environment.
References
59
REFERENCES
1. Aznar M. P., Caballero Ml A., Corella J., Gregorio M. and Toledo J.M., “Hydrogen
Production by Biomass Gasification with Steam - O2 Mixtures Followed by a Catalytic
Steam Reformer and a CO Shift System”, Energy & Fuels, 20, 1305-1309,( 2006).
2. Basu P., “Combustion and Gasification in Fluidized beds”, CRC Press, Taylor & Francis
Group, New York, Year of Publication (2006).
3. Chatterjee P.K., Datta A.B. and Kundu K.M., “Fluidized Bed Gasification of Coal,” The
Canadian Journal of Chemical Engineering, 73, 204 –210, (1995).
4. Corella J., Toledo J. M. and Molina G., “A Review on Dual Fluidized-Bed Biomass
Gasifiers”, Ind. Eng. Chem. Res., 46, 6831-6839, (2007).
5. Corella J., Orio A. and Aznar P., “Biomass Gasification With Air in Fluidized Bed:
Reforming of the Gas Composition with Commercial Steam Reforming Catalysts”, Ind.
Eng. Chem. Res., 37, 4617-4624, (1998).
6. Frederic P., Florent C. and Mohand T., “Thermo Chemical Equilibrium Modeling of a
Biomass Gasifying Process Using ASPEN PLUS”, International Journal Of Chemical
Reactor Engineering, Volume 7 , Article A40, (2009).
7. Kumar A., Kent E., David, D. Jones. and Milford, A. Hanna. , “Steam–Air Fluidized Bed
Gasification of Distillers Grains: Effects of Steam to Biomass Ratio, Equivalence Ratio
And Gasification Temperature”, Bio resource Technology ,100, 2062–2068, (2009).
8. Kunii D. and Levenspiel O., “Fluidization Engineering”, (Second edition) Butterworth-
Heinemann, Elsevier, New Delhi, India, (2005).
References
60
9. Lendon T.R. Mc, Lui A. P., Pineault R.L., Beer S.K. and Richardson S.W., “High Pressure
Co-Gasification of Coal and Biomass in a Fluidized Bed”, Biomass and Bio energy, 26, 377
– 388, (2004).
10. Li X.T., Grace J.R., Lim C.J., Watkinson A.P., Chenb H.P., Kimc J.R., “Biomass
Gasification in a Circulating Fluidized Bed”, Biomass and Bio-energy, 26, 171 – 193,
(2004).
11. Lv, P., Chang J., Xiong Z., Huang H., Chuangzhi W. U. and Zhu Y. C. J.,“ Biomass Air-
Steam Gasification in a Fluidized Bed to Produce Hydrogen-Rich Gas”, Energy & Fuels, 17,
677-682, ( 2003).
12. Lv P.M., Xiong Z.H., Chang J., Wu C.Z. , Chen Y. and Zhu J.X., “An Experimental Study
on Biomass Air–Steam Gasification in a Fluidized Bed”, Bio resource Technology, 95–101,
(2004).
13. Lv P., Yuan Z., Ma L., Wu C., Chen Y. and Zhu J., “Hydrogen-Rich Gas Production from
Biomass Air and Oxygen/Steam Gasification in a Downdraft Gasifier”, Renewable Energy,
32, 2173–2185, (2007).
14. Mathieu P. and Dubuisson R., “Performance Analysis of a Biomass Gasifier”, Energy
Conversion and Management, 43 ,1291–1299, (2002).
15. Meng Ni., Dennis Y.C. L., Michael K.H. L. and Sumathy K., “An Overview of Hydrogen
Production from Biomass”, Fuel Processing Technology, 87, 461 – 472, (2006).
References
61
16. Murakami T., Guangwen Xu., Toshiyuki S., Yoshiaki M., Hidehisa T. and Toshiro F.,
“Some Process Fundamentals of Biomass Gasification in Dual Fluidized Bed” Fuel 86,
244–255, (2007).
17. Nath K. and Das D., “Hydrogen from Biomass”, Current Science, Vol. 85, No. 3, 10
August, (2003).
18. Natarajan E., Ohman. M., Gabra, M., Nordin. A., Liliedahl. T. and Rao, A.N.,
“Experimental Determination of Bed Agglomeration Tendencies of Some Common
Agricultural Residues in Fluidized Bed Combustion and Gasification”, Biomass and
Bioenergy, Elsevier Science Ltd., 15 (2), 163-169, (1998).
19. Nikoo M.B. and Mahinpey N., “Simulation Of Biomass Gasification in Fluidized Bed
Reactor Using ASPEN PLUS”, Biomass and Bioenergy, 32 ,1245–1254,(2008).
20. Pfeifer C., Rauch R. and Hofbauer H., “In-Bed Catalytic Tar Reduction in a Dual Fluidized
Bed Biomass Steam Gasifier”, Ind. Eng. Chem. Res., 43, 1634-1640, ( 2004).
21. Ramirez J. J., Martinez J.D. and Petro S.L., “Basic Design of a Fluidized Bed Gasifier for
Rice Husk on a Pilot Scale” Latin American Applied Research 37, 299-306, (2007).
22. Rai G.D., “Non-conventional Source of Energy”, Khanna Publication, New Delhi, 393 -
414, (2007).
23. Roy G.K., “Solved Examples in Chemical Engineering”, Khanna Publication, New Delhi,
(1994).
24. Sinnott R. K., “Chemical Engineering Design Vol-6”, Printed at Butterworth Heinemann,
An Imprint of Elsevier, Linacre house, Jordan Hill, Oxford OX2 8DP, 30 Cooperative
References
62
Drive, MA 01803, 450 – 457, (1999).
25. Souza-Santos, M., “Modeling and Simulation in Combustion and Gasification of Solids
Fuels”, Notas de Aula, UNICAMP, Campinas, Brazil (1996).
26. Vriesman P., Heginuz E. and Sjostrom K., “Biomass Gasification in a Laboratory Scale a
FBG: Influence of the Location of the Feeding Point on the Fuel-N Conversion”, Fuel, 79
1371–1378, (2000).
27. Warnecke R., “Gasification of Fixed Bed and Fluidized Bed Gasifier”, Biomass and Bio
Energy, Vol. 18, 489-497, (2000).

Appendix
63
List of Tables
Table-A-1 Simulated product gas composition (volume %) at different temperatures
Table-A-2 Simulated product gas composition (volume %) at different equivalence ratio
Table-A-3 Simulated product gas composition (volume %)at different steam to biomass
ratio
Table-B-1 Variation of temperature inside the gasifier
Table-B-2 Direct instrument reading with N2 and O2 for rice husk
Table-B-3 Product gas composition obtained from analyzer with N2 and O2 for rice straw
Table-B-4 Product gas composition obtained from analyzer with N2 and O2 for saw dust
Table-B-5 Product gas composition obtained from analyzer with N2 and O2 for saw dust
Table-B-6 Syn-gas composition on N2 and O2 free basis for rice straw
Table-B-7 Syn-gas composition on N2 and O2 free basis for saw dust
Table-B-8 Effect of steam/biomass ratio on syn-gas composition for rice husk
Table-B-9 Effect of steam/biomass ratio on syn-gas composition for rice straw
Table-B-10 Effect of steam/biomass ratio on syn-gas composition for saw dust
Table-B-11 Effect of equivalence ratio on syn-gas composition for rice husk
Table-B-12 Effect of equivalence ratio on syn-gas composition for rice straw
Table-B-13 Effect of equivalence ratio on syn-gas composition for saw dust
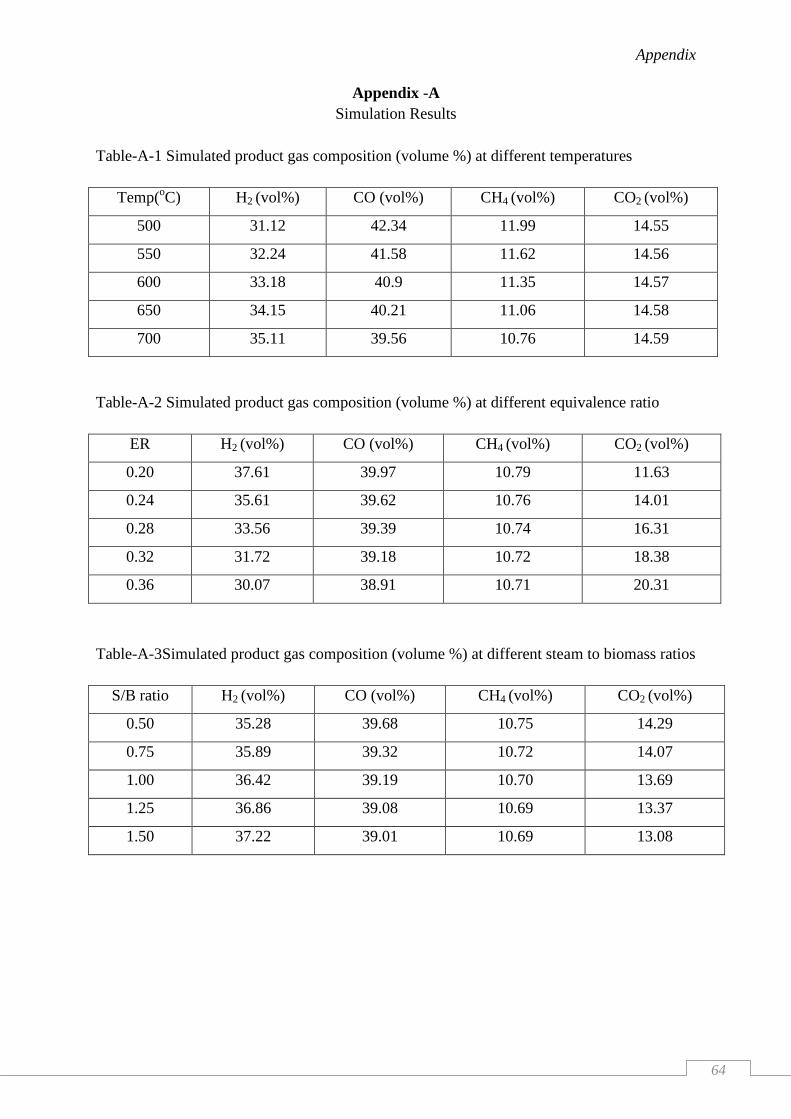
Appendix
64
Appendix -A
Simulation Results
Table-A-1 Simulated product gas composition (volume %) at different temperatures
Temp(oC) H2 (vol%) CO (vol%) CH4 (vol%) CO2 (vol%)
500 31.12 42.34 11.99 14.55
550 32.24 41.58 11.62 14.56
600 33.18 40.9 11.35 14.57
650 34.15 40.21 11.06 14.58
700 35.11 39.56 10.76 14.59
Table-A-2 Simulated product gas composition (volume %) at different equivalence ratio
ER H2 (vol%) CO (vol%) CH4 (vol%) CO2 (vol%)
0.20 37.61 39.97 10.79 11.63
0.24 35.61 39.62 10.76 14.01
0.28 33.56 39.39 10.74 16.31
0.32 31.72 39.18 10.72 18.38
0.36 30.07 38.91 10.71 20.31
Table-A-3Simulated product gas composition (volume %) at different steam to biomass ratios
S/B ratio H2 (vol%) CO (vol%) CH4 (vol%) CO2 (vol%)
0.50 35.28 39.68 10.75 14.29
0.75 35.89 39.32 10.72 14.07
1.00 36.42 39.19 10.70 13.69
1.25 36.86 39.08 10.69 13.37
1.50 37.22 39.01 10.69 13.08
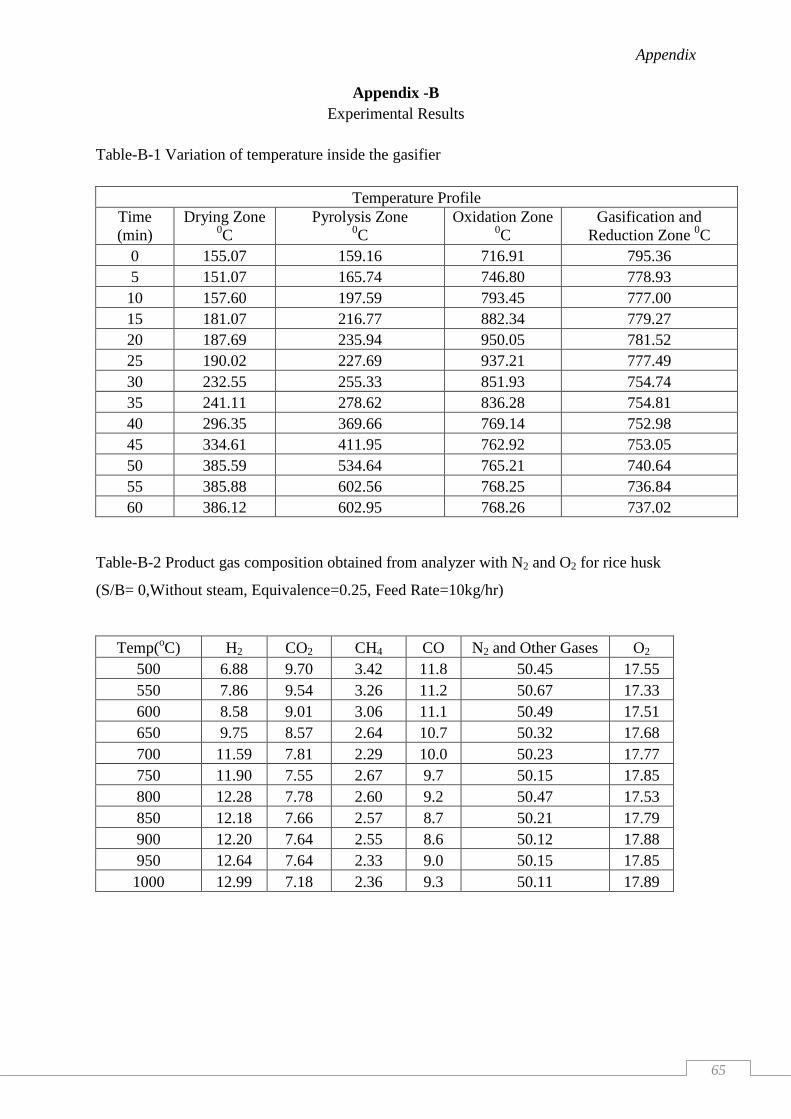
Appendix
65
Appendix -B
Experimental Results
Table-B-1 Variation of temperature inside the gasifier
Temperature Profile
Time
(min)
Drying Zone 0C
Pyrolysis Zone 0C
Oxidation Zone 0C
Gasification and
Reduction Zone 0C
0 155.07 159.16 716.91 795.36
5 151.07 165.74 746.80 778.93
10 157.60 197.59 793.45 777.00
15 181.07 216.77 882.34 779.27
20 187.69 235.94 950.05 781.52
25 190.02 227.69 937.21 777.49
30 232.55 255.33 851.93 754.74
35 241.11 278.62 836.28 754.81
40 296.35 369.66 769.14 752.98
45 334.61 411.95 762.92 753.05
50 385.59 534.64 765.21 740.64
55 385.88 602.56 768.25 736.84
60 386.12 602.95 768.26 737.02
Table-B-2 Product gas composition obtained from analyzer with N2 and O2 for rice husk
(S/B= 0,Without steam, Equivalence=0.25, Feed Rate=10kg/hr)
Temp(oC) H2 CO2 CH4 CO N2 and Other Gases O2
500 6.88 9.70 3.42 11.8 50.45 17.55
550 7.86 9.54 3.26 11.2 50.67 17.33
600 8.58 9.01 3.06 11.1 50.49 17.51
650 9.75 8.57 2.64 10.7 50.32 17.68
700 11.59 7.81 2.29 10.0 50.23 17.77
750 11.90 7.55 2.67 9.7 50.15 17.85
800 12.28 7.78 2.60 9.2 50.47 17.53
850 12.18 7.66 2.57 8.7 50.21 17.79
900 12.20 7.64 2.55 8.6 50.12 17.88
950 12.64 7.64 2.33 9.0 50.15 17.85
1000 12.99 7.18 2.36 9.3 50.11 17.89
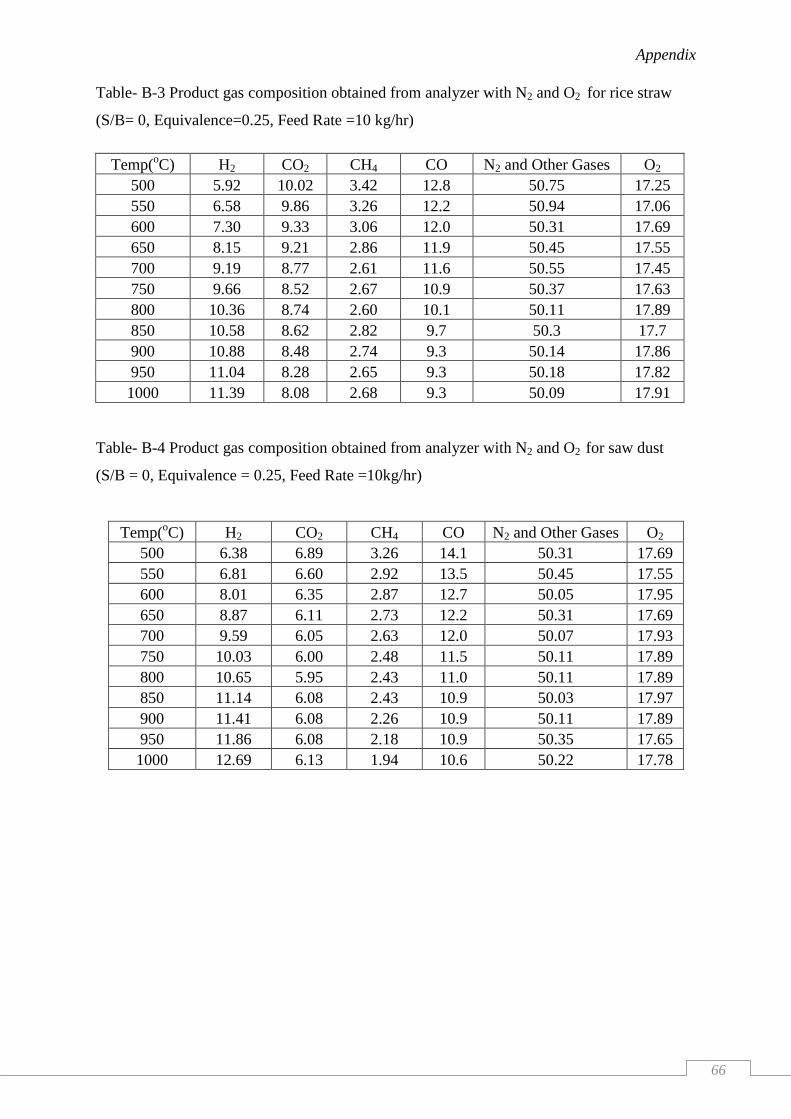
Appendix
66
Table- B-3 Product gas composition obtained from analyzer with N2 and O2 for rice straw
(S/B= 0, Equivalence=0.25, Feed Rate =10 kg/hr)
Temp(oC) H2 CO2 CH4 CO N2 and Other Gases O2
500 5.92 10.02 3.42 12.8 50.75 17.25
550 6.58 9.86 3.26 12.2 50.94 17.06
600 7.30 9.33 3.06 12.0 50.31 17.69
650 8.15 9.21 2.86 11.9 50.45 17.55
700 9.19 8.77 2.61 11.6 50.55 17.45
750 9.66 8.52 2.67 10.9 50.37 17.63
800 10.36 8.74 2.60 10.1 50.11 17.89
850 10.58 8.62 2.82 9.7 50.3 17.7
900 10.88 8.48 2.74 9.3 50.14 17.86
950 11.04 8.28 2.65 9.3 50.18 17.82
1000 11.39 8.08 2.68 9.3 50.09 17.91
Table- B-4 Product gas composition obtained from analyzer with N2 and O2 for saw dust
(S/B = 0, Equivalence = 0.25, Feed Rate =10kg/hr)
Temp(oC) H2 CO2 CH4 CO N2 and Other Gases O2
500 6.38 6.89 3.26 14.1 50.31 17.69
550 6.81 6.60 2.92 13.5 50.45 17.55
600 8.01 6.35 2.87 12.7 50.05 17.95
650 8.87 6.11 2.73 12.2 50.31 17.69
700 9.59 6.05 2.63 12.0 50.07 17.93
750 10.03 6.00 2.48 11.5 50.11 17.89
800 10.65 5.95 2.43 11.0 50.11 17.89
850 11.14 6.08 2.43 10.9 50.03 17.97
900 11.41 6.08 2.26 10.9 50.11 17.89
950 11.86 6.08 2.18 10.9 50.35 17.65
1000 12.69 6.13 1.94 10.6 50.22 17.78
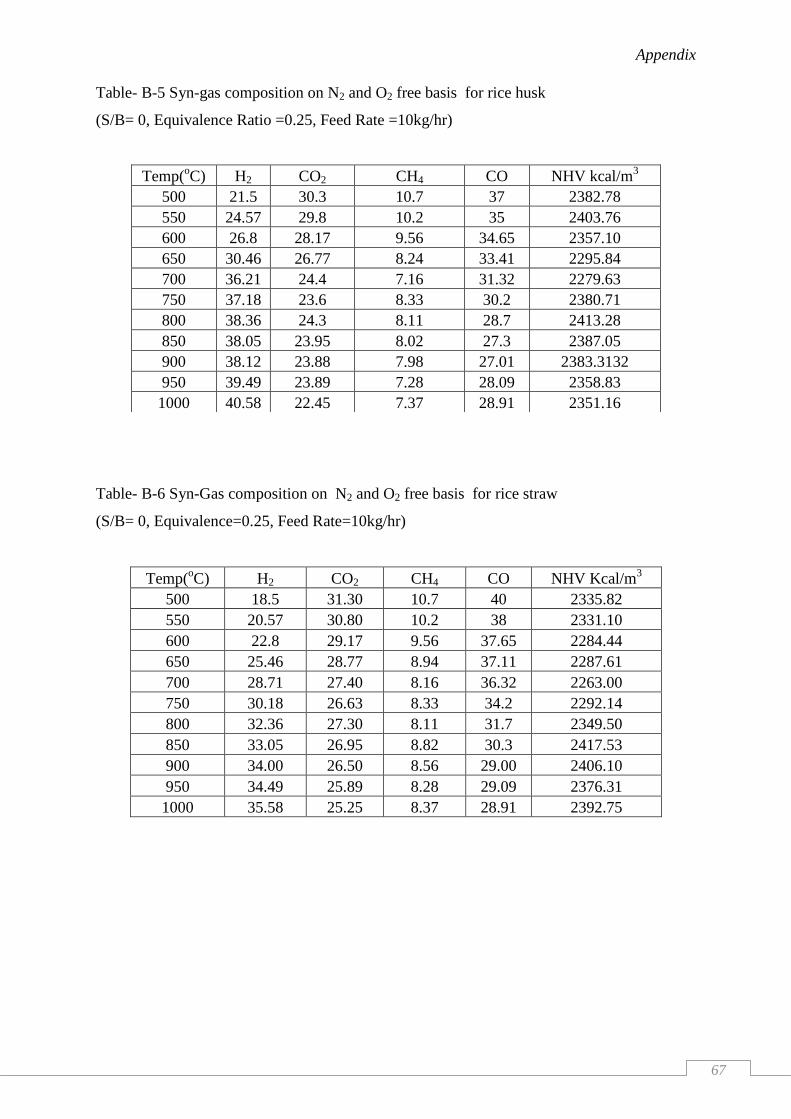
Appendix
67
Table- B-5 Syn-gas composition on N2 and O2 free basis for rice husk
(S/B= 0, Equivalence Ratio =0.25, Feed Rate =10kg/hr)
Table- B-6 Syn-Gas composition on N2 and O2 free basis for rice straw
(S/B= 0, Equivalence=0.25, Feed Rate=10kg/hr)
Temp(oC) H2 CO2 CH4 CO NHV Kcal/m
3
500 18.5 31.30 10.7 40 2335.82
550 20.57 30.80 10.2 38 2331.10
600 22.8 29.17 9.56 37.65 2284.44
650 25.46 28.77 8.94 37.11 2287.61
700 28.71 27.40 8.16 36.32 2263.00
750 30.18 26.63 8.33 34.2 2292.14
800 32.36 27.30 8.11 31.7 2349.50
850 33.05 26.95 8.82 30.3 2417.53
900 34.00 26.50 8.56 29.00 2406.10
950 34.49 25.89 8.28 29.09 2376.31
1000 35.58 25.25 8.37 28.91 2392.75
Temp(oC) H2 CO2 CH4 CO NHV kcal/m
3
500 21.5 30.3 10.7 37 2382.78
550 24.57 29.8 10.2 35 2403.76
600 26.8 28.17 9.56 34.65 2357.10
650 30.46 26.77 8.24 33.41 2295.84
700 36.21 24.4 7.16 31.32 2279.63
750 37.18 23.6 8.33 30.2 2380.71
800 38.36 24.3 8.11 28.7 2413.28
850 38.05 23.95 8.02 27.3 2387.05
900 38.12 23.88 7.98 27.01 2383.3132
950 39.49 23.89 7.28 28.09 2358.83
1000 40.58 22.45 7.37 28.91 2351.16
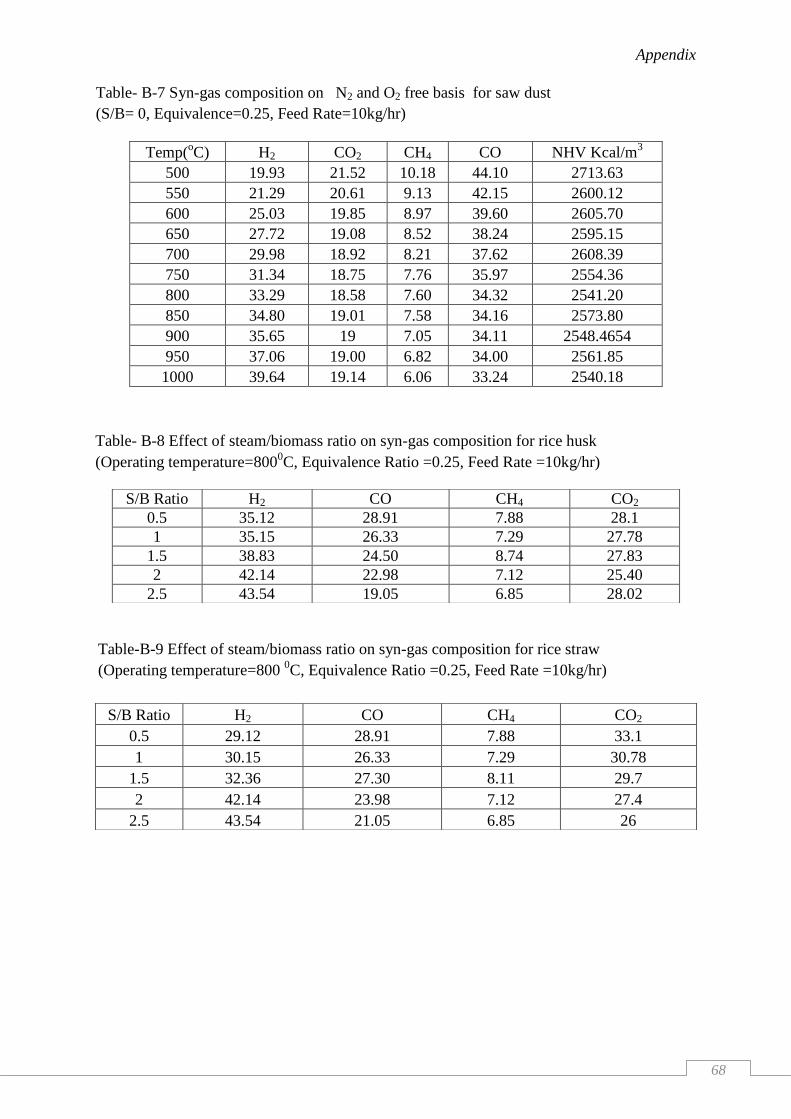
Appendix
68
Table- B-7 Syn-gas composition on N2 and O2 free basis for saw dust
(S/B= 0, Equivalence=0.25, Feed Rate=10kg/hr)
Temp(oC) H2 CO2 CH4 CO NHV Kcal/m
3
500 19.93 21.52 10.18 44.10 2713.63
550 21.29 20.61 9.13 42.15 2600.12
600 25.03 19.85 8.97 39.60 2605.70
650 27.72 19.08 8.52 38.24 2595.15
700 29.98 18.92 8.21 37.62 2608.39
750 31.34 18.75 7.76 35.97 2554.36
800 33.29 18.58 7.60 34.32 2541.20
850 34.80 19.01 7.58 34.16 2573.80
900 35.65 19 7.05 34.11 2548.4654
950 37.06 19.00 6.82 34.00 2561.85
1000 39.64 19.14 6.06 33.24 2540.18
Table- B-8 Effect of steam/biomass ratio on syn-gas composition for rice husk
(Operating temperature=8000C, Equivalence Ratio =0.25, Feed Rate =10kg/hr)
S/B Ratio H2 CO CH4 CO2
0.5 35.12 28.91 7.88 28.1
1 35.15 26.33 7.29 27.78
1.5 38.83 24.50 8.74 27.83
2 42.14 22.98 7.12 25.40
2.5 43.54 19.05 6.85 28.02
Table-B-9 Effect of steam/biomass ratio on syn-gas composition for rice straw
(Operating temperature=800 0C, Equivalence Ratio =0.25, Feed Rate =10kg/hr)
S/B Ratio H2 CO CH4 CO2
0.5 29.12 28.91 7.88 33.1
1 30.15 26.33 7.29 30.78
1.5 32.36 27.30 8.11 29.7
2 42.14 23.98 7.12 27.4
2.5 43.54 21.05 6.85 26
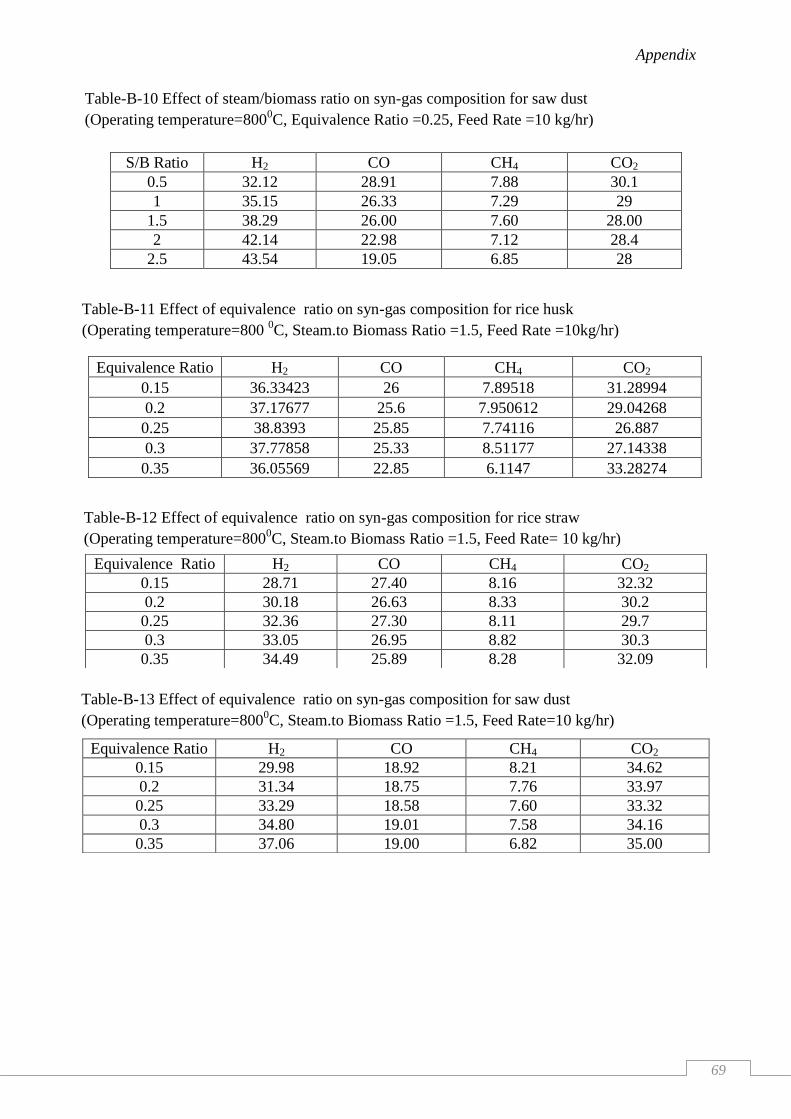
Appendix
69
Table-B-10 Effect of steam/biomass ratio on syn-gas composition for saw dust
(Operating temperature=8000C, Equivalence Ratio =0.25, Feed Rate =10 kg/hr)
S/B Ratio H2 CO CH4 CO2
0.5 32.12 28.91 7.88 30.1
1 35.15 26.33 7.29 29
1.5 38.29 26.00 7.60 28.00
2 42.14 22.98 7.12 28.4
2.5 43.54 19.05 6.85 28
Table-B-11 Effect of equivalence ratio on syn-gas composition for rice husk
(Operating temperature=800 0C, Steam.to Biomass Ratio =1.5, Feed Rate =10kg/hr)
Equivalence Ratio H2 CO CH4 CO2
0.15 36.33423 26 7.89518 31.28994
0.2 37.17677 25.6 7.950612 29.04268
0.25 38.8393 25.85 7.74116 26.887
0.3 37.77858 25.33 8.51177 27.14338
0.35 36.05569 22.85 6.1147 33.28274
Table-B-12 Effect of equivalence ratio on syn-gas composition for rice straw
(Operating temperature=8000C, Steam.to Biomass Ratio =1.5, Feed Rate= 10 kg/hr)
Equivalence Ratio H2 CO CH4 CO2
0.15 28.71 27.40 8.16 32.32
0.2 30.18 26.63 8.33 30.2
0.25 32.36 27.30 8.11 29.7
0.3 33.05 26.95 8.82 30.3
0.35 34.49 25.89 8.28 32.09
Table-B-13 Effect of equivalence ratio on syn-gas composition for saw dust
(Operating temperature=8000C, Steam.to Biomass Ratio =1.5, Feed Rate=10 kg/hr)
Equivalence Ratio H2 CO CH4 CO2
0.15 29.98 18.92 8.21 34.62
0.2 31.34 18.75 7.76 33.97
0.25 33.29 18.58 7.60 33.32
0.3 34.80 19.01 7.58 34.16
0.35 37.06 19.00 6.82 35.00