Embed Size (px)
Citation preview
_____________________________________________________________________________________________________
*Corresponding author: Email: [email protected], [email protected];
Asian Food Science Journal
4(1): 1-25, 2018; Article no.AFSJ.43115
Production and Evaluation of Pasta (Noodles) fromRice, Cowpea and Orange-Fleshed Sweet Potato
Flour Blends
I. E. Mbaeyi-Nwaoha1* and C. I. Ugwu1
1Department of Food Science and Technology, University of Nigeria, Nsukka, Nigeria.
Authors’ contributions
This work was carried out in collaboration between both authors. Author IEM-N designed the study,wrote the protocol, supervised the research work and wrote the first draft of the manuscript. Author
CIU managed some of the literature searches and the analyses of the study as well as wrote the lastdraft and tidied the literature searches. Both authors read and approved the final manuscript.
Article Information
DOI: 10.9734/AFSJ/2018/43115Editor(s):
(1) Ho Lee Hoon, Department of Food Industry, Faculty of Bioresources and Food Industry, Universiti Sultan Zainal Abidin(UniSZA), 22200 Besut, Terengganu, Malaysia.
(2) Vijaya Khader, Professor, Department of Foods and Nutrition, Post Graduate and Research Centre, Acharya N. G. RangaAgricultural University, India.
Reviewers:(1) Anna Szosland-Fałtyn, Institute of Agricultural and Food Biotechnology, Poland.
(2) K. Immaculate Jeyasanta, Suganthi Devadason Marine Research Institute, India.Complete Peer review History: http://prh.sdiarticle3.com/review-history/26006
Received 1st June 2018Accepted 4th August 2018
Published 27th August 2018
ABSTRACT
Aims: The aim was to produce and evaluate the properties (proximate and functional) of pastafrom blends of local rice (Oryza sativa), white cowpea beans (Vigna unguiculata) and orange-fleshed sweet potato [Ipomoea batatas (L) Lam.] (umusco/3 variety) flours as well as to evaluatethe cooking characteristics, microbiological quality and sensory attribute of the formulated pasta.Study Design: The experimental design that was used is Completely Randomized Design.Place and Duration of Study: The study took place at the Department of Food Science andTechnology, University of Nigeria, Nsukka between December 2016 and September 2017.Methodology: The study investigated the applicability of local rice, cowpea beans and orange-fleshed sweet potato flour to develop pasta rich in proteins and pro-vitamin A. The local rice andcowpea flours were blended in the ratio of 90:10, 80:20, 70:30, 60:40 and 50:50 to produce pastawhich was subjected to sensory evaluation to isolate the best blend (80:20). Following thispreliminary study, pastas were formulated from a combination of rice-cowpea flour blend andOFSP flour in the ratio of 90:10, 80:20, 70:30, 60:40 and 50:50 for samples RC/Pa, RC/Pb, RC/Pc,
Original Research Article
Mbaeyi-Nwaoha and Ugwu; AFSJ, 4(1): 1-25, 2018; Article no.AFSJ.43115
2
RC/Pd and RC/Pe respectively, while unblended rice (100%) was used as the control. The pastaproducts were subjected to physical, proximate, pro-vitamin A, cooking, microbiological andsensory analysis using standard methods.Results: The width, height and length of the samples ranged from 0.57 to 0.82 cm, 0.88 to 1.78cm and 2.24 to 3.48 cm respectively. The protein content, fat, ash, crude fibre and moisture,carbohydrate and caloric contents ranged from 10.91 to 18.80%, 1.95 to 2.24%, 1.74 to 3.43%,1.52 to 3.29%, 11.09 to 14.63%, 60.95 to 80.47% and 323.85 to 339.91 kcal/g respectively. Theprotein, fat, ash, fibre and moisture contents of the blends were significantly (p<0.05) higher thanthe control but their carbohydrate and caloric content were lower than the control. The pro-vitaminA content of the samples varied from 0.93 to 4.07 mg/100 g. There was an increase in the pro-vitamin A content as the ratio of orange-fleshed sweet potato increased in the blend. The cookinganalysis showed that sample RC/Pa (90:10) had the highest cooking time and cooking loss whilesample RC/Pe (50:50) had the highest cooking yield. The total viable count ranged from 2.0 × 10⁴
to 6.2 × 10⁴cfu/g while mould was not detected except on sample RC/Pd (60:40) which had 4.0 ×101 cfu/g. The microbial content of the samples was not high when assessed using the guidelinefor microbiological quality of pasta products. The sensory scores showed that all the samples hadhigh ratings.
Keywords: Rice; Pasta (Noodles); Mung beans or cowpea beans; Orange-fleshed sweet potato.
1. INTRODUCTION
Pasta is one of the most ancient nourishmentswhich are considered to be versatile both innutritive and the gastronomic point of view. Pastais a staple food of traditional Italian cuisine, withthe first reference dating to 1154 in Sicily [1]. It isalso commonly used to refer to the variety ofpasta dishes. Typically, pasta is a noodle madefrom unleavened dough of durum wheat flourmixed with water and eggs and formed intosheets or various shapes, then cooked by boilingor baking [2]. It can also be made with flour fromother cereals or grains. During the last 20 years,the annual consumption of pasta product hasincreased because of consumer perception ofpasta [3]. According to a 2008 survey, it wasreported that the annual consumption of instantnoodles in the world averaged about 94 billioncups [4]. Instant noodles are normally consumedby people of all socio - economic status. Severalkinds of pasta are present in Brazilian cuisineand served as a main dish or additional in themain meals. They have high acceptability due toits great convenience, fast preparation as well asthe satiety they provide.
Pasta may be divided into two broad categories,dried and fresh pasta. Dry pasta is a traditionalcereal-based food that has become increasinglyaccepted worldwide for the reason of itsconvenience, palatability and nutritionalsuperiority. It also provides significant quantitiesof complex carbohydrates, protein, B-vitaminsand iron. However, wheat which is the principalraw material for noodle production is beingimported. Also, the traditional pasta prepared
with wheat flour cannot be consumed by theentire population, because some individuals areintolerant to gluten present in this flour. Glutenintolerance is an autoimmune disease that canpotentially affect any organ, not merely thegastrointestinal tract [5]. In addition, pastaproducts are low in sodium, amino acids andtotal fat. Noodles produced from wheat flourcontain 11 - 15% protein (dry basis) but deficientin lysine and threonine (the first and secondlimiting amino acid), common to most cerealproducts [6]. The absence of lysine makes thebody difficult to synthesize protein, hormones,enzymes and antibodies which are needed forgrowth and other functions [7].
Processed wheat which is used for noodlesproduction is also discovered to be deficient incertain essential nutrients such as vitamins A, C,E, K, and β-carotene [8] unless blended withother food materials such as orange-fleshed sweet potatoes. A growing demandfor functional plant proteins has been identified,and their properties customized forspecific applications and formulations asfood ingredients [9]. Consequently, legumesand cereals are nutritionally complementary[10]. Cereals and legumes are anexcellent sources of energy due to their relativelyhigh content of carbohydrates and proteins [11].
The only satisfactory treatment for glutenintolerance is a complete avoidance of wheat,rye, barley, oatmeal and their derivatives in thediet [12]. The substitution of these cereals can bedone with soy, rice, corn, potatoes, cassava andyams, and among these, rice is the least allergic
Mbaeyi-Nwaoha and Ugwu; AFSJ, 4(1): 1-25, 2018; Article no.AFSJ.43115
3
[13]. Rice (Oryza sativa) is a staple food that iswidely consumed in the South-East and South-South geopolitical zones in Nigeria, and alsoNigeria as a whole. It is believed to provide morehealth benefits than other carbohydrate-basedfoods since it contains several nutrients and anti-oxidative compounds [14]. Rice is rich in manynutrient components including carbohydrate,proteins, certain fatty acids and micronutrients(vitamins and trace minerals). They are alsosources of many bioactive non-nutrientcompounds, known as an antioxidant, includingphenolic compounds [15]. Rice, due to itsnutritional properties, hypoallegenicity, pleasanttaste and not interference in the colour of thefinal product, has been used industrially in theproduction of rice flour which is subsequentlyused as an additive in puddings, ice cream andsimilar products [16]. Cereals are generally low inprotein quality and are limiting in some essentialamino-acids, notably lysine and tryptophan,supplementation of cereals with locally availablelegumes such as cowpea beans (Vignaunguiculata) that are high in protein and lysineimproves the protein content of cereal-legumeblends and their protein quality throughcomplementation of their individual amino acids.Cowpea (Vigna unguiculata) is a legume that isgrown throughout the world as annual crop. Thisinexpensive crop, packed with nutrition is awidely cultivated especially in the developingcountries. The different varieties of cowpea areavailable in a range of sizes and colours. Theseprotein rich peas have high amino acid content,making them ideal as a nutritional supplement tocereals.
Sweet potato [Ipomoea batatas (L) Lam.], on theother hand, is one of the major staple crops andmost important food security promoting rootcrops in the world, especially in sub-SaharanAfrica (Low et al. 2009). Well adapted to thetropical and subtropical regions, sweet potatohas nutritional advantage for the rural and urbandwellers [17]. Sweet potato is an excellentsource of energy (438 kg/ 100 g edible portion)and can produce more edible energy per hectareper day than cereals, such as wheat and rice,and has other advantages, and wide ecologicaladaptability [18]. Sweet potato roots are rich instarch, sugar, vitamin C, β-carotene, iron, andseveral other minerals [18,19]. Despite its highcarbohydrate content, sweet potato has a lowglycemic index due to low digestibility of starch,making it suitable for diabetic or overweighedpeople [20,21]. The root is reported to usuallyhave higher protein content than other roots andtuber, such as cassava and yams [19]. In
addition, some varieties of sweet potato containcoloured pigments, such as β-carotene,anthocyanin, and phenolic compounds. Thesepigments form the basis for classifying the foodsas nutraceuticals [19]. Sweet potato leaves arerecognised to be rich in essential amino acidssuch as lysine and tryptophan which arealways limited in cereals. Hence, sweet potatocan easily complement cereal based diets[22,19]. Moreover, sweet potatoes have hightechnological potential and it is reported that itcan be used for various products, such as drinks(wine, liquor and vinegar), sugar production,biscuits, flour, pasta, alcohol among others [20].Nowadays, several research programmes arefocusing on orange-fleshed or vitamin A sweetpotato with great potential to prevent and combatvitamin A deficiency for the sub-region [17].
Meanwhile, wheat, which is the principal rawmaterial for noodle production is imported since itis produced in small quantity in Nigeria. Thisresults to an immerse drain on the economywhile also suppressing and displacing indigenouscereals, with a resultant detrimental effect on theagricultural and technological development andcourse of poverty in Nigeria [8]. Also, thetraditional pasta prepared with wheat flour cannotbe consumed by the entire population, becausesome individuals are intolerant to gluten presentin this flour [5]. In addition, noodles preparedfrom wheat are deficient in essential amino acidsand other essential nutrients. Vitamin Adeficiency (VAD) contributes to significant ratesof blindness, disease and premature death insub-Sahara Africa (SSA) [23]. However, thisproblem could be solved by incorporation of foodmaterials which are high in protein, vitamin,minerals and fibre into noodles.
The development of gluten-free pasta (noodles)should encourage the manufacture of productsoriginated from mixed flours, attending a specialportion of consumers and reducing the severityof celiac disease caused by consumption ofgluten obtained in wheat. Rice is believed toprovide more health benefits than othercarbohydrate based foods, since it containsseveral nutrients and anti-oxidative compounds[15]. Cowpea beans are protein rich peas thathave high amino acid content, making themideal as a nutritional supplement tocereals. Sweet potatoes are rich in starch, sugar,vitamin C, β-carotene, iron, and severalother minerals. Orange-fleshed or vitaminA sweet potato has great potential to preventand combat vitamin A deficiency [17]. Theuse of local rice, orange-fleshed sweet
Mbaeyi-Nwaoha and Ugwu; AFSJ, 4(1): 1-25, 2018; Article no.AFSJ.43115
4
potato and cowpea beans composite flour innoodles would reduce wheat importation andenhance the use of indigenous crops in valueadded products.
Therefore, the broad objective of this studywas to produce and evaluate theproperties (proximate and functional) of pastafrom blends of local rice, cowpea beans andorange-fleshed sweet potato flour as well as toevaluate the cooking characteristics,microbiological quality and sensory attribute ofthe formulated pasta.
2. MATERIALS AND METHODS
2.1 Raw Materials
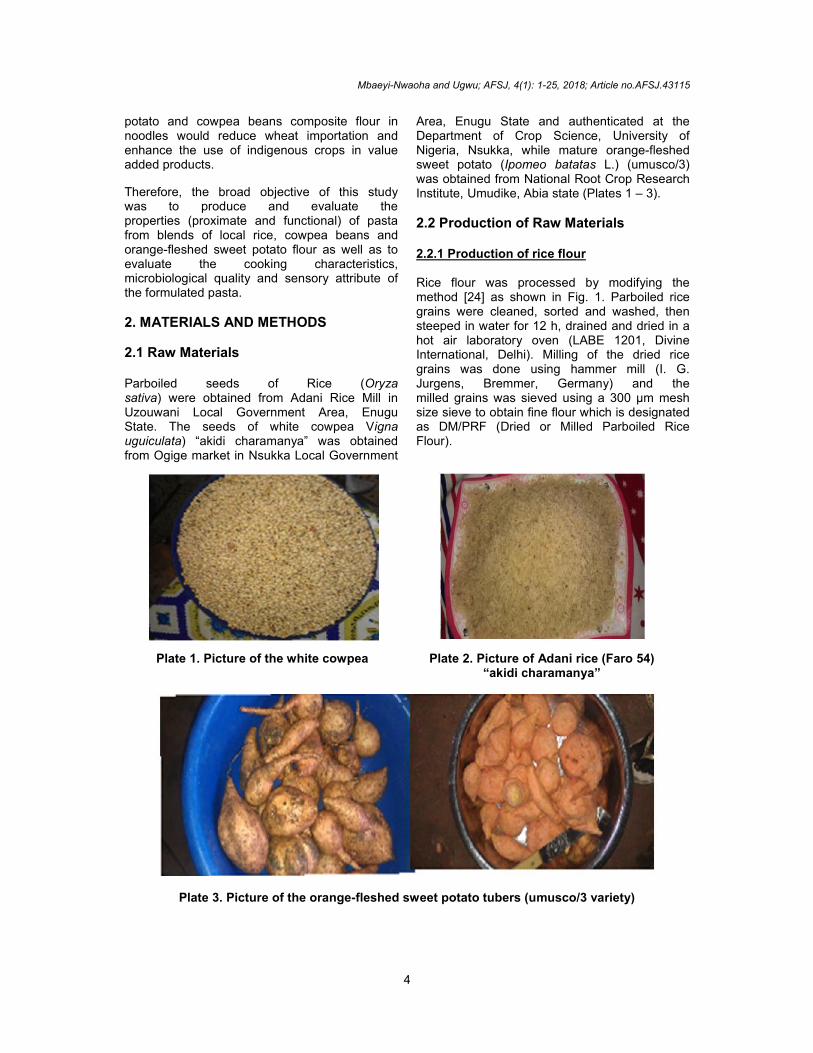
Parboiled seeds of Rice (Oryzasativa) were obtained from Adani Rice Mill inUzouwani Local Government Area, EnuguState. The seeds of white cowpea Vignauguiculata) “akidi charamanya” was obtainedfrom Ogige market in Nsukka Local Government
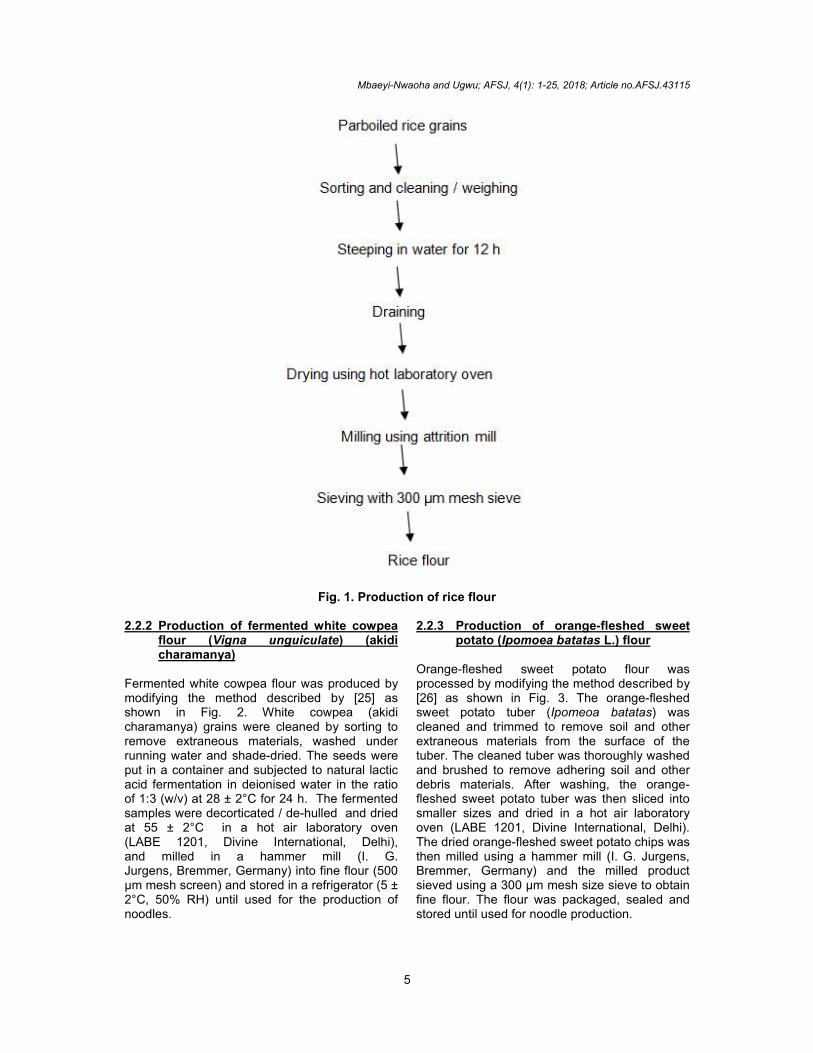
Area, Enugu State and authenticated at theDepartment of Crop Science, University ofNigeria, Nsukka, while mature orange-fleshedsweet potato (Ipomeo batatas L.) (umusco/3)was obtained from National Root Crop ResearchInstitute, Umudike, Abia state (Plates 1 – 3).
2.2 Production of Raw Materials
2.2.1 Production of rice flour
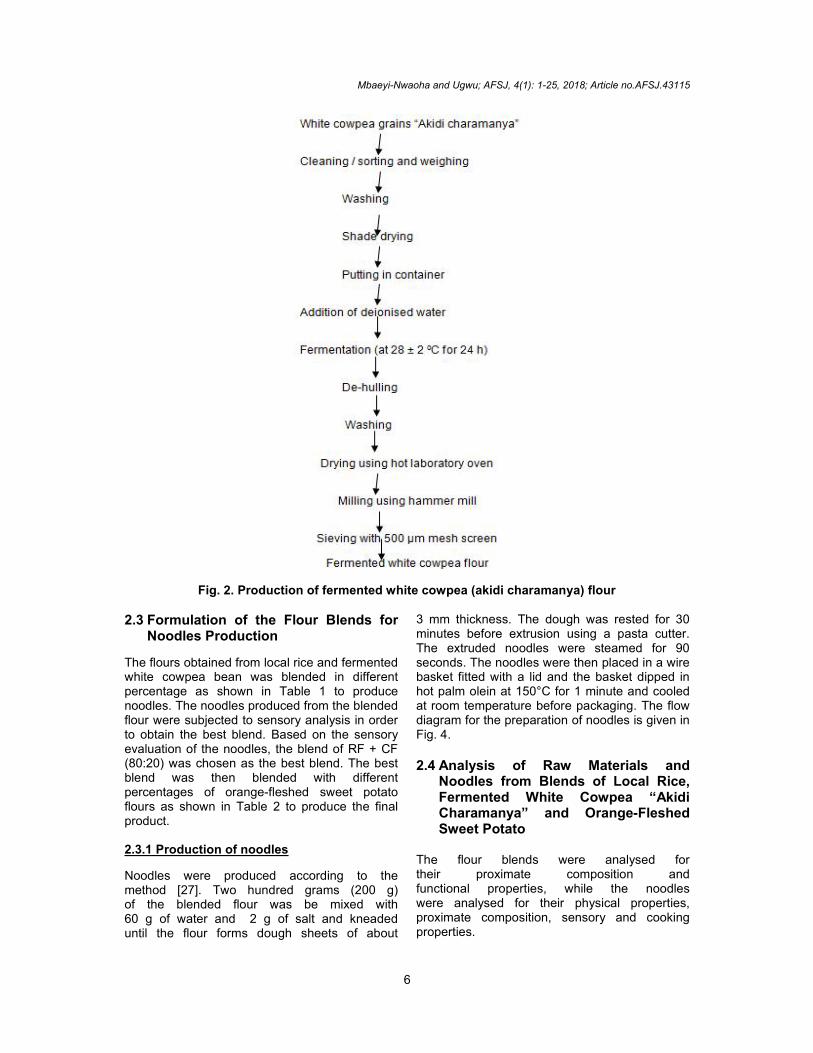
Rice flour was processed by modifying themethod [24] as shown in Fig. 1. Parboiled ricegrains were cleaned, sorted and washed, thensteeped in water for 12 h, drained and dried in ahot air laboratory oven (LABE 1201, DivineInternational, Delhi). Milling of the dried ricegrains was done using hammer mill (I. G.Jurgens, Bremmer, Germany) and themilled grains was sieved using a 300 µm meshsize sieve to obtain fine flour which is designatedas DM/PRF (Dried or Milled Parboiled RiceFlour).
Plate 1. Picture of the white cowpea Plate 2. Picture of Adani rice (Faro 54)“akidi charamanya”
Plate 3. Picture of the orange-fleshed sweet potato tubers (umusco/3 variety)
Mbaeyi-Nwaoha and Ugwu; AFSJ, 4(1): 1-25, 2018; Article no.AFSJ.43115
5
Fig. 1. Production of rice flour
2.2.2 Production of fermented white cowpeaflour (Vigna unguiculate) (akidicharamanya)
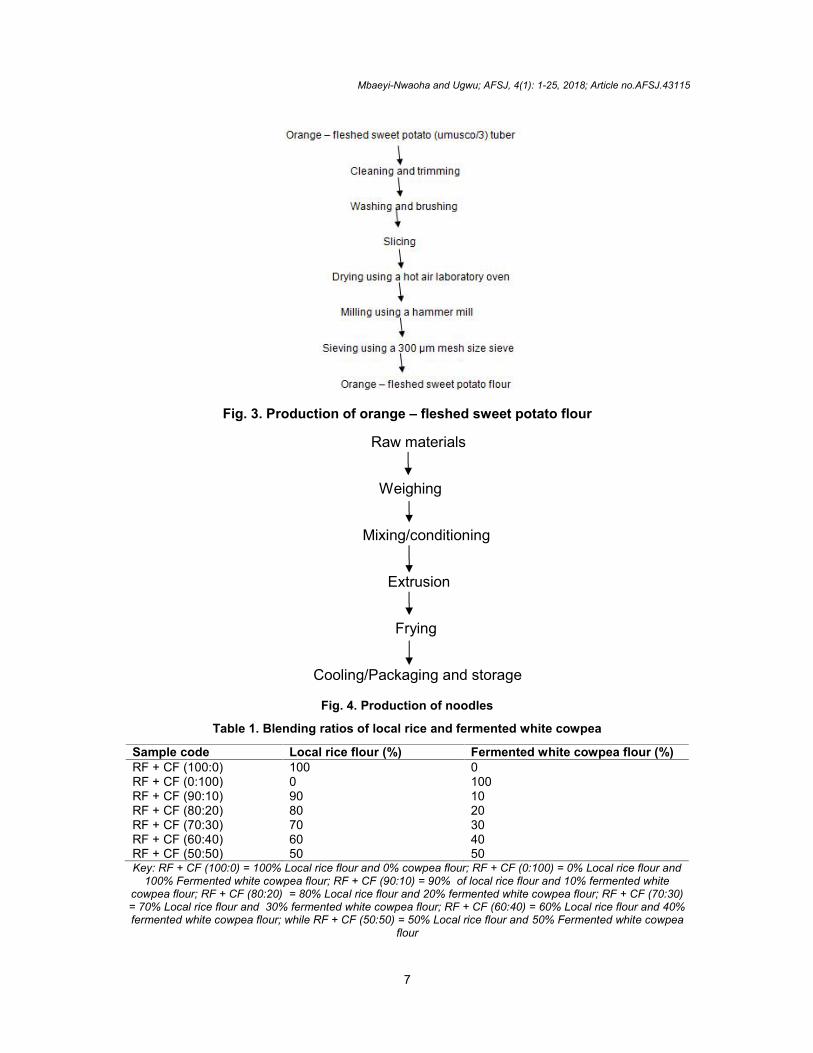
Fermented white cowpea flour was produced bymodifying the method described by [25] asshown in Fig. 2. White cowpea (akidicharamanya) grains were cleaned by sorting toremove extraneous materials, washed underrunning water and shade-dried. The seeds wereput in a container and subjected to natural lacticacid fermentation in deionised water in the ratioof 1:3 (w/v) at 28 ± 2°C for 24 h. The fermentedsamples were decorticated / de-hulled and driedat 55 ± 2°C in a hot air laboratory oven(LABE 1201, Divine International, Delhi),and milled in a hammer mill (I. G.Jurgens, Bremmer, Germany) into fine flour (500µm mesh screen) and stored in a refrigerator (5 ±2°C, 50% RH) until used for the production ofnoodles.
2.2.3 Production of orange-fleshed sweetpotato (Ipomoea batatas L.) flour
Orange-fleshed sweet potato flour wasprocessed by modifying the method described by[26] as shown in Fig. 3. The orange-fleshedsweet potato tuber (Ipomeoa batatas) wascleaned and trimmed to remove soil and otherextraneous materials from the surface of thetuber. The cleaned tuber was thoroughly washedand brushed to remove adhering soil and otherdebris materials. After washing, the orange-fleshed sweet potato tuber was then sliced intosmaller sizes and dried in a hot air laboratoryoven (LABE 1201, Divine International, Delhi).The dried orange-fleshed sweet potato chips wasthen milled using a hammer mill (I. G. Jurgens,Bremmer, Germany) and the milled productsieved using a 300 µm mesh size sieve to obtainfine flour. The flour was packaged, sealed andstored until used for noodle production.
Mbaeyi-Nwaoha and Ugwu; AFSJ, 4(1): 1-25, 2018; Article no.AFSJ.43115
6
Fig. 2. Production of fermented white cowpea (akidi charamanya) flour
2.3 Formulation of the Flour Blends forNoodles Production
The flours obtained from local rice and fermentedwhite cowpea bean was blended in differentpercentage as shown in Table 1 to producenoodles. The noodles produced from the blendedflour were subjected to sensory analysis in orderto obtain the best blend. Based on the sensoryevaluation of the noodles, the blend of RF + CF(80:20) was chosen as the best blend. The bestblend was then blended with differentpercentages of orange-fleshed sweet potatoflours as shown in Table 2 to produce the finalproduct.
2.3.1 Production of noodles
Noodles were produced according to themethod [27]. Two hundred grams (200 g)of the blended flour was be mixed with60 g of water and 2 g of salt and kneadeduntil the flour forms dough sheets of about
3 mm thickness. The dough was rested for 30minutes before extrusion using a pasta cutter.The extruded noodles were steamed for 90seconds. The noodles were then placed in a wirebasket fitted with a lid and the basket dipped inhot palm olein at 150°C for 1 minute and cooledat room temperature before packaging. The flowdiagram for the preparation of noodles is given inFig. 4.
2.4 Analysis of Raw Materials andNoodles from Blends of Local Rice,Fermented White Cowpea “AkidiCharamanya” and Orange-FleshedSweet Potato
The flour blends were analysed fortheir proximate composition andfunctional properties, while the noodleswere analysed for their physical properties,proximate composition, sensory and cookingproperties.
Mbaeyi-Nwaoha and Ugwu; AFSJ, 4(1): 1-25, 2018; Article no.AFSJ.43115
7
Fig. 3. Production of orange – fleshed sweet potato flour
Raw materials
Weighing
Mixing/conditioning
Extrusion
Frying
Cooling/Packaging and storage
Fig. 4. Production of noodles
Table 1. Blending ratios of local rice and fermented white cowpea
Sample code Local rice flour (%) Fermented white cowpea flour (%)RF + CF (100:0) 100 0RF + CF (0:100) 0 100RF + CF (90:10) 90 10RF + CF (80:20) 80 20RF + CF (70:30) 70 30RF + CF (60:40) 60 40RF + CF (50:50) 50 50Key: RF + CF (100:0) = 100% Local rice flour and 0% cowpea flour; RF + CF (0:100) = 0% Local rice flour and
100% Fermented white cowpea flour; RF + CF (90:10) = 90% of local rice flour and 10% fermented whitecowpea flour; RF + CF (80:20) = 80% Local rice flour and 20% fermented white cowpea flour; RF + CF (70:30)= 70% Local rice flour and 30% fermented white cowpea flour; RF + CF (60:40) = 60% Local rice flour and 40%fermented white cowpea flour; while RF + CF (50:50) = 50% Local rice flour and 50% Fermented white cowpea
flour
Mbaeyi-Nwaoha and Ugwu; AFSJ, 4(1): 1-25, 2018; Article no.AFSJ.43115
8
Table 2. Blending ratios of local rice/fermented white cowpea flour and orange-fleshedsweet potato flour
Sample code Local rice/fermented white cowpea flourblend (80:20 best blend) (%)
Orange-fleshed sweet potatoflour (%)
RF (Control)RC/Pa (90:10)
10090
010
RC/Pb (80:20) 80 20RC/Pc (70:30) 70 30RC/Pd (60:40) 60 40RC/Pe (50:50) 50 50
Key: RF = Rice flour; RC = Rice + Cowpea blend; Pa – Pe =Orange-fleshed sweet potato in different ratios.RC/Pa (90:10) = 90% of the best blend flour and 10% of orange-fleshed sweet potato flour; RC/Pb (80:20) = 80%of the best blend flour and 20% of orange-fleshed sweet potato flour; RC/Pc (70:30) 70% of the best blend flourand 30% of orange-fleshed sweet potato flour; RC/Pd(60:40) = 60% of the best blend and 40% of orange-fleshed
sweet potato flour; while RC/Pe (50:50) = 50% of the best blend flour and 50% of orange-fleshed sweet potatoflour
2.4.1 Physical evaluation
2.4.1.1 Noodle width and height
The width and height of the noodles wereanalysed using a micrometre screw gauge.
2.4.1.2 Noodle length
The lengths of the noodles were measured usinga measuring rule.
2.4.2 Proximate composition
2.4.2.1 Determination of moisture content
Moisture content was determined according tothe methods of Association of Official AnalyticalChemists [28]. The Samples were dried at 105°Cfor 3 h using the preset oven mechanizedconvection air oven (Phoenix furnace, model534, SN: 524-85, Chapel town, Sheffield).
2.4.2.2 Determination of crude protein
The protein content (% nitrogen x 6.25) of thesample was determined using the Kjeldahlmethod [28].
2.4.2.3 Determination of crude protein
The crucible containing the pre-weighed sampleswere placed in a heated furnace mechanizedconvection air oven (Phoenix furnace, model534, SN: 524-85, Chapel town, Shefffield). at600°C for 6 h after which they were cooled toroom temperature in desiccators and weighed.
2.4.2.4 Determination of crude fibre content
The crude fibre content of the samples wasdetermined using the standard method [29]. N-Hexane was used to de-fat 2 g of sample, addedin oiled 200 ml of 1.25% H2SO4 and boiled for 30
minutes, filtered, washed with 1% HCl andboiling water. The residues were returned into200 ml boiling NaOH and allowed for 30 minutes.The final residues were drained and transferredto the silica ash crucible (porcelain crucible),dried in an oven at 100°C for 2 hours and cooleduntil a constant weight obtained. and incinerated(ashed) in a muffle furnace at 600°C for 5 hours,cooled in a desiccator and weighed.
2.4.2.5 Determination of fat content
The fat content of the samples content (1g wasextracted for ether extract determination usingpetroleum ether as solvent) was determinedusing the standard Soxhlet method [28].
2.4.2.6 Determination of carbohydrate content
The carbohydrate content of the sample wasdetermined as nitrogen free extraction calculationby difference [28].using the formula below:
% Carbohydrate = 100 – (% moisture + % protein+ % ash + % crude fibre + % fat)
2.4.2.7 Determination of energy value / caloriccontent
The caloric content was calculated using thestandard method [28]. as follows:
Calorie (kcal / 100 g) = (4 × % carbohydrate) + (4× % protein) + (9 × % fat)
2.4.3 Determination of micronutrient
2.4.3.1 Determination of β-carotene content
The β – carotene content of the samples wasdetermined using the method [30]. The sampleswere weighed, W1 and homogenized in methanol
Mbaeyi-Nwaoha and Ugwu; AFSJ, 4(1): 1-25, 2018; Article no.AFSJ.43115
9
in the ratio of 1:10 (%) using a laboratoryblender. The homogenate was filtered using afilter paper of measured weight, W2 to obtain theinitial crude extract, washed with 20 ml of distilledwater in separating funnel. The other layer wasrecovered and evaporated to dryness at a lowtemperature (35 – 50°C) in vacuum desiccator.The dry extract was saponified with 20 ml ofethanoic potassium hydroxide and was leftovernight in a dark cupboard. After a day, the β –carotene was taken up in 20 ml of ether and thenwashed with two portions of 20 ml distilled water.The β – carotene content extract (ether layer)was dried in a desiccator and treated withpetroleum (petroleum spurt) and allowed to standovernight in a freezer. The next day, theprecipitated steroid was removed bycentrifugation and β – carotene extract wasevaporated to dryness in a desiccator andweighed, W3. The weight of the β – carotene wasdetermined and expressed as a percentage ofthe sample weight.
β – Carotene content (%) = W3 – W2 × 100W1 1
Where W1 = Weight of sample; W2 = Weight ofempty filter paper and W3 = Weight of filter paper+ Weight of precipitate.
2.4.4 Determination of functional properties
2.4.4.1 Determination of water absorptioncapacities
Water absorption capacity was determined bymodifying the method [31]. One gram (dry weightbasis) of the sample was dispersed in 10 mldistilled water, vortexed intermittently for 10minutes and centrifuged at 4500 rpm for 20minutes. The aqueous supernatant obtained aftercentrifuging was decanted and the test tubesinserted and allowed to drain for 5 minutes on atowel. By weighing the residue, water absorptioncapacity was calculated as a percentage of agram of water absorbed per gram of sample.
2.4.4.2 Determination of oil absorption capacities
The oil absorption capacity was determined bymodifying the method [32]. Powdered sampleswere weighed 0.5 g each and mixed with 5 ml ofoil (pure olive oil) for 30 seconds. The sampleswere allowed to stand at room temperature (30 ±2°C) for 30 minutes after which the sampleswere centrifuged at 500 rpm for 30 minutes. Thesupernatant, mainly oil was decanted and thetest tubes inverted and allowed to drain for 15
minutes on a towel. By weighing the residue, oilabsorption capacity was calculated as oilabsorbed per weight of samples.
2.4.4.3 Determination of bulk density
The bulk density was determined according tothe method [33]. A graduated measuring cylinderof 10 ml capacity was weighed and gently filledwith the sample, followed by gently tapping thebottom until there was no further diminution ofthe sample level after filling to the 10 cm3 mark.The bulk density was calculated as:
Bulk density (g / cm3) = Weight of sample (g)/The weight of sample after tapping (cm3)
2.4.4.4 Determination of swelling capacity
The swelling capacity was determined bymodifying the method [33]. The flour sample (0.1g) was weighed into a test tube and 10 ml ofdistilled water added. The mixture was heated ina water bath at a temperature of 50°C for 30minutes with continuous shaking. In the end, thetest tube was centrifuged at 1500 rpm for 20minutes in order to facilitate the removal of thesupernatant which was carefully decanted andthe weight of the starch paste taken. This wascarried out over a temperature range of 50 –100°C.
The swelling power was calculated as follows:
Swelling power = Weight of starch paste/ Theweight of dry starch sample
2.4.5 Cooking characteristics of noodles
Cooking quality of pasta was the most importantaspect from the consumer’s point of view,including optimal cooking time, swelling or wateruptake during cooking, the texture of the cookedproduct, stickiness, aroma and taste. Thesecooking factors of pasta were related to thegelatinization rates and chemical composition ofthe pasta used. Cooking time, cooking quality,solid loss and water absorption were studied asper the methods described by AmericanAssociation of Cereal Chemists [29].
2.4.5.1 Optimum cooking time
The optimum cooking time of the noodles wasevaluated according to the modified method ofSchoenlechner et al. [34]. One hundred grams ofpasta was put into a beaker containing 1 L ofboiling water (without salt addition). Every
Mbaeyi-Nwaoha and Ugwu; AFSJ, 4(1): 1-25, 2018; Article no.AFSJ.43115
10
minute, some pieces were taken out andpressed between two glass plates (2.5 cm × 2.5cm). The optimal cooking time (OCT)corresponded to the disappearance of the whitecentre core
2.4.5.2 Cooking yield and cooking loss
Cooking yield and cooking loss was determinedaccording to the method of American Associationof Cereal Chemists ([29].
2.4.6 Total Viable and Mould Count (TVC)
The total viable count was determinedaccording to the method [35]. The samples wereinoculated using nutrient agar after theserial dilution of the sample had been obtained.Pour plate method was used. The colony countwas done after 24 hours of incubation at 37 oCusing a colony counter (Gallenkampcolony counter, CNW 330 – 010X) and thenumber of colonies calculated using the followingformula:
TVC (CFU / g) = (Number of colonies × Originalconcentration) / (Dilution factor × Volume ofinoculums)
CFU = Colony Forming Unit
For the mould count, after the serial dilution ofthe samples, they were inoculated usingSabauroud dextrose agar (SDA). Pour platemethod was used. The colony count was doneafter 72 hours on incubation at 37 oC,using a colony counter (Gallenkampcolony counter, CNW 330 – 010X) and thenumber of colonies calculated using the followingmethod:
Mould count (CFU / g) = (Number of colonies ×Original concentration)/ (Dilution factor × Volumeof inoculums)
CFU = colony forming unit
2.4.7 Sensory evaluation
The noodles were cooked and assessed by a 20– man semi- trained panel consisting of studentsof Department of Food Science and Technology,University of Nigeria, Nsukka, for colour, flavour,taste, texture, after taste and generalacceptability on a 9 - point Hedonic scale [36].where 9 signifies like extremely and 1 signifiesdislike extremely. Based on the sensory score,the best noodle from the composite flour wascompared with 100% rice noodle. The sampleswere presented in coded plastic plates. Theorder of presentation of samples to the judgeswas randomised. Clean water was presented forthe panelists to rinse their mouth in betweenevaluation.
2.5 Data Analysis and ExperimentalDesign
The experimental design that was usedis Completely Randomized Design and themean values were subjected to analysis ofvariance (ANOVA) using Duncan’s MultipleRange Test (DMRT) and SPSS (StatisticalProduct for Service Solution) version 20computer was used. Significance was acceptedat p < 0.05 [37].
3. RESULTS AND DISCUSSION
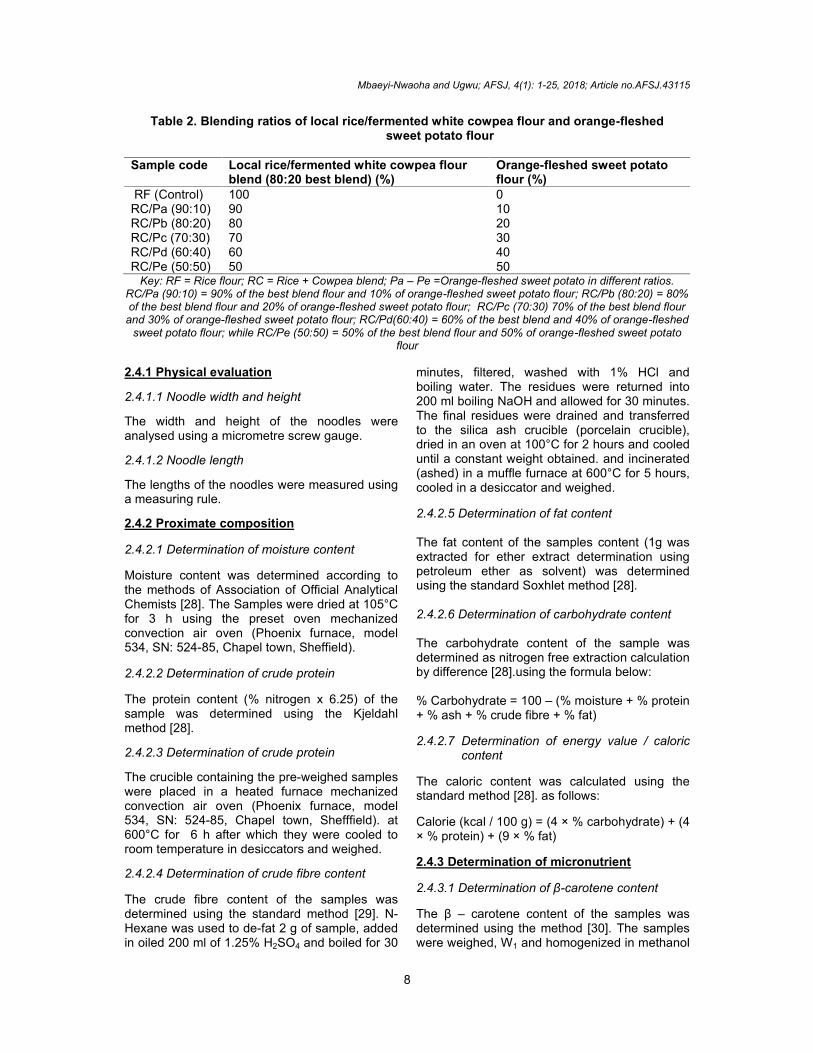
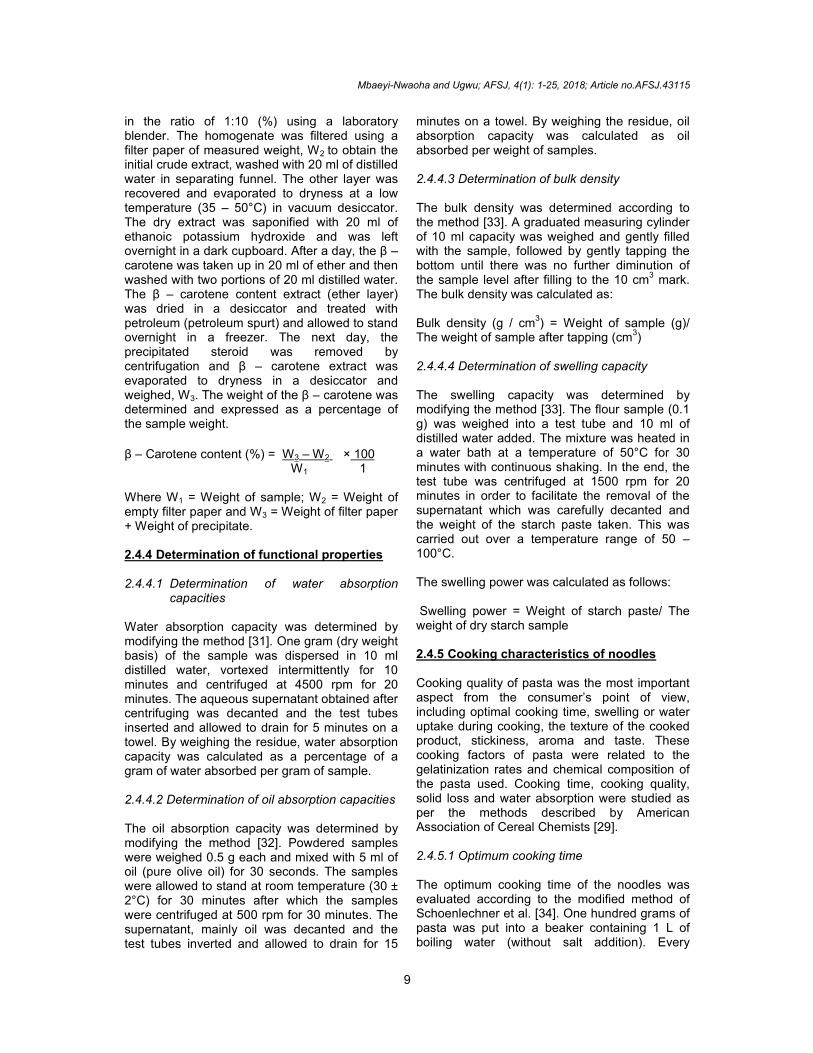
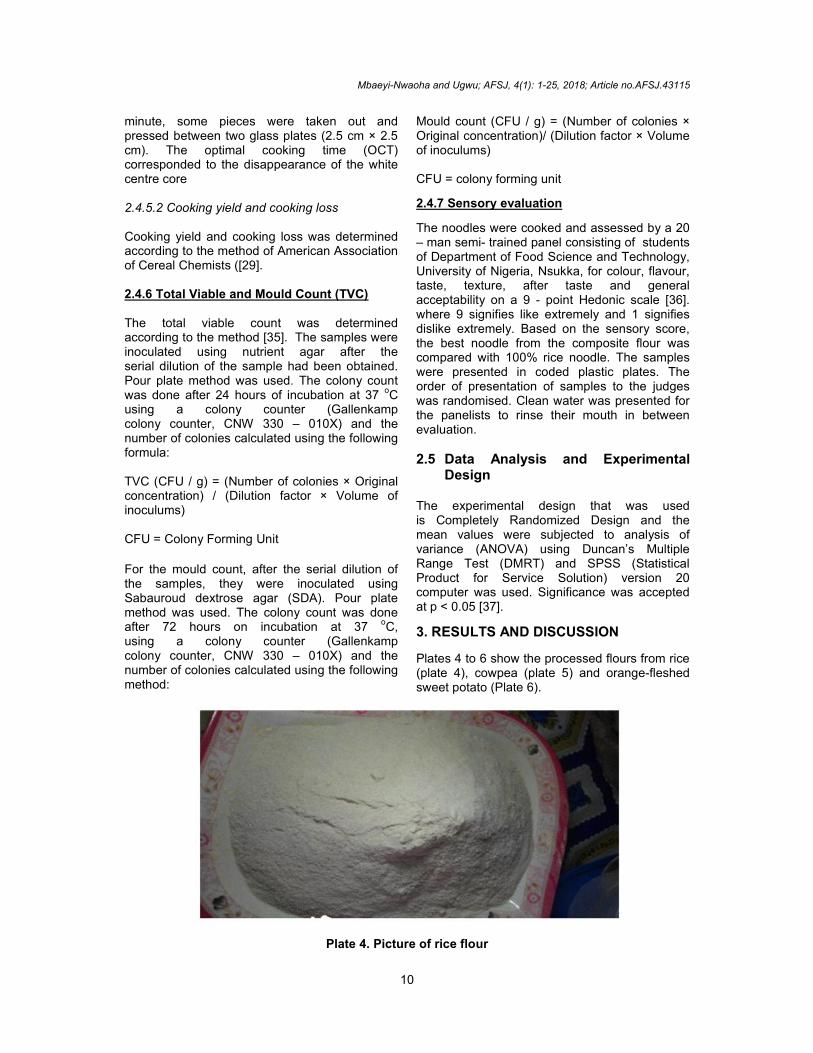
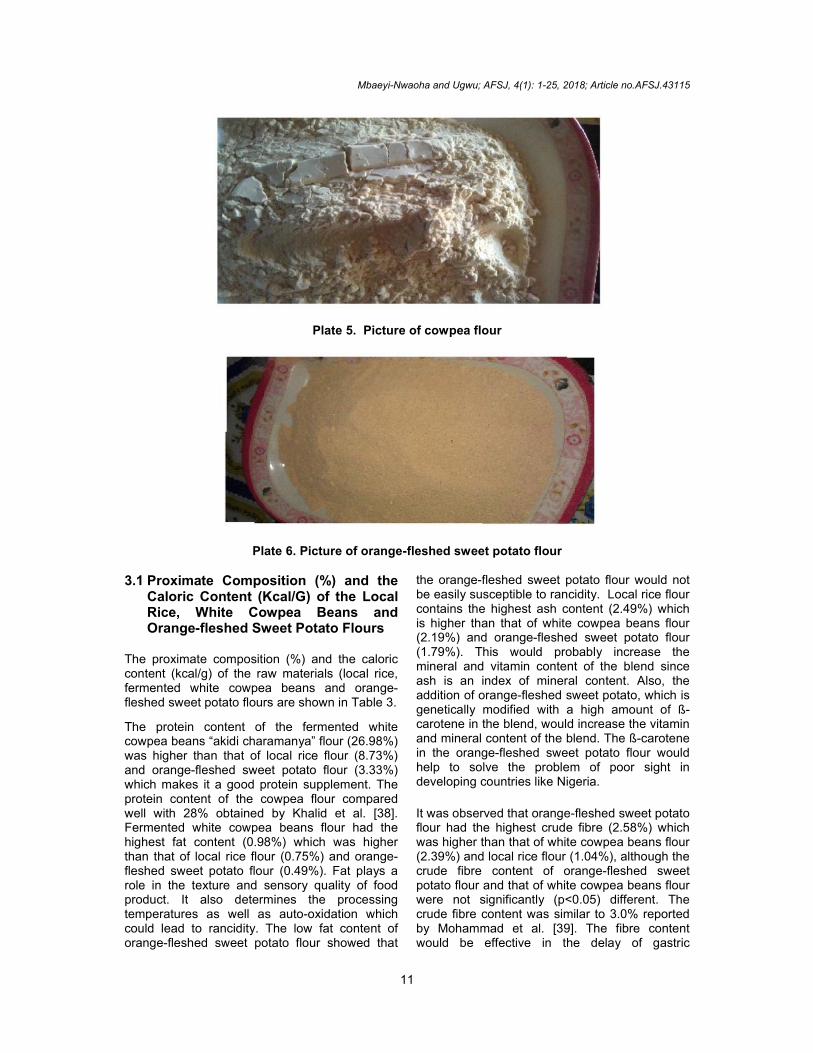
Plates 4 to 6 show the processed flours from rice(plate 4), cowpea (plate 5) and orange-fleshedsweet potato (Plate 6).
Plate 4. Picture of rice flour
Mbaeyi-Nwaoha and Ugwu; AFSJ, 4(1): 1-25, 2018; Article no.AFSJ.43115
11
Plate 5. Picture of cowpea flour
Plate 6. Picture of orange-fleshed sweet potato flour
3.1 Proximate Composition (%) and theCaloric Content (Kcal/G) of the LocalRice, White Cowpea Beans andOrange-fleshed Sweet Potato Flours
The proximate composition (%) and the caloriccontent (kcal/g) of the raw materials (local rice,fermented white cowpea beans and orange-fleshed sweet potato flours are shown in Table 3.
The protein content of the fermented whitecowpea beans “akidi charamanya” flour (26.98%)was higher than that of local rice flour (8.73%)and orange-fleshed sweet potato flour (3.33%)which makes it a good protein supplement. Theprotein content of the cowpea flour comparedwell with 28% obtained by Khalid et al. [38].Fermented white cowpea beans flour had thehighest fat content (0.98%) which was higherthan that of local rice flour (0.75%) and orange-fleshed sweet potato flour (0.49%). Fat plays arole in the texture and sensory quality of foodproduct. It also determines the processingtemperatures as well as auto-oxidation whichcould lead to rancidity. The low fat content oforange-fleshed sweet potato flour showed that
the orange-fleshed sweet potato flour would notbe easily susceptible to rancidity. Local rice flourcontains the highest ash content (2.49%) whichis higher than that of white cowpea beans flour(2.19%) and orange-fleshed sweet potato flour(1.79%). This would probably increase themineral and vitamin content of the blend sinceash is an index of mineral content. Also, theaddition of orange-fleshed sweet potato, which isgenetically modified with a high amount of ß-carotene in the blend, would increase the vitaminand mineral content of the blend. The ß-carotenein the orange-fleshed sweet potato flour wouldhelp to solve the problem of poor sight indeveloping countries like Nigeria.
It was observed that orange-fleshed sweet potatoflour had the highest crude fibre (2.58%) whichwas higher than that of white cowpea beans flour(2.39%) and local rice flour (1.04%), although thecrude fibre content of orange-fleshed sweetpotato flour and that of white cowpea beans flourwere not significantly (p<0.05) different. Thecrude fibre content was similar to 3.0% reportedby Mohammad et al. [39]. The fibre contentwould be effective in the delay of gastric
Mbaeyi-Nwaoha and Ugwu; AFSJ, 4(1): 1-25, 2018; Article no.AFSJ.43115
12
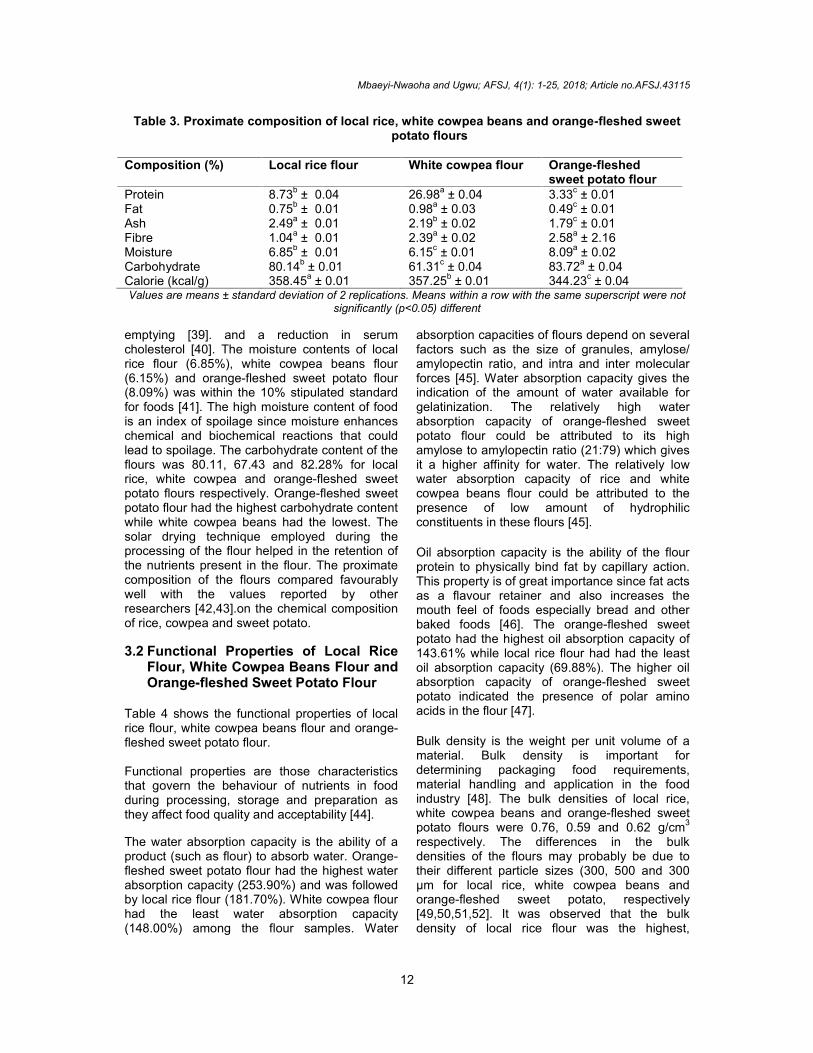
Table 3. Proximate composition of local rice, white cowpea beans and orange-fleshed sweetpotato flours
Composition (%) Local rice flour White cowpea flour Orange-fleshedsweet potato flour
Protein 8.73b ± 0.04 26.98a ± 0.04 3.33c ± 0.01Fat 0.75b ± 0.01 0.98a ± 0.03 0.49c ± 0.01Ash 2.49a ± 0.01 2.19b ± 0.02 1.79c ± 0.01Fibre 1.04a ± 0.01 2.39a ± 0.02 2.58a ± 2.16Moisture 6.85b ± 0.01 6.15c ± 0.01 8.09a ± 0.02Carbohydrate 80.14b ± 0.01 61.31c ± 0.04 83.72a ± 0.04Calorie (kcal/g) 358.45a ± 0.01 357.25b ± 0.01 344.23c ± 0.04Values are means ± standard deviation of 2 replications. Means within a row with the same superscript were not
significantly (p<0.05) different
emptying [39]. and a reduction in serumcholesterol [40]. The moisture contents of localrice flour (6.85%), white cowpea beans flour(6.15%) and orange-fleshed sweet potato flour(8.09%) was within the 10% stipulated standardfor foods [41]. The high moisture content of foodis an index of spoilage since moisture enhanceschemical and biochemical reactions that couldlead to spoilage. The carbohydrate content of theflours was 80.11, 67.43 and 82.28% for localrice, white cowpea and orange-fleshed sweetpotato flours respectively. Orange-fleshed sweetpotato flour had the highest carbohydrate contentwhile white cowpea beans had the lowest. Thesolar drying technique employed during theprocessing of the flour helped in the retention ofthe nutrients present in the flour. The proximatecomposition of the flours compared favourablywell with the values reported by otherresearchers [42,43].on the chemical compositionof rice, cowpea and sweet potato.
3.2 Functional Properties of Local RiceFlour, White Cowpea Beans Flour andOrange-fleshed Sweet Potato Flour
Table 4 shows the functional properties of localrice flour, white cowpea beans flour and orange-fleshed sweet potato flour.
Functional properties are those characteristicsthat govern the behaviour of nutrients in foodduring processing, storage and preparation asthey affect food quality and acceptability [44].
The water absorption capacity is the ability of aproduct (such as flour) to absorb water. Orange-fleshed sweet potato flour had the highest waterabsorption capacity (253.90%) and was followedby local rice flour (181.70%). White cowpea flourhad the least water absorption capacity(148.00%) among the flour samples. Water
absorption capacities of flours depend on severalfactors such as the size of granules, amylose/amylopectin ratio, and intra and inter molecularforces [45]. Water absorption capacity gives theindication of the amount of water available forgelatinization. The relatively high waterabsorption capacity of orange-fleshed sweetpotato flour could be attributed to its highamylose to amylopectin ratio (21:79) which givesit a higher affinity for water. The relatively lowwater absorption capacity of rice and whitecowpea beans flour could be attributed to thepresence of low amount of hydrophilicconstituents in these flours [45].
Oil absorption capacity is the ability of the flourprotein to physically bind fat by capillary action.This property is of great importance since fat actsas a flavour retainer and also increases themouth feel of foods especially bread and otherbaked foods [46]. The orange-fleshed sweetpotato had the highest oil absorption capacity of143.61% while local rice flour had had the leastoil absorption capacity (69.88%). The higher oilabsorption capacity of orange-fleshed sweetpotato indicated the presence of polar aminoacids in the flour [47].
Bulk density is the weight per unit volume of amaterial. Bulk density is important fordetermining packaging food requirements,material handling and application in the foodindustry [48]. The bulk densities of local rice,white cowpea beans and orange-fleshed sweetpotato flours were 0.76, 0.59 and 0.62 g/cm3
respectively. The differences in the bulkdensities of the flours may probably be due totheir different particle sizes (300, 500 and 300µm for local rice, white cowpea beans andorange-fleshed sweet potato, respectively[49,50,51,52]. It was observed that the bulkdensity of local rice flour was the highest,
Mbaeyi-Nwaoha and Ugwu; AFSJ, 4(1): 1-25, 2018; Article no.AFSJ.43115
13
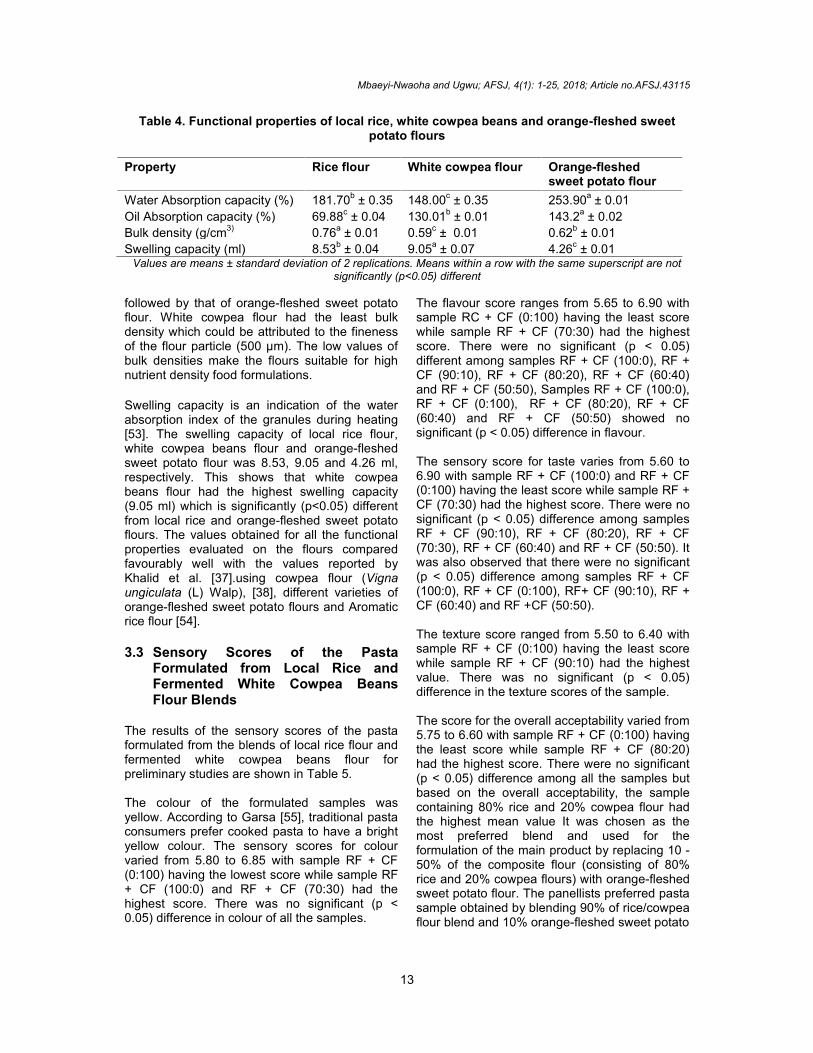
Table 4. Functional properties of local rice, white cowpea beans and orange-fleshed sweetpotato flours
Property Rice flour White cowpea flour Orange-fleshedsweet potato flour
Water Absorption capacity (%) 181.70b ± 0.35 148.00c ± 0.35 253.90a ± 0.01Oil Absorption capacity (%) 69.88c ± 0.04 130.01b ± 0.01 143.2a ± 0.02Bulk density (g/cm3) 0.76a ± 0.01 0.59c ± 0.01 0.62b ± 0.01Swelling capacity (ml) 8.53b ± 0.04 9.05a ± 0.07 4.26c ± 0.01
Values are means ± standard deviation of 2 replications. Means within a row with the same superscript are notsignificantly (p<0.05) different
followed by that of orange-fleshed sweet potatoflour. White cowpea flour had the least bulkdensity which could be attributed to the finenessof the flour particle (500 µm). The low values ofbulk densities make the flours suitable for highnutrient density food formulations.
Swelling capacity is an indication of the waterabsorption index of the granules during heating[53]. The swelling capacity of local rice flour,white cowpea beans flour and orange-fleshedsweet potato flour was 8.53, 9.05 and 4.26 ml,respectively. This shows that white cowpeabeans flour had the highest swelling capacity(9.05 ml) which is significantly (p<0.05) differentfrom local rice and orange-fleshed sweet potatoflours. The values obtained for all the functionalproperties evaluated on the flours comparedfavourably well with the values reported byKhalid et al. [37].using cowpea flour (Vignaungiculata (L) Walp), [38], different varieties oforange-fleshed sweet potato flours and Aromaticrice flour [54].
3.3 Sensory Scores of the PastaFormulated from Local Rice andFermented White Cowpea BeansFlour Blends
The results of the sensory scores of the pastaformulated from the blends of local rice flour andfermented white cowpea beans flour forpreliminary studies are shown in Table 5.
The colour of the formulated samples wasyellow. According to Garsa [55], traditional pastaconsumers prefer cooked pasta to have a brightyellow colour. The sensory scores for colourvaried from 5.80 to 6.85 with sample RF + CF(0:100) having the lowest score while sample RF+ CF (100:0) and RF + CF (70:30) had thehighest score. There was no significant (p <0.05) difference in colour of all the samples.
The flavour score ranges from 5.65 to 6.90 withsample RC + CF (0:100) having the least scorewhile sample RF + CF (70:30) had the highestscore. There were no significant (p < 0.05)different among samples RF + CF (100:0), RF +CF (90:10), RF + CF (80:20), RF + CF (60:40)and RF + CF (50:50), Samples RF + CF (100:0),RF + CF (0:100), RF + CF (80:20), RF + CF(60:40) and RF + CF (50:50) showed nosignificant (p < 0.05) difference in flavour.
The sensory score for taste varies from 5.60 to6.90 with sample RF + CF (100:0) and RF + CF(0:100) having the least score while sample RF +CF (70:30) had the highest score. There were nosignificant (p < 0.05) difference among samplesRF + CF (90:10), RF + CF (80:20), RF + CF(70:30), RF + CF (60:40) and RF + CF (50:50). Itwas also observed that there were no significant(p < 0.05) difference among samples RF + CF(100:0), RF + CF (0:100), RF+ CF (90:10), RF +CF (60:40) and RF +CF (50:50).
The texture score ranged from 5.50 to 6.40 withsample RF + CF (0:100) having the least scorewhile sample RF + CF (90:10) had the highestvalue. There was no significant (p < 0.05)difference in the texture scores of the sample.
The score for the overall acceptability varied from5.75 to 6.60 with sample RF + CF (0:100) havingthe least score while sample RF + CF (80:20)had the highest score. There were no significant(p < 0.05) difference among all the samples butbased on the overall acceptability, the samplecontaining 80% rice and 20% cowpea flour hadthe highest mean value It was chosen as themost preferred blend and used for theformulation of the main product by replacing 10 -50% of the composite flour (consisting of 80%rice and 20% cowpea flours) with orange-fleshedsweet potato flour. The panellists preferred pastasample obtained by blending 90% of rice/cowpeaflour blend and 10% orange-fleshed sweet potato
Mbaeyi-Nwaoha and Ugwu; AFSJ, 4(1): 1-25, 2018; Article no.AFSJ.43115
14
Table 5. Sensory scores of pasta produced from blends of local rice and fermented white cowpea beans flour blends
Sensory attributes RC + CF(100:0)
RF + CF(0:100)
RF + CF(90:10)
RF + CF(80:20)
RF + CF(70:30)
RF + CF(60:40
RF + CF(50:50)
Colour 6.85a±2.03 5.80a±1.36 6.30a±1.17 6.75a±1.65 6.85a±1.04 6.55a±1.43 6.65a±1.42Flavour 5.85ab±1.81 5.65b±2.45 6.20ab±1.61 6.50ab±1.28 6.90a±1.67 6.15ab±1.39 6.10ab±1.83Taste 5.60b±1.82 5.60b±1.61 6.25ab±2.05 6.80a±1.51 6.90a±1.21 6.20ab±1.54 6.15ab±1.73Texture 5.75a±1.71 5.50a±1.93 6.40a±1.50 6.10a±1.21 6.10±1.21 5.90a±1.71 5.85a±1.42Overall acceptability 5.90a±1.80 5.75a±1.74 6.50a±1.47 6.60a±1.81 6.45a±0.69 6.40a±1.64 6.15a±1.79
Values are mean ± standard deviation of 20 panellists. Means within a row with the same superscript were not significantly (p < 0.05) different.Key: RF + CF (100:0) = 100 % Local rice flour and 0% cowpea flour; RF + CF (0:100) = 0% Local rice flour and 100% Fermented white cowpea flour; RF + CF (90:10) = 90%of local rice flour and 10% fermented white cowpea flour; RF + CF (80:20) = 80% Local rice flour and 20% fermented white cowpea flour; RF + CF (70:30) = 70% Local rice
flour and 30% fermented white cowpea flour; RF + CF (60:40) = 60% Local rice flour and 40% fermented white cowpea flour; RF + CF (50:50) = 50% Local rice flour and 50%Fermented white cowpea flour
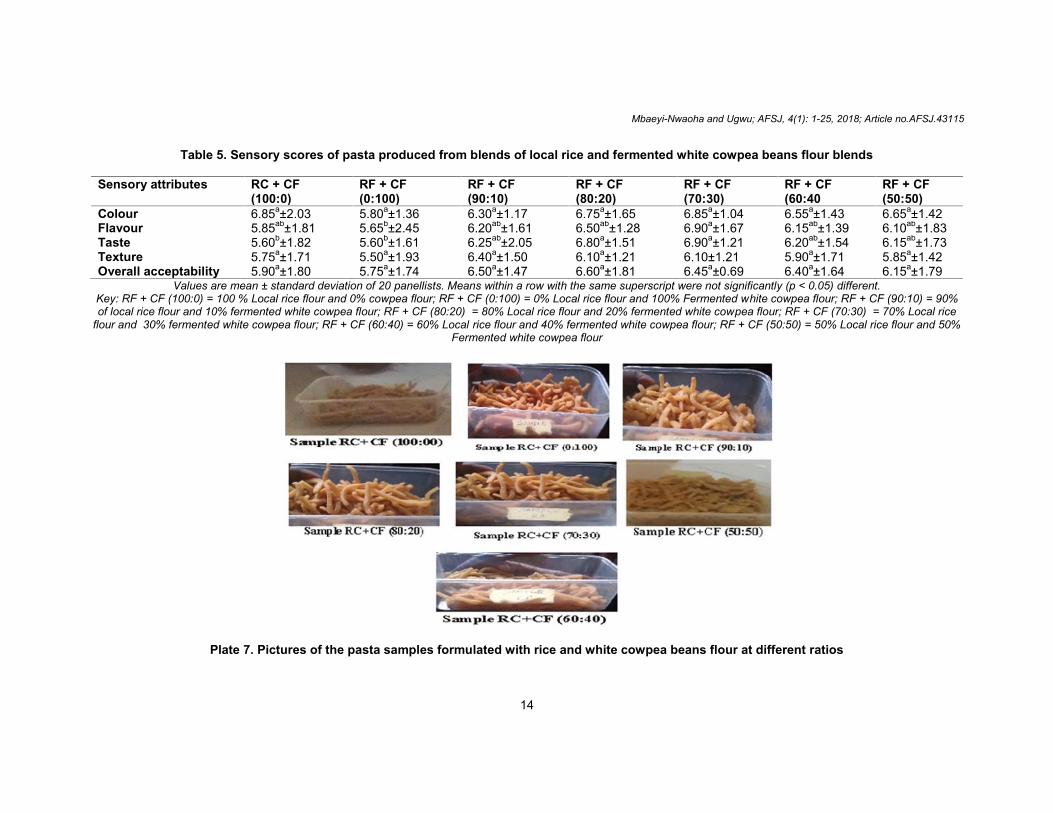
Plate 7. Pictures of the pasta samples formulated with rice and white cowpea beans flour at different ratios
Mbaeyi-Nwaoha and Ugwu; AFSJ, 4(1): 1-25, 2018; Article no.AFSJ.43115
15
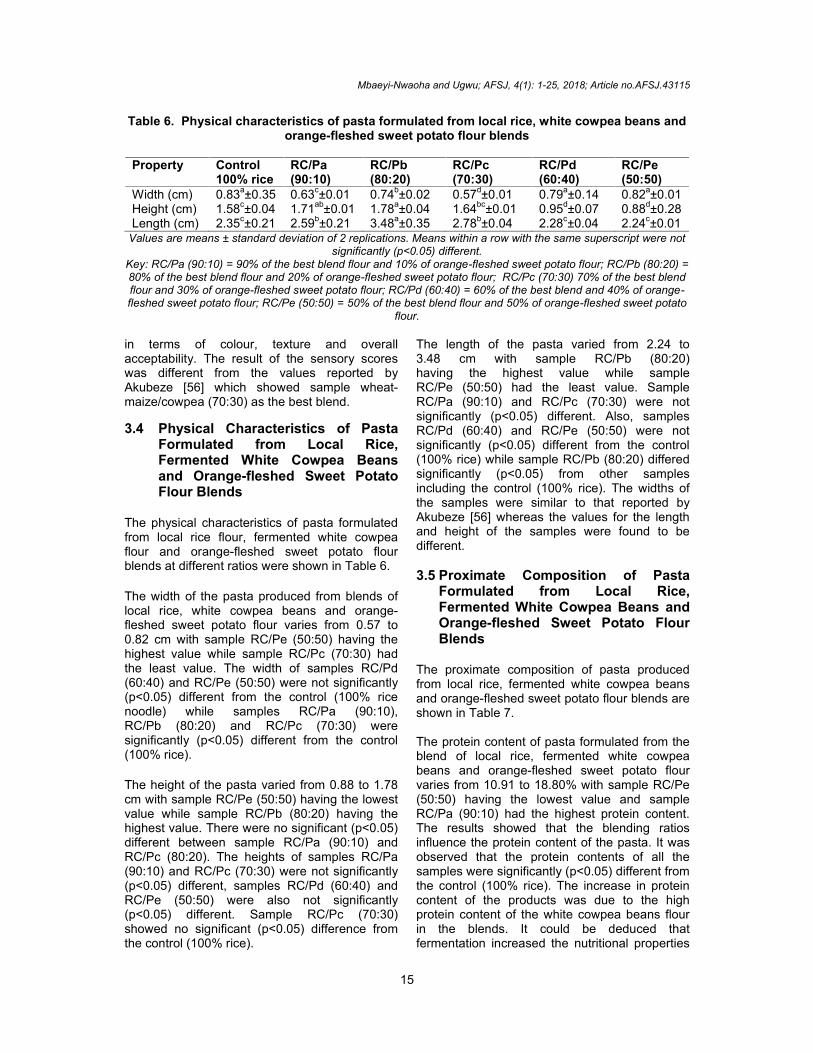
Table 6. Physical characteristics of pasta formulated from local rice, white cowpea beans andorange-fleshed sweet potato flour blends
Property Control100% rice
RC/Pa(90:10)
RC/Pb(80:20)
RC/Pc(70:30)
RC/Pd(60:40)
RC/Pe(50:50)
Width (cm) 0.83a±0.35 0.63c±0.01 0.74b±0.02 0.57d±0.01 0.79a±0.14 0.82a±0.01Height (cm) 1.58c±0.04 1.71ab±0.01 1.78a±0.04 1.64bc±0.01 0.95d±0.07 0.88d±0.28Length (cm) 2.35c±0.21 2.59b±0.21 3.48a±0.35 2.78b±0.04 2.28c±0.04 2.24c±0.01
Values are means ± standard deviation of 2 replications. Means within a row with the same superscript were notsignificantly (p<0.05) different.
Key: RC/Pa (90:10) = 90% of the best blend flour and 10% of orange-fleshed sweet potato flour; RC/Pb (80:20) =80% of the best blend flour and 20% of orange-fleshed sweet potato flour; RC/Pc (70:30) 70% of the best blendflour and 30% of orange-fleshed sweet potato flour; RC/Pd (60:40) = 60% of the best blend and 40% of orange-fleshed sweet potato flour; RC/Pe (50:50) = 50% of the best blend flour and 50% of orange-fleshed sweet potato
flour.
in terms of colour, texture and overallacceptability. The result of the sensory scoreswas different from the values reported byAkubeze [56] which showed sample wheat-maize/cowpea (70:30) as the best blend.
3.4 Physical Characteristics of PastaFormulated from Local Rice,Fermented White Cowpea Beansand Orange-fleshed Sweet PotatoFlour Blends
The physical characteristics of pasta formulatedfrom local rice flour, fermented white cowpeaflour and orange-fleshed sweet potato flourblends at different ratios were shown in Table 6.
The width of the pasta produced from blends oflocal rice, white cowpea beans and orange-fleshed sweet potato flour varies from 0.57 to0.82 cm with sample RC/Pe (50:50) having thehighest value while sample RC/Pc (70:30) hadthe least value. The width of samples RC/Pd(60:40) and RC/Pe (50:50) were not significantly(p<0.05) different from the control (100% ricenoodle) while samples RC/Pa (90:10),RC/Pb (80:20) and RC/Pc (70:30) weresignificantly (p<0.05) different from the control(100% rice).
The height of the pasta varied from 0.88 to 1.78cm with sample RC/Pe (50:50) having the lowestvalue while sample RC/Pb (80:20) having thehighest value. There were no significant (p<0.05)different between sample RC/Pa (90:10) andRC/Pc (80:20). The heights of samples RC/Pa(90:10) and RC/Pc (70:30) were not significantly(p<0.05) different, samples RC/Pd (60:40) andRC/Pe (50:50) were also not significantly(p<0.05) different. Sample RC/Pc (70:30)showed no significant (p<0.05) difference fromthe control (100% rice).
The length of the pasta varied from 2.24 to3.48 cm with sample RC/Pb (80:20)having the highest value while sampleRC/Pe (50:50) had the least value. SampleRC/Pa (90:10) and RC/Pc (70:30) were notsignificantly (p<0.05) different. Also, samplesRC/Pd (60:40) and RC/Pe (50:50) were notsignificantly (p<0.05) different from the control(100% rice) while sample RC/Pb (80:20) differedsignificantly (p<0.05) from other samplesincluding the control (100% rice). The widths ofthe samples were similar to that reported byAkubeze [56] whereas the values for the lengthand height of the samples were found to bedifferent.
3.5 Proximate Composition of PastaFormulated from Local Rice,Fermented White Cowpea Beans andOrange-fleshed Sweet Potato FlourBlends
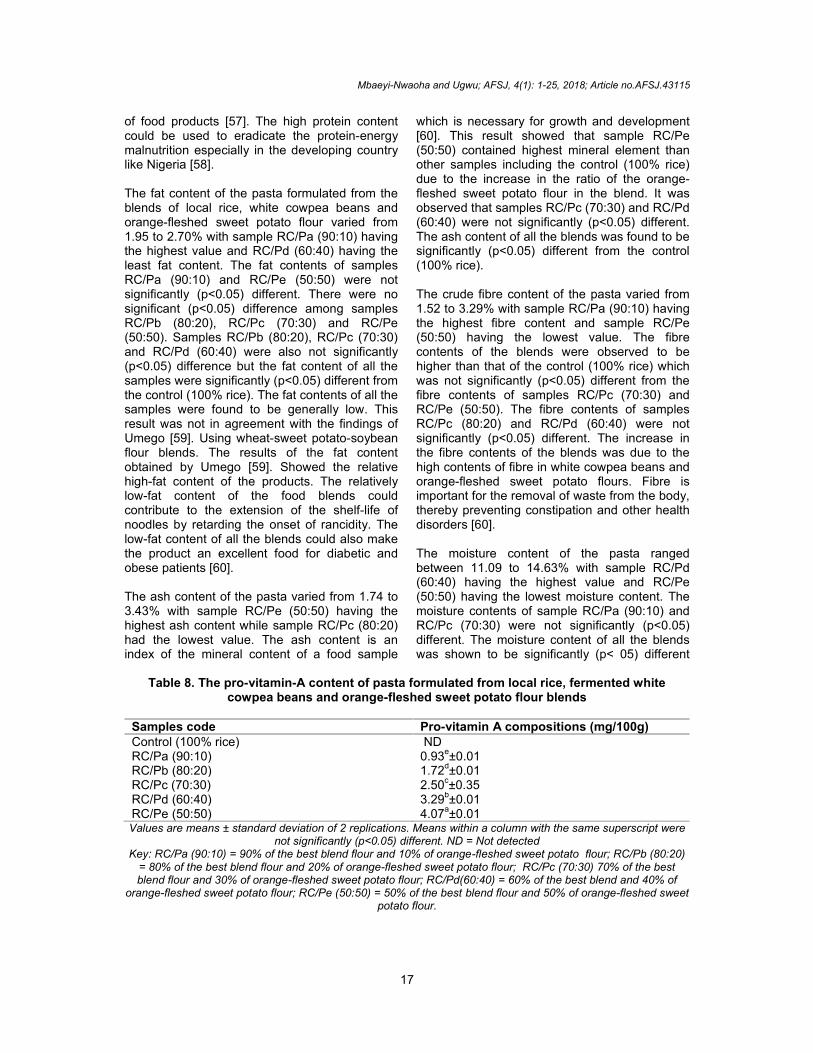
The proximate composition of pasta producedfrom local rice, fermented white cowpea beansand orange-fleshed sweet potato flour blends areshown in Table 7.
The protein content of pasta formulated from theblend of local rice, fermented white cowpeabeans and orange-fleshed sweet potato flourvaries from 10.91 to 18.80% with sample RC/Pe(50:50) having the lowest value and sampleRC/Pa (90:10) had the highest protein content.The results showed that the blending ratiosinfluence the protein content of the pasta. It wasobserved that the protein contents of all thesamples were significantly (p<0.05) different fromthe control (100% rice). The increase in proteincontent of the products was due to the highprotein content of the white cowpea beans flourin the blends. It could be deduced thatfermentation increased the nutritional properties
Mbaeyi-Nwaoha and Ugwu; AFSJ, 4(1): 1-25, 2018; Article no.AFSJ.43115
16
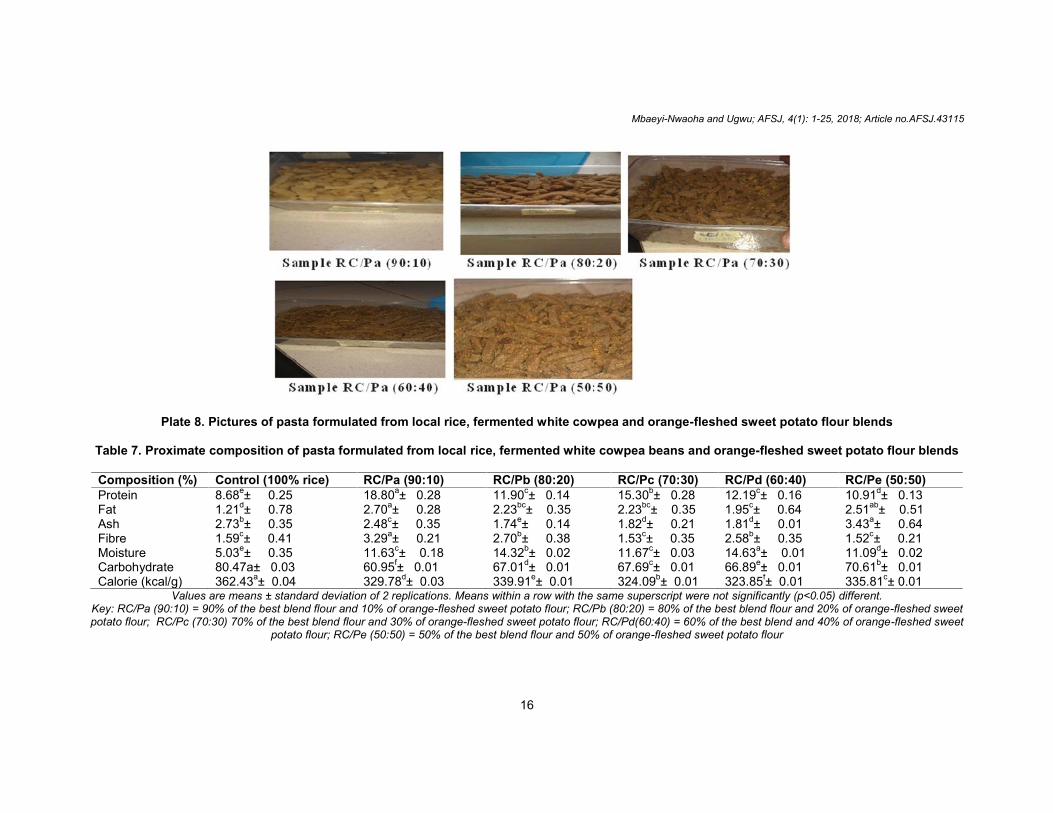
Plate 8. Pictures of pasta formulated from local rice, fermented white cowpea and orange-fleshed sweet potato flour blends
Table 7. Proximate composition of pasta formulated from local rice, fermented white cowpea beans and orange-fleshed sweet potato flour blends
Composition (%) Control (100% rice) RC/Pa (90:10) RC/Pb (80:20) RC/Pc (70:30) RC/Pd (60:40) RC/Pe (50:50)Protein 8.68e± 0.25 18.80a± 0.28 11.90c± 0.14 15.30b± 0.28 12.19c± 0.16 10.91d± 0.13Fat 1.21d± 0.78 2.70a± 0.28 2.23bc± 0.35 2.23bc± 0.35 1.95c± 0.64 2.51ab± 0.51Ash 2.73b± 0.35 2.48c± 0.35 1.74e± 0.14 1.82d± 0.21 1.81d± 0.01 3.43a± 0.64Fibre 1.59c± 0.41 3.29a± 0.21 2.70b± 0.38 1.53c± 0.35 2.58b± 0.35 1.52c± 0.21Moisture 5.03e± 0.35 11.63c± 0.18 14.32b± 0.02 11.67c± 0.03 14.63a± 0.01 11.09d± 0.02Carbohydrate 80.47a± 0.03 60.95f± 0.01 67.01d± 0.01 67.69c± 0.01 66.89e± 0.01 70.61b± 0.01Calorie (kcal/g) 362.43a± 0.04 329.78d± 0.03 339.91e± 0.01 324.09b± 0.01 323.85f± 0.01 335.81c± 0.01
Values are means ± standard deviation of 2 replications. Means within a row with the same superscript were not significantly (p<0.05) different.Key: RC/Pa (90:10) = 90% of the best blend flour and 10% of orange-fleshed sweet potato flour; RC/Pb (80:20) = 80% of the best blend flour and 20% of orange-fleshed sweetpotato flour; RC/Pc (70:30) 70% of the best blend flour and 30% of orange-fleshed sweet potato flour; RC/Pd(60:40) = 60% of the best blend and 40% of orange-fleshed sweet
potato flour; RC/Pe (50:50) = 50% of the best blend flour and 50% of orange-fleshed sweet potato flour
Mbaeyi-Nwaoha and Ugwu; AFSJ, 4(1): 1-25, 2018; Article no.AFSJ.43115
17
of food products [57]. The high protein contentcould be used to eradicate the protein-energymalnutrition especially in the developing countrylike Nigeria [58].
The fat content of the pasta formulated from theblends of local rice, white cowpea beans andorange-fleshed sweet potato flour varied from1.95 to 2.70% with sample RC/Pa (90:10) havingthe highest value and RC/Pd (60:40) having theleast fat content. The fat contents of samplesRC/Pa (90:10) and RC/Pe (50:50) were notsignificantly (p<0.05) different. There were nosignificant (p<0.05) difference among samplesRC/Pb (80:20), RC/Pc (70:30) and RC/Pe(50:50). Samples RC/Pb (80:20), RC/Pc (70:30)and RC/Pd (60:40) were also not significantly(p<0.05) difference but the fat content of all thesamples were significantly (p<0.05) different fromthe control (100% rice). The fat contents of all thesamples were found to be generally low. Thisresult was not in agreement with the findings ofUmego [59]. Using wheat-sweet potato-soybeanflour blends. The results of the fat contentobtained by Umego [59]. Showed the relativehigh-fat content of the products. The relativelylow-fat content of the food blends couldcontribute to the extension of the shelf-life ofnoodles by retarding the onset of rancidity. Thelow-fat content of all the blends could also makethe product an excellent food for diabetic andobese patients [60].
The ash content of the pasta varied from 1.74 to3.43% with sample RC/Pe (50:50) having thehighest ash content while sample RC/Pc (80:20)had the lowest value. The ash content is anindex of the mineral content of a food sample
which is necessary for growth and development[60]. This result showed that sample RC/Pe(50:50) contained highest mineral element thanother samples including the control (100% rice)due to the increase in the ratio of the orange-fleshed sweet potato flour in the blend. It wasobserved that samples RC/Pc (70:30) and RC/Pd(60:40) were not significantly (p<0.05) different.The ash content of all the blends was found to besignificantly (p<0.05) different from the control(100% rice).
The crude fibre content of the pasta varied from1.52 to 3.29% with sample RC/Pa (90:10) havingthe highest fibre content and sample RC/Pe(50:50) having the lowest value. The fibrecontents of the blends were observed to behigher than that of the control (100% rice) whichwas not significantly (p<0.05) different from thefibre contents of samples RC/Pc (70:30) andRC/Pe (50:50). The fibre contents of samplesRC/Pc (80:20) and RC/Pd (60:40) were notsignificantly (p<0.05) different. The increase inthe fibre contents of the blends was due to thehigh contents of fibre in white cowpea beans andorange-fleshed sweet potato flours. Fibre isimportant for the removal of waste from the body,thereby preventing constipation and other healthdisorders [60].
The moisture content of the pasta rangedbetween 11.09 to 14.63% with sample RC/Pd(60:40) having the highest value and RC/Pe(50:50) having the lowest moisture content. Themoisture contents of sample RC/Pa (90:10) andRC/Pc (70:30) were not significantly (p<0.05)different. The moisture content of all the blendswas shown to be significantly (p< 05) different
Table 8. The pro-vitamin-A content of pasta formulated from local rice, fermented whitecowpea beans and orange-fleshed sweet potato flour blends
Samples code Pro-vitamin A compositions (mg/100g)Control (100% rice) NDRC/Pa (90:10) 0.93e±0.01RC/Pb (80:20) 1.72d±0.01RC/Pc (70:30) 2.50c±0.35RC/Pd (60:40) 3.29b±0.01RC/Pe (50:50) 4.07a±0.01Values are means ± standard deviation of 2 replications. Means within a column with the same superscript were
not significantly (p<0.05) different. ND = Not detectedKey: RC/Pa (90:10) = 90% of the best blend flour and 10% of orange-fleshed sweet potato flour; RC/Pb (80:20)
= 80% of the best blend flour and 20% of orange-fleshed sweet potato flour; RC/Pc (70:30) 70% of the bestblend flour and 30% of orange-fleshed sweet potato flour; RC/Pd(60:40) = 60% of the best blend and 40% of
orange-fleshed sweet potato flour; RC/Pe (50:50) = 50% of the best blend flour and 50% of orange-fleshed sweetpotato flour.
Mbaeyi-Nwaoha and Ugwu; AFSJ, 4(1): 1-25, 2018; Article no.AFSJ.43115
18
from the control (100% rice). The relatively highmoisture contents of the blends could beattributed to their relatively high fibre content.Fibrous food products have the ability to trapmore moisture than their less fibrouscounterparts [60]. Low moisture contentenhances the storage stability of foods. This isbecause moisture enhances the biochemicalreactions that would lead to food spoilage. Asimilar result was reported by David [61].usingmaize and cowpea flour blends.
The carbohydrate content of the control (100%rice) was higher (80.47%) than that of the blendswhile sample RC/Pa (90:10) had the leastcarbohydrate content. The carbohydrate contentsof all the samples were significantly (p<0.05)different from the control (100% rice). Thedecrease in the carbohydrate contents could bedue to the fact that carbohydrate by differencedepended on the other nutrients.
The calorie content for the pasta varied from323.85 to 339.91 kcal/100g with sample RC/Pd(60:40) having the least calorie value whilesample RC/Pc (70:30) had the highest calorievalue. The caloric values of all the samples weresignificantly (p<0.05) different from the control(100% rice). The high calorie content of thecontrol (100% rice) could be attributed to the highcarbohydrate content of the pasta.
The values obtained for the proximatecompositions compared favourably well with thevalues reported by David [61].using maize andcowpea flour blends and that of Akubeze [56].using wheat/maize and mungbean flour blends.
3.6 Pro-Vitamin a Content of PastaFormulated from Local Rice,Fermented White Cowpea Beans andOrange-fleshed Sweet Potato FlourBlends
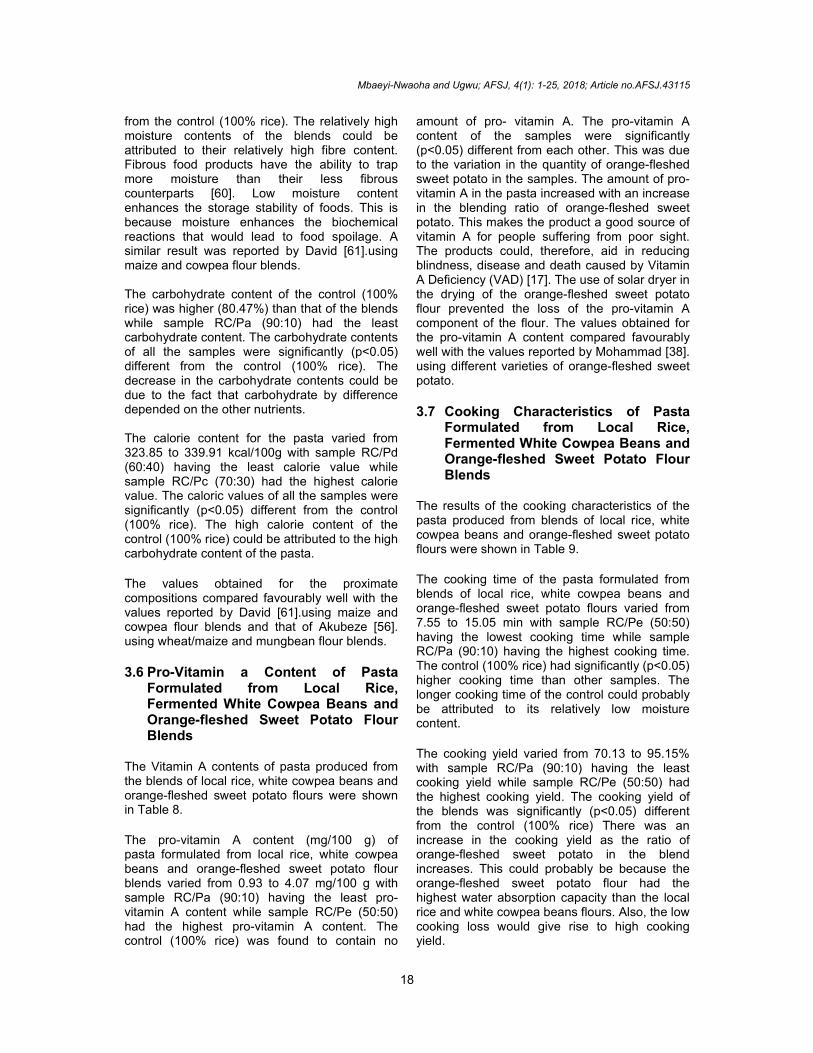
The Vitamin A contents of pasta produced fromthe blends of local rice, white cowpea beans andorange-fleshed sweet potato flours were shownin Table 8.
The pro-vitamin A content (mg/100 g) ofpasta formulated from local rice, white cowpeabeans and orange-fleshed sweet potato flourblends varied from 0.93 to 4.07 mg/100 g withsample RC/Pa (90:10) having the least pro-vitamin A content while sample RC/Pe (50:50)had the highest pro-vitamin A content. Thecontrol (100% rice) was found to contain no
amount of pro- vitamin A. The pro-vitamin Acontent of the samples were significantly(p<0.05) different from each other. This was dueto the variation in the quantity of orange-fleshedsweet potato in the samples. The amount of pro-vitamin A in the pasta increased with an increasein the blending ratio of orange-fleshed sweetpotato. This makes the product a good source ofvitamin A for people suffering from poor sight.The products could, therefore, aid in reducingblindness, disease and death caused by VitaminA Deficiency (VAD) [17]. The use of solar dryer inthe drying of the orange-fleshed sweet potatoflour prevented the loss of the pro-vitamin Acomponent of the flour. The values obtained forthe pro-vitamin A content compared favourablywell with the values reported by Mohammad [38].using different varieties of orange-fleshed sweetpotato.
3.7 Cooking Characteristics of PastaFormulated from Local Rice,Fermented White Cowpea Beans andOrange-fleshed Sweet Potato FlourBlends
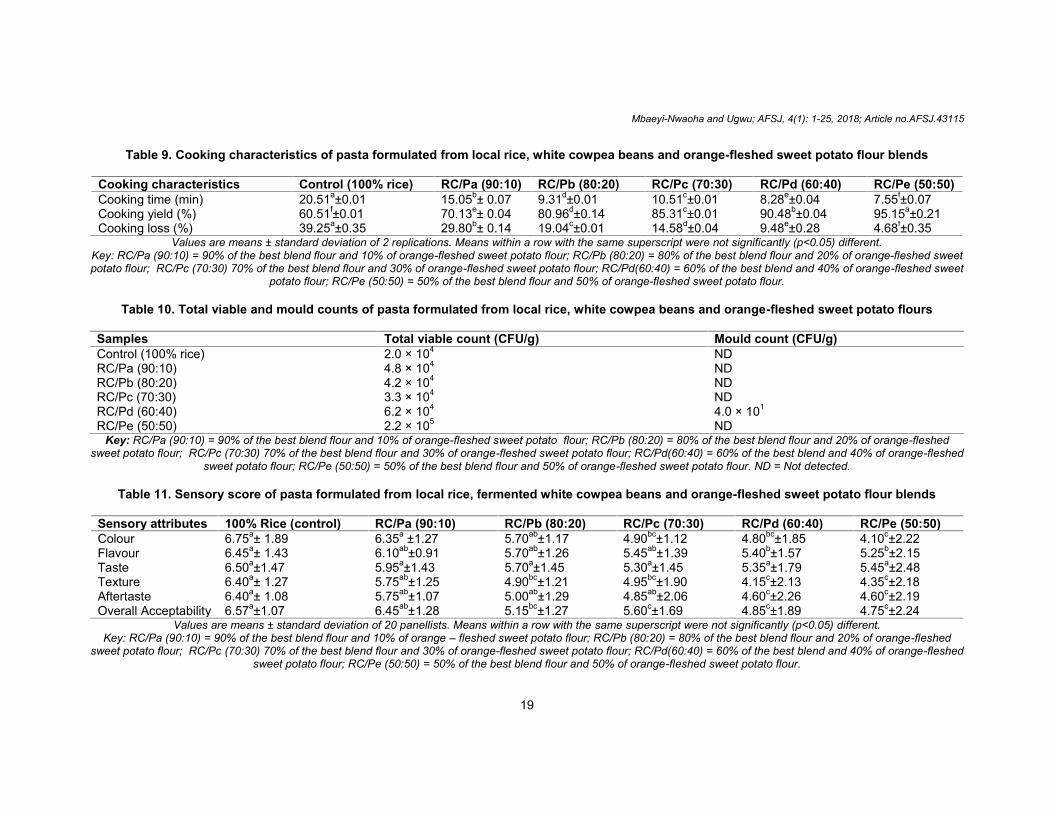
The results of the cooking characteristics of thepasta produced from blends of local rice, whitecowpea beans and orange-fleshed sweet potatoflours were shown in Table 9.
The cooking time of the pasta formulated fromblends of local rice, white cowpea beans andorange-fleshed sweet potato flours varied from7.55 to 15.05 min with sample RC/Pe (50:50)having the lowest cooking time while sampleRC/Pa (90:10) having the highest cooking time.The control (100% rice) had significantly (p<0.05)higher cooking time than other samples. Thelonger cooking time of the control could probablybe attributed to its relatively low moisturecontent.
The cooking yield varied from 70.13 to 95.15%with sample RC/Pa (90:10) having the leastcooking yield while sample RC/Pe (50:50) hadthe highest cooking yield. The cooking yield ofthe blends was significantly (p<0.05) differentfrom the control (100% rice) There was anincrease in the cooking yield as the ratio oforange-fleshed sweet potato in the blendincreases. This could probably be because theorange-fleshed sweet potato flour had thehighest water absorption capacity than the localrice and white cowpea beans flours. Also, the lowcooking loss would give rise to high cookingyield.
Mbaeyi-Nwaoha and Ugwu; AFSJ, 4(1): 1-25, 2018; Article no.AFSJ.43115
19
Table 9. Cooking characteristics of pasta formulated from local rice, white cowpea beans and orange-fleshed sweet potato flour blends
Cooking characteristics Control (100% rice) RC/Pa (90:10) RC/Pb (80:20) RC/Pc (70:30) RC/Pd (60:40) RC/Pe (50:50)Cooking time (min) 20.51a±0.01 15.05b± 0.07 9.31d±0.01 10.51c±0.01 8.28e±0.04 7.55f±0.07Cooking yield (%) 60.51f±0.01 70.13e± 0.04 80.96d±0.14 85.31c±0.01 90.48b±0.04 95.15a±0.21Cooking loss (%) 39.25a±0.35 29.80b± 0.14 19.04c±0.01 14.58d±0.04 9.48e±0.28 4.68f±0.35
Values are means ± standard deviation of 2 replications. Means within a row with the same superscript were not significantly (p<0.05) different.Key: RC/Pa (90:10) = 90% of the best blend flour and 10% of orange-fleshed sweet potato flour; RC/Pb (80:20) = 80% of the best blend flour and 20% of orange-fleshed sweetpotato flour; RC/Pc (70:30) 70% of the best blend flour and 30% of orange-fleshed sweet potato flour; RC/Pd(60:40) = 60% of the best blend and 40% of orange-fleshed sweet
potato flour; RC/Pe (50:50) = 50% of the best blend flour and 50% of orange-fleshed sweet potato flour.
Table 10. Total viable and mould counts of pasta formulated from local rice, white cowpea beans and orange-fleshed sweet potato flours
Samples Total viable count (CFU/g) Mould count (CFU/g)Control (100% rice) 2.0 × 10⁴ NDRC/Pa (90:10) 4.8 × 10⁴ NDRC/Pb (80:20) 4.2 × 10⁴ NDRC/Pc (70:30) 3.3 × 10⁴ NDRC/Pd (60:40) 6.2 × 10⁴ 4.0 × 101
RC/Pe (50:50) 2.2 × 10⁵ NDKey: RC/Pa (90:10) = 90% of the best blend flour and 10% of orange-fleshed sweet potato flour; RC/Pb (80:20) = 80% of the best blend flour and 20% of orange-fleshed
sweet potato flour; RC/Pc (70:30) 70% of the best blend flour and 30% of orange-fleshed sweet potato flour; RC/Pd(60:40) = 60% of the best blend and 40% of orange-fleshedsweet potato flour; RC/Pe (50:50) = 50% of the best blend flour and 50% of orange-fleshed sweet potato flour. ND = Not detected.
Table 11. Sensory score of pasta formulated from local rice, fermented white cowpea beans and orange-fleshed sweet potato flour blends
Sensory attributes 100% Rice (control) RC/Pa (90:10) RC/Pb (80:20) RC/Pc (70:30) RC/Pd (60:40) RC/Pe (50:50)Colour 6.75a± 1.89 6.35a ±1.27 5.70ab±1.17 4.90bc±1.12 4.80bc±1.85 4.10c±2.22Flavour 6.45a± 1.43 6.10ab±0.91 5.70ab±1.26 5.45ab±1.39 5.40b±1.57 5.25b±2.15Taste 6.50a±1.47 5.95a±1.43 5.70a±1.45 5.30a±1.45 5.35a±1.79 5.45a±2.48Texture 6.40a± 1.27 5.75ab±1.25 4.90bc±1.21 4.95bc±1.90 4.15c±2.13 4.35c±2.18Aftertaste 6.40a± 1.08 5.75ab±1.07 5.00ab±1.29 4.85ab±2.06 4.60c±2.26 4.60c±2.19Overall Acceptability 6.57a±1.07 6.45ab±1.28 5.15bc±1.27 5.60c±1.69 4.85c±1.89 4.75c±2.24
Values are means ± standard deviation of 20 panellists. Means within a row with the same superscript were not significantly (p<0.05) different.Key: RC/Pa (90:10) = 90% of the best blend flour and 10% of orange – fleshed sweet potato flour; RC/Pb (80:20) = 80% of the best blend flour and 20% of orange-fleshed
sweet potato flour; RC/Pc (70:30) 70% of the best blend flour and 30% of orange-fleshed sweet potato flour; RC/Pd(60:40) = 60% of the best blend and 40% of orange-fleshedsweet potato flour; RC/Pe (50:50) = 50% of the best blend flour and 50% of orange-fleshed sweet potato flour.
Mbaeyi-Nwaoha and Ugwu; AFSJ, 4(1): 1-25, 2018; Article no.AFSJ.43115
20
The cooking loss varied from 4.68 to 29.80% withsample RC/Pe (50:50) having the least cookingloss while sample RC/Pa (90:10) had the highestcooking loss. The cooking loss of the blends wasnot significantly (p<0.05) different from thecontrol (100% rice). The blends had the lowestcooking loss than the control (100% rice). Thiscould be attributed to the low solubility of the rice,cowpea and orange-fleshed sweet potato flourblends. The overall network that holds the noodlestructure might consist primarily of protein andstarch matrices [62].
The values obtained for the cooking time andcooking loss of the pasta was higher than thatreported by Akubeze [56] using wheat/maize andmungbean flour blends, but the cooking yieldwas similar.
3.8 Microbiological Content of PastaFormulated from Local Rice, WhiteCowpea Beans and Orange-fleshedSweet Potato Flour Blends
The total viable count and mould count of pastaformulated from blends of local rice, whitecowpea beans and orange-fleshed sweet potatoflours are shown in Table 10.
The total viable count of the pasta ranged from3.3 × 104 to 2.2 × 10⁵ CFU/g with sample RC/Pc(70:30) having the least value and sample RC/Pe(50:50) had the highest value. The mould countwas not detected on other samples exceptsample RC/Pe (60:40) which had the 4.0 × 101.This could be because of its high moisturecontent. Microorganisms play a significant role inthe determination of the shelf life of products.Microorganisms are usually responsible forspoilage of many food items. A high total viablecount could indicate the presence of a mixedpopulation of microorganisms, which may consistof spoilage types. The total viable count andmould count of the samples were not high whenassessed using the guidelines for microbiologicalquality of pasta products [63] which indicated 104
CFU/g for satisfactory, 104 to 105 CFU/gacceptable and 106 CFU/g and above as being ofunsatisfactory quality. The total bacterial andfungal counts in the food product may be aconsequence of fermentation of the whitecowpea flour and low level of hygiene maintainedduring processing of the product. Limits ofmicrobial counts have been recommended inmost foods to keep them safe for consumption[64]. Thus, it is preferable to utilize these floursas soon as possible especially the fermented
white cowpea beans flour because of the highprotein content which might cause spoilage.
3.9 Sensory Scores of Pasta Formulatedfrom Local Rice, Fermented WhiteCowpea Beans and Orange-fleshedSweet Potato Flour Blends
The sensory scores of the pasta formulated fromlocal rice, fermented white cowpea beans andorange-fleshed sweet potato flour blends areshown in Table 11.
The sensory scores for colour varied from 4.10 to6.35 with sample RC/Pa (50:50) having the leastscore while sample RC/Pa (90:10) had thehighest score. There were no significant (p<0.05)difference in colour between samples RC/Pa(90:10), RC/Pb (80:20) and the control (100%rice). Also, there was no significant (p<0.05)difference among samples RC/Pb (80:20), RC/Pc(70:30) and RC/Pd (60:40). It was also observedthat there was no significant (p<0.05) differencein colour among samples RC/Pc (70:30), RC/Pd(60:40) and RC/Pe (50:50), while the control(100% rice) were significantly (p<0.05) differentfrom samples RC/Pc (70:30), RC/Pd (60:40) andRC/Pe (50:50). Transparency in colour has alsoused an indicator in assessing the quality ofpasta [65]. The appearance/colour of the noodlesbecame darker (from light brown to dark brown)with increasing level of orange-fleshed sweetpotato in the blend. The increasing substitutionlevel of the orange-fleshed sweet potato may becaused a significant decrease in scores. Thiscould probably be because potatoes were moreapt to scotch or discolour during dehydration ordarken during product storage when they havehigh reducing sugar content. Orange-fleshedsweet potato used to formulate the pastaproducts contained a high amount of reducingsugar. This discolouration could be due to thereactions involving amino acids and reducingsugars [66]. A similar result was obtained byUmego [59] using wheat-sweet potato-soy beanflour blends and wheat pasta substituted withhull-less barley [55].
The sensory score for flavour ranged from 5.25to 6.10 with sample RC/Pe (50:50) having theleast score and sample RC/Pa (90:10) having thehighest score. There were no significant (p<0.05)different in flavour among samples RC/Pa(90:10), RC/Pb (80:20) and RC/Pc (70:30) andthe control (100% rice). Also, there was nosignificant (p<0.05)difference in flavour amongsamples RC/Pa (90:10), RC/Pb (80:20), RC/Pc
Mbaeyi-Nwaoha and Ugwu; AFSJ, 4(1): 1-25, 2018; Article no.AFSJ.43115
21
(70:30), RC/Pd (60:40) and RC/Pe (50:50), whilethe control (100% rice) was significantly (p<0.05)different in flavour from samples RC/Pd (60:40)and RC/Pe (50:50). The desirable flavourattributes of the samples could be due to theeffect of fermentation on the organolepticproperties of foods [57].
The sensory scores for taste varied from 5.30 to5.95 with sample RC/Pc (70:30) having thelowest score and sample RC/Pa (90:10) havingthe highest score. There was no significant(p<0.05) difference in the taste of the blends andthe control (100% rice). The samples were foundto have a good taste which could be attributed tothe high reducing sugar content of the orange-fleshed sweet potato flour and the effect offermentation on the organoleptic properties of thefermented white cowpea beans flour [57, 65]. Asimilar result was obtained by Umego [59].
The sensory scores for texture varied from 4.15to 5.75 with sample RC/Pd (60:40) having theleast score and sample RC/Pa (90:10) having thehighest score. The low texture score of sampleRC/Pd (60:40) could be attributed to the increasein the amount of orange-fleshed sweet potatoflour in the blend. This was because; the orange-fleshed sweet potato had a coarse particle size(300 µm). Also, the smooth texture of sampleRC/Pa (90:10) could be due to the high amountof fermented cowpea beans flour in the samplewhich had the finest particle size (500 µm), andlow amount of orange-fleshed sweet potato flour.There were no significant (p<0.05) differencebetween the control (100% rice) and sampleRC/Pa (90:10). Also, there were no significant(p<0.05) difference among samples RC/Pa(90:10), RC/Pb (80:20) and RC/Pc (70:30).Samples RC/Pb (80:20), RC/Pc (70:30), RC/Pd(60:40) and RC/Pe (50:50) were not significantly(p<0.05) different, while samples RC/Pb (80:20),RC/Pc (70:30), RC/Pd (60:40) and RC/Pe(50:50) were significantly (p<0.05) different fromthe control (100% rice).
The sensory score for the aftertaste varied from4.60 to 5.75 with sample RC/Pd (60:40) andRC/Pe (50:50) having the lowest score whilesample RC/Pa (90:10) had the highest score.There were no significant (p<0.05) differentamong samples RC/Pa (90:10), RC/Pb (80:20)and RC/Pc (70:30) and the control (100% rice).Samples RC/Pd (60:40) and RC/Pe (50:50) werealso not significantly (p<0.05) different from eachother but significantly (p<0.05) different from thecontrol (100% rice).
Based on the overall acceptability, the control(100% rice) had the highest score (6.57) followedby sample RC/Pa (90:10) which scored 6.45,while sample RC/Pe (50:50) had the least score(4.75). There were no significant (p<0.05)difference between the control (100% rice) andsample RC/Pa (90:10). Also, there was nosignificant (p<0.05) difference between samplesRC/Pa (90:10) and RC/Pb (80:20). SamplesRC/Pb (80:20), RC/Pc (70:30), RC/Pd (60:40)and RC/Pe (50:50) were not significantly(p<0.05) different from each other butsignificantly (p<0.05) different from the control(100% rice). All the samples had a good ratingfor all the sensory attributes since their scoreswere higher than the mean 4.5 for a 9 – pointHedonic scale used for the sensory. The sensoryscores compared favourably well with the data[59] using wheat-sweet potato-soy bean flourblends and orange-fleshed sweet potato andrice-field bean gluten-free pasta improved by theaddition of hydrothermally treated rice flour [67].From the sensory scores, it showed nosignificant difference (p>0.05) in taste, colourand flavour between the control and the optimumpasta. The obtained results showed that theoptimal formulation of pasta was significantlybetter with the highest scores for all theattributes. Moreover, the selected optimum pastagathered superior scores (values above 5 on a 9-point Hedonic scale) in the overall acceptability incomparison with the control sample without theaddition of orange-fleshed sweet potato.
4. CONCLUSION AND RECOMMENDA-TION
From the study, it has shown that acceptablepasta could be produced from blends of localrice, white cowpea beans and orange-fleshedsweet potato flour. The result showed that theaddition of white cowpea beans and orange-fleshed sweet potato in the pasta formulationaffected the chemical, cooking and sensoryproperties of the pasta. Addition of white cowpeabeans improved the protein content of the ricepasta. The use of orange-fleshed sweet potatoimproved the pro- vitamin A content of the pasta,thereby making the product a good source ofvitamin A which could aid in reducing blindness,disease and death caused by vitamin Adeficiency. The use of rice-cowpea-orange-fleshed sweet potato pasta would help toalleviate problems of protein-energy malnutritionand micro-nutrient deficiency in Nigeria and otherdeveloping countries. Also, the sample obtainedby blending 90% of rice/cowpea flour blend and
Mbaeyi-Nwaoha and Ugwu; AFSJ, 4(1): 1-25, 2018; Article no.AFSJ.43115
22
10% orange-fleshed sweet potato was mostpreferred among all the samples formulated. Thesample had the highest mean score on all thesensory attributes evaluated.
Based on the result of the study, it isrecommended that the use of underutilizedagricultural produce such as local rice (Adani rice“Faro 54”) and white cowpea beans “akidicharamanya” should be encouraged in foodproduct formulations and development because itreduced nutritional imbalance and would help inboosting of rural dwellers income. Consumersshould be enlightened on the nutritional andhealth benefits of orange-fleshed sweet potato asa strategy for food diversification. Further studiesshould also be carried out on the shelf stabilityand colour of the pasta formulated from the flourblends.
ACKNOWLEDGEMENT
The authors thank the National Root CropResearch Institute, Umudike, Abia State formature orange-fleshed sweet potato (Ipomeobatatas L.) (umusco/3).
COMPETING INTERESTS
Authors have declared that no competinginterests exist.
REFERENCES
1. McClatchey C. How pasta became theworld’s favourite food; 2011.Available:http//www.bbc.com(Accessed November 12th, 2016)
2. Sui Z, Locas P, Corke H. Optional cookingtime of noodles related to their notchsensitivity. Journal of Texture Studies.2006;37:428–441.
3. Owen G. Cereals processing technology.england, cambridge. Woodhead PublishingLimited. 2008;131-151.
4. World Instant Noodle Association. InstantNoodle Facts Worldwide; 2001.Available:http//www.Instant%20noodle%20-%20Wikipedia.mht(Accessed on November 20th, 2016)
5. Mearim ML, Invarsson A, Dickey W. Celiacdisease: Is it time for mass screening?Best Practice and Research ClinicalGastroenterology. 2005;19(13):41-452.
6. Tongpun N. Formulation of soy protein-enriched instant noodles. Master ofScience Dissertation (Nutrition), Faculty ofGraduate Studies, Mahidol University,Bangkok, Thailand; 2006.
7. Flodin NW. The metabolic roles,pharmacology and toxicology of lysine.The Journal of the American College ofNutrition. 1997;16(1):7-21.
8. Kumara D. Routledge studies in themodern world economy: Poverty,Inequality, and growth in developingcountries: Theoretical and empiricalapproaches edited by Atsushi Maki.Canada: Routledge Publishers. 2015;130.
9. Wa sche A Muller, K Knauf U. Newprocessing of lupin protein isolates andfunctional properties. Nahrung/Food. 2001;45:393-395.
10. Duranti M. Grain legume proteins andnutraceutical properties. Fitodorapia. 2006;77:67-82.
11. Haard NF, Chism GW. Characteristics ofedible plant tissues. In: Food chemistry.New York Marcel Dekker, Inc. 1996;943-1001.
12. Raymond N, Heap J, Case S. The gluten-free diet: An update for healthprofessionals. Practice. Gastroenterology.2006;30(9):67–69.
13. Amussen HW, Sharp RN, Sharp CK. Thefeasibility of making soups from rice flourand hydrolyzed rice. Journal of AmericanDietetic Association. 1990;90(7):991-993.
14. Leardkamolkarn V, Thongthep W,Suttiarporn P, Kongkachuichai R,Wongpornchai S, Wanavijit A.Chemopreventive properties of the branextracted from a newly-developed Thairice: The riceberry. Food Chemistry.2011;125: 978-985.
15. Frei M, Becker K. Agro-biodiversity insubsistence-oriented farming systems in aPhilippine upland region: Nutritionalconsiderations. Biodiversity andConversion. 2004;13:1591-1610.
16. Ju ZY, Hettiarachchy NS, Path N.Extraction, denaturation and hydrophobicproperties of rice flour proteins. Journal ofFood Science. 2001;66(2):229-232.
17. Inagabire MR, Hilda V. Comparison of thenutrient composition of flour sweet potatovarieties cultivated in Rwanda. AmericanJournal of Food and Nutrition. 2011;13:35-38.
18. Laurine SM, Van Jaarsveld PJ, Faber M,Philpott MF, Labuschagne MT. Trans-β-carotene, selected mineral content andpotential nutritional contrition of 12 sweetpotato varieties. Journal of FoodComposition Analysis. 2012;27:151-159.
19. Oloo BO, Shitandi A, Mahungu S, MalingaJB, Ogata BR. Effects of lactic acid
Mbaeyi-Nwaoha and Ugwu; AFSJ, 4(1): 1-25, 2018; Article no.AFSJ.43115
23
fermentation on the retention of β-carotenecontent in orange-fleshed sweet potato.International Journal of Food Studies.2014;3:13–33.
20. Ellong EN, Billard C, Adenet S.Comparison of physiochemical,organoleptic and nutritional abilities ofeight sweet potato (Ipomoea batatas L)varieties. Food and Nutrition Science.2014;5(2):196.
21. Fetuga G, Tomlins K, Henshaw F, IdowuM. Effect of variety and processing methodon functional properties of traditional sweetpotato flour (‘elubo’) and sensoryacceptability of cooked paste (‘amala’).Food Science and Nutrition. 2014;2(6):682-691.
22. Mwanri A, Kogi-Makanu W, Laswai H.Nutrients and anti-nutrients composition ofraw, cooked and sun-dried sweet potatoleaves. African Journal of Food andAgricultural Nutrition Development. 2011;11(5):5142-5156.
23. Low J, Lynam J, Lemaga B, Crissman C,Bakr I, Thece G. Sweet potato in sub-Sahara Africa. Netherlands; Springer.2009;359-390.
24. Iwe MO, Onyeukwu U, Agiriga AN.Proximate, functional and pastingproperties of FARO44 rice, African yambean and brown cowpea seeds compositeflour. Journal of Food and Agriculture;2016.Available:http:dxdoi.org/10.1080/23311932.2016.1143409
25. Onoja US, Akubor PI, Njoku I, Atama CI,Onyishi GC, Ekeh FN, Eyo JE, Ejere VC.Nutritional composition, functionalproperties and sensory evaluation ofbreads based on blends of ‘orarudi’ (Vignaspecie) and wheat flour. Journal of FoodScience and Nutrition. 2014;9(24):1119–1026.DOI: 10.5897/SRE2014.6104
26. Hagenimana V, Owori C. Process ofproducing sweet potato flour; 2016.Available:http//www. R7036 – sweet potatoflour.pdf(Accessed December 22nd, 2016)
27. Hou G. Oriental noodles. Advances inFood and Nutrition Research. 2011;43:141-193.
28. AOAC. Association of official analyticalchemist, official methods of analysis. 18th
edition, Washington DC, USA; 2010.29. AACC. Approved methods of American
association of cereal chemists (10th
edition). Minnesota: American Associationof Cereal Chemists. St. Paul. 2000;276–280.
30. Onyeka EU, Nwabekwu IO. Phytochemicalprofile of some leafy vegetables driedusing solar dryer. Nigeria Food Journal2007;1:72-82.
31. Philips RD, Chinnan MS, Branch AL, MillerJ, Mcwatters KH. Effects of pre – treatmenton functional and nutritional properties ofcowpea meal. Journal of Food Science.1998;53:805–809.
32. Beuchat LR. Functional and electro-phoretic characteristics of succinylatedpeanut flour protein. Journal of AgriculturalFood Chemistry. 1977;25:258–261.
33. Onwuka GI. Food analysis andinstrumentations theory and practice. 1st
edition. Lagos; Naphtali Prints. 2005;29–73.
34. Schoenlechner R, Drausinger J,Ottenschlaeger V, Jurackova K, BerghoferE. Functional properties of gluten-freepasta produced from amaranth, quinoaand buckwheat. Plant Foods of HumanNutrition. 2010;65(4):339-349.
35. Prescott LM, Harley JP, Kelein OA.Microbial nutrition: Types of media. In:Microbiology, Sixth edition. New York;McGrawill. 2005;93–105.
36. Ihekoronye AI, Ngoddy PO. Integratedfood science and technology for tropics.Macmillian education Ltd, London. 1985;10–77.
37. Steel RG, Torrie JH. Principles andprocedures of statistics: A biometricalapproach. 2nd Edition. New York: McGrawHill; 1980.
38. Khalid I, Elhardallou S, Elkhalifa E.Compostion and functional properties ofcowpea (Vigna unguiculata L. Walp) flourand protein isolates. American Journal ofFood Technology. 2011;7:113–122.
39. Mohammad K, Ziaul H, Sheikh N.Comparison of the proximate composition,total carotenoids and total polyphenolcontent of nine varieties of orange-fleshedsweet potato grown in Bangladesh.Institute of Nutrition and Food Science,University of Dhaka, Dhaka, Bangladesh;2016.
40. Kure OA, Bahago EJ, Daniel EA. Studieson the proximate composition and effect offlours particle size and susceptibility ofbiscuits produced from blends of soybeans
Mbaeyi-Nwaoha and Ugwu; AFSJ, 4(1): 1-25, 2018; Article no.AFSJ.43115
24
and plantain flours. Namado TechnologyScope Journal. 1998;3(2):17-22.
41. Hou G, Kruk M. Asian noodle technology.AIB Research Department, TechnicalBulletin. 2008;20:12.
42. Standard Organization of Nigeria (SON),Nigeria Industrial Standard for PastaProducts. 2014;188–189.
43. Mepba DH, Eboh L, Nwaojigwa SU.Chemical composition, functional andbaking properties of wheat – plantaincomposite flours. African Journal of Foodand Agriculture nutrition and Development.2007;7(1):40–45.
44. Enwere NJ. Foods of plant origin: NsukkaNigeria: Afro-Orbis publications limited.1998;24–106.
45. Matil KF. Functional requirementof proteins for foods. Journal ofAmerican Oil Chemistry Society. 2007;48:477-480.
46. Akubor PI, Badifu GIO. Chemicalcomposition, functional properties andbaking potential of African bread fruitkernel and wheat flour blends. InternationalJournal of Food Science and Technology.2001;39:223-229.
47. Kinsella E. Functional properties ofproteins in foods: Critical review. FoodScience and Nutrition Journal. 1976;1(3):219–280.
48. Taira H. Buckwheat introduction. Ency-clopaedia of Food Technology. 2010;139.
49. ASABE Standards S319.4: Method ofdetermining and expressing fineness offeed materials by sieving. St. Joseph,Michigan: ASABE; 2008.
50. AACC. AACCI method 55-60.01- guidelinefor determination of particle sizedistribution. Approved methods- PhysicalTests of American Association of CerealChemists (11th edition). Minnesota:American Association of Cereal Chemists.St. Paul; 2011.
51. Sonaye SY, Baxi RN. Particle sizemeasurement and analysis of flour.International Journal of EngineeringResearch and Applications (IJERA). 2012;2(3):1839-1842.
52. Patwa A, Malcolm B, Wilson J, Ambrose K.Particle size analysis of two distinctclasses of wheat flour by sieving.Transactions of the ASABE (AmericanSociety of Agricultural and BiologicalEngineers). 2014;57(1):151-159.
53. Kanura D, Noel D, Dilip K. Significance ofthe functional properties of plant products.
Food and Nutrition Bulletin. United NationUniversity. 1996;17(2).
54. Adeleke RO, Odedeji JO. Functionalproperties of wheat and sweet potato flourblends. Pakistan Journal of Nutrition. 1974;9(6):535–538.
55. Garsa AAS. Preparation and qualityevaluation of pasta substituted with hull-less barley. Australian Journal of Basicand Applied Sciences. 2017;11(1):98-106.
56. Akubeze VO. Production and evaluation ofnoodles from blends of wheat/maize andmungbean flour blends. A B.Sc. Project,Department of Food Science andTechnology, University of Nigeria, Nsukka;2015.
57. Hutkin RW. Microbiology and technologyof fermented foods. London; BlackwellPublishing. 2006;12-13
58. Ghasemzadeh R. Processing andassessment of quality characteristic ofcereals – legumes composite weaningfoods. International conference on Bio-science, Biochemistry and Bioinformatics.2011;5:357–359.
59. Umego E. Chemical composition, physicaland sensory properties of fried noodlesprepared from wheat, sweet potato andsoybean flour blends. A B.Sc. Project,Department of Food Science andTechnology, University of Nigeria, Nsukka;2012.
60. Jeckins DJA. Dietary fibre, Lentecarbohydrates and the insulin resistantdiseases. British Journal of Nutrition 2000;83:157-163.
61. David O. Development of instant noodlesfrom maize and cowpea. An M.Sc.dissertation, Kwame Nkrumah Universityof Science and Technology, Kumesi,Ghana; 2015.
62. Saifullah R, Abbas FM, Yeoh SY, AzharME. Utilization of green banana flour as afunctional ingredient in yellow noodle.International Food Research Journal.2009;16:373–379.
63. International commission on micro-biological specifications for foods. ICMSF.Microorganisms in Foods 2, Sampling forMicrobiological Analysis: Principles andSpecific Applications; 1986.
64. Anon. Microbiological guidelines for pastaproducts. Recommendations for foodsafety monitoring in Hong Kong by theexpert panel on microbiological safety offood, Hong Kong. 2016;7.
Mbaeyi-Nwaoha and Ugwu; AFSJ, 4(1): 1-25, 2018; Article no.AFSJ.43115
25
65. Jane J, Kasemsuwan T, Chen JF.Phosphorous in rice and other starches.Cereal Food World. 1996;41:827e–832e.
66. Tewe OO, Ojeniyi FE, Abu OA. Sweetpotato production, utilization and marketingin Nigeria. Department of Social Sciences,International Potato Centre (CIP), Lima,Peru; 2003.
67. Dib A, Wójtowicz A, Benatallah L, ZidouneMN, Mitrusb M, Sujak A. Optimization ofrice-field bean gluten-free pasta improvedby the addition of hydrothermally treatedrice flour. Italian Journal of Food Science.2018;30:226–248.
© 2018 Mbaeyi-Nwaoha and Ugwu; This is an Open Access article distributed under the terms of the Creative CommonsAttribution License (http://creativecommons.org/licenses/by/4.0), which permits unrestricted use, distribution, and reproductionin any medium, provided the original work is properly cited.
Peer-review history:The peer review history for this paper can be accessed here:
http://prh.sdiarticle3.com/review-history/26006