Embed Size (px)
Citation preview

UC San DiegoUC San Diego Electronic Theses and Dissertations
TitleProduction and characterization of recombinant restriction enzyme NgoMIV and its mutant
Permalinkhttps://escholarship.org/uc/item/7mj5x8cn
AuthorRen, Wei
Publication Date2012-01-01 Peer reviewed|Thesis/dissertation
eScholarship.org Powered by the California Digital LibraryUniversity of California

UNIVERSITY OF CALIFORNIA, SAN DIEGO
Production and Characterization of Recombinant Restriction Enzyme NgoMIV and its
Mutant
A Thesis submitted in partial satisfaction of the requirements
for the degree of Master of Science
in
Bioengineering
by
Wei Ren
Committee in charge:
Professor Amy Sung, Chair
Professor Kun Zhang
Professor Chia-ming Uang
2012

©
Wei Ren, 2012
All rights reserved.

iii
This Thesis of Wei Ren is approved and it is acceptable in quality and form for
publication on microfilm and electronically:
________________________________________________________________________
________________________________________________________________________
________________________________________________________________________
_ Chair
University of California, San Diego
2012

iv
TABLE OF CONTENTS
SIGNATURE PAGE ......................................................................................................... iii
TABLE OF CONTENTS ................................................................................................... iv
LIST OF ABBREVIATIONS .......................................................................................... viii
LIST OF FIGURES ........................................................................................................... ix
LIST OF TABLES .............................................................................................................. x
ACKNOWLEDGEMENTS ............................................................................................... xi
ABSTRACT ...................................................................................................................... xii
CHAPTER 1 INTRODUCTION ........................................................................................ 1
1.1 Restriction Enzymes and Restriction Modification Systems ................................. 2
1.1.1 Restriction Modification Systems in Bacteria and Archae ........................... 2
1.1.2 Functions of Restriction Modification Systems in Bacteria and Archae ...... 4
1.1.3 Regulation of Gene Expression in A Type II Restriction Modification
System .......................................................................................................... 4
1.1.4 Type II Restriction Enzymes and Their Applications ................................... 6
1.1.5 General Features of Protein Structures of Type II Restriction Enzymes ...... 8
1.1.6 Current Researchs in Restriction Enzymes ................................................. 9
1.2 Protein Dynamics of Type II Restriction Enzymes .............................................. 10
1.2.1 Protein Functions, Structures and Dynamics .............................................. 10
1.2.2 Structures and Mechanisms of Type II Restriction Enzymes ..................... 12
1.2.3 Structures of NgoMIV ................................................................................ 15
1.2.4 Anisotropic Network Model and its Application in Intrinsic Dynamics
Study of Restriction Enzymes .................................................................. 16
CHAPTER 2 EXPRESSION AND PURIFICATION OF WILD-TYPE NGOMIV
PROTEIN AND ITS MUTANT ............................................................ 18
2.1 Introduction .......................................................................................................... 21
v
2.2 Materials and Methods ......................................................................................... 21
2.2.1 Amplification and Purification of pTrc His2-Topo® TA-M. NgoMIV-
NgoMIV and pTrc His2-Topo® TA-M. NgoMIV-NgoIV-Hb Plasmids .... 21
2.2.1.1 Amplification of pTrc His2-TOPO® TA-M. NgoMIV-NgoMIV and
pTrc His2-TOPO® TA-M. NgoMIV-NgoIV-hb Plasmids ............. 22
2.2.1.2 Purification of pTrc His2-TOPO® TA-M. NgoMIV-NgoMIV and
pTrc His2-TOPO® TA-M. NgoMIV-NgoIV-hb Plasmids ............. 23
2.2.2 Cloning of M. NgoMIV into His-tag Sequence Deleted pBAD-His/b ......... 23
2.2.2.1 Amplification of M. NgoMIV Fragments ......................................... 24
2.2.2.2 Purification of M. NgoMIV Fragments and pBAD-His/b ................. 25
2.2.2.3 Restriction Digestion of pBAD-His/b and M. NgoMIV Fragments . 27
2.2.2.4 Purification and Ligation of Restriction Digested pBAD-His/b and M.
NgoMIV Fragments ...................................................................... 28
2.2.2.5 Transformation of reconstructed pBAD-His/b-methylase .............. 30
2.2.2.6 Amplification, Comfirmation and Sequencing of Reconstructed
pBAD-His/b-methylase.................................................................... 30
2.2.2.7 Deletion of the His-tag sequence in the Reconstructed pBAD-His/b-
methylase Plasmids .......................................................................... 32
2.2.3 Cloning of NgoMIV and NgoIV-hb into pCDF-1b ...................................... 37
2.2.3.1 Amplification of NgoMIV and NgoIV-hb DNA Fragments ............. 37
2.2.3.2 Preparation of pCDF-1b .................................................................... 38
2.2.3.3 Restriction Digestion of pCDF-1b, NgoMIV and NgoIV-hb ............ 38
2.2.3.4 Ligation and Transformation of pCDF-1b-NgoMIV and pCDF-1b-
NgoIV-hb Plasmids .......................................................................... 38
2.2.3.5. Extraction, Confirmation and Sequencing of Constructed pCDF-1b-
NgoMIV and pCDF-1b-NgoIV-hb Plasmids ................................... 39
2.2.4 Expression and Purification of NgoMIV and NgoIV-hb Proteins ............... 41
2.2.4.1 Expression of NgoMIV and NgoIV-hb Proteins ............................... 41
2.2.4.2 Purification of NgoMIV and NgoIV-hb Proteins .............................. 42
2.2.4.3 Quantification of Protein by Bradford Protein Assay ....................... 43

vi
2.2.4.4 Sodium Dodecyl Sulfate Polyacrylamide Gel Electrophoresis (SDS-
PAGE) of NgoMIV and NgoIV-hb Proteins .................................. 44
2.3 Results .................................................................................................................. 45
2.4 Discussion ............................................................................................................ 49
2.5 Supplementary Methods ....................................................................................... 52
2.5.1 Restriction Enzyme Digestion and Ligation ................................................. 52
2.5.2 Preparation of Competence Cells ................................................................. 53
2.5.3 Preparation of SDS-PAGE Gels ................................................................... 54
2.5.4 Media and Solution Preparation ................................................................... 55
CHAPTER 3 DIGESTION TESTS OF NGOMIV AND ITS MUTANT ........................ 56
3.1 Introduction .......................................................................................................... 56
3.2 Materials and Methods ......................................................................................... 58
3.2.1 Amplification and Purification of pET21a-d(+)-Protein A .......................... 58
3.2.2 Preparation of NgoMIV and NgoIV-hb Protein Stock Solution .................. 59
3.2.2.1 Dialysis of NgoMIV and NgoIV-hb Proteins .................................... 60
3.2.2.2 Concentration of NgoMIV and NgoIV-hb Proteins .......................... 61
3.2.2.3 Glycerol Sample Stocks of NgoMIV and NgoIV-hb Proteins ........ 61
3.2.3 Digestion Tests of pET21a-d(+)-Protein A Plasmids ................................... 62
3.2.3.1 Linearization of pET21a-d(+)-Protein A Plasmids ........................... 62
3.2.3.2 The Between-siteDigestion Tests of Linearized Plasmids by NgoMIV
and NgoIV-hb Proteins .................................................................... 62
3.2.3.3 Analysis of digestion results by Image J ........................................... 64
3.3 Results .................................................................................................................. 64
3.4 Discussion ............................................................................................................ 72
CHAPTER 4 HYPOTHESES AND OUTLOOK OF RESTRICTION ENZYME
CATALYTIC MECHANISM ............................................................... 74
4.1 Introduction .......................................................................................................... 74
4.1.1 Anisotropic Elastic Network Model (ANM) ................................................ 74
vii
4.1.2 DNA Deformation by Restriction Enzymes ................................................. 75
4.1.3 Tetrameric Restriction Enzymes .................................................................. 76
4.2 Methods and Materials ......................................................................................... 77
4.2.1 Structure Alignment, PDB File Editing and Standard DNA Structure
Generation .................................................................................................... 77
4.2.2 Anisotropic Elastic Network Model (ANM) ................................................ 77
4.2.3 Crystal Structures of Restriction Enzymes ................................................... 78
4.3 Results and Proposed Mechanisms ...................................................................... 78
4.3.1DNA Deformation and Motion of Catalytic Cores ....................................... 78
4.3.2 Dimer-dimer Motion of NgoMIV................................................................. 84
CHAPTER 5 CONCLUSION........................................................................................... 85
REFERENCES ................................................................................................................. 87
viii
LIST OF ABBREVIATIONS
ANM: Anisotropic Elastic Network Model
bp: Base pair
kDa: Kilo Dalton
PBS: Phosphate buffered saline
PCR: Polymerase chain reaction
RE: Restriction Enzyme
RM: Restriction-Modification
SDS: Sodium dodecyl sulfate
TAE: Tris base, acetic acid and EDTA (Ethylenediaminetetraacetic acid)
TE: Tris base, EDTA
TEMED: N,N,N′,N′-Tetramethylethylenediamine

ix
LIST OF FIGURES
Figure 2.1 Schematic map of NgoMIV and its corresponding methylase ....................... 18
Figure 2.2 Culture bacteria in a shaker at 37°C and 250 rpm ........................................... 22
Figure 2.3 Cloning methylase into pBAD-His/B plasmid. ............................................... 35
Figure 2.4 Cloning of NgoMIV and NgoIV-hb into pCDF-1b plasmid ........................... 39
Figure 2.5 E. coli cells containing two constructed plasmids ........................................... 40
Figure 2.6 SDS-PAGE representation .............................................................................. 44
Figure 2.7 SDS-PAGE of NgoMIV and NgoIV-hb proteins ............................................ 46
Figure 2.8 SDS-PAGE of NgoMIV .................................................................................. 47
Figure 2.9 SDS-PAGE of NgoMIV and NgoIV-hb proteins. ........................................... 48
Figure 3.1 DNA looping by tetrameric restriction enzymes ............................................. 57
Figure 3.2 Plasmid map of pET-21a(+)-protein A ........................................................... 59
Figure 3.3 Between-site distance experiment by EcoRV linearized plasmids ................. 66
Figure 3.4 Between-site distance experiment by EcoRI linearized plasmids ................... 68
Figure 3.5 Between-site distance experiment by PstI linearized plasmids ....................... 70
Figure 4.1 Theoretical base of elastic network model ...................................................... 75
Figure 4.2 Structure alignment of BamHI’s cognate DNA .............................................. 80
Figure 4.3 Structure alignment of EcoRV’s cognate DNA .............................................. 81
Figure 4.4 Structure alignment of NgoMIV’s cognate DNA. .......................................... 82
Figure 4.5 Motion of NgoMIV protein predicted by ANM .............................................. 83
Figure 4.6 Predicted dimer-dimer motion of NgoMIV ..................................................... 84

x
LIST OF TABLES
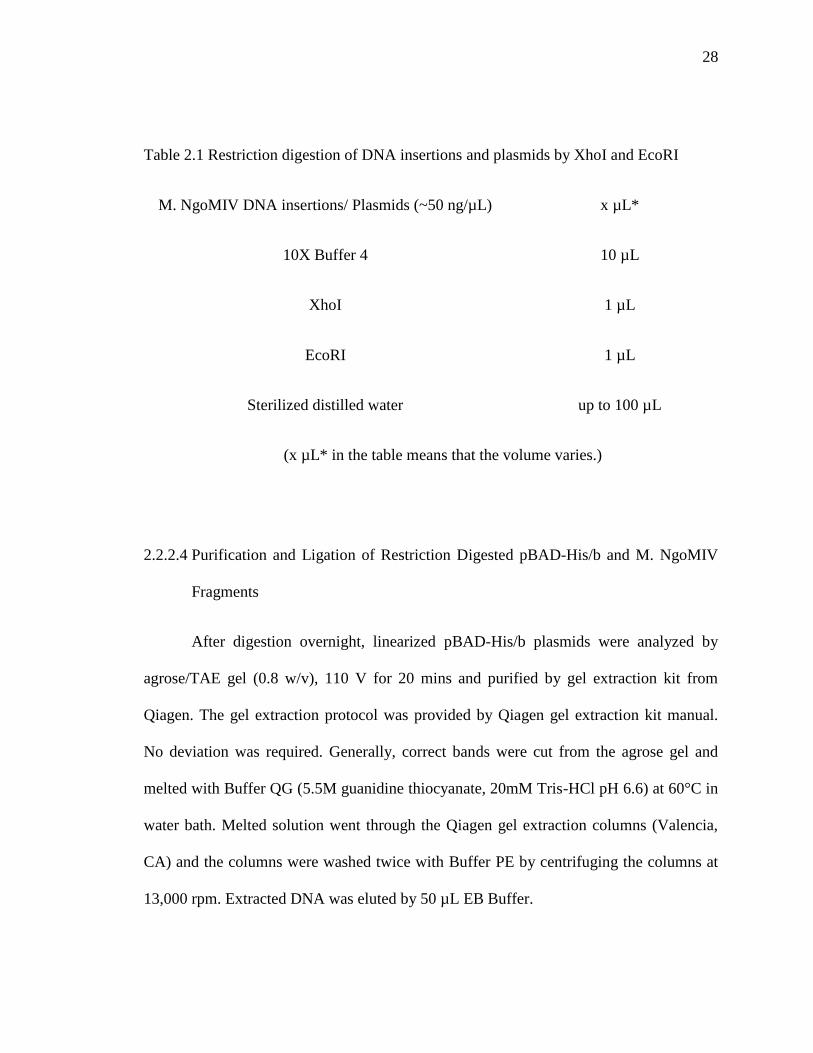
Table 2.1 Restriction digestion of DNA insertions and plasmids by XhoI and EcoRI .... 28
Table 2.2 Ligation of restriction digested M. NgoMIV fragments with pBAD-His/b
plasmids ............................................................................................................ 29
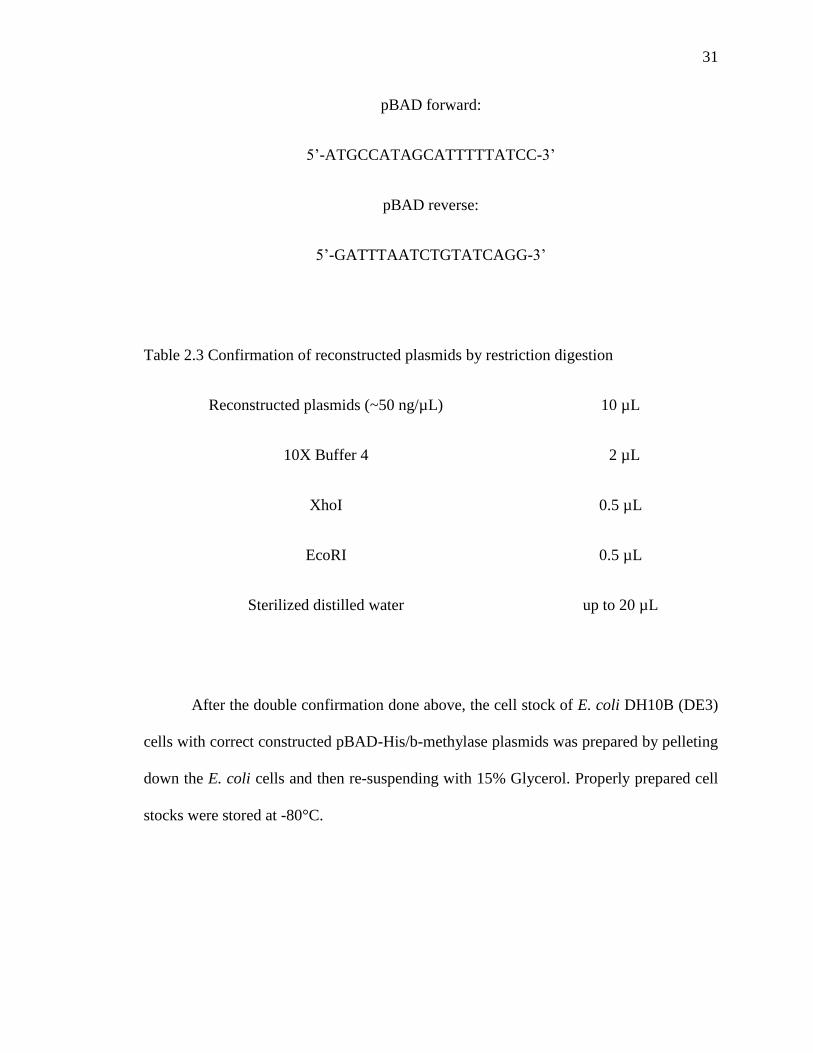
Table 2.3 Confirmation of reconstructed plasmids by restriction digestion ..................... 31
Table 2.4 NcoI digestion of pBAD-methylase ................................................................. 33
Table 2.5 Self-ligation of restriction digested pBAD-methylase plasmids ...................... 33
Table 2.6 Confirmation of reconstructed pBAD-methylase plasmids by restriction
digestion ........................................................................................................... 34
Table 2.7 Recipe of 8% resolving gel and 4% stacking gel for SDS-PAGE .................... 53
Table 3.1 Reaction composition of the between-site digestion reactions. ........................ 64
xi
ACKNOWLEDGEMENTS
Firstly, I would like to express my gratitude to my thesis advisor Dr. Amy Sung.
Her encouraging ideas in science research light up my passion in doing researches. I am
very grateful that Dr. Sung accepted me as her student and for her trust and faith in my
ability. I am fortunate to have had such a dedicated advisor who worked with me
throughout this process, teaching me basic science research techniques as well as
inspiring me to think and solve problems. She is always there to guide my journey of
developing into an independent researcher. Dr. Sung is also a strong proponent of my
career goals and has always fully supported my intention in economics graduate program
application.
I am grateful to thank my committee members Dr. Chia-ming Uang and Dr. Kun
Zhang for their time and insightful comments on my thesis. Also, I would also like to
thank my former lab mate Dr. Albert Chung, who has always given me a lot of
suggestions in experiments. Particularly, I would like to thank Dr. Huiwang Ai and Xinyi
Tang for their graciously sharing their knowledge and experience with me. Finally, I
cannot be more grateful to my parents, without whose love and support; I would not have
been who I am today and been able to complete this fantastic journey.
xii
ABSTRACT OF THE THESIS
Production and Characterization of Recombinant Restriction Enzyme NgoMIV and its
Mutant
by
Wei Ren
Master of Science in Bioengineering
University of California, San Diego, 2012
Professor Amy Sung, Chair
Discovery of restriction enzymes has led to the development of recombinant DNA
technology and restriction enzymes are currently widely used in biotechnology, medicine
and research. Till now, thousands of restriction enzymes have been discovered, purified,
characterized and commercialized. As well as, production of restriction enzymes has
gained a huge profit in biotechnology industry. Although restriction enzymes have been

xiii
applied well in current molecular biology researches, a lot of questions regarding their
binding and catalytic mechanisms haven’t been clearly explained or described by
scientists.
NgoMIV is a tetrameric restriction enzyme, which has been discovered and
purified about 20 years ago from Neisseria gonorrhoeae MS11. It belongs to the type II P
and type II F subtypes. The recognition site of NgoMIV is 5’-G/CCGGC-3’, which is a
palindromic sequence. Also the tetrameric protein has two catalytic cores, which means
that it will bind with two cognate sites and cut them both. NgoAIV, which was
discovered in another strain- FA1090 of Neisseria gonorrhoeae, is different from
NgoMIV protein in two amino-acid residues. A hybrid protein called NgoIV-hb was
designed based on the differences. In the thesis study here, the expression of NgoMIV
and its mutant was conducted. To undercover the preference of the distance between two
recognition sites, digestion tests by applying a plasmid with four recognition sites as
substrate were conducted. At last, several proposed mechanisms of catalysis based on the
protein motion predicted by anisotropic elastic network model and current existing
crystal structures were raised.

1
CHAPTER 1 INTRODUCTION
Restriction enzymes, also called restriction endonucleases, are known as enzymes
that can cut double-strand DNA at specific recognition nucleotide sequences. These
recognition nucleotide sequences are known as recognition sites. Originally they are
existed in bacteria and archaea and considered to be functioning in a defense mechanism
against invading virus. From 1970s, with the discovery, isolation and characterization of
various restriction enzymes, they have led to a huge development in molecular biology
techniques especially the recombinant DNA technology. In nowadays, as the
development of technology, restriction enzymes are involved in more techniques and
researches. Besides the recombinant DNA technology, restriction enzymes can be used to
distinguish gene alleles by specifically recognizing single base changes in DNA.
Similarly, restriction enzymes could also be applied to digest genomics DNA for gene
analysis by Southern blot.
It is generally accepted that restriction enzymes are remarkable tools to biologists
for their investigations in gene organization, function and expression. Beside the wide
applications of restriction enzymes, the structures and catalytic dynamics and
mechanisms of them are hot research topics to chemists and biophycists. As is known to
all, most of the recognition sites of restriction enzymes are palindromic and short, mostly
4 - 8 base-pair (bp) long, and the cleavage of the recognition sites are within the
sequences and at specific points. In addition, a large majority of restriction enzymes are
homo-dimer or homo-tetramer, which facilitates the cleavage of both strands of DNA.
Therefore, restriction enzymes and their cognate binding sequences are considered to be

2
very simple DNA-protein interaction model systems, which could be examined to
elucidate rules of DNA-protein interaction and restriction enzymes’ catalytic dynamics
and mechanisms.
1.1 Restriction Enzymes and Restriction Modification Systems
Restriction enzymes, initially discovered in bacteria are thought to have the
primary function of protecting the organism by cleaving foreign invading DNA, like the
one borne by bacteriophage. In the protection mechanism, which is considered to be the
bacterial immune system, methyltransferases are needed to function together with
restriction enzymes, which would add methyl groups to certain nucleosides of the
restriction enzymes’ recognition sites. Methylated recognition sites would not be digested
by the corresponding restriction enzymes, however, those un-methylated invading DNA
would be cut. The restriction enzymes and their corresponding methylases form the
restriction modification systems (RM system).
1.1.1 Restriction Modification Systems in Bacteria and Archae
Generally, restriction modification systems are divided into five types. They are
type I, type II, type IIS, type III and type IV. Type I system is the most complex. In this
RM system, three polypeptides are consisted. They are restriction (R), modification (M)
and specificity (S). Restriction subunits in these systems require ATP or AdoMet for their
activity and the cleavage always occurs a considerable distance from the recognition site.

3
The S subunits determine the specificity of methylation and restriction. Type II system is
the most common one, which consists of two separately encoded proteins. They are
restriction enzymes and their corresponding methyltransferase, also called methylase.
Generally, there are three kinds of site-specific DNA methylases. They are Dam
methylase, Dcm methylase and EcoKI methylase. Dam methylase would transfer a
methyl group from S-adenosylmethionine to the N6 position of the adenine residues in the
sequence GATC; Dcm methylase methylates the internal cytosine residues in the
sequences CCAGG and CCTGG at the C5 position. Methylase of EcoKI is much less
common than Dam and Dcm methylases, which modifies adenine residues in AACGTGC
and GCACGTT. Restriction enzymes and their corresponding methylase of type II
systems would function together on the recognition sequences. Additionally, different
from type I systems, restriction enzymes from type II systems, also called type II
restriction enzymes, do not need ATP or AdoMet for their activity and the digestion
would happen within the recognition sequences. Type II restriction enzymes only need
magnesium ions (Mg2+
) as a cofactor. Type III systems are as complicated as type I
systems. They are composed of restriction proteins and modification proteins. The
modification proteins only function on their own. The recognition sequences of the
restriction proteins are asymmetric. And the cleavage is occurred approximately 25 bp
away from one side of the sequence. In the cleavage process, ATP is required and
AdoMet could stimulate the cleavage. Type IV RM systems are complicated like type I
and type III systems. Few type IV RM systems have been characterized.

4
1.1.2 Functions of Restriction Modification Systems in Bacteria And Archae
As mentioned above, it is generally believed that restriction modification systems
are serving as bacterial immune systems to protect bacteria from invading DNA.
However, with further researches in restriction modification systems, several other
hypotheses about the existence and maintenance of restriction modification systems were
raised. One of the proposals is the selfish gene hypothesis. The hypothesis states that
restriction modification systems are thought to be one of the simplest forms of life,
similar to virus, transposons and homing endonucleases. This proposal is based on the
observation that several restriction modification systems in bacteria cannot be replaced;
otherwise, it will lead to the cell death. Currently, the hypothesis has been supported by
various gene analyses and experimentation. Another popular hypothesis shows that
restriction modification systems could aid the generation of gene diversity. This notion is
supported by the evidence that restriction modification systems are in association with
genome variation.
1.1.3 Regulation of Gene Expression in A Type II Restriction Modification System
As discussed above, the restriction enzymes would digest un-modified DNA. The
modification is conducted by modification enzymes in the restriction modification
systems. Therefore, in order to protect the bacterial genomic DNA and self-contained
plasmids, the modification enzymes should be expressed ahead of the restriction
enzymes. And they should be in enough amounts to modify the DNA. At later time, the

5
level of modification enzymes’ activity should decrease to prevent the modifications in
invading DNA. As well as, the decreased level of modification enzyme should still have
the ability to maintain the modifications in genomic DNA and self-contained plasmids.
These rules could be a guide for the restriction enzymes production in biotechnology
industry. In this subchapter, the regulation and expression mechanisms of type II
restriction modification systems would be reviewed, which not only make people have a
better understanding of the gene regulations in bacteria, but also give us some hints in
gene construction.
Most restriction modification system genes are located on plasmids, which are
able to spread into cells of the same bacterial species or different species, lacking the
plasmids. If the plasmids could be horizontally transferred into different species, it
means that regulation within the restriction modification systems should be relatively
independent from the host regulatory factors. And the host regulatory factors vary from
different species of bacteria.
To have an insight into the regulation and expression mechanism inside the
restriction modification systems, the comparative analysis of gene arrangements in the
restriction modification systems are necessary. Currently, based on the differences in
gene arrangements, five restriction modification systems were selected as representatives.
They are Cfr9I, SalI, SsoII, EcoRII and PvuII’s restriction modification systems. In Cfr9I
restriction modification systems, modification enzyme is encoded in the upstream of the
restriction enzyme. In SalI, SalIM is encoded in the downstream of SalIR. In SsoII, like
SalI’s system, the restriction enzyme is in the upstream of the modification enzyme, but
6
the SsoIIR gene is encoded in a reverse direction of the SsoIIM gene. EcoRII’s system,
similar to SsoII, restriction enzyme and modification are encoded in the reverse direction.
But both the encode directions are in the opposite direction of SsoII’s. In all the four
systems discussed above, there are only restriction enzyme and modification enzyme
encoded in each system. In PvuII system, there is another additional C-protein encoded,
which would regulate the expression mechanism inside the system. The C-protein is
encoded next to the restriction enzyme and in the same direction with it. NgoMIV’s
restriction modification system is similar to Cfr9I’s. The M.NgoMIV is encoded in the
upstream of the restriction enzyme NgoMIV.
Among all these already-known restriction modification systems, the restriction
enzyme’s expression control mechanisms are generally divided into three types. In the
first type, restriction enzyme’s expression is controlled by the modification enzyme.
Modification enzyme plays a regulatory function by regulating the transcription of
restriction enzymes. It could activate the promoter of the restriction enzyme’s gene.
Secondly, some restriction enzymes’ expression could be regulated by C-protein. The C-
protein, containing the helix-turn-helix domain, displays the similarity with prokaryotic
transcription factors. The last kind of regulation strategy still remains unknown to people.
In this kind of system, there is no regulatory protein involved and there are not
recognition or regulation sites for modification enzyme. NgoMIV’s system belongs to the
third type.
1.1.4 Type II Restriction Enzymes and Their Applications

7
Type II restriction enzymes are restriction enzymes in the simplest and most
prevalent type II restriction modification systems. According to the statistic result
released by REBASE (http://rebase.neb.com/rebase/rebase.html), by 29 October 2004,
among all 3707 restriction enzymes listed in REBASE, 3635 restriction enzymes are type
II. From another putative restriction modification system analysis based on published
genome sequences, it shows that 45% of those putative restriction modification systems
are type II. According to their enzymatic properties, type II restriction enzymes could be
divided into several subtypes- A, B, C, E, P, F, G, H, M, S and T. Type IIP restriction
enzymes are the most common and most useful to recombinant DNA technology. The P
here represents palindromic, which means that they recognize and digest palindromic
sequences. The palindromic sequences are 4-8 nucleotides in length. Type IIP restriction
enzymes proteins are homo-dimer or homo-tetramer, which cut DNA in both strands.
They do not need to use ATP or AdoMet for their activity and they usually require
Magnesium ions (Mg2+) as a cofactor. The digestions in these reactions are happened in
the phosphodiester bonds inside the palindromic sequences. Taking EcoRI (recognition
site G/AATTC) as an example, the digestion happens in the phosphodiester bond
between the first and second nucleotides, which could generate sticky ends. If the
digestion happens in the phosphodiester bond between the third and fourth nucleotides,
like EcoRV (recognition site GAT/ATC), it causes a generation of blunt end. EcoRI and
EcoRV here are best-known and best-studied representatives of type IIP restriction
enzymes and they are also widely applied in labs. The generated sticky ends and blunt
ends can be reconnected with the help of DNA ligase. These techniques are the most
important parts of recombinant DNA technology, like gene cloning. Besides, type IIP
8
restriction enzymes are also useful in DNA analysis. After restriction enzymes digestion,
discrete DNA fragments can be easily separated and detected by Ethidium bromide
stained agrose gels.
Other subtypes have various differences with type IIP restriction enzymes in
recognition sites, digestion sites etc. Type IIA restriction enzymes recognize asymmetric
sequences and cut only one strand of the DNA. Type IIB enzymes cleave both strands of
DNA at both sides of the recognition sequences. Type IIC enzymes have the catalytic
domain and modification domain in one polypeptide. Type IIE enzymes need two copies
of recognition sequences to function. One of the recognition sequences would act as the
allosteric effector; the cleavage would happen in the other recognition sequence. Type IIF
enzymes are similar to type IIE enzymes. They bind to two recognition sites and but cut
both. NgoMIV focused in this research is a type IIF enzyme. Type IIG enzymes are
almost identical to type IIC enzymes, except that they could be stimulated by AdoMet.
Type IIH enzymes have similar type II enzymatic behavior, but their genetic organization
resembles type I RM systems. Type IIM enzymes recognize and digest specific
methylated sequences at fixed sites. Type IIS enzymes cleave at least one strand of the
target DNA outside of the recognition sequence. Type IIT enzymes are heterodimeric
proteins. These subtype restriction enzymes are less useful in recombinant DNA
technology, comparing with type IIP restriction enzymes, but they still have wide
applications in genomic DNA analysis.
1.1.5 General Features of Protein Structures of Type II Restriction Enzymes

9
By 2005, crystal structures of 23 nucleases of the PD…D/ExK superfamily are
accessible in Protein Data Bank (PDB). 16 of them are type II restriction enzymes, most
of them are type IIP enzymes. The other 7 are other nucleases, which are belonging to
this family too. A comparison of these crystal structures illustrates that all these enzymes
share a similar core. The catalytic active site is located in the core. In addition, the core
also serves as an important structure stabilization factor. Generally, the core is composed
of a five-stranded mixed beta-sheet flanked by alpha helices. The catalytic residues of the
PD…D/ExK motif are located in either the second or the third beta-sheet. The fifth beta-
sheet and the fourth beta-sheet are parallel or antiparallel. As mentioned earlier, EcoRI
and EcoRV are most famous and most well-studied type II restriction enzyme
representatives. Not only they are the most common restriction enzymes and they could
act differently to generate one sticky end and one blunt end, but also the topology of
secondary structure elements and the arrangement of the subunits of EcoRI and EcoRV
are totally different. Therefore, in accordance with the differences in structure
arrangements, researchers divide the structure-information-existed 23 restriction enzymes
into two categories- EcoRI branch and EcoRV branch. EcoRI branch enzymes usually
produce sticky ends. They approach the DNA from the major groove and recognize the
DNA mainly via an alpha-helix and a loop. EcoRV branch enzymes, like EcoRV,
produce blunt ends. They approach the DNA from the minor groove and recognize the
DNA by using a beta-strand and a beta-like turn. The NgoMIV focused in this study
belongs to the EcoRI branch enzymes; more structure features of NgoMIV would be
discussed in the following part. For a long time, it seems that all type IIP restriction

10
enzymes belong to the PD…D/ExK superfamily. However, recent bioinformatics
evidences prove that a few other type IIP enzymes are out of the superfamily.
1.1.6 Current Researches in Restriction Enzymes
Restriction enzymes have made a great contribution to the development of
biotechnology. However, the researches in restriction enzymes have never been
discontinued. As mentioned above, by 2004, thousands of restriction enzymes have been
characterized from various bacteria and archea; whereas, people’s researches in
discovering new restriction enzymes have never been terminated. By applying
computational methods, researchers nowadays are tending to discover putative restriction
modification systems from those already sequenced genomic DNA, which is also
stimulated by the novel high-throughput sequencing techniques. In the other way,
researchers are designing and producing artificial restriction enzymes by applying protein
engineering techniques. TAL nucleases (TALNs), composed of TAL effectors and Fokl
DNA-cleavage domain, has recently been expressed and published by researchers in Iowa
state university in 2010.
1.2 Protein Dynamics of Type II Restriction Enzymes
1.2.1 Protein Functions, Structures And Dynamics
Proteins, macromolecules composed by 20 kinds of natural amino acids in cells,
are involved in all cell activities. Each kind of protein inside the cells has its unique
function. Due to the differences in composition, different proteins are also in different
three-dimensional shapes, i.e. protein structures. Uniqueness in each protein’s structure

11
and function stimulates us to have a better understanding in the connections between
them. Protein structures, often described by X-ray crystallography data, are powerful
sources for protein structure researches. Besides these static data, molecular dynamic
simulations are also powerful tools for exploration of the conformational energy
landscape of these macromolecules. In the next several paragraphs, general researches in
protein structure and dynamics would be reviewed.
Proteins composed of one or more peptides fold into unique 3-dimensional
structures. The protein structure of protein folding naturally is called native
conformation. Generally, protein structures could be divided into four kinds. They are
primary structure, secondary structure, tertiary structure and quaternary structure. The
primary structure is the amino acid sequence. Secondary structures are regularly
repeating local structures stabilized by hydrogen bonds. Most common structures are
alpha-helix, beta sheet and turns. Tertiary structure is the overall shape of a single
protein, which represents the spatial relationship of the secondary structures to one
another. Quaternary structure is the assembly of several protein molecules or polypeptide
chains. Common experimental methods of protein structure determination are X-ray
crystallography and NMR spectroscopy. They both produce information at atomic
resolution. Besides, there are several other experimental methods providing structure
information of proteins. For example, Circular dichroism is the technique for determining
internal beta sheet/helical composition of proteins. Cyoelectron microscopy could be
used to produce lower-resolution structural information about very large proteins. In
Protein Data Bank (PDB), a repository for 3-D structural information of macromolecules,

12
most proteins’ structure (65703/74331 till March 20th of 2012) information is based on
X-ray diffraction data. Beside the experimental methods, computational methods came
into play a crucial role in determining proteins’ structures. Protein structure prediction is
the prediction of a protein’s 3-D structure based on their primary structure, i.e. the
protein’s amino acid sequence.
Definitely the functional proteins would not act in just one conformation- the
conformation people see from the X-ray crystallography. Physicists see protein as soft
materials that sample a large ensemble of conformation around the average structure as a
result of thermal energy. In order to describe proteins’ dynamics, a multidimensional
energy landscape, defining the relative probabilities of the conformation states and the
energy barriers between them. Also, to understand the proteins’ motion, the fourth
dimension, time, must be added to the snapshots of proteins frozen in crystal structures.
Currently, it is not possible to watch those atoms’ moving activity experimentally.
Therefore, theoretical biophysics studies came to be a powerful approach to
understanding the connections between proteins’ functions and their dynamics.
1.2.2 Structures and Mechanisms of Type II Restriction Enzymes
As mentioned before, the action process of type II restriction enzymes can be
divided into three parts. Firstly, type II restriction enzymes would target DNA sequence
and search for the recognition sites. Secondly, type II restriction enzymes would
recognize the recognition sites. Finally, restriction enzymes would conduct the catalysis
13
at specific cutting sites. For most kinds of type II restriction enzymes, their recognition
sites and cutting sites are overlapped.
From the structural information of free enzymes, the DNA binding sites of these
apo-enzymes seem to be not opened enough to bind DNA. Till now, this question has not
been solved experimentally. Currently there are two popular hypotheses addressing this
phenomenon. Some people think that the restriction enzymes might oscillate between the
closed and open states. As well as, the open state induced by association of enzyme with
DNA could also be reasonable explanation. After binding with DNA, restriction enzymes
need to search and target their cognate recognition sites. Three probable mechanisms for
the efficiency of target site location by DNA-binding proteins are raised and popularly
agreed. They are sliding, jumping or hopping and intersegment transfer. Sliding implies
that the protein will follow the pitch of the double helix and move along with it until it
finds the cognate site. At the whole process, the protein stays bound to the DNA. But the
binding modes of the protein with the cognate DNA and the non-cognate DNA are
different, which could be clearly examined by existed X-ray crystallography structures. It
is widely agreed that, when sliding, protein will bind in the non-specific mode. Once
targeting the cognate sequence, it will transfer to the specific binding mode. Sliding
model is a one-dimensional diffusion model. The model seems to have a conflict with the
high efficiency of restriction enzymes, due to that sliding, the one dimensional
movement, is considered to be efficient. Therefore, the jumping or hopping model based
on three-dimensional diffusion is raised. During the jumping or hopping, non-specific
binding mode is given up. And the water layer characteristic for the free DNA and the

14
free protein is reformed. In jumping or hopping, proteins’ motion do not follow the pitch
of the double helix. And it is possible that specific sites could be overlooked due to the
step size. Small DNA binding ligands could not be obstacles to the proteins. The third
proposed searching mechanism is only possible for proteins that have two DNA binding
sites. For this kind of protein, it can still bind to DNA, even though one binding site is
released. Binding DNA with two binding sites would contribute to loops in DNA. It is
believed that intersegment transfer is a particular efficient way to cover large distances.
Similar to the jumping or hopping model, intersegment transfer cannot be inhibited by
those small DNA binding ligands too. In the recognition process, conformational
adaptations of protein and DNA with water and counter-ion release at the protein-DNA
interface is consisted, which results in a favorable ΔH contribution from direct protein-
DNA recognition interactions and a favorable ΔS contribution from water and counter-
ion release. With inspections of those available crystal structures of apoenzymes and
enzymes with cognate DNA and non-cognate DNA, several general structural aspects of
the recognition process have been showed. Firstly, most enzymes producing blunt ends or
sticky ends with 3’ overhangs would approach DNA from the minor groove. Enzymes
producing sticky ends with 5’ overhangs would approach DNA from the major groove.
Secondly, specific DNA binding would be accompanied with more or less DNA
distortions. The distortion would bring functional groups of the DNA into position
required for recognition and catalysis. As well as, a highly cooperative hydrogen bond
network is a major characteristic feature of the specific protein-DNA complex. Although
recognition has been uncovered with the resources of crystal structures, the coupling
between recognition and catalysis is still least known. How those residues involved in

15
direct and indirect readout communicate with catalytic centers and trigger conformation
changes, which are required for the initiation of phosphodiester bond cleavage is an
interesting and crucial question, for better understanding of the coupling. From
heterodimer experiments of EcoRV, it is found that there is a cross-talk between amino
acid residues involved in recognition in one subunit with the catalytic centers of both
subunits. It means that substitution of one amino acid residue involved in recognition in
one subunit would contribute to the low-efficient cleavage.
The catalysis process, i.e. the hydrolysis of phosphodiester bond, follows the SN-
2 type mechanism. This mechanism generally consists of three steps- attacking
nucleophile, pentavalent transition state and 3’ hydroxyl leaving group.
As mentioned above, restriction enzymes need metal ions to cut their
corresponding cognate sequences. Based on this phenomenon and existed crystallography
structures, several ion related mechanisms were raised. A single metal ion at the active
site could stabilize the developing negative charge during the nucleophilic attack. Two
divalent metal ions (usually the magnesium ions Mg2+
) are used to accelerate the
phosphodiester bond hydrolysis reaction. The three metal ion mechanism has not been
approved by crystal structures. According to the existed crystal structure of EcoRV, it is
believe that three metal ions might be necessary for the catalytic site of EcoRV.
1.2.3 Structures of NgoMIV
16
Until now, there are two crystal structures of NgoMIV available in PDB. In one
structure (PDBID: 1FIU, submitted in 2000), it shows us the tetramer binds to two
cognate DNA sequences and the two cognate DNA sequences are cut in the correct sites.
In another structure (PDBID: 4ABT, submitted in 2012), the structure is similar to the
previous one. The only difference is that two cognate DNA sequences in this structure are
not digested at corresponding sites.
1FIU and 4ABT are still the only two NgoMIV’s co-crystal structures of
tetrameric restriction enzyme-DNA complexes, which are meaningful to understand the
protein dynamics of tetrameric restriction enzymes. The cognate recognition site of
NgoMIV is 5’G/CCGGC3’ (The cleavage happens between 5’ G and the second C
nucleotides.) The cognate sequence used in the crystal structure is
5’TGCG/CCGGCGC3’. They retain the B-type conformation and have an enclosed
angle between their helical axes of 600.
1.2.4 Anisotropic Network Model and its Application in Intrinsic Dynamics Study of
Restriction Enzymes
The anisotropic network model, also called ANM, is a powerful tool for exploring
the relation between function and dynamics for many proteins. In the elastic network
model, which treats biological macromolecule as an elastic mass and spring network,
alpha-carbon atoms are applied with a step function for the dependence of the force
constants on the inter-particle distance. Cut-off distances between all interactions are the
only predetermined parameters in the model. It is agreed that information about the

17
orientation of each interaction regarding the global coordinates system is deemed to be
within the force constant matrix (H), which allows prediction of anisotropic motions.
In previous computational study, 11 different structures of six different type II
restriction enzymes, BamHI, EcoRV, EcoRI, PvuII, BsoBI and NgoMIV, in apo and
DNA-bound forms, are applied with the anisotropic elastic network model for functional
dynamics study. The main focus of the study is to find the common features of
conformational dynamics, which would lead to a better understanding in the recognition
and DNA cleavage mechanism of restriction enzymes. As well as, possible
communication pathways between distant catalytic sites of the restriction enzymes have
been suggested based on modeling results.

18
CHAPTER 2 EXPRESSION & PURIFICATION OF WILD-TYPE NGOMIV
PROTEIN AND ITS MUTANT
2.1 Introduction
In order to uncover the catalytic mechanism of the tetrameric restriction enzyme
NgoMIV, NgoMIV’s DNA sequence was cloned and its protein was expressed and
purified in this chapter. NgoMIV protein was firstly isolated from Neisseria gonorrhoeae
MS11 in 1990s. The length of the NgoMIV DNA sequence is 861 bp and the length of
the NgoMIV protein peptide is 286 amino acid residues. The DNA sequence of the
methylase of NgoMIV, also called M. NgoMIV, is 939 bp long and its protein consists of
312 amino acid residues. The open reading frame (ORF) of NgoMIV is downstream
neighbor to its corresponding methyltransferase’s ORF in the genome of Neisseria
gonorrhoeae MS11.
Figure 2.1 Schematic map of NgoMIV and its corresponding methylase M. NgoMIV’s
ORFs in the genome of Neisseria gonorrhoeae MS11.

19
NgoMIV and its methylase - M.NgoMIV DNA fragments were amplified together
by polymerase Chain Reaction (PCR) from the whole genome of Neisseria gonorrhoeae
MS11, which was obtained from American Type Culture Collection (ATCC). Its ATCC
number is 49759. Amplified DNA fragments with NgoMIV and M. NgoMIV were
cloned into pTrc His2-TOPO® TA expression vectors (Invitrogen, Carlsbad, CA) with
deletion of the stop codon TGA of M. NgoMIV DNA sequence and transformed into E.
coli BL21 (DE3) One-shot® system (Invitrogen, Carlsbad, CA). Another restriction
enzyme NgoAIV discovered in a different strain Neisseria gonorrhoeae FA1090 is the
same as NgoMIV in their recognition and cutting sites, proteins sequences of their
corresponding methylases and the arrangement of ORFs in the original genomes, except
for the differences of two amino acid residues in their restriction enzymes protein
sequences. In NgoMIV, the No. 272 amino acid residue is lysine and the No. 286 is
valine. In NgoAIV, the No.272 amino acid residue is isoleucine and the No.286 is
phenylalanine. In order to understand whether these two amino acid residues would lead
to a big difference between NgoMIV and NgoAIV, a hybrid protein NgoIV-hb was
designed by site-directed mutating NgoMIV’s No. 286 amino acid residue valine to
phenylalanine and keeping No. 272 amino acid residue as lysine. Therefore, another
constructed plasmid containing M. NgoMIV and NgoIV-hb sequences was constructed
by the same method and transformed into the same type E. coli competent cells.
Constructed plasmids were sequenced and sequence data of NgoIV-hb, NgoMIV and M.
NgoMIV was collected. The cloning part was done by Senior Undergraduate Research
Project of Bioengineering of Sung’s lab at 2009.

20
As mentioned in chapter 1, methyltransferase functioning as transferring a methyl
group to the specific nucleosides protects the host genome DNA from the digestion of
related restriction enzyme. In our study, the methylase of NgoMIV is a Dcm methylase. It
modifies the first cytosine residue of the recognition site 5’GCCGGC3’ at the C5 position.
Thus, in our experiments, in order to express the NgoMIV and NgoIV-hb protein, M.
NgoMIV protein needs to be co-expressed together with NgoMIV and NgoIV-hb.
Moreover, based on current research results of RM systems, M. NgoMIV protein needs to
be expressed ahead of NgoMIV and NgoIV-hb in the time scale. Additionally, from our
experiments, we determine that the amount of M. NgoMIV does not seem to be a
significant factor for the protection. In this chapter, based on the characteristics of RM
systems, two plasmids- pBAD-His/b (Invitrogen, Carlsbad, CA) and pCDF-1b ( Novagen,
Darmstadt, Germany), which have different antibiotics resistant genes and promoters
were chosen. In pBAD-His/b plasmid, it has an araBAD promoter and the ampicillin
resistant gene. The pCDF-1b has a T7 promoter and a SmR coding sequence, which is the
streptomycin/spectinomycin antibiotic resistance gene.
According to our aim- highly expressing the NgoMIV and NgoIV-hb proteins, we
decided to insert the NgoMIV and NgoIV-hb DNA sequences into pCDF-1b, for the
reason that the T7 promoter would lead to a higher expression quantity comparing with
the araBAD promoter. M. NgoMIV DNA fragments were inserted into pBAD-His/b.
Constructed pBAD-His/b-methylase plasmids were transformed into E. coli DH10B
(DE3) competent cells (Invitrogen, Carlsbad, CA) firstly before the transformation of
constructed pCDF-1b-NgoMIV plasmids. Besides, E.Coli BL21 (DE3) cells (Invitrogen,
21
Carlsbad, CA) were also applied as the expression host for NgoMIV and NgoIV-hb
proteins to target the over-expression.
In both of the constructed pBAD-His/b-methylase and pCDF-1b-NgoMIV
plamids, they have the his-Tag encoded sequences for protein purification. However,
restriction enzyme NgoMIV and NgoIV-hb proteins are the only proteins that we need to
get here. So a pair of primers was designed to delete the his-tag encoding sequence of the
constructed pBAD-His/b-methylase. The his-tag deleted pBAD-methylase plasmids were
transformed into E. coli DH10B (DE3) and E. coli BL21 (DE3) competent cells for
protein expression and purification. The pCDF-1b plasmids, which were used in cloning
and expression of NgoMIV and NgoIV-hb proteins, were also used to confirm the
biological activity of NgoMIV and NgoIV-hb. In the pCDF-1b plasmid, there is only one
NgoMIV recognistion site. The pCDF-1b plasmids were digested by NgoMIV and
NgoIV-hb proteins.
2.2 Materials and Methods
2.2.1 Amplification and Purification of pTrc His2-Topo® TA-M. NgoMIV-NgoMIV
and pTrc His2-Topo® TA-M. NgoMIV-NgoIV-Hb Plasmids
As mentioned in 1.1 Introduction, at 2009, undergraduate researchers in our lab
had already cloned the M. NgoMIV, NgoMIV and NgoIV-hb sequences into pTrcHis2-
TOPO® TA expression vectors. And the constructed plasmids pTrc His2-TOPO® TA-M.
NgoMIV-NgoMIV and pTrc His2-TOPO® TA-M. NgoMIV-NgoIV-hb were

22
transformed into E. coli BL21 (DE3) One-shot® system. The constructed plasmids would
be used as PCR templates to amplify M. NgoMIV, NgoMIV and NgoIV-hb fragments for
future experiments. In this part, the plasmids constructed were amplified and extracted by
Qiagen Mini-Prep Kit (Qiagen, Valencia, CA).
2.2.1.1 Amplification of pTrc His2-TOPO® TA-M. NgoMIV-NgoMIV and pTrc His2-
TOPO® TA-M. NgoMIV-NgoIV-hb Plasmids
E. coli BL21 (DE3) cells containing constructed plasmids were cultured overnight
to amplify the plasmids. Briefly, cell stocks were scratched by sterile tips and the tips
were thrown into individual sterile culture tubes containing 5 mL LB broth with 100
µg/ml ampicillin. These tubes were shaken at 37°C, 250 rpm overnight (8-10hrs).
Figure 2.2 Culture bacteria in a shaker at 37°C and 250 rpm

23
2.2.1.2 Purification of pTrc His2-TOPO® TA-M. NgoMIV-NgoMIV and pTrc His2-
TOPO® TA-M. NgoMIV-NgoIV-hb Plasmids
E. coli cells were harvested by centrifuging each 5 mL bacterial culture at 13,000
rpm for 3 mins. The pellets were resuspended in 250 µL of Solution I (50 mM Tris pH
8.0, 10 mM EDTA, 100 ug/ml RNaseA) by vortexing. 250 µL Solution II (0.2 M NaOH,
1% SDS) was added into tubes and then the tubes were inverted several times. Then 350
µL Solution III (2 M Acetic Acid, 3M KOAc, pH 5.5) was added into the tube. Similar to
the last step, tubes were inverted several times. After inversion, the solution was
centrifuged at a high speed 13,000 rpm for 10 mins. Supernatant was transferred to go
through the Qiagen Mini-prep columns. Columns were washed twice with 750 µL Buffer
PE (10 mM Tris-HCl, pH 7.5 and 80% ethanol) and dried. At last, plasmids were eluted
with 50 µL EB Buffer (10 mM Tris-Cl, pH 8.5). The protocol for this phase of the
experiment was provided by the Qiagen Mini-prep Kit. No deviation from the provided
protocol was required. The concentration of the plasmids was determined by Thermo
Nanodrop 2000 spectrophotometer (Thermal, Waltham, MA).
2.2.2 Cloning of M. NgoMIV into His-tag Sequence Deleted pBAD-His/b
M. NgoMIV protein was expressed in pBAD-methylase. The pBAD-methylase
plasmids were constructed by inserting the M. NgoMIV fragments and deleting the
original existed his-tag coding sequence by PCR.

24
2.2.2.1 Amplification of M. NgoMIV Fragments
M. NgoMIV DNA fragments were amplified by PCR using the extracted pTrc
His2-TOPO® TA-M. NgoMIV-NgoMIV plamids as template and a pair of primers with
XhoI and EcoRI restriction sites added. As well as, as mentioned above, the stop codon
TGA of M. NgoMIV fragment was deleted, when the TOPO® TA-M. NgoMIV-NgoMIV
was constructed. In the pair of primers, a stronger stop codon TAG was added. It is
important to note that the original PCR template does not contain the restriction sites and
spacer sequences in the primers. The two primers with XhoI and EcoRI restriction
enzymes sites were designed and synthesized by Integrated DNA Technologies (IDT, San
Diego, CA).
M. NgoMIV Forward:
5’-CCGATCACTCGAGAATGCAATTCACATC-3’
M. NgoMIV Reverse:
5’-GACTCGGAATTCCTAATTTTCCTTTTTT-3’
Since that those amplified fragments would be inserted into pBAD-His/b for
expression, the iProofTM High-Fidelity DNA Polymerase kit (Bio-Rad, Hercules, CA)
was chosen. Additionally, according to the manual of iProof™ High-Fidelity DNA
Polymerase kit, the high-fidelity DNA polymerase needs to be heat-activated at 98°C,
which differs from Taq DNA polymerase. The heat-activation temperature of Taq DNA
polymerase is 94°C. Moreover, the extension rate of the high-fidelity DNA polymerase
was about 1kb per min. Based on the sequence length of M. NgoMIV, the extension time

25
in cycle iv was adjusted to 1min10s. The following listed is the cycle program of
amplifying M. NgoMIV fragments.
i. Initial Denaturation 98°C (30s)
ii. Denaturation 98 °C (10s)
iii. Annealing 58 °C (10s)
iv. Extension 72 °C (1min10s)
v. Cycle the above ii, iii and iv steps for 30 cycles
vi. Final Extension 72 °C (5mins)
vii. Keep the tubes at 10 °C
PCR products were analyzed by Agrose Gel electrophoresis. 0.9% (w/v) agrose
gel/1X TAE Buffer (0.04 M Tris Base, 10 mM EDTA and Acetic Acid, pH 8.0) was
casted and applied in the experiment. Loading samples were pre-treated with 10X DNA
loading buffer (NEB, Ipswich, MA). After the samples loaded into the wells, a high
voltage (80V) was used for 30 mins. The gel was stained by 1X TAE buffer with 0.005%
ethidium bromide and viewed under UV light, after the former step. In our experiments,
10 µL PCR products were loaded for analysis.
2.2.2.2 Purification of M. NgoMIV Fragments and pBAD-His/b
If the PCR products have only one fragment of the correct size, then we could use
Qiagen PCR clean-up kit (Qiagen, Valencia, CA) to purify the amplified insertion. If the
PCR products have other fragments other than the correct fragment, gel extraction is
26
needed for PCR products purification, which can be done with Qiagen gel extraction kit
provided (Qiagen, Valencia, CA).
In the experiment, the Qiagen PCR clean-up kit (Qiagen, Valencia, CA) was
applied to purify the PCR products. 5 volumes of Buffer PB (5 M Gu-HCl, 30%
isopropanol) were added to 1 volume of the PCR products. The solution was gently
mixed by pipetting it for several times. Buffer PB contains pH indicator I, which would
check the pH of the mixture. If the mixture is yellow, the same color as the Buffer PB, it
means that the mixture is ready to go through the Qiagen PCR quick-spin columns
(Qiagen, Valencia, CA). If the color of the mixture turns to orange or violet, 10 μL of 3
M sodium acetate, pH 5.0 was needed to adjust the pH. In the next step, mixture of
correct pH went through the Qiagen PCR quick-spin columns by centrifuging them at
13,000 rpm for 1 min. The columns were washed twice with Buffer PE and dried. Then
PCR products were eluted with 88 μL EB Buffer. Concentration of the elution was
analyzed by Thermo Nanodrop 2000 spectrophotometer.
The pBAD-His/b was kindly provided by the former graduate student Dr. Albert
Chung in Sung lab. The pBAD-His/b plasmid was transformed into self-prepared E. coli
DH10B competent cells by heat shock method. The preparation protocol of E. coli
DH10B competent cells would be provided in the supplementary materials of chapter 2.
50 μL DH10B competent cells were thawed on ice. 1 ng of pBAD-His/b plasmids
were mixed with the competent cells and incubated on ice for 30 mins. Then the 1.5 mL
microfuge tube with the plasmids and competent cells was transferred to 42°C water bath
for 1 min. After the heat shock for 1 min, the mixture was chilled on ice for 5 mins. 500

27
μL sterile fresh LB Broth was added to the tube and mixed gently. Next, in the recovery
process, competent cells were shaken at 37°C, 250 rpm for at least 45 mins. Recovered
competent cells were spread onto fresh LB agar plate with 100 µg/ml ampicillin and
incubated in 37°C incubator overnight.
Single colonies were picked from the LB agar plate and cultured in 5 mL LB
Broth with 100 µg/ml ampicillin at 37°C, 250 rpm overnight. The plasmid extraction was
following the protocol mentioned in 1.2.1.2.
2.2.2.3 Restriction Digestion of pBAD-His/b and M. NgoMIV Fragments
Amplified insertions were digested by restriction enzymes for ligation with
digested pBAD-His/b. From the primer design part, it shows that two restriction enzyme
sites- XhoI and EcoRI sites were added to the insertion. Therefore, XhoI and EcoRI
restriction enzymes from NEB would be applied for digestion. Each restriction enzyme
from NEB has its corresponding buffer to achieve the highest enzymatic activity.
According to the NEB catalog, Buffer 4 is the optimized buffer for both XhoI and EcoRI
restriction enzymes. At the same time, circular pBAD-His/b plasmids were also digested
by the same two restriction enzymes. The digestion time in the experiment is overnight
about 12hrs, although in accordance with NEB catalog, in 1hr restriction enzymes could
digest this amount of DNA completely. In addition, from protocols in NEB catalog, it
shows that restriction enzymes from NEB have a rather high stability in long time
digestion. The following is the restriction enzyme digestion protocol.
28
Table 2.1 Restriction digestion of DNA insertions and plasmids by XhoI and EcoRI
M. NgoMIV DNA insertions/ Plasmids (~50 ng/µL) x µL*
10X Buffer 4 10 µL
XhoI 1 µL
EcoRI 1 µL
Sterilized distilled water up to 100 µL
(x µL* in the table means that the volume varies.)
2.2.2.4 Purification and Ligation of Restriction Digested pBAD-His/b and M. NgoMIV
Fragments
After digestion overnight, linearized pBAD-His/b plasmids were analyzed by
agrose/TAE gel (0.8 w/v), 110 V for 20 mins and purified by gel extraction kit from
Qiagen. The gel extraction protocol was provided by Qiagen gel extraction kit manual.
No deviation was required. Generally, correct bands were cut from the agrose gel and
melted with Buffer QG (5.5M guanidine thiocyanate, 20mM Tris-HCl pH 6.6) at 60°C in
water bath. Melted solution went through the Qiagen gel extraction columns (Valencia,
CA) and the columns were washed twice with Buffer PE by centrifuging the columns at
13,000 rpm. Extracted DNA was eluted by 50 µL EB Buffer.

29
Digested M. NgoMIV DNA insertions were purified by PCR clean up kit from
Qiagen, which followed the protocol mentioned in 1.2.2.2. Purified M. NgoMIV DNA
insertions and purified linearized pBAD-His/b were ligated together using T4 ligase
(New England BioLab, Ipswich, MA) at room temperature for 2 hrs. The protocol used
for ligation phase was based upon the recommended protocol for cohesive end.
Table 2.2 Ligation of restriction digested M. NgoMIV fragments with pBAD-His/b
plasmids
M. NgoMIV DNA insertions : pBAD-His/b 3 : 1 in molar ratio
T4 10X Ligase Buffer 1 µL
T4 Ligase 1 µL
Sterilized distilled deionized water up to 10 µL
2.2.2.5 Transformation of reconstructed pBAD-His/b-methylase
Followed by Ligating linearized plasmids and M. NgoMIV insertions at room
temperature for 1hr is transformation. In our experiment, self-prepared E. coli DH10B
(DE3) competent cells were chosen, due to their higher competency than BL21 (DE3)
competent cells. Later, BL21 (DE3) E. coli competent cells were also transformed with
the constructed plasmids for the reason that BL21 (DE3) E. coli’s higher growth rate will
increase the expressed protein’s yield. Competent cells were prepared based on the

30
protocol existed in our lab, which would be provided in the supplementary materials.
Transformation was conducted based on general heat-shock transformation protocol
mentioned above. 1 ng ligated plasmids solution was mixed with competent cells. After
incubating on ice for 30 mins, the cell mixture was incubated at 42°C for 1 min and then
recovered by adding 500 µL LB Broth and shaking at 37°C and 250 rpm for 1 hr. 0.1 to
0.2 mL recovered transformed E. coli cells would be spread onto pre-warmed LB agar
plate with 100 µg/ml corresponding antibiotics and grow overnight. Here ampicillin was
used based on the antibiotics resistant characteristic of pBAD-His/b.
2.2.2.6 Amplification, Confirmation and Sequencing of Reconstructed pBAD-His/b-
methylase
Single colonies grown on the 100 µg/ml ampicillin contained LB agar plate were
picked by sterilized 20 µL pipette tips and thrown into 5 mL LB broth with 100 µg/ml
ampicillin. These samples were incubated and shaken overnight at 250 rpm and 37°C.
Plasmids samples were extracted from overnight bacterial cultures by Qiagen Mini-Prep
Kit following mini-prep protocols mentioned above. Extracted plasmids samples were
digested again by XhoI and EcoRI to confirm whether the M. NgoMIV DNA insertion
was inserted into the plasmid or not. Plasmids with proper insertions were sent for
sequencing (Eton Bio, San Diego, CA) to confirm the sequence of the M. NgoMIV DNA
insertion. The pBAD forward and pBAD reverse primers provided by Eton Bio were used
for sequencing.
31
pBAD forward:
5’-ATGCCATAGCATTTTTATCC-3’
pBAD reverse:
5’-GATTTAATCTGTATCAGG-3’
Table 2.3 Confirmation of reconstructed plasmids by restriction digestion
Reconstructed plasmids (~50 ng/µL) 10 µL
10X Buffer 4 2 µL
XhoI 0.5 µL
EcoRI 0.5 µL
Sterilized distilled water up to 20 µL
After the double confirmation done above, the cell stock of E. coli DH10B (DE3)
cells with correct constructed pBAD-His/b-methylase plasmids was prepared by pelleting
down the E. coli cells and then re-suspending with 15% Glycerol. Properly prepared cell
stocks were stored at -80°C.

32
2.2.2.7 Deletion of the His-tag Sequence in the Reconstructed pBAD-His/b-methylase
Plasmids
As mentioned in the experiment design, pBAD-His/b and pCDF-1b were used as
M. NgoMIV, NgoMIV and NgoIV-hb protein expression. The affinity tags in both
plasmids are his-tag, which would lead to a difficulty in purifying NgoMIV and NgoIV-
hb proteins. In the subchapter, his-tag coding sequence in pBAD-His/b-methylase was
removed by amplifying the constructed plasmids with two designed primers, which
neglects the whole sequence between NcoI and XhoI restriction sites. In order to have
accurately amplified PCR products, we also used the iProofTM High-Fidelity DNA
Polymerase kit. Primers applied for deleting the his-tag coding sequence were listed as
following.
pBAD-dele forward:
5’-TAACAGGAGGAATTAACCATGGGGCAATTCACATCATTA-3’
pBAD-dele reverse:
5’-GAGTCATGCCATGGTTAATTCCTCCTGTTA-3’
The cycle program of amplifying pBAD-His/b-methylase fragments and deleting
the his-tag coding sequence in applied Biosystems® 2720 thermal cycler was almost the
same as the thermal cycle program for the amplification of M. NgoMIV fragments,
except that the extension time was adjusted to 4min45s, according to the length of
pBAD-His/b-methylase. Amplified and his-tag deleted pBAD-methylase plasmids were
purified by Qiagen gel extraction kit, which was following the same protocol provided in
33
1.2.2.5. Purified pBAD-methylase plasmids were eluted with 89 µL EB Buffer and
digested by 1 µL NcoI restriction enzymes overnight.
Table 2.4 NcoI digestion of pBAD-methylase
Reconstructed plasmids (~50 ng/µL) 89 µL
10X Buffer 4 10 µL
NcoI 1 µL
Overnight digested pBAD-methylase plasmids were purified by Qiagen PCR
clean up kit with the protocol provided before. After clean-up, digested pBAD-methylase
plasmids were ligated by T4 ligase (NEB, MA).
Table 2.5 Self-ligation of restriction digested pBAD-methylase plasmids
pBAD-methylase 5 µL
T4 10X Ligase Buffer 1 µL
T4 Ligase 1 µL
Sterilized distilled deionized water up to 10 µL

34
The ligated pBAD-methylase plasmids were transformed to self-prepared E. coli
DH10B (DE3) competent cells by heat-shock method. Recovered E. coli DH10B (DE3)
competent cells were spread to the pre-warmed LB agar plates with 100 µg/ml ampicillin.
Single colonies were picked and cultured overnight at 37°C, 250 rpm for mini-prep.
Extracted plasmids were confirmed by restriction digestion of NcoI and EcoRI and
sequencing by the pBAD primers provided above. E. coli DH10B (DE3) cells with
correct plasmids were pelleted down, resuspended with 15% sterile glycerol solution and
stored at -80°C. Also, pBAD-methylase plasmids were transformed into self-prepared E.
coli BL21 (DE3) competent cells for further application.
Table 2.6 Confirmation of reconstructed pBAD-methylase plasmids by restriction
digestion
Reconstructed pBAD-methylase plasmids (~50 ng/µL) 10 µL
10X Buffer 4 2 µL
NcoI 0.5 µL
EcoRI 0.5 µL
Sterilized distilled water up to 20 µL
35
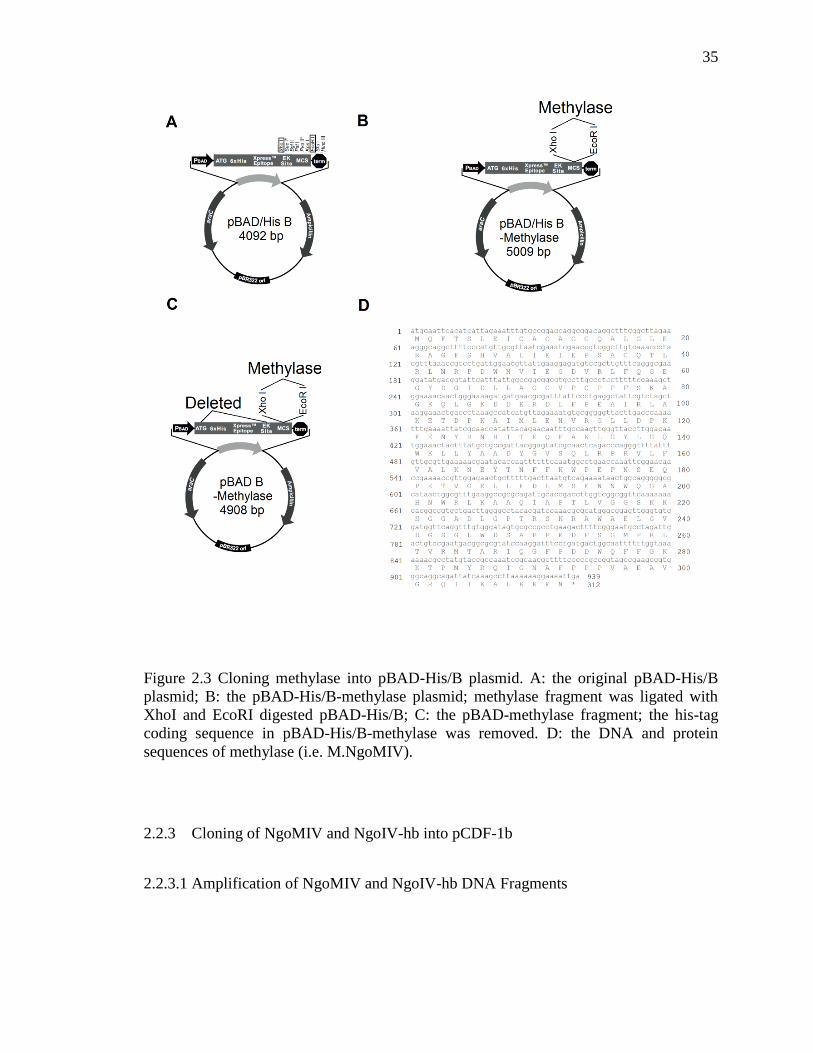
Figure 2.3 Cloning methylase into pBAD-His/B plasmid. A: the original pBAD-His/B
plasmid; B: the pBAD-His/B-methylase plasmid; methylase fragment was ligated with
XhoI and EcoRI digested pBAD-His/B; C: the pBAD-methylase fragment; the his-tag
coding sequence in pBAD-His/B-methylase was removed. D: the DNA and protein
sequences of methylase (i.e. M.NgoMIV).
2.2.3 Cloning of NgoMIV and NgoIV-hb into pCDF-1b
2.2.3.1 Amplification of NgoMIV and NgoIV-hb DNA Fragments
36
NgoMIV and NgoIV-hb DNA fragments were amplified by PCR using the
extracted pTrc His2-TOPO® TA-M. NgoMIV-NgoMIV plamids and pTrc His2-TOPO®
TA-M. NgoMIV-NgoIV-hb plamids as template and three single oligonucleotides
primers, Ngo forward, NgoMIV reverse and NgoIV-hb reverse, with XhoI and BamHI
restriction sites added. NgoMIV and NgoIV-hb fragments shared the same forward
primer, while the reverse primers of them were different with each other in one
nucleotide. The original PCR template does not contain the restriction sites and spacer
sequences in the primers. The three primers were designed and synthesized by IDT.
Ngo Forward:
5’- CGTGCAGGATCCCATGAATCCGCTTTTTACC -3’
NgoMIV Reverse:
5’- TGCACGCTCGAGTTAAACTGCCAAATCTAAGGG -3’
NgoIV-hb Reverse:
5’- TGCACGCTCGAGTTAAAATGCCAAATCTAAGGG -3’
The NgoMIV and NgoIV-hb fragments would be inserted into pCDF-1b for
expression. We still use the iProofTM High-Fidelity DNA Polymerase kit for PCR
amplification. The cycle program for fragments amplification was the same as the one for
M. NgoMIV. PCR products were analyzed by 0.9% (w/v) Agrose Gel electrophoresis and
purified by Qiagen Gel Extraction Kit.
2.2.3.2 Preparation of pCDF-1b
37
The pCDF-1b plasmids were kindly provided by former graduate researcher Dr.
Albert Chung in Sung lab. The plasmids were amplified by transformed to self-prepared
E. coli DH10B (DE3) competent cells and culturing those single colonies at 37°C, 250
rpm overnight. All protocols used here were following those provided before. Plasmids
were extracted from these overnight cell cultures by Qiagen Mini-prep kit. Purified
plasmids were eluted in EB Buffer and determined the concentration by nanodrop.
2.2.3.3 Restriction Digestion of pCDF-1b, NgoMIV and NgoIV-hb
Purified pCDF-1b plasmids, NgoMIV and NgoIV-hb were digested by XhoI and
BamHI at 37°C overnight. Digested plasmids and insertion fragments were purified by
Qiagen PCR clean up kit.
2.2.3.4 Ligation and Transformation of pCDF-1b-NgoMIV and pCDF-1b-NgoIV-hb
Plasmids
NgoMIV and NgoIV-hb fragments were ligated with pCDF-1b plasmids by T4
ligase for 2hrs at room temperature. E. coli DH10B (DE3) cells and E.Coli BL21 (DE3)
cells both with former constructed pBAD-methylase were prepared as competent cells for
transformation of the ligation solution here. Transformation was conducted by the heat
shock method mentioned above. As mentioned above, the antibiotics selectable marker in
former constructed pBAD-methylase is ampicillin, while the antibiotic resistance gene
existed in pCDF-1b is streptomycin/spectinomycin antibiotic resistance (SmR). We chose

38
spectinomycin for the selection. The difference of antibiotics selectable markers in two
plasmids could help us to pick the correct colonies with two plasmids inside. Therefore,
transformed competent cells were spread onto LB agar plates with 100 µg/ml ampicillin
and 100 µg/ml spectinomycin.
2.2.3.5 Extraction, Confirmation and Sequencing of Constructed pCDF-1b-NgoMIV
and pCDF-1b-NgoIV-hb Plasmids
Single colonies were picked and cultured overnight for plasmids extraction.
Extracted plasmids, containing pBAD-methylase and pCDF-1b-NgoMIV or pCDF-1b-
NgoIV-hb, were confirmed by restriction digestion of BamHI and XhoI. The XhoI site in
pBAD-methylase has been revmoved and there is no BamHI site in pBAD-methylase.
Therefore, digested plasmids samples from correct colonies should have a fragment of
about 900bp. After confirmation, plasmids samples were sent for sequencing using the T7
primers provided by Eton Bio.
T7 promoter:
5’-AATACGACTCACTATAGG-3’
T7 terminator:
5’-GCTAGTTATTGCTCAGCGG-3’
39
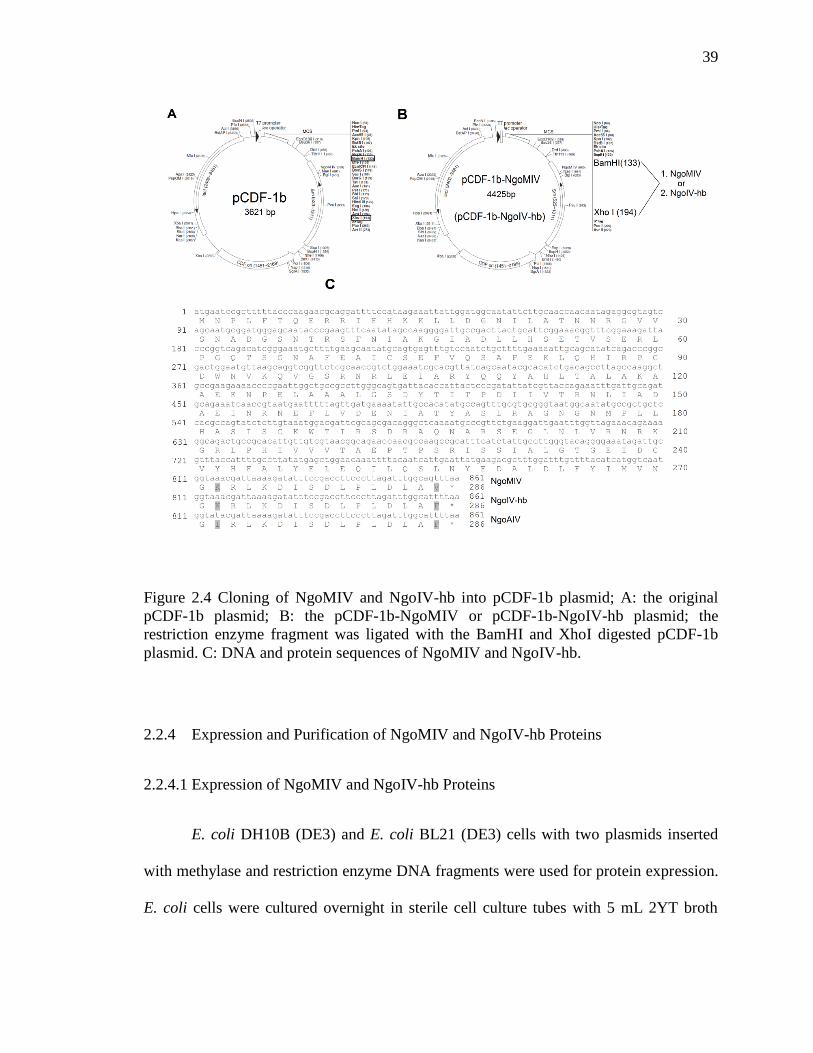
Figure 2.4 Cloning of NgoMIV and NgoIV-hb into pCDF-1b plasmid; A: the original
pCDF-1b plasmid; B: the pCDF-1b-NgoMIV or pCDF-1b-NgoIV-hb plasmid; the
restriction enzyme fragment was ligated with the BamHI and XhoI digested pCDF-1b
plasmid. C: DNA and protein sequences of NgoMIV and NgoIV-hb.
2.2.4 Expression and Purification of NgoMIV and NgoIV-hb Proteins
2.2.4.1 Expression of NgoMIV and NgoIV-hb Proteins
E. coli DH10B (DE3) and E. coli BL21 (DE3) cells with two plasmids inserted
with methylase and restriction enzyme DNA fragments were used for protein expression.
E. coli cells were cultured overnight in sterile cell culture tubes with 5 mL 2YT broth

40
mixed with100 µg/ml ampicillin, 100 µg/ml spectinomycin and 0.02% L-arabinose. L-
arabinose is the inducer of araBAD promoter, which would induce the expression of
methylase. 2 mL overnight cell culture was seeded into 200 mL 2YT broth with 100
µg/ml ampicillin, 100 µg/ml spectinomycin and 0.02% L-arabinose. The 200 mL cell
culture was shaken at 37°C, 250 rpm for about 3 hrs until the OD reached 0.7-1. For
BL21 (DE3) cells, it takes about 3 hrs to reach the OD; for DH10B (DE3), it takes about
3.5-4 hrs. Due to the existence of T7 promoter and lac operator in pCDF-1b, Isopropyl-β-
D-thio-galactoside (IPTG) was applied for restriction enzyme protein expression. 1 mM
(final concentration) IPTG was added into the cell culture and the flasks were shaken
overnight at 37°C, 250 rpm.
Figure 2.5 E. coli cells containing two constructed plasmids for NgoMIV or NgoIV-hb
proteins expression
2.2.4.2 Purification of NgoMIV and NgoIV-hb Proteins
E. coli cell
pBAD-methylase
pCDF-1b-NgoMIV
or pCDF-1b-NgoIV-hb
41
E. coli cells were pelleted down by centrifuging cell culture at 4,000 rpm for 15
mins. Cell pellets were resuspended in 20 mL 1X Phosphate buffered saline buffer (PBS
Buffer, 130 mM NaCl, 7 mM Na2HPO4, 3 mM NaH2PO4·H2O, pH7.4) and sonicated
on ice for 10 mins with cycles of 20 s bursts and 20 s cooling. The lysate was centrifuged
at 8,000 rpm for 15 mins at 4°C to pellet down the debris. Supernatant went through his-
tag purification columns, which were filled with Ni-NTA purification beads (Invitrogen,
Carlsbad, CA). After washing with washing buffer (30 mM imidazole, 300 mM NaCl, 50
mM Tris-HCl, pH8) for several times (at least four times), wild-type NgoMIV protein
and mutated NgoMIV protein were eluted by 2 mL elution buffer (300 mM imidazole, 50
mM NaCl, 50 mM Tris-HCl, pH8).
2.2.4.3 Quantification of Protein by Bradford Protein Assay
Since imidazole absorbs UV radiation at 280 nm, 6xHis tagged proteins in the
elution buffer can often not be quantified directly by absorbance at 280 nm. The
absorbance of imidazole can vary depending on its source and purity, but elution buffer
containing 250 mM imidazole usually has an A280 of 0.2–0.4. To quantitate proteins in
eluents containing imidazole, we use the Bradford protein assay, which is based on the
ability of Coomassie Brilliant Blue R250 to form strong complexes with proteins. This
assay is more tolerant of higher imidazole concentrations than the Lowry and the biuret
assay, which are more sensitive to imidazole because they involve the reduction of
copper.

42
In the experiment, we use the dye reagent from Sigma (Sigma, St Louis, MO).
Standard curve for concentration determination was generated by bovine serum albumin
(BSA) protein standard solution of 6 different concentrations ranging from 0-1.0 mg/mL.
10 µL BSA standard solution and diluted NgoMIV and NgoIV-hb solution were added
into separate wells in the 96-well plate. 190 µL dye reagent was added into the used wells
and mixed with protein samples by shaking for 30mins at room temperature. The
absorbance at 598nm of these well-mixed samples was determined by BioTek® multi-
mode microplate reader (BioTek, Winooski, VT). Then the standard curve generated by
BSA standard solution as well as the absorbance of our protein samples were plotted. By
comparing the standard curve and the absorbance of protein samples, the concentrations
of protein samples could be determined.
2.2.4.4 Sodium Dodecyl Sulfate Polyacrylamide Gel Electrophoresis (SDS-PAGE) of
NgoMIV and NgoIV-hb Proteins
In order to determine the molecular weights of NgoMIV and NgoIV-hb proteins,
SDS-PAGE, which could separate proteins according to their electrophoretic mobility,
was used here. The polypeptide chain binding with SDS imparts an even distribution of
charge per unit mass, which would result in a fractionation by approximate size. The
SDS-PAGE gel usually consists of two small pieces of gels, one piece of stacking gel and
one piece of resolving gel. The concentration of acrylamide (Sigma, St Louis, MO) in the
stacking gel used in the experiment was 4%; the concentration of acrylamide in the
resolving gel was 8%. The concentration of the resolving gel was determined according

43
to the calculated protein molecular weights, which were based on NgoMIV and NgoIV-
hb’s DNA sequences. In SDS-PAGE, gels and buffers (running buffer and sample
loading buffer) contain sodium dodecyl sulfate (SDS), which could denature proteins
from their native biological structures. The differences in biological structures could have
an influence on the electrophoretic mobility. Therefore, SDS-PAGE is a common and
useful tool for molecular biologists to determine the molecular size of proteins. As
mentioned above, NgoMIV restriction enzyme is a tetrameric protein. In the experiment,
in order to determine the quaternary structure of NgoMIV and NgoIV-hb, proteins
samples were prepared in two methods. Usually, for SDS-PAGE, protein samples were
mixed in 5X SDS sample loading buffer (250 mM Tris-HCl pH 6.8, 10% SDS, 30%
Glycerol, 0.02% Bromophenol blue, 0.5M fresh dithiothreitol or 5% beta-
mercaptoethanol). Dithiothreitol or beta-mercaptoethanol were added before the sample
preparation. Protein samples mixed with SDS-loading buffer were boiled in 80°C for
about 10mins. In the experiment, samples were also prepared in another method beside
the normal sample preparation protocol. Protein samples mixed with 5X SDS sample
loading buffer without DTT or beta-mercaptoethanol were not boiled. Samples prepared
in both two methods were loaded into SDS-PAGE gel prepared above and run under
140V for about 1hr 30mins. After the polyacrylamide electrophoresis, the gel was stained
with Coomassie Blue Stain Buffer (10% (v/v) acetic acid, 0.006% (w/v) Coomassie Blue
Dye, 90% double-distilled water) for 2hrs and then de-stained by Isopropanol Fixing
Solution (10% (v/v) acetic acid, 25% (v/v) isopropanol, 65% double-distilled water)
overnight.

44
Figure 2.6 SDS-PAGE representation
2.3 Results
In this chapter, the pBAD-methylase, pCDF-1b-NgoMIV and pCDF-1b-NgoIV-
hb plasmids were constructed. They were transformed into E. coli BL21 (DE3) and E.
coli DH10B (DE3) cells for protein expression. Expressed proteins were purified by his-
tag affinity columns. Purified proteins’ concentrations were quantified by Bradford
protein assay and the molecular weights of the proteins were determined by SDS-PAGE.
The concentration of NgoMIV protein solution is 2.87 mg/mL; the concentration of
NgoIV-hb solution is 2.45 mg/mL. Meaningful SDS-PAGE gel results were provided in
the following.
As is known to all, DTT or beta-mercaptoethanol could reduce the disulfide bonds
between two cysteine amino acid residues. According to the topology map of NgoMIV,
among all three cysteine amino acid residues, none of them are in or related to the dimer-
45
dimer interface. It was proved in an experiment that DTT was less influential to NgoMIV
and NgoIV-hb proteins’ quaternary structures in comparison with the boiling.
NgoIV-hb proteins were purified and prepared in the same fashion for SDS-
PAGE. From these SDS-PAGE gels, they shows that, under the condition of non-boiling
and non-DTT, protein fragments between 80 and 58 kDa were observed in both NgoMIV
and NgoIV-hb proteins, which were considered to be the dimers of NgoMIV and NgoIV-
hb.

46
Figure 2.7 SDS-PAGE of NgoMIV and NgoIV-hb proteins. 1: Purified NgoMIV proteins
prepared by normal SDS-PAGE sample preparation protocol. 2: Purified NgoIV-hb
proteins prepared by normal SDS-PAGE sample preparation protocol. 3: Purified
NgoMIV proteins prepared with non-DTT sample loading buffer and no boiling.4:
Purified NgoIV-hb proteins prepared with non-DTT sample loading buffer and no boiling.
1 2 3 4 wt wt* hb hb*
Dimer
Methylase Monomer
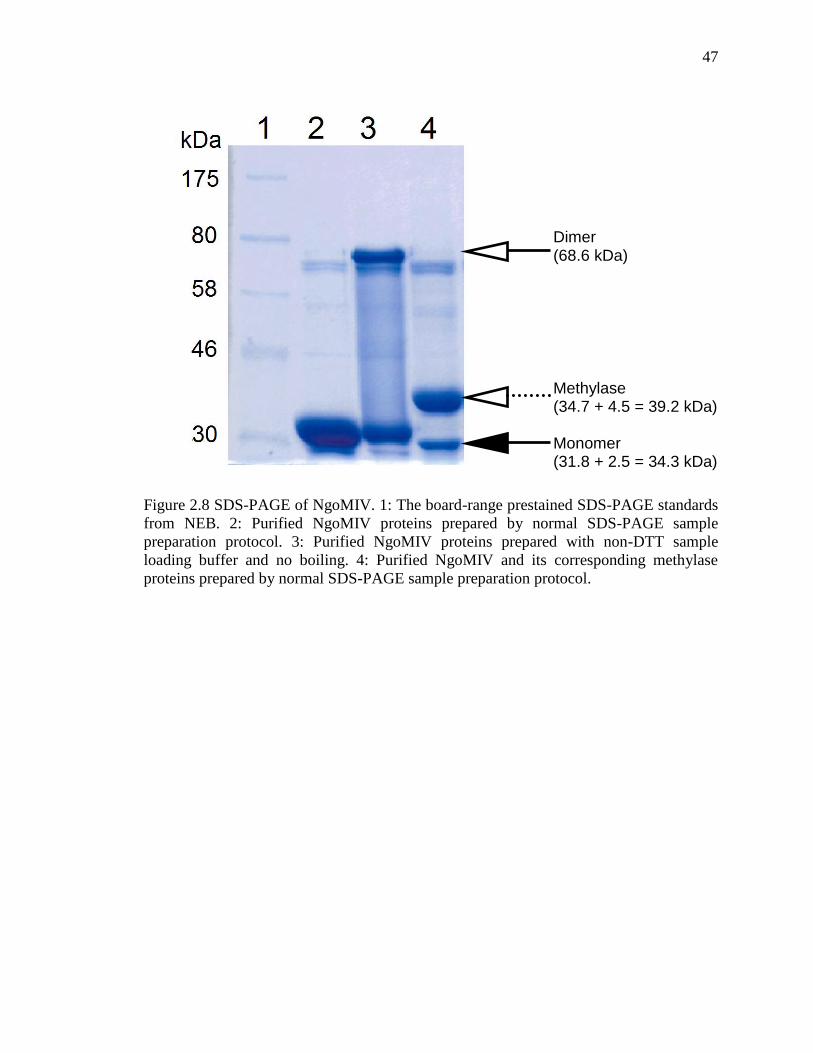
47
Figure 2.8 SDS-PAGE of NgoMIV. 1: The board-range prestained SDS-PAGE standards
from NEB. 2: Purified NgoMIV proteins prepared by normal SDS-PAGE sample
preparation protocol. 3: Purified NgoMIV proteins prepared with non-DTT sample
loading buffer and no boiling. 4: Purified NgoMIV and its corresponding methylase
proteins prepared by normal SDS-PAGE sample preparation protocol.
Dimer (68.6 kDa)
Methylase (34.7 + 4.5 = 39.2 kDa) Monomer (31.8 + 2.5 = 34.3 kDa)
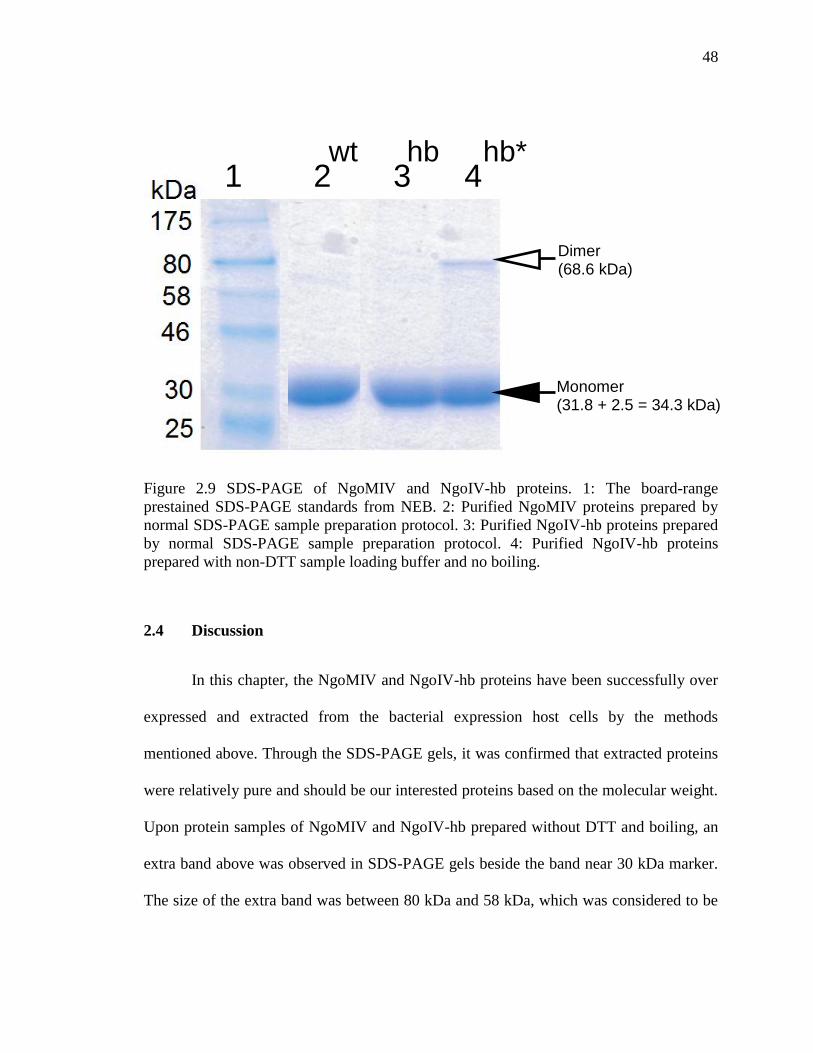
48
Figure 2.9 SDS-PAGE of NgoMIV and NgoIV-hb proteins. 1: The board-range
prestained SDS-PAGE standards from NEB. 2: Purified NgoMIV proteins prepared by
normal SDS-PAGE sample preparation protocol. 3: Purified NgoIV-hb proteins prepared
by normal SDS-PAGE sample preparation protocol. 4: Purified NgoIV-hb proteins
prepared with non-DTT sample loading buffer and no boiling.
2.4 Discussion
In this chapter, the NgoMIV and NgoIV-hb proteins have been successfully over
expressed and extracted from the bacterial expression host cells by the methods
mentioned above. Through the SDS-PAGE gels, it was confirmed that extracted proteins
were relatively pure and should be our interested proteins based on the molecular weight.
Upon protein samples of NgoMIV and NgoIV-hb prepared without DTT and boiling, an
extra band above was observed in SDS-PAGE gels beside the band near 30 kDa marker.
The size of the extra band was between 80 kDa and 58 kDa, which was considered to be
1 2 3 4
Dimer (68.6 kDa)
Monomer (31.8 + 2.5 = 34.3 kDa)
wt hb hb*

49
a dimer. The discovery of the dimer band in gel is really interesting and crucial, because
the quaternary structures of apo-NgoMIV and apo-NgoIV-hb proteins would give us a
hint about the DNA binding process of tetrameric restriction enzyme proteins, at least for
NgoMIV and NgoIV-hb proteins. Currently, for the DNA binding process of tetrameric
protein, there are two widely-accepted hypotheses, which would be discussed further in
next chapters. Firstly, tetrameric restriction enzymes are considered to be tetramers, even
without the binding of cognate DNA fragments. In another fashion, tetrameric proteins
are in dimer structures when they are searching and binding cognate DNA sequences.
Once binding with DNA sequences, dimers would contour with each other to form
tetramers. However, from the observed extra band, it is hard to conclude which binding
mechanism that the NgoMIV and NgoIV-hb restriction enzymes are following. Because,
beside the denature condition brought by heat and DTT, SDS is a detergent, which would
also cause the damage to proteins’ structures. Also it is hard to distinguish NgoMIV
proteins with NgoIV-hb proteins from current experimental observations. It is known to
all that physical forces are stabilizing the protein structures. According to the NgoMIV
structure (PDB: 1FIU) provided in protein data bank (PDB) and the topology map of
NgoMIV protein, it is obvious that the interaction interface between monomer and
monomer in the vertical direction has a larger area than that in the horizontal direction.
Larger interface might contribute to more physical forces involved, which means that the
interface might be more stable under certain denature condition and be easier to be
formed. In this way, the protein should be formed tetramers after expression. As well as,
the observed extra band could be a dimer protein, which is formed by two monomers
vertically.
50
Stability of multimeric proteins is still a challenging problem to scientists,
because of the intrinsic difficulty in handling the mathematical model for the folded
multimer-unfolded monomer equilibrium. An analysis method based on effective ΔG and
effective m-value, which is the dependence of the effective stability on denaturant
concentration of its monomeric unit, was introduced in 2004. Beside the effective energy
formation generated in the paper, a key thought of studying the stability of multimeric
protein under different concentrations of denaturant was introduced. In future
experiments, NgoMIV and NgoIV-hb proteins could be examined by the method
provided and an experiment of running protein samples under different concentrations of
SDS (in both running buffer and gel) might be interesting and indicative for protein
unfolding study.
Currently few restriction enzyme expression methods are published. In this
chapter, the restriction enzyme expression by two plasmids was introduced, which could
consider to be a general idea for restriction enzyme expression. The method was based on
rules raised according to characteristics of restriction-modification systems. Before the
success expression, several other methods had been tried. In 2009, undergraduate
researchers cloned the DNA of restriction enzyme together with the methylase into the
same expression plasmid. Protein was not expressed in this method. The reason could be
that the regulation of restriction-modification system was not recognized in E. coli
system. Also, interesting, it was found that transforming two plasmids together or
inducing restriction enzyme and methylase at the same time would not work. Restriction
enzymes brought an evolution to molecular biology and are still playing important roles

51
in various studies. Therefore, production of restriction enzymes is continuing to be red-
hot in biotechnology industry. We introduced NgoIV-hb protein here, studied the
difference between them and wish it could be a substitute for NgoMIV. Also the general
expression method of restriction enzymes, personally, could be useful to those labs,
which are doing scientific studies involved with restriction enzymes. Moreover, proteins
expressed in this chapter would be applied for dynamic studies further.
2.5 Supplementary Methods
2.5.1 Restriction Enzyme Digestion and Ligation
In 2.2 materials and methods, restriction digestion and ligations experiments in
the construction of pBAD-methylase were listed in details. While, in the construction of
pCDF-1b-NgoMIV and pCDF-1b-NgoIV-hb plasmids, digestion and ligation
experiments were not explained. Because all digestion and ligation experiments here
were following the general technical reference provided by NEB. The digestion reaction
volume could be adjusted based on different experiments, which could vary from 10-100
µL. The amount of DNA for digestion is up to 10 µg. Enzyme reaction buffers were
picked based on the catalog provided. All reaction buffers provided by NEB are 10X,
which means that they are needed to be dilute 10 times for reaction. Usually, 10-20 units
(~1.5 µL) restriction enzymes were added for reaction. And to make sure the 10X over-
digestion, the unit number needed of restriction enzymes could be calculated based on the
amount of DNA. The reaction completes well in 5hrs at 37°C. While, for plasmid

52
digestion, it is suggested to digest overnight at 37°C to minimize the background. For
analytical purpose, the reaction volume could be 10 µL, which includes 1 µL 10X
reaction buffer, 300-500 ng DNA, 2 units (~ 0.1 µL) of each restriction enzymes and
double distilled water. The reaction could be done in 1hr at 37°C.
For quick cloning purpose, the ligation could be done in a 10 µL reaction,
containing 1 µL 10X ligase buffer, 3 µL digested and purified plasmid, 5 µL digested and
purified insert and 1 µL ligase. Usually, the insert and the plasmid DNA concentrations
should be measured so that 3:1 molar ratio is used.
2.5.2 Preparation of Competent Cells
5 mL E. coli cell culture was grown overnight in fresh sterile LB media. Dilute
the overnight culture at least 100X into fresh prepared sterile 2YT media and grow the
diluted culture to an OD600 of 0.4-0.6. Split the culture into 50 mL centrifuge tubes and
incubate on ice for at least 15mins. Centrifuge the culture at 3000rom and 4°C. Cell
pellets were carefully re-suspended by chilled TSS buffer (PEG 8000, 1M MgCl2,
DMSO) and spun down twice. After washed twice by TSS buffer, pellets were re-
suspended by small volume TSS buffer to achieve high cell density. 100 µL aliquots were
added into each pre-chilled centrifuge tubes and stored at -80°C immediately. In all the
preparation process, it is important to notice that all steps after cell culture should be
conducted under cold condition i.e. 4°C.

53
2.5.3 Preparation of SDS-PAGE Gels
The recipe of preparing resolving gel and stacking gel was provided in following
table. The 10% ammonium persulfate (APS) solution is better to be prepared freshly
before use. And the 10% APS, which serves as an inhibitor for gel formation as well as
TEMED, which would stabilize free radicals and improves polymerization, should be
added at last, when you are ready to make gels.
Table 2.7 Recipe of 8% resolving gel and 4% stacking gel for SDS-PAGE
Reagents 8% Resolving gel (mL) 4% Stacking gel (mL)
Water 4.74 2.65
30% Acrylamide 2.66 0.67
Tris Buffer* 2.5 0.65
20% SDS 0.05 0.02
10% APS 0.2 0.125
TEMED 0.0082 0.006
Total Volume 10 4
Tris Buffer* for resolving gel is 1M Tris base, pH 8.8; Tris Buffer* for stacking gel is
1M Tris Base, pH 6.8.
54
2.5.4 Media and Solution Preparation
All media and solution mentioned in this chapter were prepared according to the
current recipes in Sung lab or other popular recipes provided online.

56
CHAPTER 3 DIGESTION TESTS OF NGOMIV AND ITS MUTANT
3.1 Introduction
Among all type II restriction enzymes, subtype E and F need two corresponding
DNA targets, which is considered to be a mechanism for high-fidelity digestion. Type II
E restriction enzymes, typified by Nae I, Cfr9I and EcoRII, target two cognate sites and
cut only one of them, which mean that the other one not cleaved is serving as an effector.
Type II F restriction enzymes, such as NgoMIV, Cfr10I and SfiI, target two cognate
sequences, but cut both. Besides the obvious difference in catalytic activities, derived
from current existed crystal structures of both subtype enzymes, type II E restriction
enzymes are dimer proteins, while type II F restriction enzymes are tetramers.
Requirements for two copies of their corresponding recognition sites of these proteins
were firstly identified by kinetics studies. Through the kinetics studies, most restriction
enzymes within the two subtypes were proved to have a slower cleavage rate with only
one DNA substrate, comparing with enzymes with two substrates, both in trans and in cis.
Interactions of proteins with two sites in cis are considered to be more readily than in
trans. It is because that the effective concentration of one DNA site in the vicinity of
another is usually higher for sites in the same DNA molecule than in different DNA
molecule. In cis recognition and catalysis would contribute the DNA looping, which has
been proved by various experiments. In 2003, DNA looping of NgoMIV has been
detected by single molecule detection technique. As well as, how tetrameric restriction
enzymes proteins capture two cognate recognition sites to form the looping structure is
still a significant and still uncovered question to scientists.

57
Figure 3.1 DNA looping by tetrameric restriction enzymes
The between-site distance optimization for cleavage of type II E and F restriction
enzymes has been studied by EcoRII. EcoRII is a type II E dimeric protein with a central
catalytic core and two N-terminal effector DNA binding domains. It needs to bind target
DNA to the N-terminal effector for catalysis of DNA in the central catalytic core. The
highest digestion efficiency of cognate DNA targets was detected when the two
recognition sites were only 5 bp apart. And the cleavage became less efficient as the
distance increasing to 200 bp. Further increase in the distance became less influential to
the digestion efficient, which could be explained by the formation of DNA looping. A
distance of 1000 bp would cease the cleavage. Therefore, in the case, it seems that the
distance corresponding to about one DNA helix turn would contribute to an optimal
arrangement of all molecules and lead to the hydrolysis reaction. Based on the current
recognition and catalysis mechanism studies and existed crystal structures of both EcoRII
and NgoMIV, these two restriction enzymes should behave differently in recognition and
catalysis. Also as discussed in chapter 1, personally, the apo-enzyme of NgoMIV would

58
probably be a tetramer, which means the DNA length between two recognition sites
would be fixed under certain digestion condition.
In this chapter, the between-site distance optimization experiment for NgoMIV
cleavage has been conducted by using different restriction enzyme linearized pET21a-
d(+)-Protein A as the DNA substrate as well as wide-type NgoMIV and mutated
NgoMIV. The plasmid pET21a-d(+)-Protein A is a modified pET21a-d(+), with the
deletion of his-tag sequence and addition of the Protein A DNA sequence. Four NgoMIV
restriction sites are available in the modified plasmid. The distance between each two
NgoMIV restriction sites are 3181 bp, 1589 bp, 1061 bp and 161 bp. As mentioned
before, the DNA substrates are restriction enzyme linearized pET21a-d(+)-Protein A.
EcoRI restriction site within the 1061 bp sequence, EcoRV restriction site within the
1589 bp fragment and PstI site inside the 3181 bp-distance fragment were chosen.
Linearization of the plasmids by these three restriction enzymes- EcoRI, EcoRV and PstI
was conducted by following the user manual provided by NEB®. The digestion
experiment of these three linearized fragments by both kinds of NgoMIV proteins was
conducted under the similar condition. In the meantime, digestion with different protein
concentration has been investigated in the chapter.
3.2 Materials and Methods
3.2.1 Amplification and Purification of pET21a-d(+)-Protein A
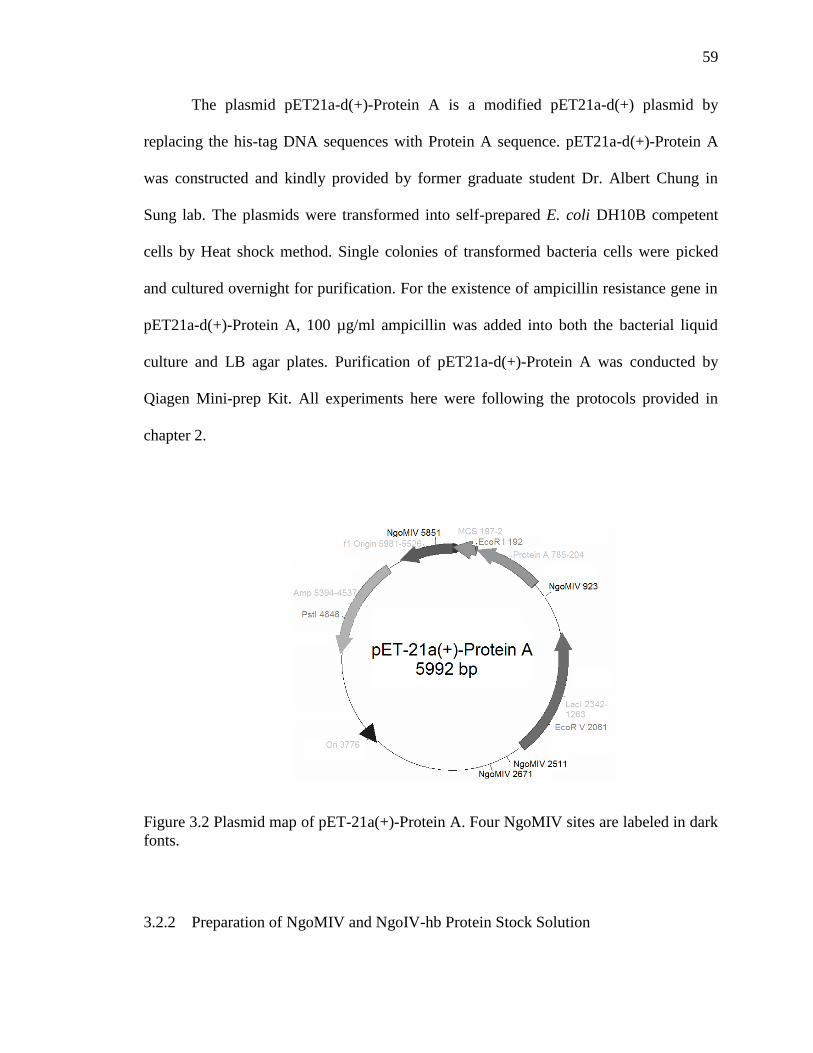
59
The plasmid pET21a-d(+)-Protein A is a modified pET21a-d(+) plasmid by
replacing the his-tag DNA sequences with Protein A sequence. pET21a-d(+)-Protein A
was constructed and kindly provided by former graduate student Dr. Albert Chung in
Sung lab. The plasmids were transformed into self-prepared E. coli DH10B competent
cells by Heat shock method. Single colonies of transformed bacteria cells were picked
and cultured overnight for purification. For the existence of ampicillin resistance gene in
pET21a-d(+)-Protein A, 100 µg/ml ampicillin was added into both the bacterial liquid
culture and LB agar plates. Purification of pET21a-d(+)-Protein A was conducted by
Qiagen Mini-prep Kit. All experiments here were following the protocols provided in
chapter 2.
Figure 3.2 Plasmid map of pET-21a(+)-Protein A. Four NgoMIV sites are labeled in dark
fonts.
3.2.2 Preparation of NgoMIV and NgoIV-hb Protein Stock Solution
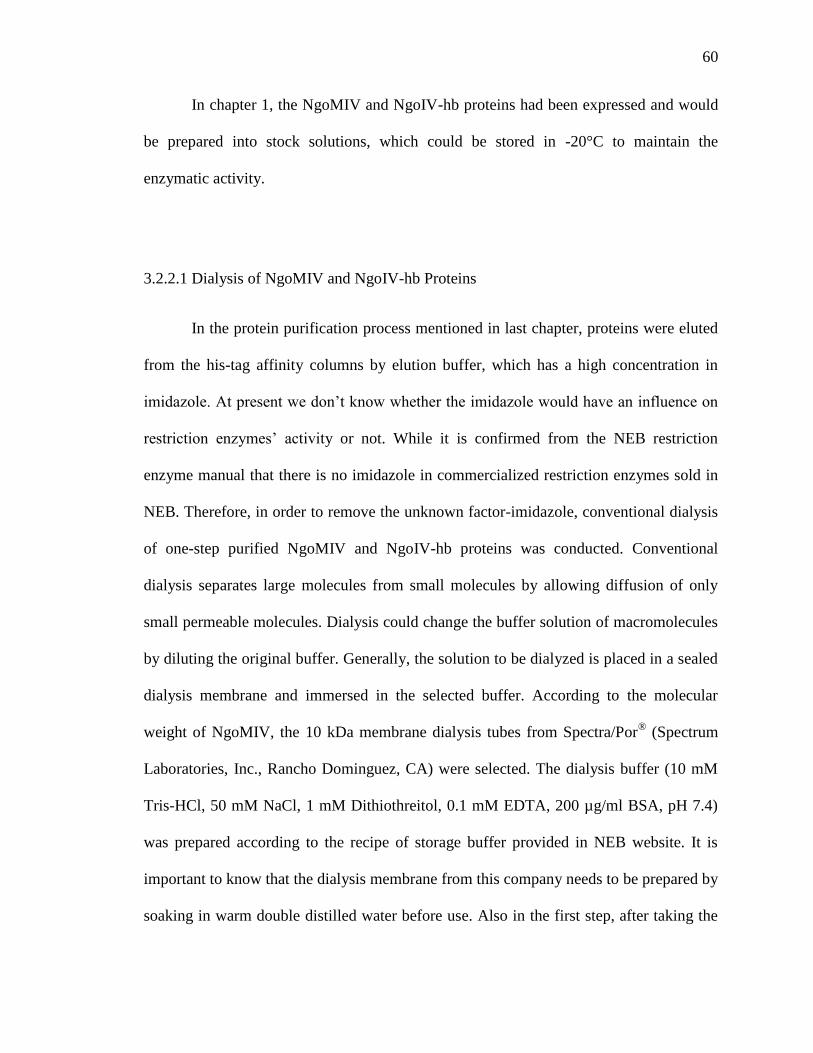
60
In chapter 1, the NgoMIV and NgoIV-hb proteins had been expressed and would
be prepared into stock solutions, which could be stored in -20°C to maintain the
enzymatic activity.
3.2.2.1 Dialysis of NgoMIV and NgoIV-hb Proteins
In the protein purification process mentioned in last chapter, proteins were eluted
from the his-tag affinity columns by elution buffer, which has a high concentration in
imidazole. At present we don’t know whether the imidazole would have an influence on
restriction enzymes’ activity or not. While it is confirmed from the NEB restriction
enzyme manual that there is no imidazole in commercialized restriction enzymes sold in
NEB. Therefore, in order to remove the unknown factor-imidazole, conventional dialysis
of one-step purified NgoMIV and NgoIV-hb proteins was conducted. Conventional
dialysis separates large molecules from small molecules by allowing diffusion of only
small permeable molecules. Dialysis could change the buffer solution of macromolecules
by diluting the original buffer. Generally, the solution to be dialyzed is placed in a sealed
dialysis membrane and immersed in the selected buffer. According to the molecular
weight of NgoMIV, the 10 kDa membrane dialysis tubes from Spectra/Por® (Spectrum
Laboratories, Inc., Rancho Dominguez, CA) were selected. The dialysis buffer (10 mM
Tris-HCl, 50 mM NaCl, 1 mM Dithiothreitol, 0.1 mM EDTA, 200 µg/ml BSA, pH 7.4)
was prepared according to the recipe of storage buffer provided in NEB website. It is
important to know that the dialysis membrane from this company needs to be prepared by
soaking in warm double distilled water before use. Also in the first step, after taking the

61
membranes from the warm double distilled water, it would be better to rinse them again
with double distilled water. Dialysis was conducted at 4°C for about 16 hrs. Low
temperature could enhance the stability of macromolecules. Dialysis buffer was changed
for three times during the whole dialysis process, which was considered to be sufficient
for successful dialysis.
3.2.2.2 Concentration of NgoMIV and NgoIV-hb Proteins
It is convenient to store proteins in high concentrations and when proteins were
added for reactions, high concentration would reduce the volume of protein samples
required. Therefore, it is necessary to concentrate the protein samples. Here, the
centrifuge concentrators YM-10-10,000 from Amicon (Millipore Corporation, Billerica,
MA) were used. 10-10,000 represents the cut-off size of the concentrator. The spin time
for concentration was 30mins at 8,000 rpm. In this experiment, 5 mL protein samples
were reduced to about 2 mL.
3.2.2.3 Glycerol Sample Stocks of NgoMIV and NgoIV-hb Proteins
2 mL glycerol was mixed with 2 mL concentrated protein solution to prepare the
sample stocks. Briefly, after added glycerol, mixture was vortexed gently for a while.
Well-mixed protein glycerol stock samples were stored in -20°C for future digestion
tests, as well as, the concentrations of the glycerol stock samples were determined by
Bradford protein assay mentioned in chapter 1. The concentration of NgoMIV protein

62
stock solution is 2.92 mg/mL; the concentration of NgoIV-hb stock solution is 2.67
mg/mL.
3.2.3 Digestion Tests of Linearized pET21a-d(+)-Protein A Plasmids
In the digestion tests, the pET21a-d(+)-Protein A plasmids were firstly linearized
by three different restriction enzymes- EcoRI, EcoRV and PstI to cause different
distributions of four NgoMIV restriction sites. Three different linearized plasmids were
digested by NgoMIV and NgoIV-hb proteins in a standard condition and then analyzed
by 0.8% (w/v) agrose gel.
3.2.3.1 Linearization of pET21a-d(+)-Protein A Plasmids
The pET21a-d(+)-Protein A plasmids were digested by three different restriction
enzymes- EcoRV, EcoRI and PstI overnight at 37°C. The digestion protocol was similar
to those provided in chapter 1. After digestion, digested plasmids were purified by
Qiagen PCR clean-up kit. The purification protocol has been provided before. The
concentrations of digested plasmids were determined by Nanodrop.
3.2.3.2 The Between-site Digestion Tests of Linearized Plasmids by NgoMIV and
NgoIV-hb Proteins

63
In the digestion tests, the amount of the linearized plasmids was fixed; 500 ng
DNA was used in each restriction digestion, while the amount of the protein was not
fixed. Protein solution was diluted into different concentrations by the same storage
buffer. Low concentration protein solution would cause the partial reaction, which would
probably provide us the digestion dynamic information. In the digestion tests, protein
stock samples of NgoMIV and NgoIV-hb were diluted 50X, 100X, 200X, 400X, 800X
and 1600X and 1 µL of them was added into each reaction. The reaction compositions
were provided in the following table. Restriction reaction buffer 4 and 100X BSA from
NEB were chosen for this experiment. Reaction was conducted at 37°C for 1 hr. After
1hr 37°C incubation, restriction reaction was terminated by heat inactivating the proteins
at 80°C for 5mins. Digested results were analyzed by 0.8 (w/v) agrose gels, ran at 115V
for about 20mins. Then agrose gel was soaked in 1X TAE buffer with 3%-4% ethidium
bromide (EB) for about 1hr. Stained agrose gel was visualized on UV plate for picture
capturing. Captured images were analyzed by image J software.
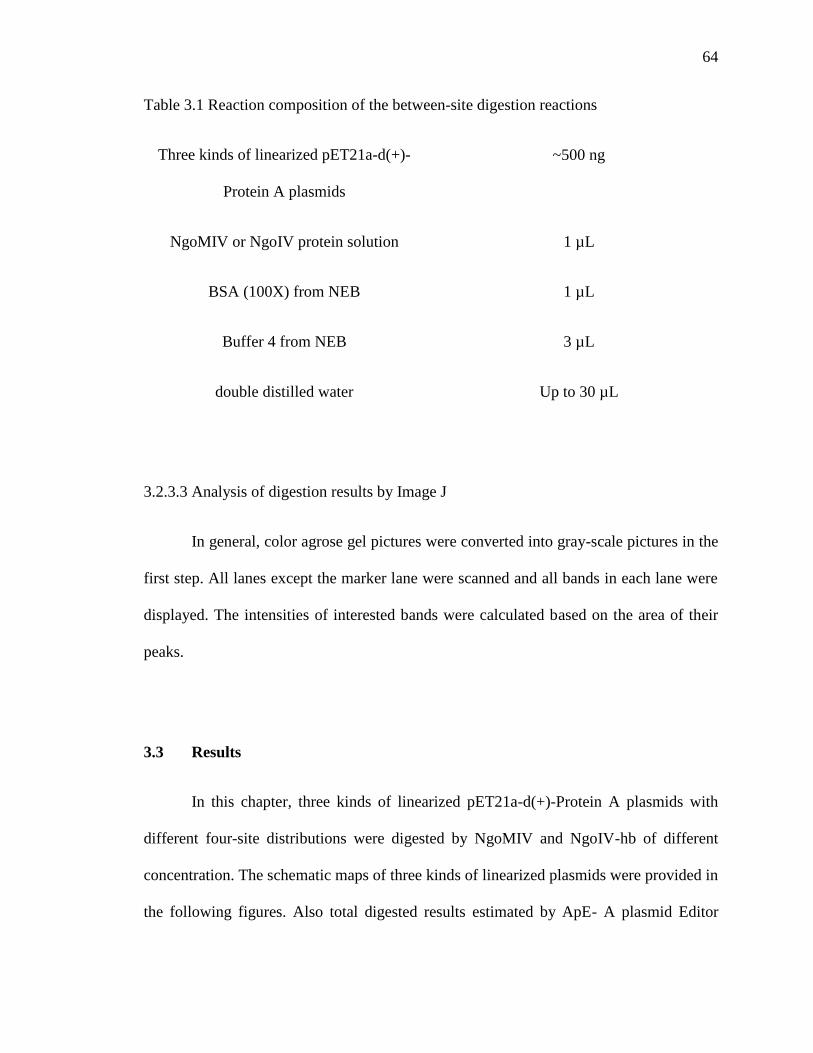
64
Table 3.1 Reaction composition of the between-site digestion reactions
Three kinds of linearized pET21a-d(+)-
Protein A plasmids
~500 ng
NgoMIV or NgoIV protein solution 1 µL
BSA (100X) from NEB 1 µL
Buffer 4 from NEB 3 µL
double distilled water Up to 30 µL
3.2.3.3 Analysis of digestion results by Image J
In general, color agrose gel pictures were converted into gray-scale pictures in the
first step. All lanes except the marker lane were scanned and all bands in each lane were
displayed. The intensities of interested bands were calculated based on the area of their
peaks.
3.3 Results
In this chapter, three kinds of linearized pET21a-d(+)-Protein A plasmids with
different four-site distributions were digested by NgoMIV and NgoIV-hb of different
concentration. The schematic maps of three kinds of linearized plasmids were provided in
the following figures. Also total digested results estimated by ApE- A plasmid Editor
65
were provided. As mentioned above, the stock concentration of NgoMIV is 2.92 mg/mL;
the concentration of NgoIV-hb glycerol stock stolution is 2.67 mg/mL. Generally, 50X,
100X, 200X, 400X, 800X and 1600X diluted protein solutions were used in the digestion
tests. Agrose gel pictures of digestion results and analysis results generated by Image J
were displayed in these integrated pictures below.
From the digestion results, it is obviously to see that partial digestion would occur
in reactions using 100X, 200X and 400X diluted protein solution. In reactions using 50X
diluted protein solution, plasmids were totally digested; while, to reactions applied with
800X and 1600X diluted protein solution, plasmids seems to be undigested. Based on our
aim to analyze the preference of the between-site length, several DNA fragments were
chosen to be focused. In the EcoRV linearized plasmid, the 3181 bp and the 1061 bp
fragments were picked. In EcoRI linearized plasmid, the 1589 bp and the 3181 bp
fragments were chosen. In PstI linearized plasmid, we were focusing on the 1064 bp and
the 1589 bp fragments. Although in all the three kinds of linearized plasmids, a 161 bp
fragment is existed within two NgoMIV recognition sites. Due to the low-resolution of
detecting such a small fragment by agrose gel, we choose to give up the fragment.
Therefore, the intensity of these fragments mentioned above were analyzed by Image J
and compared.
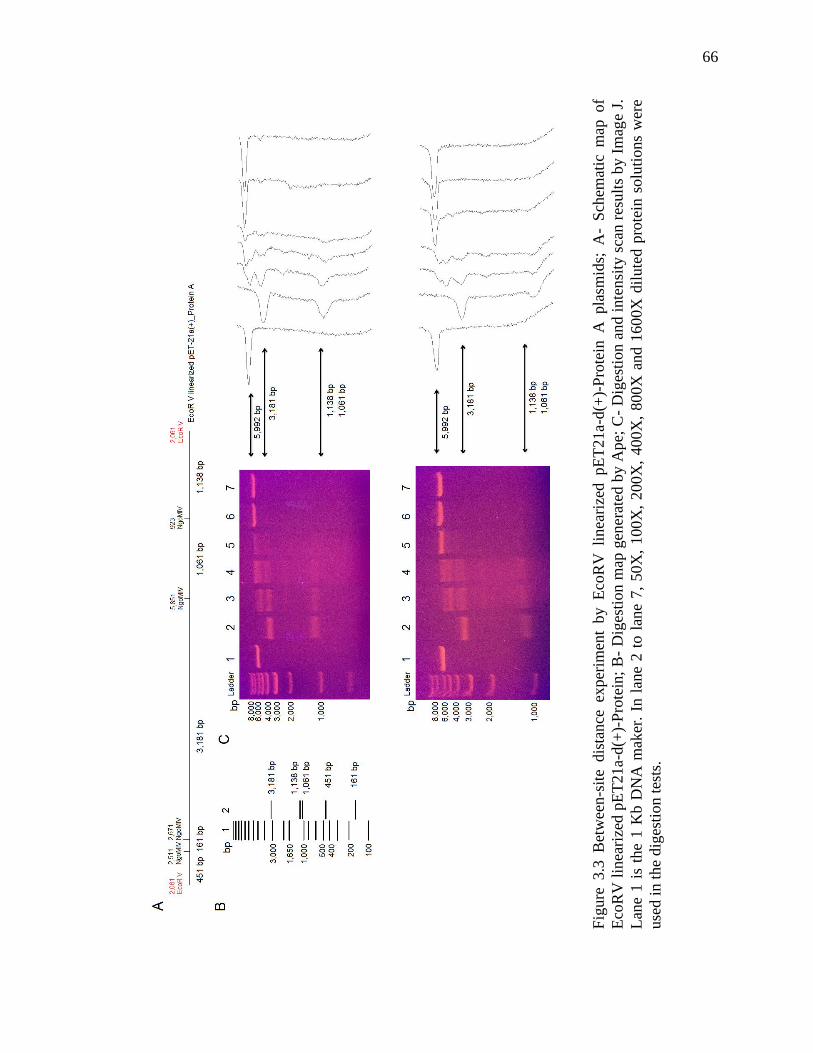
66
Fig
ure
3.3
B
etw
een
-sit
e dis
tance
ex
per
imen
t by
E
coR
V li
nea
rize
d pE
T21a-d
(+)-
Pro
tein
A
pla
smid
s; A
- S
chem
atic
m
ap of
Eco
RV
lin
eari
zed p
ET
21
a-d(+
)-P
rote
in;
B-
Dig
esti
on m
ap g
ener
ated
by A
pe;
C-
Dig
esti
on a
nd i
nte
nsi
ty s
can r
esult
s by I
mag
e J.
Lan
e 1 i
s th
e 1 K
b D
NA
mak
er.
In l
ane
2 t
o l
ane
7,
50X
, 100X
, 200X
, 400X
, 800X
and 1
600X
dil
ute
d p
rote
in s
olu
tions
wer
e
use
d i
n t
he
dig
esti
on t
ests
.

67
Fragment size (bp)
L
ane
2
L
ane
3
L
ane
4
L
ane
5
Fra
gm
ent
size
(b
p)
Fra
gm
ent
size
(b
p)
Intensity/ Fragment Size
Intensity/ Fragment Size
Fig
ure
3.3
conti
nued
.
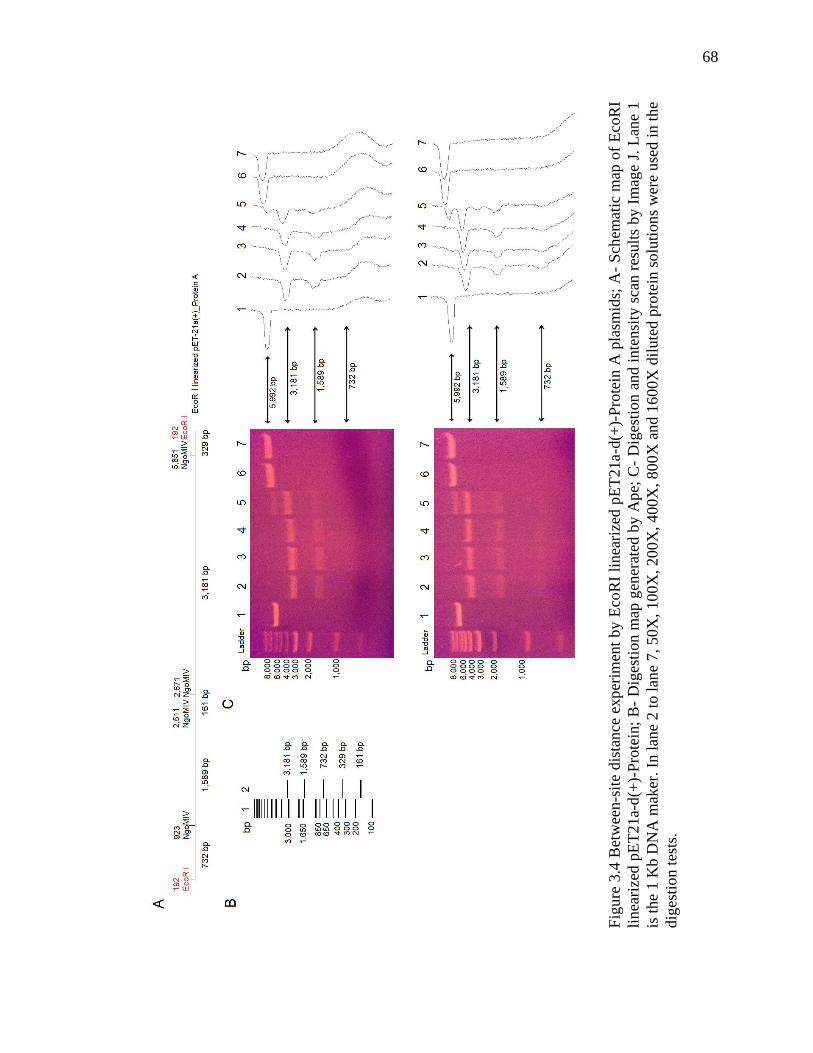
68
Fig
ure
3.4
Bet
wee
n-s
ite
dis
tance
exp
erim
ent
by
Eco
RI
linea
rize
d p
ET
21a-d
(+)-
Pro
tein
A p
lasm
ids;
A-
Sch
emat
ic m
ap o
f E
coR
I
linea
rize
d p
ET
21a-
d(+
)-P
rote
in;
B-
Dig
esti
on m
ap g
ener
ated
by A
pe;
C-
Dig
esti
on a
nd
inte
nsi
ty s
can r
esult
s by I
mag
e J.
Lan
e 1
is t
he
1 K
b D
NA
mak
er.
In l
ane
2 t
o l
ane
7,
50X
, 100X
, 200X
, 400X
, 800
X a
nd 1
600X
dil
ute
d p
rote
in s
olu
tions
wer
e use
d i
n t
he
dig
esti
on t
ests
.

69
L
ane
2
L
ane
3
L
ane
4
L
ane
5
Fig
ure
3.4
conti
nued
.
Intensity/ Fragment Size
Intensity/ Fragment Size
Fra
gm
ent
size
(b
p)
Fra
gm
ent
size
(b
p)
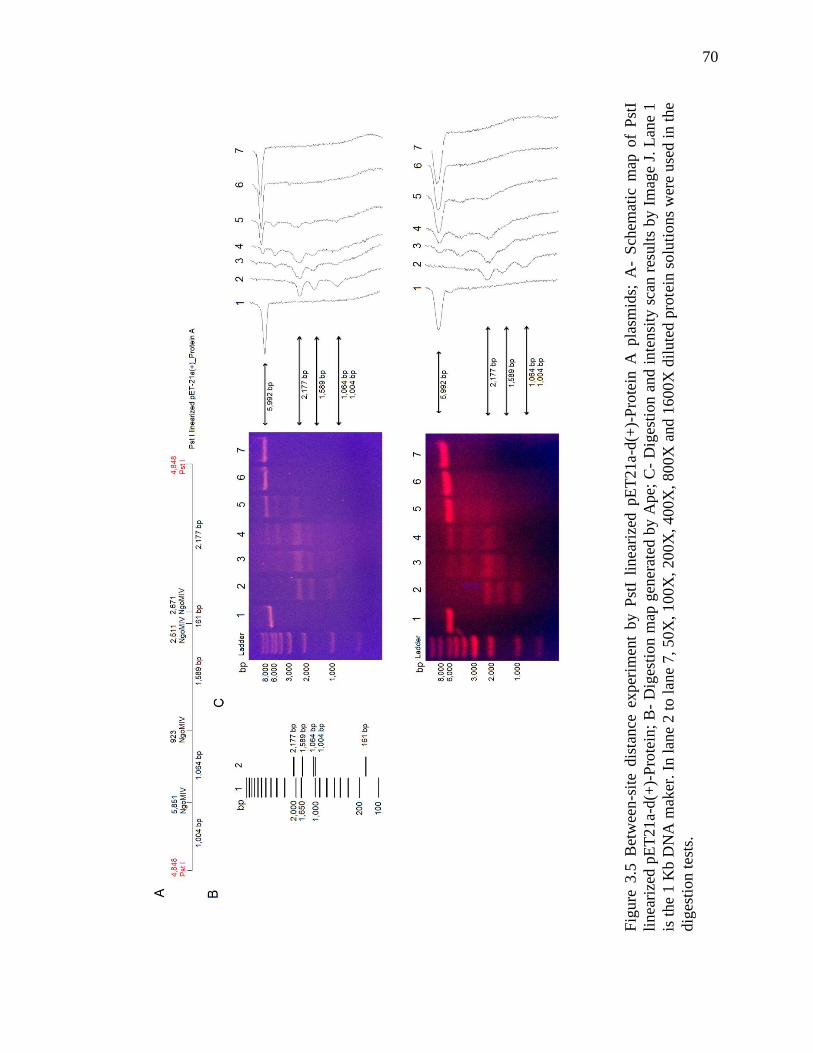
70
Fig
ure
3.5
Bet
wee
n-s
ite
dis
tance
exper
imen
t by P
stI
linea
rize
d p
ET
21a-d
(+)-
Pro
tein
A p
lasm
ids;
A-
Sch
emat
ic m
ap o
f P
stI
linea
rize
d p
ET
21
a-d(+
)-P
rote
in;
B-
Dig
esti
on m
ap g
ener
ated
by A
pe;
C-
Dig
esti
on a
nd i
nte
nsi
ty s
can r
esult
s by I
mag
e J.
Lan
e 1
is t
he
1 K
b D
NA
mak
er.
In l
ane
2 t
o l
ane
7,
50X
, 100X
, 200X
, 400X
, 800X
and 1
600X
dil
ute
d p
rote
in s
olu
tions
wer
e use
d i
n t
he
dig
esti
on t
ests
.

71
L
ane
2
L
ane
3
L
ane
4
L
ane
5
Fra
gm
ent
size
(b
p)
Fra
gm
ent
size
(b
p)
Intensity/ Fragment Size
Intensity/ Fragment Size
Fig
ure
3.5
conti
nued
.
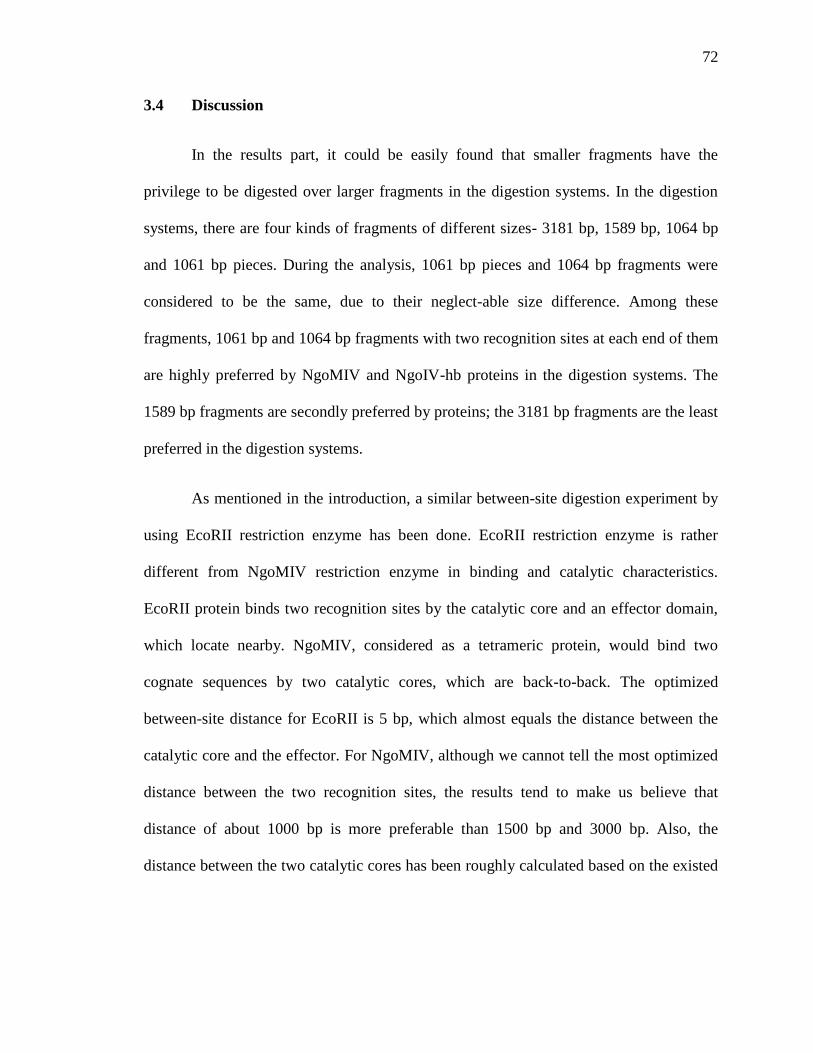
72
3.4 Discussion
In the results part, it could be easily found that smaller fragments have the
privilege to be digested over larger fragments in the digestion systems. In the digestion
systems, there are four kinds of fragments of different sizes- 3181 bp, 1589 bp, 1064 bp
and 1061 bp pieces. During the analysis, 1061 bp pieces and 1064 bp fragments were
considered to be the same, due to their neglect-able size difference. Among these
fragments, 1061 bp and 1064 bp fragments with two recognition sites at each end of them
are highly preferred by NgoMIV and NgoIV-hb proteins in the digestion systems. The
1589 bp fragments are secondly preferred by proteins; the 3181 bp fragments are the least
preferred in the digestion systems.
As mentioned in the introduction, a similar between-site digestion experiment by
using EcoRII restriction enzyme has been done. EcoRII restriction enzyme is rather
different from NgoMIV restriction enzyme in binding and catalytic characteristics.
EcoRII protein binds two recognition sites by the catalytic core and an effector domain,
which locate nearby. NgoMIV, considered as a tetrameric protein, would bind two
cognate sequences by two catalytic cores, which are back-to-back. The optimized
between-site distance for EcoRII is 5 bp, which almost equals the distance between the
catalytic core and the effector. For NgoMIV, although we cannot tell the most optimized
distance between the two recognition sites, the results tend to make us believe that
distance of about 1000 bp is more preferable than 1500 bp and 3000 bp. Also, the
distance between the two catalytic cores has been roughly calculated based on the existed

73
crystal structure 1FIU. The calculation shows that the distance of about 34 bp might let
the DNA fits the protein properly.

74
CHAPTER 4 HYPOTHESES AND OUTLOOK OF RESTRICTION ENZYME
CATALYTIC MECHANISM
4.1 Introduction
4.1.1 Anisotropic Elastic Network Model (ANM)
The anisotropic elastic network model (ANM) is an important tool for protein
structural flexibility study, which generally provides a residue-based, low-resolution and
normal mode analysis for protein structures by involving the 3D character of residue
fluctuation. In the model, the alpha-C atoms of every amino acid residues are considered
to be nodes as well as all covalent bonds and non-covalent bonds between neighboring
node pairs are considered to be harmonic springs. Therefore, it is obviously to learn that
nature side chains of amino acid residues are ignored in the model. Protein
conformational changes, which are strongly connected with proteins’ functions, i.e.
intrinsic dynamics, could be partially known by the collective modes of motion in the
model. Also the critical sites controlling these modes can be identified by ANM. In
previous study, it has been confirmed that the low frequency modes would give insight
into proteins’ functional motions as well as identify hot regions involving in catalytic
process and high-frequency fluctuations. In theoretical study, under-covering critical
amino acid residues would provide people the access for further modeling in proteins’
mechanisms. In the meantime, molecular biologists could apply protein engineering
techniques to confirm the information acquired from the model and experimentally
discover proteins’ mechanisms.
75
Figure 4.1 Theoretical base of elastic network model
4.1.2 DNA Deformation by Restriction Enzymes
DNA deformation has been observed in many co-crystal structures of restriction
enzymes and their binding DNA sequences. Structures of EcoRV with its cognate DNA
and BamHI with its cognate DNA are considered to be two representations for DNA-
restriction enzyme interaction study. From the crystal structures, it is obviously to
observe that the cognate DNA of EcoRV was bended in a very large angle, comparing to
the cognate DNA of BamHI, which seems to be still in the B-DNA conformation. The
structural changes in DNA could be explained by enzymatic theory- induced-fit
mechanism. Beside the classic enzymatic theory, some scientists reckon that the
conformation would help the catalysis physically. In this chapter, based on the elastic
network model of the NgoMIV’s dimer, a hypothesis about the intermediate
conformation of DNA in restriction enzymes’ catalytic process was raised.
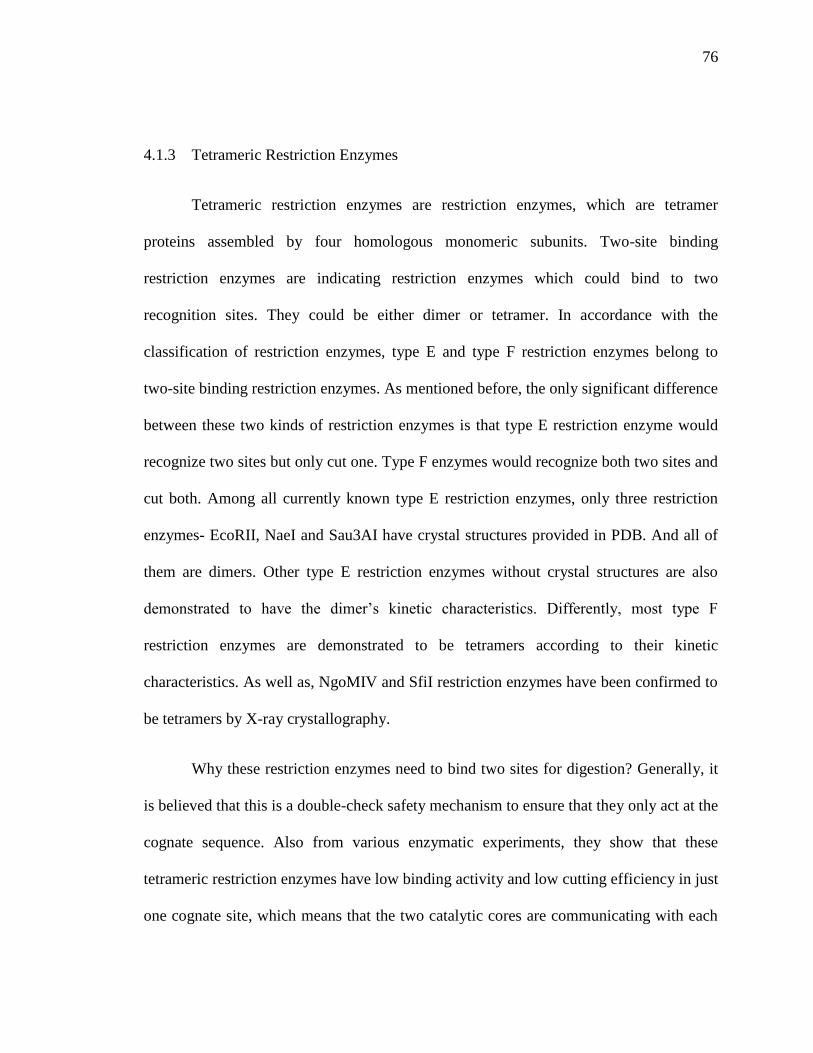
76
4.1.3 Tetrameric Restriction Enzymes
Tetrameric restriction enzymes are restriction enzymes, which are tetramer
proteins assembled by four homologous monomeric subunits. Two-site binding
restriction enzymes are indicating restriction enzymes which could bind to two
recognition sites. They could be either dimer or tetramer. In accordance with the
classification of restriction enzymes, type E and type F restriction enzymes belong to
two-site binding restriction enzymes. As mentioned before, the only significant difference
between these two kinds of restriction enzymes is that type E restriction enzyme would
recognize two sites but only cut one. Type F enzymes would recognize both two sites and
cut both. Among all currently known type E restriction enzymes, only three restriction
enzymes- EcoRII, NaeI and Sau3AI have crystal structures provided in PDB. And all of
them are dimers. Other type E restriction enzymes without crystal structures are also
demonstrated to have the dimer’s kinetic characteristics. Differently, most type F
restriction enzymes are demonstrated to be tetramers according to their kinetic
characteristics. As well as, NgoMIV and SfiI restriction enzymes have been confirmed to
be tetramers by X-ray crystallography.
Why these restriction enzymes need to bind two sites for digestion? Generally, it
is believed that this is a double-check safety mechanism to ensure that they only act at the
cognate sequence. Also from various enzymatic experiments, they show that these
tetrameric restriction enzymes have low binding activity and low cutting efficiency in just
one cognate site, which means that the two catalytic cores are communicating with each
77
other. Currently, structures of tetrameric restriction enzymes are still interesting and
complicated systems to structure biologists; a few questions about the internal
communication haven’t been answered. In the chapter, we applied ANM for tetrameric
restriction enzymes and focused on the motion of the back-back arranged dimers.
4.2 Methods and Materials
4.2.1 Structure Alignment, PDB File Editing and Standard DNA Structure Generation
Structure alignment was conducted in Pymol software by align syntax. PDB file
editor was downloaded from http://www.bioinformatics.org/pdbeditor/wiki/. Standard
DNA structures were generated by make-na webserver (http://structure.usc.edu/make-
na/).
As mentioned above, restriction enzyme protein binding with cognate DNA
sequence will trigger the conformation changes in cognate DNA sequences. Here,
deformed DNA sequences extracted with co-crystal structures of BamHI (PDBID:
1BHM), EcoRV (PDBID: 1SUZ) and NgoMIV (PDBID: 1FIU and 4ABT) were aligned
with automated generated B conformation DNA sequences.
4.2.2 Anisotropic Elastic Network Model (ANM)
A strong webserver- Hinge prot
(http://bioinfo3d.cs.tau.ac.il/HingeProt/hingeprot.html) provided with ANM modeling

78
was applied here. No further modification about the basic ANM theory and method was
conducted in our study.
4.2.3 Crystal Structures of Restriction Enzymes
In our study, crystal structures of three restriction enzymes- EcoRV, BamHI and
NgoMIV were used, which were provided by PDB and Rebase (a restriction enzyme
database establishe by NEB). All PDB IDs were also provided along with the crystal
structures.
4.3 Results and Proposed Mechanisms
4.3.1 DNA Deformation and Motion of Catalytic Cores
DNA structures from DNA-protein co-crystal structures were extracted by PDB
editor and aligned with make-na generated standard B-conformation DNA structures of
the same sequences. From the alignment pictures below, it is obvious to see the
deformation of DNA structures, which was highlighted by arrows. Also all largest
deformation sites seem to be consistent with each other; they all exist between the first or
last nucleotides of recognition sites and the neighboring nucleotide, which doesn’t belong
to the recognition sites. For example, the deformation of BamHI’s cognate DNA is
occurred between the third dT and the fourth dG. The largest deformation sites of EcoRV

79
and NgoMIV’s cognate sequences are between the last nucleotides of recognition sites
and the next nucleotide.
Structure alignments of DNA were also conducted with the existence of proteins.
From these alignments, they show that the deformation sites could be either on the top
side or the bottom side of the catalytic cores. This could be explained by the attacking
direction of protein to DNA. Here it is interesting to find that it seems that the
deformation might be strongly connected with the alpha- helices nearby, which not only
supported by the alignment pictures, but also the ANM of these proteins, which would be
provided in supplementary materials. Furthermore, based on characteristics of
palindromic sequences, we proposed that the palindromic recognition sites might be
formed hair-pin structures as the intermediate state, which has very high internal energy.
As well as, the hair-pin structures would be cleaved in different ways to generate sticky
ends and blunt ends, which were thought to be caused by different kinds of protein
motion.
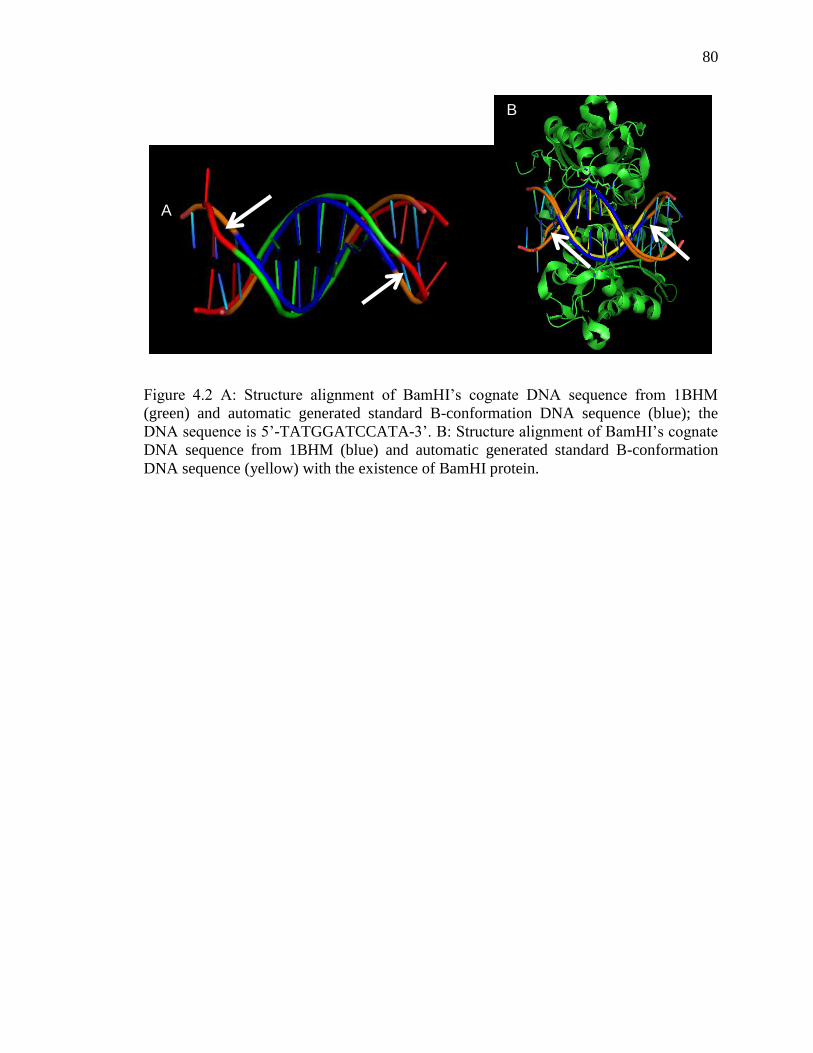
80
Figure 4.2 A: Structure alignment of BamHI’s cognate DNA sequence from 1BHM
(green) and automatic generated standard B-conformation DNA sequence (blue); the
DNA sequence is 5’-TATGGATCCATA-3’. B: Structure alignment of BamHI’s cognate
DNA sequence from 1BHM (blue) and automatic generated standard B-conformation
DNA sequence (yellow) with the existence of BamHI protein.
A
B

81
Figure 4.3 A: Structure alignment of EcoRV’s cognate DNA sequence from 1SUZ
(green) and automatic generated standard B-conformation DNA sequence (blue); the
DNA sequence is 5’-CAAGATATCTT-3’. B: Structure alignment of EcoRV’s cognate
DNA sequence from 1SUZ (yellow) and automatic generated standard B-conformation
DNA sequence (blue) with the existence of EcoRV protein.
B
A

82
Figure 4.4 A: Structure alignment of NgoMIV’s cognate DNA sequence from 1FIU
(green) as well as 4ABT (blue) and automatic generated standard B-conformation DNA
sequence (cyan); the DNA sequence is 5’-TGCGCCGGCGC -3’. B: Structure alignment
(top-view) of NgoMIV’s cognate DNA sequence from 1FIU (green) as well as 4ABT
(blue) and automatic generated standard B-conformation DNA sequence (cyan) with the
existence of NgoMIV protein. C: Deformation (red) and dislocation (green) of breakage
sites of NgoMIV recognition sites. The deformation sites were pointed by white arrows;
the dislocations of breakage sites were labeled by yellow arrows.
Based on the deformation, i.e. the red labeled sites in figure 4.4, we proposed that
the physical force causing the deformation might intend to distort the recognition sites to
form a hairpin structure, which illustrates in figure 4.5. Also, according to the observed
A
B
C

83
dislocation in figure 4.4, we proposed that, another torsional force might be existing,
which would break the hairpin structure. It would eventually lead to the cleavage of the
recognition site.
The ANM of NgoMIV protein would be demonstrated in the thesis defense. From
the predicted motion, it is easy to find that the alpha-helix boxed in figure 4.5 has the
largest motion eigenvalue. Also the amino acid residue 63 glutamine in the tip point of
alpha-helix has been confirmed to have the non-covalent interaction with the DNA
backbone. Therefore, we reckon that the motion of the alpha-helix might contribute a
major physical force for the deformation of binding DNA, which could also be the major
force to cause the formation of proposed hair-pin structure.
Figure 4.5 A: Motion of NgoMIV protein predicted by ANM. The yellow arrows briefly
indicate the oscillation direction of each monomer. B: Proposed hairpin structure of
palindromic recognition sequences.
A
B

84
4.3.2 Dimer-dimer Motion of NgoMIV
Figure 4.6 Predicted dimer-dimer motion of NgoMIV.
It is generally believed that binding two cognate sequences is a double-check
safety mechanism for tetrameric restriction enzymes. In our study, based on the ANM of
tetrameric NgoMIV, the reverse fluctuation of two dimers was observed, which was
considered to cause a physical force to distort the binding DNA sequence. Therefore, we
propose that the physical force generated by the reverse fluctuation motion might help the
chemical catalysis process. Also, we think that the binding of one recognition site of one
dimer would facilitate the binding of the other recognition site of the other dimer by
causing the conformational changes.

85
CHAPTER 5 CONCLUSION
In order to figure out the catalytic dynamics of restriction enzymes, NgoMIV, a
tetrameric restriction enzyme was chosen to be cloned and expressed. Additionally, a
hybrid protein called NgoIV-hb, which was designed based on the difference of NgoMIV
and NgoAIV, was cloned and expressed in the meantime. Previously, NgoMIV and
NgoIV-hb proteins were cloned into pTrcHis1-TOPO® together with its corresponding
modification enzyme by undergraduate researchers in Sung lab. Unfortunately, the co-
expression method turned out to be failed. Therefore, in order to solve the problem, a
two-step strategy of cloning and expressing restriction enzyme and modification enzyme
separately in two plasmids, which have different promoters and different antibiotics
selective markers, was applied. This strategy is based on the basic characteristics of
restriction-modification systems. Briefly, modification enzyme was firstly cloned and
expressed in the host cells. Expression host cells containing modification enzyme were
prepared into competent cells for the transformation of restriction enzymes. Originally in
these two plasmids, there are his-tag encoding sequences, which would bring us the
trouble of purifying restriction enzyme. To solve the problem, the his-tag encoding
sequence in the plasmid, which was constructed with modification enzyme, was removed
by PCR. Restriction enzymes were successfully expressed and purified by the strategy.
In the second part, based on the proposed catalytic mechanisms of tetrameric
restriction enzymes, we applied another plasmid with four NgoMIV sites for the
restriction digestion tests. The results shows that there exists an optimized distance
between the two restriction sites for the tetrameric restriction enzymes. Finally, based on
86
anisotropic elastic network models, several proposed mechanisms of tetrameric
restriction enzymes’ catalytic motions were raised.
87
REFERENCES
1. Bath, AJ, Halford, SE & Scott, DJ. (2004) Analysis of type II restriction
endonucleases that interact with two recognition sites. Nucleic Acids and Molecular
Biology : Restriction endonucleases, 13, 297-317.
2. Bellamy, SRW, Mina, P, Retter, SE & Halford, SE. (2008) Fidelity of DNA
sequence recognition by the Sfil restriction endonuclease is determined by
communications between its two DNA-binding sites. Journal of Molecular Biology,
384 (3), 557-563.
3. Catto, LE, Bellamy, SRW, Retter, SE & Halford, SE. (2008). Dynamics and
consequences of DNA looping by FokI restriction endonuclease. Nucleic Acids
Research, 36 (6), 2073-2081.
4. Deibert, M., Grazulis, S., Sasnauskas, G., Siksnys, V., & Hurber, R. Structure of the
tetrameric restriction endonuclease NgoMIV in complex with cleaved DNA. Nature
Structural Biology, Vol. 7(9), 792-799.
5. Doruker, P., Nilsson, L., Kurkcuoglu, O., & Uyar, A. (2011) The elastic network
model reveals a consistent picture on intrinsic function dynamics of type II
restriction endonucleases. Physical Biology, 8-056001.
6. Golovenko, D., Manakova, E., Tamulaitiene, G., Grazulis, & S., Siksnys, V. (2009).
Structural mechanisms for the 5’-CCWGG sequence recognition by the N- and C-
terminal domains of EcoRII. Nucleic Acid Research, Vol. 37, No. 19, 6613-6624.
7. Gupta, R., Capalash, N., & Sharma., P. (2012) Restriction endonucleases: natural
and directed evolution. Applied Microbiology Biotechnology, DOI 10.1007/s00253-
012-3961-z.
8. Halford, S., Welsh, A., & Szczelkun, M. (2004) Enzyme-Mediated DNA Looping.
Annu. Rev. Biophys. Biomol. Struct, 33:1-24.
9. Henzler-Wildman, K., & Kern, D. (2007) Dynamic personalities of proteins. Nature,
Vol. 450, 964-972.
10. Kirsanova, O. V., Baskunov, V. B., & Gromova, E. S. (2004). Type IIE and Type IIF
restriction endonucleases interacting with two recognition sites on DNA. Molecular
Biology, Vol. 38, No. 5, 752-764.
11. Kobayashi, I. (2004). Restriction-Modification systems as minimal forms of life.
Nucleic Acids and Molecular Biology, Vol. 14, 19-23.
12. Laurens, N, Bellamy, SRW, Harms, AF, Kovacheva, YS, Halford, SE & Wuite, GJL.
(2009). Dissecting protein-induced DNA looping dynamics in real time. Nucleic
Acids Research, 37 (16), 5454-5464.

88
13. Milson, S., Halford, S., Embleton, M., & Szczelkun, M. (2001) Analysis of DNA
looping interactions by type II restriction enzymes that require two copies of the
recognition sites. Journal of Molecular Biology, 311, 515-527.
14. Mucke, M., Kruger, D., & Reuter, M. (2003) Diversity of type II restriction
endonucleases that require two DNA recognition sites. Nucleic Acid Research, Vol.
31, No. 21, 6079-6084.
15. Nagornykh, M., Bogdanova, Protsenko, A., Solonin, A., Zakharova, M., &
Severinov, K. (2008) Regulation of gene expression in a type II restriction-
modification system. Russian Journal of Genetics, Vol. 44, No. 5, 523-532.
16. Perona, J., Rodriguez, A., & Hiller, D. (2005) Non-cognate enzyme-DNA complex:
strural and kinetic analysis of EcoRV endonuclease bound to the EcoRI recognition
site GAATTC. Journal of Molecular Biology, Vol. 354, 121-136.
17. Pingoud, A., Fuxreiter, M., Pingoud, V., & Wende., W. (2005). Type II restriction
endonucleases: structure and mechanism. CMLS, Cell. Mol. Life Sci, 62 (2005) 685-
707.
18. Pingoud, V., Wende, Wolfgang., & Pingoud, A. (2009) On the divalent metal ion
dependence of DNA cleavage by restriction endonucleases of the EcoRI family.
Journal of Molecular Biology, Vol. 393, 140-160.
19. Tamulaitis, G., Solonin, A., & Siksnys, V. (2002) Alternative arrangements of
catalytic residues at the active sites of restriction enzymes. FEBS Letters, 518, 17-22.
20. Zahran, M., Daidone, I., Smith, J., & Imhof, P. (2010) Mechanism of DNA
recognition by the restriction enzyme EcoRV. Journal of Molecular Biology, Vol.
401, 415-432.