Embed Size (px)
Citation preview
1Product Surveil lance Program report | 2015–2016
Product Surveillance Program report 2015–2016
2Product Surveil lance Program report | 2015–2016
Executive summary 1
Background 2
Methods 2Microbiological testing 2
Physiochemical testing 2
Results and discussion 3Microbiological testing 3
(a) Coliforms 3
(b) E. coli 4
(c) Total plate count 5
(d) Coagulase-positive staphylococcus 6
(e) Salmonella spp. and Listeria monocytogenes 6
Factory size analysis 6
Physicochemical testing 9
(a) pH 9
(b) Water activity 9
(c) Moisture content 9
(d) Salt concentration 11
(e) Lactic acid concentration 11
Conclusion 12
References 12
Appendix 1 13
Appendix 2 14
Appendix 3 14
Appendix 4 15
Published by Dairy Food Safety Victoria, March 2017© State of Victoria
Contents
3Product Surveil lance Program report | 2015–2016
Executive summaryThe Dairy Food Safety Victoria Product Surveillance Program (the program) evaluates the microbiological status of dairy food samples to assess compliance with the Australia New Zealand Food Standards Code (the Code). The program evaluated 2,975 samples of Victorian dairy foods from 618 batches of product during 2015–2016.
Products were tested against selected food safety (Listeria spp., Salmonella spp., Staphylococcus aureus) and process hygiene (total plate count, coliform count, and E. coli) criteria. The results demonstrated good compliance with the Code. Only eight of the 618 batches analysed during the program exceeded microbiological criteria in Standard 1.6.1 (Schedule 27) of the Code.
No Salmonella spp. or Listeria monocytogenes were detected in any product. Coagulase-positive staphylococci were not detected in any product at levels of concern.
Surface-ripened cheese and ice cream were the product categories most likely to return positive results for microorganisms, reflecting poor process hygiene. A large proportion of manufacturers of surface-ripened cheese and ice cream had coliform detections in their product. This demonstrates the susceptibility of these products to contamination during processing and the need for improvements in good hygienic practices (GHP).
E. coli was most commonly detected in surface-ripened cheese and yoghurt-based dips, although it was generally present at low levels. E. coli was not detected in ice cream, cream cheese dips, cut/shredded/grated cheese, dairy desserts, spreads or milk. The data demonstrated that sites producing large volumes of product tended to have a lower incidence of coliform and E. coli detections compared to those producing smaller volumes.
The program also monitored the water activity, pH, moisture content, salt and lactic acid concentration of product categories considered high risk in terms of food safety. The data will be used to assess the risk of microbial survival and growth in dairy product categories and to better inform predictive modelling activities.
The results of the annual testing program demonstrated good compliance with the Food Standards Code.

4Product Surveil lance Program report | 2015–2016
Methods
Microbiological testingIn 2015–2016, 2,975 samples from 618 batches of dairy products manufactured by 149 different licensees were analysed. Dairy products were divided into thirteen categories based on product characteristics and identified as either high or low risk. This determined the sampling frequency and testing requirements.
Samples were collected twice per year during the Dairy Food Safety Victoria audit. Two batches of product in each high risk category and one batch from low risk categories produced by each manufacturer were collected at audit.
Five samples per batch were collected and tested for coliforms, E. coli, and coagulase-positive staphylococcus. The five samples were then composited and tested for Salmonella spp. and Listeria monocytogenes. This sampling plan enabled products to be assessed for compliance with Schedule 27 of the Code.
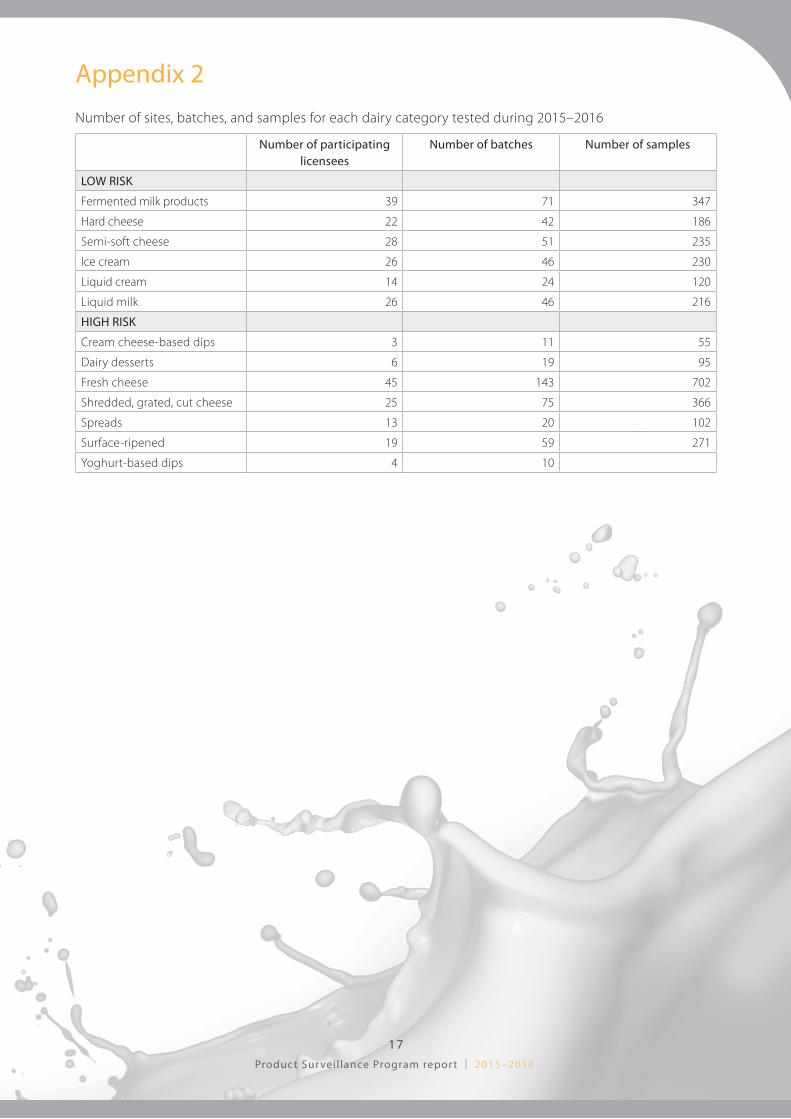
A summary of the number of samples collected from each product category, the analyses conducted on each category and the number of manufacturing sites submitting products in each category are provided in Appendix 2.
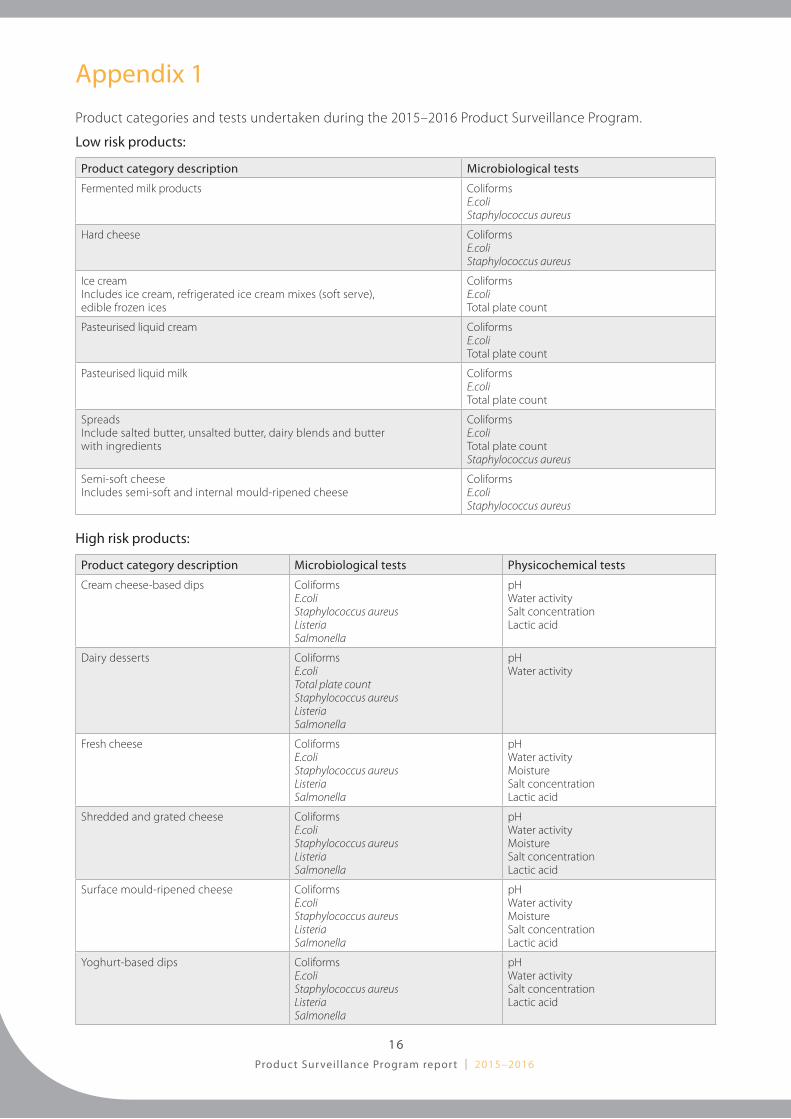
Physiochemical testingOne sample per batch of products classed as high risk was sampled and tested for relevant physicochemical parameters (water activity, pH, moisture content, salt and lactic acid concentration). The tests undertaken on each product categories are listed in Appendix 1.
BackgroundThe program is an annual survey of the microbiological status of dairy foods produced by licensed dairy manufacturers in Victoria.
In 2015–2016 the scope of the program was significantly expanded to include a component which focuses on selected high-risk dairy products. Changes included a review of the product categories to align with the Dairy Food Safety Victoria guideline Microbiological testing criteria – Minimum testing requirements for manufacturers of dairy food products,2 and sampling at levels consistent with requirements of Standard 1.6.1 (Schedule 27) of the Code.
Measurement of selected chemical parameters was introduced to the program in 2015–2016 for high-risk products.
Product testing conducted during the program is additional to the manufacturers’ normal in-house testing as detailed in their individual food safety programs. As a compliance monitoring
tool, the expanded program adds to the data indicating effective implementation of food safety programs and provides additional verification of the food safety system.
Analysis of the data provides DFSV with enhanced understanding of food safety risk across the industry at product and manufacturer level and informs technical support activities.
The testing program has been expanded to focus on the microbiological status of high-risk dairy products.
5Product Surveil lance Program report | 2015–2016
Results and discussion
Microbiological testing
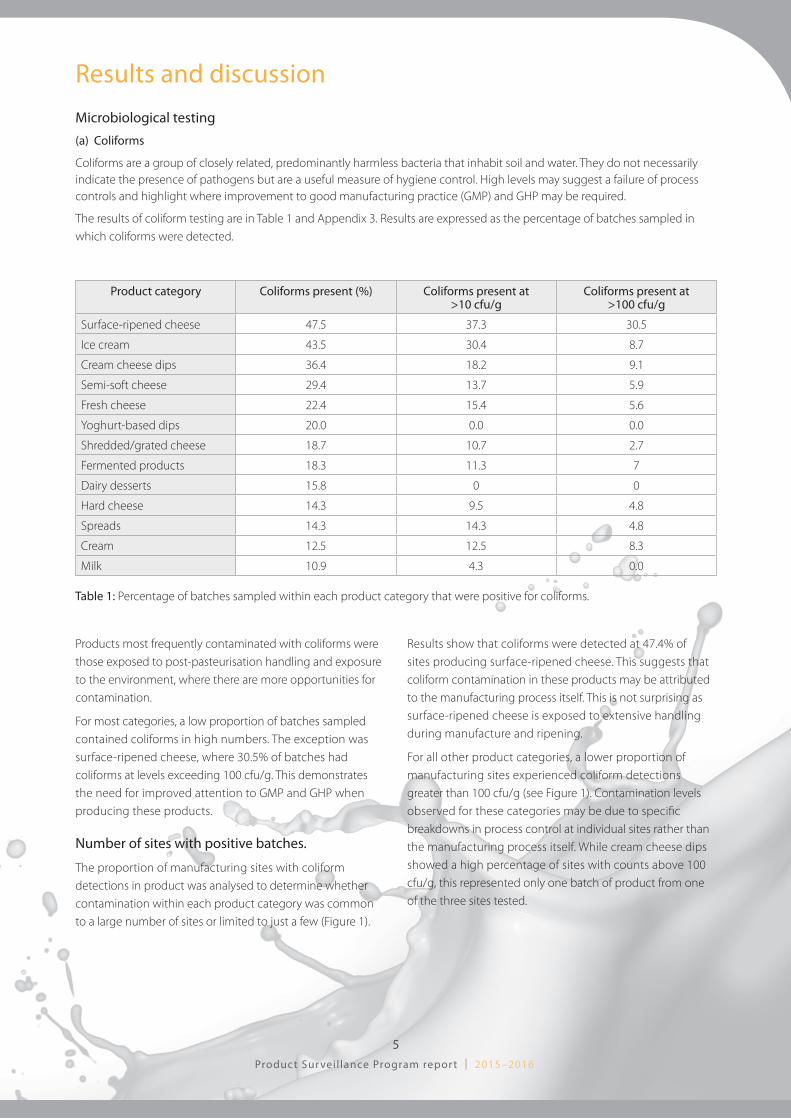
(a) Coliforms
Coliforms are a group of closely related, predominantly harmless bacteria that inhabit soil and water. They do not necessarily indicate the presence of pathogens but are a useful measure of hygiene control. High levels may suggest a failure of process controls and highlight where improvement to good manufacturing practice (GMP) and GHP may be required.
The results of coliform testing are in Table 1 and Appendix 3. Results are expressed as the percentage of batches sampled in which coliforms were detected.
Products most frequently contaminated with coliforms were those exposed to post-pasteurisation handling and exposure to the environment, where there are more opportunities for contamination.
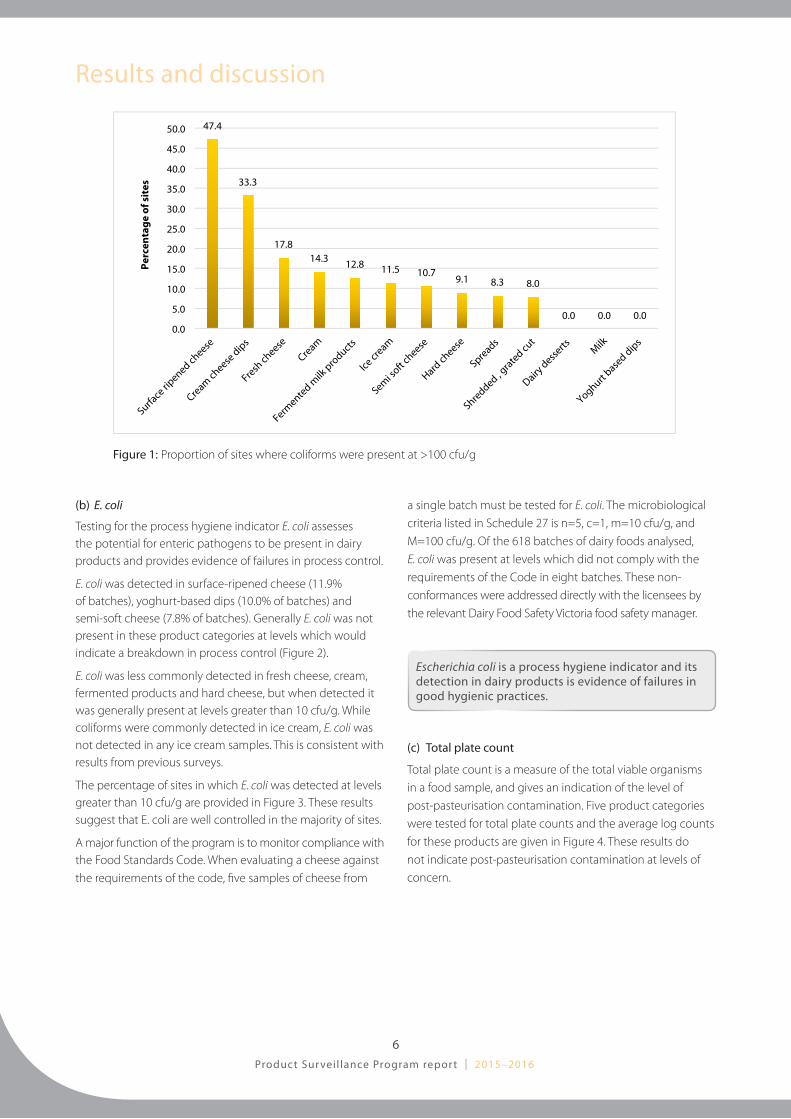
For most categories, a low proportion of batches sampled contained coliforms in high numbers. The exception was surface-ripened cheese, where 30.5% of batches had coliforms at levels exceeding 100 cfu/g. This demonstrates the need for improved attention to GMP and GHP when producing these products.
Number of sites with positive batches.
The proportion of manufacturing sites with coliform detections in product was analysed to determine whether contamination within each product category was common to a large number of sites or limited to just a few (Figure 1).
Results show that coliforms were detected at 47.4% of sites producing surface-ripened cheese. This suggests that coliform contamination in these products may be attributed to the manufacturing process itself. This is not surprising as surface-ripened cheese is exposed to extensive handling during manufacture and ripening.
For all other product categories, a lower proportion of manufacturing sites experienced coliform detections greater than 100 cfu/g (see Figure 1). Contamination levels observed for these categories may be due to specific breakdowns in process control at individual sites rather than the manufacturing process itself. While cream cheese dips showed a high percentage of sites with counts above 100 cfu/g, this represented only one batch of product from one of the three sites tested.
Product category Coliforms present (%) Coliforms present at >10 cfu/g
Coliforms present at >100 cfu/g
Surface-ripened cheese 47.5 37.3 30.5
Ice cream 43.5 30.4 8.7
Cream cheese dips 36.4 18.2 9.1
Semi-soft cheese 29.4 13.7 5.9
Fresh cheese 22.4 15.4 5.6
Yoghurt-based dips 20.0 0.0 0.0
Shredded/grated cheese 18.7 10.7 2.7
Fermented products 18.3 11.3 7
Dairy desserts 15.8 0 0
Hard cheese 14.3 9.5 4.8
Spreads 14.3 14.3 4.8
Cream 12.5 12.5 8.3
Milk 10.9 4.3 0.0
Table 1: Percentage of batches sampled within each product category that were positive for coliforms.
6Product Surveil lance Program report | 2015–2016
(c) Total plate count
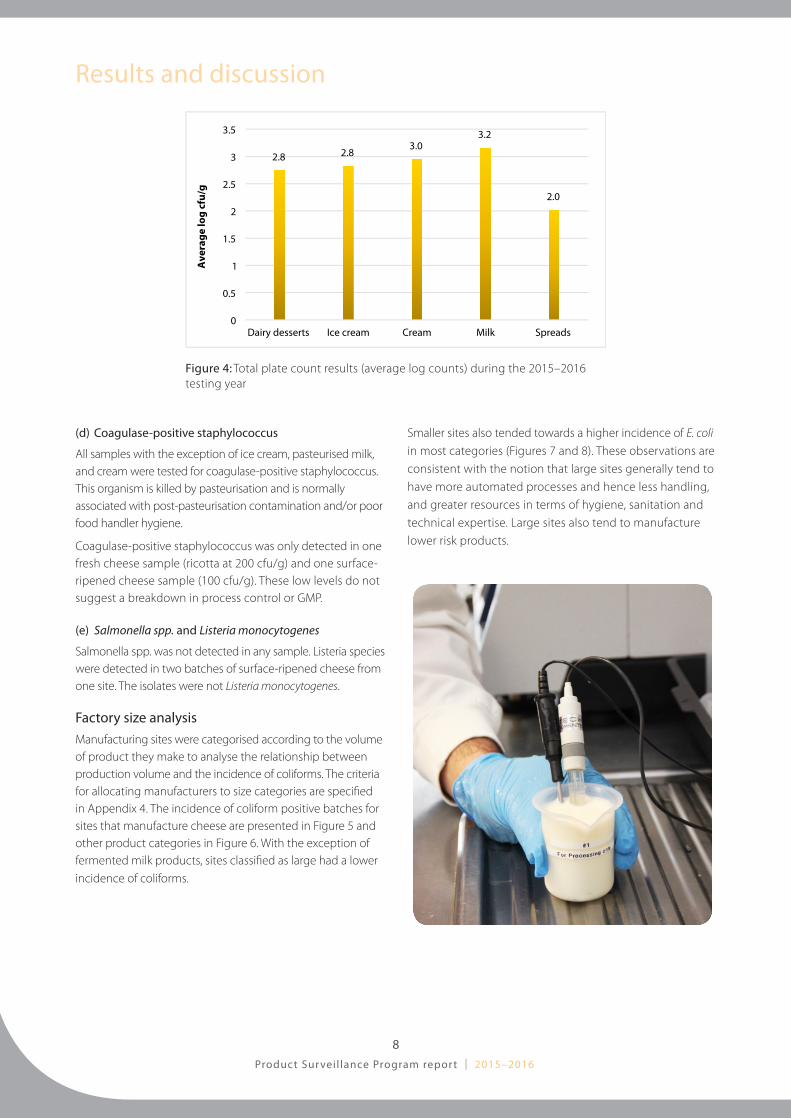
Total plate count is a measure of the total viable organisms in a food sample, and gives an indication of the level of post-pasteurisation contamination. Five product categories were tested for total plate counts and the average log counts for these products are given in Figure 4. These results do not indicate post-pasteurisation contamination at levels of concern.
(b) E. coli
Testing for the process hygiene indicator E. coli assesses the potential for enteric pathogens to be present in dairy products and provides evidence of failures in process control.
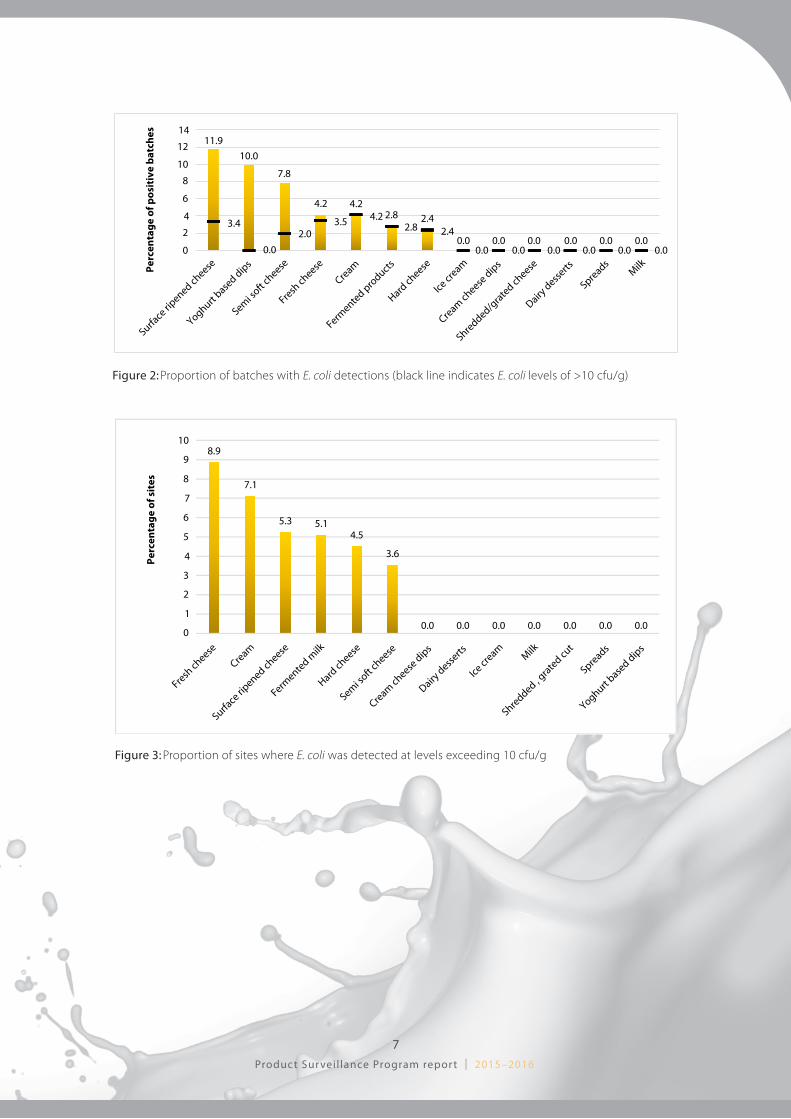
E. coli was detected in surface-ripened cheese (11.9% of batches), yoghurt-based dips (10.0% of batches) and semi-soft cheese (7.8% of batches). Generally E. coli was not present in these product categories at levels which would indicate a breakdown in process control (Figure 2).
E. coli was less commonly detected in fresh cheese, cream, fermented products and hard cheese, but when detected it was generally present at levels greater than 10 cfu/g. While coliforms were commonly detected in ice cream, E. coli was not detected in any ice cream samples. This is consistent with results from previous surveys.
The percentage of sites in which E. coli was detected at levels greater than 10 cfu/g are provided in Figure 3. These results suggest that E. coli are well controlled in the majority of sites.
A major function of the program is to monitor compliance with the Food Standards Code. When evaluating a cheese against the requirements of the code, five samples of cheese from
a single batch must be tested for E. coli. The microbiological criteria listed in Schedule 27 is n=5, c=1, m=10 cfu/g, and M=100 cfu/g. Of the 618 batches of dairy foods analysed, E. coli was present at levels which did not comply with the requirements of the Code in eight batches. These non-conformances were addressed directly with the licensees by the relevant Dairy Food Safety Victoria food safety manager.
Escherichia coli is a process hygiene indicator and its detection in dairy products is evidence of failures in good hygienic practices.
Figure 1: Proportion of sites where coliforms were present at >100 cfu/g
Results and discussion
7Product Surveil lance Program report | 2015–2016
Figure 2: Proportion of batches with E. coli detections (black line indicates E. coli levels of >10 cfu/g)
Figure 3: Proportion of sites where E. coli was detected at levels exceeding 10 cfu/g
8Product Surveil lance Program report | 2015–2016
(d) Coagulase-positive staphylococcus
All samples with the exception of ice cream, pasteurised milk, and cream were tested for coagulase-positive staphylococcus. This organism is killed by pasteurisation and is normally associated with post-pasteurisation contamination and/or poor food handler hygiene.
Coagulase-positive staphylococcus was only detected in one fresh cheese sample (ricotta at 200 cfu/g) and one surface-ripened cheese sample (100 cfu/g). These low levels do not suggest a breakdown in process control or GMP.
(e) Salmonella spp. and Listeria monocytogenes
Salmonella spp. was not detected in any sample. Listeria species were detected in two batches of surface-ripened cheese from one site. The isolates were not Listeria monocytogenes.
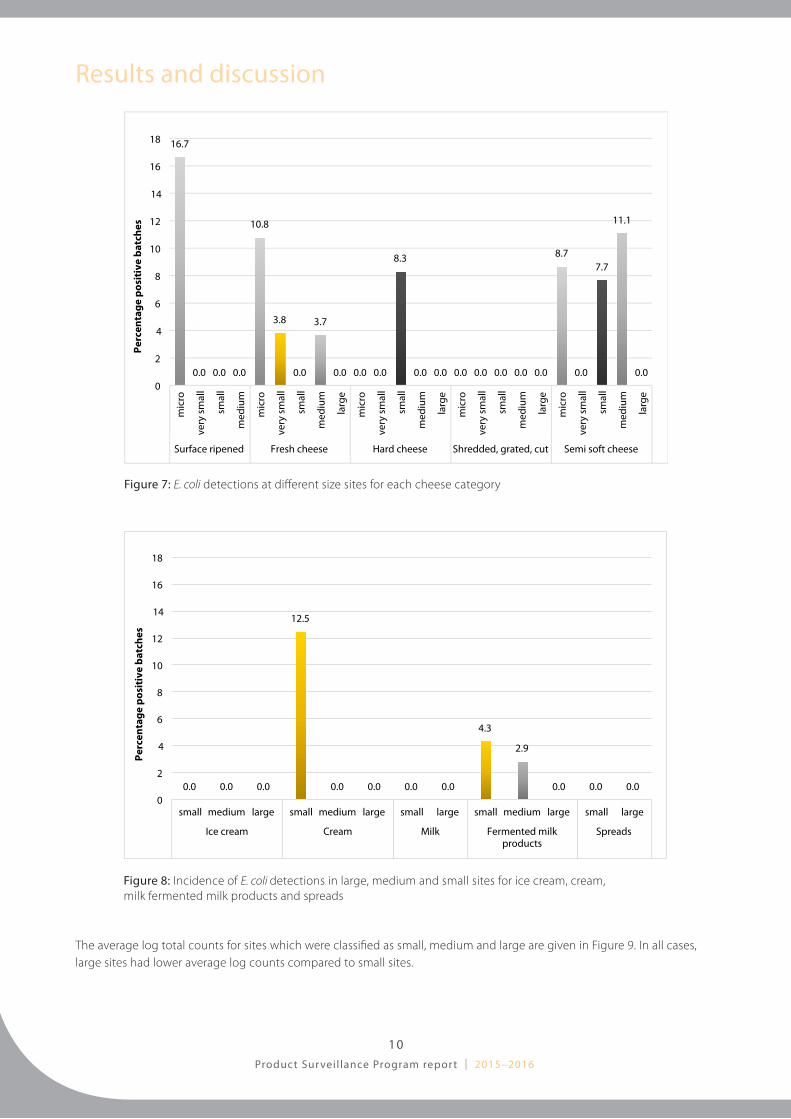
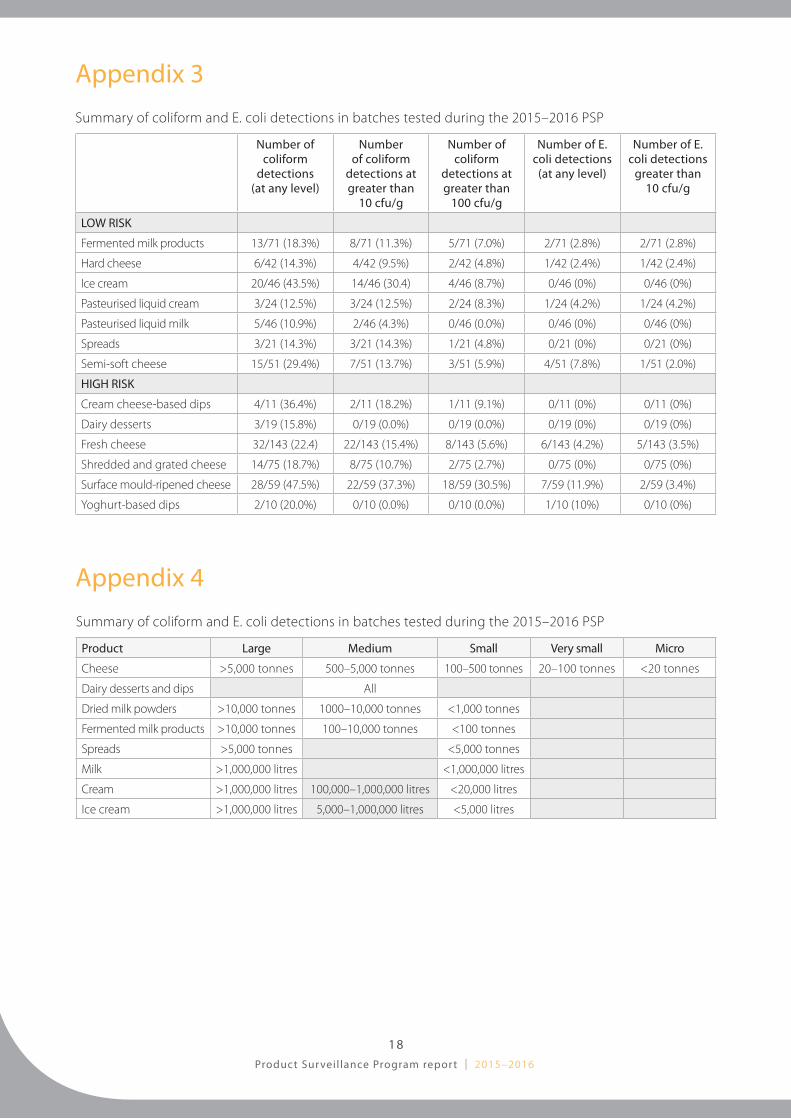
Factory size analysisManufacturing sites were categorised according to the volume of product they make to analyse the relationship between production volume and the incidence of coliforms. The criteria for allocating manufacturers to size categories are specified in Appendix 4. The incidence of coliform positive batches for sites that manufacture cheese are presented in Figure 5 and other product categories in Figure 6. With the exception of fermented milk products, sites classified as large had a lower incidence of coliforms.
Smaller sites also tended towards a higher incidence of E. coli in most categories (Figures 7 and 8). These observations are consistent with the notion that large sites generally tend to have more automated processes and hence less handling, and greater resources in terms of hygiene, sanitation and technical expertise. Large sites also tend to manufacture lower risk products.
Figure 4: Total plate count results (average log counts) during the 2015–2016 testing year
Results and discussion
9Product Surveil lance Program report | 2015–2016
Figure 5: Proportion of batches with coliform detections at different size sites for each cheese category
Figure 6: Proportion of batches with coliform detections at different size sites for ice cream, cream, milk fermented milk products and spreads
10Product Surveil lance Program report | 2015–2016
Figure 8: Incidence of E. coli detections in large, medium and small sites for ice cream, cream, milk fermented milk products and spreads
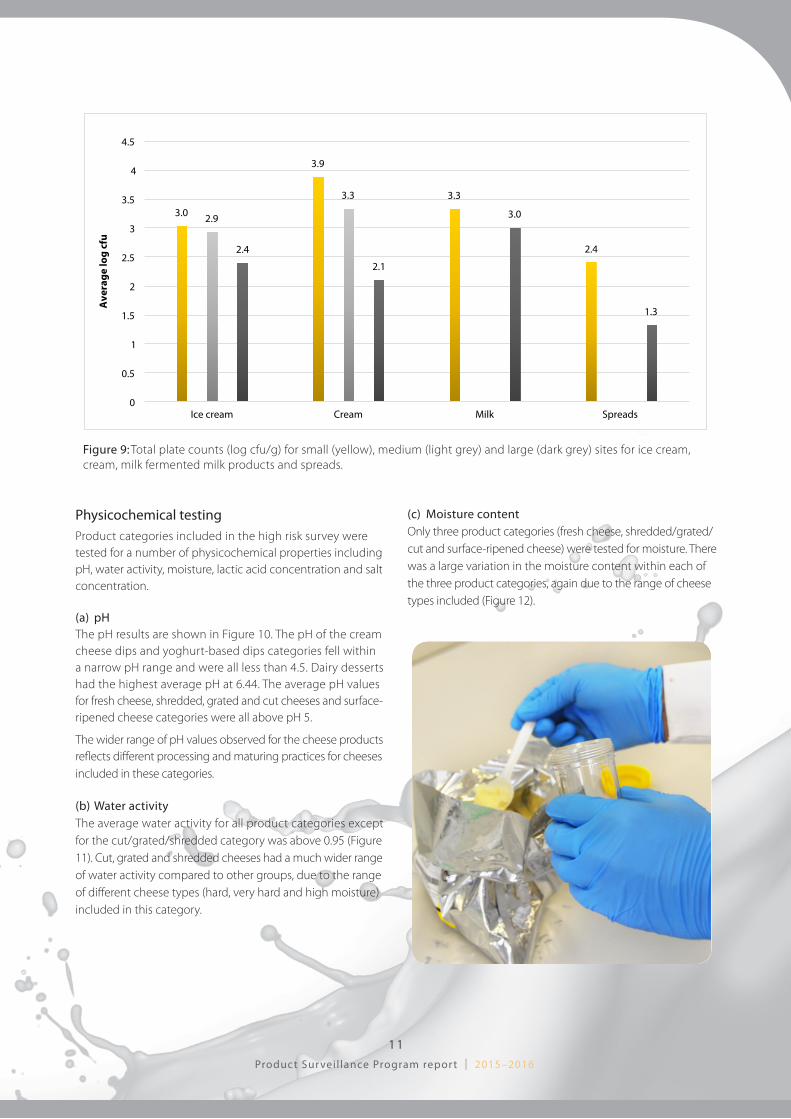
The average log total counts for sites which were classified as small, medium and large are given in Figure 9. In all cases, large sites had lower average log counts compared to small sites.
Figure 7: E. coli detections at different size sites for each cheese category
Results and discussion
11Product Surveil lance Program report | 2015–2016
Figure 9: Total plate counts (log cfu/g) for small (yellow), medium (light grey) and large (dark grey) sites for ice cream, cream, milk fermented milk products and spreads.
Physicochemical testingProduct categories included in the high risk survey were tested for a number of physicochemical properties including pH, water activity, moisture, lactic acid concentration and salt concentration.
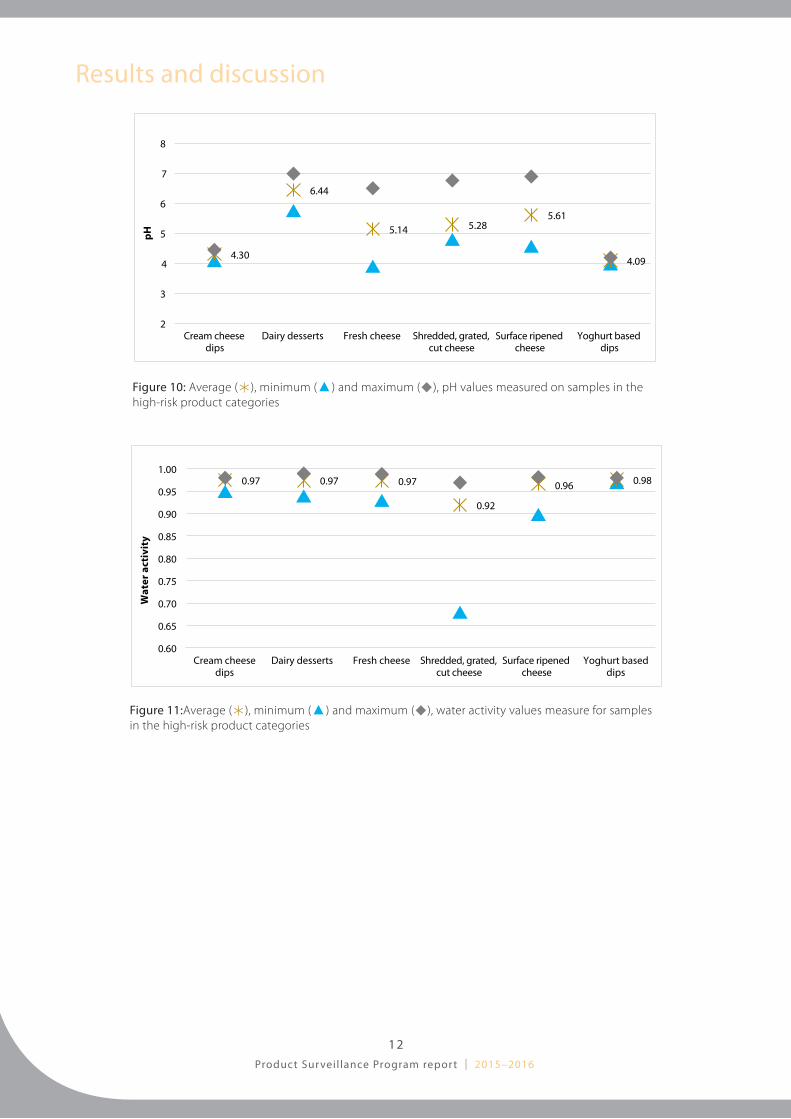
(a) pHThe pH results are shown in Figure 10. The pH of the cream cheese dips and yoghurt-based dips categories fell within a narrow pH range and were all less than 4.5. Dairy desserts had the highest average pH at 6.44. The average pH values for fresh cheese, shredded, grated and cut cheeses and surface-ripened cheese categories were all above pH 5.
The wider range of pH values observed for the cheese products reflects different processing and maturing practices for cheeses included in these categories.
(b) Water activityThe average water activity for all product categories except for the cut/grated/shredded category was above 0.95 (Figure 11). Cut, grated and shredded cheeses had a much wider range of water activity compared to other groups, due to the range of different cheese types (hard, very hard and high moisture) included in this category.
(c) Moisture contentOnly three product categories (fresh cheese, shredded/grated/cut and surface-ripened cheese) were tested for moisture. There was a large variation in the moisture content within each of the three product categories, again due to the range of cheese types included (Figure 12).
12Product Surveil lance Program report | 2015–2016
4.30
6.44
5.14 5.28 5.61
4.09
2
3
4
5
6
7
8
Cream cheese dips
Dairy desserts Fresh cheese Shredded, grated, cut cheese
Surface ripened cheese
Yoghurt based dips
pH
0.97 0.97 0.97
0.92
0.96 0.98
0.60
0.65
0.70
0.75
0.80
0.85
0.90
0.95
1.00
Cream cheese dips
Dairy desserts Fresh cheese Shredded, grated, cut cheese
Surface ripened cheese
Yoghurt based dips
Wat
er a
ctiv
ity
Figure 10: Average (Ú), minimum (�) and maximum (), pH values measured on samples in the high-risk product categories
Figure 11:Average (Ú), minimum (�) and maximum (), water activity values measure for samples in the high-risk product categories
Results and discussion

13Product Surveil lance Program report | 2015–2016
59.90
35.50
51.33
0
10
20
30
40
50
60
70
80
90
100
Fresh cheese Shredded, grated, cut cheese Surface ripened cheese
Perc
enta
ge m
oist
ure
Figure 12:Average (Ú), minimum (�) and maximum () moisture values for samples in the high-risk product categories
1.34 1.15
1.99 1.61
0.69
0.0
1.0
2.0
3.0
4.0
5.0
6.0
7.0
8.0
9.0
Cream cheese dips Fresh cheese Yoghurt based dips
Salt
con
cetr
atio
n (%
)
Shredded, grated,cut cheese
Surface ripenedcheese
Figure 13: Average (Ú), minimum (�) and maximum () salt concentration values for samples in the high-risk product categories
(d) Salt concentration
The salt concentration for samples tested during the 2015–2016 PSP are shown in Figure 13. Some samples were found to have a very high salt concentration, particularly those in the surface-ripened cheese and the shredded/grated/cut cheese categories.
14Product Surveil lance Program report | 2015–2016
308.2 455.9
1094.5
438.4
1131.1
0
500
1000
1500
2000
2500
Cream cheese dips Fresh cheese Shredded, grated, cut cheese
Surface ripenedcheese
Yoghurt based dips
Lact
ci a
cid
con
cent
rati
on (m
g/10
0g)
Figure 14: Average (Ú), minimum (�) and maximum () lactic acid concentration values for samples in the high-risk product categories
(e) Lactic acid concentration
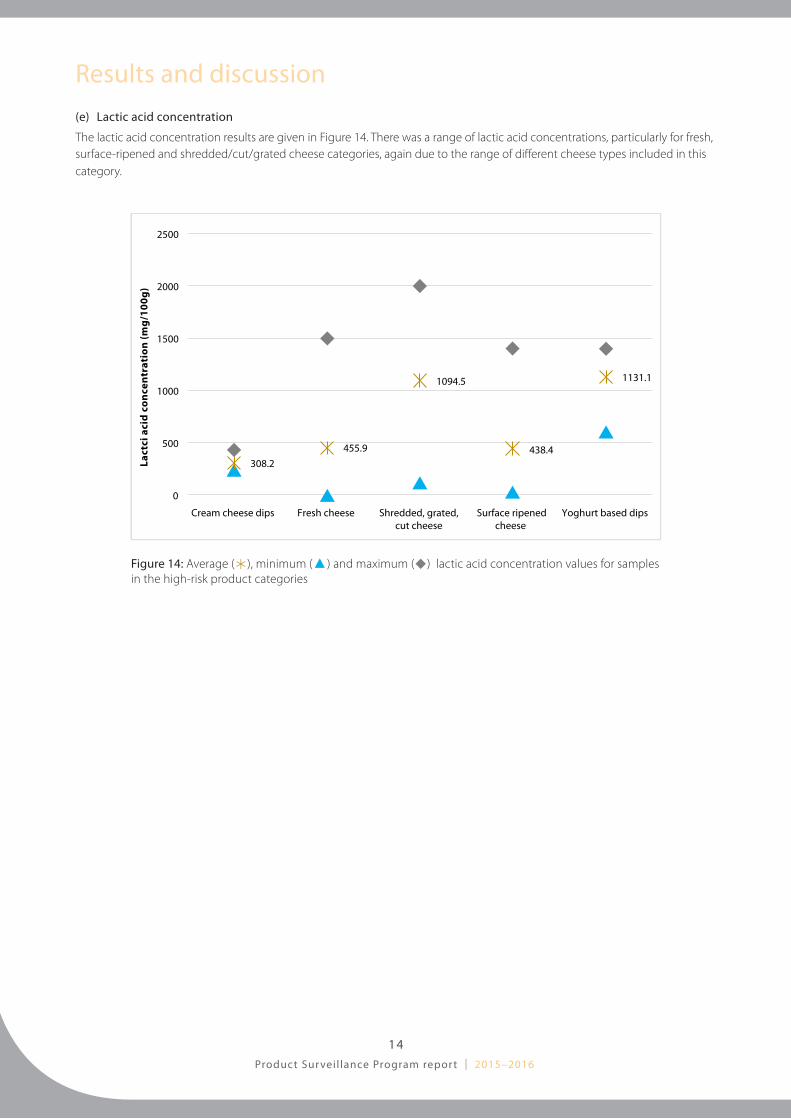
The lactic acid concentration results are given in Figure 14. There was a range of lactic acid concentrations, particularly for fresh, surface-ripened and shredded/cut/grated cheese categories, again due to the range of different cheese types included in this category.
Results and discussion
15Product Surveil lance Program report | 2015–2016
ReferencesFood Standards Australia New Zealand, Australia New Zealand Food Standards Code. FSANZ, Canberra, ACT.
Dairy Food Safety Victoria 20015, Microbiological testing criteria – Minimum testing requirements for manufacturers of dairy food products, DFSV, Victoria.
ConclusionThe Dairy Food Safety Victoria 2015–2016 Product Surveillance Program found that the majority of Victorian-produced dairy products tested are of good microbiological quality.
The results show only eight of the 618 batches analysed during the program exceeded microbiological limits in the Australia New Zealand Food Standards Code.
Surface-ripened cheese was found to be particularly susceptible to both coliform and E. coli contamination. This category had a substantially higher incidence of both these organisms compared to other product types. It is expected that the extensive handling and environmental exposure of these types of products during manufacture provides opportunities for post-pasteurisation contamination. The results are particularly concerning because the physicochemical testing confirmed that the characteristics of products in this category were favourable to the growth of pathogenic bacteria.
Ice cream was also observed to have a high level of coliform contamination but no E. coli detections. This is a pattern that has been observed in previous testing programs, and demonstrates a need to improve hygienic practices. Further investigation is proposed.
The physicochemical data obtained provides valuable information which is being used for assessing the risk of pathogen growth in products and other technical support activities such as predictive modelling and risk assessments.
More than 98% of Victorian dairy products tested in the annual Product Surveillance Program met the requirements of the Food Standards Code.
16Product Surveil lance Program report | 2015–2016
Appendix 1
Product categories and tests undertaken during the 2015–2016 Product Surveillance Program.
Low risk products:
Product category description Microbiological tests
Fermented milk products ColiformsE.coliStaphylococcus aureus
Hard cheese ColiformsE.coliStaphylococcus aureus
Ice cream Includes ice cream, refrigerated ice cream mixes (soft serve), edible frozen ices
ColiformsE.coliTotal plate count
Pasteurised liquid cream ColiformsE.coliTotal plate count
Pasteurised liquid milk ColiformsE.coliTotal plate count
Spreads Include salted butter, unsalted butter, dairy blends and butter with ingredients
ColiformsE.coliTotal plate countStaphylococcus aureus
Semi-soft cheese Includes semi-soft and internal mould-ripened cheese
ColiformsE.coliStaphylococcus aureus
High risk products:
Product category description Microbiological tests Physicochemical tests
Cream cheese-based dips ColiformsE.coliStaphylococcus aureusListeriaSalmonella
pHWater activitySalt concentrationLactic acid
Dairy desserts ColiformsE.coliTotal plate countStaphylococcus aureusListeriaSalmonella
pHWater activity
Fresh cheese ColiformsE.coliStaphylococcus aureusListeriaSalmonella
pHWater activityMoistureSalt concentrationLactic acid
Shredded and grated cheese ColiformsE.coliStaphylococcus aureus ListeriaSalmonella
pHWater activityMoistureSalt concentrationLactic acid
Surface mould-ripened cheese ColiformsE.coliStaphylococcus aureusListeriaSalmonella
pHWater activityMoistureSalt concentrationLactic acid
Yoghurt-based dips ColiformsE.coliStaphylococcus aureusListeriaSalmonella
pHWater activitySalt concentrationLactic acid
17Product Surveil lance Program report | 2015–2016
Appendix 2
Number of sites, batches, and samples for each dairy category tested during 2015–2016
Number of participating licensees
Number of batches Number of samples
LOW RISK
Fermented milk products 39 71 347
Hard cheese 22 42 186
Semi-soft cheese 28 51 235
Ice cream 26 46 230
Liquid cream 14 24 120
Liquid milk 26 46 216
HIGH RISK
Cream cheese-based dips 3 11 55
Dairy desserts 6 19 95
Fresh cheese 45 143 702
Shredded, grated, cut cheese 25 75 366
Spreads 13 20 102
Surface-ripened 19 59 271
Yoghurt-based dips 4 10
18Product Surveil lance Program report | 2015–2016
Appendix 4
Summary of coliform and E. coli detections in batches tested during the 2015–2016 PSP
Product Large Medium Small Very small Micro
Cheese >5,000 tonnes 500–5,000 tonnes 100–500 tonnes 20–100 tonnes <20 tonnes
Dairy desserts and dips All
Dried milk powders >10,000 tonnes 1000–10,000 tonnes <1,000 tonnes
Fermented milk products >10,000 tonnes 100–10,000 tonnes <100 tonnes
Spreads >5,000 tonnes <5,000 tonnes
Milk >1,000,000 litres <1,000,000 litres
Cream >1,000,000 litres 100,000–1,000,000 litres <20,000 litres
Ice cream >1,000,000 litres 5,000–1,000,000 litres <5,000 litres
Appendix 3
Summary of coliform and E. coli detections in batches tested during the 2015–2016 PSP
Number of coliform
detections (at any level)
Number of coliform
detections at greater than
10 cfu/g
Number of coliform
detections at greater than
100 cfu/g
Number of E. coli detections
(at any level)
Number of E. coli detections
greater than 10 cfu/g
LOW RISK
Fermented milk products 13/71 (18.3%) 8/71 (11.3%) 5/71 (7.0%) 2/71 (2.8%) 2/71 (2.8%)
Hard cheese 6/42 (14.3%) 4/42 (9.5%) 2/42 (4.8%) 1/42 (2.4%) 1/42 (2.4%)
Ice cream 20/46 (43.5%) 14/46 (30.4) 4/46 (8.7%) 0/46 (0%) 0/46 (0%)
Pasteurised liquid cream 3/24 (12.5%) 3/24 (12.5%) 2/24 (8.3%) 1/24 (4.2%) 1/24 (4.2%)
Pasteurised liquid milk 5/46 (10.9%) 2/46 (4.3%) 0/46 (0.0%) 0/46 (0%) 0/46 (0%)
Spreads 3/21 (14.3%) 3/21 (14.3%) 1/21 (4.8%) 0/21 (0%) 0/21 (0%)
Semi-soft cheese 15/51 (29.4%) 7/51 (13.7%) 3/51 (5.9%) 4/51 (7.8%) 1/51 (2.0%)
HIGH RISK
Cream cheese-based dips 4/11 (36.4%) 2/11 (18.2%) 1/11 (9.1%) 0/11 (0%) 0/11 (0%)
Dairy desserts 3/19 (15.8%) 0/19 (0.0%) 0/19 (0.0%) 0/19 (0%) 0/19 (0%)
Fresh cheese 32/143 (22.4) 22/143 (15.4%) 8/143 (5.6%) 6/143 (4.2%) 5/143 (3.5%)
Shredded and grated cheese 14/75 (18.7%) 8/75 (10.7%) 2/75 (2.7%) 0/75 (0%) 0/75 (0%)
Surface mould-ripened cheese 28/59 (47.5%) 22/59 (37.3%) 18/59 (30.5%) 7/59 (11.9%) 2/59 (3.4%)
Yoghurt-based dips 2/10 (20.0%) 0/10 (0.0%) 0/10 (0.0%) 1/10 (10%) 0/10 (0%)

19Product Surveil lance Program report | 2015–2016
Dairy Food Safety VictoriaLevel 2, 969 Burke Road, Camberwell, Victoria 3124
Postal addressPO Box 8221, Camberwell North, Victoria 3124
Phone: + 61 3 9810 5900 Fax: + 61 3 9882 6860Email: [email protected]
This work is copyright. Apart from any use as permitted under the Copyright Act 1968, no part may be reproduced by any process without prior written
permission from Dairy Food Safety Victoria. Requests and inquiries concerning reproduction and rights should be addressed to the Communications
Manager.
This document is intended to be used as a general guide only and is not a comprehensive statement of all the relevant considerations with respect
to this food safety topic or your particular circumstances, nor does it comprise, or substitute for, legal or professional advice.
Dairy Food Safety Victoria does not guarantee the accuracy, reliability, currency or completeness of the information. Links to other websites are provided
as a service to users and do not constitute endorsement, nor are we able to give assurances of the accuracy of their content. DFSV accepts no legal liability
arising from, or connected to, any reliance on this document.