Embed Size (px)
Citation preview
Exhibit B
Metropolitan Washington Council of Governments (COG)
National Capital Region Transportation Planning Board (TPB)
Product Requirements Document for the TPB Travel Demand Forecasting Model, Generation 3, the Next-Generation Model
To be submitted with the Request for Information (RFI) for consultant services
May 25, 2018
Ref: tpb_tdfm_gen3_nextGen_model_prd_2018_v14_nwm.docx

Product Requirements Document for the TPB Travel Demand Forecasting Model, Generation 3, the
Next-Generation Model
May 25, 2018
About the TPB
The National Capital Region Transportation Planning Board (TPB) is the federally designated
metropolitan planning organization (MPO) for metropolitan Washington. It is responsible for developing
and carrying out a continuing, cooperative, and comprehensive transportation planning process in the
metropolitan area. Members of the TPB include representatives of the transportation agencies of the
states of Maryland and Virginia and the District of Columbia, 23 local governments, the Washington
Metropolitan Area Transit Authority, the Maryland and Virginia General Assemblies, and nonvoting
members from the Metropolitan Washington Airports Authority and federal agencies. The TPB is staffed
by the Department of Transportation Planning at the Metropolitan Washington Council of Governments
(COG).
About COG
The Metropolitan Washington Council of Governments (COG) is an independent, nonprofit association
that brings area leaders together to address major regional issues in the District of Columbia, suburban
Maryland, and Northern Virginia. COG’s membership is comprised of 300 elected officials from 23 local
governments, the Maryland and Virginia state legislatures, and U.S. Congress.
Credits
Director of COG’s Department of Transportation Planning (DTP): Kanti Srikanth
Director, Travel Forecasting and Emissions Analysis Program, DTP: Ronald Milone
Report Author: Mark Moran
Contributors: Ray Ngo, Ronald Milone
Oversight: COG/TPB Travel Forecasting Subcommittee
Acknowledgements
This publication was funded, in part, by grants from the District of Columbia Department of Transportation, the Maryland
Department of Transportation, the Virginia Department of Transportation, the Federal Highway Administration and the Federal
Transit Administration. The material herein does not necessarily reflect the views of the sponsoring agencies.
Accommodations Policy
Alternative formats of this document are available upon request. Visit www.mwcog.org/accommodations or call (202) 962-
3300 or (202) 962-3213 (TDD).
Title VI Nondiscrimination Policy
The Metropolitan Washington Council of Governments (COG) fully complies with Title VI of the Civil Rights Act of 1964 and
related statutes and regulations prohibiting discrimination in all programs and activities. For more information, to file a Title VI
related complaint, or to obtain information in another language, visit www.mwcog.org/nondiscrimination or call (202) 962-
3300.
El Consejo de Gobiernos del Área Metropolitana de Washington (COG) cumple con el Título VI de la Ley sobre los Derechos
Civiles de 1964 y otras leyes y reglamentos en todos sus programas y actividades. Para obtener más información, someter un
pleito relacionado al Título VI, u obtener información en otro idioma, visite www.mwcog.org/nondiscrimination o llame al (202)
962-3300.
Copyright © 2018 by the Metropolitan Washington Council of Governments
Ref: I:\ateam\model_dev\tpb_tdfm_gen3_nextGen
Product Requirements Document for the TPB Travel Demand Forecasting Model, Generation 3, the Next-Generation Model
i
Table of Contents
1 Introduction.................................................................................................................... 1
2 Purpose .......................................................................................................................... 1
2.1 RFI process ..........................................................................................................................2
2.2 RFP process .........................................................................................................................3
2.3 Categorization of functional and usability requirements in the PRD ......................................3
3 Background .................................................................................................................... 4
3.1 COG’s Department of Transportation Planning (DTP) ...........................................................4
3.2 Model development by TPB staff and consultants ................................................................4 3.2.1 Current TPB travel model ......................................................................................................................................... 5 3.2.2 Future TPB travel models ......................................................................................................................................... 7 3.2.3 Consultant assistance ............................................................................................................................................... 8
3.3 Strategic plan for improving the TPB travel demand model ..................................................9 3.3.1 Original plan ............................................................................................................................................................. 9 3.3.2 Updates to the plan ................................................................................................................................................ 12
3.4 Context ............................................................................................................................. 12 3.4.1 Transportation system in the Washington, D.C. metropolitan area ....................................................................... 12 3.4.2 Modeling environment ........................................................................................................................................... 14 3.4.3 Uses of the TPB travel model and policies that the Gen3 model would ideally address ........................................ 15 3.4.4 Observed data for estimation, calibration, and validation of travel models .......................................................... 17
4 Overview, timeline, phasing and budget of the contract ................................................ 20
4.1 Overview and timeline for the RFI and RFP ........................................................................ 20 4.1.1 RFI process details .................................................................................................................................................. 20 4.1.2 Comparison of the RFI and RFP processes .............................................................................................................. 21 4.1.3 Award of contract/Post RFP.................................................................................................................................... 21
4.2 Phasing ............................................................................................................................. 22
4.3 Expected budget ............................................................................................................... 23
4.4 Data for model calibration ................................................................................................. 23
5 Investigations ............................................................................................................... 23
5.1 Long-term goal for the travel demand model ..................................................................... 23
5.2 Investigations in the RFI .................................................................................................... 24
5.3 RFI: Use of consultant proposals ........................................................................................ 26
5.4 Investigations in the contract ............................................................................................ 26 5.4.1 Base investigations ................................................................................................................................................. 26
Product Requirements Document for the TPB Travel Demand Forecasting Model, Generation 3, the Next-Generation Model
ii
5.4.2 Other investigations ............................................................................................................................................... 27
6 Model requirements ..................................................................................................... 28
6.1 Functional requirements ................................................................................................... 28 6.1.1 Minimum requirement (**mandatory**) .............................................................................................................. 28 6.1.2 Model form (**mandatory**) ................................................................................................................................ 28 6.1.3 Travel modes represented ...................................................................................................................................... 29 6.1.4 Modeling capabilities that span more than one model step .................................................................................. 34 6.1.5 Model inputs ........................................................................................................................................................... 36 6.1.6 Socio-economic models .......................................................................................................................................... 39 6.1.7 Trip generation ....................................................................................................................................................... 39 6.1.8 Trip distribution ...................................................................................................................................................... 39 6.1.9 Mode choice ........................................................................................................................................................... 40 6.1.10 Trip assignment ...................................................................................................................................................... 41
6.2 Usability requirements ...................................................................................................... 42 6.2.1 Model run time ....................................................................................................................................................... 42 6.2.2 Usage by TPB staff and other local-area modelers (state DOTs, local governments, consultants) ........................ 42 6.2.3 Sub-area analysis .................................................................................................................................................... 43
6.3 Technical requirements ..................................................................................................... 43 6.3.1 Hardware ................................................................................................................................................................ 43 6.3.2 Current and future software used .......................................................................................................................... 43 6.3.3 Version control system and bug-tracking software ................................................................................................ 44 6.3.4 Software to manage transportation networks used by the travel model .............................................................. 44
6.4 Support requirements ....................................................................................................... 44 6.4.1 Expectations about TPB staff and consultant support (**mandatory**) ............................................................... 44
6.5 Interaction requirements................................................................................................... 45
6.6 Summary .......................................................................................................................... 46
7 Deliverables .................................................................................................................. 48
7.1 Vendor’s model checklist regarding proposed modeling solution for Gen3 model ............... 48
7.2 Vendor’s report containing proposed modeling solution for Gen3 model ............................ 48
Product Requirements Document for the TPB Travel Demand Forecasting Model, Generation 3, the Next-Generation Model
iii
List of Figures Figure 1 Modeled area for the TPB Ver. 2.3 travel model ............................................................................ 7
Figure 2 Nesting structure of the nested-logit mode choice model in the Version 2.3 travel model ........ 32
Figure 3 Investigations ................................................................................................................................ 46
List of Tables Table 1 Naming conventions for the TPB travel demand forecasting model (TDFM): Past, current, and
future .................................................................................................................................................... 6
Table 2 MPOs considered to be peers of the TPB*..................................................................................... 10
Table 3 Strategic plan for the TPB regional travel demand model: Original plan ...................................... 11
Table 4 Strategic plan for the TPB regional travel demand model: Revised plan ...................................... 12
Table 5 Current proposed timeline: Overview ........................................................................................... 20
Table 6 Cross classification of travel demand models by demand/supply versus aggregate and
disaggregate ....................................................................................................................................... 24
Table 7 Division of labor: Expectations about the responsible party for various modeling tasks .............. 45
Table 8 Summary table: Categorization of functional and usability requirements in the PRD (See Sections
2.3 and 6 of the PRD).......................................................................................................................... 47
Product Requirements Document for the TPB Travel Demand Forecasting Model, Generation 3, the Next-Generation Model
iv
1. Introduction 1
1 Introduction The National Capital Region Transportation Planning Board (NCRTPB or simply TPB) is the federally
designated Metropolitan Planning Organization (MPO) for the Washington, D.C. metropolitan area. The
TPB is also one of several policy boards that operate at the Metropolitan Washington Council of
Governments (MWCOG or simply COG). COG is the administrative agent for the TPB, and the TPB is
staffed by COG’s Department of Transportation Planning (DTP). The TPB staff, with some consultant
assistance, develops, maintains, applies, and improves the TPB’s family of regional travel demand
forecasting models, which are used for regional, long-range transportation planning in the metropolitan
Washington region. These regional travel demand models are developed under the guidance of the
Travel Forecasting Subcommittee (TFS), a subcommittee of TPB’s Technical Committee.
At any given time, the TPB staff is maintaining at least two models:
• The adopted, production-use travel model and
• One or more developmental travel models, which may become production-use model(s) in the
future.
The production-use model is the one that is used in planning studies conducted by COG/TPB and is
made available to outside parties.1 The developmental models are those that are currently under
development by TPB staff, and, in some cases, consultants under contract with COG. The developmental
models are generally not made available to outside parties, since these models are not yet considered
finished products. The adopted, production-use, regional travel model is used by TPB staff for many
planning activities, including the following:
• Development of the TPB’s regional long-range transportation plan (LRTP), currently known as
“Visualize 2045.”
• Evaluation of the performance of the LRTP.
• Air quality conformity analysis and determination of the LRTP and its associated Transportation
Improvement Program (TIP).
• Scenario studies, i.e., changes in forecasted land use and/or transportation networks.
• Transportation project planning studies.
Many project planning studies are conducted by consultants, but TPB staff also perform some of these,
typically under the TPB’s Technical Assistance programs, set up for the District, Maryland, Virginia, and
the Washington Metropolitan Area Transit Authority (WMATA or Metro).
2 Purpose The purpose of this document is to serve as a product requirements document (PRD) for the TPB
Travel Demand Forecasting Model, Generation 3 (TPB TDFM Gen3), also currently known as the TPB
Next-Generation (NextGen) travel model. This document presents the functionality that is sought by
1 The procedures for requesting the model can be found on the “Data Requests” webpage
(https://www.mwcog.org/transportation/data-and-tools/modeling/data-requests/).
2. Purpose 2
TPB staff in the Gen3 model. This document will be part of the request for information (RFI) that is
issued to seek consultant assistance. The RFI is to be followed by a request for proposals (RFP).
It is expected that the Gen3 model will use one of the following model forms:
• Trip-based
• Tour-based
• Activity-based
• Hybrid of these
The current TPB travel model is a trip-based model (see Section 3, “Background”). Trip-based models
have been widely used since the 1970s. They are the most common type of regional travel demand
model. However, academics and others have pointed to shortcomings with these models.2 Over the last
10-15 years, many large urban areas are moving toward activity-based models (ABMs), which have some
theoretical advantages over trip-based models, but also added complexity and cost.3 Tour-based models
chain daily trips into one or more tours. All ABMs are tour-based models, but not all tour-based models
are ABMs. Purely tour-based models are not as common as ABMs, but there are some examples in the
U.S.4 Lastly, another model form that is gaining some traction is the hybrid model, which includes
elements of both aggregate, trip-based models and disaggregate ABMs.5
2.1 RFI process
The RFI process has two goals. First, to solicit input from interested vendors/consultants about their
proposed solution to our modeling needs, as described in this PRD. Second, to help COG/TPB staff
decide on the preferred direction for model upgrades that will be specified in the upcoming RFP. COG,
working as the administrative agent for the TPB, will issue the RFI. When the RFI and PRD are ready, they
will be posted on COG’s Contracts and Purchasing website (https://www.mwcog.org/purchasing-and-
bids/cog-bids-and-rfps/). After that, the RFI and PRD will be posted on the Mid-Atlantic Purchasing Team
(MAPT) website (www.midatlanticpurchasing.net). Vendors interested in following RFIs/RFPs should go
to the MAPT website and register on the vendor registration system (VRS) and sign up for automatic
notifications about new postings. In response to the RFI, vendors may choose to submit to COG a
2 Transportation Research Board, Committee for Determination of the State of the Practice in Metropolitan Area
Travel Forecasting, “Special Report 288, Metropolitan Travel Forecasting: Current Practice and Future Direction”
(Washington, D.C.: Transportation Research Board of the National Academies, 2007),
http://onlinepubs.trb.org/onlinepubs/sr/sr288.pdf. 3 See, for example, Joe Castiglione, Mark Bradley, and John Gliebe, “Activity-Based Travel Demand Models: A
Primer,” SHRP 2 Capacity Project C46 (Washington, D.C.: Transportation Research Board of the National
Academies, 2015), http://www.trb.org/main/blurbs/170963.aspx. 4 See, for example, Parsons Brinckerhoff Quade & Douglas, Inc., “New York Best Practice Model (NYBPM),”
General Final Report, Transportation Models and Data Initiative (New York, New York: New York Metropolitan
Transportation Council, January 30, 2005), http://www.nymtc.org/project/bpm/model/bpm_finalrpt.pdf; William G.
Allen Jr., “Simplified Tour-Based Model,” July 26, 2017. 5 See, for example, Vincent Bernardin, “The Spectrum of Model Designs,” March 28, 2018; Gaurav Vyas et al.,
“Stepping Closer to ABM: Hybrid 4-Step Models,” Pre-Print Paper Submitted for Presentation at the 97th Annual
Meeting of the Transportation Research Board, January 2018, and/or Publication in the Transportation Research
Record (Transportation Research Board 97th Annual Meeting, January 7-11, 2018, Washington, D.C., 2017), Paper
#18-05303.
2. Purpose 3
“vendor response,” which is essentially a proposed plan for the TPB Gen3 travel demand forecasting
model (TDFM). The vendor response to this RFI will consist of two items:
1. A concise report that explains and justifies the vendor’s proposed approach for the TPB’s Gen3
travel demand forecasting model.
2. A completed model checklist that describes the vendor’s proposed approach for the TPB’s Gen3
travel demand forecasting model. A blank copy of the model checklist will be provided along
with the PRD.
More details about these two items can be found in section 7 of this report (“Deliverables”). In general,
however, the checklist will provide a short summary of the proposed plan and the report will allow the
vendor the opportunity to further describe and support the responses in the checklist, and to present
additional information that the vendor feels is relevant.
The RFI is meant to be an information-gathering period, where TPB staff may follow up with one or
more vendors about proposed modeling solution(s). As mentioned later in this report, the RFI is not
being used for pre-qualification in the RFP, i.e., vendors are not required to respond to the RFI in order
to respond to the upcoming RFP. However, it is believed that vendors who participate in the RFI will be
in a more informed position to provide a compelling proposal in the RFP stage. The RFI process is
described in more detail later in this report.
2.2 RFP process
After the RFI process is completed, TPB staff plans to choose a selected modeling approach (e.g., trip-
based, tour-based, activity-based, or hybrid), and then issue an RFP for consultant assistance to develop
a model, based on the chosen approach. The RFP will include a scope of work (SOW). The goal of the
RFP process is to select one or more vendors/consultants to develop the Gen3 travel demand model.
More discussion about the RFI and RFP processes can be found in section 4.1 (“Overview and timeline
for the RFI and RFP”).
2.3 Categorization of functional and usability requirements in the PRD
In the PRD, each requirement or specification (“spec”) is rated by TPB staff as follows:
• Mandatory or non-mandatory: Mandatory requirements must be met to have a satisfactory
model. For non-mandatory items, consultants may propose which requirements should be part
of an updated travel model.
• Priority: For non-mandatory requirements, TPB staff has generally rated each requirement as
having one of three priority levels: High, medium, and low. Given limits on time and resources,
consultants may need to propose an updated model that includes only a subset of the non-
mandatory requirements. The three priority levels will help consultants choose which
requirements/updates to include in their proposal for the Gen3 model. The priority values
indicated in the RFI process could shift somewhat in the RFP process, depending on consultant
input in the RFI.
3. Background 4
3 Background
3.1 COG’s Department of Transportation Planning (DTP)
As noted earlier, COG’s Department of Transportation Planning (DTP) provides the staff to the National
Capital Transportation Planning Board (TPB). COG has about 120 staff, and DTP staff (TPB staff)
comprises about half the COG staff and about two-thirds of the COG budget. Like all MPOs, the TPB
develops a Unified Planning Work Program (UPWP). The most recent UPWP can be found on the COG
website (https://www.mwcog.org/transportation/plans/upwp/).
DTP is divided into five programmatic teams. One of these deals with travel demand forecasting: the
Travel Forecasting and Emissions Analysis Team, headed by Ron Milone. This team has 16 employees,
including its program director. Fourteen of these employees work in the following two groups:
• Model Development Group, headed by Mark Moran (6 staff)
• Model Application Group, headed by Dusan Vuksan (8 staff)
The mission of the Model Development Group is to develop, maintain, and improve the TPB’s regional
travel demand forecasting model. This is often done with some consultant support, though no
consultant is currently under contract. The mission of the Model Application Group is to apply the TPB’s
regional travel demand model, for example to conduct the air quality conformity analysis of the LRTP
and TIP, and to conduct project planning studies.
3.2 Model development by TPB staff and consultants
TPB staff has a long history of developing regional travel demand models for use in the long-range
transportation planning activities in the metropolitan Washington region, spanning back to the 1970s,
when TPB staff used federally developed travel demand forecasting software, known as the Urban
Transportation Planning System (UTPS). UTPS was designed to run on a mainframe computer and was
developed by the federal government.6 In the late 1970s and the 1980s, TPB staff developed and used a
travel forecasting software package known as TRIMS,7 which was compatible with UTPS and ran on a
mainframe computer. At about the same time, in the 1980s, the federal government decided to stop
developing and supporting travel demand forecasting software. Instead, the federal government
encouraged private vendors to develop travel demand forecasting software for personal computers.
The first TPB travel demand model for a personal computer was developed by TPB staff in the early
1990s and was implemented in MINUTP.8 Following that initial model, TPB staff developed a series of
travel demand forecasting models that ran on personal computers (and later computer servers). One of
the first of these was developed in 1994 by TPB staff.9 Although it did not have a specific name when it
6 UTPS was developed by the U.S. Urban Mass Transit Administration (UMTA) -- now known as the Federal
Transit Administration (FTA) -- and the Federal Highway Administration (FHWA). 7 William W. Mann, “TRIMS - Four Steps: One Execution,” ITE Journal 52, no. 12 (December 1982): 13–18,
http://www.ite.org/membersonly/itejournal/pdf/JLA82A13.pdf. 8 “Application of COG/TPB Travel Modeling Procedures within the MINUTP Microcomputer Environment,”
Project Report (Washington, D.C.: Metropolitan Washington Council of Governments, National Capital Region
Transportation Planning Board, October 1990). 9 Ronald Milone, “FY-94 Development Program for MWCOG Travel Forecasting Models, Volume A: Current
Applications,” Draft (Washington, D.C.: Metropolitan Washington Council of Governments, National Capital
Region Transportation Planning Board, June 30, 1994).
3. Background 5
was developed, this model later became known as the “Version 1” model (see the first row of Table 1).
This model was developed from about 1989 to 1994, and was used in production from about 1994 to
2001. The model was estimated using the 1987-1988 COG Home Interview Survey and other related
data sets.
Following the “Version 1” model came a series of models in the “Version 2” model family. We are now
also referring to this family as “Generation 2” or Gen2. First, there was the Version 2.0 model, which
continued to use MINUTP software. Next, the Version 2.1 model was developed. For this model, TPB
staff migrated the model application software, from MINUTP to TP+.10 This was followed by the Ver. 2.2
model and the Ver. 2.3 model. Each of these is listed in Table 1.
3.2.1 Current TPB travel model
The current adopted, production-use travel demand forecasting model is called the TPB Travel Demand
Forecasting Model, Generation 2, Version 2.3.70 (TPB TDFM Gen2, Ver. 2.3.70). This is shown in bold in
Table 1. The Ver. 2.3 model was calibrated to year-2007 conditions 11 and was validated to year-2010
conditions.12 The Ver. 2.3 model has a user’s guide that is updated on a regular basis, and the latest
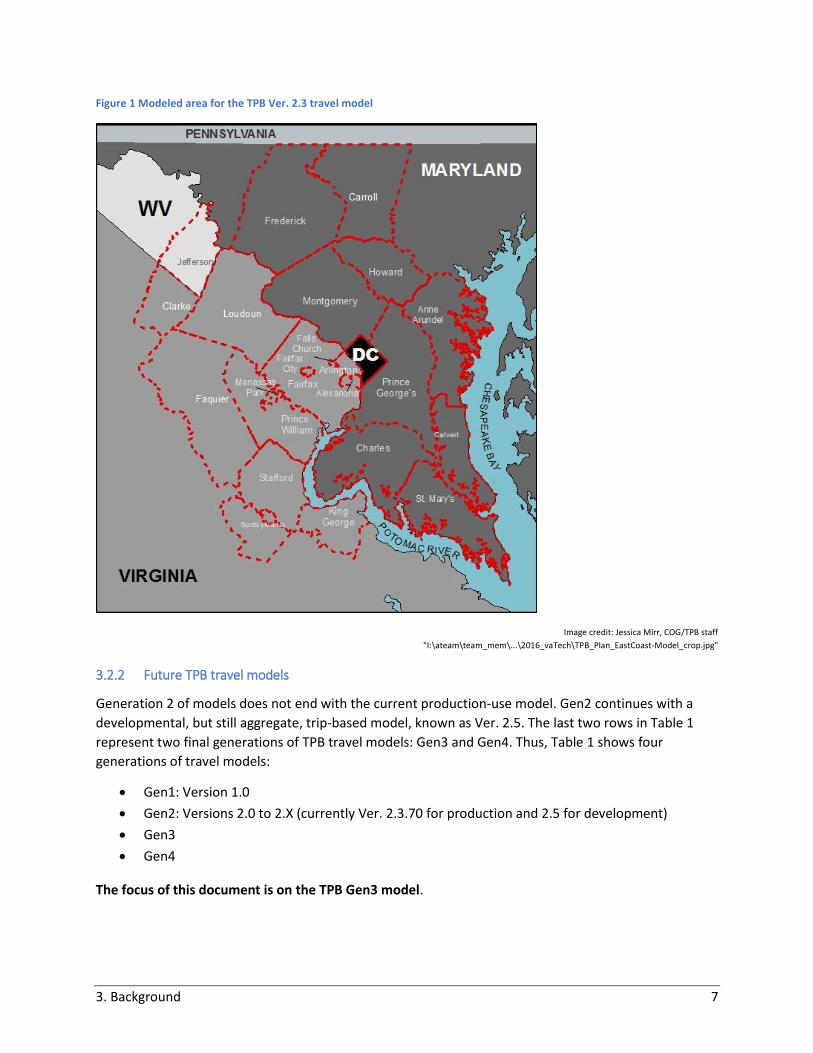
guide was developed in November 2017.13 The modeled area for the Ver. 2.3 travel model is shown in
Figure 1. The modeled area includes 6,800 square miles, and covers the District of Columbia, suburban
Maryland, Northern Virginia, and one county in West Virginia (see Figure 1).
10 Ronald Milone, “Version 2.1/TP+ Travel Model Calibration Report” (Washington, D.C.: Metropolitan
Washington Council of Governments, National Capital Region Transportation Planning Board, November 15,
2002). 11 Ronald Milone et al., “Calibration Report for the TPB Travel Forecasting Model, Version 2.3, on the 3,722-Zone
Area System,” Final Report (Washington, D.C.: Metropolitan Washington Council of Governments, National
Capital Region Transportation Planning Board, January 20, 2012), https://www.mwcog.org/transportation/data-and-
tools/modeling/model-documentation/. 12 Ronald Milone to Files, “2010 Validation of the Version 2.3 Travel Demand Model,” Memorandum, June 30,
2013. 13 Ronald Milone, Mark Moran, and Meseret Seifu, “User’s Guide for the COG/TPB Travel Demand Forecasting
Model, Version 2.3.70: Volume 1 of 2: Main Report and Appendix A (Flowcharts)” (Washington, D.C.:
Metropolitan Washington Council of Governments, National Capital Region Transportation Planning Board,
November 28, 2017), https://www.mwcog.org/transportation/data-and-tools/modeling/model-documentation/.
3. Background 6
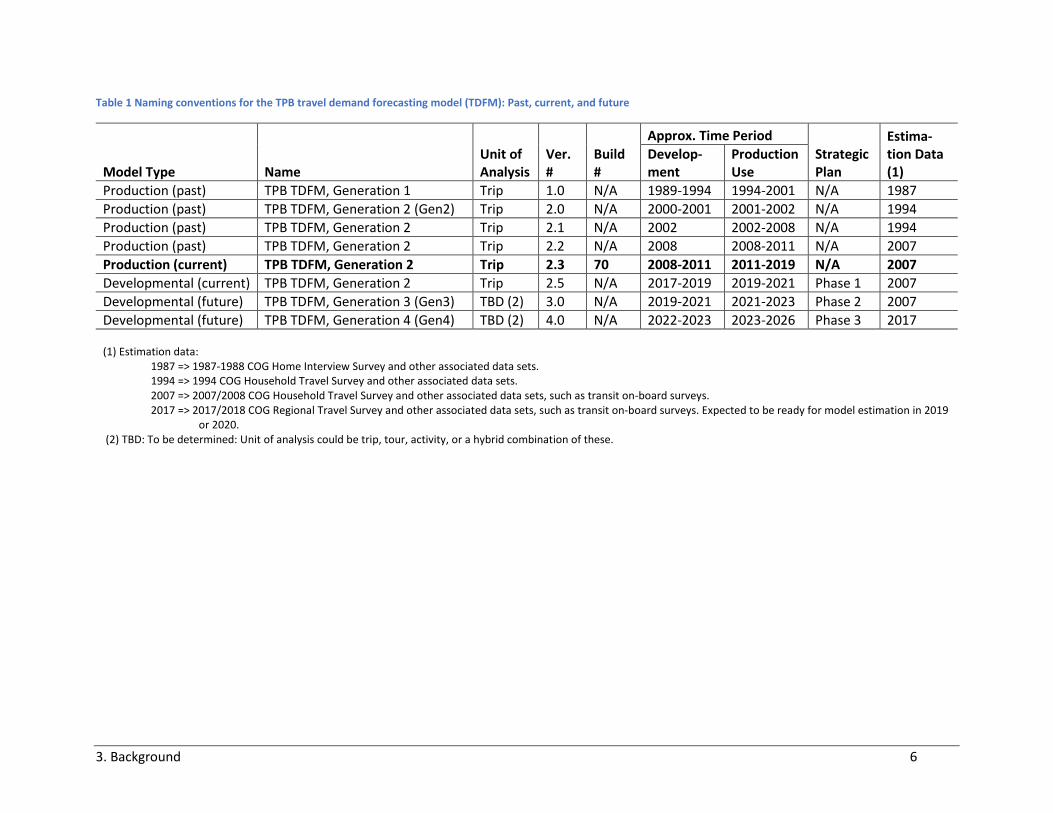
Table 1 Naming conventions for the TPB travel demand forecasting model (TDFM): Past, current, and future
Model Type Name Unit of Analysis
Ver. #
Build #
Approx. Time Period
Strategic Plan
Estima-tion Data (1)
Develop-ment
Production Use
Production (past) TPB TDFM, Generation 1 Trip 1.0 N/A 1989-1994 1994-2001 N/A 1987
Production (past) TPB TDFM, Generation 2 (Gen2) Trip 2.0 N/A 2000-2001 2001-2002 N/A 1994
Production (past) TPB TDFM, Generation 2 Trip 2.1 N/A 2002 2002-2008 N/A 1994
Production (past) TPB TDFM, Generation 2 Trip 2.2 N/A 2008 2008-2011 N/A 2007
Production (current) TPB TDFM, Generation 2 Trip 2.3 70 2008-2011 2011-2019 N/A 2007
Developmental (current) TPB TDFM, Generation 2 Trip 2.5 N/A 2017-2019 2019-2021 Phase 1 2007
Developmental (future) TPB TDFM, Generation 3 (Gen3) TBD (2) 3.0 N/A 2019-2021 2021-2023 Phase 2 2007
Developmental (future) TPB TDFM, Generation 4 (Gen4) TBD (2) 4.0 N/A 2022-2023 2023-2026 Phase 3 2017 (1) Estimation data:
1987 => 1987-1988 COG Home Interview Survey and other associated data sets. 1994 => 1994 COG Household Travel Survey and other associated data sets. 2007 => 2007/2008 COG Household Travel Survey and other associated data sets, such as transit on-board surveys. 2017 => 2017/2018 COG Regional Travel Survey and other associated data sets, such as transit on-board surveys. Expected to be ready for model estimation in 2019
or 2020. (2) TBD: To be determined: Unit of analysis could be trip, tour, activity, or a hybrid combination of these.
3. Background 7
Figure 1 Modeled area for the TPB Ver. 2.3 travel model
Image credit: Jessica Mirr, COG/TPB staff
"I:\ateam\team_mem\...\2016_vaTech\TPB_Plan_EastCoast-Model_crop.jpg"
3.2.2 Future TPB travel models
Generation 2 of models does not end with the current production-use model. Gen2 continues with a
developmental, but still aggregate, trip-based model, known as Ver. 2.5. The last two rows in Table 1
represent two final generations of TPB travel models: Gen3 and Gen4. Thus, Table 1 shows four
generations of travel models:
• Gen1: Version 1.0
• Gen2: Versions 2.0 to 2.X (currently Ver. 2.3.70 for production and 2.5 for development)
• Gen3
• Gen4
The focus of this document is on the TPB Gen3 model.
3. Background 8
3.2.3 Consultant assistance
Since 2005 (FY 2006), COG/TPB staff has maintained a consultant-assisted project to apply and improve
the TPB regional travel demand model. The project has been carried out using a series of one-year, task-
order-based consultant contracts. Each of these contracts was renewable, for up to two years, allowing
any one consultant to hold the contract for three years, at which point COG must offer a new solicitation
if it wants to continue with the project. This contract has been held by the following firms:
• Vanasse Hangen Brustlin, Inc. (VHB), from FY 2006 to 2008
• Cambridge Systematics, Inc. (CS) and Gallop Corporation, from FY 2009 to 2011
• AECOM and Stump/Hausman Partnership, from FY 2012 to 2014
• Cambridge Systematics, Inc. (CS) and Gallop Corporation, from FY 2015 to 2017
In 2012, TPB staff reviewed all the consultant recommendations that had been produced over the first
six years of the contracting period, and summarized the findings in report.14 The most recent consultant
to hold the on-call contract developed the following reports, including a strategic plan for model
development, which is the focus of the following section of this report:
• Cambridge Systematics, Inc. Review of Consultant Recommendations from FY 2012-2014 of the
COG/TPB Travel Demand Modeling Consultant-Assistance Project, Task Order 15.1. Final Report.
Metropolitan Washington Council of Governments, National Capital Region Transportation
Planning Board, October 15, 2015.
• ———. Identifying Potential Opportunities for Model Improvement, Task Order 15.2, Report 1
of 3. Final Report. Washington, D.C.: Metropolitan Washington Council of Governments,
National Capital Region Transportation Planning Board, October 15, 2015.
• ———. Status of Activity-Based Models and Dynamic Traffic Assignment at Peer MPOs, Task
Order 15.2, Report 2 of 3. Final Report. Washington, D.C.: Metropolitan Washington Council of
Governments, National Capital Region Transportation Planning Board, October 15, 2015.
• ———. Strategic Plan for Model Development, Task Order 15.2, Report 3 of 3. Final Report.
Washington, D.C.: Metropolitan Washington Council of Governments, National Capital Region
Transportation Planning Board, October 15, 2015.
• ———. Review of Transit Modeling with Respect to FTA Guidance, Task Order 15.3. Final Report.
Washington, D.C.: Metropolitan Washington Council of Governments, National Capital Region
Transportation Planning Board, October 15, 2015.
• Gallop Corporation. Task Order 15.4, Modeling with Public Transport. Final Report, October 15,
2015.
• Cambridge Systematics, Inc., and Gallop Corporation. FY 16 Task Orders. Final Report.
Washington, D.C.: Metropolitan Washington Council of Governments, National Capital Region
Transportation Planning Board, November 2016.
14 Mark S. Moran, Mary Martchouk, and Ronald Milone, “TPB Staff Review of Six Years of Consultant
Recommendations from the Ongoing Consultant-Assisted Project for Models Development,” Final Report
(Washington, D.C.: National Capital Region Transportation Planning Board, Metropolitan Washington Council of
Governments, July 19, 2012), https://www.mwcog.org/events/2012/?F_committee=199.
3. Background 9
• ———. FY 17 Task Orders. Final Report. Metropolitan Washington Council of Governments,
National Capital Region Transportation Planning Board, June 2017.
3.3 Strategic plan for improving the TPB travel demand model
3.3.1 Original plan
The on-call consultant for FY 2015-2017 was Cambridge Systematics, Inc. (CS). In 2015, in response to
one of its assigned task orders, CS developed a strategic plan for improving the TPB travel demand
model. There were three major inputs to the strategic plan:
• Review of TPB policy reports, such as TPB Vision document, the Regional Transportation
Priorities Plan (RTPP), and the Regional Activity Centers;
• Survey of Washington-D.C.-area modeling stakeholders;15
• Survey of peer MPOs regarding modeling practices (see Table 2);16
The strategic plan consists of three volumes, which were also listed above:
1. Identifying Potential Opportunities for Model Improvement;17
2. Status of Activity-Based Models and Dynamic Traffic Assignment at Peer MPOs;18
3. Strategic Plan for Model Development;19
The first two volumes provide background information and the third volume is the actual plan.
In 2010, Los Angeles was the largest MPO in the U.S., with a population of 18 million people (Table 2).
New York City was the second largest, with 12 million people. Washington, D.C. was #9, with 5 million.
And, Saint Louis, Missouri was the smallest of the top 20, with a population of 2.5 million people.
15 MWCOG/Cambridge Systematics survey to solicit stakeholder input from users of the COG/TPB regional travel
demand model, conducted February 13 to March 3, 2015, interview by Metropolitan Washington Council of
Governments/National Capital Region Transportation Planning Board and Cambridge Systematics, Inc., Web-based
survey, February 2015. 16 MWCOG/Cambridge Systematics survey of peer MPOs to assess the state of modeling practice, conducted March
6-25, 2015, interview by Metropolitan Washington Council of Governments/National Capital Region Transportation
Planning Board and Cambridge Systematics, Inc., Web-based survey, March 2015. 17 Cambridge Systematics, Inc., “Identifying Potential Opportunities for Model Improvement, Task Order 15.2,
Report 1 of 3,” Final Report (Washington, D.C.: Metropolitan Washington Council of Governments, National
Capital Region Transportation Planning Board, October 15, 2015). 18 Cambridge Systematics, Inc., “Status of Activity-Based Models and Dynamic Traffic Assignment at Peer MPOs,
Task Order 15.2, Report 2 of 3,” Final Report (Washington, D.C.: Metropolitan Washington Council of
Governments, National Capital Region Transportation Planning Board, October 15, 2015). 19 Cambridge Systematics, Inc., “Strategic Plan for Model Development, Task Order 15.2, Report 3 of 3,” Final
Report (Washington, D.C.: Metropolitan Washington Council of Governments, National Capital Region
Transportation Planning Board, October 15, 2015).
3. Background 10
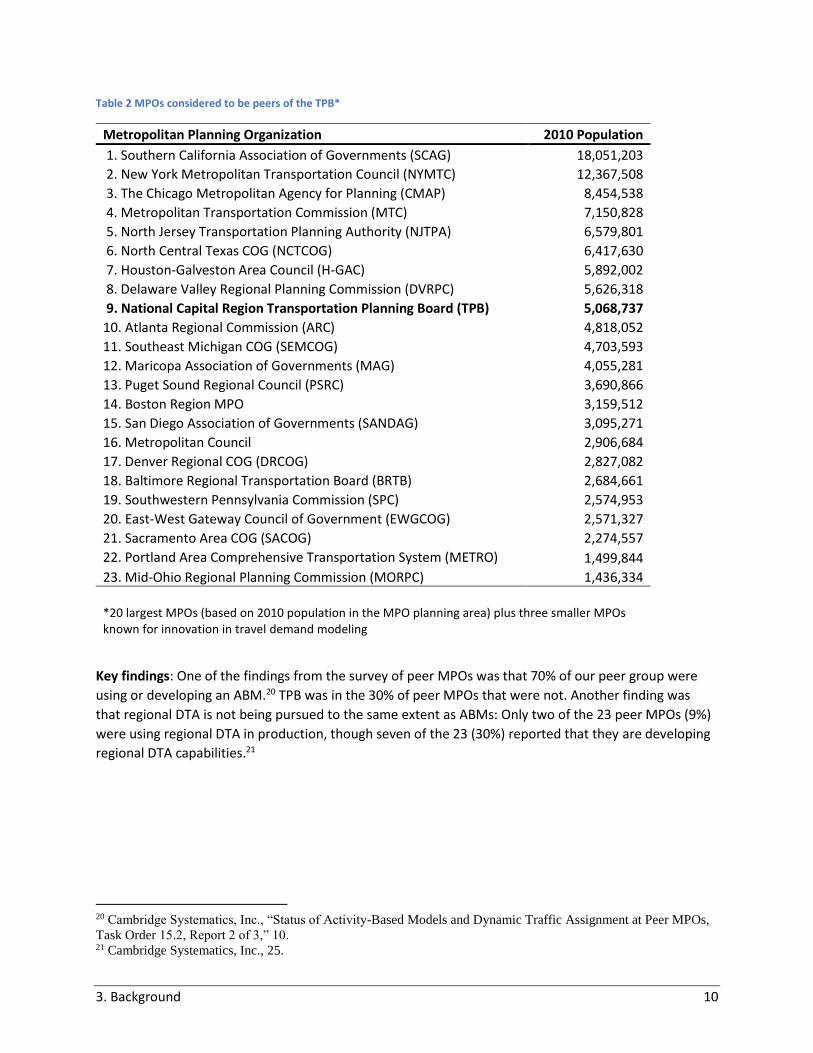
Table 2 MPOs considered to be peers of the TPB*
Metropolitan Planning Organization 2010 Population
1. Southern California Association of Governments (SCAG) 18,051,203
2. New York Metropolitan Transportation Council (NYMTC) 12,367,508
3. The Chicago Metropolitan Agency for Planning (CMAP) 8,454,538
4. Metropolitan Transportation Commission (MTC) 7,150,828
5. North Jersey Transportation Planning Authority (NJTPA) 6,579,801
6. North Central Texas COG (NCTCOG) 6,417,630
7. Houston-Galveston Area Council (H-GAC) 5,892,002
8. Delaware Valley Regional Planning Commission (DVRPC) 5,626,318
9. National Capital Region Transportation Planning Board (TPB) 5,068,737
10. Atlanta Regional Commission (ARC) 4,818,052
11. Southeast Michigan COG (SEMCOG) 4,703,593
12. Maricopa Association of Governments (MAG) 4,055,281
13. Puget Sound Regional Council (PSRC) 3,690,866
14. Boston Region MPO 3,159,512
15. San Diego Association of Governments (SANDAG) 3,095,271
16. Metropolitan Council 2,906,684
17. Denver Regional COG (DRCOG) 2,827,082
18. Baltimore Regional Transportation Board (BRTB) 2,684,661
19. Southwestern Pennsylvania Commission (SPC) 2,574,953
20. East-West Gateway Council of Government (EWGCOG) 2,571,327
21. Sacramento Area COG (SACOG) 2,274,557
22. Portland Area Comprehensive Transportation System (METRO) 1,499,844
23. Mid-Ohio Regional Planning Commission (MORPC) 1,436,334
*20 largest MPOs (based on 2010 population in the MPO planning area) plus three smaller MPOs known for innovation in travel demand modeling
Key findings: One of the findings from the survey of peer MPOs was that 70% of our peer group were
using or developing an ABM.20 TPB was in the 30% of peer MPOs that were not. Another finding was
that regional DTA is not being pursued to the same extent as ABMs: Only two of the 23 peer MPOs (9%)
were using regional DTA in production, though seven of the 23 (30%) reported that they are developing
regional DTA capabilities.21
20 Cambridge Systematics, Inc., “Status of Activity-Based Models and Dynamic Traffic Assignment at Peer MPOs,
Task Order 15.2, Report 2 of 3,” 10. 21 Cambridge Systematics, Inc., 25.
3. Background 11
In the DC area, regional DTA is being used for project prioritization by both VDOT22 and NVTA.23 NVTA
would like to see DTA added to the TPB travel model. TPB staff is interested adding DTA to the regional
model, but the question is when is the right time to pursue it, given the increased resources that would
be needed to develop and maintain DTA-capable networks (e.g., traffic signal timing and phasing) and
the increased model run time that would result from using DTA at the regional level.
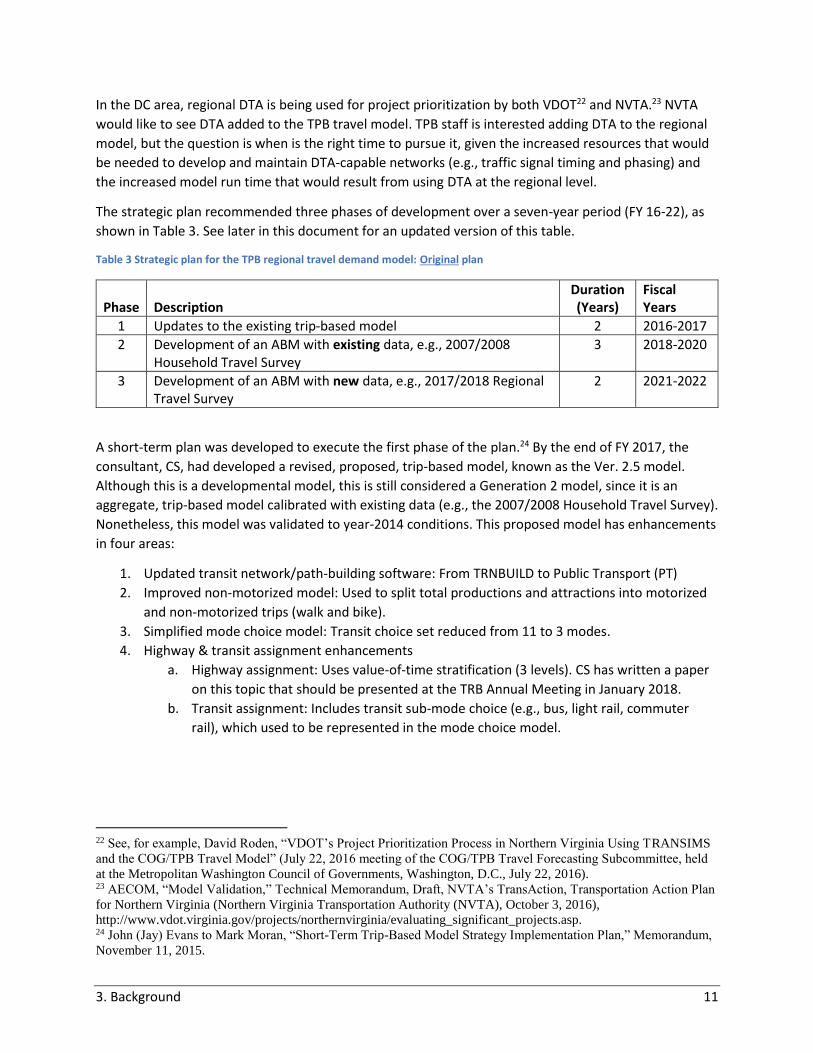
The strategic plan recommended three phases of development over a seven-year period (FY 16-22), as
shown in Table 3. See later in this document for an updated version of this table.
Table 3 Strategic plan for the TPB regional travel demand model: Original plan
Phase Description Duration (Years)
Fiscal Years
1 Updates to the existing trip-based model 2 2016-2017
2 Development of an ABM with existing data, e.g., 2007/2008 Household Travel Survey
3 2018-2020
3 Development of an ABM with new data, e.g., 2017/2018 Regional Travel Survey
2 2021-2022
A short-term plan was developed to execute the first phase of the plan.24 By the end of FY 2017, the
consultant, CS, had developed a revised, proposed, trip-based model, known as the Ver. 2.5 model.
Although this is a developmental model, this is still considered a Generation 2 model, since it is an
aggregate, trip-based model calibrated with existing data (e.g., the 2007/2008 Household Travel Survey).
Nonetheless, this model was validated to year-2014 conditions. This proposed model has enhancements
in four areas:
1. Updated transit network/path-building software: From TRNBUILD to Public Transport (PT)
2. Improved non-motorized model: Used to split total productions and attractions into motorized
and non-motorized trips (walk and bike).
3. Simplified mode choice model: Transit choice set reduced from 11 to 3 modes.
4. Highway & transit assignment enhancements
a. Highway assignment: Uses value-of-time stratification (3 levels). CS has written a paper
on this topic that should be presented at the TRB Annual Meeting in January 2018.
b. Transit assignment: Includes transit sub-mode choice (e.g., bus, light rail, commuter
rail), which used to be represented in the mode choice model.
22 See, for example, David Roden, “VDOT’s Project Prioritization Process in Northern Virginia Using TRANSIMS
and the COG/TPB Travel Model” (July 22, 2016 meeting of the COG/TPB Travel Forecasting Subcommittee, held
at the Metropolitan Washington Council of Governments, Washington, D.C., July 22, 2016). 23 AECOM, “Model Validation,” Technical Memorandum, Draft, NVTA’s TransAction, Transportation Action Plan
for Northern Virginia (Northern Virginia Transportation Authority (NVTA), October 3, 2016),
http://www.vdot.virginia.gov/projects/northernvirginia/evaluating_significant_projects.asp. 24 John (Jay) Evans to Mark Moran, “Short-Term Trip-Based Model Strategy Implementation Plan,” Memorandum,
November 11, 2015.
3. Background 12
CS developed and delivered the Ver. 2.5 model at the end of the contract (June 30, 2017).25 During FY
18, TPB staff has been conducting model testing and sensitivity to ensure that the models performance
is satisfactory and to explore application options to reduce the model run time.
3.3.2 Updates to the plan
TPB staff has recently decided to make several adjustments to the strategic plan for improving the TPB
travel model. First, the schedule has been modified. Phase 1 (updates to the existing trip-based model)
is now planned to last for three years, not two. Although the planned duration for Phases 2 and 3
remains the same (three years for Phase 2 and two years for Phase 3), given the longer duration for
Phase 1, the schedules for Phases 2 and 3 have been shifted back by a year. Similarly, the duration for
the entire strategic plan is now eight years, not seven.
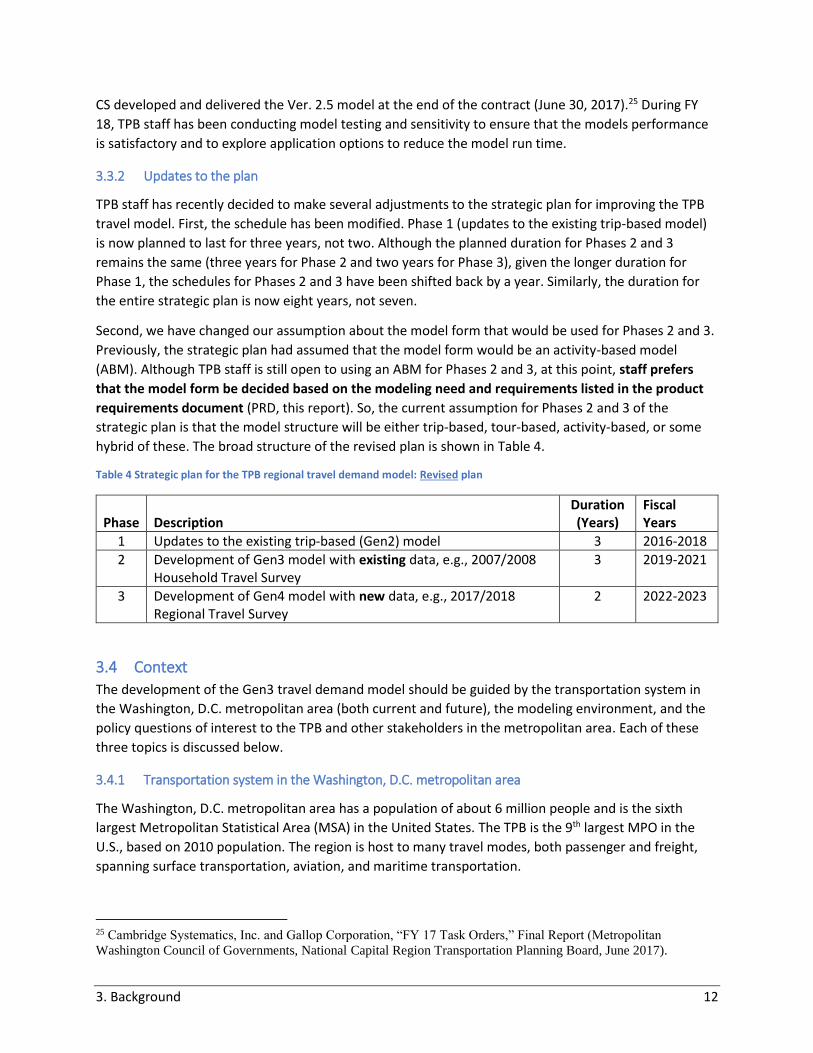
Second, we have changed our assumption about the model form that would be used for Phases 2 and 3.
Previously, the strategic plan had assumed that the model form would be an activity-based model
(ABM). Although TPB staff is still open to using an ABM for Phases 2 and 3, at this point, staff prefers
that the model form be decided based on the modeling need and requirements listed in the product
requirements document (PRD, this report). So, the current assumption for Phases 2 and 3 of the
strategic plan is that the model structure will be either trip-based, tour-based, activity-based, or some
hybrid of these. The broad structure of the revised plan is shown in Table 4.
Table 4 Strategic plan for the TPB regional travel demand model: Revised plan
Phase Description Duration (Years)
Fiscal Years
1 Updates to the existing trip-based (Gen2) model 3 2016-2018
2 Development of Gen3 model with existing data, e.g., 2007/2008 Household Travel Survey
3 2019-2021
3 Development of Gen4 model with new data, e.g., 2017/2018 Regional Travel Survey
2 2022-2023
3.4 Context
The development of the Gen3 travel demand model should be guided by the transportation system in
the Washington, D.C. metropolitan area (both current and future), the modeling environment, and the
policy questions of interest to the TPB and other stakeholders in the metropolitan area. Each of these
three topics is discussed below.
3.4.1 Transportation system in the Washington, D.C. metropolitan area
The Washington, D.C. metropolitan area has a population of about 6 million people and is the sixth
largest Metropolitan Statistical Area (MSA) in the United States. The TPB is the 9th largest MPO in the
U.S., based on 2010 population. The region is host to many travel modes, both passenger and freight,
spanning surface transportation, aviation, and maritime transportation.
25 Cambridge Systematics, Inc. and Gallop Corporation, “FY 17 Task Orders,” Final Report (Metropolitan
Washington Council of Governments, National Capital Region Transportation Planning Board, June 2017).
3. Background 13
In the Washington, D.C. area, as is true in many urban areas in the U.S., a large share of travel is made
by private-transportation, motor vehicles, such as cars (automobiles), light-duty trucks, sports utility
vehicles (SUVs), and motorcycles.
The highway system includes high-occupancy vehicle (HOV) lanes, high-occupancy/toll (HOT) lanes, and
toll roads, both fixed price (e.g., Dulles Toll Road) and variably-priced -- where the toll is not dependent
on the vehicle occupancy (e.g., the Intercounty Connector, or ICC). Carpooling is an important travel
mode and slugging (where carpools are formed informally at one or more designated locations) is also
widely used in the I-95/I-395 corridor in Virginia.
In terms of public transportation, the DC area has the 4th largest transit system in the U.S. For a long
period, the DC area had the second largest heavy rail system, though, it may now be in third place after
Chicago.26 The transit system includes commuter rail, Metrorail, light rail, streetcar, bus rapid transit
(BRT), express bus, and local bus. Inter-city passenger rail (Amtrak) and bus service are also important
travel modes within and through our region. In some parts of the region, shuttle bus service, often
associated with universities or federal government sites, can also be extensive.
Although taxis and taxicabs are a small share of resident passenger travel (about 0.3% of travel,
according to our 2007-2008 Household Travel Survey), they account for a much larger share of traffic in
markets with lots of non-resident travel (e.g., downtown, travel to/from airports). Similarly, the usage of
transportation network companies (TNCs) has been growing quickly, following the start of Uber (in
2009), Lyft (in 2012), and other similar services. In one recent study in California, TNCs were found to
account for as much as 20% of intra-San-Francisco vehicle miles of travel (VMT).27 Short-term car rental,
including those that forego centralized rental offices, are also becoming more popular, particularly in
denser parts of the region (car2go started service in DC in 2012).
In terms of non-motorized transportation (walking and biking), the DC area has a respectable mode split
of biking and walking trips (at the regional level, about 1% of commute mode share for bikes and 3% for
walk,28 though these percentages can be much more for certain areas of the region). Furthermore, these
modes are important access modes for transit. The region also includes several bikeshare systems,
including those that make use of docking stations (e.g., Capital Bikeshare) and dockless systems (e.g.,
Mobike, Spin, and LimeBike). Capital Bikeshare is subsidized by the local governments, but the other
bikeshare systems are not.
The metropolitan Washington region has three commercial airports – Ronald Reagan Washington
National Airport (DCA), Washington Dulles International Airport (IAD), and Baltimore/Washington
International Thurgood Marshall Airport (BWI) – and many general aviation airports. Washington, D.C. is
not a port city, like Baltimore or New York City, but it does have navigable rivers (the Potomac and the
26 DW Rowlands, “Metrorail Is No Longer the Second-Busiest Rapid Transit System in the Country,” Greater
Greater Washington, February 8, 2018, https://ggwash.org/view/66466/metrorail-is-no-longer-the-second-busiest-
rapid-transit-system-in-the-country. 27 “TNCs Today: A Profile of San Francisco Transportation Network Company Activity,” Final Report (San
Francisco County Transportation Authority, June 2017), 2, http://www.sfcta.org/tncstoday. 28 Robert E. Griffiths, “Regional Travel Trends” (April 20, 2016 meeting of the National Capital Region
Transportation Planning Board, held at the Metropolitan Washington Council of Governments, Washington, D.C.,
April 20, 2016), 15.
3. Background 14
Anacostia), which include some existing water taxi service, and which have been considered for
additional service.29
In terms of future, but not yet existing, travel modes, it is expected that connected and autonomous
vehicles (CAVs) will begin to enter the vehicle fleet here and in the rest of the U.S. in the next few years.
CAVs could be privately owned by households, or could be operated as fleets owned by private
companies, which could include the idea of Mobility as a Service (MaaS). Maryland is considering
options for high-speed rail (magnetic levitation or maglev) between Washington, D.C. and Baltimore,30
and private firms have considered developing a high-speed tunnel transportation system between the
two cities (i.e., Loop or Hyperloop). Lastly, some have noted that TNCs may get into the business of
offering air taxis, especially using newer, still developing technologies, such as electric vertical take-off
and landing (eVTOL) aircraft that build upon knowledge gained from the rise in unmanned aerial
vehicles (UAVs), also known as unmanned aircraft systems (UAS), or drones.31
3.4.2 Modeling environment
As noted earlier, the current adopted, production-use TPB regional travel demand forecasting model is
an aggregate trip-based travel demand model, known as the Ver. 2.3.70 model. The model was
calibrated and validated with local data. As noted earlier, the current model (Version 2.3) is documented
in a calibration report,32 validation memo,33 and a user’s guide.34 The modeled area is relatively large – it
covers DC and sections of three states (Virginia, Maryland, and one county in West Virginia). In all, the
modeled area includes 22 counties/jurisdictions and about 6,800 square miles. The TPB modeled area
overlaps with that of the Baltimore Metropolitan Council (BMC)/Baltimore Regional Transportation
Board (BRTB), and vice a versa. In the past, some have argued the technical merits of a combined, two-
city (Washington, D.C. and Baltimore) travel model, but, for various reasons, more institutional than
technical, that has never occurred.
The next generation travel demand model could be a trip-based model, a tour-based model, an activity-
based model (ABM), or a hybrid of these, as noted in a recent presentation to the TFS.35 A tour-based
model could either be an aggregate tour-based model (just as our trip-based model is aggregate) or a
29 Luz Lazo, “At Ferry Summit, a Vision Emerges for a Commuter System along the Potomac River,” The
Washington Post, September 21, 2017, sec. Transportation,
https://www.washingtonpost.com/local/trafficandcommuting/at-ferry-summit-a-vision-emerges-for-a-commuter-
system-along-the-potomac-river/2017/09/21/ee3717d4-9d5d-11e7-9c8d-cf053ff30921_story.html. 30 Luz Lazo, “Officials Have Settled on 2 Possible Routes for the High-Speed Maglev, but Project Is Still Years
Away,” The Washington Post, February 11, 2018,
https://www.washingtonpost.com/local/trafficandcommuting/officials-have-settled-on-2-possible-routes-for-the-
high-speed-maglev-but-project-is-still-years-away/2018/02/11/d50238d2-0cf9-11e8-8b0d-
891602206fb7_story.html?utm_term=.b4ca5becbcd1. 31 Biz Carson, “Uber Wants To Bring Its Flying Taxis to Traffic-Congested Los Angeles Ahead Of The Olympics,”
Forbes, November 8, 2017, https://www.forbes.com/sites/bizcarson/2017/11/08/uber-wants-to-bring-its-flying-taxis-
to-traffic-congested-los-angeles-ahead-of-the-olympics/. 32 Milone et al., “Calibration Report for the TPB Travel Forecasting Model, Version 2.3.” 33 Milone to Files, “2010 Validation of the Version 2.3 Travel Demand Model.” 34 Milone, Moran, and Seifu, “User’s Guide for the COG/TPB Travel Demand Forecasting Model, Version 2.3.70:
Volume 1 of 2: Main Report and Appendix A (Flowcharts).” 35 Mark S. Moran, “Next-Generation Travel Demand Forecasting Model for the TPB: Current Plans for
Development (Phase 2 of the Strategic Plan)” (January 19, 2018 meeting of the COG/TPB Travel Forecasting
Subcommittee, held at the Metropolitan Washington Council of Governments, Washington, D.C., January 19, 2018).
3. Background 15
disaggregate tour-based model, which is more like an ABM. The Gen3 travel model will need to address
all the travel modes that are currently active in the DC region, and should also address many of the
emerging travel modes, described earlier. The Gen3 model development effort will also need to review
and consider updates to what are known as exogenous travel markets in the model. These exogenous
inputs are associated with travelers who reside outside of the study area (non-residents) or who live in
the region (residents), but are not well represented in a typical household travel survey.36
Any consultant wishing to work with COG/TPB staff on TPB’s next generation model should be cognizant
of other modeling efforts in the region and beyond, such as the following:
• Baltimore Metropolitan Council’s (BMC’s) ABM, known as InSITE
• Maryland and Virginia’s statewide modeling efforts
• Maryland’s innovative modeling work, e.g., MITAMS
• Modeling work at the University of Maryland37
• DTA modeling work for VDOT and NVTA38
• Model review conducted by Montgomery County Planning Department39
• ActivitySim
• Zephyr Foundation
• Use of big data for model estimation, calibration, and validation40
3.4.3 Uses of the TPB travel model and policies that the Gen3 model would ideally address
Like all MPOs, the TPB must develop a Unified Planning Work Program (UPWP), which is updated on an
annual basis and lists all the planning activities that the MPO staff will undertake for a given year. The
TPB travel demand forecasting model (TDFM) is used for several of the tasks specified in the UPWP,
including the following:
• Development of an LRTP, which must extend at least 20 years into the future. The 2018 version
of the TPB’s LRTP is called Visualize 2045. The MPO must also designate a subset of the LRTP
that is financially constrained to reasonably expected future revenues. In the past, TPB called
36 Ronald Milone to DTP Technical Staff, “Round 9.0-Based Exogenous Demand Inputs to the Travel Model,”
Memorandum, May 25, 2016. 37 University of Maryland, Lei Zhang, and Gang-Len Chang, “Developing Mesoscopic Models for the Before and
After Study of the Inter-County Connector: Phase One” (Baltimore, Maryland: Maryland State Highway
Administration, March 2013), http://ntl.bts.gov/lib/47000/47200/47250/MD-13-SP109B4P_ICC-Before-After-
Study_Report.pdf. 38 AECOM, “Evaluation and Rating of Significant Projects in Northern Virginia,” Technical Report (Virginia
Department of Transportation, April 29, 2015),
http://www.vdot.virginia.gov/projects/northernvirginia/evaluating_significant_projects.asp. 39 Fehr & Peers, “Transportation Models Review Tabular Summary (Attachment D of Subdivision Staging Policy –
Briefing on Transportation Modeling Tools and Metrics)” (Silver Spring, Maryland: Montgomery County Planning
Department, Maryland-National Capital Park and Planning Commission, January 28, 2016),
http://www.montgomeryplanningboard.org/agenda/2016/agenda20160128.html. 40 See, for example, Josephine D. Kressner et al., “Using Passive Data to Build an Agile Tour-Based Model: A Case
Study in Asheville,” in Travel Forecasting Resource (6th TRB Conference on Innovations in Travel Modeling, May
1-4, 2016, Denver, Colorado: Transportation Research Board, 2016),
http://tfresource.org/6th_ITM_Conference,_Denver,_Colorado_(2016).
3. Background 16
this the constrained, long-range plan (CLRP). But, the new nomenclature is the constrained
element of the LRTP (Visualize 2045).
• Assessment of the performance of the LRTP, both in general terms of interest to the MPO and in
more specific terms dictated by performance-based planning and programming (PBPP).
• Air Quality Conformity Determination, since the metropolitan Washington area is a non-
attainment area for one or more air pollutants.
• Regional scenario studies, where changes are made to one or more of the following:
transportation networks, land use, or policy assumptions.
• Transportation-related corridor studies and project planning studies. Although these types of
studies are often conducted by state and local governments (and their consultants), the TPB
staff does perform these types of studies under technical assistance projects that are conducted
by TPB staff for the three “states” (DC, Maryland, and Virginia) and WMATA.
• Analyses of the impacts of transportation projects and policies on environmental justice
(EJ)/social equity, although much of this analysis is currently done outside of the regional travel
model.
When it comes to developing a travel demand forecasting model for an urban area, one should not rely
on the assumption that one size fits all. In other words, the planning needs and issues in one city may
differ from those of another city. Consequently, below is a list of some of the policies that are important
in the metropolitan Washington region, and, hence, should ideally be addressed in the Gen3 model.
Some of these were identified by TPB staff, others by modeling stakeholders.41 Many of these are
discussed in more detail later in this report.
Polices/modeling issues important to the metropolitan Washington region:
• Modeling of transit and transit sub-modes (e.g., bus versus light rail)
o Mode choice and path-building: The trend has been to move some of this modeling of
transit sub-modes out of mode choice and into path building
o Transit assignment
▪ All-or-nothing versus capacity restrained
▪ Production/attraction format versus origin/destination format
▪ Transit crowding. Even though there have been some declines in transit
ridership in recent years, transit crowding/capacity, on both rail and some bus
lines, remains an issue. For example, the model must represent the fact that
there is a limit to the number of Metrorail trains that can travel to/through the
regional core in peak periods.
• Modeling highway travel (private-use cars and trucks)
o Highway assignment: Very long run times to reach acceptable levels of convergence
o Modeling HOV lanes, HOT lanes, and other managed-lane facilities
• Modeling non-motorized modes (walk and bike)
41 See, for example Cambridge Systematics, Inc., “Identifying Potential Opportunities for Model Improvement, Task
Order 15.2, Report 1 of 3,” especially pages 17-21.
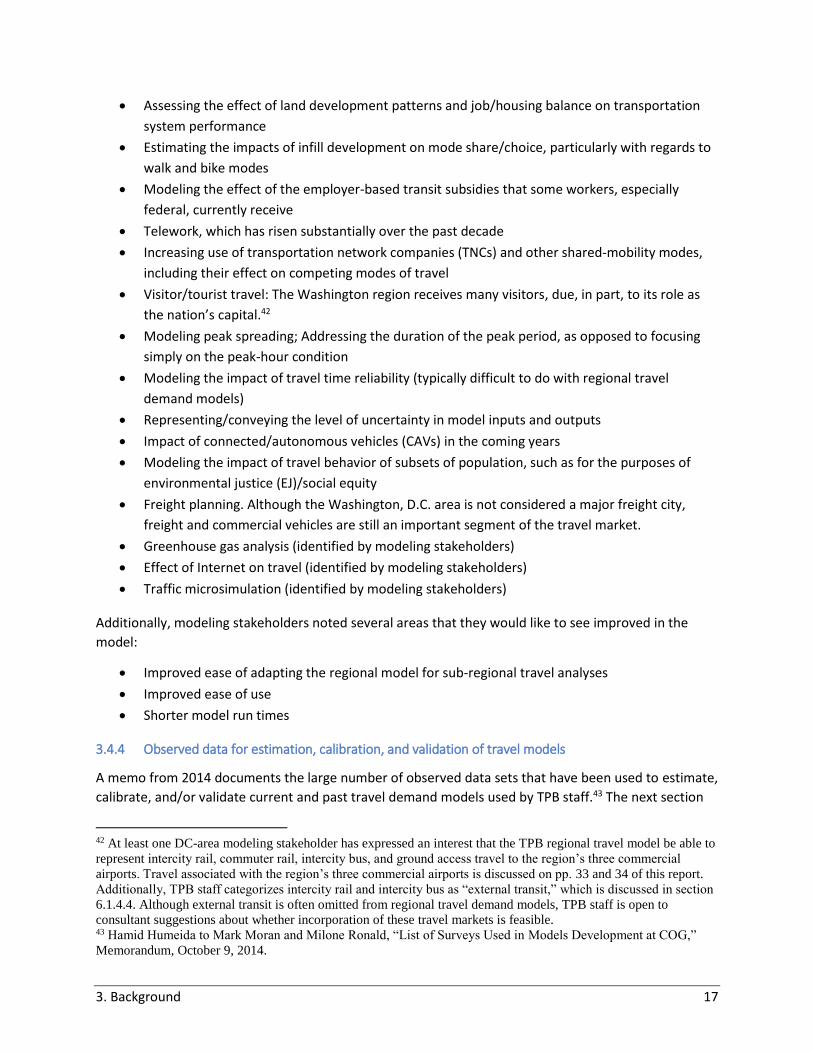
3. Background 17
• Assessing the effect of land development patterns and job/housing balance on transportation
system performance
• Estimating the impacts of infill development on mode share/choice, particularly with regards to
walk and bike modes
• Modeling the effect of the employer-based transit subsidies that some workers, especially
federal, currently receive
• Telework, which has risen substantially over the past decade
• Increasing use of transportation network companies (TNCs) and other shared-mobility modes,
including their effect on competing modes of travel
• Visitor/tourist travel: The Washington region receives many visitors, due, in part, to its role as
the nation’s capital.42
• Modeling peak spreading; Addressing the duration of the peak period, as opposed to focusing
simply on the peak-hour condition
• Modeling the impact of travel time reliability (typically difficult to do with regional travel
demand models)
• Representing/conveying the level of uncertainty in model inputs and outputs
• Impact of connected/autonomous vehicles (CAVs) in the coming years
• Modeling the impact of travel behavior of subsets of population, such as for the purposes of
environmental justice (EJ)/social equity
• Freight planning. Although the Washington, D.C. area is not considered a major freight city,
freight and commercial vehicles are still an important segment of the travel market.
• Greenhouse gas analysis (identified by modeling stakeholders)
• Effect of Internet on travel (identified by modeling stakeholders)
• Traffic microsimulation (identified by modeling stakeholders)
Additionally, modeling stakeholders noted several areas that they would like to see improved in the
model:
• Improved ease of adapting the regional model for sub-regional travel analyses
• Improved ease of use
• Shorter model run times
3.4.4 Observed data for estimation, calibration, and validation of travel models
A memo from 2014 documents the large number of observed data sets that have been used to estimate,
calibrate, and/or validate current and past travel demand models used by TPB staff.43 The next section
42 At least one DC-area modeling stakeholder has expressed an interest that the TPB regional travel model be able to
represent intercity rail, commuter rail, intercity bus, and ground access travel to the region’s three commercial
airports. Travel associated with the region’s three commercial airports is discussed on pp. 33 and 34 of this report.
Additionally, TPB staff categorizes intercity rail and intercity bus as “external transit,” which is discussed in section
6.1.4.4. Although external transit is often omitted from regional travel demand models, TPB staff is open to
consultant suggestions about whether incorporation of these travel markets is feasible. 43 Hamid Humeida to Mark Moran and Milone Ronald, “List of Surveys Used in Models Development at COG,”
Memorandum, October 9, 2014.
3. Background 18
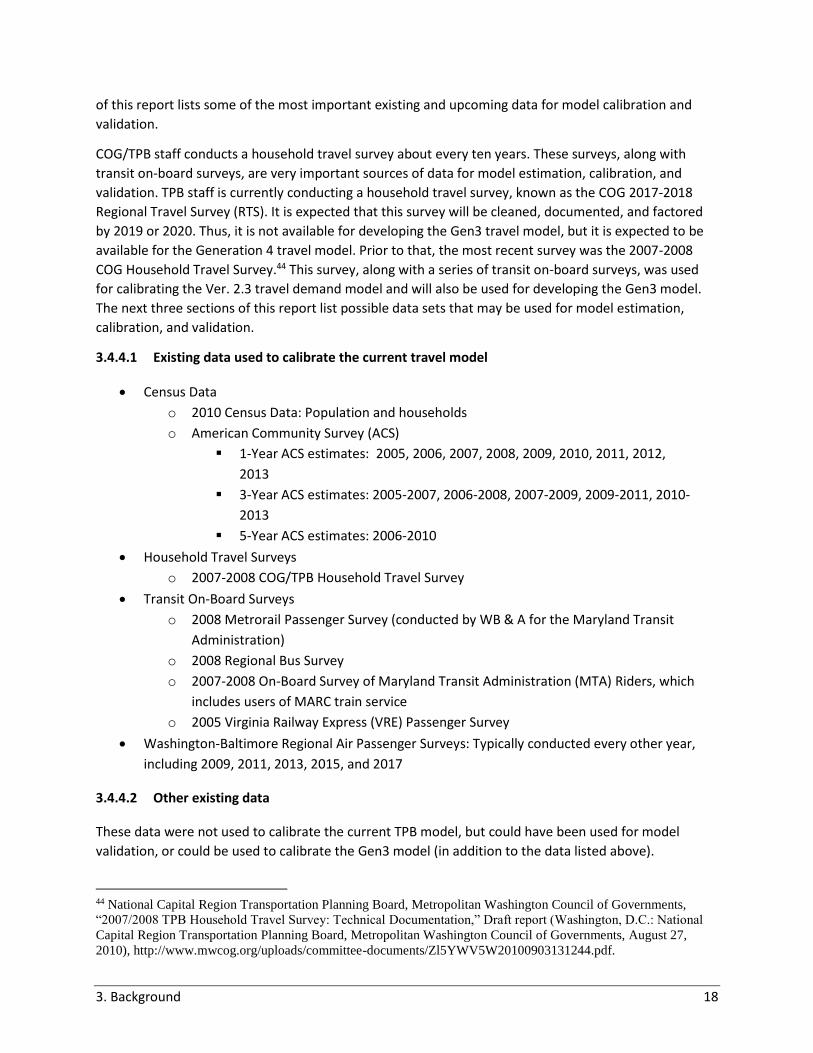
of this report lists some of the most important existing and upcoming data for model calibration and
validation.
COG/TPB staff conducts a household travel survey about every ten years. These surveys, along with
transit on-board surveys, are very important sources of data for model estimation, calibration, and
validation. TPB staff is currently conducting a household travel survey, known as the COG 2017-2018
Regional Travel Survey (RTS). It is expected that this survey will be cleaned, documented, and factored
by 2019 or 2020. Thus, it is not available for developing the Gen3 travel model, but it is expected to be
available for the Generation 4 travel model. Prior to that, the most recent survey was the 2007-2008
COG Household Travel Survey.44 This survey, along with a series of transit on-board surveys, was used
for calibrating the Ver. 2.3 travel demand model and will also be used for developing the Gen3 model.
The next three sections of this report list possible data sets that may be used for model estimation,
calibration, and validation.
3.4.4.1 Existing data used to calibrate the current travel model
• Census Data
o 2010 Census Data: Population and households
o American Community Survey (ACS)
▪ 1-Year ACS estimates: 2005, 2006, 2007, 2008, 2009, 2010, 2011, 2012,
2013
▪ 3-Year ACS estimates: 2005-2007, 2006-2008, 2007-2009, 2009-2011, 2010-
2013
▪ 5-Year ACS estimates: 2006-2010
• Household Travel Surveys
o 2007-2008 COG/TPB Household Travel Survey
• Transit On-Board Surveys
o 2008 Metrorail Passenger Survey (conducted by WB & A for the Maryland Transit
Administration)
o 2008 Regional Bus Survey
o 2007-2008 On-Board Survey of Maryland Transit Administration (MTA) Riders, which
includes users of MARC train service
o 2005 Virginia Railway Express (VRE) Passenger Survey
• Washington-Baltimore Regional Air Passenger Surveys: Typically conducted every other year,
including 2009, 2011, 2013, 2015, and 2017
3.4.4.2 Other existing data
These data were not used to calibrate the current TPB model, but could have been used for model
validation, or could be used to calibrate the Gen3 model (in addition to the data listed above).
44 National Capital Region Transportation Planning Board, Metropolitan Washington Council of Governments,
“2007/2008 TPB Household Travel Survey: Technical Documentation,” Draft report (Washington, D.C.: National
Capital Region Transportation Planning Board, Metropolitan Washington Council of Governments, August 27,
2010), http://www.mwcog.org/uploads/committee-documents/Zl5YWV5W20100903131244.pdf.
3. Background 19
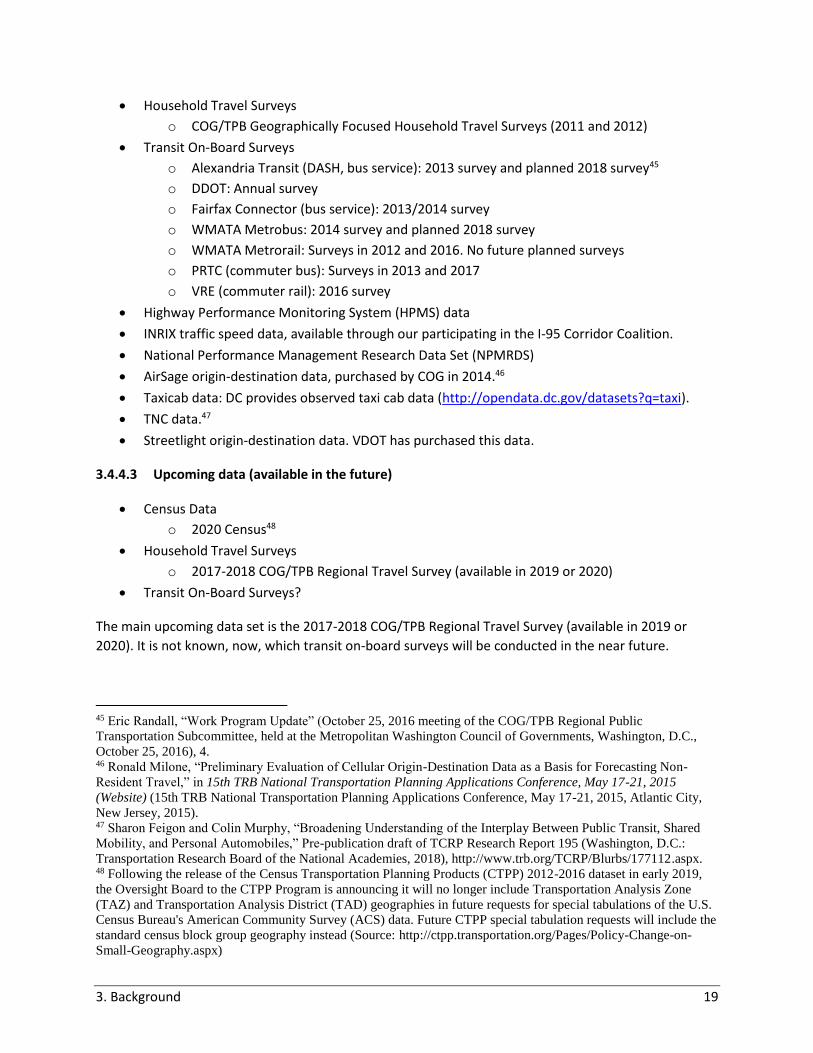
• Household Travel Surveys
o COG/TPB Geographically Focused Household Travel Surveys (2011 and 2012)
• Transit On-Board Surveys
o Alexandria Transit (DASH, bus service): 2013 survey and planned 2018 survey45
o DDOT: Annual survey
o Fairfax Connector (bus service): 2013/2014 survey
o WMATA Metrobus: 2014 survey and planned 2018 survey
o WMATA Metrorail: Surveys in 2012 and 2016. No future planned surveys
o PRTC (commuter bus): Surveys in 2013 and 2017
o VRE (commuter rail): 2016 survey
• Highway Performance Monitoring System (HPMS) data
• INRIX traffic speed data, available through our participating in the I-95 Corridor Coalition.
• National Performance Management Research Data Set (NPMRDS)
• AirSage origin-destination data, purchased by COG in 2014.46
• Taxicab data: DC provides observed taxi cab data (http://opendata.dc.gov/datasets?q=taxi).
• TNC data.47
• Streetlight origin-destination data. VDOT has purchased this data.
3.4.4.3 Upcoming data (available in the future)
• Census Data
o 2020 Census48
• Household Travel Surveys
o 2017-2018 COG/TPB Regional Travel Survey (available in 2019 or 2020)
• Transit On-Board Surveys?
The main upcoming data set is the 2017-2018 COG/TPB Regional Travel Survey (available in 2019 or
2020). It is not known, now, which transit on-board surveys will be conducted in the near future.
45 Eric Randall, “Work Program Update” (October 25, 2016 meeting of the COG/TPB Regional Public
Transportation Subcommittee, held at the Metropolitan Washington Council of Governments, Washington, D.C.,
October 25, 2016), 4. 46 Ronald Milone, “Preliminary Evaluation of Cellular Origin-Destination Data as a Basis for Forecasting Non-
Resident Travel,” in 15th TRB National Transportation Planning Applications Conference, May 17-21, 2015
(Website) (15th TRB National Transportation Planning Applications Conference, May 17-21, 2015, Atlantic City,
New Jersey, 2015). 47 Sharon Feigon and Colin Murphy, “Broadening Understanding of the Interplay Between Public Transit, Shared
Mobility, and Personal Automobiles,” Pre-publication draft of TCRP Research Report 195 (Washington, D.C.:
Transportation Research Board of the National Academies, 2018), http://www.trb.org/TCRP/Blurbs/177112.aspx. 48 Following the release of the Census Transportation Planning Products (CTPP) 2012-2016 dataset in early 2019,
the Oversight Board to the CTPP Program is announcing it will no longer include Transportation Analysis Zone
(TAZ) and Transportation Analysis District (TAD) geographies in future requests for special tabulations of the U.S.
Census Bureau's American Community Survey (ACS) data. Future CTPP special tabulation requests will include the
standard census block group geography instead (Source: http://ctpp.transportation.org/Pages/Policy-Change-on-
Small-Geography.aspx)
4. Overview, timeline, phasing and budget of the contract 20
4 Overview, timeline, phasing and budget of the contract
4.1 Overview and timeline for the RFI and RFP
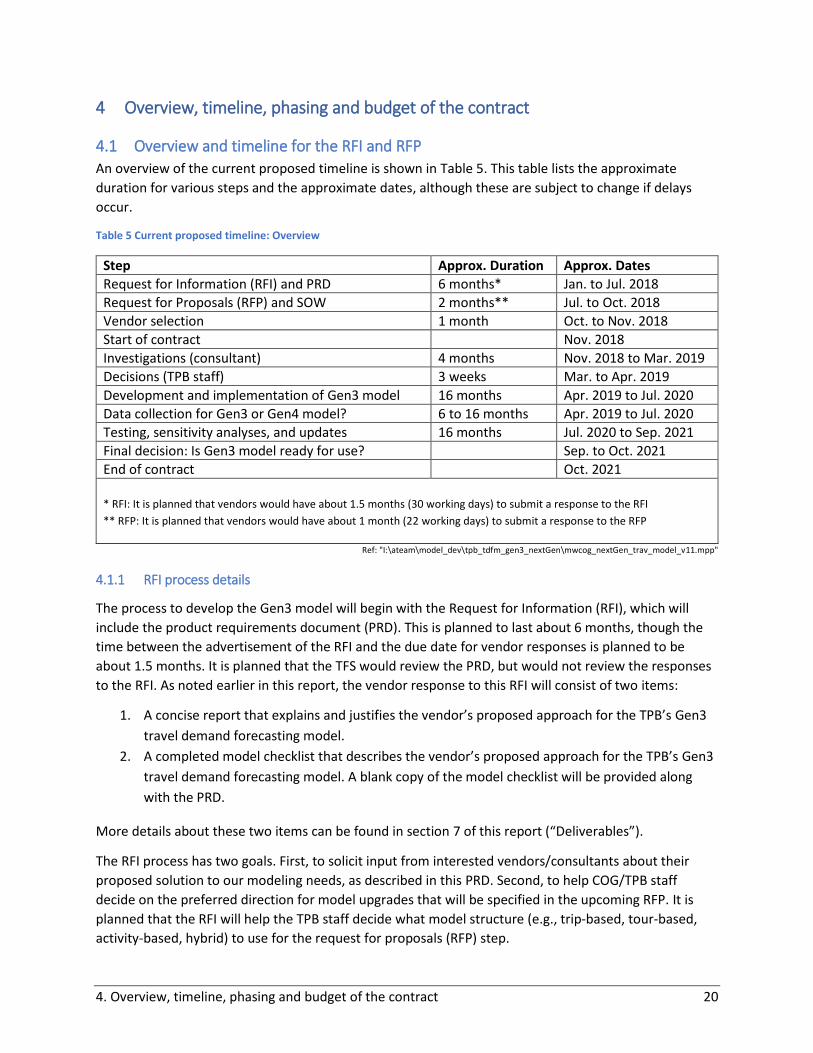
An overview of the current proposed timeline is shown in Table 5. This table lists the approximate
duration for various steps and the approximate dates, although these are subject to change if delays
occur.
Table 5 Current proposed timeline: Overview
Step Approx. Duration Approx. Dates
Request for Information (RFI) and PRD 6 months* Jan. to Jul. 2018
Request for Proposals (RFP) and SOW 2 months** Jul. to Oct. 2018
Vendor selection 1 month Oct. to Nov. 2018
Start of contract Nov. 2018
Investigations (consultant) 4 months Nov. 2018 to Mar. 2019
Decisions (TPB staff) 3 weeks Mar. to Apr. 2019
Development and implementation of Gen3 model 16 months Apr. 2019 to Jul. 2020
Data collection for Gen3 or Gen4 model? 6 to 16 months Apr. 2019 to Jul. 2020
Testing, sensitivity analyses, and updates 16 months Jul. 2020 to Sep. 2021
Final decision: Is Gen3 model ready for use? Sep. to Oct. 2021
End of contract Oct. 2021
* RFI: It is planned that vendors would have about 1.5 months (30 working days) to submit a response to the RFI
** RFP: It is planned that vendors would have about 1 month (22 working days) to submit a response to the RFP
Ref: "I:\ateam\model_dev\tpb_tdfm_gen3_nextGen\mwcog_nextGen_trav_model_v11.mpp"
4.1.1 RFI process details
The process to develop the Gen3 model will begin with the Request for Information (RFI), which will
include the product requirements document (PRD). This is planned to last about 6 months, though the
time between the advertisement of the RFI and the due date for vendor responses is planned to be
about 1.5 months. It is planned that the TFS would review the PRD, but would not review the responses
to the RFI. As noted earlier in this report, the vendor response to this RFI will consist of two items:
1. A concise report that explains and justifies the vendor’s proposed approach for the TPB’s Gen3
travel demand forecasting model.
2. A completed model checklist that describes the vendor’s proposed approach for the TPB’s Gen3
travel demand forecasting model. A blank copy of the model checklist will be provided along
with the PRD.
More details about these two items can be found in section 7 of this report (“Deliverables”).
The RFI process has two goals. First, to solicit input from interested vendors/consultants about their
proposed solution to our modeling needs, as described in this PRD. Second, to help COG/TPB staff
decide on the preferred direction for model upgrades that will be specified in the upcoming RFP. It is
planned that the RFI will help the TPB staff decide what model structure (e.g., trip-based, tour-based,
activity-based, hybrid) to use for the request for proposals (RFP) step.
4. Overview, timeline, phasing and budget of the contract 21
As noted earlier, the RFI is not being used for pre-qualification, which means that vendors are not
required to respond to the RFI to respond to the upcoming RFP.
4.1.2 Comparison of the RFI and RFP processes
The RFI step will be followed by the Request for Proposals (RFP) process, whose goal is to select one or
more vendors to develop the Gen3 model. The RFP will include a scope of work (SOW) that defines the
work that the selected vendor is expected to accomplish. Although the RFP step is planned to last about
two months, the time between the advertisement of the RFP and the due date for vendor proposals is
planned to be about one month.
It is planned that the RFI process will be somewhat open in nature, and the RFP process will by more
closed in nature. Specifically, once one or more vendors respond to the RFI with their proposed
modeling approach, TPB staff may choose to follow up with one or more of the vendors to obtain more
information or clarification about the vendor responses. Ideally, this follow-up would be conducted in
writing (via email), with a copy to the COG Contracts and Purchasing Office ([email protected]). If
TPB staff feels a meeting is warranted, TPB staff will consult with the COG Contracts and Purchasing
Office before setting up such a meeting. Note to vendors: Anything that comes from the vendor
responses or possible subsequent follow up with the vendors is for information purposes only. Thus, it
is the RFP itself that is the determinant on what services are being solicited, not the RFI. Thus, during
the RFI process, TPB staff will not reveal any inside information about the contents of the eventual
RFP, to maintain a fair and even competition.
TPB staff would not share the responses to the RFI with other vendors (participating or not), and TPB
staff does not plan to share the RFI responses with members of the TFS, even though the TFS is the
review body for most activities related to travel demand forecasting.
The RFP process, by contrast, is more closed. During the period where the RFP is open (i.e., during the
time, about one month, between the RFP advertisement and the deadline for proposals), any vendor
questions should be submitted to COG’s Contracts and Purchasing Office ([email protected]),
who will then forward the questions to the COG project manager/subject-matter experts (TPB staff).
TPB staff will then send the responses to COG’s Contracts and Purchasing Office, which will distribute
the questions and answers as an addendum to the RFP. This addendum will be placed on the same
webpage as the RFP (https://www.mwcog.org/purchasing-and-bids/cog-bids-and-rfps/), so that it is
equally available to all the vendors wishing to submit a proposal. Typically, after vendors submit their
RFP proposals, there is no more interaction between the vendors and the COG/TPB staff. Vendor
proposals are not shared with anyone except the members of a Technical Selection Committee, which is
discussed below.
4.1.3 Award of contract/Post RFP
Vendor selection will make use of a technical selection committee (TSC) to score the vendor proposals,
based on the evaluation factors listed in the RFP. It is thought that vendor selection will take about one
month. Currently, the start of the contact is planned for November 2018, but this could be delayed if
there are delays in the prior steps. In most cases, vendor selection is made by the TSC, without any
further interaction with the proposers. In some very special cases, however, such as in the event of a
close score, the top-scoring vendors may be called in for an interview.
4. Overview, timeline, phasing and budget of the contract 22
Development of the contract, including sign-offs, can typically take 7-10 days, and may require legal
review.
Following the signing of the contract, it is planned that the project will begin with a series of
investigations. These investigations, which will last about 4 months, are discussed later in this
document. The investigations will result in a series of technical memos from the
vendor/contractor/consultant. The TPB staff will then have 3 weeks to review these technical memos
and make decisions about which improvements to pursue. It is possible that the investigations would
lead to the decision that more data needs to be collected. If that is the case, it is planned that the data
would be collected during the three-year contract period, even though some of the data might not be
ready for use until the following generation of the travel model (i.e., Generation 4, which is represented
as Phase 3 of the strategic plan for model development). Note that if data collection needs are identified
by the winning vendor, the data collection is likely to occur under a separate contract, which is focused
on travel monitoring.49
Currently, it is planned that the consultant will have 16 months to develop the Gen3 travel demand
forecasting model. Following this development period, it is planned that there will be a 16-month period
where the TPB staff will conduct model testing and sensitivity tests, while the consultant is still under
contract. One scenario would include 12 months of testing by TPB staff, followed by 2 months of model
updates (in response to TPB staff findings) by the consultant, followed by 2 final months of testing.
Alternatively, at the discretion of TPB staff and the selected vendor, the model updates could happen at
multiple points during the testing phase, instead of simply at the end of the testing phase. Either way, at
the end of this 3-year period, TPB staff would make the final decision about whether the Gen3 model is
ready for production use by the TPB. If the vendors replying to the RFI process think that time
segmentation is not corrected (i.e., 16 months of development with 16 months of testing and
refinement), the vendors should propose an alternative time segmentation. However, it is not intended
for the total contract to span more than 3 years, so cutting one period will result in a reduction in
another period.
4.2 Phasing
As noted earlier, the focus of this model development contract is on Phase 2 of the strategic plan, which
is known as the TPB TDFM Gen3. This model is to be developed and implemented with existing data, by
which we mean the 2007/2008 Household Travel Survey, any corresponding transit on-board surveys,
and any data that is currently available (data for model calibration is discussed later). The expected
phases of the Gen3 model contract are shown below:
1. Investigations: The first part of the 3-year project will be investigations. Each investigation will
be documented in a report or memorandum, each of which will be reviewed by TPB staff, and
schedule permitting, by the TFS.
2. Decisions: Based on the investigations, decisions will be made about the type of model, the
features to be included in the model, and the implementation software.
49 See, for example, Richard I. Roisman, “Travel Monitoring Program, Contractor Procurement” (January 19, 2018
meeting of the COG/TPB Travel Forecasting Subcommittee, held at the Metropolitan Washington Council of
Governments, Washington, D.C., January 19, 2018), 10.
5. Investigations 23
3. Development of TPB TDFM Gen3 model (16 months planned). As noted above, if the
investigations point to the need for more data collection to support new model development,
some of that data could be collected during this period of the contract. It is understood that
some of such data collected might not be ready for use in model development efforts until the
next phase of model development: Phase 3 of the strategic plan (TPB TDFM Gen4).
4. Consultant delivers model and model documentation to TPB staff
5. Testing phase (16 months)
6. Close of contract (about 3 years after the start of contract)
4.3 Expected budget
We anticipate a consultant funding level of $300k per year for each of three years. This means that, if
one consultant holds the contract for all three years, the total budget would be $900k. It is also possible
that added funding sources for special data collection efforts may be identified. Vendor proposals need
not include cost estimates for the RFI, but proposals must adhere to the time (3 years) and cost ($900k)
constraints.
4.4 Data for model calibration
Data for model calibration was discussed in Section 3.4.4 (“Observed data for estimation, calibration,
and validation of travel models”) on p. 17.
5 Investigations It is expected that the development of the TPB TDFM Gen3 model will begin with by a series of
investigations. Some of these investigations will be part of the RFI. Then, after the contract has been
awarded, more in-depth investigations will be undertaken by the consultant. Both are discussed below,
following a discussion of the long-term goal for the travel demand modeling process.
5.1 Long-term goal for the travel demand model
The long-term goal of the TPB staff, and for many modeling staff at large MPOs, is a disaggregate travel
demand model (such as an ABM) paired with a disaggregate travel supply model (such as DTA), which is
represented as Quadrant 4 in Table 6. The current TPB travel model includes both an aggregate
representation of demand (e.g., zone-level, trip-based, four-step model) and an aggregate
representation of supply (TAZ-level transportation network with a static traffic assignment), which is
represented as Quadrant 1 in Table 6. The question is which path is used to move from Quadrant 1 to
Quadrant 4, and what is the speed of the movement. Most of our peer MPOs have chosen to take the
following path: Quadrant 1 > Quadrant 3 > Quadrant 4. We do not expect that the Gen3 model will be
able to move directly to Quadrant 4, so the going assumption is that the Gen3 model will move to
either Quadrant 3 or Quadrant 2.
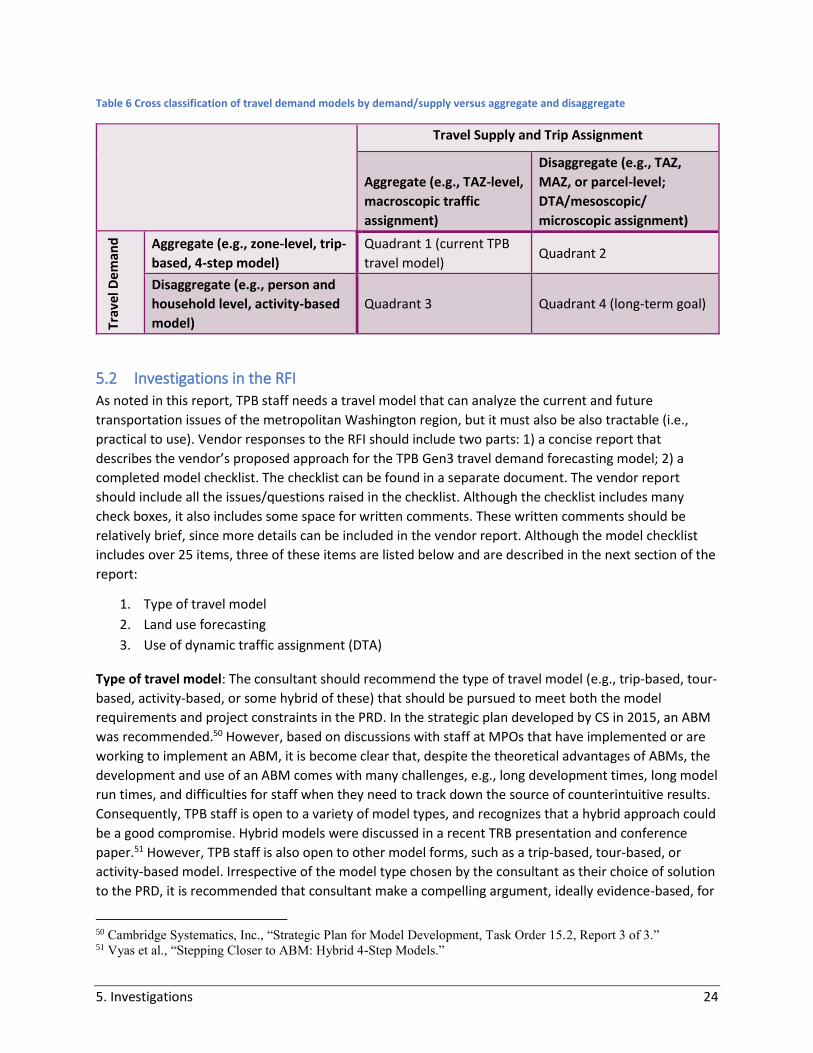
5. Investigations 24
Table 6 Cross classification of travel demand models by demand/supply versus aggregate and disaggregate
Travel Supply and Trip Assignment
Aggregate (e.g., TAZ-level,
macroscopic traffic
assignment)
Disaggregate (e.g., TAZ,
MAZ, or parcel-level;
DTA/mesoscopic/
microscopic assignment)
Trav
el D
em
and
Aggregate (e.g., zone-level, trip-
based, 4-step model)
Quadrant 1 (current TPB
travel model) Quadrant 2
Disaggregate (e.g., person and
household level, activity-based
model)
Quadrant 3 Quadrant 4 (long-term goal)
5.2 Investigations in the RFI
As noted in this report, TPB staff needs a travel model that can analyze the current and future
transportation issues of the metropolitan Washington region, but it must also be also tractable (i.e.,
practical to use). Vendor responses to the RFI should include two parts: 1) a concise report that
describes the vendor’s proposed approach for the TPB Gen3 travel demand forecasting model; 2) a
completed model checklist. The checklist can be found in a separate document. The vendor report
should include all the issues/questions raised in the checklist. Although the checklist includes many
check boxes, it also includes some space for written comments. These written comments should be
relatively brief, since more details can be included in the vendor report. Although the model checklist
includes over 25 items, three of these items are listed below and are described in the next section of the
report:
1. Type of travel model
2. Land use forecasting
3. Use of dynamic traffic assignment (DTA)
Type of travel model: The consultant should recommend the type of travel model (e.g., trip-based, tour-
based, activity-based, or some hybrid of these) that should be pursued to meet both the model
requirements and project constraints in the PRD. In the strategic plan developed by CS in 2015, an ABM
was recommended.50 However, based on discussions with staff at MPOs that have implemented or are
working to implement an ABM, it is become clear that, despite the theoretical advantages of ABMs, the
development and use of an ABM comes with many challenges, e.g., long development times, long model
run times, and difficulties for staff when they need to track down the source of counterintuitive results.
Consequently, TPB staff is open to a variety of model types, and recognizes that a hybrid approach could
be a good compromise. Hybrid models were discussed in a recent TRB presentation and conference
paper.51 However, TPB staff is also open to other model forms, such as a trip-based, tour-based, or
activity-based model. Irrespective of the model type chosen by the consultant as their choice of solution
to the PRD, it is recommended that consultant make a compelling argument, ideally evidence-based, for
50 Cambridge Systematics, Inc., “Strategic Plan for Model Development, Task Order 15.2, Report 3 of 3.” 51 Vyas et al., “Stepping Closer to ABM: Hybrid 4-Step Models.”
5. Investigations 25
their proposed solution. Evidence-based means citing examples where the proposed solution is being
used in practice. So, for example, if a consultant recommends developing a new trip-based model (which
implies shorter development times) with lots of new data collection, the consultant should make a
compelling case for why that is superior to recommending an activity-based model with no further data
collection (e.g., make a clear case for why the added complexity if offset by the benefits, and provide
evidence that the proposed model can be used by both TPB staff and the various regional modeling
stakeholders, principally state and local governments and consultants). Lastly, the consultant should also
make clear any changes to the travel model inputs (also discussed in Section 6.1.5, “Model inputs”). This
could include:
• Changes to the zone system, e.g., use of land ownership parcels or micro-analysis zones (MAZs)
• Changes to the transportation networks, e.g., use of more disaggregate networks to aid in non-
motorized modeling or representing access to transit.
• Changes to the land activity/land use data, which is currently input to the model at the TAZ
level.
Changes to any of the model inputs could require one or more years to implement, so consultants
should specify if these updates would be started during the development of the Gen3 model, even
though they might not be ready for use until the Gen4 model.
Land use forecasting: COG staff, working with local government staff, develop zone-level (TAZ-level)
land activity forecasts for the modeled area shown in Figure 1 using a process known as the Cooperative
Forecasts.52 This process is essentially a modified Delphi approach that combines both top-down
regional land activity forecasts from an econometric model with bottom-up zone-level land activity
forecast from the local jurisdictions. 53 This contrasts with other MPOs that use formal land use models,
instead of a Delphi process. In the 1970s, COG attempted to use the EMPIRIC land use model, but the
results were “disappointing.”54 Although it is unlikely that COG would replace its Cooperative
Forecasting process with a land use model, one could envision an approach where the Cooperative
Forecasting process is informed by a land use model.
Regarding land use models, there seems to be some debate about whether the use of an ABM
necessitates the use of a land use model. According to one East Coast MPO, use of an ABM does not
necessitate the move to a land use model. However, according to a West Coast MPO, use of an ABM
necessitates the use of a land use model. In consultant responses to the RFI, consultants should be
explicit about whether they are recommending changes to the current COG/TPB land use forecasting
practice. The following questions should be addressed:
• What is the recommended technique or model to use for land use forecasting?
52 “Cooperative Forecast,” Metropolitan Washington Council of Governments, 2018,
https://www.mwcog.org/community/planning-areas/cooperative-forecast/. 53 Greg Goodwin, “Cooperative Forecasting Program: Background and Draft Round 8.2 Estimates (Slides 9 and 10
Corrected on 4/4/13)” (March 22, 2013 meeting of the Travel Forecasting Subcommittee of the Technical
Committee of the National Capital Region Transportation Planning Board, held at the Metropolitan Washington
Council of Governments, Washington, D.C., March 22, 2013),
http://www.mwcog.org/committee/committee/archives.asp?COMMITTEE_ID=43. 54 Reid Ewing and Keith Bartholomew, “Comparing Land Use Forecasting Methods: Expert Panel Versus Spatial
Interaction Model,” Journal of the American Planning Association 75, no. 3 (2009): 347.
5. Investigations 26
• What is the recommended aggregation level (e.g., TAZs, MAZs, parcels)?
• Should there be a feedback loop between the land-use model and the travel model? If so, what
should be the general structure of this feedback loop?
Use of dynamic traffic assignment (DTA): Consultants recommending moving to a dynamic traffic
assignment (DTA) should make the case why it is better to move to a disaggregate supply sooner, rather
than later, and why it makes sense to move to a disaggregate supply model before moving to a
disaggregate demand model. Most MPOs in our peer group have elected to move to a disaggregate
demand model (e.g., ABM) first. The TPB staff recognizes that the ultimate goal is a disaggregate
demand model (such as an ABM) paired with a disaggregate supply model (such as DTA), but is
unconvinced that, given the current state of these models and computing technology, it makes sense to
move to this modeling structure for the Gen3 model.
Final note: In all cases, the goal of the consultant submissions is to make the case for the recommended
modeling strategy. The baseline case is always the existing, aggregate, trip-based four-step travel
demand model. In cases where consultants propose a new approach, they need to make a convincing
case for why the benefits of the new approach outweigh the costs. It is not enough to simply say that
model B is better than model A. If model B is more sophisticated or complicated, then it also comes with
added costs. The consultant submittals should make the case for why the added benefits of the new
model outweigh the added costs.
5.3 RFI: Use of consultant proposals
TPB staff intends to review the consultant proposals received in response to the RFI. As noted earlier,
TPB staff does not intend to share the consultant proposals with competing vendors or other outside
parties. TPB staff may have follow-up questions and dialog with one or more of the responding vendors.
Ideally, this follow-up would be conducted in writing (via email), with a copy to the COG Contracts and
Purchasing Office ([email protected]). If TPB staff feels a meeting is warranted, TPB staff will
consult with the COG Contracts and Purchasing Office before setting up such a meeting. TPB staff
intends to use the information supplied in the RFI responses to set some of the general parameters used
in the RFP. Thus, the TPB staff plans to pick the type of model (trip-based, tour-based, activity-based, or
hybrid), and other related issues, such as the possible use of a land use model, DTA, or more
disaggregate model inputs/supply-side data, to write the SOW for the RFP.
5.4 Investigations in the contract
Once the contract has been awarded, it is planned that one of the first tasks for the consultant will be to
conduct a series of investigations. These investigations should occur during the early part of the three-
year contract, since later work in the contract is dependent on the outcomes of the investigations. Each
of these investigations will be documented in a memo or report, which will then be reviewed by TPB
staff and, ideally, the TFS. Although some of the investigation topics are the same as were covered in the
RFI process, it is planned that the repeated investigated will be conducted in more depth than was used
in the RFI process. Additionally, there will also be one or more new investigations, which were not
covered as part of the RFI process.
5.4.1 Base investigations
As a minimum, there are likely to be three base investigations:
5. Investigations 27
1. Type of travel model
2. Land use forecasting
3. Use of dynamic traffic assignment (DTA)
Type of travel model: Suppose, for example, that, in the RFP, the TPB staff chose to solicit proposals for
a hybrid model. As part of the initial stages of the contract, the selected vendor would need to specify
and finalize several details, such as the type of hybrid model, and which components would be
aggregate versus disaggregate, and which components would be trip-based versus tour-based. Thus, this
investigation would provide the details about the type of model that would be developed by the
selected vendor later in the three-year contract.
Land use forecasting: The consultant should specify the details of the recommended land use
forecasting process, particularly if it is different from the current process (e.g., recommending the use of
a land use model; recommending an aggregation level that is different from the current TAZ-based
system).
Use of dynamic traffic assignment (DTA): Consultants who are recommending moving to DTA, should
conduct a more detailed investigation about the pros and cons of moving to DTA, to ensure that a
tractable model/process is developed. TPB staff is not expecting that the Gen3 model will make use of
DTA, so, if a consultant is recommending that DTA be part of the Gen3 model, then the consultant has to
make a strong case for the change.
5.4.2 Other investigations
In addition to the base investigations, there could be other investigations that the selected vendor
would conduct in the early phases of the contract to help define work that would be conducted in later
phases of the contract. For example, one such investigation could be about recommended software (see
below).
Recommended software: What is the best software to use to implement the new model? It is
possible/recommended that multiple software packages could be required to support the
recommended model? Below is a list of some of the key software packages:
1. Travel demand forecasting software, for path building, traffic assignment, and transit
assignment: Citilabs Cube (our current software), Caliper TransCAD, INRO EMME, PTV VISUM, or
even a combination of these. Each of these packages has strengths and weaknesses. In theory,
our current travel model and a future travel model could be implemented in any of these, but
aspects specific to the modeling needs for our region could make one package a better fit than
another.
2. Software to develop, edit, and maintain the transportation networks that are a primary input to
the travel model. We currently use a combination of ArcGIS, COGTools,55 and Cube Base. The
consultant should provide advice on the recommended spatial database/GIS system for editing
and managing transportation networks. Any system should allow storage of multiple network
scenarios and more than one user should be able to make edits at once.
55 Qiang Li and Jim Yin, “COGTOOLS User Guide, Revision 3.0” (Washington, D.C.: Metropolitan Washington
Council of Governments, National Capital Region Transportation Planning Board, October 17, 2013).
6. Model requirements 28
3. If we pursue specific new models, which software should be used?
a. ABM: CT-RAMP, DAYSIM, TourCast, ActivitySim
b. Land use model
c. DTA software
6 Model requirements The model requirements section of this report lists the model functionality and capabilities that we
would like to have in the TPB TDFM Gen3 travel model. The word “requirements” is used to mean
“expected” or “desired” capabilities. The reason for this is that we recognize that it may not be possible
to develop a model that meets every requirement in our list, given time and resource limitations. If a
functional requirement is a true requirement (as opposed to just desired functionality), then it will be
marked as “mandatory.” Mandatory requirements must be met, or the proposed model will be
deemed unacceptable. Additionally, each model requirement is given a priority ranking (high, medium,
and low), which is meant to help consultants develop their recommended set of improvements that will
provide the largest benefit.
General expectation: It is expected that the TPB TDFM Gen3 travel model, will be state of the practice,
or even state of the art, when compared to the models used by our peer MPOs (see Table 2).
6.1 Functional requirements
6.1.1 Minimum requirement (**mandatory**)
The current adopted, production-use travel demand forecasting model is called the TPB Travel Demand
Forecasting Model, Generation 2, Version 2.3.70 (TPB TDFM Gen2, Ver. 2.3.70). The Gen3 model must
have, as a minimum, all the functional capabilities of the current model. Additionally, the Gen3 model
must have the mandatory requirements listed in this section of the report, along with as many of the
non-mandatory requirements as possible. The documentation for the current model (the user’s guide,
calibration report, and validation memo, which were cited earlier) will provide the best information
about the functional capabilities of the current model.
6.1.2 Model form (**mandatory**)
As noted earlier in this report, TPB staff is open to many model forms (e.g., trip-based, tour-based,
activity-based, or some hybrid of these), provided the model
• Meets the requirements in this document,
• Addresses the modeling issues important to the metropolitan Washington region, and
• Conforms to the constraints described in this document.
Although the two most dominant model forms in the U.S. are aggregate trip-based models and
disaggregate activity-based models, TPB staff, nonetheless, encourages responding consultants/vendors
to consider the merits of a hybrid model, which could be a good compromise between an aggregate,
trip-based model and a disaggregate, activity-based model. Nonetheless, TPB staff is not committed, at
this time, to any one model form, so it is up to the responding consultant to make a compelling
argument for why the recommended model form is superior to the alternative model forms. “Model
6. Model requirements 29
form” is considered a mandatory item, since, by definition, every model in a proposal will have a model
form.
Note that, although this section is outlined using vernacular from trip-based models (e.g., “trip
generation,” “trip distribution,” “mode choice”), this is not meant to imply that the Gen3 model will be a
trip-based model. It is simply a way to structure functional requirements using a framework that is well
established in the travel demand forecasting industry.
6.1.3 Travel modes represented
As alluded to in the first requirement (6.1.1, “Minimum requirement (**mandatory**)”), the Gen3
model must be able to represent all travel modes represented in the current model. The list below
shows travel modes included in the current model, as well as some that are not, but could be, in a
Gen3 model. If a mode in the listed below is not included in the current model, it is noted as such:
1. Person travel
a. Motor vehicle
i. Private transportation: Low-capacity motor vehicles, such as cars/automobiles,
light-duty trucks, sports utility vehicles (SUVs), and motorcycles
1. Single-occupant vehicles (SOV)
2. High-occupant vehicles (HOV2, HOV3+)
ii. Public transportation
1. Fixed route, fixed schedule
a. Rail modes
i. Heavy rail (HR)
ii. Commuter rail (CR)
iii. Light rail transit (LRT)
iv. Streetcar (SR)
b. Non-rail modes
i. Local bus (MB)
ii. Commuter Bus (CB)
iii. Bus Rapid Transit (BRT)
iv. Shuttle bus service (not included in current model;
**low priority**)
v. Ferry (No ferry service is included in the current model,
though the model has the capability to represent ferry
service, coding them in a similar manner to bus routes)
2. Flexible route, flexible schedule (completely personalized services)
a. Low-capacity motor vehicles
i. Taxi/taxicab/taxi. Included in the current model, but not
in a very complete manner. Taxi travel is incorporated
in the current model as one of several
6. Model requirements 30
“exogenous”/“residual” trip purposes.56 (**medium
priority** to enhance representation in the model)
ii. Transportation Network Companies (TNC, not included
in the current model; **high priority**)
iii. Short-term car rental/car sharing, like car2go (not
included in the current model; **low priority**)
iv. Paratransit, such as MetroAccess (not included in the
current model; **low priority**)
b. Demand responsive transit (DRT), such as BRIDJ, which no
longer exists in the DC area (not included in the current model;
**low priority**)
b. Non-motorized (NM): Both walk and bike are included in the current model, but not as
distinct modes, and only in trip generation and access to transit (**high priority** to
improve representation of NM modes)
i. Walk
ii. Bike
1. Private use, privately owned
2. Public use, bikeshare (not included in the current model)
a. Stored in docks
b. Dockless
2. Freight
a. Medium truck
b. Heavy truck
3. Other commercial vehicles (some of this is freight, some of it is services)
TNCs are one component of a class of travel services known as shared mobility. A recent federal report
discusses ways that MPOs are thinking of using to improve the ability of the regional travel demand
model to represent shared mobility modes,57 including:
• Incorporating shared mobility in travel surveys
• Collecting data continuously
• Using off-model approaches to estimate shared mobility impacts
In addition to the travel modes that are handled in the current model, the Gen3 model should also be
able to address some new travel modes and/or better address some of the existing travel modes (i.e.,
56 Exogenous/residual travel consists of the following: 1) Through vehicle trips, a.k.a. external-to-external (XX)
vehicle trips, consisting of auto, commercial vehicle, heavy truck and medium truck; 2) External-to-internal (XI) and
internal-to-external (IX) vehicle trip-ends; 3) Miscellaneous vehicle trips, consisting of taxi, visitor/tourist and
school vehicle trips; and 4) Airport-passenger, auto-driver trips. Exogenous travel is not included in trip generation,
trip distribution, or mode choice. Instead, it is incorporated into the model stream at the time-of-day model, just
before traffic assignment. 57 “Integrating Shared Mobility into Multimodal Transportation Planning: Improving Regional Performance to Meet
Public Goals” (Washington, D.C.: U.S. Department of Transportation, Federal Highway Administration, February
2018), 28–30.
6. Model requirements 31
in a more robust manner). Travel modes that could either be added to the travel model or represented
in a more robust way are listed below (generally, in descending order of importance):
• Non-motorized (NM) trips: The current model represents NM trips in two manners: 1) trip
generation; and 2) as an access mode to transit for path building and mode choice. The Gen3
model should expand on this representation (**high priority**). This could be by moving the
representation deeper into the model chain, e.g., through to trip distribution and mode choice,
or by differentiating between walk and bike travel, or both. There are many MPO travel models
that now include these trips all the way through mode choice. Assigning walk/bike trips is still
exceedingly rare, but one or two MPOs may be doing this for bike trips (e.g., Portland, OR).
Enhanced modeling of NM trips could drive the need for more disaggregate transportation
networks (e.g., all streets, Open Street Maps) and more detailed area systems, such as micro-
analysis zones (MAZs), which appear to be in use or under development in San Diego, San
Francisco, Chicago, and Miami,58 so consultant responses may want to address the issue of or
need for improvements to the supply side of the model (more disaggregate transportation
networks and smaller zone sizes).
• Improved ability to distinguish transit sub-modes (**high priority**): Transit can be divided into
transit sub-modes such as local bus, express/commuter bus, BRT, streetcar, LRT, rapid
transit/heavy rail, and commuter rail. Both the current travel model (Gen. 2/Ver. 2.3) and one of
the current developmental models (Gen. 2/Ver. 2.5) can distinguish between transit sub-modes,
but they take two different approaches:
o Ver. 2.3: Complex mode choice model, but simple transit path builder and transit
assignment
o Ver. 2.5: Simple mode choice model, but complex transit path builder and transit
assignment
For example, in the Ver. 2.3 travel model, the mode choice model is complex. As shown in
Figure 2, the nested-logit (NL) model includes three auto modes (drive alone, shared ride 2
person, and shared ride 3+ person) and four transit modes (commuter rail, all bus, all Metrorail,
and combined bus/Metrorail). The four transit modes are stratified by three modes of access to
transit: Park and ride (PNR); Kiss and ride (KNR); and Walk.59 Thus, the mode choice model has
12 transit sub-modes. Although the mode choice model does not explicitly include certain
transit sub-modes, such as streetcar, BRT, and LRT, the travel model, including the mode choice
model, is, nonetheless, designed to deal with these transit sub-modes.60 Conversely, the transit
path builder and transit assignment in the Ver. 2.3 mode is relatively simple. Since the mode
choice model has delineated 12 transit sub-modes, the transit assignment model simply assigns
these sub-modes. Transit assignment is conducted for two time-of-day periods: peak and off-
peak. It is assumed that all home-based-work (HBW) trips occur in the peak period. All other trip
purposes are assigned in the off-peak period. Using a complex mode choice model and a simple
58 See, for example, Metropolitan Transportation Commission and Parsons Brinckerhoff, Inc., “Travel Model Two:
Strategic Supply Design,” Technical Paper (Metropolitan Transportation Commission, August 24, 2012), 2. 59 “User’s Guide for the COG/TPB Travel Demand Forecasting Model, Version 2.3.70: Volume 1 of 2: Main Report
and Appendix A (Flowcharts),” 169. 60 169–70.
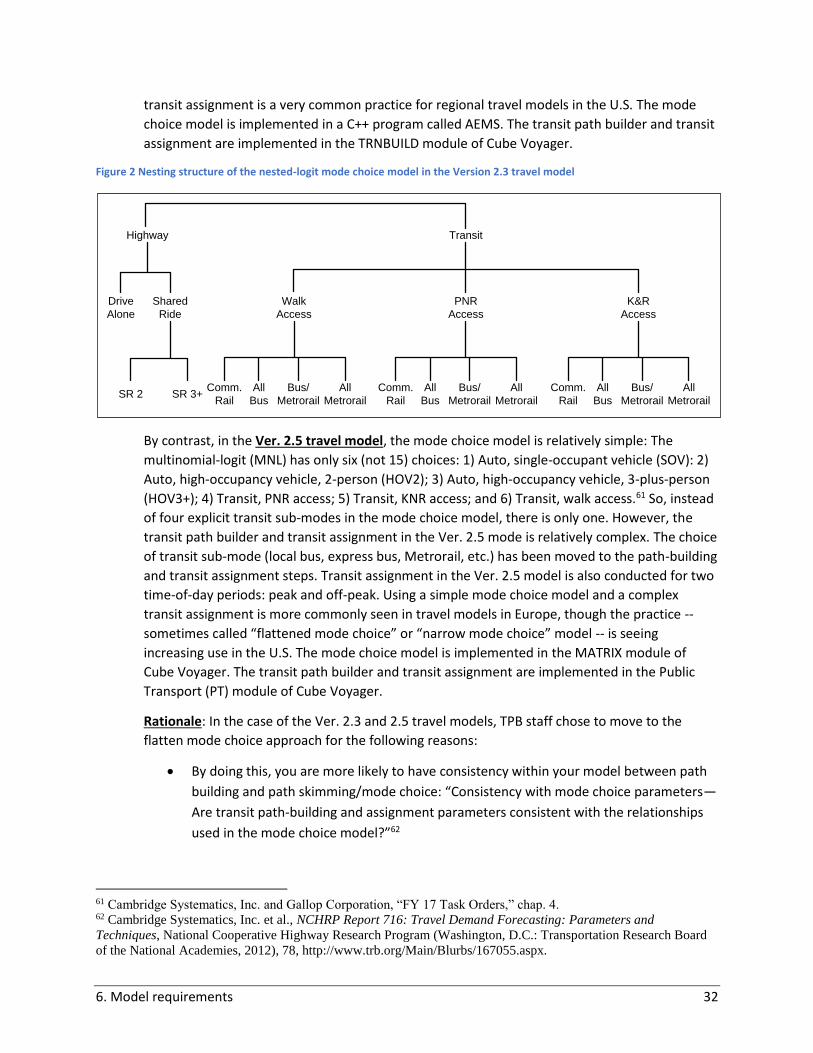
6. Model requirements 32
transit assignment is a very common practice for regional travel models in the U.S. The mode
choice model is implemented in a C++ program called AEMS. The transit path builder and transit
assignment are implemented in the TRNBUILD module of Cube Voyager.
Figure 2 Nesting structure of the nested-logit mode choice model in the Version 2.3 travel model
By contrast, in the Ver. 2.5 travel model, the mode choice model is relatively simple: The
multinomial-logit (MNL) has only six (not 15) choices: 1) Auto, single-occupant vehicle (SOV): 2)
Auto, high-occupancy vehicle, 2-person (HOV2); 3) Auto, high-occupancy vehicle, 3-plus-person
(HOV3+); 4) Transit, PNR access; 5) Transit, KNR access; and 6) Transit, walk access.61 So, instead
of four explicit transit sub-modes in the mode choice model, there is only one. However, the
transit path builder and transit assignment in the Ver. 2.5 mode is relatively complex. The choice
of transit sub-mode (local bus, express bus, Metrorail, etc.) has been moved to the path-building
and transit assignment steps. Transit assignment in the Ver. 2.5 model is also conducted for two
time-of-day periods: peak and off-peak. Using a simple mode choice model and a complex
transit assignment is more commonly seen in travel models in Europe, though the practice --
sometimes called “flattened mode choice” or “narrow mode choice” model -- is seeing
increasing use in the U.S. The mode choice model is implemented in the MATRIX module of
Cube Voyager. The transit path builder and transit assignment are implemented in the Public
Transport (PT) module of Cube Voyager.
Rationale: In the case of the Ver. 2.3 and 2.5 travel models, TPB staff chose to move to the
flatten mode choice approach for the following reasons:
• By doing this, you are more likely to have consistency within your model between path
building and path skimming/mode choice: “Consistency with mode choice parameters—
Are transit path-building and assignment parameters consistent with the relationships
used in the mode choice model?”62
61 Cambridge Systematics, Inc. and Gallop Corporation, “FY 17 Task Orders,” chap. 4. 62 Cambridge Systematics, Inc. et al., NCHRP Report 716: Travel Demand Forecasting: Parameters and
Techniques, National Cooperative Highway Research Program (Washington, D.C.: Transportation Research Board
of the National Academies, 2012), 78, http://www.trb.org/Main/Blurbs/167055.aspx.
Highway
Drive
Alone
Shared
Ride
SR 2 SR 3+Comm.
Rail
Bus/
Metrorail
All
Bus
All
Metrorail
Walk
Access
PNR
Access
K&R
Access
Transit
Comm.
Rail
Bus/
Metrorail
All
Bus
All
Metrorail
Comm.
Rail
Bus/
Metrorail
All
Bus
All
Metrorail
6. Model requirements 33
• Other large MPOs seem to be moving in this direction. For example, as noted in a recent
report by MTC, the MPO for San Francisco, CA, “Mode choice. As noted in Section 2
Model Design, a modified approach to trip mode choice/transit route choice will be
taken. Rather than the traditional creation of mode-weighted paths, the N best paths
will be created for each access/egress mode combination – possible access/egress
modes include walk, bicycle, and drive. The route choice model will then determine the
best of these paths for selection in the simulation.”63
• TCRP Report 166 seems to encourage this trend: “In technical modeling terms, the
mode choice model structure was revised to incorporate a path choice sub-nest in the
walk and drive access portion of the nested logit (NL) choice model. This process
required different path-building parameters for each path choice; these were developed
by synthesizing all reasonable path choices (486) and matching them to observed
behavior from the on-board transit survey.”64
• Our past on-call consultant recommended it: “Incorporating PT supported the ability to
explore alternative mode choice model structures, including having more of the transit
submode choice logic reside within the transit assignment step.”65
It is expected that the Gen3 mode choice model would likely use the “flattened mode choice”
approach, but it is up to each responding vendor to make the case for the approach that they
recommend.
• Taxis: Inclusion in a more detailed manner (**medium priority**). Although the Gen3 model is
to be developed with “existing” data (e.g., the 2007/2008 COG Household Travel Survey), there
could be other existing data sets, that were not used in the original calibration of the model (in
2012), but which are now available (and, hence, are still considered existing data) that could be
used. As one example, DC provides observed taxi cab data
(http://opendata.dc.gov/datasets?q=taxi).
• Transportation network companies (TNCs, **high priority**). TNCs exist in the DC region
currently, but are not included in the model, because they did not exist in the primary model
calibration data set (the 2007/2008 COG Household Travel Survey). As noted earlier, TNCs are
growing rapidly (one study in San Francisco, cited earlier, suggests that they may account for
20% of VMT in San Francisco). Unfortunately, there is a paucity of data for TNCs, since they are
private entities, but a recent TRB draft report did include some TNC data (from an unnamed
TNC) for DC and other cities.66 If any of our peer MPOs are including TNCs in their model, then
we would hope that TNCs could be included in our Gen3 model.
63 Metropolitan Transportation Commission and Parsons Brinckerhoff, Inc., “Travel Model Two: Strategic Supply
Design,” 13. 64 Maren Outwater et al., TCRP Report 166: Characteristics of Premium Transit Services That Affect Choice of
Mode (Washington, D.C.: Transportation Research Board of the National Academies, 2014), 26,
http://onlinepubs.trb.org/onlinepubs/tcrp/tcrp_rpt_166.pdf. 65 Cambridge Systematics, Inc. and Gallop Corporation, “FY 17 Task Orders,” 1–6. 66 Feigon and Murphy, “Broadening Understanding of the Interplay Between Public Transit, Shared Mobility, and
Personal Automobiles.”
6. Model requirements 34
• CAVs, privately owned by households, corporately owned fleets of vehicles for use by the
general public, or both (**medium priority**). To our knowledge, we do not know of any MPOs
that have an explicit capability to model CAVs, though several MPOs have done sensitivity
testing in this area (e.g., ARC67) and some researchers68 and consultants have also done
sensitivity tests in this area.69
• Ground transportation to/from the three commercial airports (ideally in a more explicit manner
than is currently done in the current model, **medium priority**). Airport auto driver trips are
input to the current model as one of the exogenous travel inputs. All person trips traveling
to/from the three commercial airports could be included in the Gen3 model in a more explicit
manner. A proposal to include such trips was developed in 2012, but, due to priorities at that
time, was never implemented.70 This issue is discussed more below.
• Short-term car rental/car sharing, such as car2go (**low priority**).
6.1.4 Modeling capabilities that span more than one model step
6.1.4.1 Managed lane facilities
According to a recent FHWA report, managed lanes are defined as “highway facilities or a set of lanes
where operational strategies are proactively implemented and managed in response to changing
conditions.”71 The report goes on to cite examples of managed-lane facilities, including high-occupancy
vehicle (HOV) lanes, value-priced lanes, high-occupancy toll (HOT) lanes, and exclusive or special-use
lanes. TPB’s current production-use travel model (Ver. 2.3.70) can represent and model managed-lane
facilities. The Gen3 model must also be able represent and model managed-lane facilities, using state-
of-the practice or state-of-the-art techniques. Shortcomings in the current model that could be
improved in the Gen3 model:
1. Elimination of the HOV3+ skim replacement (HSR) technique, which guarantees that HOV traffic
on HOT lanes will not suffer operationally from the paying HOT-lane traffic, but also necessitates
two model runs for every scenario that involves HOT lanes, which is most scenarios, now that
HOT lanes have been operating in Virginia since November 2012. The Ver. 2.3.70 model employs
67 “Model Development Technical Support,” Request for proposal (RFP) (Atlanta, Georgia: Atlanta Regional
Commission, October 2016). 68 Serbjeet Kohli and Luis G. Willumsen, “Traffic Forecasting and Autonomous Vehicles,” in Association for
European Transport Papers Repository (44th European Transport Conference, October 5-7, 2016, Barcelona, Spain,
2016), http://www.steerdaviesgleave.com/sites/default/files/elfinder/Traffic-forecasting-and-automated-vehicles-
Kohli-Willumsen.pdf. 69 See, for example, Kevin Johnson and Will Lisska, “Autonomous Vehicle Testing with the COG/TPB Model”
(January 27, 2017 meeting of the COG/TPB Travel Forecasting Subcommittee, held at the Metropolitan Washington
Council of Governments, Washington, D.C., January 27, 2017). 70 AECOM and Stump/Hausman Partnership, “FY 2012 Draft Final Report, COG Contract 12-006: Assistance with
Development and Application of the National Capital Region Transportation Planning Board Travel Demand
Model” (National Capital Region Transportation Planning Board, Metropolitan Washington Council of
Governments, July 13, 2012), chap. 8, http://www.mwcog.org/uploads/committee-
documents/aV1dWVhb20120720132722.pdf. 71 FHWA, “Managed Lanes: A Primer” (Washington, D.C.: U.S. Department of Transportation, Federal Highway
Administration, 2008), 5,
http://www.ops.fhwa.dot.gov/publications/managelanes_primer/managed_lanes_primer.pdf.
6. Model requirements 35
the HSR,72 but the next production model (Ver. 2.3.75 or greater) has been updated to remove
this procedure, which results in large savings in model run time. This update is considered to be
accomplished, but we are open to other suggested improvements in modeling managed-lane
facilities (**medium priority**).
2. Obtaining data for use in a future model update: It has always been a challenge to get observed
usage data on HOT lanes, which tend to be operated by private corporations that are unwilling
to provide usage data that they consider proprietary (**medium priority**).
6.1.4.2 Exogenous travel markets
The exogenous inputs in the current TPB travel model consist of four major markets: 1) Through vehicle
trips, a.k.a. external-to-external (XX) vehicle trips, consisting of auto, commercial vehicle, heavy truck
and medium truck; 2) External-to-internal (XI) and internal-to-external (IX) vehicle trip-ends; 3)
Miscellaneous vehicle trips, consisting of taxi, visitor/tourist and school vehicle trips; and 4) Airport-
passenger, auto-driver trips. Exogenous travel is not included in trip generation, trip distribution, or
mode choice. Instead, it is incorporated into the model stream at the time-of-day model, just before
traffic assignment. Consultant proposals should consider whether any of these markets can be included
in the Gen3 travel model in a more explicit manner (**medium priority**).
6.1.4.3 Travel to the region’s three commercial airports
This region is home to three commercial airports. COG/TPB staff have been conducting regional airport
system planning for over 30 years, in a process known as the Continuous Airport System Planning (CASP)
process, which involves working with the Federal Aviation Administration (FAA). Similarly, COG/TPB staff
have been conducting regional air passenger surveys, generally every two years, at the three
commercial airports for over 30 years, working in concert with the Metropolitan Washington Airports
Authority (MWAA, for DCA and IAD) and the Maryland Aviation Administration (MAA, for BWI).73
Here are some topics that may need addressing as part of the Gen3 model. First, transit trips to the
region’s three commercial airports are not well represented in the model. Could this be improved?
Second, we do not currently have an airport choice model, though work has been conducted in this area
in the past.74 Would the Gen3 model benefit from having an explicit airport choice model?
For any work relation the regional airport system, TPB travel modeling staff should coordinate with the
TPB Aviation Technical Subcommittee, particularly regarding any potential changes to the air passenger
survey, which may not contain all the variables that might be needed to estimate an airport choice
model (**medium priority**).
72 See, for example, “User’s Guide for the COG/TPB Travel Demand Forecasting Model, Version 2.3.70: Volume 1
of 2: Main Report and Appendix A (Flowcharts),” 31–34. 73 See, for example, Richard I. Roisman and Abdurahman Mohammed, “2011 Washington-Baltimore Regional Air
Passenger Survey: General Findings Report” (Washington, D.C.: National Capital Region Transportation Planning
Board, Metropolitan Washington Council of Governments, in cooperation with the Federal Aviation
Administration, May 2012). 74 See, for example, Geoffrey D. Gosling, “SCAG Regional Airport Demand Model: Literature Review” (Los
Angeles, California: Southern California Association of Governments, June 2003), 7,
http://www.scag.ca.gov/modeling/mtf/pdf/literaturereview062403.pdf.
6. Model requirements 36
6.1.4.4 Internal-to-external and external-to-internal transit travel
The current model represents internal-to-internal (II) transit travel, but not internal-to-external (IX) or
external-to-internal (XI) transit travel. This results in an underestimation of transit trips, particularly to
the three commercial airports, but also to Union Station, given the large share of commuter rail trips
coming from areas of Maryland that are north of BWI airport and thus external to the region’s modeled
area. This shortcoming has been identified in the past. A proposed solution was developed in 2012, but
1) it was never implemented, due resource limitations at the time; and 2) it was designed focused on
Metrorail trips, not all transit trips, so it did not include commuter rail.75 It is believed that external
transit trips constitute about 5% of Metrorail travel, but this ratio could be much higher in some parts of
the region, especially to/from the three commercial airports, or to/from Union Station (**high
priority**).
6.1.5 Model inputs
As alluded to earlier, the consultant should provide guidance on whether they recommend any changes
to the inputs to the travel model, both the transportation networks (supply side) and the land use
inputs, i.e.,
• Changes to the zone system, e.g., use of land ownership parcels or micro-analysis zones (MAZs)
• Changes to the transportation networks, e.g., use of more disaggregate networks to aid in non-
motorized modeling or representing access to transit.
• Changes to the land activity/land use data, which is currently input to the model at the TAZ
level.
(**high priority**)
6.1.5.1 Zone system
The modeled area for the TPB travel model is shown in Figure 1. It is divided into 3,722 transportation
analysis zones (TAZs), comprised of 3,675 internal zones and 47 external stations. The consultant should
provide advice on whether the current zone system is sufficient for future model development work, or
whether changes need to be made. Although the effort to develop a new zone system can be
substantial, possible motivations for such a change include the following:
• Need for smaller zones, such as micro analysis zones (MAZs) or even land parcels, to support a
disaggregate demand model.
• The American Association of State Highway and Transportation Officials (AASHTO) has recently
announced that, “Following the release of the Census Transportation Planning Products (CTPP)
2012-2016 dataset in early 2019, the Oversight Board to the CTPP Program is announcing it will
no longer include Transportation Analysis Zone (TAZ) and Transportation Analysis District (TAD)
geographies in future requests for special tabulations of the U.S. Census Bureau's American
75 AECOM and Stump/Hausman Partnership, “FY 2012 Report,” chap. 7.
6. Model requirements 37
Community Survey (ACS) data. Future CTPP special tabulation requests will include the standard
census block group geography instead.”76
• In 2007, COG and TPB developed a system of Regional Activity Centers and Clusters.77 Although
the clusters are no longer in use, the Regional Activity Centers are still in widespread use for
planning activities.78 If it is decided to move forward with a new TAZ or MAZ system, these zonal
boundaries should be developed with the Regional Activity Centers in mind, so that there is
alignment of zonal boundaries, when possible. This issue was also discussed by CS in 2009.79
6.1.5.2 Networks
6.1.5.2.1 Highway Networks
See above discussion on model inputs starting on p. 36.
Shape and curvature of network links: Travel demand models make use of transportation networks to
build zone-to-zone paths and perform trip assignment. There is no intrinsic need for the network links
(road segments) to have shape or curvature, only that the topology be correct. Thus, in many models,
links are represented as simply straight-line segments between nodes. However, there can be benefit to
networks with links that have accurate geometry. First, it improves the look of the networks, which is
especially important for developing reports and presentations. Second, it can lead to more accurate
networks, since accuracy of the network can be more easily compared with aerial photography. To add
geometry to network links, one generally needs an accurate all-streets network, coupled with processes
known as conflation. Once you have a network with geometrically correct links, modelers may still need
to select certain software settings to see the detailed geometry (e.g., in Cube Base, turn on “True Shape”
Display).
In the mid-1990s, TPB staff developed early versions of transportation networks for the model that were
“shape enabled.” Around 2009, TPB staff developed a tool to perform network conflation, which
resulted in networks with geometrically correct links.80 When the conflation work was done at COG, not
all links were given the true geometry. Specifically, freeway ramps were generally left as straight-line
segments. At this point, however, TPB staff and some modeling stakeholders see benefits of giving
proper geometry to freeway ramps. Adding curvature to the freeway ramps requires manual work, but
TPB staff hopes to implement such work over the next few years. TPB staff are open to solutions for
expediting this work (**priority medium**).
76 “AASHTO - CTPP - Policy Change on Small Geography,” American Association of State Highway and
Transportation Officials, February 22, 2018, http://ctpp.transportation.org/Pages/Policy-Change-on-Small-
Geography.aspx. 77 Metropolitan Washington Council of Governments, “Metropolitan Washington Regional Activity Centers and
Clusters” (Washington, D.C.: Metropolitan Washington Council of Governments, April 2007),
http://www.mwcog.org/uploads/pub-documents/ylhZVw20070828145020.pdf. 78 “Activity Centers - Data & Tools,” Metropolitan Washington Council of Governments, 2018,
https://www.mwcog.org/community/planning-areas/land-use-and-activity-centers/activity-centers/. 79 Cambridge Systematics, Inc., “Fiscal Year 2009 Task Reports,” Final Report (Washington, D.C.: National Capital
Region Transportation Planning Board, November 20, 2009), 4–8,
http://www.mwcog.org/transportation/activities/models/review.asp. 80 Martha Kile, “Network Conflation” (May 22, 2009 meeting of the COG/TPB Travel Forecasting Subcommittee,
held at the Metropolitan Washington Council of Governments, Washington, D.C., May 22, 2009).
6. Model requirements 38
6.1.5.2.2 Transit Networks
See above discussion on model inputs starting on p. 36.
6.1.5.2.2.1 Transit fares
The current TPB travel model (Ver. 2.3.) is implemented in Cube Voyager, including TRNBUILD. The
current developmental travel model (Ver. 2.5) is also implemented in Cube Voyager, but uses Public
Transport (PT). The fare development process for the current model (Ver. 2.3, TRNBUILD) has two main
parts and is described in Chapter 17 of the travel model user’s guide. First, Metrorail station-to-station
fares are calculated (MFARE1.S). These distance-based fares are a function of both the over-the-rail
distance and the Euclidean (“as-the-crow-flies”) distance between the two stations. Second, TAZ-to-TAZ
transit fares are calculated (MFARE2.S). For TAZ-to-TAZ interchanges whose minimum path includes
Metrorail for a portion of the path, the transit fare is the sum of the Metrorail station-to-station fare
plus the non-Metrorail (principally bus) TAZ-to-TAZ fare. For TAZ-to-TAZ interchanges that do not involve
Metrorail, the transit fare is simply non-Metrorail (principally bus) TAZ-to-TAZ fare. The procedure for
calculating the non-Metrorail transit fare relies on developing a non-Metrorail fare matrix (called a “bus-
fare” matrix, even though it includes non-bus modes such as commuter rail and LRT). Given that 1) we
intend to migrate from TRNBUILD to more sophisticated transit path builder (such as Citilabs PT or
another vendor solution) in the Gen3 model; and 2) these more sophisticated transit path builders
should allow us to use new methods for calculating TAZ-to-TAZ transit fares, as, for instance, was
discussed in Chapter 9 of a recent report from AECOM,81 then we would like to improve the way that
transit fares are handled in the Gen3 model (**medium priority**). These improvements could be based
on the work that was documented by AECOM.
6.1.5.3 Land use
See above discussion on model inputs.
6.1.5.4 External and through travel
The TPB travel demand forecasting model represents travel that occurs within the modeled area, called
internal-to-internal (II) travel. The model also represents trips that cross the external cordon, i.e.,
internal-to-external (IX) travel, external-to-internal (XI) travel, and through (XX) travel. These last three
travel markets are part of the exogenous travel inputs to the model, which are discussed elsewhere in
this document. The first two markets (IX and XI) are sometimes collectively referred to as “external
travel,” even though travel that is strictly external to the modeled area is not really represented in the
model.
In the past, consultants have made the following suggestions for mode improvements in this area.82
Also, TPB staff has recently realized that there are some other problems with the way that external
81 AECOM and Stump/Hausman Partnership, “Draft FY 2013 Final Report, COG Contract 12-006: Assistance with
Development and Application of the National Capital Region Transportation Planning Board Travel Demand
Model” (National Capital Region Transportation Planning Board, Metropolitan Washington Council of
Governments, July 1, 2013), chap. 9, http://www.mwcog.org/transportation/activities/models/review.asp. 82 See, for example, Vanasse Hangen Brustlin, Inc., “Results of FY 2006 Travel Forecasting Research”
(Washington, D.C.: National Capital Region Transportation Planning Board, Metropolitan Washington Council of
Governments, September 22, 2006), 10, 27–28, http://www.mwcog.org/transportation/activities/models/review.asp.
6. Model requirements 39
travel has been modeled. Although the issue has been present for several years, staff only recently
became aware of the issue, which manifests itself by the fact that these external trip ends seem to be
having a much longer trip length than they should. (**high priority**, though this issue is currently
being worked on by TPB staff).
6.1.5.5 Treatment of fuel prices
We currently use a fuel price of 10 cents per mile (2007 prices83) for both the base year and the out year
(i.e., no change in the real price of fuel). This is based on past consultant advice.84 No items currently
identified by TPB staff. We are open to suggested updates that are identified and proposed by
consultants. One possible consideration is the fact that, in the future, a sizable share of the fleet could
be powered by electricity or other alternative fuels (**medium priority**).
6.1.6 Socio-economic models
No items currently identified by TPB staff. We are open to suggested updates that are identified and
proposed by consultants (**low priority**).
6.1.7 Trip generation
Special generators: Some regional travel models make use of special generators, to account for places in
the region that generate trips in a way that cannot simply be accounted for by the zone-level land
activity data. Examples include universities, regional shopping malls, military installations, and
commercial airports. According to the on-call consultant in 2010, “The TPB model currently handles the
three commercial airports as special generators, but not universities, group quarters, regional shopping
centers, or military bases.”85 The consultant made a series of recommendations (p. 2-18), which should
be considered for the Gen3 model (**low priority**).
6.1.8 Trip distribution
The current TPB travel model uses a gravity-model trip distribution process (see Chapter 5 or the
calibration report). In 2009, CS had the following recommendation: “Review the intradistrict versus
interdistrict trip movements against the household and Census datasets. Test the option of using two
sets of friction factor curves, one for short trips and another for long trips.”86 In 2012, TPB staff noted
the following:
[TPB staff is open to this suggestion], but staff will require more detailed procedural guidance on
this recommendation. One of the technical problems staff encountered during the Version 2.3
model trip distribution validation was a pervasive underestimation of intra-jurisdictional trips,
particularly for the non-work purposes (where trip lengths are relatively short). Many of these
83 All costs and prices are deflated to year-2007 values for consistency, given that the model was calibrated to year-
2007 conditions using the 2007/2008 COG Household Travel Survey. 84 Cambridge Systematics, Inc., “Fiscal Year 2009 Task Reports,” 1–12. 85 Cambridge Systematics, Inc., “Fiscal Year 2010 Task Reports,” Final Report (Washington, D.C.: National Capital
Region Transportation Planning Board, November 16, 2010), 2–13,
http://www.mwcog.org/transportation/activities/models/review.asp. 86 Cambridge Systematics, Inc., “Fiscal Year 2009 Task Reports,” 2–19.
6. Model requirements 40
problems were treated with K-factors used to “encourage” trips to remain within the origin
jurisdiction. This recommendation may lead to a reduction in use of K-factors.
There have also been suggestions that the TPB travel model should shift from a gravity-model trip-
distribution model to a destination choice model. In 2009, CS noted “Though there is little doubt that
destination choice models are superior to gravity models, the value of migration may be limited if an
activity-based model is planned within a few years because re-estimation would be necessary”87 (**high
priority**).
6.1.9 Mode choice
Historically, most travel models in U.S. cities have featured a relatively complicated mode-choice model
and a relatively simple path-building/transit-assignment model. A newer trend has been to use a simpler
mode choice model, with more elaborate choices, such as transit sub-mode, made in the path-
building/transit-assignment process. This is sometimes called a “flattened mode choice model,” though
a more apt name might be a “narrower mode choice model.” As an example, the Ver. 2.3 mode choice
model has 15 modes and 12 transit submodes (i.e., four transit modes by three modes of access). By
contrast, the proposed, trip-based successor to the Ver. 2.3 model (the Ver. 2.5 model) incorporates a
flattened mode choice model, with the transit sub-mode choice decisions pushed down to the transit
path building and transit assignment stages. Although the Ver. 2.5 model is still not a production-use
model (it is undergoing testing by COG staff), it is likely that the Gen3 model will also feature a flattened
mode choice model, where transit sub-mode choice is made in the transit assignment stage. There is a
more detailed discussion of the trade-off between mode choice and transit path building/assignment,
including the distinguishing of transit sub-modes on pages 31 to 33 (**high priority**).
Ideally, any future mode choice model should meet Federal Transit Administration (FTA) guidelines for
the FTA Capital Investment Grant (CIG) Program, which includes 1) New Starts; 2) Small Starts; and 3)
Core Capacity Improvements. In past years, the TPB mode choice model has been identified as having
problems with meeting FTA guidelines for New Starts analyses.88 More recent reviews found fewer
problems with the mode choice model, but there still appear to be some issues that should be
addressed, e.g., (**medium priority**):
During the development of TPB Version 2.3 travel model, it appears that FTA guidance was
considered, to some extent, in the mode choice and path building processes, including ensuring
proper relationship between coefficients of in-vehicle time and coefficients of out-of-vehicle time
and consistency between weights used in path building and coefficient values in mode choice.
Further refinements could be pursued in light of this review to address findings with respect to
our review/comparison with the latest guidance. More broadly stated, mode choice coefficients
and constants such as cost coefficients and alternative specific constants need to be updated to
87 Cambridge Systematics, Inc., 2–20. 88 See, for example, Cambridge Systematics, Inc., 2–19.
6. Model requirements 41
be in the reasonable ranges recommended by the FTA, unless compelling evidence can be
provided otherwise.89
The current mode choice model makes use of seven superdistricts (which are used to create 20 district-
to-district geographic market segments) for the purposes of both model calibration and model
summary.90 CS in 2015 recommended that this system of superdistricts be removed (and we concur;
**high priority**):
The existing geographic segmentation, with 20 district-to-district interchanges, based on seven
superdistricts (DC core, VA core, DC urban, MD urban, VA urban, MD suburban, VA suburban),
was intended to capture geographic variations, but should be eliminated and replaced with
explicit variables that represent urban design and land use diversity and density.91
Nonetheless, the 20 geographic-market-segment-system was not dropped from the Ver. 2.5 model,
even though it was developed by CS (this omission was likely due to resource limitations).
If a new mode choice model is estimated/calibrated, our preference would be to first attempt to
estimate the coefficients using statistical methods, as opposed to starting with the more common
technique these days of setting coefficient values by fiat and simply calibrating the model based on an
automated, heuristic calibration method.
6.1.10 Trip assignment
6.1.10.1 Traffic assignment
Must include options for both fast-converging algorithms, such as origin-based assignment and
proportional assignment algorithms, which would permit the use of select-link analyses (**high
priority**). Regarding the speed of the model run, typically, about half the run time is due to the traffic
assignment. The current baseline model (Ver. 2.3.70) makes use of the Citilabs Cube Voyager 6.4.1
(specifically: bi-conjugate Frank-Wolfe traffic assignment algorithm). It should be noted that, although
select-link analyses are popular with many analysts, there is a theoretical problem with using them: the
lack of guarantee of a unique solution. Specifically, although the user equilibrium solution represents a
unique solution in terms of link flows, it does not guarantee a unique solution in terms of path flows.92
Thus, although there are theoretical reasons why select-link analyses should not be used (e.g., lack of
unique solution), they remain popular with some analysts, so it should be expected that that this
capability should continue to be a part of the Gen3 TDFM.
In the current model, drive-access-to-transit trips are not part of the highway assignment. Some
modeling stakeholders have noted that it would be useful to be able to include drive-access-to-transit
trips in the highway assignment. For example, stakeholders would like to be able to obtain from the
89 Cambridge Systematics, Inc., “Review of Transit Modeling with Respect to FTA Guidance, Task Order 15.3,”
Final Report (Washington, D.C.: Metropolitan Washington Council of Governments, National Capital Region
Transportation Planning Board, October 15, 2015), 23. 90 Milone et al., “Calibration Report for the TPB Travel Forecasting Model, Version 2.3,” 6–7 to 6–10 and 6–22 to
6–25. 91 Cambridge Systematics, Inc., “Review of Transit Modeling with Respect to FTA Guidance, Task Order 15.3,” 23. 92 Yosef Sheffi, Urban Transportation Networks: Equilibrium Analysis With Mathematical Programming Methods
(Englewood Cliffs, New Jersey: Prentice Hall, 1985), http://web.mit.edu/sheffi/www/urbanTransportation.html.
6. Model requirements 42
model both park-and-ride (PNR) and kiss-and-ride (KNR) drive-access trips. Stakeholders noted that, if
the trip tables from this assignment were made available, the tables could be manipulated to analyze
specific locations that are being considered for redevelopment (**medium priority**).
6.1.10.2 Transit assignment
Must be able to perform capacity-constrained assignment. May want to consider moving from
production-attraction assignment (the most common approach in the U.S.) to origin-destination
assignment (rarer in the U.S., but the dominant approach for highway assignment). May want to
consider moving from all-or-nothing assignment (the most common approach for transit assignment in
the U.S.) to a capacity-constrained assignment, which makes sense for large metropolitan areas with
well-used transit systems (**high priority**).
From 2000 to 2018, the TPB travel model made use of a modeling technique called the “Metrorail
constraint through the regional core.” This technique, also known as the “transit constraint through the
regional core,” even though it is specific to Metrorail service, is a technical adjustment to the trip tables
coming out of the mode choice process designed to reflect a WMATA policy assumption that, during
peak periods, the Metrorail system may have insufficient capacity to serve all the demand traveling to
and through the regional core.93 The Metrorail constraint was initiated by WMATA in 2000 to address
funding shortfalls restricting the expansion of the rail fleet. WMATA policy set the binding year, which
has most recently been set at 2020. This meant that, for any forecast year past 2020, the Metrorail
constraint is applied, i.e., any forecasted peak-period Metrorail trips that exceed the 2020 demand to
and through the regional core were shifted to other travel modes (specifically, auto person trips). In
2018, the District of Columbia, Maryland, and Virginia agreed to provide dedicated funding to WMATA
($500 million per year). Due to this historic funding agreement, the Metrorail constraint through the
regional core was eliminated as a step in the regional travel demand forecasting model.94
6.2 Usability requirements
6.2.1 Model run time
It is expected that the Gen3 model will have a reasonable model run time. The current production-use
trip-based model (Ver. 2.3.70) has a run time of about 17 hours. Our current developmental trip-based
model (Ver. 2.5) requires about 40 hours to run. For the Gen3 model, the model run time should be no
more than 24 hours, assuming a zone-level (TAZ-to-TAZ) analysis, as is the case with the current travel
model. If the Gen3 model operates at a more disaggregate level, e.g., micro-analysis zones (MAZs), for
one or more modeling steps, the consultant and the TPB staff will agree upon an acceptable model run
time. (**mandatory**)
6.2.2 Usage by TPB staff and other local-area modelers (state DOTs, local governments, consultants)
It is expected that the Gen3 TDFM will be able to be run by both TPB staff and other local-area
modelers, such as state DOTs, local governments, consultants, which is the case with the current Gen.
93 Milone, Moran, and Seifu, “User’s Guide for the COG/TPB Travel Demand Forecasting Model, Version 2.3.70:
Volume 1 of 2: Main Report and Appendix A (Flowcharts),” 31. 94 Jane Posey to Transportation Planning Board, “Amendments to the Visualize 2045 Air Quality Conformity Scope
of Work,” Memorandum, May 16, 2018.
6. Model requirements 43
2/trip-based model. Although it is understood that some model forms (such as tour-based, ABM, or
hybrid models) may require that model users receive training to be able to run the new model, it is
considered mandatory that the Gen3 model be able to be run by current model stakeholders. In other
words, any model form that requires consultant assistance to run, will not be considered acceptable.
Obviously, some consultant assistance may be necessary in the early stages, but, after an initial
introductory/training stage, consultant assistance should no longer be required to run, or, ultimately, to
update, the Gen3 model. See, also, the section, below, on Support Requirements. (**mandatory**)
6.2.3 Sub-area analysis
The TPB is a regional entity and focuses on regional transportation planning activities. Nonetheless,
consultants, local governments, and, on rare occasions, MPO staff, develop subarea models for project-
planning studies and corridor-level studies. Several COG/TPB modeling stakeholders have identified a
need to have an easier way to develop subarea models from the regional TPB travel demand model. The
TPB travel model is implemented in Citilabs Cube software, which does have methods for creating
subnetworks and submodels (e.g., subarea network extraction), but several stakeholders have identified
a need to have an easier way to develop subareas and submodels (**priority medium**).
6.3 Technical requirements
6.3.1 Hardware
We currently conduct runs of the regional travel demand forecasting model using four travel model
servers, known as tms4, tms5, tms6, and tms7. The computer specifications of these servers can be
found in our recent model documentation.95 It is expected that we will buy a new travel model server
(tms8) in 2018 that will have similar, but, hopefully, better, specs to tms7. Although COG has a server
room on the second floor of 777 N. Capitol Street, where the travel model servers are kept, we are
aware that there is a trend in many agencies of moving some or all servers to the cloud (i.e., the servers
are stored in a remote location). So, it is possible, in the future, that we might seek a hardware solution
that works with cloud computing.
6.3.2 Current and future software used
We currently use Citilabs Cube software to implement our model. The current production model (Gen.
2/Ver. 2.3) is designed to run within a command window, using a series of Windows batch files and Cube
Voyager scripts (and one Fortran program for the mode choice stage). Although TPB staff is comfortable
running the model in the command-line mode, TPB staff is open to other ways to implement the model,
such as using another execution software environment (e.g., Windows PowerShell, Python, Cube PILOT)
or a graphical user interface (GUI), such as Cube Scenario Manager and Cube Application Manager
(**medium priority**). Some local modeling stakeholders have expressed an interest in moving from a
command-line interface for running the model to a GUI.
95 Milone, Moran, and Seifu, “User’s Guide for the COG/TPB Travel Demand Forecasting Model, Version 2.3.70:
Volume 1 of 2: Main Report and Appendix A (Flowcharts),” sec. 3.3.
6. Model requirements 44
6.3.3 Version control system and bug-tracking software
We believe that there could be major benefits to using a version control system and a bug-tracking
software package to manage the scripts and batch files that make up the model code. We have done
some in-house experimentation with Git and GitHub, but we have not implemented a system that can
be used by all TPB modeling staff and external users (mainly consultants) who might use or modify the
model code. For the RFP/contract phase, we would like consultant assistance to choose the best system
for our group and to get it implemented, including training staff or identifying the best written or online
training methods (**high priority**).
6.3.4 Software to manage transportation networks used by the travel model
A database is a self-describing collection of data, usually in the form of integrated records. A spatial
database is a self-describing collection of spatial data. A relational database is a database consisting of
“relations,” also known as tables, typically with explicit relationships between tables, such as one-to-
one, one-to-many, and many-to-many. A database management system (DBMS) is a set of programs
used to define, administer, and process a database. A DBMS is often used to ensure that data tables do
not contain duplicates and to enforce referential integrity between data tables. A geographic
information system (GIS) is a type of spatial DBMS.
We currently use a series of series spatial databases (Esri personal geodatabases) to store the
transportation networks used as inputs to the travel demand forecasting model. Our spatial DBMS is
ArcGIS, along with an ArcGIS add-in called COGTools, which was developed for COG by a consultant and
now maintained by TPB staff. One question for the consultant would be whether our current system to
manage transportation networks is optimal and whether it is up to the task if we make a move to
enhance the detail of our networks or our TAZ system (e.g., move to more disaggregate MAZs)
(**medium priority**).
6.4 Support requirements
6.4.1 Expectations about TPB staff and consultant support (**mandatory**)
It is expected that there will not be radical changes to the size and expertise of the TPB staff. It is
assumed that as staff retire or accept jobs in other agencies, these vacant positions will be refilled with
new staff. It is expected that there may need to be training to bring current and new TPB staff up to
speed on any new modeling methods. TPB staff can currently develop, maintain, and improve the
current trip-based model with only limited consultant assistance. Modeling solutions will be preferred
that continue this trend, i.e., that TPB staff can take care of most needs associated with developing,
maintaining, and improving the Gen3 travel demand model.
It is assumed that TPB staff will continue to use consultant support to develop, maintain, and improve
the Gen3 travel demand model. Table 7 provides the expected division of labor between TPB staff and
the consultant. From the table, it should be clear that TPB staff hopes to be involved with all steps of the
model development process. This contrasts with some MPO/consultant arrangements where the
consultant does all the model development work and the MPO is focused solely on running the model.
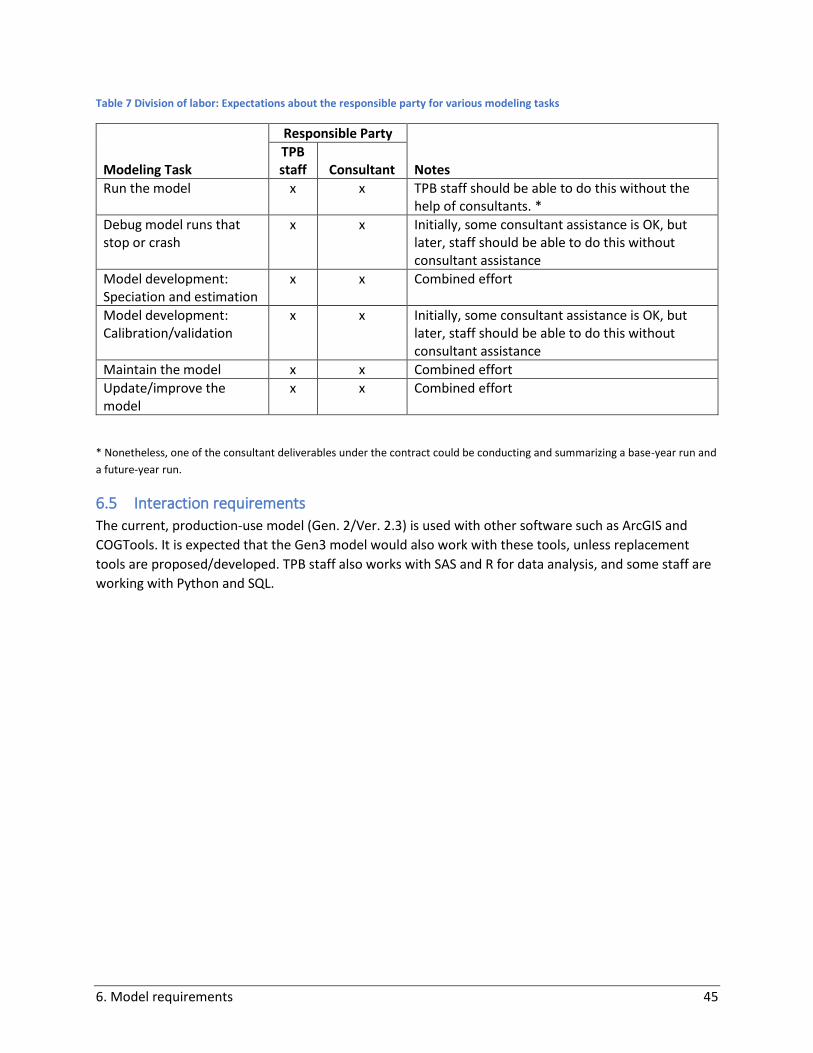
6. Model requirements 45
Table 7 Division of labor: Expectations about the responsible party for various modeling tasks
Modeling Task
Responsible Party
Notes TPB staff Consultant
Run the model x x TPB staff should be able to do this without the help of consultants. *
Debug model runs that stop or crash
x x Initially, some consultant assistance is OK, but later, staff should be able to do this without consultant assistance
Model development: Speciation and estimation
x x Combined effort
Model development: Calibration/validation
x x Initially, some consultant assistance is OK, but later, staff should be able to do this without consultant assistance
Maintain the model x x Combined effort
Update/improve the model
x x Combined effort
* Nonetheless, one of the consultant deliverables under the contract could be conducting and summarizing a base-year run and
a future-year run.
6.5 Interaction requirements
The current, production-use model (Gen. 2/Ver. 2.3) is used with other software such as ArcGIS and
COGTools. It is expected that the Gen3 model would also work with these tools, unless replacement
tools are proposed/developed. TPB staff also works with SAS and R for data analysis, and some staff are
working with Python and SQL.
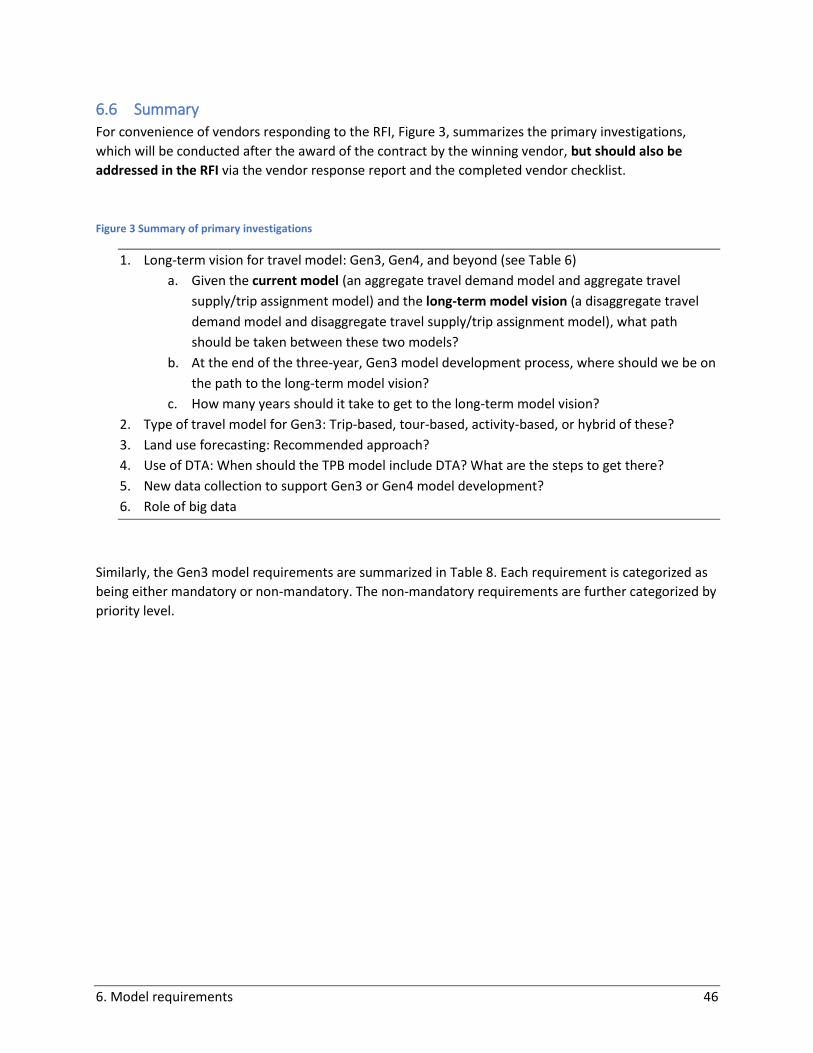
6. Model requirements 46
6.6 Summary
For convenience of vendors responding to the RFI, Figure 3, summarizes the primary investigations,
which will be conducted after the award of the contract by the winning vendor, but should also be
addressed in the RFI via the vendor response report and the completed vendor checklist.
Figure 3 Summary of primary investigations
1. Long-term vision for travel model: Gen3, Gen4, and beyond (see Table 6)
a. Given the current model (an aggregate travel demand model and aggregate travel
supply/trip assignment model) and the long-term model vision (a disaggregate travel
demand model and disaggregate travel supply/trip assignment model), what path
should be taken between these two models?
b. At the end of the three-year, Gen3 model development process, where should we be on
the path to the long-term model vision?
c. How many years should it take to get to the long-term model vision?
2. Type of travel model for Gen3: Trip-based, tour-based, activity-based, or hybrid of these?
3. Land use forecasting: Recommended approach?
4. Use of DTA: When should the TPB model include DTA? What are the steps to get there?
5. New data collection to support Gen3 or Gen4 model development?
6. Role of big data
Similarly, the Gen3 model requirements are summarized in Table 8. Each requirement is categorized as
being either mandatory or non-mandatory. The non-mandatory requirements are further categorized by
priority level.
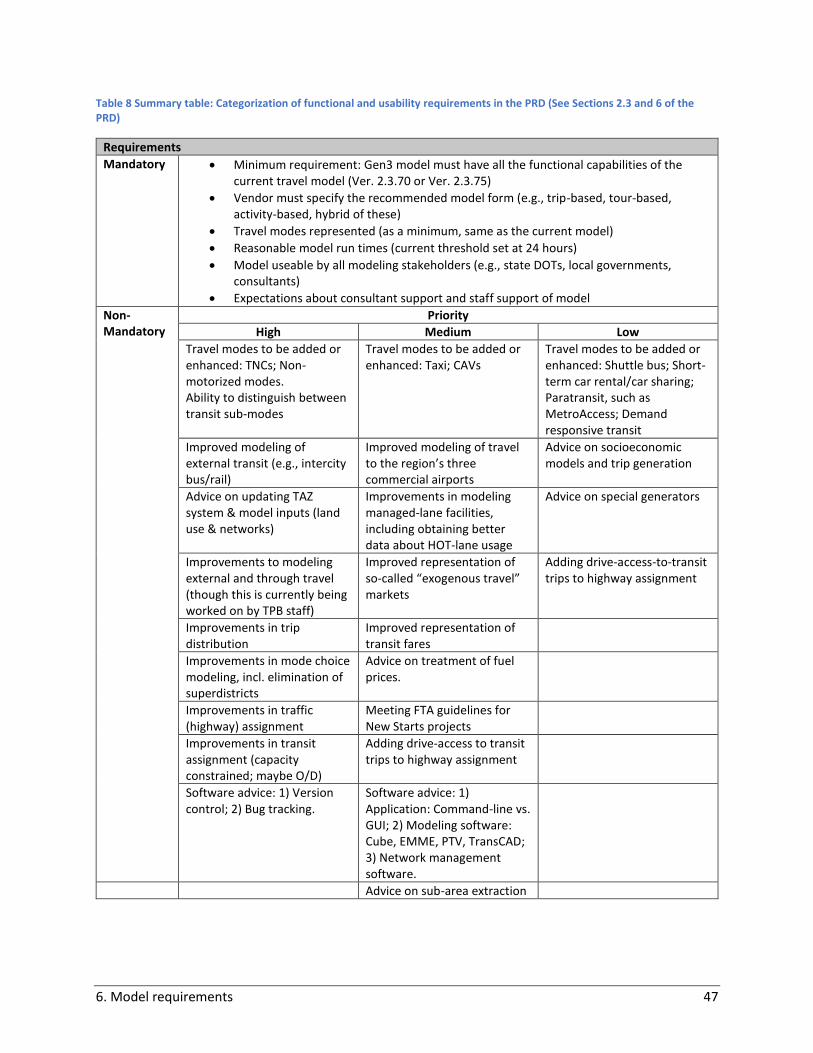
6. Model requirements 47
Table 8 Summary table: Categorization of functional and usability requirements in the PRD (See Sections 2.3 and 6 of the PRD)
Requirements
Mandatory • Minimum requirement: Gen3 model must have all the functional capabilities of the current travel model (Ver. 2.3.70 or Ver. 2.3.75)
• Vendor must specify the recommended model form (e.g., trip-based, tour-based, activity-based, hybrid of these)
• Travel modes represented (as a minimum, same as the current model)
• Reasonable model run times (current threshold set at 24 hours)
• Model useable by all modeling stakeholders (e.g., state DOTs, local governments, consultants)
• Expectations about consultant support and staff support of model
Non-Mandatory
Priority
High Medium Low
Travel modes to be added or enhanced: TNCs; Non-motorized modes. Ability to distinguish between transit sub-modes
Travel modes to be added or enhanced: Taxi; CAVs
Travel modes to be added or enhanced: Shuttle bus; Short-term car rental/car sharing; Paratransit, such as MetroAccess; Demand responsive transit
Improved modeling of external transit (e.g., intercity bus/rail)
Improved modeling of travel to the region’s three commercial airports
Advice on socioeconomic models and trip generation
Advice on updating TAZ system & model inputs (land use & networks)
Improvements in modeling managed-lane facilities, including obtaining better data about HOT-lane usage
Advice on special generators
Improvements to modeling external and through travel (though this is currently being worked on by TPB staff)
Improved representation of so-called “exogenous travel” markets
Adding drive-access-to-transit trips to highway assignment
Improvements in trip distribution
Improved representation of transit fares
Improvements in mode choice modeling, incl. elimination of superdistricts
Advice on treatment of fuel prices.
Improvements in traffic (highway) assignment
Meeting FTA guidelines for New Starts projects
Improvements in transit assignment (capacity constrained; maybe O/D)
Adding drive-access to transit trips to highway assignment
Software advice: 1) Version control; 2) Bug tracking.
Software advice: 1) Application: Command-line vs. GUI; 2) Modeling software: Cube, EMME, PTV, TransCAD; 3) Network management software.
Advice on sub-area extraction
7. Deliverables 48
7 Deliverables The goal of the RFI process is to solicit ideas from vendors/consultants about a proposed solution to the
Gen3 TDFM that meets the requirements of the PRD. It is expected that vendors/consultants who chose
to respond to the RFI will deliver two items to COG:
1. A concise report that explains and justifies the vendor’s proposed approach for the TPB’s Gen3
travel demand forecasting model.
2. A completed model checklist that describes the vendor’s proposed approach for the TPB’s Gen3
travel demand forecasting model. A blank copy of the model checklist will be provided along
with the PRD.
Below are some notes about the two deliverables.
7.1 Vendor’s model checklist regarding proposed modeling solution for Gen3 model
1. Each vendor/consultant should submit a completed model checklist. The model checklist is
simply a summary of the proposed modeling approach.
2. All items in the checklist refer to your proposal for the TPB Gen3 model, unless noted otherwise.
3. File format: The checklist is provided in Microsoft Word format to make it easy to complete.
Checkboxes can be checked or unchecked. There are also spaces provided for more free-form
responses to some questions.
4. The checklist contains mostly checkboxes. For any items marked “please specify,” it is assumed
that you will specify briefly on this checklist and will provide more detail in your written report.
There is no need to include all the detail in your report in the model checklist.
7.2 Vendor’s report containing proposed modeling solution for Gen3 model
1. The report should be concise
a. It should have no more than 30 pages of content about the vendor’s proposed
solution/approach. This does not include the title page or the table of contents.
b. There can be one page of information about the firm, but there is no need to include
information about specific people working at the firm. That information is more suited
for vendor proposals to the upcoming RFP, not the RFI.
2. In theory, your report should cover, as a minimum, the items in the checklist. If your report does
not include one or more of the items on this checklist, we will assume that you do not think
those items are a top priority.
3. The vendor report should make a compelling (ideally evidence-based) case for why their
proposed solution is better than alternate visions for an updated model.
4. File format: The vendor report should be supplied to COG in both Microsoft Word and PDF
format.
5. As a minimum, vendor response reports should cover all the mandatory requirements in the
PRD, and some or all the non-mandatory requirements.
As noted earlier, the RFI is not being used for pre-qualification, which means that vendors are not
required to respond to the RFI to respond to the upcoming RFP.