Embed Size (px)
Citation preview

Authors: Tutor: Examiner:
Subject: Level and semester:
Product Placement A study about Swedes attitude towards product placements in Movies and TV-shows
PhD. Rana MostaghelPhD. Pejvak OghaziMarketingBachelor´s �esis, Spring 2012
Jens AbrahamssonMarketing Programme
Niclas LindblomMarketing Programme

2
Abstract
Marketers have always been looking for alternative ways to reach the target population with
their messages. One approach that has grown the last decades is product placement that has
become a large arena for companies to involve in their marketing communication. It has
been shown that people tend to dislike traditional advertisement such as commercial brakes
in TV and tries to avoid it by switching channel. Since product placement is a type of
advertisement that is embedded in a movie or TV-show and cannot be zapped away without
missing the story of the movie or TV-show, it is a good opportunity to reach out with a
company’s message.
Several studies have been done in the field of mapping the attitudes towards product
placement but no research has been done with the Swedish audience in focus. Therefore the
purpose of this thesis is: “…to investigate what attitudes the Swedish audience has towards
product placements in Movies and TV-shows”, which will lead to a greater knowledge for
Swedish marketing managers about the attitudes towards product placement in Sweden.
This thesis is a quantitative study with a descriptive single cross-sectional design. The data
was retrieved through a questionnaire online. The sample frame was generation Y which is
people that are between the ages 18-35.
The study showed that the general attitude towards product placement is positive for the
Swedish audience. When it comes to the different dimensions of product placement; visual-
only, audio-only and a combination audio-visual it is shown that the visual placements is
seen as the most positive way to place a product in a movie or a TV-show. It could also be
seen several similarities with previous studies that prominent placement has a lower
attitude while a subtle placements has a more positive attitude.
Keywords: Product Placement, Attitudes, Brand, Brand Recall, Generation Y

3
Acknowledgement First of all we would like to thank our supervisor Dr. Rana Mostaghel at Linnaeus
University, Sweden, for her help and guidance through our process writing this
thesis. We are also thankful for Dr. Magnus Hultman at Leeds University,
England, guidance in writing the methodology chapter and Dr. Vinit Parida for
overall feedback at the seminars.
Also in order to make this thesis possible we would like to direct a grateful
thanks to our respondents that participated in our questionnaire.
Last but by no means least we would like to thank our friends and families that
has been supporting during the whole process.
Linnaeus University, Växjö
Spring 2012
Jens Abrahamsson Niclas Lindblom

4
Table of Content
1. Introduction .................................................................................................................. 7
1.1 Background ....................................................................................................................... 7
1.1.1 How about in Sweden? .............................................................................................. 8
1.2 Problem Discussion .......................................................................................................... 9
1.3 Purpose ........................................................................................................................... 11
2. Literature Review ........................................................................................................ 12
2.1 What is a Brand? ............................................................................................................ 12
2.1.1 Communicating the Brand ...................................................................................... 13
2.1.2 How can a message affect consumers? .................................................................. 14
2.2 Attitudes ......................................................................................................................... 14
2.2.1 Three components of attitudes ............................................................................... 15
2.2.2 The functional theory of attitudes ........................................................................... 15
2.3 Product Placement ......................................................................................................... 16
2.3.1 Product placement appearance .............................................................................. 16
2.3.2 Different dimensions of product placement ............................................................ 17
2.3.3 Advantages and disadvantages with product placements ..................................... 19
2.4 Results of previous researches within product placement ............................................ 20
3. Conceptualization ....................................................................................................... 23
3.1 Research discussion and research gap ........................................................................... 23
3.1.1 Research Questions ................................................................................................. 25
3.2 Conceptual framework ................................................................................................... 25
4. Methodology .............................................................................................................. 27
4.1 Research Approach ........................................................................................................ 27
4.1.1 Inductive vs. Deductive Research ............................................................................ 27
4.1.2 Qualitative vs. Quantitative Research ..................................................................... 28
4.2 Research Design ............................................................................................................. 29
4.3 Data Sources ................................................................................................................... 31
4.4 Research Strategy ........................................................................................................... 32
4.5 Data collection method .................................................................................................. 33
4.6 Survey Design ................................................................................................................. 34
4.6.1 Operationationalization and measurement of variables ........................................ 34
4.6.2 Questionnaire design ............................................................................................... 36
4.6.3 Pretesting ................................................................................................................ 38
4.7 Sampling ......................................................................................................................... 38

5
4.7.1 Sampling frame ....................................................................................................... 39
4.7.2 Sample selection and data collection procedure..................................................... 39
4.8 Data analysis method ..................................................................................................... 40
4.8.1 Descriptive statistics ................................................................................................ 41
4.8.2 Correlation analysis ................................................................................................. 41
4.8.3 One-Sample T-Test .................................................................................................. 42
4.9 Quality Criteria ............................................................................................................... 42
4.9.1 Content validity ....................................................................................................... 42
4.9.2 Construct validity ..................................................................................................... 42
4.9.3 Reliability ................................................................................................................. 43
5. Analysis and Results .................................................................................................... 44
5.1 Descriptive statistics ....................................................................................................... 44
5.2 Reliability & Validity ....................................................................................................... 47
5.3 Correlation Analysis ........................................................................................................ 48
5.4 Analysis of the Research Questions ............................................................................... 50
6. Discussion & Conclusion .............................................................................................. 54
6.1 Discussion ....................................................................................................................... 54
6.1.1 Conclusion ............................................................................................................... 57
6.2 Theoretical & Managerial Implications .......................................................................... 57
6.3 Limitations ...................................................................................................................... 58
6.4 Suggestions for future research ..................................................................................... 59
Reference ....................................................................................................................... 61
Appendix 1 – Swedish questionnaire ................................................................................... 67
Appendix 2 – English questionnaire ..................................................................................... 71
Appendix 3 – T-test .............................................................................................................. 75

6
List of Figures
Figure 3.1: Conceptualization Model ....................................................................................... 24
Figure 4.1: Deduction vs. Induction .......................................................................................... 28
Figure 4.2: “A classification of Marketing Research Designs” (Malhotra, 2010, p.103). ......... 31
Figure 4.3: “Relevant Situations for Different Research Methods” (Yin, 2008, p. 9) ............... 32
Figure 4.4: “Calculation of Sample Size”, Formula from (Malhotra, 2011) .............................. 40
Figure 5.1: PP3 - Ethical side of product placement ................................................................. 47
Figure 5.2: PCP2 - Match the Story........................................................................................... 47
Figure 5.3: Product Placement (PP) .......................................................................................... 50
Figure 5.4: Visual (VIS) .............................................................................................................. 50
Figure 5.5: Audio (AUD) ............................................................................................................ 51
Figure 5.6: Visual & Audio (VAP) .............................................................................................. 51
Figure 5.7: Plot Connection (PCP) ............................................................................................. 52
Figure 5.8: Prominent (PRO) ..................................................................................................... 52
Figure 5.9: Subtle (SUB) ............................................................................................................ 53
List of Tables
Table 3.1 - Research Constructs and their Definitions ............................................................. 25
Table 4.1 - Measurement and scaling construct ...................................................................... 35
Table 5.1 - How often do you watch Movies? .......................................................................... 46
Table 5.2 - How often do you watch TV-shows? ...................................................................... 46
Table 5.3 - Correlations & Cronbach Alpha .............................................................................. 49

7
Chapter 1.
1. Introduction 1.1 Background
randing is a way to differentiate a company from others in the competitive market.
A Brand is build up by a name with different signs, symbols and attributes that
together makes a company´s brand unique (Armstrong et al., 2009). Through
marketing communication a company can be able to promote its products or services for the
consumers. Even if a company has good products or services it is still important that
prospect customers recognize their existence and learn about the value the company can be
able to give them. Therefore marketing communication is essential for a company’s success
(Lovelock & Wirtz, 2010).
According to Armstrong et al. (2009) companies advertising strategy is consisted of two
elements: the created advertising message and the selection of advertising media. In a world
where an average person is exposed to around 1,600 ad messages a day, advertising can
only succeed if the ad gains attention and is communicated well (Armstrong et al., 2009).
B

8
Marketers are always looking for alternative methods to convey their messages and
communicate with their target population. One approach that has continued grown and
received attention the last decades is product placements (Balasubramanian, Karrh &
Patwardhan, 2006; van Reijmersdal, Neijens & Smit, 2009; Karniouchina, Uslay & Erenburg,
2011). The practice of product placements where brands are placed into media content,
mainly in movies and TV-shows is not new. Product placements have a history back to the
mid-1890s but it was not until 1982 with the blockbuster movie “E.T.: The Extra Terrestrial”
with the placement of Reese’s Pieces candy that the real product placements industry was
born. After the movie release, Reese’s Pieces increased their sales with 65 % and other
marketers saw the benefits with product placements (Newell, Salmon & Chang, 2006;
Balasubramanian, Karrh & Patwardhan, 2006; Gregorio & Sung, 2010).
For what has been an effective tool for reaching audiences for more than 50 years, the role
of product placements has shifted from being a part of the background settings to being a
substantial part of a movie or TV-show (Yang & Roskos-Ewoldsen, 2007). For instance that
James Bond is driving a kitted up Aston Martin car in the movie Casino Royale (Campbell,
2006) and in the movie Castaway (Zemeckis, 2000) where Tom Hanks is stranded on a empty
island with numerous of FedEx packages that helps him to survive and he even creates a
relationship with a Wilson volleyball, that he aptly names Wilson. The different types of
product placement can be divided into two types of placements; prominent and subtle.
Prominent placements is easy to notice and can be very obvious through showing, using or
talking about the brand while subtle placement is harder to notice and does often occur in
the background (Ferraro & Avery, 2000).
1.1.1 How about in Sweden? Peter Carnello, CEO at InBetween Entertainment, has worked with product placement in
Sweden since 1991. In an interview in 2011 with the newspaper Svenska Dagbladet, SvD, he
estimates that the product placement category of advertisement has a turnover between
500 million - 1 billion SEK per year in Sweden (svd.se). In a recent report from IRM-Media
their study shows that the whole advertisement industry in Sweden had a turnover at 32
billion SEK in 2011, where 6.5 billion was internet advertising and 5.7 billion were regular TV-
commercials (irm-media.se). In relation to the whole Swedish advertising industry, product
placement represents only about 1.6-3.1% of the total turnover.
9
Since 2010 the Swedish government decided a new law around product placement in
Swedish television and movies. Earlier it was an invisible line between sponsorship and
product placement which made it almost impossible for public service TV companies to use
product placement. But the new law specified what was meant with product placement in
the law and results in that even SVT that does not have the right to send commercials can
now use product placement (sydsvenskan.se). But the new law also says that the viewer has
to be informed in the beginning and at the end of the movie, TV-show etc. that it contains
product placement. Further on it is not allowed in programs specially directed to children
and as in all commercials in Sweden, alcohol and prescript medicine is not allowed either.
(riksdagen.se)
The first product placement after the new law was a “Sibylla”-kiosk in the TV program
Robinson at TV4. The media agency Mindshare did a research after the broadcast to see the
viewers’ reactions. The result was that 52% of their respondents thought the product
placement did not disturb at all and melted in naturally and 21% answered that they got a
better attitude against the brand; only 7% was negative to the placement (mindshare.se).
Other examples of product placements in Sweden are the TV-show “Solsidan” or the movies
“Hamilton” and “Jägarna 2”. Peter Carnello at InBetween Entertainment has worked with all
three and says that it is all about finding the right brand for the right place, to work with the
manuscript and see what fits the most (dn.se). In the movie “Jägarna” the main character
drives a new Toyota pick-up and stop to meet some friends at a gas station, he describes
how much horsepower it has and all the facts about the car. The main character is a
masculine poacher with flannel shirt and is supposed to be the bragging kind, Peter Carnello
means that this scene is both a good placement for Toyota and at the same time a way to
build up the character in the movie (saljarnas.se).
1.2 Problem Discussion It has been showed that attitudes towards traditional advertising on TV are something that is
perceived as something negative for the viewer. A study made by SIFO showed that 75% of
Swedish citizens try to avoid the commercials on TV (tns-sifo.se). With this fact that the
audience has a negative view of traditional advertising simultaneously with the easiness for
the audience to avoid the commercials by switching channel or ignore it, has created
10
”However, one can’t ignore the paradox of product placement:
“If you notice it, it’s bad. But if you don’t notice, it’s worthless”
(Ephron 2003, p. 20).” (Homer, 2009, p.1)
opportunities for product placements (Gupta & Gould, 2008). According to Cowley and
Barron (2008) there are a number of different advantages by using product placement
compared to traditional advertising in television. The main advantage is that the viewer’s
cannot avoid the exposure of the placement when they are watching a TV-show (Cowley &
Barron, 2008). It has also been shown that product placements can have an increase of the
recognition memory and brand attitude of a certain product or brand (Russell, 2002). The
primary objective with product placements from a company’s view is to increase brand
awareness (Karrh, 1998; Karrh et al., 2003; Chang et al., 2009).
Studies of attitudes towards product placement have showed that the practice has generally
a positive perception, with exceptions for products that are ethically charged. Products of
alcohol, cigarettes and firearms are rated as less favorably than other products for product
placements (Brennan, Rosenberger & Hementera, 2004).
Marketers have acquired more control over the context that their brand appears in due to
that higher willingness to invest money in product placement and also by becoming more
proactive in creating opportunities of placements in different medias (Karrh, McKee &
Pardun, 2003). But it is clear that by the practice of product placement, marketers have less
control over the effects compared to traditional media advertising. For an example, Coca-
Cola appeared in a way that they did not expect in the movie Natural Born Killers where a
Coca-Cola advertisement was interspersed in a bloody murder scene (Johnson in Karrh,
McKee & Pardun, 2003).
It has been showed that the brand attitude has a tendency to decrease if the prominent
placements are too obvious, and especially if this obvious placement is mentioned
repeatedly. When it comes to subtle product placement the consumer attitudes are
relatively positive, even if the placement is exposed in a repeated way (Homer, 2009; van
Reijmersdal, Neijens & Smit, 2009). But the problem with too subtle placement is that it has

11
no effect and is worthless for the company that has a placement (Homer, 2009). Homer
(2009) continues that prominent placements are perceived to be more distracting, less
realistic and is interrupting the plot of a show or movie.
Several studies have been done of how the audience attitudes are toward product
placement. Studies of attitudes towards product placements has been done with Austrian,
French and Americans (Gould, Gupta & Grabner-Kräuter, 2000), Australians (Brennan,
Rosenberger & Hementera, 2004), Dutch (Reijmersdal, Smit & Neijens, 2010) and South
Koreans (Lee, Sung & Choi 2011) but no studies have been found to today’s date about
Scandinavian attitudes towards product placements in movies and television. Because of this
it is relevant to study how the Swedish audience´s attitudes is toward product placements,
which will lead to a greater knowledge for Swedish marketing managers about the attitudes
towards product placements in Sweden.
1.3 Purpose The purpose of this thesis is to investigate what attitudes the Swedish audience has towards
product placements in Movies and TV-shows.

12
Chapter 2.
2. Literature Review 2.1 What is a Brand?
eetharaman et al. defines a brand as “an asset that does not have physical existence
and the value of which cannot be determined exactly unless it becomes the subject of
a specific business transaction of sale and acquisition” (Seetharaman et al., 2001, p.
243). An effective brand name is often characterized by being short and easy to read out and
understand, other characteristics of a brand can be that it describes something about the
product (de Chernatony & McDonald, 2003).
A brand adds value to a product or service, this is called brand equity and adds value both to
possible consumers and to the company it belongs to. Furthermore the added value to a
successful brand makes it possible to maintain a high level of consumer acceptance
(Farquhar, 1989; Ambler, 1997). The brand equity can only exist as long as customers are
aware of it and maintains to be loyal and think it has quality (Seetharaman et al., 2001).
Brand equity also makes it possible for consumers to buy products with reliance because of
S

13
the value the brand gives and it can also reduce the risk a potential buyer can feel before a
purchase (Aaker, 1996). All that a brand can stand for to a person is different to each
individual all depending on past experience (Seetharaman et al., 2001).
2.1.1 Communicating the Brand In communication between a company and its customers the brand takes two aspects, brand
identity and brand image. The brand identity is how the company wants to be perceived and
originates from within the company (Nandan, 2004). The brand image is the sum of all
impressions and perceptions that a customer gets and all of them together form a brand
personality (Herzog, 1963). Aaker writes about brand personality in her article “Dimensions
of brand personality” and describes it as “the set of human characteristics associated with a
brand” (Aaker, 1997, p. 347). These characteristics can be mirrored in the consumers’ self-
image or ideal self when consuming a brand, as an extended self were the products
characteristics builds up your own image (Belk, 1988). Even if the characteristics of brands
are similar to the ones of humans they do differ in how they are built up. Park et al. (1986)
believes that humans’ personality is based upon individual behavior, physical characteristics,
attitudes and demographic. On the other hand brand personality is built up only by direct or
indirect contact to a brand according to Plummer (1985). But Aaker (1997) writes that brand
personality can also be built up by demographical characteristics such as; feminine or
masculine, young or old and upper class or blue collar. Furthermore Keller (1993) describes
brand personalities as a self-expressive function when using a brand, where for example
Absolut Vodka tends to be characterized as a cool, hip, contemporary 25-year old.
Brand awareness is simply an element about the customers’ recognition about a brand, yet
this is very important for the companies. There are four levels of awareness, first comes
‘dominant’ that means that customers think about a whole product category, like Jeep or
Thermos. Second is ‘top-of-mind’ that is the brands that customers think of first in a product
segment, e.g. Coca-Cola among sodas. The third level of awareness is ‘recall’ that is the
brands that customers remember after stating the ones that is top-of-mind. The fourth and
last is ‘recognition’ that is the lowest form of awareness (Seetharaman et al., 2001).
In a basic communication model called the railway model a message is communicated from
a source and is taken in by a receiver, in this context a company is the source and the

14
consumers are the receivers. The message is sent through some sort of media channel which
can be compared to a noise were a message can be distorted or get lost. And even if it
comes through intact every receiver, consumers, interprets the message out from their own
perspective (Gripsrud, 2002). To create loyal customers and a unified brand image, it is
important that the communication is consistent through all channels (Nandan, 2004).
2.1.2 How can a message affect consumers? Furthermore, Grönroos writes about how different channels in the media affect consumers
in different ways. He proposes four categories of messages; planned message, product
message, service message and unplanned message. Each has a different level of
trustworthiness towards the consumers were planned messages has the lowest value and
could be a TV commercial. Product message is the offerings that follow the physical product
and has more trustworthiness. Service message comes often from an employee directly or
via an announcement and is even trustworthy. The last is unplanned message that is the
messages that the company itself does not send out but rather comes from other customers,
reviewers or other sources independent from the company (Grönroos, 2008). It can for
instance be word-of-mouth (a message that is spread from person to person (Solomon et al.,
2010)) from a close environment, such as friends, or word-of-mouth that is scattered from
different governments or medias, or by previous experiences that the customer may have
stored in the mind (Karaosmanoglu & Melewar, 2006). This category of messages is the one
of these four categories that has the highest level of trustworthy (Grönroos, 2008).
2.2 Attitudes According to Ajzen (2005) attitudes can be defined as: “a disposition to respond favorably or
unfavorably to an object, person, institution, or event” (Ajzen, 2005, p. 3).
Schiffman & Kanuk (2004) writes that the decision if a consumer likes a product or not is
based on the attitudes that she has to the product itself. Consumer behaviors such as;
purchasing decisions, recommendations to friends, beliefs, evaluations about a product or
intentions are all related to attitudes. This kind of attitudes and opinions towards an object
is something that we are not born with; it is something that is learned during our lives
(Schiffman & Kanuk, 2004). Anything that someone has an attitude towards is called an
attitude object (Solomon et al., 2010).

15
2.2.1 Three components of attitudes One of the most enduring statements that most researchers agree with is that an attitude
has three components; cognition, affect and conation (Ajzen, 2005; Solomon et al., 2010;
Schiffman & Kanuk, 2004; Evans et al., 2008). These three components of attitudes create
the ABC-model that describes the relationship between knowing, feeling and doing
(Solomon et al., 2010). The cognitive component is about a person’s beliefs and knowledge
about a certain attitude object (Evans et al., 2008). The affective component is related to a
person’s feelings and emotions about an attitude object (Solomon et al., 2010). These
feelings can be either negative or positive and is based on the beliefs that the consumers
have towards the object (Evans et al., 2008). The conative component that also is called the
behavioral component is related to the intentions for a person to act and do something
towards the attitude object, e.g. buy a product (Solomon et al., 2010). The likeliness for a
person to respond to an attitude object is based on the person’s knowledge and feelings to
the object (Evans et al., 2008).
2.2.2 The functional theory of attitudes For better insight about how attitudes are developed can be describes by the functional
theory of attitudes that is developed by Daniel Katz (1960). Attitudes exist because it serves
a function for a person, which is determined by a person’s motive. Katz has identified four
different functions of attitudes that are; utilitarian function, value-expressed function, ego-
defensive function and knowledge function. It is important to consider that an attitude can
serve more than just one function, but it is more commonly that one function will be
dominant (Katz, 1960; Solomon et al., 2010).
The utilitarian function is associated with rewards and punishment and attitudes is shaped
by whether we as people get rewards or punishment because of our actions. If customers
like a certain product they will develop a positive attitude to the product (Solomon et al.,
2010). The value-expressive function of attitudes is not based on the functional value of the
product itself, the attitudes are shaped by the symbolic value of the product and what the
usage of the product says about the customers as a person. In the ego-defensive function
people use attitudes in order to protect their self-image from either external threats or
internal feeling (Solomon et al., 2010). That can for an example be that customers defends
themselves by developing negative attitudes towards a product that they cannot afford

16
(Evans et al., 2008). The knowledge function of attitudes is formed when customers’ needs
to organize and structure the information they may receive. This kind of need can occur
when customers are confronted with a new product and they want more knowledge about it
(Solomon et al., 2010).
2.3 Product Placement Russell and Belch (2005) define product placement as ”the purposeful incorporation of a
brand into an entertainment vehicle” (Russell & Belch, 2005, p. 74) and this is also the
definition that Wilson and Till (2011) uses. Further on Russell and Belch (2005) writes about
that product placement is found in many different media, all from obvious as movies, TV and
video games but also in novels.
2.3.1 Product placement appearance The impact that a product placement can have to the audience is according to Lehu (2007)
based on the appearance of the placement and it can be divided into four different types of
appearance: classic placement, corporate placement, evocative placement and stealth
placement.
Classic placement
The first type of placement that Lehu mention is the classic placement that has existed since
the practice of product placement was first derived. In this type of placement the brand
appears in the camera’s view and is almost naturally integrated in to the scenario of the
movie or TV-show. For example when Will Smith is wearing Converse shoes in the movie I,
Robot (Proyas, 2004) or in the movie Forrest Gump (Zemeckis, 1994) where Tom Hanks
drinks about fifteen Dr. Peppers for free during a visit at the White House. A classic
placement is easy to put in place in a certain movie or TV-show for a low cost, or sometimes
for free when a brand can appear without the advertisers expressed wish. But it can
sometimes pass by unnoticed by the audience, particularly if there are a high number of
placements in the same movie or TV-show (Lehu, 2007).
Corporate placement
With a corporate placement the placement is focused on the brand and not a certain
product. It can sometimes be easier to put in a brand instead of a product in a movie for
instance by putting the brands logo in the background of a movie (Lehu, 2007), such as the

17
big billboard of McDonalds in the movie The Fifth Element (Besson, 1997). This kind of
placement is best to use if the brand is a recognizable brand for the audience, otherwise it
may never be noticed. If the placement is successful it will be beneficial for all the product of
the brand and not just a certain product (Lehu, 2007).
Evocative placement
An evocative placement is a discreet and subtle placement where the logo or name of the
brand is not visual or neither mentioned. With this kind of placement it is important to have
an original and unique design or packaging that can be associated and recognized to a brand
by the audience. This can for example be different car brands that can be recognized by their
design (Lehu, 2007), or in the Swedish TV-show Solsidan (Herngren & Kvensler, 2010) where
the character “Fredde” is using a Segway without that the logo or the name of the brand is
mentioned or shown.
Stealth placement
The last type of placement that Lehu writes about is stealth placement that is a highly
discreet and subtle placement that sometimes almost can be undetectable. This type of
placement is often well integrated into the scene that can generate a positive effect when
the brand is identified due to that it is placed in a movie or TV-show in a natural way that the
audience can perceive as more credible (Lehu, 2007). This type of placement does often
concern fashion, for example in the movie Drive (Winding, 2011) where Ryan Gosling is
wearing a pair of sunglasses from Selima Optique.
2.3.2 Different dimensions of product placement The most usual way to integrate product placements into media is to use either just visual-
only or audio-only placements (La Ferle & Edwards, 2006; Wilson & Till, 2011). Galician &
Bourdeau (2004) assert that vision-only placements are more common than audio-only
placements.
According to Russell (2002) product placement can be categorized in to three dimensions:
visual, auditory and plot connection. The visual dimension is referred to how the brand is
appeared on the screen, this is also called screen placements. This kind of placement can
have different levels, depending on different aspects such as the number of appearances on
the screen or in which way the product is filmed (Russell, 2002).

18
The second dimension is the auditory dimension, or the verbal dimension, is referred to how
the brand is mentioned verbally in the dialogue and is called a script placement. This type of
placement also has different degrees which is depended on in which context the brand is
mentioned, how many times it is mentioned and in which way it is mentioned through the
tone of voice or place in the dialogue (Russell, 2002).
The third and last dimension, the plot connection is referred to the degree of how the brand
is integrated in the plot of the story. In such placement the brand or the product becomes a
part of the plot or takes a major role of the storyline. It has been shown that small and
subtle plot connected placements do not make any bigger differences to the story while
prominent plot connected placements can have a major impact of the story, e.g. building up
a character as a person (Russell, 2002).
Wilson and Till (2011) takes up that studies by Gupta & Lord (1998) and Russell (2002) came
to the result that audio-only placements have the greatest recall over visual-only and Law &
Braun (2000) came to the conclusion that visual-only had the largest recall. But they point
out that they came to the conclusion in their field study that it was no significant difference
between audio-only and visual-only placements. However Wilson and Till (2011) did find that
when both audio and visual placements were combined the recall was higher than the two
separate, they also suggest a ‘recipe’ for the placement with highest recall; “combined
audio-visual presentations, that are prominently displayed, have actor involvement, and
have two or more verbal mentions” (Wilson & Till, 2011, p. 391). But they also say that
marketers often do not have the ability to control the placements exactly how they want in
movies and TV.
MacInnis and Jaworski (1989) write about how branded messages have more response when
customers have greater opportunities to process the messages. Wilson and Till (2011) agrees
and defines these opportunities as time on screen and how often, actor involvement and
how prominent the message is. Further they found that placements that were placed in the
first half of a movie did not have an equally high level of recall (Wilson & Till, 2011).
Prominent placements are those that are in the foreground of a scene, they are easy to
notice and can sometimes be the only thing that can be seen in the screen (Ferraro & Avery
2000). Subtle placements are those that are in the background of a scene, they are not
19
always so easy to notice. Subtle placement can often share the screen with many other
brands (Wilson & Till, 2011). Several studies have showed that prominent placements have a
higher recall than the subtle placements (Law & Braun, 2000). Reijmersdal, Neijens and Smit
(2009) add that the prominent placements that even are involved into the plot get an even
higher brand recall.
2.3.3 Advantages and disadvantages with product placements Karrh (1998) says that one reason to use products placed in media is to reduce costs in a
production. According to Balasubramanian et al. (2006) it can also be about to build up an
impression of reality, because a set without brands could look made up. In that occasion
Chang et al. (2009) agrees and write that many placements are of serendipity. Placements
can also be used from the advertisers view as a way to reach out to customers, due to the
potential way it can get supported through the characters in for example a movie (Babin &
Carder, 1996; Smit et al., 2009). The primary objective with product placements from a
company’s view is to increase brand awareness (Karrh, 1998; Karrh et al., 2003; Chang et al.,
2009).
According to Cowley and Barron (2008) there are a number of different advantages by using
product placement compared to traditional advertising in television. The main advantage is
that the viewer’s cannot avoid the exposure of the placement when they are watching a TV-
show (Cowley & Barron, 2008). It has also been shown that product placements can have an
increase of the recognition memory and brand attitude of a certain product or brand
(Russell, 2002).
Cowley and Barron (2008) write about two different approaches to describe the shift of
attitude when being exposed to product placement. First they write that product placement
can increase the implicit memory of the viewer and not necessarily the explicit memory,
leaving the viewer with a more accessibility to the brand recall memory that could
subconsciously increase the liking of a brand. With just the mere exposure to the placement
as explain to the increased brand choice (Cowley & Barron, 2008). The second approach is
about that a placement can increase the explicit memory, this with a positive attitude shift
when being exposed to just audio-placement that is highly connected to the plot (Russell,
2002; Cowley & Barron, 2008). Cowley and Barron assume that it is because of that the

20
placement created or increased the positive association with the brand (Cowley & Barron,
2008).
Furthermore Cowley and Barron (2008) write in their article about some downsides in
product placement. First of all they write that a prominent placement often increases the
memory of a brand, which is good, but that it at the same time makes the viewer more
aware of the placement and the notion that it is all about a persuasion attempt (Cowley &
Barron, 2008). Van Reijmersdal, Neijens and Smit (2009) agrees and states that “the higher
the perceived prominence of a placement, the more negative the placement attitudes and
beliefs” (Van Reijmersdal, Neijens & Smit, 2009, p. 433). This could then lead to a decrease in
attitude and irritation, not only for the brand itself but also to the movie/TV-show that the
placement was in (Cowley & Barron, 2008).
2.4 Results of previous researches within product placement Gould, Gupta and Grabner-Kräuter (2000) based their research on Gould and Gupta (1997)
that conducted the same research but limited to just the US. Now they went further and did
the same survey in both France and Austria as well in order to compare the results of
attitudes towards product placement in movies in each country. All three surveys were done
with a sample that 75 % - 99 % was under the age of 25 and very close to 50/50 balance in
terms of gender. (Gould, Gupta and Grabner-Kräuter, 2000)
The results that they came to were that it was difference in how acceptable product
placement was in the different countries. In the US the survey showed that they were more
tolerant towards placements in movies than in both France and Austria, but at the same
time they could see some similarities between all three countries. For example placements
regarding cigarettes, alcohol and guns had little acceptance in all three countries. They also
found that it was a significant gender difference, women were less positive to placements
and this was found across all the three countries. So the conclusion was that it is similar
attitudes across the three counties but they differ in intensity. Gould, Gupta and Grabner-
Kräuter (2000) article did not take up any difference in the placement types but they gave
the recommendation that further studies also should include Television. They also made a
managerial advice to be aware of the difference between countries attitudes towards
product placements.

21
An article written by Brennan, Rosenberger and Hementera (2004) was inspired by Gould,
Gupta and Grabner-Kräuters (2000) research and wanted to test it further more. Brennan,
Rosenberger and Hementera used the same questionnaire and mainly the same hypothesis
about gender difference and how unethical placement was judged and then applied this to
an Australian sample. The difference in this case beside the country was that they did not
get a sample that was as equally distributed between gender as Gould, Gupta and Grabner-
Kräuters (2000) researches were. Instead of fairly equal they had roughly 63 % male and 37
% female in their test. But they did anyway draw the same conclusion that women were less
positive than men towards placements and that unethical placement with alcohol, guns etc.
was regarded less positive overall. They also saw the same indicators as Gould, Gupta and
Grabner-Kräuters (2000) that it was the same attitudes across the countries but different
intensity, also in Australia.
In 2010 Reijmersdal, Neijens and Smit did a research where they investigated the correlation
between a positive attitude toward a movie or television show and the outcome of attitudes
against a certain placement that was in the media. The research was conducted in the
Netherlands and the method used was a combination of first a TV-program being showed to
the respondent in their home setting alone, and then the day after they answered a survey.
Some of their findings were that product placements that occurred in programs with high-
perceived value such as a cooking program or home makeover program had a higher level of
brand recognition than in programs with general program. They also came to the conclusion
that people with higher education and also people that were younger tended to be less
affected by brand placement, both in terms of attitude and buying intentions. Their
reasoning around that is that some studies has shown that just that group has higher
knowledge of advertisers’ motives with branding and therefore is less persuaded.
(Reijmersdal, Neijens & Smit, 2010)
A research comparing the attitudes towards product placement in movies and television was
done between USA and Korea by Lee, Sung and Choi (2011). They conducted an internet
based survey and let respondents between the ages of 19-29 answer their survey. The both
samples were conducted at collages in both countries. What they noticed in their research
was that the attitudes were similar but that the Koreans was a little less positive towards
placements in TV and movies, they perceived it more unethical than the respondents from

22
US. They also found that the respondents that had a more positive attitude toward
advertisement in general tended to be more positive towards product placement as well and
also that individuals that perceived that product placement could lead to a more realistic
setting in a movie were those that were likely to pay more attention towards the actual
placements. The authors of this article also suggested that a reason to the difference
between the two countries can originate from the different cultures where USA is seen to be
more materialistic (Lee, Sung & Choi, 2011).

23
Chapter 3.
3. Conceptualization 3.1 Research discussion and research gap
rom the literature review it was shown that product placements that occur in movies
and TV-shows could be divided into different types based on their characteristics. It
was shown that the most usual way to integrate a product or brand through
placements is to use either visual or audio placements (La Ferle & Edwards, 2006; Wilson &
Till, 2011), these two dimensions of placements could also be combined (Wilson & Till,
2011). A product placement could also have different characteristics of how it is integrated
into the movie or TV-show, it could either have a connection to the story or not, this is called
a plot connection (Russell, 2002). Finally it was shown that a product placement is either
subtle (Wilson & Till, 2011) or prominent (Ferraro & Avery, 2000), which define how easy the
placement is to notice and how big impact it has to the movie or TV-show. Previous research
has shown that different types of product placements form different attitudes towards
F
24
product placements for the viewer. Several previous research studies have been done within
the area of attitudes towards product placements (Gould, Gupta and Grabner-Kräuter, 2000;
Russell, 2002; Brennan, Rosenberger & Hementera,2004; Cowley & Barron, 2008; Van
Reijmersdal, Neijens & Smit, 2009; Reijmersdal, Neijens & Smit, 2010; Lee, Sung & Choi,
2011). Even if the area has been investigated before by several researchers, however the
authors of this thesis have not found any previous research about the Swedish audience’s
attitudes towards product placements in movies and TV-shows. This is the research gap that
this thesis has the purpose to fill in.
The choice to investigate both movies and television is founded in that both several previous
studies have researched both mediums and also that it could be difficult to separate the two
mediums apart for a respondent. It gets harder to remember from which mediums what
thoughts came from and to investigate this it should probably be done in a more isolated
environment. Therefore to investigate both movies and television covers the whole
experience that the respondents have of product placement.
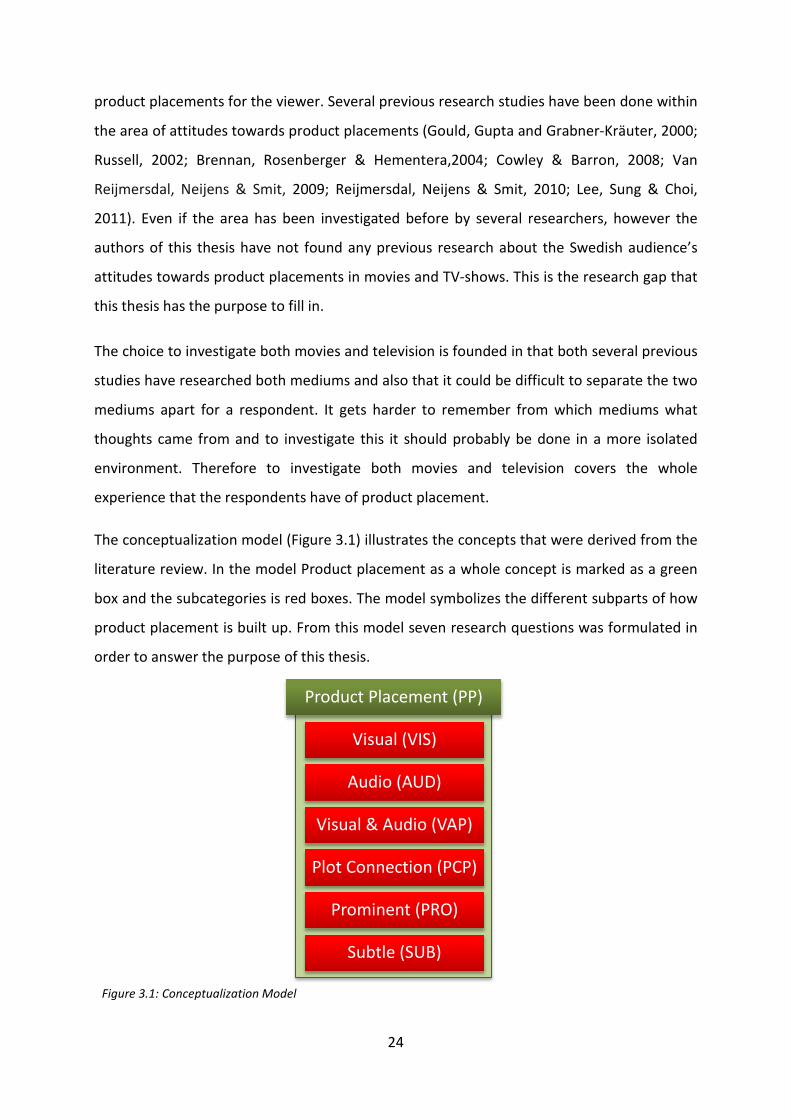
The conceptualization model (Figure 3.1) illustrates the concepts that were derived from the
literature review. In the model Product placement as a whole concept is marked as a green
box and the subcategories is red boxes. The model symbolizes the different subparts of how
product placement is built up. From this model seven research questions was formulated in
order to answer the purpose of this thesis.
Product Placement (PP)
Visual (VIS)
Audio (AUD)
Visual & Audio (VAP)
Plot Connection (PCP)
Prominent (PRO)
Subtle (SUB)
Figure 3.1: Conceptualization Model

25
3.1.1 Research Questions From the information that was found in the literature review and the conceptualization
model, seven research questions were developed. They are all based out from the purpose
of this thesis and every research question comes from different theories in the area. Each
research question has been developed through looking at previous research that has studied
the same concepts and also from variables that has been collected from the literature
review of this thesis. The research questions make it clearer of what has been investigated in
the thesis.
RQ1: What is the attitude towards product placement in general?
RQ2: What is the attitude towards visual placements?
RQ3: What is the attitude towards audible placements?
RQ4: What is the attitude towards combined visual and audible placements?
RQ5: What is the attitude towards a plot connected placement?
RQ6: What is the attitude towards a prominent placement?
RQ7: What is the attitude towards a subtle placement?
3.2 Conceptual framework The concepts that have been carried out from the literature review chapter have been
operationalized in order to define the concepts in an easy understanding way. Table 3.1
illustrates the conceptual and operational definitions for each variable in this thesis.
Table 3.1 - Research Constructs and their Definitions
Concept Conceptual Definition Operational Definition
Product Placement as a whole concept (PP)
Is the purposeful incorporation of a brand into any form of entertainment-vehicle (Russell & Belch, 2005).
Referrers to a form of advertisement where a brand is placed in a movie or TV-show.
Visual (VIS) Is how a brand appears on the screen, this is also called screen placement (Russell, 2002).
Refers to how a brand appears on the screen where it can be seen by the viewer. For instance the number of appearances and how the product is filmed.

26
Audio (AUD)
Is how a brand is mentioned verbally in the dialogue, this is also called script placement (Russell, 2002).
Refers to how a brand can be heard in a movie or television show; for instance in which context, how many times and in which way it is mentioned by characters.
Visual & Audio (VAP)
Is when both visual and audio appearance is combined in a placement (Wilson & Till, 2011).
Refers to when a placement is a combination of both visual and audio, it can both be heard and seen in a movie or TV-show.
Plot connection (PCP)
The degree of how a brand is integrated in the plot of the story (Russell, 2002).
Refers to how a placement of a brand becomes a part of the story in a movie or TV-show.
Prominent (PRO)
Placements that are in the foreground of a scene, easy to notice and sometimes the only thing that appears in the screen (Ferraro & Avery, 2000).
Refers to how a brand is placed noticeable in the screen or is being mentioned clearly.
Subtle (SUB)
Are placements that are in the background of the scene, they are not always so easy to see (Wilson & Till, 2011).
Refers to how a brand is placed discreetly in the screen or being mentioned discreetly.

27
Chapter 4.
4. Methodology 4.1 Research Approach
ccording to Bryman & Bell (2005) a scientific research can be approached in
different ways and the major approaches are deduction or induction and if the
research approach is quantitative and qualitative research.
4.1.1 Inductive vs. Deductive Research
According to Bryman & Bell (2005) a deductive theory represents the most common
interpretation of how the relationship between theory and research looks like. A deductive
approach is used when the researcher use existing theories and the knowledge of what is
known in a particular area in order to draw conclusions from the research, the researcher
goes from theory to empirics. A deductive approach is most common in a quantitative
A

28
research. An inductive approach is the opposite of the deductive approach where the theory
is the outcome of research. In other words, the researcher arrives at a theory based on the
empirical findings. An inductive approach is most common in a qualitative research (Bryman
& Bell, 2005).
Figure 4.1: Deduction vs. Induction
In this thesis the research questions was based on known theory that was then tested
through the collected empirics. The phenomena product placement is not new and there are
a lot of theories about the subject that this thesis has been based on, therefore this thesis
has a deductive approach.
4.1.2 Qualitative vs. Quantitative Research
According to Bryman & Bell (2005) a quantitative research can be described as a research
strategy that emphasizes quantification when it comes to the collection and analysis of
numeric data, e.g. through surveys, and the relationship between theory and research is of a
deductive kind (Bryman & Bell, 2005). A quantitative research is more formalized and
structured then a qualitative research and it can be highly controlled by the researcher. The
main purpose of a quantitative investigation is to make generalizations about a certain
subject and it also makes it possible to treat the research problem in a broader perspective
(Holme & Solvang, 1997).
A qualitative research is a research strategy that unlike the quantitative research emphasizes
the collection and analysis of data that is more oriented to words than statistical numbers
(Bryman & Bell, 2005). According to Holme & Solvang (1997) the primary aim with a
qualitative research is to gain a deeper understanding about the subject that is investigated.
This kind of research is characterized by its closeness to the source that the data is gathered
from, e.g. through a depth interview (Holme & Solvang, 1997).
Deduction
Theory
Observations/Findings
Induction
Observations/Findings
Theory

29
In this thesis a quantitative research was used since the purpose was to investigate attitudes
from a larger amount of respondents that can be analyzed through numeric data and
statistics.
4.2 Research Design A research design is the framework for how to collect and analyze data, it is a structure that
guide how to use a certain method in a concrete way (Bryman & Bell, 2005).
Exploratory research designs
Wallén (1996) writes that exploratory research design is used to gain more knowledge of
what the problem really is that will be studied, often as a pre-study to a major project. It is to
get the problems’ basic facts of what, when, how and in what context the problem occurs
(Wallén, 1996). Moreover, Kotler et al. (2002) agrees and write that it is about gather
preliminary data that will help to define what a problem is and propose hypothesis (Kotler et
al., 2002). Exploratory design is often categorized as highly flexible and easy to adapt to new
situations, this because that it often lacks the formal structure of organized questionnaires
and large samples. Instead the researcher has to be responsive and open to new ideas and
approaches (Malhotra, 2010).
Descriptive research designs
Descriptive research design is used in order to describe for instance a markets potential for a
certain product or the demographics and attitudes of customers (Kotler et al., 2002). A
descriptive research design is used to decide the subjects’ characteristics, values and to
determine relations (Wallén, 1996). Eriksson and Wiedersheim-Paul (2011) writes that this
type of research design is used to identify and map situation, events, pattern or actions. In
order to be useful every description has to be precise of what it will be used to, what data
that should be found (Eriksson & Wiedersheim-Paul, 2011). Bryman and Bell (2005) write
that a variable that is gathered with a descriptive research is almost impossible to alter, it is
what it is. Moreover, they highlight that it is positive because then the variables cannot be
manipulated in order to suit the researchers purpose (Bryman & Bell, 2005).
Causal designs
A causal design is a way to test hypothesis about cause-and-effect relationship (Kotler et al.,
2002; Eriksson & Wiedersheim-Paul, 2011; Malhotra, 2010), like if a certain discount on a

30
product would increase the sales of that product and what relation it gives. Wallén (1996)
call it the “why”-design and write that it explains the relationship between variables (Wallén,
1996).
Sub segments of Descriptive and Causal Designs
Longitudinal design is about investigating over a period of time; observe in order to collect
data. This type of design is meant to see if it is any changes over a predetermined time
period (Bryman & Bell, 2005). It uses a fixed sample that is used every time in order to see
possible differences over time (Malhotra, 2010).
Cross-sectional design is a type of design that can be used in both causal research and
descriptive research. Cross-sectional design is about collecting data at a certain point
compared to longitudinal design that observed over a long time. Cross-sectional design can
be separated in to two branches; multiple and single. Multiple cross-sectional design uses
two or more samples to obtain data and as the name applies single cross-sectional design
use only one sample at one specific time to obtain data. With a cross-sectional design it is
only possible to compare the relations between different variables and not be sure of what
causes the relation (Bryman & Bell, 2005; Malhotra, 2010).
In this thesis a descriptive single cross-sectional design was used in order to serve the
purpose of the thesis. The descriptive part comes from that this thesis is about mapping the
attitudes and therefore it suits the most. The single cross-section was due to the time and
resource limit for this thesis, either a multiple cross-sectional or longitudinal design would
simply have taken too long time to execute for this thesis.

31
Figure 4.2: “A classification of Marketing Research Designs” (Malhotra, 2010, p.103).
4.3 Data Sources There are two different types of empirical data categorized as primary data and secondary
data (Malhotra, 2010).
Secondary data is information that already exist trough other researches and is gathered for
another purpose than the one at hand (Kotler et al., 2002; Malhotra, 2010). Secondary data
can show problems that exist, but the needed information may not exist and needs to be
gathered. It is not often the secondary data provides what is needed for the most usual
purposes and even when it might be the right data that is found it is not certain that it can
be used anyway. The researcher has to be sure that the source can be trusted and that the
data is accurate, impartial and is up-to-date. Secondary data can often be gathered faster
and at a lower cost than primary data (Kotler et al., 2002). Secondary data can be divided
into two categories; internal and external. Internal secondary data comes from within an
organization and takes often more effort to get a hold of due to that it is not published.
External secondary data comes from outside an organization and can be found in published
papers, computerized databases etc. (Malhotra, 2010).
Primary data on the contrary is information that is collected exclusively in order to serve the
specific purpose of a paper, tailor made data. When primary data is used for a paper the
researcher can be sure that the information is up-to-date and not inaccurate (Kotler et al.,
2002).
Rese
arch
Des
igns
Exploratory Research Design
Conclusive Research Design
Causal Research
Longditudinal Design
Cross-sectional Design
Multiple Cross-Sectional Design
Single Cross-Sectional Design
Descriptive Research

32
In this thesis mainly primary data source was used for analysis, mainly because that relevant
data in the area that was researched did not exist pre this study. Related data to what was
researched was used in the introduction chapter to explain the situation and why the topic
of this study was relevant, that data is secondary.
4.4 Research Strategy Yin (2008) writes that a research can have different methods in order to collect and analyze
the empirical evidence. Yin (2008) takes up five different research strategies that are:
experiments, surveys, archival analysis, histories and case studies. All of these strategies can
be used in an exploratory, descriptive or explanatory way. To know which research strategy
that should be used there is three different conditions that the researcher should follow in
order to determine which one to use, these are:
1. The type of research question posed.
2. The extent of control an investigator has over actual behavioral events.
3. The degree of focus on contemporary as opposed to historical events.
Yin (2008) has created a model (Figure 4.3) that shows these three conditions and how each
of them is related to the five different research strategies.
(1) (2) (3)
METHOD Form of Research Question
Requires Control of Behavior Events?
Focuses on Contemporary Events?
Experiment how, why? yes yes
Survey who, what, where, how many, how much?
no yes
Archival Analysis
who, what, where, how many, how much?
no yes/no
History how, why? no no
Case Study how, why? no yes
Figure 4.3: “Relevant Situations for Different Research Methods” (Yin, 2008, p. 9)
Since the research questions of this thesis was what attitudes the Swedish audience has
towards product placement it was shown that experiments, histories and case studies could
be eliminated in the decision of which method to use. Due to that this thesis did not need to

33
have control of the behavioral events and that it was focusing on contemporary events it
meant that there was two methods left to choose between, surveys or archival analysis.
According to Patel & Davidson (2011) a survey can be useful to measure what respondent
thinks about, or what attitudes they have towards something. Since this thesis was about
measuring attitudes, the selected research strategy was therefore to conduct a survey study.
4.5 Data collection method Since this thesis had a quantitative approach it was not relevant to discuss if any qualitative
data collection method should be used. The most common data collection method in a
quantitative approach is structured interviews, questionnaires, structured observations and
content analysis (Bryman & Bell, 2005).
Structured interviews
A structured interview is when an interviewer asks different questions to a respondent from
a predetermined interview schedule with decided questions. The reason with this is that the
context for every interview will be the same, which means that each respondent faces the
same situation. The target for such interview is to ensure that the answers from the
respondents can be compiled in a comparable way. This method takes much time due to
that the interviews can not be carried out simultaneously (Bryman & Bell, 2005).
Questionnaires
According to Bryman & Bell (2005) a questionnaire is used in a quantitative research, usually
with a numbers of questions where the respondents fill in the answers. The aim of a
questionnaire is to collect opinions, beliefs and attitudes from the respondents. During the
completion of the questionnaire, there is usually no interviewer present who ask the
questions, the respondents must therefore read and answer the questions by themselves.
Because of this the questions must be easy to understand and answer. A questionnaire is an
inexpensive way to reach out to many respondents in a fast way and it is not time-
consuming when the replies should be administrated. The research should though have in
mind that it takes time to assemble the questions that should be used (Bryman & Bell, 2005).
Structured observations
According to Bryman & Bell (2005) a structured observation is a method where the
researcher observes the behavior of an individual or subject and the researcher record the

34
behavior from a category scheme. The fixed rules that compose the observation scheme
should be as specific and concrete as possible that will make it easier for the researcher to
focus on those aspects of behavior that are of interest (Bryman & Bell, 2005).
Content analysis
A content analysis is a data collection method where the approach is to analyze different
documents and texts that in a replicable and systematic way can quantify the content. This is
based on categories that are determined in advance. A content analysis is a flexible method
that can be used in connection with many different medias (Bryman & Bell, 2005).
In this thesis questionnaire was selected as the collection method because it was the most
suitable for quantitative approaches. Since the purpose was to investigate the attitudes
towards product placement from a larger number of entities and that the researchers had
limited resources and time a questionnaire was the most suitable data collection method.
4.6 Survey Design
4.6.1 Operationationalization and measurement of variables According to Eliasson (2010) an operationalization is about carrying out concepts from a
theory that through a definition turns into easy understanding words that is possible to
measure. The concepts that are operationalized should be relevant for the thesis and
significant to the purpose of the thesis. It is also important that the concept is defined as
clearly as possible and it should be consistent with the theory from where the concept is
collected (Eliasson, 2010). The table with the concepts and the operationalized definitions
can be found in Table 3.1 in the conceptualization chapter.
Eliasson (2010) continues with that an operationalization is about making the concepts
possible to measure. By making the concepts measurable, it will be possible to investigate,
which puts the concepts into focus of the study when conducting a questionnaire (Eliasson,
2010), this is shown in Table 4.1.

35
Table 4.1 - Measurement and scaling construct
Concept Type of scale and its construction Items used Adopted From
Product Placement as a whole concept (PP)
7-items, 7-point Likert scale with (1) as Strongly Disagree and (7) as Strongly Agree.
PP1: Standing point
Gupta & Gould, 1997; Ong, 2004; Balasubramanian et al., 2006; Cowley & Barron, 2008; Reijmersdal et al., 2010
PP2: For commercial purposes.
PP3: Ethical side of product placement
PP4: Increased realism.
PP5: Avoidance of placements
PP6: Impact on favorable movie/TV-show
PP7: Brand damage
Visual (VIS)
3-items, 7-point Likert scale with (1) as Strongly Disagree and (7) as Strongly Agree.
VIS1: Standing point Russell, 2002; Wilson & Till, 2011 VIS2: Example of placements
VIS3: Number of appearances
Audio (AUD)
3-items, 7-point Likert scale with (1) as Strongly Disagree and (7) as Strongly Agree.
AUD1: Standing point Russell, 2002; Wilson & Till, 2011 AUD2: Example of placements
AUD3: Number of appearances
Visual & Audio (VAP)
3-items, 7-point Likert scale with (1) as Strongly Disagree and (7) as Strongly Agree.
VAP1: Standing point Russell, 2002; Wilson & Till, 2011 VAP2: Example of placements
VAP3: Number of appearances
Plot connection (PCP)
4-items, 7-point Likert scale with (1) as Strongly Disagree and (7) as Strongly Agree.
PCP1: Standing point
Gupta & Gould, 1997; Russell, 2002; Wilson & Till, 2011
PCP2: Example of placements
PCP3: Actors influence
PCP4: Excessively
Prominent (PRO)
4-items, 7-point Likert scale with (1) as Strongly Disagree and (7) as Strongly Agree.
PRO1: Standing point
Gupta & Gould, 1997; Ferraro & Avery, 2000; Homer, 2009
PRO2: Example of placements
PRO3: Up-close filming
PRO4: Annoying placement
Subtle (SUB)
4-items, 7-point Likert scale with (1) as Strongly Disagree and (7) as Strongly Agree.
SUB1: Standing point
Wilson & Till, 2011; Ferraro & Avery, 2000; Homer, 2009
SUB2: Example of placements
SUB3: Brand in background
SUB4: Subconscious placement

36
4.6.2 Questionnaire design
Letter of intent
To reduce the fallout of respondents not answering a questionnaire Bryman and Bell (2005)
writes about that it is important to start of a questionnaire with a paragraph describing why
it is important that this questionnaire should be filled in. Here it should be stated if the
researcher gets any foundation from a company etc. and also state clearly if the answers are
being handled with confidentiality and the respondent stays anonymous (Bryman & Bell,
2005).
Question structure
According to Malhotra (2010) the questions in a questionnaire can be built up in three
different ways; open-ended, close-ended and partially closed-ended. The open-ended is
when the question does not provide any answer but instead leave it open to the respondent
to answer what he/she thinks is suitable. An example of such question could be what
country someone is from and only an empty box follows to be filled in. Close-ended
questions are when the respondent is given alternatives to a question, for example when
asked for gender and next to it there is two boxes, one for male and one for female. This
type is easier to analyze due to that the possible answers is controlled in forehand. Partially
closed-ended question is a combination of the two above, an example here can be “are you
satisfied with our service, if no why” and after the question it is two checkboxes followed by
a line where the respondent can leave their comment as well (Malhotra, 2010).
Likert scale
Likert scale is a scale that is named by its developer Rensis Likert. Malhotra (2010) writes
that the scale is a way to rate what respondents think and feel in an area in a degree of often
five levels, for example from strongly disagree to opposite strongly agree. The range can
have other intervals as well as for example seven or nine etc. The questions are formulated
as statements that the respondent has to decide from where their standing point is. This
type of scale is widely used in questionnaires and is a common way to measure attitudes. An
advantage with the Likert scale is that is relatively simple to construct and administer, also
respondents tend to understand the scale easily which suites questionnaires that is being
send out. A disadvantage is however that it can take long time to complete a questionnaire

37
that contains many questions based on Likert scale, the respondent needs to read every
statement carefully in order to answer it correctly (Malhotra, 2010).
How to conduct
How a questionnaire is being conducted can be divided in to four different classifications;
telephone, personal, mail and electronic. The telephone way is simply that the questionnaire
is conducted over the phone and the answers are written down. Personal is when the
researcher meets the respondent and hand them the questionnaire personally and the
researcher stays around when the questionnaire is being filled in, this can for example be in
someone’s home or in a shopping mall. Over mail means traditional postal mail and the
questionnaire is being sent to the respondents. The fourth way electronic can be either over
Internet through some kind of on-line questionnaire service or by e-mail which contains the
questionnaire (Malhotra, 2010).
In this thesis the electronic way was used to conduct the questionnaire. The questionnaire
was built up through the web service Keysurvey (keysurvey.com) where the questionnaire
was reachable through an Internet link. The address to the site was then spread to the
sample trough the social network Facebook as an event. When the event was created over
500 persons from the authors friend lists were invited so that they could reach the link to
the questionnaire. The people that were invited could then chose to click attend and the
event would be visible to all their friends at Facebook as well and the same for these people
and the questionnaire could spread out to the target group. The questionnaire used the
Likert scale in order to measure the respondents’ attitudes and also both closed and open-
ended questions were used in order to collect demographic data about the respondent. The
Likert scale used in this questionnaire was graded from Strongly Disagree to Strongly Agree
on a degree from one to seven. In order to motivate the respondents more to complete the
questionnaire a lottery was stated for a cinema gift card with the value of 300 SEK. To be
able to win the respondents had to fill in their e-mail at the end as a lottery ticket. In order
to avoid half completed questionnaires the option of that all questions had to be filled in
order to be able to submit the questionnaire, except the line where the e-mail should be put
in for the lottery. The questionnaire was divided into four pages so that it would not seem to
long and hard to fill in. Both the Swedish version that was used and a translated version in

38
English is attached in the appendix, see Appendix 1 for the Swedish version and Appendix 2
for English version.
4.6.3 Pretesting According to Bryman & Bell (2005) a pre-testing, also called a pilot study should always be
done before starting to do the actual questionnaire. Eliasson (2010) writes that a pilot study
of a questionnaire can be done by letting an amount of individuals from the target group
answer the questions. It is important to take in consideration that those individuals that do
the pilot study should not also be included to do the finished one. A pilot study of a
questionnaire can provide information about things that the researcher have thoughts about
or did not thought about when the questionnaire was conducted. It may involve questions
that the researchers have about the answer alternatives, if something is missing or if the
respondents find it hard to understand the question. A pilot study makes it possible to
discover and eradicate weaknesses with the questionnaire (Eliasson, 2010). A pilot study
may be especially important when it comes to questionnaires due to that there is no
interviewer present that can answer questions that may occur (Bryman & Bell, 2005). In this
thesis eleven persons that all were a part of the target group were included in the pretesting
of the questionnaire in order to look for misunderstandings and difficult questions.
4.7 Sampling According to Malhotra (2010) the aim of the most marketing research studies is to collect
information about the characteristics or parameters of a population. To obtain this
information it can be done either by taking a census or a sample. A census involves every
element of the population while a sample only studies a representative subgroup of the
population. To do a census is both time-consuming and costly to conduct and is often
unrealistic to do if the population is large (Malhotra, 2010). Due to a limited resources and
time this thesis was using a sample of the population instead of study the whole population.
When talking about different sampling techniques it is broadly classified as either non-
probability or probability (Malhotra, 2010). Bryman & Bell (2005) writes that a probability
sample is a sample that has been chosen on a random basis, which means that each unit of
the selected population has a known chance to be selected. A non-probability sample is
different, it is a sample that has not been selected through a random sampling method. It

39
essentially means that some units in the population are more likely than others to be
selected in the sample (Bryman & Bell, 2005). A simple random sample is the most basic
form of a probability sample and is primary used in a cross-sectional research design. It is
used when the researcher has a large population and by making a sample would be able to
represent that to the whole population (Christensen et al., 2010). In this thesis the
population was as the purpose states Swedish TV- and movie viewers.
4.7.1 Sampling frame Malhotra (2010) describe a sampling frame as a representation of the elements of the target
population, which the sample will be selected from.
Generation Y is a segment that is described to be having high purchasing power. The
generation is specified to be individuals born from 1977 to 1994 which today, 2012, equals
people in the age of 18-35 (Noble et al., 2008). In a research made by Noble et al. (2008) the
conclusion was that it strengthen the previous theories about that the segment has high
purchasing power and adds that their respondents were chasing high value in their
purchasing. Furthermore they write about generation Y that “Branded products provide
consumers a sense of comfort from knowing that they look and feel good in these garments”
(Noble et al., 2008, p. 626) and that targeting this segment should include letting them know
that they can trust brand X (Noble et al., 2008).
Out from this data it seemed logical to investigate this particular segment due to the
purchasing power they possess. Therefore an age limit of 18-35 was being set as sampling
frame.
4.7.2 Sample selection and data collection procedure The sample size is referred to the number of element that will be included in the thesis
(Malhotra, 2010). In other words, it is about how many respondents that is desired to
answer the questionnaire.
The sampling frame of the age 18-35 in Sweden that was used in this thesis was at the 31
December 2011 a total of 2 206 763 individuals (scb.se). Calculated from a formula fetched
from Malhotra (2011) a desired minimum value of respondents would be as follows:

40
n = Sample size required N = Population size = 2 206 763 people Z = Number of standard errors = 1,96 for 95 % confidence level
𝑛 = 2500 × 𝑁 × 𝑍2
�25(𝑁 − 1) + (2500 × 𝑍2)�
2500 × 2 206 763 × 1,962
�25(2 206 763 − 1) + (2500 × 1,962)�= 384,09331
Figure 4.4: “Calculation of Sample Size”, Formula from (Malhotra, 2011)
Out from this formula the desired number of respondents was calculated to 384 people. To
reach the specific sampling frame the Internet link to the questionnaire was spread through
Facebook. In a research made by the social media analysis company SocialBakers based on
the usage the six last months until 2012-03-21 a mean of 4 638 500 Swedish citizens used
Facebook and they are distributed between 51% females and 49% males. Of all users 43% is
within this thesis´ sampling frame of 18-35 years old and is the largest user group on
Facebook (socialbakers.com). This is a total of 1 994 555 people. The sampling frame of this
thesis is as mention earlier 2 206 763 people and according to the statistics from
SocialBakers 90.4% of the sampling frame could potentially be reached through this
network.
4.8 Data analysis method Deciding what analysis that will be used in a research is a matter that is important to take a
stand to before retrieving the data that will be analyzed. This is because of how it implies the
gathering of the data. Depending on which data analysis methods that will used the
gathering of the data differs and must retrieve the right information to make certain data
analysis methods possible. In order for some methods to work it is of importance to retrieve
the right kinds of variables (Bryman & Bell, 2005)
In order to that the data retrieved from a questionnaire should be able to analyze the
questions in a questionnaire should be coded into numbers. For example a question about
gender with the answers Male or Female can be coded with; male = 0 and female = 1.
Furthermore some questions are automatically pre-coded like for example questions that

41
use the Likert scale, if it is a scale of 5 it automatically becomes 1,2,3,4,5 as answers and is
simple put in the coding sheet and if a question ask for age or similar the number itself is the
coding (Bryman & Bell, 2005).
Sometimes of different reasons (misunderstanding, unwillingness, simple mistake etc.) some
questions are not answered and in order to be able to use these respondents’ data the
missing data has to be filled in. In some cases the number 0 can be placed instead to apply
that it is no input and sometimes it can be filled in with the mean from other respondents if
the respondents´ other answers is in line and not stands out (Bryman & Bell, 2005).
4.8.1 Descriptive statistics According to Hinkle et al. (1994) descriptive statistics are used to show a clear summary of
the sample and measures. It classifies and summarizes numerical data, in other words it
describe the data that has been collected. Descriptive statistics includes measurements of
the average or variation around the average. This can be done through using different
statistics tables, such as a histogram, or different parameters such as the mean, median or
the standard deviation (Hinkle et al., 1994).
4.8.2 Correlation analysis According to Bryman & Bell (2005) the correlation coefficient provides information about the
probability that the coefficient also is applicable to the population from which the sample
was drawn from. The larger the sample size is, the more likely it is that the calculated
coefficient is statistical significant. If the correlation coefficient is statistically significant or
not is controlled by two factors which is the size of the calculated coefficient and the size of
the sample (Bryman & Bell, 2005). In order to be certain that the coefficient can be trusted
the significance value needs to be controlled. In economics and marketing significance is
recommended to be at least 95%, which equals a value of 0.05 (Malhotra, 2010).
The correlation analysis explains how two variables are related to each other. The coefficient
can be between -1.00 and 1.00 were a positive correlation means that if a respondents with
a high scores at variable 1 tend to have a high scores on variable 2, and those with low
scores on variable 1 tend to have low scores at variable 2 as well. A negative correlation
means that respondents with a high score on variable 1 tend to have a high score on variable
2 and those that have high scores on variable 1 tend to have a low score on variable 2 (Nolan

42
& Heinzen, 2008). According to Farrar and Glauber (1967) a rule of thumb is to have a
correlation coefficient lower than .8 or .9 to be sure that the variables do not measure the
same thing.
4.8.3 One-Sample T-Test A one-sample T-test compares the mean for each variable that is put in the formula, in this
test only one sample of a population is used. When testing it is also possible to chose a value
to have as a test value to compare the means to, for example if a seven graded scale is used
the test value could be 4 to see if the means are significant different to that test value (Nolan
& Heinzen, 2008).
4.9 Quality Criteria The quality of a research can be measured by validity and reliability, which can define the
strength and trustworthiness of a research (Yin, 2008). According to Bryman and Bell (2005)
validity refers to the question of whether one or more indicators that are designed to
measure a certain concept really measure that concept. Validity can be divided into three
different forms when it comes to evaluate the quality of a quantitative research; these are
content, construct and criterion validity (Bryman & Bell, 2005).
4.9.1 Content validity According to Bryman and Bell (2005) the content validity, also called face validity, is about
how well and clear a measurement reflects the concept in question. The content validity can
be determined by asking other people if the measurement is capturing the concept from
their views. A good way to do this is to involve experts in the certain research area that can
determine if the measurement seems to reflect what the concept is about in a clear and
understanding way (Bryman & Bell, 2005). In this thesis different professors of Linnaeus
University that can be seen as experts in the field of marketing looked over the
questionnaire to determine if the concepts were described in a clear and complete way.
4.9.2 Construct validity Construct validity is used when the researcher is deducing hypothesis and/or research
questions from a theory that is relevant to the concept (Bryman & Bell, 2005). Malhotra
(2010) describes this as a type of validity that makes it clear of what construct or
characteristics the scale is measuring, the researcher answer theoretical questions that

43
explain why the scale works and describe what deductions that can be done concerning the
underlying theory (Malhotra, 2010). This measurement has been done in this thesis through
a correlation test.
4.9.3 Reliability According to Yin (2008) the objective of measuring the reliability of a study is that if later
researcher would follow the same procedure and constructed the exactly same study as an
earlier researcher it should turn up with same conclusions and findings. In other words, the
study should be repeatable (Yin, 2008). Bryman and Bell (2005) writes that the reliability is
about the consistency, conformation and the trustworthiness of a measurement of a
concept and it can be measured in different ways, for example by doing a repeatable study
or by measuring the Cronbach alpha by a reliability test, that will be used in this thesis. The
Cronbach alpha calculates the average of all possible reliability coefficients in terms of so
called “split-half”, in other words that the questions is randomly divided and then compared
with each other (Bryman & Bell, 2005). The coefficient for Cronbach alpha is a number
between 0 and 1 and the higher the more reliable it is. Hair et al. (2003) writes about a rule
of thumb that to be sufficient reliable the coefficient should be at least .6, everything below
that is poor reliability. They also write as a recommendation to have at least three items per
concept to increase the actual reliability (Hair et al., 2003).

44
Chapter 5.
5. Analysis and Results 5.1 Descriptive statistics
he questionnaire was sent out to approximately 912 persons via the social network
Facebook where 434 persons responded the questionnaire, which is a response rate
of 47,7%. Jin (2011) writes that a typical response rate for Internet questionnaires is
about 6-15 %. The high response rate in this research can be explained by that the
questionnaire was sent out to the respondents on Facebook as an event. Because of that
several of the respondents filled in that they either “Attend” or “Not Attending” on the
event page, this made the event also visible for their friends. This may have led to that
people who were not invited to the event from the beginning also responded the
questionnaire, this could mean that the actual response rate might be a bit lower. In the end
418 respondents was used in this thesis.
T

45
The questionnaire was available online for one week. The 418 that responded were included
in the target groups, which were Swedish citizens between 18 and 35 years old. To ensure
that respondents that did not match the target group did not fill in the whole questionnaire
a control question was made in the beginning of the questionnaire where persons that was
not included in the target group was sifted out. It was a simple yes or no question about if
they were between the ages 18 and 35, if yes they could continue, if no the questionnaire
was ended.
Regarding the age at least one person for every age from 18 to 35 answered the
questionnaire. Mainly, the responses were from people that were 23 years old, followed by
the ages 22 and 24. The majority of the respondents were conducted by people in the ages
between 22 and 25, which was 275 people (66 %). It was shown that older respondents had
fewer responses, in the age group 26-35, 68 persons (16 %) out of 418 answered the
questionnaire. Because of the uneven age distribution no reliable conclusions could be
drawn regarding the difference in attitude between ages.
A majority of responses of the questionnaire were from females. From the total amount of
responses, females made 267 responses and males made 151 responses. This shows that
63.9 percent of the answers were made by females while males made 36.1 percent of the
answers. It was shown that students with a number of 89.7 percent mainly conducted the
questionnaire. 7.7 percent of the respondents worked full time while 1.7 percent had a part-
time work. Only 1 percent was unemployed. When it comes to how often the respondents
watch movies the majority watch movies 1-2 times a week and that the respondents watch
TV-shows more frequently than movies. The majority of the respondents watch TV-shows
every day.
All variables – Movie & TV-show consumption
In Table 5.1 the means for every concept in connection with how often the respondents
watch movies is shown. It is some variance between the means but it is no drastically
difference. For instance under the variable PP (Product Placement as a whole), it can be seen
that respondents that watch movies every day has a mean of 5.46 while respondents that
watch movies “less than above”, which equals more less than every second week, has a
mean of 5.58.

46
Table 5.2 is similar to Table 5.1 but instead it shows the means for every concept in
connection with how often the respondents watch TV-shows. What’s also similar is the
response, for instance as above the means for the variable PP (Product Placement as a
whole) for every day viewers are 5.43 and for less than every second week are 5.50 which is
very similar.
Excluded & Individual questions
Of all items used in the questionnaire four were taken out before merging and measuring
each variable. It was the questions PP3 (Product Placement), PCP2, PCP3 (Plot Connection)
Table 5.1 - How often do you watch Movies?
N PP VIS AUD VAP PCP PRO SUBMean 5,46 5,54 4,77 4,77 4,77 3,92 5,00
Std. Dev. 1,20 1,13 1,17 1,42 1,59 1,50 1,68
Mean 5,30 5,04 4,00 4,04 4,20 3,64 5,51
Std. Dev. 1,05 1,30 1,62 1,28 1,47 1,33 1,30
Mean 5,27 4,78 3,88 3,97 4,11 3,38 5,55
Std. Dev. 1,15 1,37 1,40 1,45 1,48 1,25 1,18
Mean 5,42 5,03 4,17 4,34 4,42 3,85 5,14
Std. Dev. 1,16 1,36 1,54 1,45 1,54 1,32 1,39
Mean 5,58 4,84 4,32 4,68 4,21 3,82 5,03
Std. Dev. 1,06 1,37 1,51 1,45 1,44 1,33 1,39
Mean 5,34 4,92 4,04 4,16 4,23 3,59 5,39
Std. Dev. 1,13 1,35 1,49 1,43 1,49 1,31 1,30
Every day
3-6 times a week
1-2 times a week
Every second week
Less than above
13
84
190
93
38
418Total
Table 5.2 - How often do you watch TV-shows?
N PP VIS AUD VAP PCP PRO SUBMean 5,43 4,93 3,92 4,19 4,27 3,59 5,37
Std. Dev. 1,12 1,32 1,45 1,43 1,43 1,30 1,31
Mean 5,19 4,92 4,18 4,08 4,12 3,59 5,50
Std. Dev. 1,17 1,44 1,51 1,49 1,53 1,32 1,29
Mean 5,24 4,90 4,24 4,30 4,48 3,69 5,27
Std. Dev. 1,09 1,42 1,63 1,38 1,51 1,34 1,19
Mean 5,40 5,00 4,50 4,30 3,80 3,80 5,30
Std. Dev. 1,17 0,94 1,08 1,16 1,55 1,48 1,89
Mean 5,50 4,58 3,67 3,42 3,33 3,08 5,58
Std. Dev. 1,00 1,17 1,44 1,38 1,83 1,24 1,38
Mean 5,34 4,92 4,04 4,16 4,23 3,59 5,39
Std. Dev. 1,13 1,35 1,49 1,43 1,49 1,31 1,30
Every second week
67
10
12
418
Less than above
Total
227
102
Every day
3-6 times a week
1-2 times a week

47
Figure 5.2: PCP2 - Match the Story Figure 5.1: PP3 - Ethical side of product placement
0
100
1 2 3 4 5 6 7
Freq
uenc
y PP3 - Ethical side of product
placement
0
50
100
150
1 2 3 4 5 6 7
Freq
uenc
y
PCP2 - Match the Story
and SUB4 (Subtle) that did not measure the variable intended. Two of the questions were
however still of interest, PCP2 and PP3, because of the facts it still brought to the research.
Regarding the question if the product or brand that is placed into a movie or TV-show should
match the story (Figure 5.1) the response showed a high agreement. The highest response
was number 7 with 40.9 % of all respondents. The mean was 5.67 with a standard deviation
of 1.513.
The question about if the respondents think it is inappropriate with placements of alcohol,
cigarettes and guns (Figure 5.2) the respondents answered mostly positive. The mean was
4.87 with a standard deviation of 1.899, which shows that the respondents think that it is
slightly inappropriate to include alcohol, cigarettes and guns in product placements.
5.2 Reliability & Validity As described in the methodology part a Cronbach alpha test was done in order to see the
reliability for every variable. In Table 5.3 the Cronbach alpha is displayed for each variable.
The majority of the variable uses all previous stated items for measuring the variable. Before
merging the items to each variable four items was removed since they decreased the
Cronbach alpha. Two of these items (PCP2 and PP3) were still interesting for the study
independently due to the nature of the questions.
When first examined the Cronbach alpha for each variable it was one variable that was lower
than 0.6, PCP (Plot Connection) with an alpha of 0.523 with 434 respondents. It was then
noticed that several responses had not reacted well to the control question PCP4 that was a
negative stated question. When examined the relation between the questions for the
variable PCP it was revealed that some respondents answered nr 1 on the first question and
nr 7 on the second, or vice versa. It was a sum of 16 respondents, 3.7 % of the total.

48
According to Hair et al. (2007) a question with more than 10 % missing data should be
removed. In this case it was not missing data rather an indicator towards misinterpreting the
question or that the respondent did not read before answering. In order to increase the
alpha and also increase the reliability over all questions these respondents´ answers were
removed and decreased the respondents’ number from 434 to the used 418. This meant
that now the variable PCP has just two items compared the recommended three, this has to
be taken in consideration although it is just a recommendation and not a rule.
As can be seen in Table 5.3 each variable is at least 0.6, which is acceptable, and the lowest
in this test was plot connected placement (PCP) with the alpha of 0.667.
5.3 Correlation Analysis In Table 5.3 all correlation data is presented. As can be seen the highest coefficient is .753
and is lower than the rule of thumb of .8 or .9 that Farrar and Glauber (1967) writes about.
This means that none of the variables measures the same concept.
Under the column PP (Product Placement) it can be seen that all variables has a positive
correlation towards product placement as a whole, however it has to be taken into
consideration that the variable Subtle (SUB) is not significant with a score of .513. The
highest correlation coefficient is between PP and VIS (Visual) and has a value of .691.
As mentioned the correlation between SUB (Subtle) and PP (Product Placement) was not
significant, but also the correlation between SUB and VIS (Visual) has no significance either
with its value of .566. This is the only two variables in the table that has no significance in the
coefficient. This means that there is no significant correlation between these variables. All
the other correlation has at least a significance level of 95 % and the majority even at 99 %.
The highest positive coefficient over all is .753 and is between VAP (Visual/Audio) and AUD
(Audio). Moreover it can be seen that the correlation between the variable SUB (Subtle) is
negative correlation with audio (AUD), visual/audio (VAP), plot connection (PCP) and
prominent (PRO) placements. This means that if a respondent tend to like subtle placement
they tend to dislike the four mentioned variables and vice versa. The highest negative
correlation is between SUB and PRO, -.393.

Cro
nbac
h α
Mea
nSt
d. D
ev.
PPVI
SAU
DVA
PPC
PPR
OSU
B
Prod
uct P
lace
men
t1
PP Visu
al,6
91**
1
VIS
,000
Audi
o,4
80**
,617
**1
AUD
,000
,000
Visu
al &
Aud
io,5
56**
,610
**,7
53**
1
VAP
,000
,000
,000
Plot
Con
nect
ion
,428
**,4
47**
,509
**,4
92**
1
PCP
,000
,000
,000
,000
Prom
inen
t,4
76**
,502
**,5
31**
,560
**,4
76**
1
PRO
,000
,000
,000
,000
,000
Subt
le,0
32,0
28 -
,103
* -
,173
** -
,112
* -
,393
**1
SUB
,513
,566
,035
,000
,022
,000
Not
es: N
= 4
18.
5,34
4,92
4,04
4,16
4,23
3,59
5,39
**. C
orre
latio
n is
sig
nific
ant a
t the
0.0
1 le
vel (
2-ta
iled)
.*.
Cor
rela
tion
is s
igni
fican
t at t
he 0
.05
leve
l (2-
taile
d).
1,49
1,31
1,30
,783
,667
,775
Tabl
e 5.
3 - C
orre
latio
ns a
nd C
ronb
ach
Alph
a 1,13
1,35
1,49
1,43
,771
,816
,862
,745

50
Figure 5.3: Product Placement (PP)
Figure 5.4: Visual (VIS)
0
50
100
150
1 2 3 4 5 6 7
Freq
uenc
y
Visual (VIS)
0
50
100
150
1 2 3 4 5 6 7
Freq
uenc
y
Product Placement (PP)
5.4 Analysis of the Research Questions
RQ1: What is the attitude towards product placement in general?
What can be seen in Figure 5.3 is the result from merging the result from six questions
regarding the concept of “Product Placement as a whole concept (PP)”. The mean for the
variable was 5.34 on the 7-graded scale and the standard deviation 1.13. The most usual
response regarding product placement was number 6 with 36.4 % of all responses. The
tendency is that the overall attitude towards product placement is positive. When looking at
male and female separately it is a significant difference towards that males are a little more
positive towards product placements, the mean for males are 5.47 and females 5.27 (see
Appendix 3).
RQ2: What is the attitude towards visual placements?
Figure 5.4 illustrates the result of merging the three questions regarding visual placements.
The mean for the variable was 4.92 on the 7-graded scale and the standard deviation 1.35.
The most usual response for visual placements was nr 5 with 29.4 % of all responses. The
tendency is a mainly a positive attitude towards product placements that are visible. When
looking gender vise at visual placements males are significant more positive, the mean for
males are 5.07 and females 4.83 (see Appendix 3).

51
Figure 5.5: Audio (AUD)
0
50
100
150
1 2 3 4 5 6 7
Freq
uenc
y
Audio (AUD)
Figure 5.6: Visual & Audio (VAP)
0
50
100
150
200
1 2 3 4 5 6 7
Freq
uenc
y
Visual & Audio (VAP)
RQ3: What is the attitude towards audible placements?
Figure 5.5 illustrates the result for audible placements can be seen. The result comes from
the merging of the three questions regarding placements with audio characteristics. The
mean for the variable was 4.04 on the 7-graded scale and the standard deviation 1.49. The
most frequent response was number 4, with 29.9 % of the responses. The attitude towards a
placement that is audible is regarded neutral and when looking at males and females
separately for this concept there were no significant difference between their attitudes (see
Appendix 3).
RQ4: What is the attitude towards combined visual and audible placements?
Figure 5.6 illustrates the result of Visual & Audio placements are shown. The result comes
from three questions that were merged to one variable. The mean for the variable was 4.16
and the standard deviation 1.43. The most frequent response was number 4 with 36.4 % of
the responses. The attitude toward placement that has the combination of both visual and
audible attributes is rather neutral and it is a significant difference between male and female
where males have a little higher mean than females. The mean for males are 4.30 and for
female it is 4.08 (see Appendix 3).

52
Figure 5.8: Prominent (PRO)
Figure 5.7: Plot Connection (PCP)
0
50
100
150
1 2 3 4 5 6 7
Freq
uenc
y
Plot Connection (PCP)
0
50
100
150
1 2 3 4 5 6 7
Freq
uenc
y
Prominent (PRO)
RQ5: What is the attitude towards a plot connected placement?
Figure 5.7 illustrates the result of plot connected placement is shown. The variable comes
from two questions regarding the concept. The mean for the variable was 4.23 and the
standard deviation 1.49. The most frequent response was number 4 with 30.1 % of all
responses. The attitude towards a plot connected placement is rather neutral. When looking
at males and females separately there were no significant difference in attitudes (see
Appendix 3). Also, when looking at this concept it has to be taken in to consideration that it
has only two items that represent the attitude.
RQ6: What is the attitude towards a prominent placement?
Figure 5.8 illustrates the result is shown for placements that are prominent. The variable
comes from four questions regarding the concept. The mean for the variable was 3.59 and
the standard deviation 1.31. The most frequent response was number 4 with 31.3 % of all
responses. The attitude towards a placement that is prominent has the tendency towards
negative with the position a little lower than neutral. Gender vise females have significant
lower attitude and acceptance towards prominent placements than males. The mean for
males are 3.71 and females 3.53 (see Appendix 3).

53
Figure 5.9: Subtle (SUB)
0
50
100
150
1 2 3 4 5 6 7
Freq
uenc
y
Subtle (SUB)
RQ7: What is the attitude towards a subtle placement?
Figure 5.9 illustrates the result is shown for responses towards placements that are subtle.
The variable comes from three questions regarding the concept. The mean for the variable
was 5.39 and the standard deviation 1.30. The most frequent response was number 6 with
27.8 % of all responses. The attitude towards placements that are subtle is rather positive
and the research showed that there was no difference between the genders regarding the
attitude towards subtle placements.

54
Chapter 6.
6. Discussion & Conclusion 6.1 Discussion The aim for this thesis was to map and describe what the Swedish audience´s attitudes are
towards product placements that occur in Movies and TV-Shows. Out from the result of the
research it was shown that the general attitude toward product placement is positive in
Sweden. This is similar to what researchers have found in USA, France, Austria (Gould et al.,
2000), Australia (Brennan et al., 2004), Netherlands (Reijmersdal et al., 2010) and Korea (Lee
et al., 2011) that the attitude is generally positive toward product placements.
In the studies made in USA, France, Austria (Gould et al., 2000) and Australia (Brennan et al.,
2004) the findings showed that females were significant less positive towards product
placements. From the research made in this thesis the result showed some similarities to the

55
previous researches. For four (Product Placement, Visual, Visual/Audio and Prominent) of
the seven concepts males had a significantly more positive attitude towards placements
than females, just like in USA, France, Austria (Gould et al., 2000) and Australia (Brennan et
al., 2004). It is not a big difference but still significant. The other three concepts (Audio, Plot
Connection & Subtle) showed no significant difference between males and females. The
studies in USA, France, Austria and Australia also showed that it was little acceptance for
placements where cigarettes, alcohol and guns were involved (Gould et al., 2000; Brennan et
al., 2004). Even this shows similarities to the Swedish people since they have the same
negative attitude and thought it was inappropriate to include these products in a placement.
In general the Swedish audience has a positive attitude toward placements that are visual. It
was shown that the correlation between a visual placement and product placement as a
whole is high and the attitudes is similar. Mainly, the majority of all product placements are
visual, if not it is just audible. This classic way of placement is the type of placement that is
the most associated with product placement. The classic way to place a product in a movie
or TV-show is to let it appear in the cameras´ view in a way that should be naturally
integrated to the movie or TV-show, often in a background setting (Lehu, 2007). The Swedish
audience has a positive attitude towards this kind of appearance of a product placement.
Since earlier studies has shown that a visual-only placement has a large recall for the viewer
(Law & Braun, 2000), the companies should keep this into consideration in the decision
making of how to place their product in a movie or TV-show. This is due to the combination
of the positive attitude towards a visual placement that the Swedish audience has, and the
opportunities for a good recall.
When it comes to product placements that are audible, by for instance being mentioned
verbally by the character in a movie or TV-show, the attitude towards this kind of placement
was overall neutral for the Swedish audience. Even if the audience of Sweden neither have
any positive or negative opinions about an audible product placement it is still appropriate
for companies to use this kind of placement since it has been shown by Wilson and Till
(2011) that audio-only placements has at least an equal large impact of the recall by the
viewers as visual-only, where both of them combined has a larger recall. It was shown that
the Swedish audience´s has a neutral attitude, that slightly tend to be positive, with product
placements that has a combined appearance of a visual and audible dimension at the same

56
time. If the different dimensions visual-only, audio-only and a combination audio-visual are
compared with each other it is shown that a product placement that has a visual appearance
is seen as the most positive way to place a product in a movie or TV-show according to the
Swedish audience, due to the positive attitude.
Regarding placements that are involved in the plot of a movie or TV-show, a so-called plot
connection (Russell, 2002), the Swedish audience had a small positive significant response
from the research. It was shown that the viewers do not really have a clear opinion about a
plot connected placement since the attitude was nearly neutral. However the viewers had
strongly beliefs about that the product that would be involved in the plot should definitely
match the story of the movie or TV-show.
It was clearly shown that the Swedish audience prefers a subtle placement before a
prominent placement. The attitudes towards a subtle placement, where the placement is
harder to notice and does often occur in the background (Ferraro & Avery, 2000), was
overall positive for the audience in Sweden, with no differences between the gender. This
shows similarities to other studies that have come up with that the consumer attitudes are
relatively positive, even if the placement is exposed in a repeated way (Homer, 2009; van
Reijmersdal, Neijens & Smit, 2009).
A prominent placement that can be seen as the opposite to a subtle placement where the
placement can be easy to notice and be very obvious (Ferraro & Avery, 2000), is not
preferable for the Swedish audience since they tend to have a negative attitude towards it.
Even if the attitude towards a prominent placement is negative it could even though be an
opportunity for companies since it has been shown by Law and Braun (2000) that a
prominent placement has a higher recall than a subtle placement. Still, it can have a negative
impact since the brand attitude has a tendency to decrease if the placement is too obvious
(Homer, 2009; van Reijmersdal, Neijens & Smit, 2009). The negative attitude that the
Swedish audience have towards a prominent placement may be caused by the opinion that
it could be distracting, less realistic and an interruption to the story of a movie or TV-show.
This can be connected to utilitarian function of attitudes that states that attitudes are
shaped from that people get either rewards or punishments (Solomon et al., 2010). Since a
prominent placement can be distracting it can be seen as a punishment to the viewer and

57
that can lead to a negative attitude towards the placement itself and both the product and
movie/TV-show.
6.1.1 Conclusion It was shown that the attitude towards product placement in Sweden has similarities to
other countries where previous research of the subject has been done. The general attitude
towards product placement in Sweden is positive. The Swedish audience has also a positive
attitude towards placements that is visual in a movie or TV-show.
Placements that has an audible appearance or a combination of both visual and audio is
something the Swedish audience doesn’t have a stronger opinion about, since their attitude
towards it is neutral. This level of attitude can also be applied to a placement with a
connection to the plot, with a small difference towards a positive attitude.
The Swedish audience’s attitude towards placements that are either subtle or prominent has
big differences since the attitude towards a subtle placement is seen as positive while the
attitude towards a prominent placement is negative.
6.2 Theoretical & Managerial Implications This thesis was focusing on the Swedish attitude towards product placements. Through the
investigation this thesis expands the research about the attitudes towards product
placements. It describes what the attitude towards different concepts of product placement
is, both from a general view and also towards six sub concepts of product placement.
Furthermore, this thesis has after concluding the result from the Swedish audience that was
collected from quantitative empirical data compared the findings with previous research
that has been carried out in other countries. The thesis shows that the attitudes in Sweden
are in line with what has been found in other countries before. Earlier studies that have
been done in this field have a similar pattern for the attitudes towards the different product
placements dimensions as the conclusions from this thesis.
Cowley and Barron (2008) wrote that the main advantage with product placement is that the
viewer’s cannot avoid the exposure of the placement when they are watching a TV-show or
a movie. It has been shown that the Swedish audience´s attitudes towards product
placement do not differ by how often they watch TV-shows or movies. An interesting part is

58
that Swedes watch TV-shows and movies very frequently, the majority watch TV-shows
every day and movies one to two times a week. Since the Swedish citizens tend to avoid the
commercials increasingly (tns-sifo.se), product placement is a good opportunity for
companies to reach out to many people due to the high viewing rate of TV-shows and
movies.
Furthermore it can be good for marketers to consider how they want their brand to be seen
since according to Herzog (1963) the brand image is the sum of all impressions and
perceptions that customers gets. Due to this it is important to take in to consideration how
different placements have different attitudes. Therefore a placement can create a negative
attitude to the placement itself and trough that create a negative attitude towards the brand
that is placed. But at the same time the main purpose with product placement from a
company´s view is to increase brand awareness (Karrh, 1998; Karrh et al., 2003; Chang et al.,
2009) and it is therefore a balance between to be not seen at all or risk creating a negative
attitude.
6.3 Limitations In this thesis a single cross-sectional research method was used as mentioned before. This
was due to both time and monetary constrains. With this type of study it is more limited to
investigate causal relations and what is an underlying reason for the attitudes, now the
results only give exactly what the attitudes are. With more time at hand a longitudinal or
multi cross-sectional research method could be used to increase the foundation of the result
by mapping if the attitude is consistent or change over time.
Another limitation in this thesis is regarding the concept Plot Connection (PCP) that from the
beginning had four items for measuring the attitude. After the questionnaire was conducted
it become clear that two of the items did not measure the concept in the way that it was
supposed and these two items were removed and left the concept with just two items. Due
to the time constraint it was no possibility to make an improvement for this concept and
make a new measurement.
Due to the uneven distribution of the age responses it was not possible to draw any
conclusions about if it was any difference between the attitude and age. The same situation

59
occurred regarding to what occupation the respondents had, where the majority were
students. Also it has to be taken in to consideration that the respondents was a majority of
females with a percentage of 63.9, a goal would of course be 50 % per gender to have a total
equal distribution. As seen in the comparison between genders, females had a significant
lower attitude in general towards product placement. Due to this the uneven distribution
could potentially decrease the total attitude for both genders.
6.4 Suggestions for future research Product placement is a growing field of marketing in today’s society and it needs more
research in the field. Through this thesis several questions have been raised that needs
further research and therefore some suggestions have been made.
An interesting thought that was raised during this thesis is regarding the line between subtle
and prominent placements. In the existing literature and previous research no clear line
between these concepts is drawn. The attitudes towards subtle placements are higher than
prominent placements in Sweden but it has been proven by earlier researches that
prominent placements have higher recall than subtle placements. That means that
marketers want to use prominent placements to make use of the higher recall yet the
audience prefers subtle placement. On the other hand if a prominent placement is too
obvious it could have a negative impact. Therefore a study focused on where the line goes
between subtle and prominent placements are and what is acceptable, this would bring
interesting facts to the field.
A suggestion for researchers in the future is to improve the measurement for the concept
Plot Connection (PCP). This is a concept that in this thesis is on the verge of not being
reliable. To make it more reliable in future research other items has to be used to fully
measure the attitude.
Another suggestion is to make a more adequately research by better control and work for a
more evenly distribution of the sample. In this thesis the sample frame were between the
ages 18 and 35 but 66 % was between 22-25 years old and also 89.7 % of all respondents
was student. To make a more generally stated research in the future it would be interesting

60
to involve other age categories and also make sure that the survey reaches more peoples
that are not students.
Grönroos (2008) writes about how a message can have different trustworthiness depending
on how the message is transmitted, he writes about four levels where planned message is
the least trustworthy. This is the category he writes about that product placement fit the
most in and it is of course a planned message from the company´s side but still differ from
regular commercials that is the examples Grönroos writes about. Out from this it can be
seen that an investigation of the trustworthiness in product placements and even if different
placements has different trustworthiness would be interesting and bring new theories to the
field.

61
Reference Aaker, D. A. (1996), ‘Building Strong Brands’, The Free Press, New York, NY.
Aaker, D. A. (1997), ”Dimensions of Brand Personality”, Journal of Marketing Research, vol. 34, no. 3, pp. 347-356.
Ajzen, I. (2005), “Attitudes, Personality and Behavior”, Second edition, Open University Press, New York.
Ambler, T. (1997), “How much of brand equity is explained by trust?”, Management Decision, vol. 35, no. 4, pp. 283–292.
Armstrong, G., Kotler, P., Harker, M. & Brennan, R. (2009), “Marketing an Introduction”, European Edition, 1st Edition, Pearson Education. Essex
Babin, L.A. & Carder, S.T. (1996), ”Advertising via the box office: is product placement effective?”, Journal of Promotion Management, vol. 3, no. 1/2, pp. 31-51.
Balasubramanian, S.K., Karrh, J.A. & Patwardhan, H. (2006), ”Audience response to product placements”, Journal of Advertising, vol. 35, no. 3, pp. 115-141.
Belk, R. W. (1988), “Possessions and the Extended Self”, Journal of Consumer Research, vol. 15, September, pp.139-168.
Brennan, S., Rosenberger III, P. J. & Hementera, V. (2004), “Product placements in movies: An Australian consumer perspective on their Ethicality and acceptability”, Marketing bulletin - Department of Marketing, Massey University, vol. 15, pp. 1-16
Bryman, A., & Bell, E. (2005), ”Företagsekonomiska forskningsmetoder”, Edition 1:1, Liber AB, Malmö.
Castaway, 2000. (Film) Directed by Robert Zemeckis. USA: 20th Century Fox
Casino Royale, 2006. (Film) Directed by Martin Campbell. USA. Columbia Pictures
Chang, S., Newell, J. & Salmon, C.T. (2009), ”Product placements in entertainment media”, International Journal of Advertising, vol. 28, no. 5 , pp. 783-806.
Chernatony, L. & McDonald, M. (2003), “Creating Powerful Brands”, Third Edition, Butterworth-Heineman.
Christensen, L., Engdahl, N., Grääs, C. & Haglund, L. (2010), ”Marknadsundersökning: en handbok”, Third edition, Studentlitteratur, Lund.
Cowley, E. & Barron, C. (2008), ”When product placement goes wrong”, Journal of Advertising, vol. 37, no. 1, pp. 89-98.
dn.se – Swedish newspaper, online version. - http://www.dn.se/kultur-noje/produkterna-flyter-in-i-tv-serierna
Reviewed: 2012-02-17

62
Drive, 2011. (Film) Directed by Nicolas Winding Refn. USA. FilmDistrict
Eliasson, A. (2010), ”Kvantitativ metod från början”, Second edition, Studentlitteratur, Lund.
Eriksson, L.T. & Wiedersheim-Paul, F. (2011), “Att utreda, forska och rapportera”, 9th Edition, Liber AB, Malmö.
Evans, M., Jamal A. & Foxall G. (2008), “Consumer Behaviour”, Second Edition, John Wiley & Sons Ltd, West Sussex.
Farrar, D. E. & Glauber, R. R. (1967),” Multicollinearity in Regression Analysis: The Problem Revisited”, The Review of Economics and Statistics, vol. 49, no. 1, pp. 92-107.
Farquhar, P. H. (1989), “Managing Brand Equity”, Marketing Research, September, pp. 24-33.
Ferraro, R. & Avery, R.J. (2000), ”Brand appearances on prime-time television”, Journal of Current Issues and Research in Advertising, vol. 22,no. 2, pp. 1-15.
Forrest Gump, 1994. (Film) Directed by Robert Zemeckis. USA. Paramount Pictures
Galician, M. & Bourdeau, P.G. (2004), ”The evolution of product placements in Hollywood cinema: embedding high-involvement ‘heroic’ brand images”, Journal of Promotion Management, vol. 10, no. 1/2, pp. 15-36.
Gould, S. J., Gupta, P. B. & Grabner-Kräuter, S. (2000). “Product placements in movies: a cross-cultural analysis of Austrian, French and American consumers' attitudes toward this emerging, international promotional medium”, Journal of Advertising, vol. 29, no.4, pp. 41-58.
Gupta, P. B. & Gould, S. J. (1997), ”Consumers’ Perception of the Ethics and Acceptability of Product Placements in Movies: Product Category and Individual Differences”, Journal of Current Issues and Research in Advertising, vol. 19, no. 1, pp. 37-50.
Gupta, P. B & Lord, K. R. (1998), “Product placement in movies: The effect of prominence and mode on audience recall”, Journal of Current Issues and Research in Advertising, vol. 20, no. 1, pp. 47-59
Gregorio, F. & Sung, Y. (2010), “Understanding attitudes toward and behaviors in response to product placement”, Journal of Advertising, vol. 39, no. 1, pp. 83–96.
Gripsrud, J. (2002), “Mediekultur Mediesamhälle”, Second Edition, Daidalon AB, Sweden.
Grönroos, C. (2008), “Service Management and Marketing – Costumer management in Service competition”, British Library, Third Edition.
Hair, J. F., Money, A. H. & Samouel, P. (2003), “Essentials of business research methods”, Wiley & Sons, Inc., Danvers, USA.

63
Hair, J. F., Money, A. H., Samouel, P. & Page, M. (2007), “Research Methods for Business”, John Wiley & Sons, Chichester.
Herzog, H. (1963), “Behavioral science concepts for analyzing the consumer”, ‘Marketing and the Behavioral Sciences’, Bliss, P. (ed.) Allyn and Bacon, Boston, MA, pp. 76–86.
Hinkle, D. E. (1994), “Applied statistics for the behavioral sciences”, Third edition, Houghton Mifflin Corporation, Boston.
Holme, I. M. & Solvang, B. K. (1997), “Forskningsmetodik: om kvalitativa och kvantitativa metoder”, Second edition, Studentlitteratur, Lund.
Homer, P. M. (2009), ”Product placements – The impact of placement type and repetition on attitude”, Journal of Advertising, vol. 38, no. 3, pp. 21–31.
irm-media.se – The Institute of Advertising and Media Statistics. - http://www.irm-media.se/pdf_public/pressmeddelande_q4-11.pdf
Reviewed: 2012-02-16
I, Robot, 2004. (Film) Directed by Alex Proyas. USA. 20th Century Fox
Jin, L. (2011), “Improving response rates in web surveys with default setting, The effects of default on web survey participation and permission”, International Journal of Market Research, vol. 53, issue 1, pp. 75-94.
Katz, D. (1960), “The Functional Approach to the Study of Attitudes” Public Opinion Quarterly, vol. 24, pp. 163-204.
Karaosmanoglu, E. & Melewar, T. C., (2006) “Corporate communications, identity and image: A research agenda”, Journal of Brand Management, Vol. 14, pp. 196-206
Karrh, J.A. (1998), ”Brand placement: a review”, Journal of Current Issues and Research in Advertising, vol. 20, no. 2, pp. 31–49.
Karrh, J.A., McKee, K.B. & Pardun, C.J. (2003), ”Practitioners’ evolving views on product placement effectiveness”, Journal of Advertising Research, vol. 43, no. 2, pp. 138– 149.
Karniouchina, E. V., Uslay, C. & Erenburg, G. (2011), “Do marketing media have life cycles? The case of product placement in movies”, Journal of Marketing, vol. 75, pp. 27-48
Keller, K. L. (1993), “Conceptualizing, measuring, and managing customer-based brand equity”, Journal of Marketing, vol. 57, no. 1, pp. 1–17.
keysurvey.com – Online questionnaire services. - http://www.keysurvey.com/ Reviewed: 2012-04-11
Kotler, P., Armstrong, G., Saunders, J., Wong, V. (2002), “Principles of Marketing”, Third European Edition, Pearson Education, Essex.

64
La Ferle, C. & Edwards, S.M. (2006), ”Product placement”, Journal of Advertising, vol. 35, no. 4, pp. 65–86.
Law, S. & Braun, K.A. (2000), ”I’ll have what she’s having: gauging the impact of product placements on viewers”, Psychology & Marketing, vol. 17, no. 12, pp. 1059–1075.
Lee, T., Sung, Y. & Choi, S. M. (2011). “Young adults’ responses to product placement in movies and television shows: A comparative study of the United States and South Korea”, International Journal of Advertising. Vol. 30, no. 3, pp. 479-507
Lehu, J. (2007), “Branded Entertainment: Product Placement and Brand Strategy in the Entertainment Business”, Kogan Page Ltd, London.
Lovelock C. & Wirtz J. (2011) “Service marketing people, technology, strategy”, Seventh edition, Pearson Education, New Jersey.
MacInnis, D.J. & Jaworski, B.J. (1989), ”Information processing from advertisements: toward an integrative framework”, Journal of Marketing, vol. 53, no. 4, pp. 1–23.
Malhotra, N. (2010), “Marketing Research”, Sixth edition, Pearson Education, New Jersey.
Malhotra, N. (2011), ”Basic Marketing Research”, Fourth edition, Prentice Hall, Upper Saddle River.
mindshare.se – Communications agency. - http://www.mindshare.se/om-oss/nyheter/@robinsontittarna-svalde-
sibyllaplaceringen Reviewed: 2012-02-16
Nandan, S. (2004), “An exploration of the brand identity-brand image linkage: A communication perspective”, Brand Management, vol. 12, no. 4, pp. 264–278.
Noble, S. M., Haytko, D. L. & Phillips, J. (2008), “What drives college-age Generation Y consumers?”, Journal of Business Research, vol. 62, pp. 617–628.
Nolan, S. A. & Heinzen, T. E. (2008), “Statistics for the Behavioral Sciences”, First Edition, Worth Publishers, New York.
Ong, B. S. (2004), “A Comparison of Product Placements in Movies and TV programs: An online Research Study”, Journal of Promotion Management, vol. 10, no. 1, pp. 147-158.
Park, C. W., Jaworski, B. J. and MacInnis, D. J. (1986), “Strategic brand concept-image management”, Journal of Marketing, vol. 50, October, pp. 135–145.
Patel, R. & Davidsson, B. (2011), “Forskningsmetodikens grunder: Att planera, genomföra och rapportera en undersökning”, Fourth edition, Studentlitteratur, Lund.
Plummer, J. T. (1985), “How personality makes a difference”, Journal of Advertising Research, vol. 24, no. 6, pp. 27–31.

65
riksdagen.se – Government site with the Swedish laws. - http://62.95.69.3/SFSdoc/10/100696.pdf
Reviewed: 2012-02-10
Russell, C.A. (2002), ”Investigating the effectiveness of product placements in television shows: the role of modality and plot connection congruence on brand memory and attitude”, Journal of Consumer Research, vol. 29, no. 3, pp. 306–318.
Russell, C.A. & Belch, M. (2005), ”A managerial investigation into the product placement industry”, Journal of Advertising Research, vol. 45, no. 1, pp. 73–92.
saljarnas.se – Newspaper, professional association for sales and marketing. - http://www.saljarnas.com/Saljaren/Arkiv/Artikelarkiv/2011/Nummer-4-5/TV-
reklamen-tar-nya-vagar/ Reviewed: 2012-02-16
scb.se – Statistical Central Bureau, Swedish population by sex and age, December 31, 2011. - http://www.scb.se/Pages/TableAndChart____262459.aspx Reviewed: 2012-03-19
Schiffman, L. G. & Kanuk, L. L. (2004), “Consumer Behavior”, Eight edition, Pearson Education, New Yersey.
Seetharaman, A., Nadzir, Z. A. & Gunalan, S. (2001), “A conceptual study on brand valuation”, Journal of Product & Brand Management, vol. 10, no. 4, pp. 243–256.
Smit, E., van Reijmersdal, E. & Neijens, P. (2009) Today’s practice of brand placement and the industry behind it. International Journal of Advertising, 28(5), pp. 761–782.
socialbakers.com – Social Media Analysis Company, Swedish Facebook statistics. - http://www.socialbakers.com/facebook-statistics/sweden
Reviewed: 2012-03-21
Solomon, M. R., Bamossy, G., Askegaard, S. & Hogg, M. K. (2010), “Consumer Behaviour – A European Perspective”, Fourth edition, Pearson Education, Essex.
Solsidan, 2010-2011. (TV-series) Directed by Felix Herngren & Ulf Kvensler. Sweden. Jarowskij
svd.se – Swedish newspaper, online version. - http://www.svd.se/naringsliv/reklamen-du-inte-ska-upptacka_6481138.svd
Reviewed: 2012-02-16
sydsvenskan.se – Swedish newspaper, online version. - http://www.sydsvenskan.se/kultur-och-nojen/article1192560/SVT-far-salja-plats-i-
rutan.html Reviewed: 2012-02-10
The Fifth Element, 1997. (Film) Directed by Luc Besson. USA. Gaumont Film Company

66
tns-sifo.se – Researching organization, Reklamundvikande I Sverige 2008. - http://www.tns-sifo.se/media/89146/sifo_reklamundvikande_20081202.pdf Reviewed: 2012-05-29
van Reijmersdal, E.A., Neijens, P.C. & Smit, E.G. (2009), ”A new branch of advertising: reviewing factors that influence reactions to product placements”, Journal of Advertising Research, vol. 49, no. 4, pp. 429–449.
van Reijmersdal, E.A., Smit, E.G. & Neijens, P.C. (2010), “How media factors affect audience responses to brand placement”, International Journal of Advertising, vol. 29, nr. 2, pp. 279-302.
Wallén, G. (1996), “Vetenskapsteori och forskningsmetodik”, Second edition, Studentlitteratur, Lund.
Wilson, R. T. & Till, B. D. (2011), “Product placements in movies and on Broadway”, International Journal of Advertising, vol. 30, no. 3, pp. 373–398.
Yang, M. & Roskos-Ewoldsen, D. R. (2007), “The effectiveness of brand placements in the movies: Levels of placements, explicit and implicit memory, and brand-choice behavior”, Journal of Communication, vol. 57, pp. 469-489
Yin, R. K. (2008), ”Case Study Research, Design and methods”, Fourth edition, SAGE Corporation, London.

67
Appendix 1 – Swedish questionnaire

68

69

70

71
Appendix 2 – English questionnaire

72

73

74

75
Appendix 3 – T-test Ap.3.1 T-Test
One-Sample Statistics
N Mean Std. Deviation Std. Error Mean
PP 418 5,34 1,125 ,055
VIS 418 4,92 1,348 ,066
AUD 418 4,04 1,488 ,073
VAP 418 4,16 1,432 ,070
PCP 418 4,23 1,491 ,073
PRO 418 3,59 1,309 ,064
SUB 418 5,39 1,300 ,064
Measured against test value 4
One-Sample Test
Test Value = 4
t df Sig. (2-tailed) Mean
Difference
95% Confidence Interval of the
Difference
Lower Upper
PP 24,383 417 ,000 1,342 1,23 1,45
VIS 13,894 417 ,000 ,916 ,79 1,05
AUD ,526 417 ,599 ,038 -,10 ,18
VAP 2,254 417 ,025 ,158 ,02 ,30
PCP 3,116 417 ,002 ,227 ,08 ,37
PRO -6,351 417 ,000 -,407 -,53 -,28
SUB 21,815 417 ,000 1,388 1,26 1,51
Ap.3.2 Gender
Product Placement
One-Sample Statistics
Gender N Mean Std. Deviation Std. Error Mean
Male PP 151 5,47 1,136 ,092
Female PP 267 5,27 1,115 ,068

76
One-Sample Test
Gender Test Value = 5.47
t df Sig. (2-tailed) Mean Difference 95% Confidence Interval of the
Difference
Lower Upper
Male PP ,002 150 ,998 ,000 -,18 ,18
Female PP -2,936 266 ,004 -,200 -,33 -,07
Visual
One-Sample Statistics
Gender N Mean Std. Deviation Std. Error Mean
Male VIS 151 5,07 1,312 ,107
Female VIS 267 4,83 1,363 ,083
One-Sample Test
Gender Test Value = 5.07
t df Sig. (2-tailed) Mean Difference 95% Confidence Interval of the
Difference
Lower Upper
Male VIS ,027 150 ,979 ,003 -,21 ,21
Female VIS -2,905 266 ,004 -,242 -,41 -,08
Audio
One-Sample Statistics
Gender N Mean Std. Deviation Std. Error Mean
Male AUD 151 4,11 1,571 ,128
Female AUD 267 4,00 1,441 ,088
One-Sample Test
Gender Test Value = 4.11
t df Sig. (2-tailed) Mean Difference 95% Confidence Interval of the
Difference
Lower Upper
Male AUD -,032 150 ,975 -,004 -,26 ,25
Female AUD -1,248 266 ,213 -,110 -,28 ,06

77
Visual & Audio
One-Sample Statistics
Gender N Mean Std. Deviation Std. Error Mean
Male VAP 151 4,30 1,531 ,125
Female VAP 267 4,08 1,370 ,084
One-Sample Test
Gender Test Value = 4.3
t df Sig. (2-tailed) Mean Difference 95% Confidence Interval of the
Difference
Lower Upper
Male VAP -,016 150 ,987 -,002 -,25 ,24
Female VAP -2,640 266 ,009 -,221 -,39 -,06
Plot Connection
One-Sample Statistics
Gender N Mean Std. Deviation Std. Error Mean
Male PCP 151 4,18 1,654 ,135
Female PCP 267 4,25 1,394 ,085
One-Sample Test
Gender Test Value = 4.18
t df Sig. (2-tailed) Mean Difference 95% Confidence Interval of the
Difference
Lower Upper
Male PCP -,009 150 ,993 -,001 -,27 ,26
Female PCP ,876 266 ,382 ,075 -,09 ,24
Prominent
One-Sample Statistics
Gender N Mean Std. Deviation Std. Error Mean
Male PRO 151 3,71 1,436 ,117
Female PRO 267 3,53 1,230 ,075

78
One-Sample Test
Gender Test Value = 3.71
t df Sig. (2-tailed) Mean Difference 95% Confidence Interval of the
Difference
Lower Upper
Male PRO -,012 150 ,991 -,001 -,23 ,23
Female PRO -2,416 266 ,016 -,182 -,33 -,03
Subtle
One-Sample Statistics
Gender N Mean Std. Deviation Std. Error Mean
Male SUB 151 5,32 1,397 ,114
Female SUB 267 5,43 1,244 ,076
One-Sample Test
Gender Test Value = 5.32
t df Sig. (2-tailed) Mean Difference 95% Confidence Interval of the
Difference
Lower Upper
Male SUB -,019 150 ,985 -,002 -,23 ,22
Female SUB 1,406 266 ,161 ,107 -,04 ,26

Linnæus UniversitySE-391 82 Kalmar/SE-351 95 VäxjöTelefon 0772-28 80 00
Linnaeus University – a firm focus on quality and competence
On 1 January 2010 Växjö University and the University of Kalmar merged to form Linnaeus University. This newuniversity is the product of a will to improve the quality, enhance the appeal and boost the development potential ofteaching and research, at the same time as it plays a prominent role in working closely together with local society.Linnaeus University offers an attractive knowledge environment characterised by high quality and a competitiveportfolio of skills.
Linnaeus University is a modern, international university with the emphasis on the desire for knowledge, creativethinking and practical innovations. For us, the focus is on proximity to our students, but also on the world around usand the future ahead.