Embed Size (px)
Citation preview
Product Innovation as a Mediator in the Impact of R&D Expenditure and Brand Equity on
Marketing Performance
Piyush Sharma, School of Marketing, Curtin Business School
Curtin University, Bentley WA 6102, Australia
Email: [email protected]
Nebojsa S. Davcik, Instituto Universitario de Lisboa (ISCTE-IUL), Business Research Unit
(BRU-IUL), Av. das Forcas Armadas, 1649-026, Lisbon, Portugal
Email: [email protected]
Kishore Gopalakrishna Pillai, University of Bradford School of Management
Emm Lane, Bradford, West Yorkshire BD9 4JL, United Kingdom
Email: [email protected]
Submission: October 2015
Revision: January 2016
Accepted: March 2016
The authors are grateful to Nicholas Grigoriou of Monash University, Sunway Campus, Malaysia
for sharing his ideas at the early stage of this research.
1
Product Innovation as a Mediator in the Impact of R&D Expenditure and Brand Equity on
Marketing Performance
Abstract
This paper combines the signaling theory and dynamic marketing capabilities perspective to
investigate the mediating role of product innovation in the influence of R&D expenditure and
brand equity on marketing performance. The study shows that MNC firms are able to use R&D
expenditure to improve their product innovation and market share to a greater extent compared
to SME and retailer firms. However, the stronger brand equity of MNC firms may actually hurt
the performance of their new products by inhibiting product innovation. The authors use
regression and probit analysis to study a panel data for 1,356 food brands. Overall, this research
provides fresh insights into the process by which R&D expenditure and brand equity affect
product innovation and marketing performance in highly competitive product categories.
Keywords: Brand equity; marketing performance; market share; product innovation; R&D
expenditure, dynamic marketing capabilities; signaling theory
2
1. Introduction
Innovation is a major driver of business growth and expansion because it allows firms to
transform their dynamic capabilities to become more adaptive and develop the ability to learn
and exploit new ideas, given that every firm possesses a bundle of resources, skills and
competencies as argued by the resource-based theory of the firms (Peres, Muller, & Mahajan,
2010). Product innovation is particularly important in marketing context because it allows firms
to not only develop new market segments but to also expand its current market segments and
product portfolios (Gupta, Raj, & Wilemon, 1986; Slotegraaf & Pauwels, 2008). However,
product innovation may also lead to higher costs (Lynn, 1998) as well as higher risks and
management challenges (Danneels & Kleinschmidt, 2001); hence despite growing research on
product innovation, its effect on firm performance remains unclear (De Luca & Atuahene-Gima,
2007). Besides these effects, the relationship between product innovation and brand strategy may
vary across different product categories. For instance, Sriram, Balachander, and Kalwani (2007)
argue that product innovation lead to brand equity, whereas Beverland, Napoli, and Farrelly
(2010) suggest that firm’s ability to innovate depends on brand portfolio strategy. In contrast to
these opposite views, Slotegraaf and Pauwels (2008) assert the importance of interaction effects
between brand equity and product innovation to affect sales.
Consumers often use brand equity to assess firms and their product or service offerings in the
absence of reliable information about firms’ internal resources and capabilities, because it
reduces their information search costs and increases their overall utility (Erdem & Swait, 1998;
Erdem, Swait, & Valenzuela, 2006). Signalling theory argues that brands act as signals of the
overall quality of a product or service and thereby help consumers resolve their uncertainty
caused by a lack of information about a product or a company (Erdem & Swait, 1998). Strong
3
brands signal unobservable quality and product performance expectations (Rao & Ruekert,
1994). Brands also give customers a positive emotional experience during the processes of
information search, decision-making, purchase, consumption and ownership (Schmitt &
Simonson, 1997).
Notwithstanding their useful theoretical contribution, prior studies on brand equity generally
focus on the link between consumers’ perceptions of brand equity and their behavioral intentions
and outcomes such as repeat purchase and brand loyalty at individual consumer level and not at
the level of brands or product categories. Hence, there is still little clarity about the exact
mechanism by which brand equity may affect marketing performance (e.g., market share) in a
highly competitive marketplace. It is also unclear how marketing and intellectual proprietary
assets interconnect with other resources to create a competitive advantage through a core
business process, such as product innovation (Rust et al., 2004).
In this paper, the authors address these two research gaps by combining signaling theory and
the dynamic marketing capabilities (DMC) perspective from resource-based theory (RBT) to
model the mediating role of product innovation in the influence of brand equity and research and
development (R&D) expenditure on marketing performance. Specifically, this paper explores
both direct and indirect effects of brand equity and R&D expenditure on product innovation and
marketing performance in the Italian packaged food market. The authors also examine the
differences in the influence of brand equity and R&D expenditure on marketing performance for
different types of firms (retailer, small and medium enterprises [SME] and multinational
companies [MNC]). Finally, the authors discuss the implications of their results and suggest
several directions for future research.
4
2. Theoretical framework and hypotheses
2.1. Dynamic Marketing Capabilities and Signaling Theory
DMC assert the role of marketing resources and organizational routines in firm processes,
such as generating revenue by satisfying current customers, exploiting existing products and
distribution channels, and advertising existing brands (Barrales-Molina et al., 2014; cf. Bruni &
Verona, 2009). Prior research (e.g., Barney, 1991; Kozlenkova et al., 2014; Wilden & Gudergan,
2015) recognizes the role of marketing resources, such as brands and customer and distribution
relationships, in gaining and sustaining competitive advantages (Combs & Ketchen, 1999) but
has generally ignored the fundamental processes by which resources are transformed into
customer value (Srivastava, Fahey, & Christensen, 2001). Similarly, researchers focus on the role
of DMC in developing competitive advantage in inter-firm competition, but ignore the intra-firm
distribution of resources and how different brand signals from heterogeneous brand offers (brand
portfolio and brand extension strategies) affect consumers, brand value and brand performance
(Davcik et al., 2015).
Both marketing (e.g., Aaker, 1996; Keller, 1993) and strategy (e.g., Amit & Schoemaker,
1993) literatures show that brands represent valuable firm resources. Firms develop strong
brands using substantial investments in marketing communications (particularly advertising) to
create strong consumer awareness and superior consumer attitudes toward the brand (Rossiter &
Percy, 1997). One such value creation mechanism is a firm’s brand equity and its market
performance (Madden, Fehle, & Fournier, 2006). Brand equity is an important marketing
concept because it provides theoretical and business mechanisms for understanding how
5
marketing resources in the form of market knowledge and marketing assets affect brand
performance, which in turn affects the overall prospect of a firm’s competitive advantage.
Brands have the ability to indicate dependability and performance based on a firm’s
positioning goals (Erdem & Swait, 1998). A brand may be able to leverage its entrenched
reputation for product quality to indicate comparative attributes for new products released onto
the market under the same name (Wernerfelt, 1988). Brands as market signals improve consumer
perceptions of brand attributes and increase confidence in the brands’ claims (Erdem & Swait,
1998). Because unobservable product quality is quite common, scholars investigate the effects
and implications of signals such as price (Ippolito, 1990), advertising (Kirmani, 1990), and
product quality (Rao, Qu, & Ruekert, 1999). Despite such importance of brand equity as a signal,
there are few studies using a holistic approach that combines different classes of signals, hence it
is still unclear how firms utilize their resources to meet their customer expectations and achieve
competitive advantage. In this context, brand equity paradigm and investments in R&D activities
have important monetary underpinnings in signaling theory (Rao et al., 1999).
< Take in table 1 here >
2.2. Product Innovation – Antecedents and Outcomes
Product innovation provides opportunities for firms to expand and grow into new areas;
however, it may also require greater firm resources (Lynn, 1998) and lead to higher risk and
management challenges (Danneels & Kleinschmidt, 2001). Despite growing research interest,
conceptualization of product innovation and its effects on firm performance remain unclear, as
prior studies consider it as an independent, dependent or even a moderator variable (Danneels &
Kleinschmidt, 2001).
6
Using the food industry as an example, with the growing trend toward healthier lifestyles,
food safety and higher value for consumers, investments in R&D help create new technologies,
production procedures and standards. For example, use of beneficial bacteria may improve the
functional properties of food products as well as reduce the dependence on potentially harmful
chemicals. As a result, it is almost impossible to find brands in today’s supermarkets that do not
use organic and/or functional innovations. Danone, a leading European multinational food
company has conventional (Evian), organic (Happy Family) and functional (Activia) brands in
its portfolio. Similarly, Tesco, a major global retailer, has Tesco Organic and ‘Free From’ in
addition to the conventional brands in its portfolio. The ability to make creative strategic
decisions about market segmentation and product differentiation can have a positive effect on
customers’ perceptions about a new brand's ability to fit their needs. Hence, this paper focuses on
two types of product innovation – functional and organic.
2.3. Role of R&D Expenditure
Research and development (R&D) is an important dynamic capability (Eisenhardt & Martin,
2000; Wilden & Gudergan, 2015) as well as a driver of product innovation (Gupta et al., 1986).
Prior research suggests that R&D intensity is low in the food industry (the setting for our
research) with the lowest R&D-to-sales ratios in comparison to other industrial sectors (Khan et
al., 2013; Bigliardi & Galati, 2013). Traditionally, innovations in the food industry included the
development of new production technologies and standards (organic vs. conventional) or
changes in product formulations in response to regulations. However, the introduction of
functional foods has ushered in the application of new technology and radical innovation in
production (e.g., product formulation, production standards etc.) and marketing (e.g., branding,
consumer segmentation, stakeholder expectations, etc.).
7
2.4. Role of Brand Equity
Marketing practitioners face increasing pressure to demonstrate their contribution to firm’s
financial performance and demands for resource allocation to achieve the best possible firm
performance (O’Sullivan & Abela, 2007). However, the exact mechanism through which brand
equity translates into consumer demand, preference and market share, is still unclear. Some
studies show that product innovation may lead to brand equity (Sriram et al., 2007), whereas
others argue that a firm’s ability to innovate may depend on the positioning of a brand within its
competitive space (Beverland et al., 2010) or brand equity and product innovation may interact
with one another to affect sales (Slotegraaf & Pauwels, 2008). For example, product innovation
may be a route to success for an existing brand such as Apple, with new innovative products such
as Apple iPhone or iPod, especially in a high-growth category, such as consumer electronics. In
contrast, having highly successful brands in mature food product categories may allow firms
such as Unilever and Nestle to make continuous investments in product development to develop
innovative products. In other words, brand equity may not just have a simple direct effect on
product innovation; instead it may interact with other variables (e.g., R&D expenditure) and their
combined impact on product innovation and marketing performance may also vary across
different product categories.
2.5. Role of Firm Type
Unlike the direct effect of brand equity and R&D expenditure on product innovation as
suggested by prior marketing research, the strategy literature suggests a different causality (e.g.,
Hitt et al., 1997). Specifically, companies with greater product diversification are less likely to
invest in R&D for further product innovation. Business managers are under constant pressure to
8
deliver financial performance of their brands and/or business units, and such overemphasis on
financial controls may make them ignore the changing preferences and needs of their consumers
as well as the market response of their competitors to these changes. Instead, managers may
avoid further expansion of their brand portfolios by lowering investments in R&D and by
attempting to extend their consumer base with existing brands (Hitt et al., 1997).
Despite having more resources than smaller firms, large firms do not always excel at
innovation because of their bureaucratic processes, centralized control systems and routines that
inhibit the development of technology-market knowledge links (Dougherty, 1992; cf. Hitt et al.,
1997). Interestingly, some studies find significant differences among smaller firms in different
industries, such as manufacturing and knowledge-intensive services, after controlling for firm
size (de Jong & Vermeulen, 2006). However, many of these studies focused on differences
between broad categories of industries rather than exploring differences among various types of
firms within a specific product or service category.
Emergence of retail brands (also known as private labels) have taken a sizeable portion of the
market share of more established MNC brands by offering similar product quality and variety;
however, such brands still lag behind the established brands in terms of brand image and equity
(Burt, 2000). Most retailers tend to follow MNC firms in offering new products, because they
can afford to invest in new products and use the economy of scale to get a considerable market
share. For instance, Khan et al. (2013) suggest that consumers do not consider private labels in
the functional food sector as a weak alternative in comparison to branded food products; and
retailers may easily manage the quality and price using their market power.
9
Based on the above, it seems that with multinational companies should be able to better
leverage their strong brand equity into product innovation by developing and launching a greater
variety of products and flavors, which may in turn lead to greater market share. In contrast, intra-
firm competition for limited resources will make SME companies focus their limited resources
on the most lucrative brands (Davcik et al., 2015). Interestingly, retailers generally have a wide
product portfolio but they must also improve their performance using economies of scale and
price optimization (Khan et al., 2013). Therefore, the positive effects of brand equity and R&D
expenditure are likely to be stronger for MNC firms compared to SME firms and retailers
respectively, as follows:
H1: The positive effect of R&D expenditure on market share is stronger for a) MNC
firms compared to SME firms, and b) SME firms compared to retailers.
H2: The positive effect of brand equity on market share is stronger for, a) MNC firms
compared to SME firms, and b) SME firms compared to retailers.
2.6. Product Innovation as a Mediator
Prior research argues that signalling is most effective for products whose quality is unknown
prior to purchase because a brand name can be an effective signal of unobserved quality (Rao et
al., 1999), which helps consumers resolve their classification problem in the face of potential
deception by the seller (Boulding & Kirmani, 1993). Assuming that consumers and firms are
rational and capable of interpreting one another’s moves, signaling specifies the market
conditions under which firms can resolve information asymmetry and deliver product quality
information to consumers by manipulating elements of the marketing mix such as price or
advertising (Kirmani, 1990). Erdem and Swait (1998) define brand signals as a firm’s past and
10
present marketing mix strategies and activities associated with its brand, wherein brands
communicate unobservable quality in products as a result of firms’ investments (e.g., product
design) in building brand equity. However, brand image and equity may not be the only signals
of product quality and firm capabilities; product innovation itself could be a signal to consumers
that a firm has the ability to invest in R&D and to develop innovative products that provide
greater satisfaction to consumers. Therefore, product innovation is likely to partially mediate the
effects of R&D expenditure and brand equity on market share, as follows:
H3: Product innovation partially mediates the positive effect of R&D expenditure on
market share, such that it is stronger for, a) functional; and b) organic, compared
to conventional product categories.
H4: Product innovation partially mediates the positive effect of brand equity on
market share, such that it is stronger for, a) functional; and b) organic, compared
to conventional product categories.
Figure 1 summarizes all these hypotheses graphically.
< Take in figure 1 here >
3. Methodology
3.1. Research Setting
This study uses enriched-food brands in three product categories (juice, milk and yogurt) as
the research setting because these are a major contributor to the FMCG industry. Moreover, these
products use high levels of applied technology, marketing know-how and ethical consciousness.
11
Enriched-food brands include a broad category of healthy products, such as organic foods,
functional foods and conventional foods with added value (Davcik & Sharma, 2015). Product
innovation exists at three levels: conventional food brands, organic food brands (food produced
according to organic production standards; e.g., NOP [USA]; EC 834/2007 [EU], etc.) and
functional food brands (e.g., products with beneficial bacteria) food brands (Davcik & Sharma,
2015). Therefore, the difference among the three different product innovation levels is in the
technology applied, the production standards, the label requirements and the quality, as
established in prior research (e.g., Davcik & Sharma, 2015; Hamzaoui-Essoussi & Zahaf, 2012).
Overall, this study uses 1,356 food brands (juices, milk, and yoghurt) in total, including 674
conventional brands, 319 organic brands and 363 functional food brands in the sample. From a
company type perspective, this study concerns 259 retailers’, 876 SMEs and 221 MNC brands in
our sample. The authors use STATA 13 to estimate all the models. Tables 1 and 2 present the
summary and descriptive statistics for all these variables.
< Take in tables 1 & 2 here >
3.2. Data sources & measures
This study uses two data sources. First, the Amadeus financial statement database from the
Bureau van Dijk Electronic Publishing provides the financial performance data for all the firms
directly from their balance sheets. Second, ACNielsen Italy’s report provides the food purchase
data for 10,282 Italian households, which includes the prices paid, market share and qualitative
characteristics of brands. Table 4 summarizes all the variables and their sources.
< Take in table 4 here >
12
3.3. Model development
The authors use a bootstrapping algorithm within the regression and probit procedure to test
their empirical model. Bootstrapping is a nonparametric statistical technique that provides robust
estimates of standard errors and confidence intervals for a population parameter based on the
assumption that a given sample is representative of the population. Calculating bootstrapped
standard errors involves drawing random samples, estimating the desired statistic corresponding
to these bootstrap samples, and calculating the sample standard deviation of the sampling
distribution (e.g., Efron, 1979; Guan, 2003). This approach utilizes the same theory underlying
Monte Carlo simulation methods, except that it utilizes resamples from the original data rather
than from the population (cf. Guan, 2003). At the end of this procedure, the bootstrapping
estimates should converge to the true parameters.
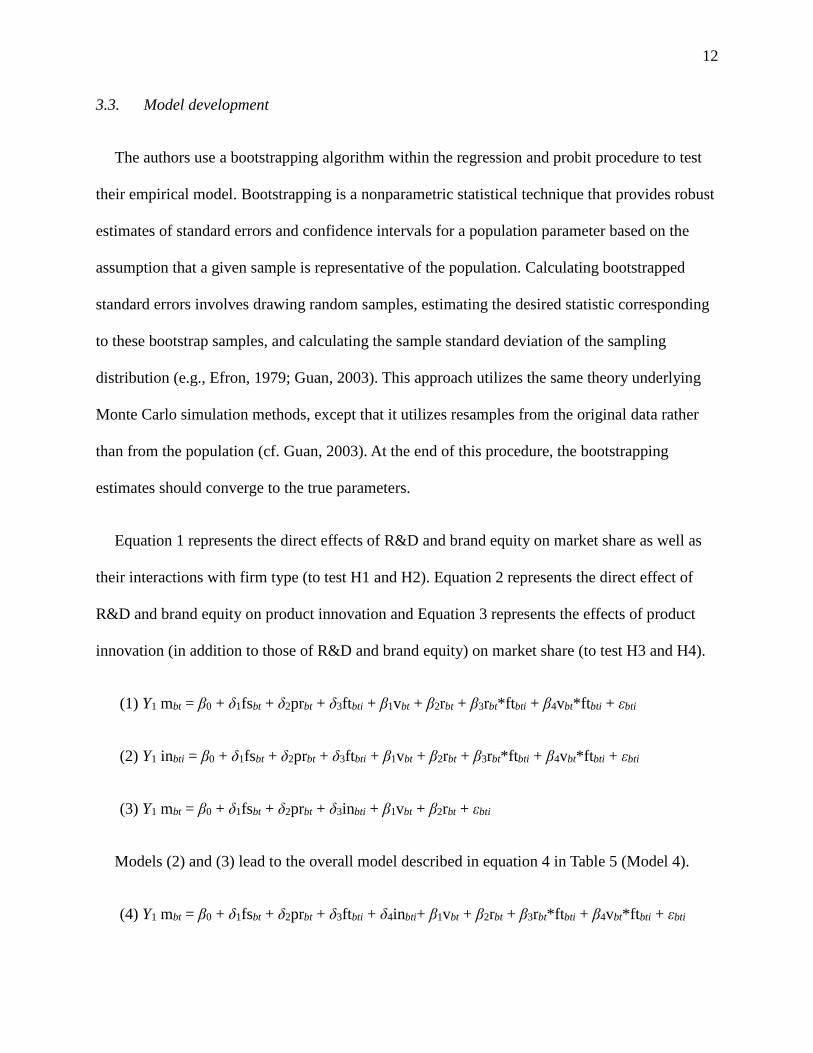
Equation 1 represents the direct effects of R&D and brand equity on market share as well as
their interactions with firm type (to test H1 and H2). Equation 2 represents the direct effect of
R&D and brand equity on product innovation and Equation 3 represents the effects of product
innovation (in addition to those of R&D and brand equity) on market share (to test H3 and H4).
(1) Y1 mbt = β0 + δ1fsbt + δ2prbt + δ3ftbti + β1vbt + β2rbt + β3rbt*ftbti + β4vbt*ftbti + εbti
(2) Y1 inbti = β0 + δ1fsbt + δ2prbt + δ3ftbti + β1vbt + β2rbt + β3rbt*ftbti + β4vbt*ftbti + εbti
(3) Y1 mbt = β0 + δ1fsbt + δ2prbt + δ3inbti + β1vbt + β2rbt + εbti
Models (2) and (3) lead to the overall model described in equation 4 in Table 5 (Model 4).
(4) Y1 mbt = β0 + δ1fsbt + δ2prbt + δ3ftbti + δ4inbti+ β1vbt + β2rbt + β3rbt*ftbti + β4vbt*ftbti + εbti
13
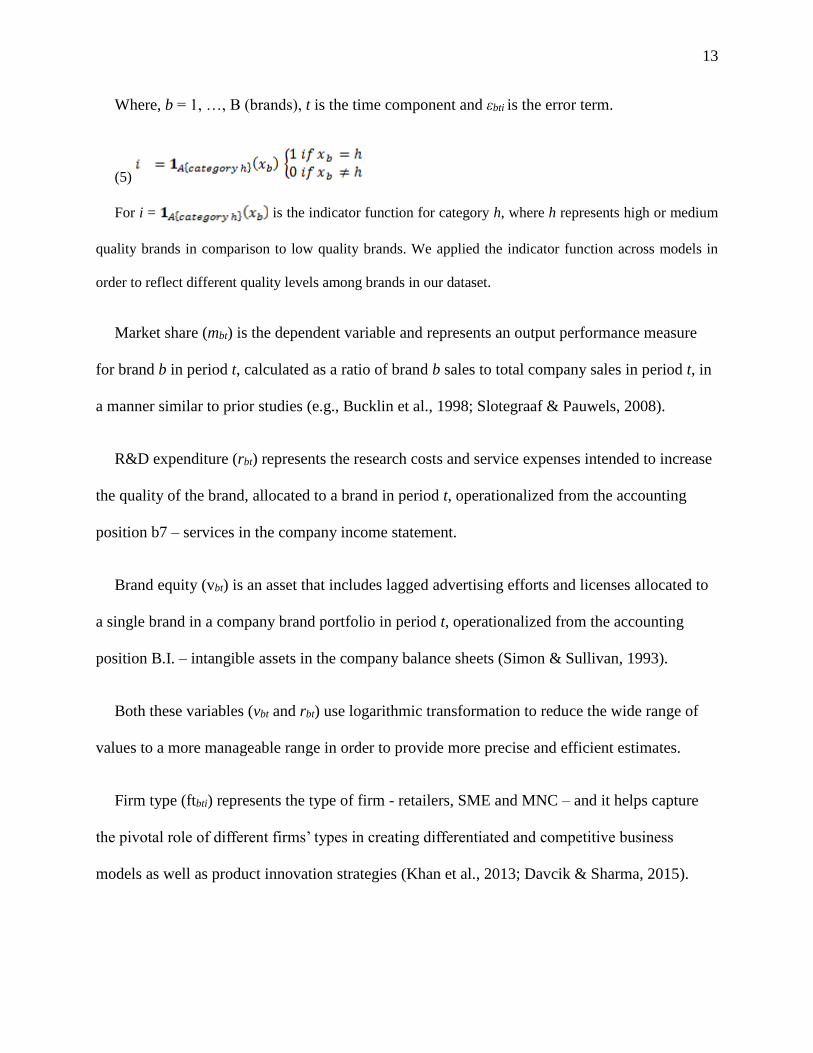
Where, b = 1, …, B (brands), t is the time component and εbti is the error term.
(5)
For i = is the indicator function for category h, where h represents high or medium
quality brands in comparison to low quality brands. We applied the indicator function across models in
order to reflect different quality levels among brands in our dataset.
Market share (mbt) is the dependent variable and represents an output performance measure
for brand b in period t, calculated as a ratio of brand b sales to total company sales in period t, in
a manner similar to prior studies (e.g., Bucklin et al., 1998; Slotegraaf & Pauwels, 2008).
R&D expenditure (rbt) represents the research costs and service expenses intended to increase
the quality of the brand, allocated to a brand in period t, operationalized from the accounting
position b7 – services in the company income statement.
Brand equity (vbt) is an asset that includes lagged advertising efforts and licenses allocated to
a single brand in a company brand portfolio in period t, operationalized from the accounting
position B.I. – intangible assets in the company balance sheets (Simon & Sullivan, 1993).
Both these variables (vbt and rbt) use logarithmic transformation to reduce the wide range of
values to a more manageable range in order to provide more precise and efficient estimates.
Firm type (ftbti) represents the type of firm - retailers, SME and MNC – and it helps capture
the pivotal role of different firms’ types in creating differentiated and competitive business
models as well as product innovation strategies (Khan et al., 2013; Davcik & Sharma, 2015).
14
Innovation type (inbti) represents the type of technology and production standards, namely
conventional, organic and functional (e.g., Davcik & Sharma, 2015; Hamzaoui-Essoussi &
Zahaf, 2012).
Firm size (fsbt) is a control variable, which represents parent-firm sales and controls for
company size for brand b in period t, following the approach of Slotegraaf and Pauwels (2008).
Price (prbt) is the control variable for brand b in period t because using the appropriate price
strategy is crucial for the maintenance of market share (O’Regan, 2002; Urban et al., 1986).
4. Data analysis and results
The empirical model for this study (Figure 1) consists of two DMC (R&D expenditure and
brand equity) as predictors, firm type with three types of market players (retailer, SME and
MNC) as moderator, product innovation with three categories (conventional, functional and
organic) as mediator, firm size and price as control variables, and market share as the outcome
variable. A series of analyses using models representing equations 1 to 4 along with bootstrap
resampling (a type of Monte Carlo simulation method applied to observed data) helps test all the
hypotheses. Corrected standard errors with bootstrap resampling method using 1,000 repetitions
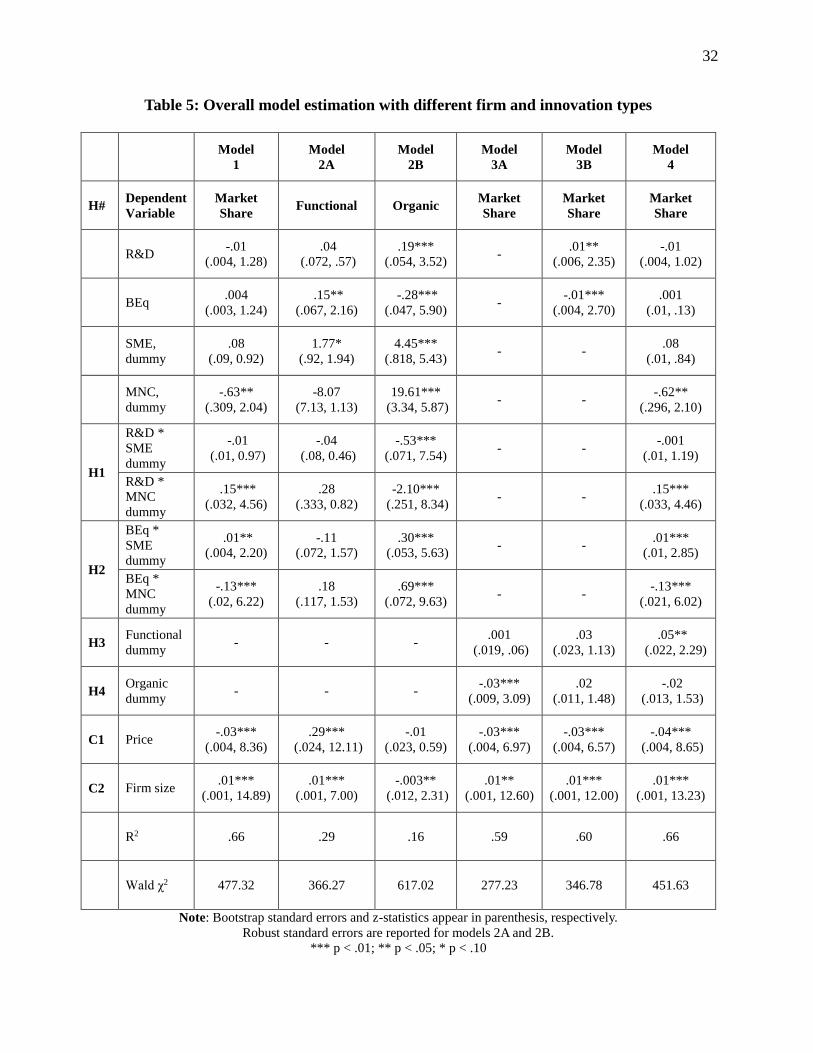
provide accurate sample estimations (Efron & Tibshirani, 1993). Table 5 presents all the results.
< Take in table 5 here >
4.1. Moderating Role of Firm Type (H1-H2)
The first column in Table 5 shows the results for Model 1 using market share as the dependent
variable, wherein that both dynamic marketing capabilities (R&D and brand equity) do not have
15
significant direct effects on market share, while the two covariates (price and firm size) have
significant albeit small effects on market share. However, R&D has a significant positive effect
on market share for MNC brands (β = .15, p < .001) but not for SME brands (β = -.01, p > .10),
relative to retailer brands. Similarly, brand equity has a significant positive effect on market
share for SME brands (β = .01, p < .01) but not for MNC brands (β = -.13, p < .001), relative to
retailer brands. Thus, both H1 and H2 only find partial support.
4.2. Mediating Role of Product Innovation (H3-H4)
Next, the second and third columns in Table 5 show the results for Models 2A and 2B using
the two dummy variables for product innovation types (functional and organic relative to
conventional brands) as the dependent variable respectively. First, R&D expenditure has a
stronger positive effect on organic brands (β = .19, p < .01) compared to functional (β = .04, p >
.10); whereas, brand equity has a significant positive effect on functional brands (β = .15, p <
.05) and a surprising negative effect on organic (β = -.28, p < .01), relative to conventional
brands. Interestingly, the interaction terms for both R&D and brand equity with firm type are
significant for organic brands but not functional brands, hence the results for H1 and H2 appear
to be stronger for organic brands compared to the other two types.
Next, the fourth column in Table 5 shows the results for Model 3A using market share as the
dependent variable and includes only the mediator (two dummies for product innovation) and the
two control variables (firm size and price) as predictors. Interestingly, functional innovation has
no significant effect on market share (β = .001, p > .10) but organic innovation does have
significant effects on market share (β = -.03, p < .01). Next, the fifth column in Table 5 shows the
results for Model 3B using market share as the dependent variable and includes the two
16
independent variables (R&D and brand equity), the moderator (firm type), the mediator (two
product innovation types) and the two control variables (firm size and price) as predictors. In this
model, functional (β = .03, p >.10) and organic innovation (β = .02, p > .10) have positive but
less significant effects on market share, which shows that product innovation partially mediates
the influence of R&D and brand equity on market share, thus H3 and H4 find partial support.
Finally, the last column in Table 5 shows the results for Model 4, with market share as the
dependent variable, both the independent variables (R&D and brand equity), their interaction
terms with firm size, the moderator (firm type), the mediator (product innovation) and the two
control variables (firm size and price) as predictors. Once again, R&D (β = -.01, p > .10), brand
equity (β = .001, p > .10), firm size (β = .01, p < .01) and price (β = -.04, p < .01) as well as three
out of four interaction terms have significant effects on market share. However, the effects of
both product innovation variables become marginally significant in this model, which suggests
that product innovation does partially mediate the moderating effects of firm size on the
influence of R&D expenditure and brand equity on market share.
4.3. Post-estimation procedures
The appropriate control function and distribution of the error term across models is a typical
modeling issue (cf. Petrin & Train, 2010). The study applies various modeling specifications
such as residuals entering, signed and unsigned series expansion of residuals and exclusion of
one or both error terms; as explained in Petrin and Train (2010). Additionally, the control for
Hausman-type instrument alternatives, addresses the possible problem of reverse causality in
models using the Hausman specification test (e.g., Hausman, 1978; Wooldridge, 2002; Petrin &
Train, 2010).
17
5. Discussion and implications
In this research, the authors investigate how DMC affect product innovation strategy and an
organization’s ability to perform in the market, as reflected by its market share. Prior research
suggests that DMC such as brand equity and R&D expenditure have a positive effect on product
innovation and marketing performance; however, this research shows some subtle but significant
differences in these effects for different types of market players and product innovation
strategies. Specifically, the results about H1 show that R&D expenditure has a stronger positive
effect on market share for MNC brands compared to SME and retailer brands, however, in
contrast, the results for H2 show that brand equity has a stronger effect on market share for SME
brands than the MNC and retailer brands. In fact, brand equity also has a weaker effect on market
share for MNC brands compared to retailer brands. This may seem counter-intuitive because
MNCs are supposed to possess strong mega brands that should have a stronger positive impact
on their market share. However, from these results it seems that in the context of innovative food
products, having strong brand equity may actually hurt MNC brands because consumers may
perceive them as being too traditional or associated more with their conventional products.
Finally, as hypothesized, product innovation partially mediates the positive effects of R&D
expenditure (H3) and brand equity (H4) on market share. Moreover, consistent with all the other
results, the impact of brand equity on market share is stronger for conventional products
compared to products with either functional or organic food innovation. From all these findings
it is quite clear that different types of firms should focus their marketing strategies on specific
quality appeals and product differentiation approaches based on their DMC. These findings are
also in-line with management literature on dynamic capabilities, such as Barney (1991) who
argues that dynamic capabilities and performance of the firm will differ from one firm to another
18
because each firm has different organizational culture, assets, abilities, etc., a view largely
ignored so far in marketing research.
These findings have several implications for marketing theory and managerial decision
makers. First, DMC generally relate with inter-firm competition for resources and the
achievement of competitive advantages relative to one another; hence, these do not explain intra-
firm competition for resources and do not indicate how this business mechanism affects the
competitive advantage of firms. This paper addresses this research gap by studying the
performance of different products in heterogeneous portfolios and by demonstrating the
importance of intra-firm competition for resources in brand strategy. Using the application of
different technological and production standards as proxies for product innovation, this paper
shows that different market players must apply different product differentiation strategies
through the innovation mechanism to obtain higher levels of market share.
Second, the environment in which signaling occurs is important to ascertaining the
appropriate signal to use. Signaling theory suggests that firms give promises to consumers based
on brand/firm values but does not explain how their resources meet those promises and perform
in the market. This study shows that marketers can use their brand equity and R&D expenditure
to signal the appropriate level of product innovation that is consistent with the expectations of
consumers when firms rely on information asymmetry. Because signals have varying degrees of
reliability, signaling theory provides the basis in this study, for marketing managers to decide on
which factors to focus on, in order to make better product innovation decisions.
Third, this research also contributes to the debate on product innovation and performance by
addressing the question of whether product innovation is an antecedent or an outcome.
19
Understanding the drivers of product success is becoming increasingly important, especially in
highly competitive and volatile environments that increase the rates of technical obsolescence
and shorten product life cycles (Langerak et al., 2004). However, the literature provides mixed
views and arguments on this question. One stream of the research (e.g., Beverland et al., 2010)
highlights the crucial role of brand equity in driving product innovations especially in mature
markets such as FMCG brands. However, another stream of literature (e.g., Sriram et al., 2007)
posits the product innovation drives higher values of brand equity, an approach that may be more
appropriate for strong existing brands in categories such as consumer electronics. The third
research stream (e.g., Slotegraaf & Pauwels, 2008) suggests that these phenomena may interact
with one another in their effect on sales. This iterative approach to the question of whether
product innovation is an antecedent or an outcome of brand equity potentially provides a more
holistic view of this phenomenon. However, because of the objective limitations of their dataset,
the authors could not test the latest research assumptions within this modeling design and could
only show empirically that this research problem is a contextual issue rather than a theoretical
problem. As such, this paper provides a general framework which can help investigate the
specific aspects (features) of a product that consumers may consider to be innovative.
Finally, the prevailing logic in the marketing literature strongly suggests that R&D has
positive and significant effects on product innovation. In contrast to this research paradigm, the
literature on business strategy (e.g., Hitt et al., 1997) asserts that multi-brand organization may
disincentivize R&D for product innovation. This observation is not surprising from a business
strategy perspective because the imperative for financial accountability leads to the risk aversion
behavior of managers. We provide mixed evidence that in a multibrand environment, R&D has
20
positive and negative effects on product innovation for different market players, depending on
the product innovation strategy applied.
6. Limitations and future research
This research has a few limitations that future research may address. First, the limited scope
of the available market data led to a rather simplistic empirical model and made it difficult to
expand the research focus to other relevant market phenomena. For instance, the authors could
not include the potential influence of brand loyalty or brand image on brand performance.
Second, future research could try to understand the signaling-RBT nexus as it applies to
marketing. For instance, this study focuses on signaling from the signaler’s perspective but
future empirical investigation may address this nexus from the receiver’s perspective. Such
receivers may consist of end-user consumers, distribution channel members, or both.
This study examines product innovation and performance in consumer markets using
signaling and resource-based theory; with a single brand as the central unit of analysis. Future
studies could extend this research by using a different signaling environment to examine, for
example, a similar phenomenon between different organizations and include the competitors of a
marketing organization as the intended or accidental recipients of branding signals. An extension
in the B2B direction would also be a beneficial theoretical contribution to the performance
paradigm of the DMC and RBT framework.
Another area of future research involves testing and expanding the reliability of signals (other
than those presented in this study) for their ability in assisting with product innovation. Such
research would expand our knowledge of the conditions under which signaling theory assists in
product innovation. Further research should concentrate on investigating whether other aspects
21
of the marketing mix (e.g., advertising effectiveness or channel selection) could influence
organizational performance from a signaling perspective based on a RBT approach.
This study considers firm type as a moderating variable in the relationship among firms’
dynamic capabilities, product innovation and market share. Future work could identify possible
alternative variables that moderate this relationship, such as the degree of market orientation of
the innovating firm or the extent to which the innovation decision is either centralized (i.e., made
at the head office) or decentralized (i.e., not made at a head office location). Finally, researchers
could replicate this study in emerging markets to explore how the process of product innovation
differs from that in developed markets, based on various socio-economic and cultural factors.
22
7. References
Aaker, D.A. (1996). Building Strong Brands. New York: The Free Press.
Amit, R., & Schoemaker, P.J.H. (1993). Strategic Assets and Organizational Rents. Strategic
Management Journal, 14(1), 33-46.
Barney, J.B. (1991). Firm resources and sustained competitive advantage. Journal of
Management, 17, 99-120.
Barrales-Molina, V., Martinez-Lopez, F., & Gazquez-Abad, J. (2014). Dynamic Marketing
Capabilities: Toward an Integrative Framework. International Journal of Management
Reviews, 16(4), 397-416.
Beverland, M.B., Napoli, J., & Farrelly, F. (2010). Can All Brands Innovate in the Same Way? A
Typology of Brand Position and Innovation Effort. Journal of Product Innovation
Management, 27(1), 33-48.
Bigliardi, B., & Galati, F. (2013). Innovation trends in the food industry: The case of functional
foods. Trends in Food Science & Technology, 31, 118-129.
Bruni, D.S., & Verona, G. (2009). Dynamic marketing capabilities in science-based firms: an
exploratory investigation of the pharmaceutical industry. British Journal of Management, 20,
101–117.
Boulding, W., & Kirmani, A. (1993). A consumer-side experimental examination of signaling
theory: do consumers perceive warranties as signals of quality? Journal of Consumer
Research, 20(June), 111-123.
Bucklin, R., Russell, G., & Srinivasan, V. (1998). A Relationship between Market Share
Elasticities and Brand Switching Probabilities. Journal of Marketing Research, 35
(February), 99-113.
23
Burt, S. (2000). The strategic role of retail brands in British grocery retailing. European Journal
of Marketing, 34(8), 875-890.
Combs, J.G., & Ketchen, D.J. (1999). Explaining interfirm cooperation and performance: toward
a reconciliation of predictions from the resource‐based view and organizational economics.
Strategic Management Journal, 20(9), 867-888.
Danneels, E., & Kleinschmidt, E.J. (2001). Product innovativeness from the firm's perspective:
its dimensions and their relation with project selection and performance. Journal of Product
Innovation Management, 18(6), 357-373.
Davcik, N.S., da Silva, R.V., & Hair, J. (2015). Towards a unified theory of brand equity:
Conceptualizations, taxonomy and avenues for future research. Journal of Product and
Brand Management, 24(1), 3-17.
Davcik, N.S., & Sharma, P. (2015). Impact of Product Differentiation, Marketing Investments
and Brand Equity on Pricing Strategies: A Brand Level Investigation. European Journal of
Marketing, 49(5/6), 760-781.
De Jong, J.P.J., & Vermeulen, P.A.M (2006). Determinants of Product Innovation in Small Firms:
A Comparison across Industries. International Small Business Journal, 24(6), 587-609.
De Luca, L.M., & Atuahene-Gima, K. (2007). Market knowledge dimensions and cross-
functional collaboration: Examining the different routes to product innovation performance.
Journal of Marketing, 71(1), 95-112.
Dougherty, D. (1992). Interpretive Barriers to Successful Product Innovation in Large Firms.
Organization Science, 3(2), 179-202.
Efron, B. (1979). Bootstrap Methods: Another Look at the Jackknife. The Annals of Statistics,
7(1), 1-26.
24
Efron, B., & Tibshirani, R. (1998). An Introduction to the Bootstrap, Chapman & Hall/CRC,
Boca Raton, FL, USA.
Eisenhardt, K.M., & Martin, J.A. (2000). Dynamic capabilities: what are they? Strategic
Management Journal, 21(10-11), 1105-1121.
Erdem, T., & Swait, J. (1998). Brand equity as a signaling phenomenon. Journal of Consumer
Psychology, 7(2), 131-157.
Erdem, T., Swait, J., & Valenzuela, A. (2006). Brands as Signals: A Cross-Country Validation
Study. Journal of Marketing, 70(1), 34-49.
Guan, W. (2003). From the help desk: Bootstrapped standard errors. The Stata Journal, 3(1), 71-
80.
Gupta, A.K., Raj, S., & Wilemon, D. (1986). A Model for Studying R&D - Marketing Interface
in the Product Innovation Process. Journal of Marketing, 50(2), 7-17.
Hausman, J.A. (1978). Specification test in Econometrics. Econometrica, 46(6), 1251-1271.
Hamzaoui-Essoussi, L., & Mehdi, Z. (2012). Canadian Organic Food Consumers’ Profile and
Their Willingness to Pay Premium Prices. Journal of International Food and Agribusiness
Marketing, 24(1), 1-21.
Hitt, M.A., Hoskisson, R.A., & Kim, H. (1997). International diversification: Effects of
innovation and firm performance in product-diversified firms. Academy of Management
Journal, 40(4), 767-798.
Ippolito, P.M. (1990). Bonding and Non-bonding Signals of Product Quality. Journal of
Business, 63(1), 41-60.
Kirmani, A. (1990). The effect of perceived advertising costs on brand perceptions. Journal of
Consumer Research, 17, 160-171.
25
Khan, R., Grigor, J., Winger, R., & Win, A. (2013). Functional food product development –
Opportunities and challenges for food manufacturers. Trends in Food Science & Technology,
30, 27-37.
Kozlenkova, I.V., Samaha, S.A., & Palmatier, R.W. (2014). Resource-based theory in marketing.
Journal of the Academy of Marketing Science, 42(1), 1-21.
Langerak, F., Hultink, E.J., & Robben, H.S.J. (2004). The Impact of Market Orientation, Product
Advantage, and Launch Proficiency on New Product Performance and Organizational
Performance. Journal of Product Innovation Management, 21(2), 79–94.
Lynn, G.S. (1998). New Product Team Learning: Developing and Profiting from Your
Knowledge. California Management Review, 3(38), 74-93.
Madden, T.J., Fehle, F., & Fournier, S. (2006). Brands matter: an empirical demonstration of the
creation of shareholder value through branding. Journal of the Academy of Marketing
Science, 34(2), 224-235.
O’Regan, N. (2002). Market share: the conduit to future success? European Business Review,
14(4), 287-293.
O'Sullivan, D., & Abela, A.V. (2007). Marketing performance measurement ability and firm
performance. Journal of Marketing, 71(2), 79-93.
Peres, R., Muller, E., & Mahajan, V. (2010). Innovation diffusion and new product growth
models: A critical review and research directions. International Journal of Research in
Marketing, 27(2), 91-106.
Petrin, A., & Train, K. (2010). A Control Function in Consumer Choice Models, Journal of
Marketing Research, 47(February), 3-13.
26
Rao, A.R., Qu, L., & Ruekert, R.W. (1999). Signaling unobservable product quality through a
brand ally. Journal of Marketing Research, 36(May), 258-268.
Rao, A.R., & Ruekert, R.W. (1994). Brand alliances as signals of product quality. Sloan
management review, 36, 87-87.
Rust, R.T., Ambler, T., Carpenter, G.S., Kumar, V., & Srivastava, R.K. (2004). Measuring
Marketing Productivity: Current Knowledge and Future Directions. Journal of Marketing,
68(October), 76-89.
Schmitt, B., & Simonson, A. (1997). Marketing aesthetics: The strategic management of brands,
identity, and image. New York: Free Press.
Simon, C.J., & Sullivan, M.W. (1993). The Measurement and Determinants of Brand Equity: A
Financial Approach. Marketing Science, 12(1), 28-52.
Slotegraaf, R.J., & Pauwels, K. (2008). The Impact of Brand Equity and Innovation on the Long-
Term Effectiveness of Promotions. Journal of Marketing Research, 45(3), 293-306.
Sriram, S., Balachander, S., & Kalwani, M.U. (2007). Monitoring the Dynamics of Brand Equity
Using Store-Level Data. Journal of Marketing 71(2), 61-78.
Srivastava, R.K., Fahey, L., & Christensen, H.K. (2001). The resource-based view and
marketing: The role of market-based assets in gaining competitive advantage. Journal of
Management, 27(6), 777-802.
Urban, G.L., Carter, T., Gaskin, S., & Mucha, Z. (1986). Market Share Rewards to Pioneering
Brands: An Empirical Analysis and Strategic Implications. Management Science, 32(6), 645-
659.
Wernerfelt, B. (1988). Umbrella branding as a signal of new product quality: an example of
signalling by posting a bond. The Rand Journal of Economics, 19(3), 458-466.
27
Wooldridge, J.M. (2002). Econometric Analysis of Cross Sectional and Panel Data. Cambridge,
Massachusetts: MIT Press.
Wilden, R., & Gudergan, S. (2015). The impact of dynamic capabilities on operational marketing
and technological capabilities: investigating the role of environmental turbulence. Journal of
the Academy of Marketing Science, 43, 181-199.
28
Figure 1: Conceptual Framework and Hypotheses
Market Share
Organic Innovation
R&D Spend
Brand Equity
Firm Type
H1 (+)
H2 (+)
H3 (+)
H4 (+)
Functional Innovation
29
Table 1: Theoretical framework
Focus Study Main findings / assumptions This study
Dynamic
marketing
capabilities and
signalling in
branding context
Kozlenkova et al.
(2014)
Brands are important marketing
resources in gaining competitive
advantage in inter-firm competition.
Market-based resource perspective
suggests focus on intangible and
complementary resources and their
effects on performance.
Intra-firm competition for
limited resources in multi-
brand organizations will lead to
application of different
technologies and production
standards to obtain the
competitive advantage with
mixed expectations across
markets and brand portfolio. Davcik et al. (2015)
The literature ignores the importance
of the intra-firm distribution of
resources and how different brand
signals affect performance
Product
innovation and
performance
outcome
Danneels &
Kleinschmidt (2001)
The effects of product innovation on
firm performance are unclear in the
literature, because it has been
considered as an independent,
dependent and moderating variable.
Performance of DMC varies for
different market players
(retailers, SME, MNC) and it’s
dependent on availability of
firms’ resources.
Effects of
dynamic
marketing
capabilities on
product
innovation and
performance
outcome
Sriram et al. (2007) Product innovation leads to higher
brand equity
Different forms of DMC and
product innovation have no just
a simple direct effect, because
the literature suggests mixed
results. We argue that DMC
may enhance development of
innovative products in the
mature FMCG markets.
However, product innovation is
a route to success in creation of
new markets in consumer
electronics. We showed that
this problem is contextual
rather than theoretical.
Beverland et al. (2010) A firm’s ability to innovate depends
on brand equity
Slotegraaf & Pauwels
(2008)
Brand equity and product innovation
may interact to affect sales
Hitt et al. (1997)
The literature in strategic
management suggests that firms with
greater product diversification are less
likely to invest in R&D for further
product innovation.
Wilden & Gudergan
(2015)
Dynamic capabilities have positive
impact on marketing capabilities, but
their effects on firm performance
require more empirical research
30
Table 2: Descriptive statistics
Variables
Descriptive statistics
Mean Standard
deviation
Minimum Maximum
Market share .13 .42 .00 4.23
Brand equity (log) 14.38 2.72 6.68 20.73
R&D expenditures (log) 16.21 1.78 11.07 19.46
Firm size (log) 2.24 1.41 .78 6.30
Price (€/kg) 3.43 2.11 .22 10.36
Table 3: Descriptive statistics by product innovation and company type
Retailer SME MNC Total
Conventional 123 412 139 674
Organic 70 245 4 319
Functional 66 219 78 363
Total 259 876 221 1,356
31
Table 4: Variables of product innovation models
Variable Name Description Source
Price pr Amount of money that the consumers have to pay to
obtain the brand in period t for category c in €/kg.
Nielsen
Market share m
Allocated brand share in company brand portfolio; i.e.
a ratio of brand sales to the total company sales in
period t for category c (following Bucklin et al., 1998
and Slotegraaf & Pauwels, 2008)
Nielsen
R&D
expenditure r
Research costs and service expenses that help increase
the quality of the brand, allocated on a brand b in
period t for category c. In euros (€).
Amadeus
Brand equity v
Includes lagged advertising efforts, licenses, etc.,
allocated to the single brand b in period t for category c
(following Simon & Sullivan, 1993). In euros (€).
Amadeus
Firm size fs Parent firm’s sales as described in Slotegraaf and
Pauwels (2008). In euros (€).
QIV &
Nielsen
Product
innovation in
Dummy variables that represent type of a brand
according to the product innovation: conventional,
organic or functional food brands
QIV
Firm type ft Dummy variables that represent brands by firm type:
retailer, SME and MNC QIV
Legend: Amadeus – Company financial statements (balance sheet data),
Nielsen – data from the ACNielsen research, QIV – Quality independent variable
32
Table 5: Overall model estimation with different firm and innovation types
Model
1
Model
2A
Model
2B
Model
3A
Model
3B
Model
4
H# Dependent
Variable
Market
Share Functional Organic
Market
Share
Market
Share
Market
Share
R&D -.01
(.004, 1.28)
.04
(.072, .57)
.19***
(.054, 3.52) -
.01**
(.006, 2.35)
-.01
(.004, 1.02)
BEq .004
(.003, 1.24)
.15**
(.067, 2.16)
-.28***
(.047, 5.90) -
-.01***
(.004, 2.70)
.001
(.01, .13)
SME,
dummy
.08
(.09, 0.92)
1.77*
(.92, 1.94)
4.45***
(.818, 5.43) - -
.08
(.01, .84)
MNC,
dummy
-.63**
(.309, 2.04)
-8.07
(7.13, 1.13)
19.61***
(3.34, 5.87) - -
-.62**
(.296, 2.10)
H1
R&D *
SME
dummy
-.01
(.01, 0.97)
-.04
(.08, 0.46)
-.53***
(.071, 7.54) - -
-.001
(.01, 1.19)
R&D *
MNC
dummy
.15***
(.032, 4.56)
.28
(.333, 0.82)
-2.10***
(.251, 8.34) - -
.15***
(.033, 4.46)
H2
BEq *
SME
dummy
.01**
(.004, 2.20)
-.11
(.072, 1.57)
.30***
(.053, 5.63) - -
.01***
(.01, 2.85)
BEq *
MNC
dummy
-.13***
(.02, 6.22)
.18
(.117, 1.53)
.69***
(.072, 9.63) - -
-.13***
(.021, 6.02)
H3 Functional
dummy - - -
.001
(.019, .06)
.03
(.023, 1.13)
.05**
(.022, 2.29)
H4 Organic
dummy - - -
-.03***
(.009, 3.09)
.02
(.011, 1.48)
-.02
(.013, 1.53)
C1 Price -.03***
(.004, 8.36)
.29***
(.024, 12.11)
-.01
(.023, 0.59)
-.03***
(.004, 6.97)
-.03***
(.004, 6.57)
-.04***
(.004, 8.65)
C2 Firm size .01***
(.001, 14.89)
.01***
(.001, 7.00)
-.003**
(.012, 2.31)
.01**
(.001, 12.60)
.01***
(.001, 12.00)
.01***
(.001, 13.23)
R2 .66 .29 .16 .59 .60 .66
Wald χ2 477.32 366.27 617.02 277.23 346.78 451.63
Note: Bootstrap standard errors and z-statistics appear in parenthesis, respectively.
Robust standard errors are reported for models 2A and 2B.
*** p < .01; ** p < .05; * p < .10


![[SIS] Innovation & Designing for Impact](https://img.pdfslide.us/doc/110x75/53e92f6e8d7f7289708b4aa4/sis-innovation-designing-for-impact.jpg)


