Embed Size (px)
Citation preview
PRODUCT CARBON FOOTPRINT ANALYSIS FOR THE PACKAGING PROCESS OF
RETURNABLE GLASS AND PET CONTAINERS FOR A SOUTH AFRICAN
CARBONATED SOFT DRINKS BUSINESS
Ivan Ivanov
A research report submitted to the Faculty of Engineering and the Built Environment,
University of the Witwatersrand. partly in fulfilment of the requirements for the degree of
Master of Science in Engineering.
Johannesburg 2016

DeclarationI declare that this research report is my own unaided work. It is being submitted to the Degree
of Masters of Science in Engineering (50/50) to the University of the Witwatersrand,
Johannesburg. It has not been submitted before for any degree or examination to any other
University.
JjbIvan Ivanov
1st day of June, 2016
2
AbstractNon-renewable resources are becoming scarce and current Global Warming Potential (GWP)
values are rising. In an effort to promote a successful shift towards a “greener’ planet,
governments worldwide are developing policies, which enforce businesses to contribute to the
effort. One such policy is the potential upcoming carbon tax (measured in weight of C02e) in
South Africa. As a result, industries need to carefully analyse and understand their core
processes and their impact on the environment to ensure that their operations have the lowest
environmental cost possible. One such industry in South Africa is the fast growing Carbonated
Soft Drinks (CSD) beverage packaging industry. CSD are packaged in both Returnable Glass
Bottles/Glass (RGB) and PET containers. The Product Carbon Footprint (PCF) of the CSD
packaging process for 300ml Glass and 500ml PET containers was of particular interest.
Review of academic literature revealed that no similar research has been conducted previously
in South Africa. International studies on PCF, which vastly use the (ISO 14040/14044, 2006)
for their method, were found to have conflicting results and conclusions regarding the
“greenness” of the two types of containers both with respect to the overall GWP of each and
the percentage contribution of the packaging process life cycle stage to the total environmental
impact. This is mainly because such studies are region and technology specific. A study was
therefore required to understand the implications the business' Glass and PET CSD packaging
process has on its GWP and hence carbon tax. The GHG (Green House Gas) Protocol PCF
guideline (World Resource Institute, 2013) was used to construct the method for this research
to ensure best practice, which would allow the study to be expanded into a full blown Fife
Cycle Assessment (FCA) as future work. It was found that the 500ml PET packaging process
draws 100% of its Cumulative Energy Demand (CED) from purchased electricity (generated
by burning coal) and has a GWP of 65 147 gCCTe/hl (hectolitre), which is 4.5 times less than
that for 300ml Glass (294 173 gCCEe/hl) which has 71% of its emissions resulting directly
from coal fired boilers on site. A dynamic model analysis revealed that packaging in larger
containers results in a significant GWP reduction per volume for both Glass and PET
containers. It was recommended that short term the business needs to focus on optimising its
packaging lines’ equipment, work with suppliers on reducing the weight of the raw materials
used for the packaging containers manufacture and promote rate of return of its Glass.
3

Table of Contents
Declaration..................................................................................................................................
Abstract.......................................................................................................................................
Table of Contents........................................................................................................................
List of Tables..............................................................................................................................
List of Figures.............................................................................................................................
Acknowledgements.....................................................................................................................
Proprietary and Confidentiality..................................................................................................
Acronyms and Abbreviations....................................................................................................
1. Introduction.........................................................................................................................
1.1 General research project rationale..............................................................................
1.2 Purpose of the study....................................................................................................
1.3 Research background and motivation........................................................................
2. Literature Review...............................................................................................................
2.1 Methodology for literature review...................................................................................
2.2 Review of literature and gaps identification...................................................................
2.3 Selecting gaps for the research........................................................................................
3. Problem Statement, research questions and objectives....................................................
4. Study approach. Scope, Limitations and Assumptions....................................................
4.1 Study approach................................................................................................................
4.1.1 The product systems and functions..........................................................................
4.1.2 Functional unit..........................................................................................................
4.1.3 Product system boundaries.......................................................................................
4.1.4 Allocation procedures, types of impact and methodology of impact assessment...
4.1.5 Data requirements.....................................................................................................
4.1.6 Assumptions of the research.....................................................................................
...2
...3
...4
...7
...9
.11
. 12
.13
.14
.14
.14
.15
.21
.21
.21
.36
,38
,40
.40
.43
43
43
44
44
46
4

4.1.7 Limitations of the research 48
4.1.8 Critical review..........................................................................................................50
5. Research Method................................................................................................................ 51
a. Setting the context............................................................................................................ 51
b. Sample section................................................................................................................. 51
c. Data collection and model construction..........................................................................51
d. Reporting and ethics........................................................................................................55
6. Observations....................................................................................................................... 57
6.1 Selecting Glass and PET container size.......................................................................... 57
6.2 500ml PET product system’s unit processes...................................................................57
6.3 300ml RGB product system’s unit processes..................................................................63
6.4 Process emissions.............................................................................................................. 68
6.5 Statutory and fugitive emissions...................................................................................... 69
6.6 Material inputs to the CSD packaging process and their GHG emissions................... 69
6.7 Main utilities for the Glass and PET CSD packaging process....................................... 70
6.8 Dynamic model analysis observations............................................................................. 70
7. Results and Discussion.......................................................................................................72
7.1 PET and Glass CSD packaging process unit processes' CED........................................72
7.2 PET and Glass CSD packaging process unit processes' GWP.......................................75
7.3 PET and Glass CSD packaging process key raw materials CED and GW P................. 76
7.4 PET and Glass CSD packaging process main utilities CED and GWP..........................81
7.5 PET and Glass CSD packaging process overall CED and GWP....................................83
7.6 PET and Glass CSD packaging process dynamic model analysis..................................86
7.7 PET and Glass CSD packaging process overall discussion............................................89
8. Conclusions......................................................................................................................... 93
9. Recommendations............................................................................................................... 95
10. References.......................................................................................................................96
5

Appendix A - South Africa's Carbon T ax..............................................................................103
Appendix B - Data Accuracy and Reliability Standards Used as a Guideline......................104
Appendix C — MS Excel Model (CD)..................................................................................... 107
Appendix D - GHG protocol calculation tool example.......................................................... 108
6

Table 1: Estimated length of time left for major fossil fuels (BBC UK, 2015)...................... 16
Table 2: South Africa's sources of energy generation..............................................................18
Table 3: PET vs. Glass facts comparison (Paster, 2007)..........................................................20
Table 4: Environmental footprint for Coca-Cola's bestselling products (Journey Staff - Coca-
Cola, 2010)...................................................................................................................................33
Table 5: Criteria for selecting a methodology approach...........................................................40
Table 6: MS Excel model summary of outputs........................................................................ 55
Table 7: Selecting PET and Glass containers for comparison...................................................57
Table 8: Blow moulder 1 process summary............................................................................. 59
Table 9: Blow moulder 2 process summary............................................................................. 59
Table 10: Air conveyors and silo process summary..................................................................60
Table 11: Bottle unscrambler process summary....................................................................... 60
Table 12: Labeller 1 process summary...................................................................................... 60
Table 13: Labeller 2 process summary...................................................................................... 61
Table 14: Rinser and Filler process summary............................................................................ 61
Table 15: Bottle conveyor process summary............................................................................ 61
Table 16: Case shrink wrapper process summary..................................................................... 62
Table 17: Pack conveyor process summary............................................................................... 62
Table 18: Palletiser process summary........................................................................................ 62
Table 19: Pallet wrapper process summary.............................................................................. 63
Table 20: De-palletiser process summary.................................................................................. 65
Table 21: Crate unpacker process summary............................................................................. 65
Table 22: Crate rinser process summary................................................................................... 66
Table 23: De-capper process summary*.................................................................................... 66
Table 24: Bottle washer process summary............................................................................... 66
Table 25: Filler process summary...............................................................................................67
Table 26: Crate packer process summary.................................................................................. 67
Table 27: Crate packer process summary.................................................................................. 68
Table 28: Bottle conveyors process summary...........................................................................68
Table 29: Key fugitive emissions for CSD packaging process in Glass and PET containers .69
Table 30: Main primary and secondary packaging material differences for Glass and PET CSD
packaging process....................................................................................................................... 69
List of Tables
7

Table 31: g/hl and related C02e in g/hl for the different raw materials for Glass and PET ...70
Table 32: kWh/hl and related C02e in g/hl for the different utilities for Glass and PET......70
Table 33: Packaging container sizes used in the model analysis..............................................70
Table 34: 1250ml Glass packaging process' unit processes.....................................................71
Table 35: 2000ml PET packaging process' unit processes...................................................... 71
Table 36: South Africa's new carbon tax per industry (Parker & Gilder, 2015).................. 103
8

Figure 1: Greenhouse gases (Shailesh, 2012)........................................................................... 15
Figure 2: Estimated remaining world supplies of non-renewable resources (Fastcoexist, 2015)
......................................................................................................................................................16
Figure 3: LCA phases (ISO 14040/14044, 2006)......................................................................22
Figure 4: LCA stages for a typical packaging product (Flanigan, et al., 2013)...................... 23
Figure 5: Process flow chart of basic bottling operations (Hirsheimer, 2015)........................24
Figure 6: Steps in identifying and calculating GHG emissions (World Resource Institute, 2013)
...................................................................................................................................................... 27
Figure 7: A - MJ/1000 units and B - GHG emissions (lbs. Co2e/1000units) (Quantifying
environmental impacts of Carbonated Soft Drink (CSD) packaging , 2009)..........................29
Figure 8: LCA results comparison for Rivella 33cl (returnable glass bottle) vs. Rivella 50cl
(one way PET bottle) (Doublet, 2012)....................................................................................... 31
Figure 9: "Global warming potential of the carbonated drink for different types of packaging
showing the contribution of different life cycle stages" (Amienyo, et ah, 2013)................... 32
Figure 10: "Average greenhouse gas emissions by packaging type (kgC02e/hl per SKU)”
(SABMiller, 2015)...................................................................................................................... 33
Figure 11: Contribution of different packaging containers to total packaging emissions
(Heineken, 2013)..........................................................................................................................34
Figure 12: System boundaries for a LCA for the PepsiCo (Ghosh & Socci, 2012)............... 35
Figure 13: PepsiCo results comparison (Ghosh & Socci, 2012)............................................. 35
Figure 14: Research study methodology choice........................................................................40
Figure 15: LCA stages for atypical packaging product (Flanigan, et ah, 2013).................... 42
Figure 16: Summarised life cycle stages for Glass and PET from the point of view of the scope
for this research........................................................................................................................... 42
Figure 17: CED per functional unit calculation logic................................................................53
Figure 18: Model GHG emissions in C02e calculation logic process flow............................53
Figure 19: Purchased electricity GWP calculation logic...........................................................54
Figure 20: Calculation logic for cross checking hl/hr................................................................54
Figure 21: CSD 500ml PET product system's unit processes*................................................ 58
Figure 22: CSD 300ml RGB product system's unit processes*............................................... 64
Figure 23: 500ml PET CSD packaging process' unit processes CED......................................72
Figure 24: 300ml Glass CSD packaging process’ unit processes CED................................... 73
List of Figures
9

Figure 25: Unit processes for the PET and Glass CSD packaging processes..........................74
Figure 26: 500ml PET vs. 300ml Glass CSD packaging process' unit processes CED from
purchased electricity................................................................................................................... 74
Figure 27: GWP for CSD packaging process’ unit processes of 500ml PET and 300ml Glass
...................................................................................................................................................... 75
Figure 28: 500ml PET CSD packaging process main materials usage g /h l............................76
Figure 29: 500ml PET packaging process main raw materials' GWP......................................77
Figure 30: 500ml PET CSD packaging process main materials usage g /h l........................... 78
Figure 31: 300ml Glass packaging process main materials' GWP.......................................... 78
Figure 32: 300ml Glass vs. 500ml PET packaging process main raw materials GWP, assuming
new injections every production cycle....................................................................................... 79
Figure 33: 300ml Glass vs. 500ml PET main packaging raw materials GWP per 20 cycles per
h i .................................................................................................................................................. 80
Figure 34: CED for boiler and HP compressor.......................................................................... 81
Figure 35: GWP for boiler and HP compressor......................................................................... 82
Figure 36: 300ml Glass vs. 500ml PET CED requirement......................................................... 83
Figure 37: GWP for the 300ml Glass and 500ml PET CSD packaging process.................... 84
Figure 38: 2000ml PET vs. 1250ml Glass CSD packaging process' unit processes C ED 86
Figure 39: CSD of packaging process' unit processes CED of 500ml PET vs. 300ml Glass vs.
2000ml PET vs. 1250ml Glass....................................................................................................86
Figure 40: 2000ml PET vs. 1250ml Glass CSD packaging process' unit processes GWP.....87
Figure 41: GWP of packaging process' unit processes CED of 500ml PET vs. 300ml Glass vs.
2000ml PET vs. 1250ml Glass....................................................................................................88
Figure 42: GWP calculation tool example (World Resource Institute, 2013).......................108
10

AcknowledgementsThis study could not have been successful without the seamless co-operation of personnel from
the selected South African carbonated soft drinks manufacturing business as well as the
continuous and valuable support by Mr Dieter Hartmann.

Proprietary and ConfidentialityThe carbonated soft drinks manufacturing business selected for this study shall remain
anonymous. In line with the ethics associated with this research, the business’ identity and/or
any of its employees’ names have been omitted. Furthermore, sensitive information about the
business, such as sales, is not disclosed.
12

Acronyms and AbbreviationsBM - Blow Moulder
Bph - bottles per hour
CED - Cumulative Energy Demand
CCEe - Carbon Dioxide equivalents
CSD - Carbonated Soft Drink(s)
FBI - Full Bottle Inspector
FLT-Forklift
GHG - Greenhouse Gas
Glass - returnable glass container. Used interchangeably with RGB
GWP - Global Warming Potential
hi - Hectolitre
HP - High Pressure
KPI - Key Performance Indicator
LCA - Life Cycle Assessment
LCI - Life Cycle Inventory
NRB - Non-Returnable Bottle
OEM - Original Equipment Manufacturer
PCF - Product Carbon Footprint
PET - Polyethylene Terephthalate
RGB - Returnable Glass Bottles
SKU - Stock Keeping Unit
SSD - Sparkling Soft Drink(s), same as CSD
SW - Shrink Wrapper
13

1. Introduction1.1 General research project rationale
Due to the rapid rate of non-renewable resource depletion and ever increasing Greenhouse gas
emissions, opportunities for carbon footprint reduction are of interest internationally. Industrial
processes use electricity which emits CO2 due to the combustion of fossil fuels (e.g. coal) and
hence contribute to the global warming of the planet.
In an effort to enforce businesses to be more environmentally conscious, South Africa is
considering the introduction of carbon tax regulation to all major sectors of the country’s
economy in the near future. One such contributor in the consumption of non-renewable
resources and GHG emissions is the manufacturing sector, because of its numerous energy
intensive processes. Therefore, businesses in this sector need to better understand what their
carbon tax would be as well as how they can strategize to reduce it, in particular, the carbon
footprint of a carbonated soft drinks packaging process, which is in either returnable glass or
PET bottles. Above all, the Cumulative Energy Demand (CED) and Global Warming Potential
(GWP) due to the packaging process of PET and returnable glass containers/bottles are of
interest.
1.2 Purpose of the studyWith the potential upcoming carbon tax regulation in South Africa, there will be a need for the
selected CSD manufacturing business to better understand the global warming impact its core
operations have on the environment and therefore its potential carbon tax cost. This will help
the relevant stakeholders develop appropriate carbon emissions reduction strategies. The
proposed research study will seek to quantify the environmental impact (Product Carbon
Footprint) of the packaging process of, on the one hand, returnable glass and on the other hand
PET containers respectively in a typical CSD manufacturing business in Gauteng, South
Africa. This analysis will investigate cumulative energy demand (CED) and its links to carbon
footprint impact in terms of GWP, during the packaging process of the two types of containers.
The business may use the results of the study to understand how the usage of PET and Glass
in its packaging process contributes to prospective carbon taxation. The study will also provide
the business with an understanding of how the usage of Glass and PET on its packaging lines
affects the country's carbon emissions in terms of fossil fuels burnt to generate electricity. By
understanding the aforementioned implications the business will be able to make strategic
decisions with respect to the choice of packaging container used in its packaging process.
14

1.3 Research background and motivationHuman activity results in “unnatural” processes which emit GHGs, such as the burning of fossil
fuels to generate electricity. The length of time a GHG remains in the atmosphere as well as its
ability to absorb energy are the two main factors which determine how strong a GHG affects
the Earth's climate. The GWP is calculated by considering both of these factors. GWP for a
GHG is expressed as an equivalent mass of C02, which has the GWP of 1. The higher the
GWP number is for a process the greater the impact of the Earth's climate will be. (United
States Environmental Protection Agency, 2015)
An accurate carbon footprint is determined by taking into account all the GHGs. “The use of
global warming potentials is central to greenhouse gas accounting and reporting...thus
allowing for comparison between emissions totals, and facilitating the development and
implementation of mitigation and reductions strategies and initiatives.” (Emission Factors,
2014) Figure 1 shows the most central GHGs to climate change: (Shailesh, 2012):
C02
SFg * CH4♦ *
GHGs
HFCs * N20
PFCs
Figure I: Greenhouse gases (Shailesh, 2012)
Fossil fuels, which produce Greenhouse gases (GHG) when burnt, are non-renewable because
the world has a limited capacity available and hence using fossil fuels for energy generation is
not sustainable. (BBC UK, 2015) Example of some of the most used non-renewable resources
include: coal, oil and natural gas. Different methods are used to estimate the fossil fuels left on
the planet. Also the available methods are estimates and are based on assumptions which are
heavily influenced by economic, seasonal and temporal factors. (BBC UK, 2015) Figure 2
shows an estimate for the length of time left of the planet's major fossil fuels. (Fastcoexist,
2015)
Carbon dioxide (C02)
Methane (CH^)
Nitrous oxide (N20)
Ilydrofluorocarbons (HFCs)
Perfluorocarbons (PFCs)
Sulphur hexafluoride (SFg)
15

©
Figure 2: Estimated remaining world supplies of non-renewable resources (Fastcoexist, 2015)
As can be seen from the figure above, the estimated years of coal, oil and natural gas are 42,
37 and 35 respectively.
Table 1 shows the estimated number of years left of major fossil fuels using a different
estimation method:
Table 1: Estimated length of time left for major fossil fuels (BBC UK, 2015)
F o is f l fuel Tim e left
Oil 50 years
Natural gas 70 yeans
Coal 250 years
Although different estimates are obtained by each method, the fact of the matter is that fossil
fuels will run out eventually in the near future and actions need to be put in place now to ensure
a sustainable planet for future generations.
16

There are two ways in which fossil fuel depletion can be reduced. The first is by reducing the
fossil-fuel-generated energy demand and the second is by increasing the supply of renewable
energy. (BBC UK, 2015). In both cases an understanding of the CED for a process is required
beforehand. It is therefore of interest, especially big, energy intensive corporations, to consider
the impact processes’ CED has on consuming these very limited non-renewables.
A few ways have been identified regarding how companies can reduce their environmental
impact. Examples include using alternative to natural resources products, making use of
recycled materials and considering all parts of the business activities and evaluating their
environmental impact. (Queensland Government, 2014). "Reducing the impact on the
environment and conserving non-renewable natural resources is not the only benefit of running
an environmentally friendly business”. (Queensland Government, 2014). Environmentally
conscious companies enjoy numerous benefits as well. Cutting costs is considered the major
benefit of earth-friendly organisations. Business costs tend be reduced by simply avoiding,
reducing, reusing and recycling non-renewable resources. (Queensland Government, 2014).
Adopting green policies will help businesses attract new customers. (Queensland Government,
2014). Greener companies tend to be more sustainable than their counterparts. This is mainly
due to greater independence from natural resource price fluctuations, climate change and other
similar factors which less-green competitors may suffer from. (Queensland Government,
2014) . (Zokaei, 2013) Points out that companies that tackle environmental waste can identify
and eliminate some of their economical waste as well, thus increasing their profit margins.
South Africa is the 14th highest emitter of greenhouse gases in the world. (South Africa Info,
2015) The country is a signatory to the Kyoto Protocol, thus committing to reduce its emissions
of greenhouse gases. (South Africa Info, 2015) Furthermore, the government has rolled out a
National Development Plan (NDP) which main focus is the sustainable development of the
country. (South African Government, 2015). The South African minister of finance has
released a draft on the long discussed carbon tax legislation for public comments in late 2015
and the goal of the government is to pass that regulation in 2016. (Minister of Finanace, 2015)
The main goal is to reduce greenhouse gas emissions by 34% by 2020 and 42% by 2025.
(Minister of Finanace, 2015) This new legislation is will affect all South African businesses
both directly and indirectly. With reference to appendix A, most industries in South Africa will
be directly affected by the new legislation. However, other industries will be indirectly affected
because of upstream supplier costs such as electricity suppliers. Therefore businesses have to
take into account their entire supply chain as well as their operations to mitigate the costs
17

associated with the potential introduction of carbon tax legislation. A thorough understanding
of areas where the business will be subject to tax requires identification in order for companies
to effectively start planning their move away from carbon reliance. (Parker & Gilder, 2015)
Furthermore, this carbon tax will be calculated based on the fossil fuel or non-renewable inputs
that result in greenhouse gas emissions. (Minister of Finanace, 2015), (Parker & Gilder, 2015).
The cost will be measured in terms of CCPe (carbon dioxide equivalent). It will consist of
R120/tonne of CCPe. There will also be an annual raise of 10%/year. However, there will be
tax relief regulations, which may result in the effective cost of carbon tax to the business to be
between R12 - R48/tonne of CCFe. (Parker & Gilder, 2015) Because this rate is significantly
less than the statutory rate, it’s in the business’ best interests to understand how their products
relate to the carbon tax. Also, companies may not be able to incorporate the increase in cost of
manufacture due to the carbon tax liability into the price of their products, because of customer
agreed contracts and other market regulations. Hence it is important for all businesses in South
Africa to investigate their operations' product carbon footprint. The aforementioned findings
apply to the carbonated soft drinks manufacturing business in South Africa and as such this
study will play the part of a valuable reference to the company under investigation.
Table 2 shows South Africa’s non-renewable and renewable resources contribution to total
energy generation: (World Nuclear Association, 2015).
Table 2: South Africa’s sources of energy generation
TypeGenerating
Capacity (GWe)% Contribution
Fossil Fuels (Coal) 34.3 85%
Nuclear 1.8 4%
Other 4.4 11%
TOTAL 40.5 100%
From Table 2 it is evident that the power stations generating the largest portion of electricity
for the South African grid consume non-renewable resources (coal) (85%). This is important
to note as the company under investigation in this project uses energy from both the national
grid in the form of purchased electricity as well as self-generated energy from site-installed
coal-fired boilers. The CSD industry was considered to be of importance because on the
African continent CSD demand is expected to experience a steady trend growth of 4.2% per
18

year. (Canadean, 2013) Also, given the current soft drinks consumption in South Africa, which
is also the 10th largest consumer of soft drinks is the world; this annual 4.2% growth translates
to a massive additional consumer demand, which the beverage industry must satisfy. (Statista,
2015)
South African businesses are placing a major focus on reducing their carbon footprints and
improving efficiencies. The company has recognised that its operations directly impact on the
planet’s climate. A study has concluded that a 1 C° increase in temperature results in 10%
decrease in farming productivity. (ABI, 2015) Hence, the study concludes that waste
management and the introduction of energy technologies should be at the forefront of any
company’s carbon reduction initiatives. Furthermore businesses are advised to develop the
following goals for their packaging operations amongst others: (ABI, 2015)
• “To adopt a holistic approach to sustainable packaging management
• To increase use of recycled content and sustainable materials
• To reduce the amount of packaging raw material consumption.
• To actively participate in activities that encourage post-consumer waste recovery
• To optimise packaging design to enable recycling or re-use” (ABI, 2015)
CSD in general are packaged in Glass, PET or Aluminium containers. Prior research (Franklin
Associates, 2009) (Paster, 2007), (Pretium packaging, 2012) has investigated the “greenness”
of Glass vs. PET bottles to determine which is environmentally friendlier in terms of overall
energy usage throughout its respective life cycle. Evidence points to the fact that PET is fast
becoming the better option for reasons such as its lightweight composition and better energy
efficiency during its packaging process as well as its low transport cost when compared to its
Glass equivalent.
19

Table 3 presents some facts about PET and Glass in terms of their composition and impact on
the environment. (Paster, 2007)
Table 3: PET vs. Glass facts comparison (Paster, 2007)
Description PET GlassAbiotic materials (minerals
and fossil fuels) used (g/g)6.45 3.04
GHG’s emissions (g/g) 3.723 0.716
C02 for every 1000 units
shipped 1000km33.5 224.9
Table 3 shows that glass containers have a lower initial manufacturing environmental impact
whilst PET is superior to Glass on transportation costs. (Paster, 2007) Still this research cannot
be used to clearly justify the usage of PET over glass containers on the packaging lines for a
South African CSD manufacturing business. Also little part of the research can be directly used
by the business to better understand the role its packaging container choice has on the
environment in terms of carbon footprint, because majority of the research is conducted for
organisations outside of South Africa and no general conclusion about the environmental cost
of a system can be made. (Flanigan, et al., 2013)
In general, the argument that cost based selection by companies may reduce making of
environmentally friendlier choices still exists. It is therefore important to investigate the carbon
footprint of the CSD packaging process in PET and Glass from a neutral point of view.
20
2. Literature ReviewThe purpose of this section is to identify gaps in the existing literature with respect to
determining the product carbon footprint of the CSD packaging process for Glass and PET for
a South African business. These gaps are used in developing the problem statement and
objectives for this research.
2.1 Methodology for literature reviewThe following literature review methodology is followed to ensure credibility and originality
of the selected topic:
1. Review current literature to determine what work has been done on determining the
Product Carbon Footprint (PCF) for CSD packaging process in Glass and PET in South
Africa
2. Identify and discuss potential gaps between the reviewed literature and research project
topic
2.2 Review of literature and gaps identification“Life Cycle Assessment (LCA) is a quantitative evaluation of the environmental performance
of a product system across its life cycle. While LCA does not represent a complete set of
potential environmental, social, or economic impacts to be optimized for packaging, it provides
a replicable and rigorous methodology for evaluating several key environmental metrics of
priority to the sector and its customers” (Flanigan, et al„ 2013), for example identifying
environmental hot spots, understanding trade-offs between alternative products. LCA is an
internationally used approach when assessing environmental impact of a given product or
process. “Life Cycle Assessment helps encourage a transition away from focus on single-issue
environmental priorities and provides insurance that environmental burdens are not shifted
from one life cycle stage to another (e.g., from manufacturing to raw material production). In
other words, LCA results make it more difficult to make decisions that are out of context for
the product or environmental impacts being optimized." (Flanigan, et ah, 2013) For example it
would be unnecessary to investigate the environmental impact of the CSD packaging process
for a plastic container vs. a Glass container, if an LCA has found that the raw materials required
to manufacture PET require a lot more energy than the ones for Glass in which case comparing
the packaging process environmental impact of the two types of containers would be of little
value for the decision making process of relevant stakeholders. However, a study should still
be undertaken when a business is trying to evaluate the PCF of its product/service.
21

ISO 14040 and 14044 are specifically drafted to provide a best practice approach when
conducting LCA studies, which can be used for organisations in both developed and developing
economies. (Flanigan, et al., 2013) In summary, there are four phases one should take into
account: (Flanigan, et al., 2013) •
Figure 3: LCA phases (ISO 14040/14044, 2006)
• Goal and scope definition - system parameters are set and functional unit defined (ISO
14040/14044, 2006)
• Life cycle inventory analysis - a list of resources consumed and emissions generated
throughout the product's life cycle within the scope of the study is compiled (ISO
14040/14044,2006)
• Life cycle impact assessment - inventory from previous step is characterised based on
potential of contribution to environmental concerns such as climate change and
resource depletion. (Goedkoop, et al., 2009) have developed characterisation
methodology which is vastly used by researchers in the field (Flanigan, et al., 2013)
• Furthermore, it is essential that the correct impact categories are selected for the
analysis. Choosing too little and or the wrong impact categories may result in
inaccuracies. (Flanigan, et al., 2013)
• Interpretation - results are evaluated in terms of system boundaries, collected data and
assumptions made (ISO 14040/14044, 2006)
22

Furthermore, any "LCA methodology should be amenable to the inclusion of new scientific
findings and improvements in the state-of-the-art of the technology” (ISO 14040/14044, 2006).
Figure 4 shows a LCA for a typical packaging container with the major life cycle stages shown.
Product Lrf* Cydoj
\ 4
I\
3
Figure 4: LCA stages for a typical packaging product (Flanigan, et al, 2013)
Highly automated machinery is the result of a demand increase for soft drink beverages over
the past few decades. This has resulted in bigger, faster and higher quality machinery.
(Hirsheimer, 2015) This machinery requires less people to run at the expense of consuming
more energy. Figure 5 represents the major process blocks of a CSD packaging line together
with its major supporting operating activities. (Hirsheimer, 2015) It is good visual illustration
of all the major energy consumers required to package a SSD in a container. Also, it enables
one to accurately determine the overall energy consumption required by a packaging line by
summing the entire relative and directly contributing process blocks.
23

WAREHOUSE
STIIIP PREPARATION
Figure 5: Process flow churl of basic bottling operations (Hirsheimer, 2015)
(Amienyo, et al., 2013), who make use of the guidelines provided by (ISO 14040/14044, 2006).
have determined that in order to obtain accurate results, the energy related to the use of all type
of secondary packaging material such as stretch wrap, crates, etc. as used on the different
packaging lines need to be considered e.g. mapping of the process from a primary packaging
container point of view and understanding all the energy required to produce the end product.
For the Glass containers’ packaging line, de-palletising the bottles, washing of bottles and
crates, filling, capping and labelling of the tilled bottles, re-crating, re-palletising activities
need to be considered. For the PET container's packaging line blowing of PET pre-forms to
form the final bottles, washing and drying, capping, labelling and stretch wrapping need to be
considered. The energy required for the belt transport system on the two different packaging
lines should also be factored in. (Amienyo, et al., 2013)
Furthermore, (Amienyo, et al., 2013) have used the ISO 14040/44 standards to conduct a cradle
to grave study of the CSD production impact on the environment. Data for the study was
obtained from a carbonated soft drinks manufacturer as well as from CCaLC, Ecoinvent and
Gabi databases. Software tools have been used to develop the LCA modelling. The study has
adopted the CML 2001 method for assessing the overall environmental impact. The scope of
the proposed research does not contain a cradle to grave analysis, which renders the use of the
24

software modelling tools used by (Amienyo, et al., 2013) impractical. Furthermore, the use of
software provides a generic dataset, while this study will make use of real, site and packaging
line specific data where possible. Furthermore, (Amienyo, et al., 2013) suggest that data
concerning the packaging of CSD into the different types of containers must be obtained
directly from the business under investigation to ensure the most accurate results.
(Flanigan, et al., 2013) have done a study, which has consolidated the “outcomes of existing
research on environmental performance of packaging”. The study's conclusions may be
regarded to form the basis for future environmental impact assessment of packaging. In
addition, the publication provides a detailed methodology for conducting LCA studies,
including knowledge mining techniques. The focus of the publication is to provide best in
practice guidelines, which can be used in assessing the environmental impact of packaging
containers. Furthermore, the study highlights that optimal packaging design from an
environmental performance point of view may vary according to packaging system inputs such
as raw materials, product being packaged, and route of supply. (Flanigan, et al., 2013) Flence,
the findings of a study conducted in the USA for example cannot be directly applied to the
South African business in question as there are many system parameters such as technological
and geographical inputs which will differ between the two countries.
Qualitative and quantitate methods can be combined into a framework for the environmental
assessment of a product/process. (Fluang & Ma, 2004). However, the research has found that
these two types of methodology do not yield consistent results. The majority of the literature
(Flanigan, et al., 2013), (Franklin Associates, 2009), (Ghosh & Socci, 2012), (Gleick & Cooley,
2009), (Humbert, et al., 2009) available on LCA prefers the quantitative approach. Hence,
quantitative methodology would be adopted by this research.
An effective approach done during a study conducted by (Steenwerth, et al., 2015) was to
gather site specific data (material specifications. OEM technical specifications, utilities bill,
etc.) and to interview key business personnel in order to best understand and quantify the
manufacturing processes and their respective energy consumption requirements. A similar data
gathering approach is selected for this research, because it will eliminate many general
assumptions and will therefore yield more accurate and useful results, which are value adding
and business specific.
In a study done by (Bieda, et al., 2015) only certain environmental aspects such as electric
energy, steam, air, heat, and industrial water as well emissions of various GHG were considered
25

in the life cycle assessment of a process. Another study by (Frischknecht, et al., 2015) has
determined that the using the cumulative energy demand for a process is an effective way of
determining the impact of a process on the environment, however one should take care when
defining renewable and non-renewable energy as this definition can have significant impact on
the results of the study.
(Humbert, et ah, 2009) suggested that the best approach for undertaking an LCA analysis is by
adhering to already developed ISO standards, which is a compilation and evaluation of the
different inputs, outputs and potential impacts on the environment throughout a product’s
lifecycle. (Ecoinvent, 2015) offers an extensive database for modelling systems to evaluate
their environmental impact from cradle to grave. However, the website does not offer an
educational trial and was therefore not used for this study.
Furthermore, there are numerous environmental impact assessment factors which can be
considered during an LCA study. These include CED (GJ), GWP (kg CO2 eq.), ADP (kg SB
eq.), AP (kg SO2 eq.), EP (kg PO4 eq.), HTP (kg DCB eq.)x(100), MAETP (t DCB eq.)x(100),
FAETP (kg DCB eq.), TETP (kg DCB eq.), ODP (mg R -ll eq.)x(100) and POCP (g C2H4
eq.)x(100). (Amienyo, et ah, 2013) From the aforementioned, (Humbert, et ah, 2009) identified
two environmental factors which are best suited for the comparison of the environmental
impact of different types of products. Those are Global Warming Potential (GWP), which is
measured in kg of CO2 equivalent and Cumulative Energy Demand (CED), which is measured
in kWh. The emission levels of the greenhouse gases (CO2, CH4 , N20 and halogenated
hydrocarbons) are expressed by the GWP. On the other hand the consumption of renewable
and non-renewable resources energy accumulated throughout the different stages of the life
cycle of a container is expressed by the CED. CED is related to the GWP because non
renewable resources, which generate GHGs, may be used for the generation of energy.
The topic for this research requires a quantification of the GWP for the CSD packaging process
of Glass and PET for a South African manufacturer. The aforementioned discussion has been
around the benefits of an LCA as well identifying the most suitable methodology when
conducting such environmental studies. However a more specific branch of an LCA called
Product Carbon Footprint is available for conducting environmental impact comparison
studies. According to (Martin, 2014), there’s a slight difference between LCA and Product
Carbon Footprint (PCF) aka GHG emissions assessment. PCF "only assesses the global
warming potential of an organization, product, project or service” (Martin, 2014) in terms of
26
GHGs and converts them to carbon dioxide equivalents, “whereas a life cycle assessment
(LCA) assesses multiple environmental impact categories, which may include global warming,
but may also include human health impacts, ecosystem quality, acidification, land use. etc.”
(Martin, 2014) The three most internationally used standards for conducting such a study are
PCF: PAS 2050, ISO DS 14067, and the GHG Protocol (GHG Protocol - Corporate Accounting
and Reporting Standards). The latter one is selected as a guideline for this research because it
is intended for quantifying GHG emissions only for business activities and operations).
(Martin, 2014)
Another distinguishable feature of PCF is that it considers all direct GHG emissions associated
with a process (either owned or controlled), indirect GHG emissions from purchased
electricity, heat or steam and all other indirect emissions such as waste disposal, transportation,
etc. (Martin, 2014) (World Resource Institute, 2013)
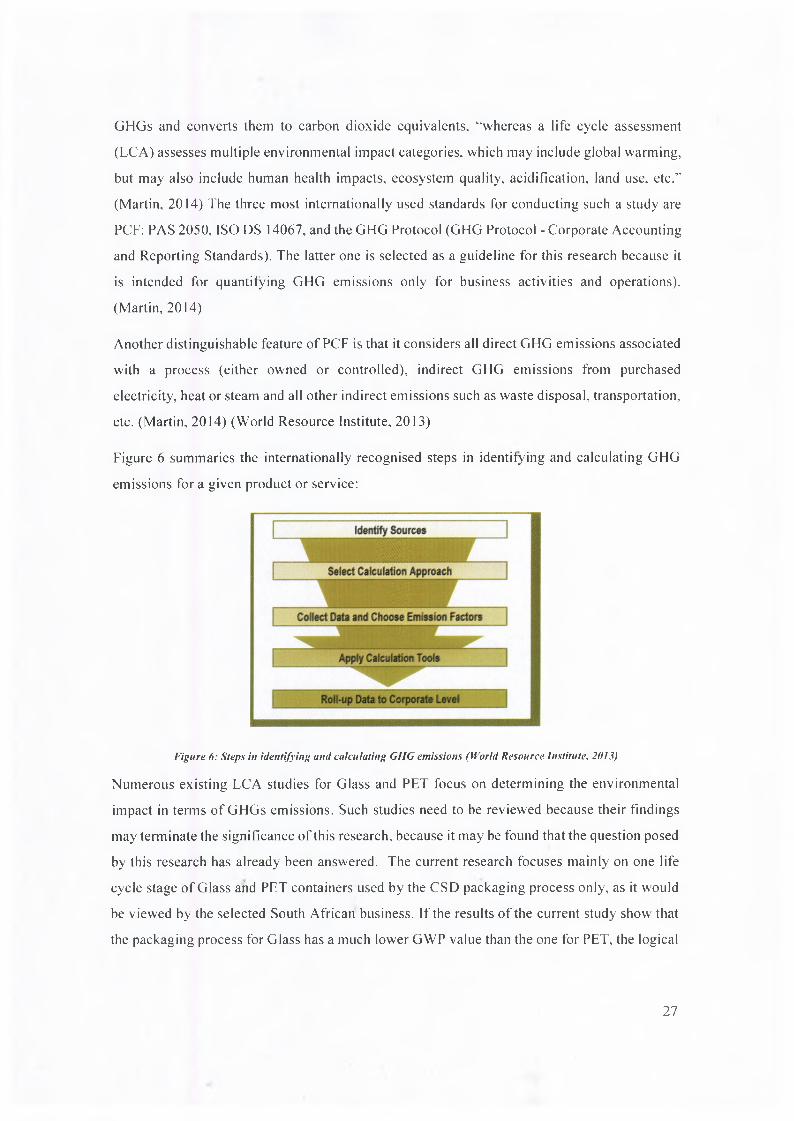
Figure 6 summaries the internationally recognised steps in identifying and calculating GHG
emissions for a given product or service:
Figure 6: Steps in identifying and calculating GHG emissions (World Resource Institute, 2013)
Numerous existing LCA studies for Glass and PET focus on determining the environmental
impact in terms of GHGs emissions. Such studies need to be reviewed because their findings
may terminate the significance of this research, because it may be found that the question posed
by this research has already been answered. The current research focuses mainly on one life
cycle stage of Glass and PET containers used by the CSD packaging process only, as it would
be viewed by the selected South African business. If the results of the current study show that
the packaging process for Glass has a much lower GWP value than the one for PET, the logical
27
business decision from an environmental point of view would be to convert all of its packaging
lines to Glass. If however a full blown LCA for Glass and PET is done it may reveal that:
• The packaging process for Glass and PET is the least environmentally costly life stage
for the two containers. Hence the decision for the business to convert to Glass may not
be justified as supplier costs or other upstream business operations such as
transportation of the Glass will be significantly higher than PET, because Glass is more
environmentally costly in those upstream life cycle stages than PET. Also, a higher
GHGs emissions for Glass upstream will result in higher supplier carbon tax which will
result in higher Glass material cost to the business
• The overall environmental cost for Glass is much higher than the one for PET. If this is
the case the business might be forced by external stimuli such as government and
suppliers to convert all of its packaging lines to PET
Hence, before starting with the study, it is very important to review existing LCA for Glass and
PET and to understand the overall environmental cost for Glass and PET as well as the
contribution of the packaging process life cycle stage to this overall environmental cost.
In an American study, which has adopted the internationally recognised LCA methodology as
specified by (ISO 14040/14044, 2006), PET (32MJ/16oz bottle) has a very similar total
environmental impact to NRB (glass) (34MJ/16oz bottle). (CAE, 2005) PET has been found to
be better for the environment in areas such as transportation, while glass is better in terms of
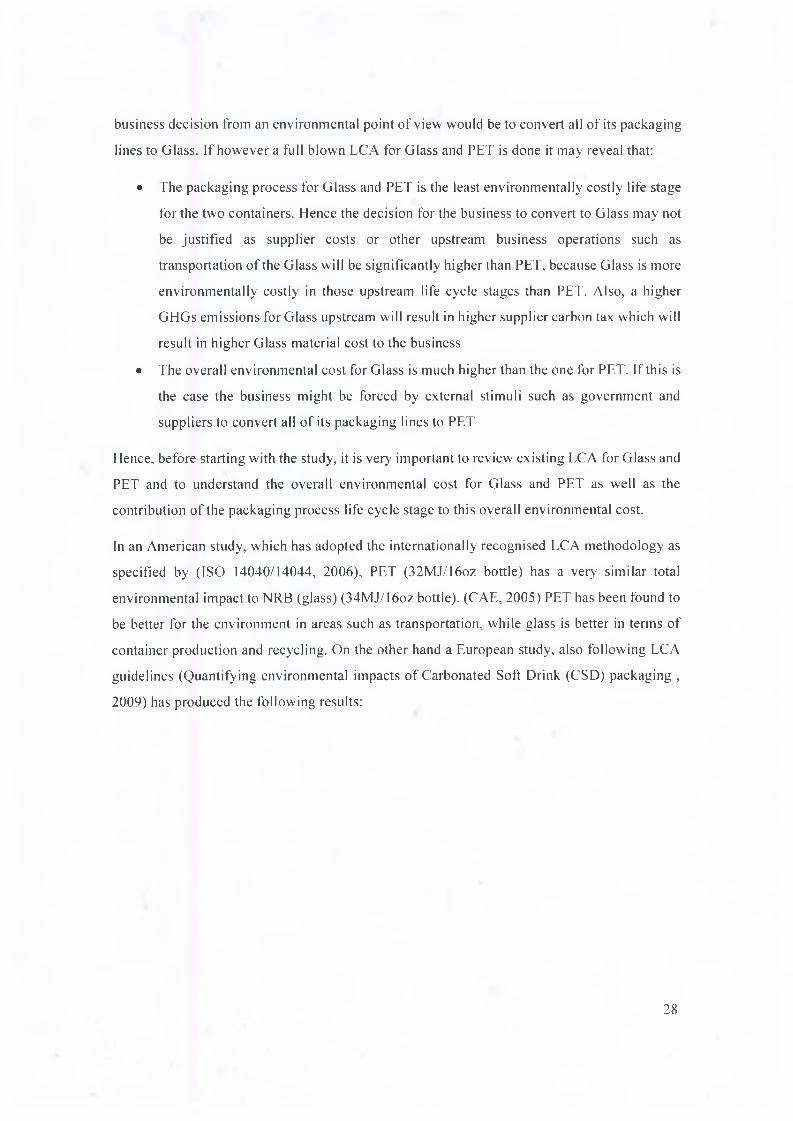
container production and recycling. On the other hand a European study, also following LCA
guidelines (Quantifying environmental impacts of Carbonated Soft Drink (CSD) packaging ,
2009) has produced the following results:
28
5W0 r
4000
3000
2000
487.2
1000
Aluminum (an Glass Bottle| Purchased Mat h □ Process
Aluminum CanI Purchased Mat'ls
Glass Bottle□ Process
Figure 7: A - MJ/1000 units and B - GHG emissions (lbs. Co2e/1000units) (Quantifying environmental impacts ofCarbonated Soft Drink (CSD) packaging, 2009)
The study focused on comparing PET, glass and aluminium cans in terms of their total energy
consumption and total greenhouse gas emissions. In this study, both the overall MJ/1000 units
(CED) as well as the lbs. CCEe/lOOO units (GWP) are lower for PET than for glass containers.
The yellow part (process) for the CED and GWP, which refers to the packaging of the different
types of containers, is approximately 10% less in favour for PET. Furthermore, the study did
not consider returnable glass containers. The case study is also done in Europe and as such
carries a lot of continent specific assumptions. It does not offer a true reflection of packaging
container comparison, which can directly be translated to South Africa, because the facilities
tested in the study use their own specific machinery, which draw power from a source, which
may or may not use coal as its primary fossil fuel. It is evident that based on the assumptions
and many other factors such as political, economic and situational, the container’s “greenness”
is expected to differ and applying the findings of one study to another would not provide
stakeholders with accurate results.
An Australian study, adhering to LCA principles in line with (ISO 14040/14044, 2006), has
determined that PET is worse for the environment than Glass if both containers’ manufacture
and their packaging is done locally. (Spenser, n.d.). Hence, geographical factors and local
availability of fossil fuels play a significant role in determining the environmental impact of a
product/process which again implies that studies conducted globally cannot be directly used by
decision makers in South Africa.
Glass packaging has been found to benefit the environment because it can easily be recycled
and reused. Re-use means that less fossil fuels are required for container fabrication.
Transportation costs and cleaning requirements on the packaging lines have to been found to
29

be the main reasons for the preference of PET over Glass containers, (Marsh & Bugusu, 2007)
mainly because Glass is a much “dirtier" and unsafe process as a result of container breakages.
However, the study does not in any way quantify the environmental impact of those cleaning
requirements on the packaging lines for Glass. It is therefore of interest to understand what the
impact of such systems is on the environment in terms of CED and GHG emissions.
A study conducted by (Franklin Associates, 2009), in the United States, has extensively made
use of an LCA methodology by following (ISO 14040/14044, 2006) and has analysed the
cradle to grave impact on the environment of glass, PET and aluminium containers, in terms
of the solid waste generated, greenhouse gas emissions and energy consumption in the context
of the CSD manufacturing industry in the USA. It has found that the majority of total energy
for PET and glass occurs in the cradle to material and container fabrication life stage.
Furthermore, (Franklin Associates, 2009) found that PET bottles resulted in less greenhouse
gas emissions overall (77% less than glass). The study also found that the energy used for PET
bottles totalled 11 million BTU per 30001 of soft drink vs. 26.6 million BTU per 30001 of glass.
However, the study does not consider the energy required for the packaging of glass and PET.
Hence, a business looking to determine its direct carbon tax contribution would fail to do so
based on the findings of this study. Also, the study was conducted in the USA where the
packaging raw materials manufacturing processes are not identical to the ones in South Africa.
Although similarities exist, no two processes are identical and businesses use different
technologies to produce their goods. For example the way energy is used and recovered in a
CSD manufacturing plant in the USA would be different to the way energy is used and
recovered in a corresponding South African plant. Hence, because of raw material supplier
differences as well as transportation distances, the results of (Franklin Associates, 2009) cannot
be generalised for all CSD manufacturers. Although the results can be used as a general guide
they do not provide confidence for decision makers in South Africa. Secondly, the study was
conducted in general for CSD manufacturers and it didn't focus on a single business and hence
it’s not company specific. Thirdly, the environment for the study is not identical to South
Africa’s. For example the power used in the USA could have come from a renewable power
source such as hydro-electric generated energy. The market conditions are different (distance
to from supplier of raw materials to manufacturing site, distance from manufacturing site to
consumer and waste areas, etc.). Forth, the study takes into account the whole cradle to grave
impact of PET and glass bottles, which has many variables (such as supplier manufacturing
processes, country specific travel distances, etc.) that is cannot simply be translated to a
30

business in South Africa. Glass could still be better than PET from packaging process point of
view for a specific business. Also the study looked at single serving, non-refillable glass
containers. No evidence is provided by the study regarding RGBs. Hence, an RGB might be
greener than its PET equivalent.
(Gleick & Cooley, 2009) found that for a PET container the energy cost for packaging of water
is 0.34% of the total energy cost that goes into the bottle. This result was calculated by using
theoretical packaging machines’ power consumptions for fillers and labellers only. A detailed
analysis of the energy costs of all packaging line components was absent. However, an
important recommendation of the study for future work was to investigate in more detail the
energy consumption associated with the packaging process in order to better understand its
impact on the environment as well as to identify potential energy saving opportunities.
In another European LCA for CSD manufactures, (Doublet, 2012) has concluded that refillable
glass bottles have lower environmental impact than PET. Figure 8 below show the
environmental impact contributions from each life cycle stage of glass and PET as found by
BMSWI
/ / Disposal packaging
f. Distribution
:% Bottling
■ Secondary and tertiary packaging
label
it Closure
PET Bottle/Transport Glass Bottle
■ PET Preform/ Glass bottle
Figure 8: LCA results comparison for Riveiia 33cl (returnable glass bottle) vs. R ivella 50cl (one way PET bottle)(Doublet, 2012)
"‘Bottling" (Doublet, 2012) i.e. CSD packaging process (50% of the total GWP for Glass and
20% of the total GWP for PET) has a significant environmental impact and hence an
investigation into bottling will have a significant impact on the container's total environmental
impact. Furthermore in another European study, the packaging stage of the LCA for Glass and
(Doublet, 2012).
Rivella 33d Rivella SOd
31

PET was also found to form a significant part of the total LCA energy. (Pasqualino, et al..
2011) Hence, considering only the packaging phase of the process in more detail can be
expected to provide sufficient information for the business studied, which can be used to
develop strategies focused on directly reducing the company’s carbon tax. Also, any reduction
made in this area would be in line with South Africa’s GWP reduction policies. (Minister of
Finanace, 2015)
A study conducted by (Amienyo, et al., 2013) following (ISO 14040/14044, 2006) in the UK
has looked at the GWP for CSD from cradle to grave for containers of various sizes, which
include glass and PET bottles. The manufacturing stage of the process has been found to
account for up to 10% of the total energy mainly due to the resources required on the CSD
packaging lines. (Amienyo, et al., 2013) 2L PET container has been found to have the lowest
carbon footprint when compared to a non-returnable glass container. However, if the Glass
containers are re-used its carbon footprint would be very close to that of the PET container,
because less energy would be required for the packaging raw materials stage manufacture.
Figure 9 summarises the results of the study.
600,
Figure 9: "Global warming potential of the carbonated drink for different types of packaging showing the contribution ofdifferent life cycle stages" (Amienyo, et al., 2013)
In this study, it is evident that the “Packaging” life stage, which in the study is defined as the
stage where containers are manufactured from raw materials, is by far the most
environmentally costly life state in terms of GHGs emissions for both glass and PET. The CSD
32
packaging process stage (defined by the study as "Manufacturing”) contributes a small amount
to the total environmental cost for the different types of containers. (Amienyo, et ah, 2013)
Because the study has been conducted in the UK it will not be accurate to translate the
conclusions directly to a South African CSD manufacturer. This is because raw material supply
and availability in the UK is different to the one in South Africa. Manufacturing technologies
as well as transportation distances also differ between the two countries as no two
manufacturing plants carry the same characteristics. Therefore a similar research in the South
African context is required by the business, if an accurate comparison of the environmental
impact for its CSD packaging process in Glass and PET is required.
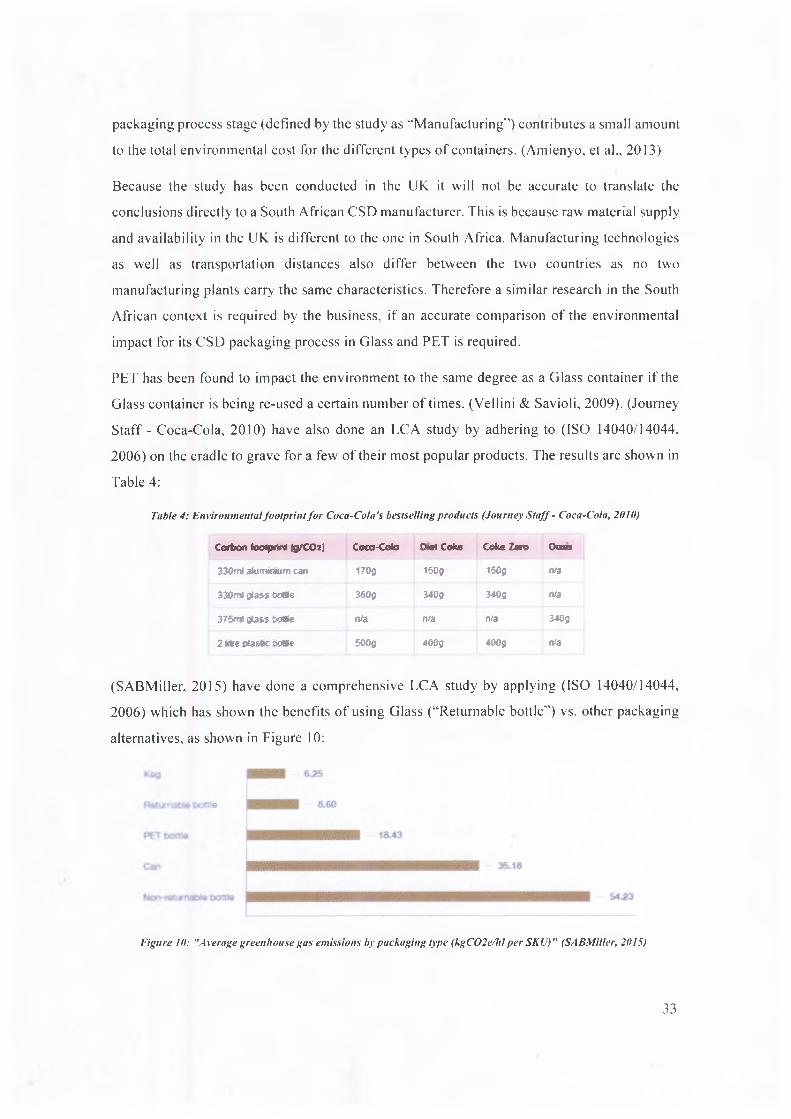
PET has been found to impact the environment to the same degree as a Glass container if the
Glass container is being re-used a certain number of times. (Vellini & Savioli, 2009). (Journey
Staff - Coca-Cola, 2010) have also done an LCA study by adhering to (ISO 14040/14044,
2006) on the cradle to grave for a few of their most popular products. The results are shown in
Table 4:
Table 4: Environmental footprint for Coca-Cola's bestselling products (Journey Staff - Coca-Cola, 2010)
Carbon footprint (9/CO2) Coco-Cota Dtel Coke Coke Zero Oasis
330ml aluminium can I70g 150g 150g n/a
330ml glass 6o»8 360g 340g 340g n/a
375ml glass b e a t n/a n/a n/a 340g
2 litre d asItc tx** 500g 400g 400g n/a
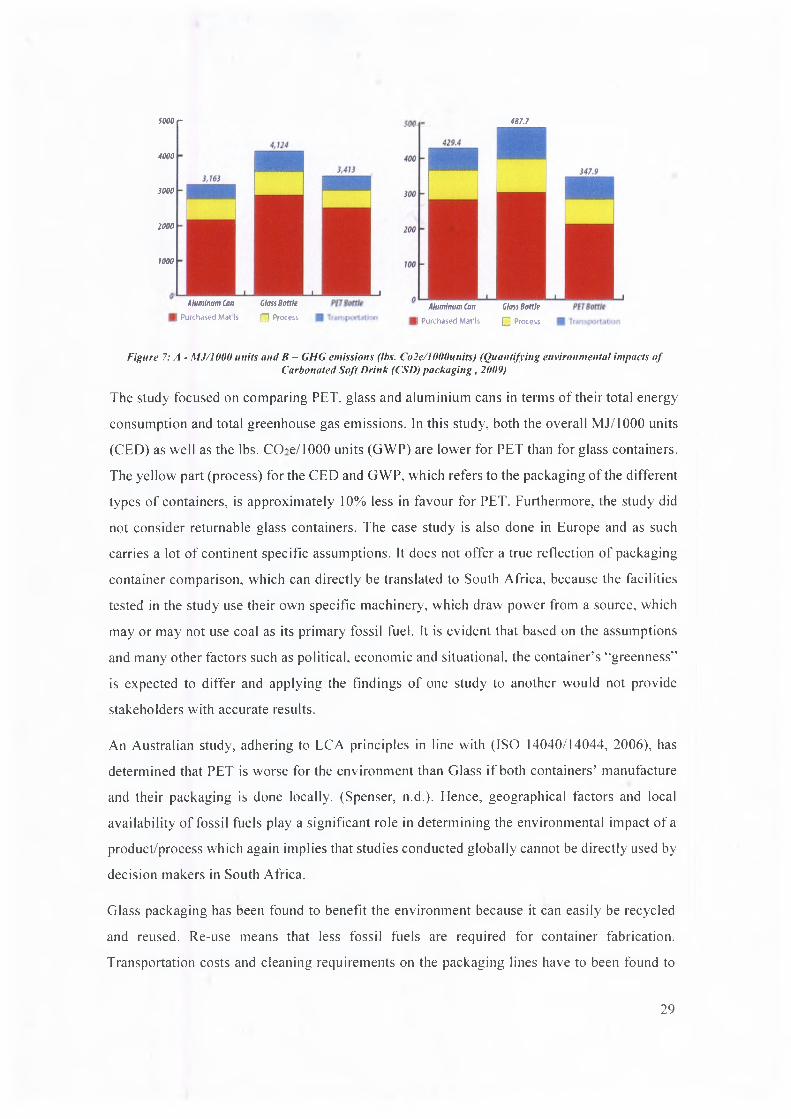
(SABMiller, 2015) have done a comprehensive LCA study by applying (ISO 14040/14044,
2006) which has shown the benefits of using Glass (“Returnable bottle") vs. other packaging
alternatives, as shown in Figure 10:
Figure 10: "Average greenhouse gas emissions by packaging type (kgC02e/hl per SKU)" (SABMiller, 2015)
33

(Pasqualino, et al., 2011) have concluded that packaging process of a plastic container of water
and juice has the highest environmental impact amongst all the activities that take place during
the life cycle of the container. Another study by (Humbert, et al., 2009) has established that
plastic packaging for baby food is slightly better over its Glass alternative.
(Heineken, 2013) identified that thermal and electrical energy is required for the production of
the company’s beverages, which are mainly in non-returnable glass containers. Thermal energy
is defined as energy that comes from fuel used on site for heat generation, while electrical
energy refers to the electricity consumption required on site. Thermal energy is measured in
MJ/hl and electrical energy in kWh/hl. The business has quantified that the majority of this
energy is consumed in the beverage production and packaging process on site. As part of
environmental conservation programs the (Heineken, 2013) has identified that thermal energy
is best reduced by new, more thermally efficient equipment and improved recycling projects
while electrical energy is best reduced by switching to a renewable source of electricity
generation. Furthermore, (Heineken, 2013) defines the measurement for greenhouse gas
emissions i.e. kgCCfe/hl.
■ Glass bottle 35%■ Aluminium can 35%■ Secondary or tertiary 12%
Returnable 8%■ PET bottle 8%■ Steel can 2%
Figure 11: Contribution of different packaging containers to total packaging emissions (Heineken, 2013)
It must be noted that Glass packaging process emissions are higher than PET in the figure
above, as it is the main primary packaging material for the business and majority of business
products are packaged in this type of container. Also the main focus of the study was on
reducing the physical weight of the containers as well as developing more efficient recycling
initiatives. (Heineken, 2013) The energy used on the packaging lines has been seldom found
to be at the forefront of such improvement programs and as such it requires investigation.
Figure 12 is an excerpt from an LCA study adhering to (ISO 14040/14044, 2006) and
conducted by (Ghosh & Socci, 2012) on the Pepsi Co. Although the study has focused on
evaluating the cradle to grave LCA of the different packaging containers the company uses for
34

its products, it did not cover the Filling (packaging process) energy associated with the various
containers.
— Within Study Boundary
— — Outside Study Boundary
Elementary Inputs from Nature• Water• Raw Materials
I
Intermediate Inputs from Technosphere• Treated Water• Energy• Economic Goods
Elementary Outputs to Nature Intermediate Outputs to Technosphere• Water • Waste Water to be Treated• Airborne Emissions • Economic Goods• Waterborne Emissions • Solid Waste to be Managed
Figure 12: System boundaries for a LCA for the PepsiCo (Ghosh & Socci, 2012)
With reference to another excerpt from (Ghosh & Socci, 2012). it is interesting to point out that
in terms of GHG emissions and total energy demand i.e. CED overall, excluding the
manufacturing part of the process, Glass results in 1.6 times more GHG emissions than PET
and Glass requires 1.2 times the CED than PET.
Figure 13: PepsiCo results comparison (Ghosh & Socci, 2012)
Hence the packaging process life cycle stage has not been considered, it would be of academic
importance to investigate how the integration of GHG and CED of the manufacturing (CSD
packaging) process will affect PET and Glass containers' GWP.
35
2.3 Selecting gaps for the researchIn summary, from all the studies which relate to conducting an LCA on different beverage
packaging options such as (Vellini & Savioli, 2009), (Gleick & Cooley, 2009), (Pasqualino, et
al., 2011), few e.g. (Journey Staff - Coca-Cola, 2010) and (Doublet, 2012), directly investigate
the carbon footprint of packaging CSDs in Glass and PET containers alone. As far as the
research for this project has gone there has been no evidence found for work done on the carbon
footprint of the CSD packaging process for PET and Glass containers in South Africa.
Therefore any work conducted hereby will be the first of its kind.
Different LCA studies have different results regarding the contribution impact for each life
cycle stage for Glass and PET. Some studies (e.g. (Amienyo, et al., 2013)) suggest that the
packaging process life stage is insignificant to the total environmental cost of the products
while others (e.g. (Pasqualino, et al., 2011)) identify it as the life stage with most significant
environmental impact. Furthermore, no conclusive evidence exists in favour of either of the
two materials i.e. the environmental cost for the CSD packaging process in Glass and PET
containers is not definitive. Hence a targeted case study, which will provide a repeatable
method for quantification of PCF, for the soft drinks manufacturer under investigation, will be
beneficial in closing this gap in literature as well as providing the business under investigation
with valuable information about their products, which stakeholders can use in preparation for
the potential carbon tax legislation in South Africa.
Furthermore, no conclusive evidence exists which supports the packaging process dominance,
in terms of GHGs emissions, of Glass over PET. Therefore, this creates the need for this current
study which would be used by the business to determine how their operations impact on its
potential future carbon tax.
In majority of the literature found (Doublet, 2012), (Pasqualino, et al., 2011), (Franklin
Associates, 2009), (Flanigan, et al., 2013) (Ganji, et al., 2002), etc. the life cycle analysis uses
data from (Ecoinvent, 2015). This is a theoretical database and it deviates from business
specific data. This is a gap in literature that will be closed with this research as the study will
collect and use real business data as much as possible for its analysis.
LCA studies (e.g. (Amienyo, et al., 2013), (Flanigan, et al., 2013), (Pasqualino, et al., 2011)
etc.) have been found to be time and resource consuming. Although the significance of
conducting a full blown LCA for the business is vast, for the purposes of the current business
36

needs identified by this research, such an analysis is not required at this time and has to be
conducted as future work.
In summary, the following literature gaps are identified:
• No research on PCF for CSD packaging process done in South Africa
• PCF research depends on many external factors such as technical, geographical and
operational and the results of one study in one country cannot be directly translated to
a business in another country
• No clear conclusion on the most expensive environmental life stage for Glass and PET
containers
• No clear conclusion on which material (Glass or PET) has a lower environmental
impact
• Studies on the packaging process of Glass and PET either use theoretical data from
databases or they do not include all the steps of the process into consideration when
calculating the environmental impact
• Literature available (e.g. Journal of Life Cycle Assessment) mostly focuses on the
production and recycling of PET and Glass and does not offer any insight into how the
usage of these materials in the CSD packaging process affects the consumption of non
renewable resources
In summary, the research project is expected to have the following benefits:
• Environmental awareness regarding the packaging of CSD in PET and Glass
containers in South Africa
• Assistance to the business under investigation to better plan its future initiatives, in
the context of South Africa's potential new carbon tax regulation, by providing
insightful energy quantifications with respect to packaging container choice across its
SKU portfolio. This will also positively impact the business’ corporate governance
• Provide a method which can be applied by a different manufacturing businesses to
better understand their role in reducing South Africa's carbon footprint
• Providing literature with a generic calculation model that can be used, to assess
different PCF for a variety of similar processes
• Create opportunities for further academic research by providing recommendation
which build on the existing study
37

3. Problem Statement, research questions and objectivesThe problem statement for this research project is defined as follows:
Quantify the environmental impact in terms of Global Warming Potential for the CSD
packaging process of returnable glass and PET containers for a South African business in
Gauteng in light of the potential new carbon tax legislation. Hence, determine which type of
packaging process has a lower carbon footprint.
The main focus of the research is to quantify the Cumulative energy demand (CED) of PET
and Glass containers during their respective packaging processes. The Greenhouse Gas
emissions will be calculated based on the nature of the sources of this CED and hence the
carbon footprint on the environment determined as measured by GWP. Furthermore, using less
energy does not necessarily mean that a certain process is greener than another. This paradox
emerges in the realisation that processes that use renewable resources of power have less of an
overall impact on the environment than those derived from non-renewables. This means that a
process that is more energy intensive may still have an overall lower footprint. For example
one process can use 1 OOkWh and another 150kWh, however upon breaking these two processes
down to the usage of non-renewable resources one can find that the 150kJ process consists of
50kJ which are generated from non-renewable resources, while the lOOkJ consists of lOOkJ
directly generated from non-renewable resources. Hence, the following research questions
were developed to provide more insight into the packaging “greenness” of PET and Glass
containers:
Research question 1:
Given two similar sized containers (Glass and PET), which of the two have a lower Cumulative
Energy Demand (CED) during their respective (CSD) packaging process?
Research question 2:
What sources of energy are used i.e. the CED breakdown each of the two (Glass and PET) CSD
packaging processes?
Research question 3:
What are the Greenhouse Gases (GHGs) emitted by each source of energy in terms of weight
of CCEe and hence which packaging process has a lower Global Warming Potential (GWP)?
38

Research question 4:
Which CSD packaging process (Glass or PET) is associated with a lower carbon tax for the
business?
Hence the following objectives are developed for the project:
• Quantify the energy requirement of all unit processes, main utilities and raw materials
required for the packaging process of a PET and a Glass container on a carbonated soft
drinks’ packaging line operating within a South African business in Gauteng in order
to determine the respective process’ CED
• Determine which container uses the least amount of energy during its respective
packaging process in terms of CED
• Determine the breakdown of direct and indirect CED in terms of source of energy used
by each of the unit blocks for the packaging process of Glass and PET e.g. how much
of the CED for the packaging process of a PET and a Glass container can be directly
attributed to fossil fuels i.e. purchased electricity
• Quantify the GHGs in terms of weight of CCEe as a result of the packaging process,
main utilities and raw packaging materials for Glass and PET to determine which type
of packaging process is associated with a lower overall GWP and hence results in a
lower carbon taxation to the business
• Understand the impact on CED and GWP when using Glass and PET containers of
different size
• Provide recommendations on the usage of the two types of containers as a packaging
choice for the selected South African business in terms of their environmental impact
and carbon tax
39
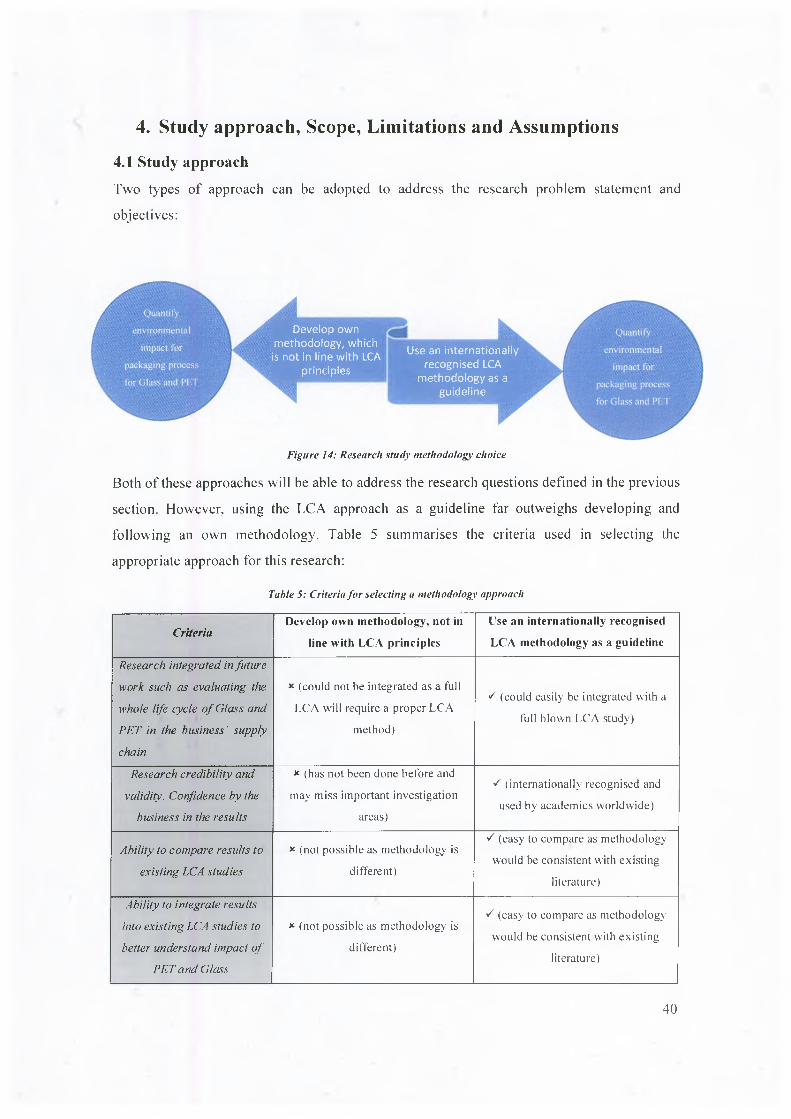
4. Study approach, Scope, Limitations and Assumptions4.1 Study approachTwo types of approach can be adopted to address the research problem statement and
objectives:
Develop own methodology, which is not in line with LCA
principles
Use an internationally recognised LCA
methodology as a guideline
Figure 14: Research study methodology choice
Both of these approaches will be able to address the research questions defined in the previous
section. However, using the LCA approach as a guideline far outweighs developing and
following an own methodology. Table 5 summarises the criteria used in selecting the
appropriate approach for this research:
Table 5: Criteria for selecting a methodology approach
CriteriaD e v e l o p o w n m e t h o d o l o g y , n o t in
l in e w i t h L C A p r i n c i p l e s
U s e a n i n t e r n a t i o n a l l y r e c o g n i s e d
L C A m e t h o d o l o g y a s a g u i d e l i n e
Research integrated in fu ture
work such as evaluating the
whole life cycle o f Glass and
P E T in the business ' supply
chain
x ( c o u ld n o t b e i n t e g r a t e d a s a fu l l
L C A w i l l r e q u i r e a p r o p e r L C A
m e th o d )
C ( c o u ld e a s i ly b e i n te g r a te d w i th a
fu ll b lo w n L C A s tu d y )
Research credibility and
validity. Confidence by the
business in the results
x ( h a s n o t b e e n d o n e b e f o r e a n d
m a y m is s im p o r t a n t i n v e s t i g a t io n
a r e a s )
C ( i n te r n a t io n a l ly r e c o g n i s e d an d
u s e d b y a c a d e m ic s w o r ld w id e )
Ability to com pare results to
existing LCA studies
x ( n o t p o s s ib l e a s m e th o d o lo g y is
d i f f e r e n t )
C ( e a s y to c o m p a r e a s m e th o d o lo g y
w o u ld b e c o n s i s t e n t w i th e x i s t i n g
l i t e r a tu r e )
Ability to integrate results
into existing LCA studies to
better understand im pact o f
PET a n d Glass
x ( n o t p o s s i b l e a s m e th o d o lo g y is
d i f f e r e n t )
C ( e a s y to c o m p a r e a s m e th o d o lo g y
w o u ld b e c o n s i s t e n t w i th e x i s t i n g
l i t e r a tu r e )
40

Based on the table above, the research methodology approach criteria are best met by using an
LCA method as a guideline for conducting this research. It is important to highlight that
although an LCA method is used, this is not an LCA study. The LCA method is only applied
as a guideline to the packaging process life cycle stage of Glass and PET. Conducting a full
blown LCA falls outside of the scope of this study due to its complexity in terms of cost,
resources and time required to complete it. Furthermore, as majority of academic research
shows (refer to Literature Review Section 2), there's little clarity on the detailed environmental
cost for the packaging process of the two types of containers. Hence the research focuses on
this present literature uncertainty.
A special case for LCA is Product Carbon Footprint (PCF). PCF focuses on the impact of GHG
emissions only (i.e. GWP), as opposed to LCA which can consider many different
environmental impacts, and therefore it is better aligned with the goal and scope of this project,
because only the GWP is of interest.
(ISO 14040/14044, 2006), (World Resource Institute, 2013) are internationally recognised and
accepted standard in the field of LCAs and PCF used by academics worldwide, as shown
Section 2. The GHG protocol is selected to be used as a guide for conducting the research. A
comparison between the adopted approach and ISO protocols is not done as ISO standards
come at cost which is not budgeted for in this research.
The study analyses the core operation of a South African CSD manufacturing business i.e.
packaging process in Glass and PET containers only and therefore cannot be categorised as an
LCA. However, as discussed above, PCF approach is adopted as a guideline. The figure below
shows all major life cycle stages which can be considered when undertaking a LCA for a typical
CSD manufacturing business (Flanigan, et ah, 2013). The life cycle stage labelled “Packaged
goods manufacture” in Figure 15 was investigated, because it contains the packaging process
which is focus of this research.
41

product Life Cycle]
Figure 15: LCA stages for a typical packaging product (Flanigan, et at., 2013)
Figure 15 can be simplified, as shown in the diagram below. For the purposes of this research,
only the area highlighted in grey in Figure 16 is studied i.e. CSD packaging process in
PET/Glass containers.
Phase 1: From birth to Glass/ PET ■ Phase 2: Glass/PET packaging I Phase 3: From Glass/PET packaging packaging process ■ process ■ process to disposal/recyde
Figure 16: Summarised life cycle stages for Glass and PETfrom the point of view of the scope for this research
Phase 1: From birth to Glass/ PET packaging process
This phase is outside of the scope for this research and consists of all processes related to
acquiring the raw materials, their manufacture and all necessary transportation and storage of
PET and Glass containers in order for them to get to their respective CSD packaging line. It
must be noted that although the main packaging raw materials form part of this stage they are
still considered in the scope of the research in terms of their GWP contribution.
42
Phase 2: Glass/PET CSD packaging process
This is the life cycle stage considered in this research. The PCF of Glass and PET is for this
stage only. It deals with the packaging process of CSD in PET and Glass containers. The
starting point is when empty Glass and PET containers enter their respective packaging lines
and ends when these containers are filled, sealed, stacked on a pallet and ready to leave their
respective packaging lines e.g. a pallet at the exit conveyor of a palletiser ready to be collected
by a Forklift (FLT) to be allocated to the finished goods’ warehouse floor.
Phase 3: From Glass/PET CSD packaging process to disposal/recycle
This phase is outside of the scope for this research and consists of all the processes related to
storage and transportation of the packaged CSD Glass and PET containers from the time they
leave their respective packaging line to the time of their disposal/recycle.
4.1.1 The product systems and functionsThe product system is defined as the CSD PET and Glass packaging lines, which house the
packaging process. The function of the packaging line is to package (unpack, prepare for filling,
fill, seal, label and pack) CSD in Glass and PET containers by using a combination of highly
automated machinery. Glass packaging lines are different to PET packaging lines as they have
different process units.
4.1.2 Functional unitHectolitre (hi) is the volumetric functional unit selected for the study i.e. the study assesses the
environmental impact in terms of the GWP for the Glass and PET packaging process per hi of
CSD.
4.1.3 Product system boundariesThe packaging process on the Glass and PET packaging lines of the CSD manufacturing
business is the core operation of the business selected to be studied. Anything outside of the
packaging lines will not be considered, except GWP of the main packaging raw materials. The
packaging line starts when the empty Glass or PET container arrives at the line and ends when
the filled and sealed Glass or PET container leaves the packaging line. Energy inputs to the
unit processes will be traced back to energy point of origin in order to assess the environmental
impact of the packaging process as measured by GWP requirements.
43

4.1.4 Allocation procedures, types of impact and methodology of impact assessment(World Resource Institute, 2013) is the internationally used guideline to identify and quantify
the GHG emissions for the CSD packaging process in Glass and PET. Indirect and direct GHG
emissions (expressed in tonnes of CCFe) are considered for impact assessment. The method for
this impact assessment is as follows: (World Resource Institute, 2013)
1. Categorise the GHG emissions within the CSD packaging process for Glass and PET.
This will be done by mapping the elementary input of unit process which together form
the product system i.e. packaging line
a. Stationary combustion - combustion of fuels in stationary equipment such as
boilers on site
b. Mobile combustion (emissions due to mobile equipment used by the company)
- outside of the scope for this study, as explained in section 6.1.7
c. Process emissions - direct emissions generated by the unit processes of the
packaging process for Glass and PET
d. Fugitive emissions - intentional and unintentional emissions by equipment such
as compressors and boilers
2. Calculation approach - the technical, machine and factory specific, design
specifications of the unit processes are used to determine the theoretical input and
output of material and energy. Actual (metered) energy consumption was not used.
Documented emission factors and fuel use data are then used to obtain the carbon
content coefficients and hence calculate the GHG emissions of unit processes in the
packaging process for Glass and PET. Calculation tools provided by the (World
Resource Institute, 2013) are used as guidance and a generic calculation tool is
developed in MS Excel to obtain results
4.1.5 Data requirementsThe main data requirements used by this research are presented below. Appendix B contains a
more comprehensive description of data implications usually considered when undertaking a
PCF study.
4.1.5.1 Time, geographical and technical coverage
The latest, region specific factors such as type of coal used for energy generation, country of
origin and method of combustion as provided by (World Resource Institute, 2013) are used for
the study
44

4.1.5.2 Precision, completeness and representativeness of the data
Internationally recognised principles are adopted as a guideline for this research from (World
Resource Institute, 2013). The GHG emissions for the company are calculated using these
standards. All emission sources and activities and processes within the Glass and PET
packaging processes' boundary, which are relevant to the research questions, are captured to
ensure completeness. Transparency is ensured by addressing all relevant issues as well as
disclosing all assumptions and references used in this research. Thus it is ensured that the
calculated emissions are reflected on appropriately and the results will satisfy the decision
making needs of the business.
4.1.5.3 Consistency and reproducibility of the methods for the PCF
The calculation procedures for determining the environmental impact of the packaging process
for Glass are the same for the packaging process for PET. Data is collected using the same
method and from the same sources to ensure consistency of results. An MS Excel spread sheet
is developed for the calculation of the GHG emissions for the packaging process of Glass and
PET. The model construction and assumptions are clearly defined in this report such that the
business as well as academics may use it in the future to re-calculate new GHG emissions in
case of operational and/or technology improvements/changes and to conduct further research.
4.1.5.4 Data sources
Data on CCEe conversion factors is from credible sources such as (World Resource Institute,
2013). This data represents the latest and up to date numbers of GHG emissions. Furthermore,
data is obtained from specific sites, published sources and from the business production
facilities in Gauteng. The material and energy inputs to the unit processes are be obtained from
the technical specifications of the unit processes' OEM manuals. The energy requirement
calculation takes into account the different sources of energy used as well as the efficiency of
conversion and distribution of the energy flow. (ISO 14040, 2006)
4.1.5.5 Uncertainty of the information
Theoretical emission factors as provided by the (World Resource Institute, 2013) are used over
facility-specific emission factors (lack of such locally available factors). Theoretical technical
specifications of the unit processes of the packaging process for Glass and PET as provided by
the OEM manuals are used, which in reality may deviate from the actual values due to machine
degradation or modifications. After discussions with technical staff on site, it was assumed that
such deviations are minimal and that unit processes operate as per their specifications and
45

hence assumed to be the true consumption from the grid. This was done by measuring some of
the unit processes current drawn with a clamp ammeter. When site specific data is available,
(World Resource Institute, 2013) advises that an uncertainty analysis is not appropriate. Hence
for the most part the data collected for the study is site specific, an uncertainty analysis was not
done.
4.1.6 Assumptions of the researchThe study has the following assumptions. Some of the information is obtained from the
business, but there's no direct reference due to ethics reasons:
• Environmental impact due to material inputs into the packaging process such as Glass,
PET, closures, labels etc. will be obtained from published sources. These sources are
assumed to provide up to date, credible information, because of their use in other similar
LCA studies
• The return rate of Glass and HDPE plastic crates is assumed to be 97%, as provided by
the company
• The business would not change its sales profile i.e. PET and Glass containers sales will
remain the same in the near future. Hence, the business will find the information
provided by this research useful when developing its strategic plan
• As shown in the literature review, LCAs conducted for glass and PET show that there’s
no clear winner between the two in terms of overall environmental impact. The way
PET and Glass containers are manufactured in South Africa will not change in the near
future and hence only company specific changes in the handling of the two types of
containers in the CSD manufacturing process of the South African business will result
in “green” improvements
• Temporary technical faults, which cause more energy to be consumed by a unit
process/s on the Glass and PET packaging lines, are not taken into account. It is
assumed that these are short term and fixed by the business in due time
• All of the components on the packaging lines are operating as per their OEM
specifications
• The direct GHG emissions from the coal boilers required for steam generation for the
Glass packaging process are calculated using theoretical GHG emissions which would
occur when burning a 1kg of coal in a power station
46

• When calculating the raw materials GWP it is assumed that the relationship between
weight of the raw material and the corresponding GWP value is directly proportional,
as provided by literature
• 500ml PET container is the closest in comparison to a 300ml Glass container in terms
of the packaging lines’ sizes and their components. The other possible comparison of
1000ml PET and 1250ml Glass has a greater volumetric difference (250ml) than the
selected option (200ml) and hence is not selected for this research
• The losses made on the packaging lines are assumed to require the same amount of
effort to remove from the packaging lines, as provided by the business, and therefore
are not considered in the energy quantifications i.e. removal of waste from the
packaging lines is not taken into account
• The PET and glass containers considered are assumed to be best in class, which means
that there are no extra considerations with respect to energy quantifications that may
result as an effect from using a poor quality container
• The principal greenhouse gas emission associated with the production of purchased
electricity is CO2 (World Resource Institute, 2013) and hence it is the only gas
considered in the calculation of GHG emissions for purchased electricity
• Unit processes run at rated speeds during normal production on both Glass and PET
packaging lines, as verified by company technical staff
• Overheads are assumed to be the same for the Glass and PET CSD packaging lines
• Coal is used as the main purchased electricity fuel, because it is the main source of
energy generation in South Africa and because the business is assumed to get all of its
power from a coal-burning power station. Furthermore it is assumed that coal burners,
whether on site or in a boiler on site have similar performance i.e. it is assumed that
they operate at the same efficiencies and that the emissions from burning the same type
of coal in both would be the same (International Energy Agency, 2010)
• Container size is dictated by marketing constraints and hence the business is not
allowed to change the volumetric sizes of its PET and Glass containers
• The same unit processes on the Glass and PET packaging lines can run the different
SKU pack sizes with the required modification i.e. the same filler which fills 500ml
PET bottles, drawing the same power, but running at a slower speed would be able to
fill 2000ml PET
47
• The fugitive emissions associated with the 7 bar pressurised air, chilled and chlorinated
water are similar for both CSD packaging processes in Glass and PET containers and
hence are excluded from the analysis
4.1.7 Limitations of the researchThe limitations of the research follow below:
• Phases I and 3 as depicted by Figure 17 are not considered, with the exception of main
packaging raw materials
• Overhead energy consumptions such as packaging lines offices and lighting are not
considered in this research, because it is assumed that these are identical for both Glass
and PET packaging lines i.e. a Glass packaging line can be replaced by a PET line and
its overheads will stay the same
• The impact on the environment due to the construction of the packaging line building
is not considered
• The project uses PCF principles as defined by the (World Resource Institute, 2013) as
a guideline only due to cost, resources and time constraints
• Secondary packaging materials which are added to the PET/Glass containers and the
energy required to get them to the packaging line (e.g. CSD ingredients) are not
considered in this research. Only PCF of the main secondary packaging raw material
(bottle caps/crowns, shrink wrap, pallets, crates, labels and pallet wrap) in C0 2 e as
obtained from published sources is taken into account
• All Glass and PET functional system commonalities such as quality assurance stations
are excluded from the study
• The results of the study cannot be generalised to other businesses because each business
will have its own specific equipment as well as its own operational practices. The results
will only apply to the South African company in Gauteng selected for this research.
Nevertheless, other companies can use the research to get a general understanding of
CSD PCF. Due to its transparent nature the method can be used by academics to
conduct comparison studies in other businesses
• The impact of the ramp up process during production is not taken into account. Only
steady running state of unit processes is considered
• The energy used to supply unit processes with inputs to the packaging process in not
taken into account. For example, the energy to transport water to the blow moulder is
48
not considered in the calculations as it is assumed that it is a closed system with minimal
energy requirements
• The energy and carbon footprint required to manufacture, transport, install and
commission the unit processes to the manufacturing site in not taken into account
• The focus of the study is the direct energy consumed by machines forming part of the
packaging lines for PET and Glass. Only main energy consumers such as main utilities
(e.g. compressors) are taken into account
• The emission factors used for purchased electricity are obtained from (World Resource
Institute, 2013) and factors such as power station efficiency and power transmission
distances from the power station to the business under investigation are not taken into
account
• The peak power consumption and its effect on the business carbon tax is not in the
scope of this study
• When conducting the dynamic model analysis only the unit processes' CED and GWP
are compared, because obtaining all the details associated with the overall packaging
process for 2000ml PET and 1250ml Glass is outside of the scope for the study
• The impact on the environment is only considered in terms of global warming potential
(GWP) which is measured in CCEe and which can directly be related to carbon tax.
Other impacts such as:
o (ADP) - Abiotic depletion
o (AP) - Acidification
o (HTP) - Human toxicity
o (FAETP) - Fresh water toxicity
o (MAETP) - Marine water toxicity
o (POCP) - Photochemical oxidant creation
o (EP) - Eutrophication
o (TETP) - Terrestrial Eco toxicity
o (ODP) - Ozone depletion
o (POCP) - Photochemical oxidant creation
have not been measured
49

4.1.8 Critical reviewA critical review will not be conducted for this research. The author of this report has taken the
responsibility to ensure that the key principles and guidelines from (World Resource Institute,
2013) are adhered to when conducting the work.
50
5. Research MethodThe method undertaken for this research is as follows:
a. Setting the contexti. Research to understand the relationship between CED and GWP
a. Identify how CED for a certain process is measured i.e. what needs to be
considered when calculating the CED for a given product/service
b. Identify how CED relates to GHG emissions i.e. allocate GHG emissions to the
CED required for a given product/service
c. Identify the relationship between GHG emissions and GWP i.e. how are the
different GHGs expressed in terms of CCTe
b. Sample sectionii. Select a CSD manufacturing business in South Africa and identify two packaging lines
within the business, which package similar sized PET and Glass containers (one
packaging line for PET and one packaging line for Glass). Compare the volumetric
difference between the different Glass and PET containers and select the combination
with the lowest difference
iii. Process map the respective packaging lines (functional systems) (PET and returnable
glass) to identify all key unit processes (e.g. blow moulders, storage silo, conveyors,
labeller, filler, etc. on the PET packaging line and bottle washer, conveyors, filler, etc.
on the Glass packaging line). Key unit processes are directly involved in the packaging
process for CSD in Glass and PET containers. These are identified from packaging line
layouts and direct observations of the product system. All unit processes are expressed
separately (e.g. the two blow moulders on the PET packaging line are not combined) to
ensure that individual contributions can be identified and analysed
iv. Identify and list all main packaging raw materials (e.g. plastic crates, shrink wrap, etc.)
and utilities (e.g. steam, compressors) and map the connections between the main
packaging raw materials and utilities and all the identified unit processes for the Glass
and PET packaging lines
c. Data collection and model constructionv. Collect technical specifications for all the key unit processes for the Glass and PET
packaging lines such as operating speed per hour and power consumption from business
owned OEM manuals. Use the help of the electrical technician for the respective
51
packaging line to make sure that the correct information is obtained in full. Understand
the source of the energy consumed
vi. Consult the businesses’ utilities department to understand what the main utilities are
and in what quantities they are delivered to the unit processes. Determine the energy
source powering up these utilities
vii. Consult the business’ bill of materials to accurately determine the quantities of main
packaging raw materials used per the finished (fully packaged) PET and Glass container
viii. Triangulate the data by consulting with key business personnel on the operation of the
packaging lines to verify all unit process maps. Gather outstanding data from the
business
ix. Construct an MS Excel model, which incorporates relevant data collected in the steps
above, as well as information form published sources such as (World Resource
Institute, 2013) calculation tools to calculate the CED (kWh/hl) and GWP (gCCPe) for
the CSD packaging process in PET and Glass containers
a. Model inputs
A MS Excel calculation model is developed as part of the study to calculate the CED used by
the Glass and PET CSD packaging processes as well as their respective GHG emissions.
Analysis (for PET and Glass containers of different size) can be done by changing the inputs
of the model and quantity how CED and GWP will change. This is one of the main reasons for
building a dynamic model and not simply a table that sums the individual unit process
contributions for the respective CSD packaging process.
The inputs for the model are:
i. Glass and PET packaging container size (hi)
ii. Power consumption of Glass and PET CSD packaging processes' unit
processes (kW)
iii. Operating speed of Glass and PET CSD packaging processes' unit
processes during normal production (bph)
iv. Consumption (kWh) of main utilities per hi, as supplied by the business
v. Weight (grams) of main raw packaging materials for the finished (fully
packaged) Glass and PET container
vi. Conversion factors for the relationship between weight of coal and
power generation, obtained from the business
52

vii. GHG emissions for the main packaging raw materials, obtained from
literature (Amienyo, et al., 2013)
viii. GHG emission factors for purchased electricity for Glass and PET.
Emission factors are obtained from a calculation spread sheet as
provided by the (World Resource Institute, 2013), see Appendix D
b. Model development
The calculation logic used by the model to calculate the CED for the CSD PET and Glass
packaging processes’ unit processes is shown in Figure 17:
Figure 17: CED per functional unit calculation logic
The calculation logic for quantifying the GHG emissions and in consequence the GWP for the
CSD Glass and PET packaging processes’ main packaging raw materials in the model is based
on quantification principles as specified by (World Resource Institute, 2013). The process flow
diagram in Figure 18 depicts this logic.
Figure 18: Model GHG emissions in C02e calculation logic process flow
The equations for the calculations in the figure above are:
53
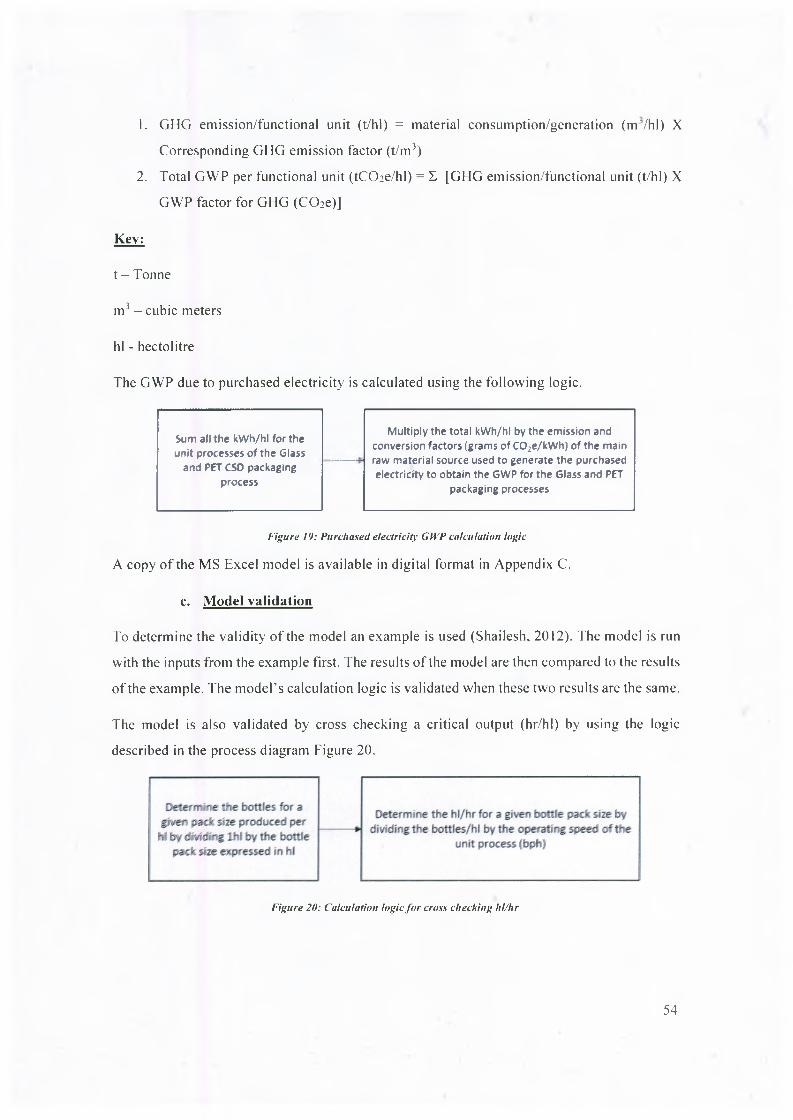
1. GHG emission/functional unit (t/hl) = material consumption/generation (m’/hl) X
Corresponding GHG emission factor (t/m3)
2. Total GWP per functional unit (tCCEe/hl) = X [GHG emission/functional unit (t/hl) X
GWP factor for GHG (CCEe)]
Key:
t - Tonne
m3 — cubic meters
hi - hectolitre
The GWP due to purchased electricity is calculated using the following logic.
Sum all the kWh/hl for the unit processes of the Glass
and PET CSD packaging process
Multiply the total kWh/hl by the emission and conversion factors (grams of C 02e/kWhj of the main raw material source used to generate the purchased electricity to obtain the GWP for the Glass and PET
packaging processes
Figure 19: Purchased electricity GWP calculation logic
A copy of the MS Excel model is available in digital format in Appendix C.
c. Model validation
To determine the validity of the model an example is used (Shailesh, 2012). The model is run
with the inputs from the example first. The results of the model are then compared to the results
of the example. The modePs calculation logic is validated when these two results are the same.
The model is also validated by cross checking a critical output (hr/hl) by using the logic
described in the process diagram Figure 20.
Figure 20: Calculation logic for cross checking lil/hr
54
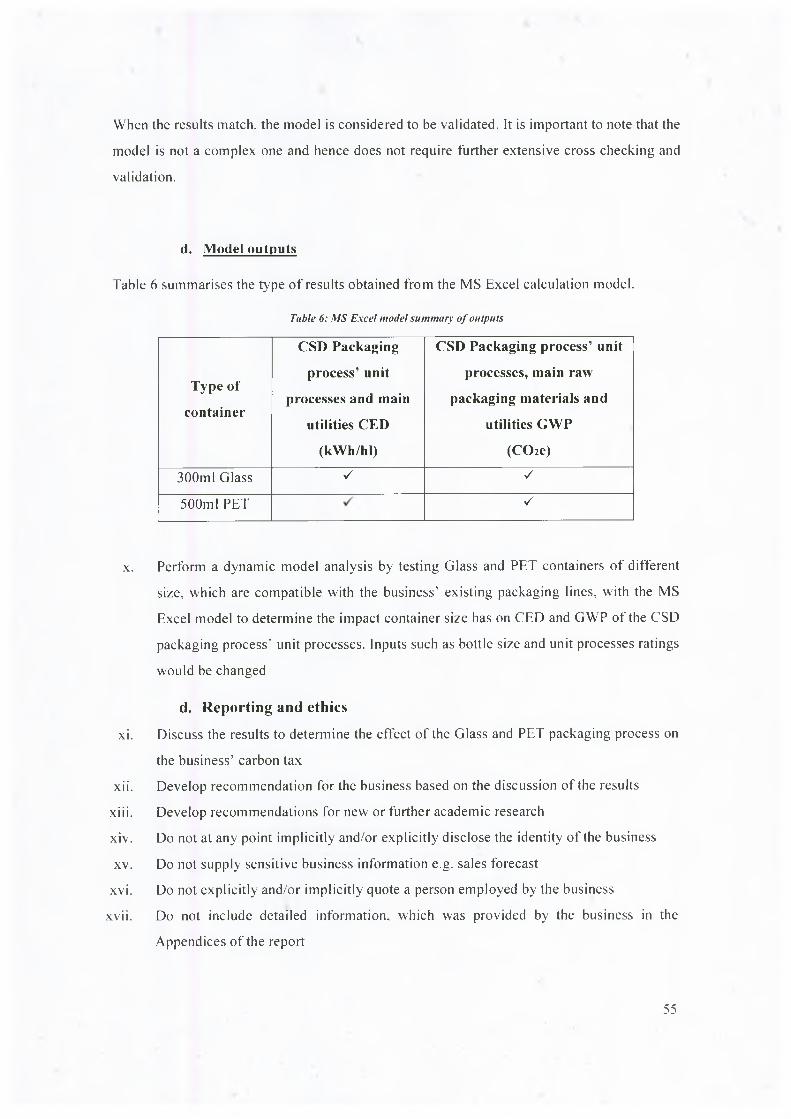
When the results match, the model is considered to be validated. It is important to note that the
model is not a complex one and hence does not require further extensive cross checking and
validation.
d. Model outputs
Table 6 summarises the type of results obtained from the MS Excel calculation model.
Table 6: MS Excel model summary of outputs
Type of container
CSD Packaging process’ unit
processes and main utilities CED
(kWh/hl)
CSD Packaging process’ unit processes, main raw
packaging materials and utilities GWP
(CChe)300ml Glass S y
500ml PET V
x. Perform a dynamic model analysis by testing Glass and PET containers of different
size, which are compatible with the business’ existing packaging lines, with the MS
Excel model to determine the impact container size has on CED and GWP of the CSD
packaging process' unit processes. Inputs such as bottle size and unit processes ratings
would be changed
d. Reporting and ethicsxi. Discuss the results to determine the effect of the Glass and PET packaging process on
the business’ carbon tax
xii. Develop recommendation for the business based on the discussion of the results
xiii. Develop recommendations for new or further academic research
xiv. Do not at any point implicitly and/or explicitly disclose the identity of the business
xv. Do not supply sensitive business information e.g. sales forecast
xvi. Do not explicitly and/or implicitly quote a person employed by the business
xvii. Do not include detailed information, which was provided by the business in the
Appendices of the report
55

xviii. Express the results per functional unit such that the sales of the business remain
confidential
xix. Copy the MS Excel model on a CD such that it is electronically available
xx. Provide the business with a copy of the report, upon request
xxi. Return raw documentation obtained from the business back to the business
56
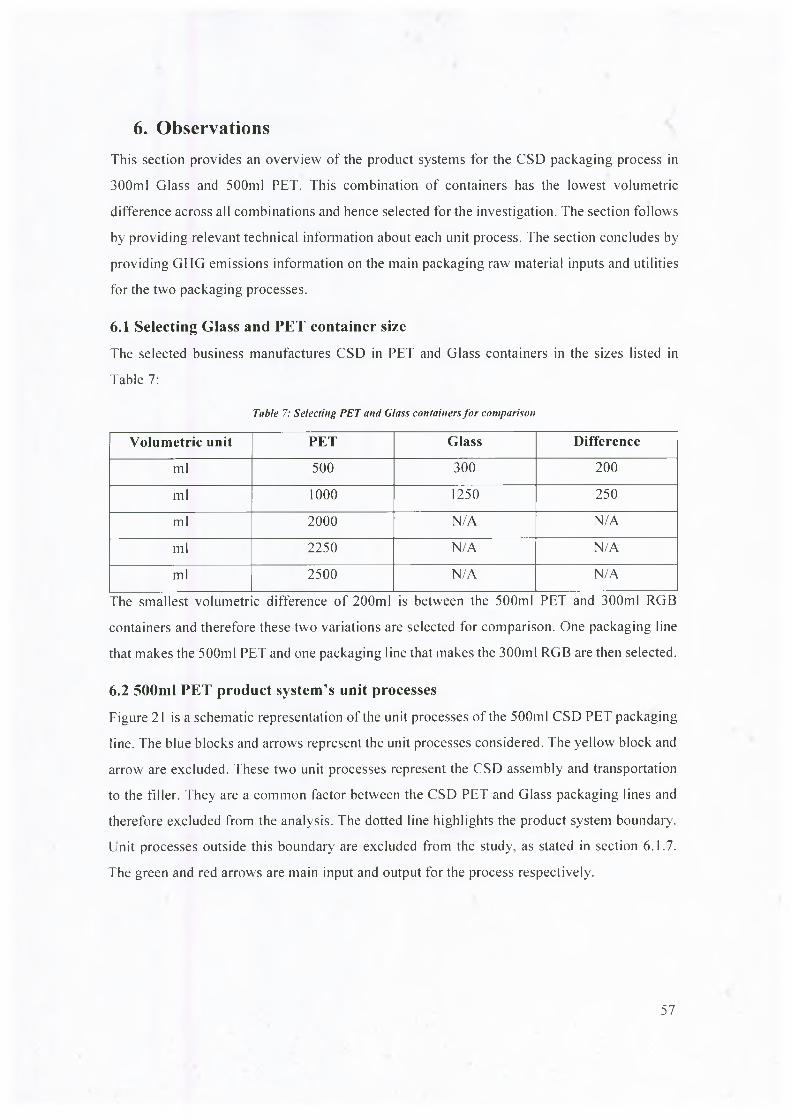
6. ObservationsThis section provides an overview of the product systems for the CSD packaging process in
300ml Glass and 500ml PET. This combination of containers has the lowest volumetric
difference across all combinations and hence selected for the investigation. The section follows
by providing relevant technical information about each unit process. The section concludes by
providing GHG emissions information on the main packaging raw material inputs and utilities
for the two packaging processes.
6.1 Selecting Glass and PET container sizeThe selected business manufactures CSD in PET and Glass containers in the sizes listed in
Table 7:
Table 7: Selecting PET and Glass containers for comparison
Volumetric unit PET Glass Differenceml 500 300 200
ml 1000 1250 250
ml 2000 N/A N/A
ml 2250 N/A N/A
ml 2500 N/A N/A
The smallest volumetric difference of 200ml is between the 500ml PET and 300ml RGB
containers and therefore these two variations are selected for comparison. One packaging line
that makes the 500ml PET and one packaging line that makes the 300ml RGB are then selected.
6.2 500ml PET product system’s unit processesFigure 21 is a schematic representation of the unit processes of the 500ml CSD PET packaging
line. The blue blocks and arrows represent the unit processes considered. The yellow block and
arrow are excluded. These two unit processes represent the CSD assembly and transportation
to the filler. They are a common factor between the CSD PET and Glass packaging lines and
therefore excluded from the analysis. The dotted line highlights the product system boundary.
Unit processes outside this boundary are excluded from the study, as stated in section 6.1.7.
The green and red arrows are main input and output for the process respectively.
57
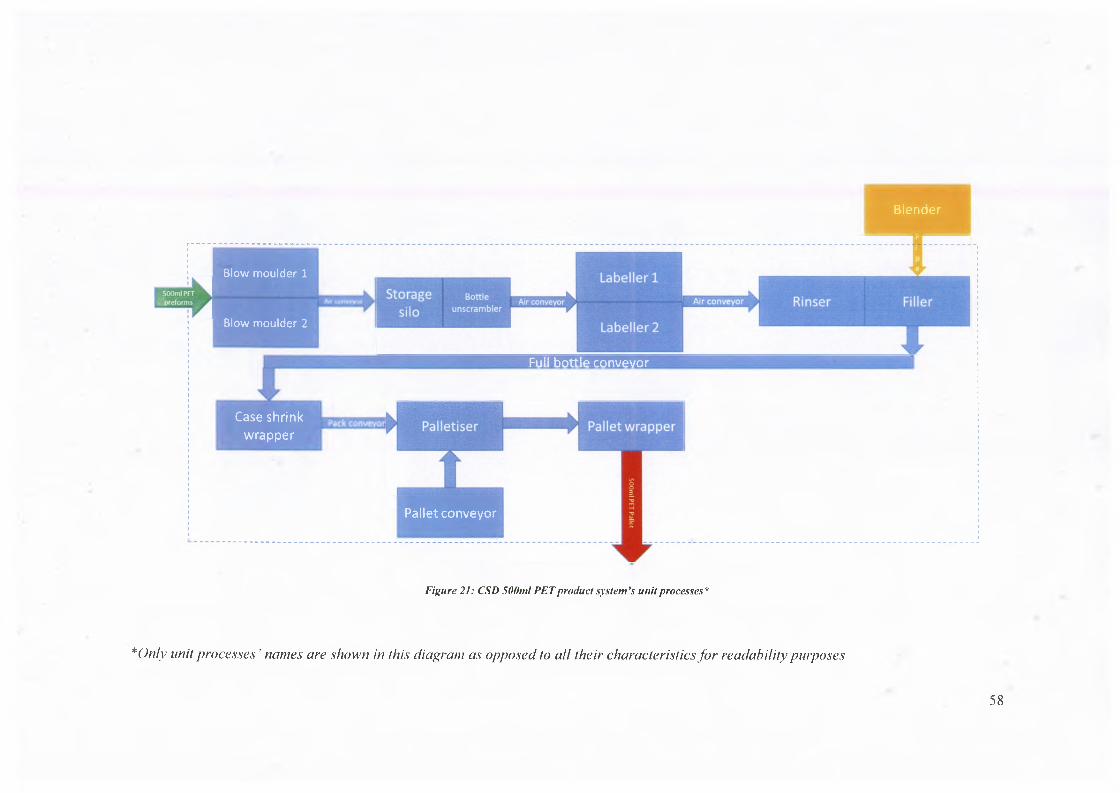
Blender
Blow m oulder 1
Blow m oulder 2
Full bottle conveyor
C" o c a c h r i m l /L.dbc bnririK wrapper
Pallet conveyor
Figure 21: CSD 500ml PET product system’s unit processes*
*Only unit processes ’ names are show n in this diagram as opposed to all their characteristics fo r readability purposes
58

Table 8 up to Table 19 contain all the relevant information regarding the CSD 500ml PET unit
processes. Bph - bottles per hour
Table 8: Blow moulder 1 process summary
BLOW MOULDER 1
Function
To convert PET preforms to blown bottles
through a series of heating and blow
moulding operations
Operating speed (bph) 18 000
M aterial input 500ml PET preform
P ow er consum ption (kW) * 120
C om pressed air (bar) 40
Water 8-10°C chilled water via NH3 cooler
Output Blown 500ml PET bottle
* This is the true consumption from the grid (p ease see section 4.1.5.5)
Table 9: Blow moulder 2 process summary
BLOW MOULDER 2
Function
To convert PET preforms to blown bottles
through a series of heating and blow
moulding operations
Operating speed (bph) 20 400
M aterial input 500ml PET preform
Pow er consum ption (kW) * 122.4
C om pressed air (bar) 40
Water 8-10°C chilled water via NH3 cooler
Output Blown 500ml PET bottle
* This is the true consumption from the grid
59

T able II): A ir c o n v e y o r s u n it s ilo p ro c e s s su m m a ry
Air conveyor 1 (blow moulders to silo, silo, silo to labellers, labellers to filler)*
Function
To transport blown bottles from the blow
moulders to the buffer storage silo. To
transport bottles from the silo to the
labellers and from the labellers to the filler.
Operates via electric motors
Operating speed (bph) 40 000
Pow er consum ption (kW)** 98
C om pressed air (bar) 7
Output Blown 500ml PET bottle
* The motors on these conveyors and storage silo are identical. This table represents the sum
of all the motors
** This is the true consumption from the grid
Table II: Bottle unscrambler process summary
Bottle unscrambler
FunctionTo un-scramble blown bottle from the silo
and supply them to air conveyor 2
O perating speed (bph) 54 000
Pow er consum ption (kW) * 4.6
Com pressed air (bar) 7
Output Blown 500ml PET bottle
* This is the true consumption from the grid
Table 12: Labeller 1 process summary
Labeller 1Function To glue a label on a 500ml blown bottle
O perating speed (bph) 40 000
M aterial input Blown 500ml PET bottle. Plastic labels
Pow er consum ption (kW) * 65
Com pressed air (bar) 7
Output Labelled 500ml PET blown bottle
* This is the true consumption from the grid
60

T ab le 13: L a b e lle r 2 p r o c e s s su m m a ry
Labeller 2Function To glue a label on a 500ml blown bottle
O perating speed (bph) 40 000
M aterial input Blown PET bottle. Plastic labels
Pow er consum ption (kW) * 65
C om pressed air (bar) 7
Output Labelled 500ml PET blown bottle
* This is the true consumption from the grid
Table 14: Rinser and Filler process summary
Rinser and Filler
FunctionTo rinse, fill and seal blown and labelled
500ml PET bottles
O perating sp eed (bph) 40 000
M aterial inputBlown labelled 500ml PET bottle, plastic
cap
Pow er consum ption (kW) * 38.38
C hlorinated water (ml) 50
Com pressed air (bar) 7
OutputLabelled, filled and sealed 500ml PET
bottle
* This is the true consumption from the grid
Table 15: Bottle conveyor process summary
Bottle conveyor (filler to case shrink wrapper)
Function
To transport filled, labelled and sealed
500ml PET bottles from the filler to the case
shrink wrapper. Operates via electric motors
O perating speed (bph) 86 400
Pow er consum ption (kW) * 18.5
C om pressed air (bar) 7
Output Filled, labelled and sealed 500ml PET bottle
* This is the true consumption from the grid
61

T able 16: C a se sh r in k w ra p p e r p r o c e s s su m m a ry
Case shrink wrapper
FunctionTo shrink wrap 24 labelled, filled and sealed
500ml PET bottles into a case of 24 bottles
O perating speed (bph) 48 960
M aterial input Plastic shrink wrap
P ow er consum ption (kW) * 215
C om pressed air (bar) 7
Output1 case of 24 labelled, filled and sealed
500ml PET bottles
* This is the true consumption from the grid
Table 17: Pack conveyor process summary
Pack conveyor (case shrink wrapper to palletiser
Function
To transport a case of 24 shrink wrapped
labelled, filled and sealed 500ml PET
bottles to the palletiser
Operating speed (bph) 86 400
Pow er consum ption (kW) * 38
C om pressed air (bar) 7
OutputA case of filled, labelled and sealed 500ml
PET bottles
* This is the true consumption from the grid
Table 18: Palleliser process summary
Palletiser
Function
To create a full pallet out of 75 shrink wrap
cases of labelled, filled and sealed 500ml
PET bottles
Operating speed (bph) 72 000
M aterial input Wooden pallets
Pow er consum ption (kW) * 48.5
C om pressed air (bar) 7
62

Output
1 pallet of 75 shrink wrapped cases of
labelled, filled and sealed 500ml PET
bottles
* Power for the palletiser and the pallet conveyor and reflects true consumption from the grid
Table 19: Pallet wrapper process summary
Pallet stretch wrapper
Function
To stretch wrap a full pallet of 75 shrink
wrapped cases each with 24 labelled, filled
and sealed 500ml PET bottles
O perating speed (bph) 196 360
M aterial input Plastic stretch wrap
Pow er consum ption (kW) * 12
C om pressed air (bar) 7
Output
1 stretch wrapped pallet of 75 shrink
wrapped cases of labelled, filled and sealed
500ml PET bottles
* This is the true consumption from the grid
6.3 300ml RGB product system’s unit processesFigure 22 is a schematic representation of the unit processes of the 300mi CSD RGB packaging
line. The blue blocks and arrows represent the unit processes considered. The yellow block and
arrow are excluded. These two unit processes represent the CSD assembly and transportation
to the filler. They are a common factor between the CSD PET and Glass packaging lines and
therefore excluded from the analysis. The dotted line highlights the product system boundary.
Unit processes outside this boundary are excluded from the study, as stated in section 6.1.7.
The green and red arrows are main input and output for the process respectively.
63
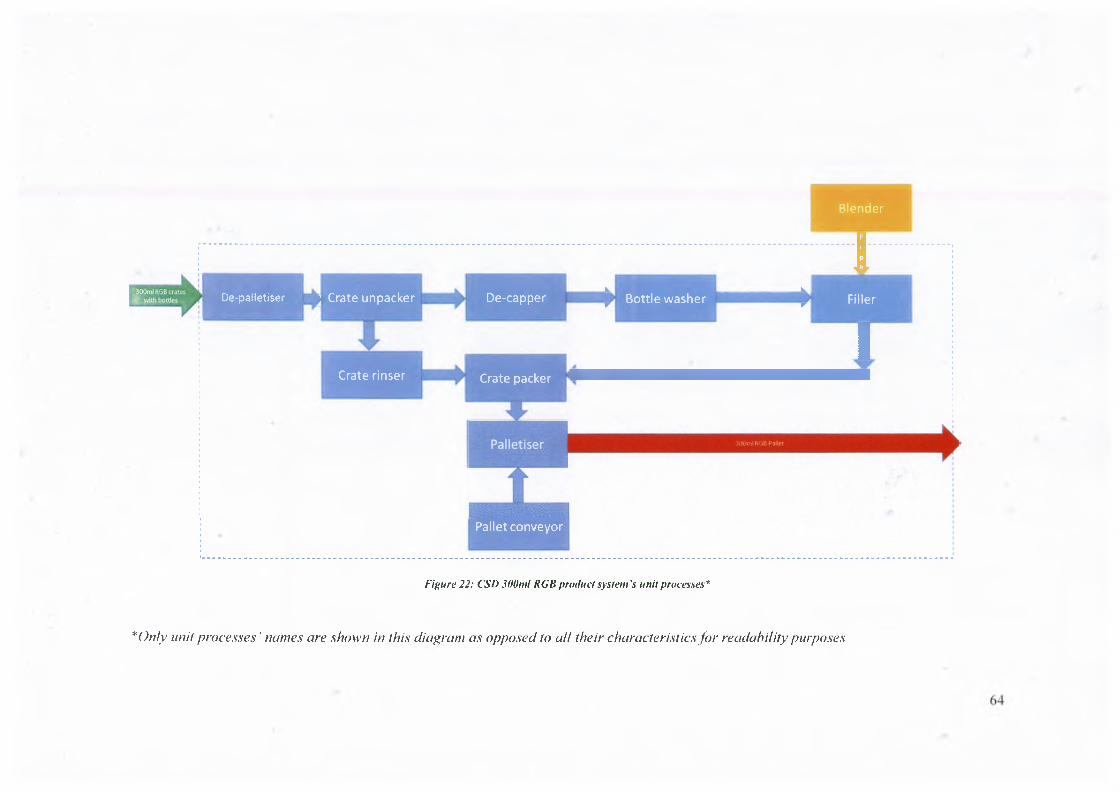
Blender
I
Oe-palletiser j Crate unpacker
Crate rinser
............ k .....................................k 1De-capper Bottle washer FillerV r
1Crate packer
Pallet conveyor
Figure 22: CSD 300ml RGB product system's unit processes*
*Only unit processes ’ names are show n in this diagram as opposed to all their characteristics fo r readability purposes

Table 20 until Table 28 contain all the relevant information regarding the 300ml RGB unit
processes.
Table 21): De-palletiser process summary
De-palletiser
FunctionTo break down a pallet of 60x300ml RGB
plastic crates into crates with empty bottles
O perating speed (bph) 53 700
M aterial inputPallet of 300ml RGB plastic crates with
empty 300ml RGB bottles
Pow er consum ption (kW) * 27.74
C om pressed air (bar) 7
Output300ml RGB plastic crate with 24 empty
300ml RGB bottles
* Includes the pallet conveyor power consumption and is the true consumption from the grid
Table 21: Crate unpacker process summary
Crate unpacker
FunctionTo take out the empty 300ml RGB bottles
out of the 300ml RGB plastic crate
O perating speed (bph) 45 000
M aterial input300ml RGB plastic crate with 300ml empty
RGB bottles
P ow er consum ption (kW) * 15.00
C om pressed air (bar) 7
OutputEmpty 300ml RGB Plastic crate and
24 empty 300ml RGB bottles
* This is the true consumption from the grid
65
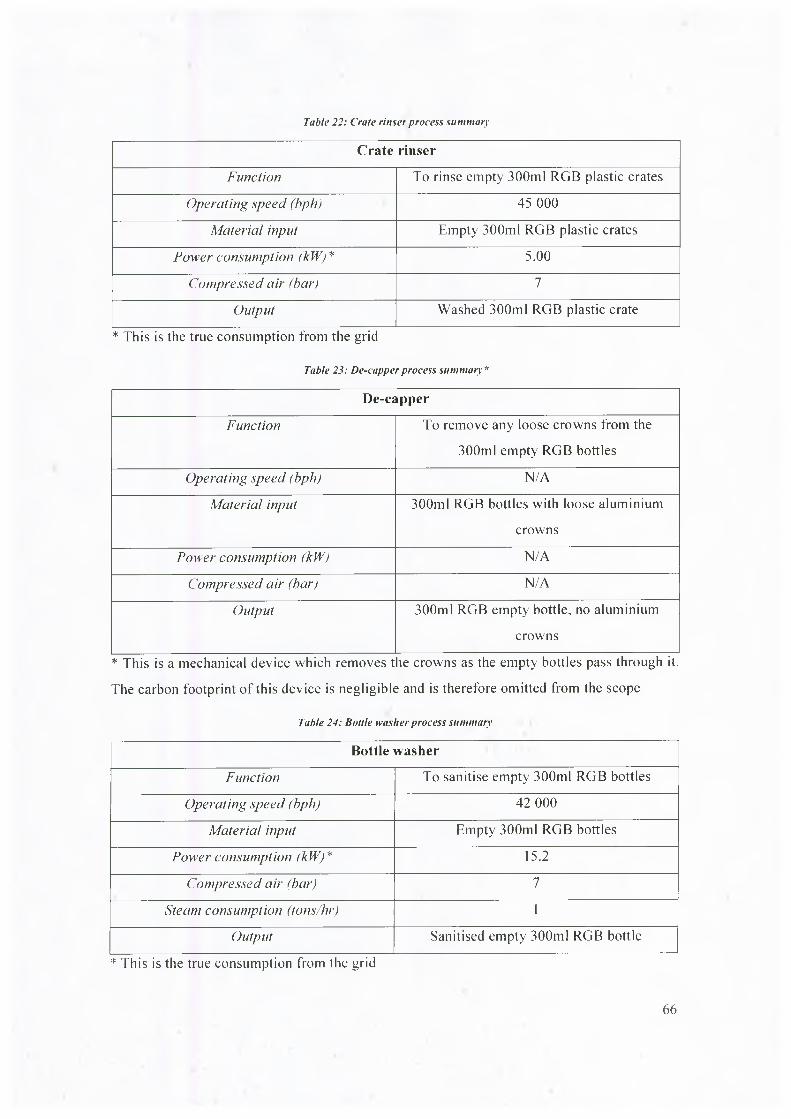
T ab le 2 2 : C ra te r in s e r p r o c e s s su m m a ry
Crate rinserFunction To rinse empty 300ml RGB plastic crates
O perating speed <bph) 45 000
M aterial input Empty 300ml RGB plastic crates
P ow er consum ption (kW) * 5.00
Com pressed air (bar) 7
Output Washed 300ml RGB plastic crate
* This is the true consumption from the grid
Table 23: De-cupper process summary*
De-capperFunction To remove any loose crowns from the
300ml empty RGB bottles
O perating speed (bph) N/A
M aterial input 300ml RGB bottles with loose aluminium
crowns
P ow er consum ption (kW) N/A
Com pressed air (bar) N/A
Output 300ml RGB empty bottle, no aluminium
crowns
* This is a mechanical device which removes t le crowns as the empty bottles pass through it.
The carbon footprint of this device is negligible and is therefore omitted from the scope
Table 24: Bottle washer process summary
Bottle washerFunction To sanitise empty 300ml RGB bottles
Operating speed (bph) 42 000
M aterial input Empty 300ml RGB bottles
Pow er consum ption (kW) * 15.2
Com pressed air (bar) 7
Steam consum ption (tons/hr) 1
Output Sanitised empty 300ml RGB bottle
* This is the true consumption from the grid
66

T ab le 2 5 : F ille r p r o c e s s su m m a ry
Filler
FunctionTo fill and seal empty 300ml RGB bottles
with CSD
O perating speed (bph) 36 000
M aterial inputEmpty 300ml RGB bottles and aluminium
crowns
Pow er consum ption (kW) * 7.60
Com pressed air (bar) 7
Output Filled and sealed 300ml RGB bottle
* This is the true consumption from the grid
Table 26: Crate packer process summary
Crate packer
Function
To pack 24 filled and sealed 300ml RGB
bottles into washed 300ml RGB plastic
crates
Operating speed (bph) 40 000
M aterial inputWashed, empty 300ml RGB crates and
filled and sealed 300ml RGB bottles
Pow er consum ption (kW) * 15.00
C om pressed air (bar) 7
Output300ml RGB plastic crate with 24 filled and
sealed 300ml RGB bottles
* This is the true consumption from the grid
67

T a b le 2 7 : C ra te p a c k e r p r o c e s s su m m a r y
Palletiser
Function
To stack 60 crates of 300ml RGB plastic
crates with 24 300ml RGB filled and sealed
bottles onto a pallet
Operating speed (bph) 47 000
M aterial inputFilled and sealed 300ml RGB bottles into
300ml RGB plastic crates, wooden pallets
Pow er consum ption (kW) * 36.48
C om pressed air (bar) 7
Output
A pallet of 60 crates of 300ml RGB plastic
crates with 24 300ml RGB filled and sealed
bottles
* Includes crate conveyor power consumption and is the true consumption from the grid
Table 28: Bottle conveyors process summary
Bottle conveyors*
Function
Transport empty and filled 300ml RGB
bottles and empty and filled 300ml RGB
plastic crates around the packaging line
O perating speed (bph) 40 000
M aterial inputEmpty and filled 300ml RGB bottles and
empty and filled 300ml RGB plastic crates
Power consum ption (kW )** 79.2
C om pressed (bar) 7
O utputEmpty and filled 300ml RGB bottles and
empty and filled 300ml RGB plastic crates
* All conveyors are powered by identical electric motors
** This is the true consumption from the grid
6.4 Process emissionsThere are no direct process emissions i.e. none of the unit processes for the packaging of CSD
in Glass and PET emit GHGs during their operations. For example the blow moulder does not
emit any GHGs during its normal production operation.
68
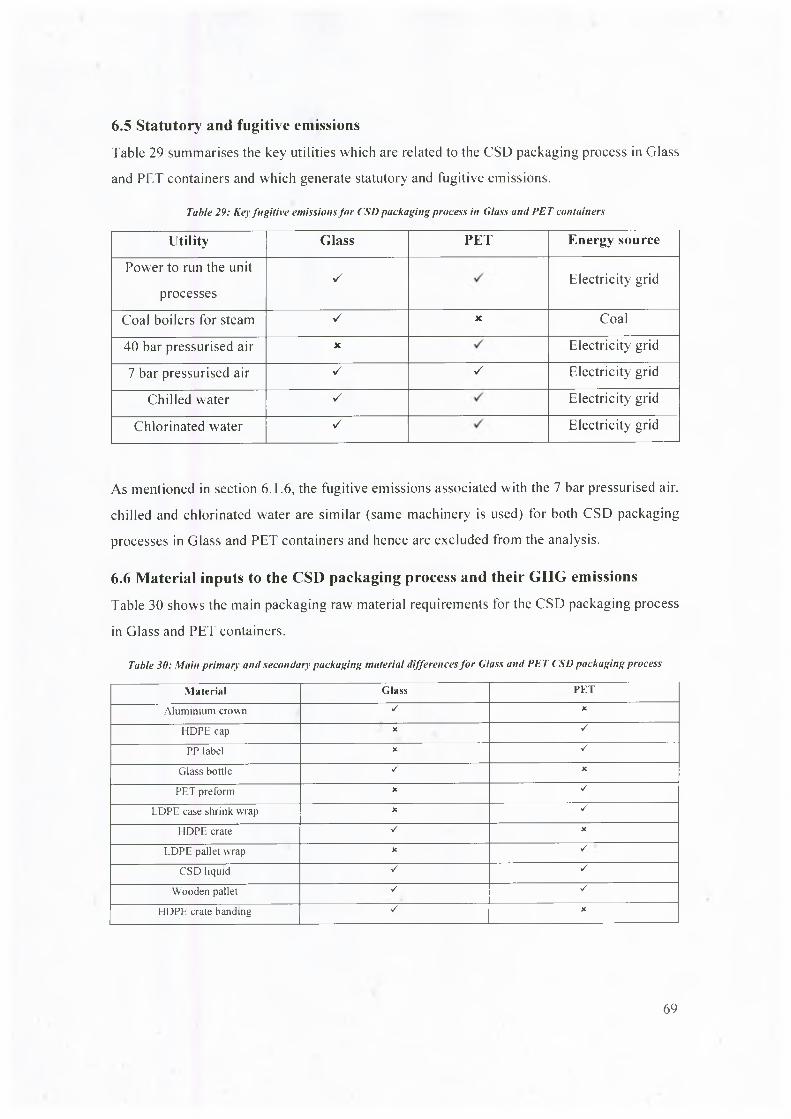
6.5 Statutory and fugitive emissionsTable 29 summarises the key utilities which are related to the CSD packaging process in Glass
and PET containers and which generate statutory and fugitive emissions.
Table 29: Key fugitive emissions for CSD packaging process in Glass and PET containers
Utility Glass PET Energy sourcePower to run the unit
processesV Electricity grid
Coal boilers for steam V X Coal
40 bar pressurised air X Electricity grid
7 bar pressurised air V V Electricity grid
Chilled water V Electricity grid
Chlorinated water S Electricity grid
As mentioned in section 6.1.6, the fugitive emissions associated with the 7 bar pressurised air,
chilled and chlorinated water are similar (same machinery is used) for both CSD packaging
processes in Glass and PET containers and hence are excluded from the analysis.
6.6 Material inputs to the CSD packaging process and their GHG emissionsTable 30 shows the main packaging raw material requirements for the CSD packaging process
in Glass and PET containers.
Table 30: Main primary and secondary packaging material differences for Glass and PET CSD packaging process
M a t e r i a l G la s s P E T
Aluminium crown ✓ X
HDPE cap X V
PP label X -2
Glass bottle ✓ X
PET preform X ✓
LDPE case shrink wrap X s
HDPE crate s X
LDPE pallet wrap X V
CSD liquid V V
W ooden pallet s V
HDPE crate banding V X
69
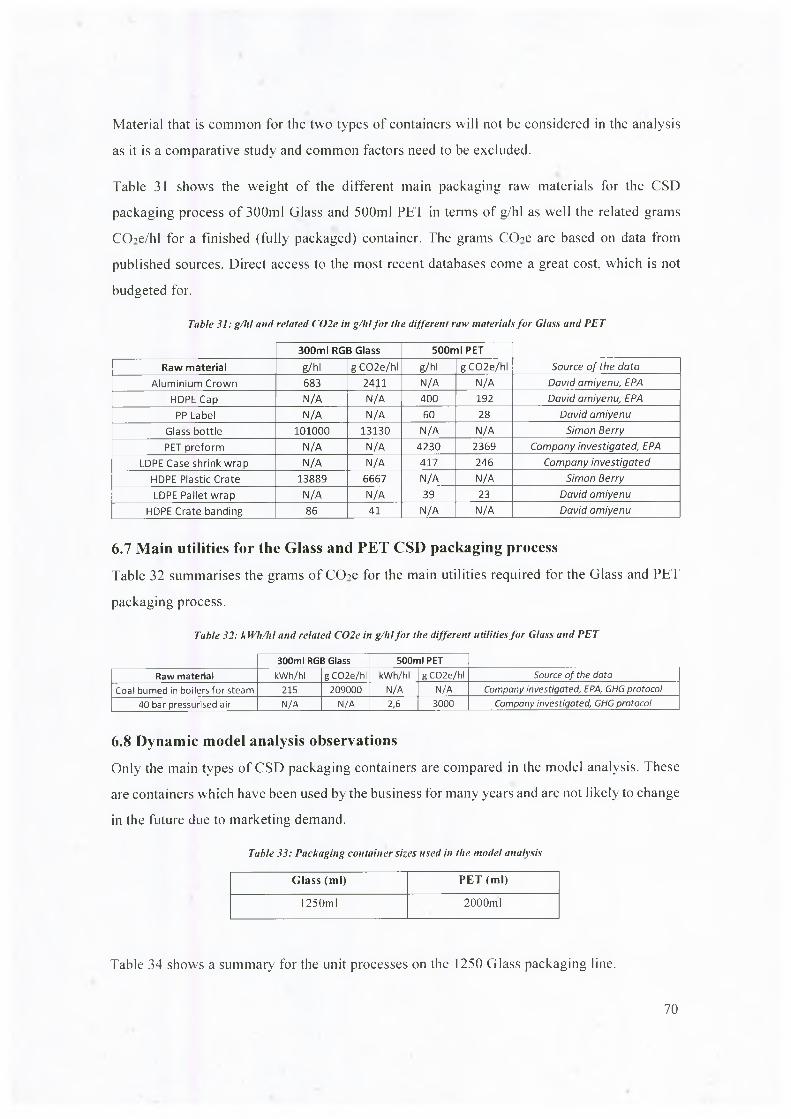
Material that is common for the two types of containers will not be considered in the analysis
as it is a comparative study and common factors need to be excluded.
Table 31 shows the weight of the different main packaging raw materials for the CSD
packaging process of 300ml Glass and 500ml PET in terms of g/hl as well the related grams
CCEe/hl for a finished (fully packaged) container. The grams CCTe are based on data from
published sources. Direct access to the most recent databases come a great cost, which is not
budgeted for.
Table 31: g/hl anil related C02e in g/lilfor the different raw materials for Glass and PET
3 0 0 m l R G B G la s s 5 0 0 m l P E T
R a w m a t e r ia l g/hl g C02e/hl g/hl g C02e/hl S o u r c e o f th e d a ta
Aluminium Crown 683 2411 N/A N/A D a v id a m iy e n u , E P A
HDPECap N/A N/A 400 192 D a v id a m iy e n u , E P A
PP Label N/A N/A 60 28 D a v id a m iy e n u
Glass bottle 101000 13130 N/A N/A S im o n B e r r y
PET preform N/A N/A 4230 2369 C o m p a n y in v e s t ig a t e d , E P A
LDPE Case shrink wrap N/A N/A 417 246 C o m p a n y in v e s t ig a t e d
HDPE Plastic Crate 13889 6667 N/A N/A S im o n B e r r y
LDPE Pallet wrap N/A N/A 39 23 D a v id a m iy e n u
HDPE Crate banding 86 41 N/A N/A D a v id a m iy e n u
6.7 Main utilities for the Glass and PET CSD packaging processTable 32 summarises the grams of CCTe for the main utilities required for the Glass and PET
packaging process.
Table 32: kWh/hl and related C02e in g/hl for the different utilities for Glass and PET
3 0 0 m l R G B G la s s 5 0 0 m l P E T
R a w m a t e r ia l k W h /h l g C 0 2 e /h l k W h /h l g C 0 2 e /h l Sou rce o f the data
C o a l burned in boilers fo r steam 215 209000 N /A N /A Com pany in vestig a te d , EPA , GHG p ro to co l
40 bar pressurised air N /A N /A 2,6 3000 Com pany in vestiga ted , GHG pro to co l
6.8 Dynamic model analysis observationsOnly the main types of CSD packaging containers are compared in the model analysis. These
are containers which have been used by the business for many years and are not likely to change
in the future due to marketing demand.
Table 33: Packaging container sizes used in the model analysis
G l a s s ( m l ) P E T ( m l )
1250m l 2000m l
Table 34 shows a summary for the unit processes on the 1250 Glass packaging line.
70

T able 3 4 : 1 2 5 0 m l G la ss p a c k a g in g p r o c e s s ' u n it p ro c e ss e s
UNIT PROCESS POWER CONSUMPTIONS SPEED POWER SOURCE
De-palletiser kW 27,74 bph 26850 Purchased ElectricityCrate unpacker kW 15 bph 22500 Purchased Electricity
Crate rinser kW 5 bph 22500 Purchased ElectricityBottle washer kW 15,2 bph 21000 Purchased Electricity
Filler kW 7,6 bph 18000 Purchased ElectricityCrate packer kW 15 bph 20000 Purchased Electricity
Palletiser kW 36,48 bph 23500 Purchased ElectricityBottle conveyors kW 79,2 bph 20000 Purchased Electricity
The bottle washer on the 300ml RGB line is the same for the 1250ml RGB. However, the speed
of the bottle washer is reduced when running the larger 1250ml RGB.
Table 35 shows a summary for the unit processes on the 2000ml PET packaging line.
Table 35: 2000ml PET packaging process' unit processes
UNIT PROCESS POWER CONSUMPTIONS SPEED POWER SOURCE
Blow moulder 1 power kW 120 bph 10800 Purchased ElectricityBlow moulder 2 power kW 122,4 bph 12240 Purchased ElectricityAir conveyor and silo kW 98 bph 24000 Purchased Electricity
Unscrambler kW 4,6 bph 32400 Purchased ElectricityLabeller 1 kW 65 bph 24000 Purchased ElectricityLabeller 2 kW 65 bph 24000 Purchased Electricity
Rinser and filler kW 38,38 bph 24000 Purchased ElectricityBottle conveyor kW 18,5 bph 51840 Purchased Electricity
Case shrink wrapper kW 215 bph 29376 Purchased ElectricityPack conveyor kW 38 bph 51840 Purchased Electricity
Palletiser kW 48,5 bph 43200 Purchased ElectricityStretch wrapper kW 12 bph 117816 Purchased Electricity
The packaging raw materials and the main utilities for the 1250ml Glass and the 2000ml PET
are almost identical to the 300ml Glass and 500ml PET, respectively, with the sole exception
of the container size and 1250ml Glass plastic cap.
71

7. Results and DiscussionThe purpose of this section is to review the CED and GWP results with respect to the Glass
and PET CSD packaging processes. Initially unit processes' CED and GWP are analysed. This
is followed by examining the main packaging raw materials’ GWP for the two processes.
Afterwards, the main utilities' CED and GWP are compared and discussed. Finally the overall
CED and GWP in terms of direct and indirect contributions for the two packaging processes
are analysed.
7.1 PET and Glass CSD packaging process unit processes’ CEDThe CED in terms of kWh/hl for the 500ml PET CSD packaging process' unit processes is
shown in Figure 23:
500ml PET packaging process' unit processes
Figure 23: 500ml PET CSD packaging process ’ unit processes CED
The total CED for the 500ml PET CSD packaging process as a result of unit processes alone is
calculated to be 5.04kWh/hl. Purchased electricity is used as an energy supply for all the unit
processes on the PET CSD packaging line. The blow moulders consume the most kWh/hl,
l.33kWh/hl and 1.2kWh/hl, respectively. This amounts to 50% of the CED. The case shrink
wrapper, which consumes 0.88kWh/hl, amounts to 18% of the CED. Together the blow
moulders and the case shrink wrapper contributes to 68% of the CED for the 500ml PET CSD
packaging process. Therefore, business efforts in reducing the energy consumption in these
unit processes will be significant in bringing the CED down.
72

These types of machines require a tremendous amount of electricity to heat up electrical
components which in turn generate heat which is used for production. Research points out that
packaging line machinery OEMs corporations like Sidel, are encouraging the use of PET
through their continuous breakthrough technologies which include innovations such as eco-
ovens, reducing energy requirement by up to 45%, (Sidel, 2015). The business can consider
replacing the heating elements in its blow moulders and case shrink wrapper with more
efficient ones, which will consume less energy.
The speed of the case shrink wrapper (48 960bph) is 22% higher than the bottleneck's speed
(40 OOObph). During the research it was observed that the case shrink wrapper is often left
operating at full capacity. The faster the case shrink wrapper runs, the faster it needs to heat
the plastic shrink wrap over the bottles and hence it requires more power. Therefore,
conducting a further study, which focuses on determining the optimum case shrink wrapper
operating speed, may result in energy reductions.
The energy breakdown for the 300ml CSD Glass packaging process" unit processes is shown
in Figure 24:
0,70 0,66
Figure 24: 300ml Glass CSD packaging process ’ unit processes CED
The total CED for the 300ml Glass CSD packaging process as a result of unit processes alone
is calculated to be 1.56kWh/hl. Purchased electricity is used as an energy supply for all the unit
processes on the Glass CSD packaging line. The bottle conveyors consume the most -
0.66kWh/hl. This amounts to 42% of the CED. The bottle conveyors, which transport the Glass
73

bottles from one unit process to another, are powered by electric motors. Replacing existing
electric motors with more efficient equivalents will have the biggest impact in reducing CED.
Figure 25 shows the number of unit processes for PET and Glass CSD packaging process.
500ml PET unit processes 300ml Glass unit processes
Figure 25: Unit processes for the PET and Glass CSD packaging processes
500ml PET CSD packaging process has 12 unit processes while 300ml Glass CSD packaging
process has 8 unit processes. The business can try and optimise the number of unit processes
on its PET packaging line by designing the unit processes better around the packaging line
bottleneck (filler). This will eliminate the need for the silo, bottle unscrambler and some
electric motors, which are currently used to compensate for the flaw in design and in turn
reduce the CED for the PET packaging process.
Figure 26 compares the CED for the PET and Glass CSD packaging process' unit processes.
6
5
4
2
1
0
5.04
PACKAGING PROCESS ENERGY PACKAGING PROCESS ENERGY CONSUMPTION/HL 500ml PET CONSUMPTION/HL 300ml GLASS
Figure 26: 500ml PET vs. 500ml Glass CSD packaging process ’ unit processes CED from purchased electricity
The total CED from purchased electricity for the PET CSD packaging process is 5.04kWh/hl
and 1.56kWh/hl for Glass. 3.2 times more purchased electricity is used by the unit processes
on the PET packaging line than the unit processes on the Glass packaging line. Therefore,
74

packaging CSD in PET is a lot more energy intensive than packaging CSD in Glass. Based
solely on this result, the business should convert all of its packaging lines to Glass. As
mentioned earlier this will only be the case if no energy efficiency improvements and/or
alternative energy sources are used. However, the business should not do the conversion based
solely on the unit processes’ CED result, but rather evaluate the CED for the whole process.
The impact on the business’ carbon tax as a result of the CED for the CSD packaging processes
in Glass and PET is zero. This is because carbon tax is only applicable to direct emissions from
the process. The upstream supplier will be the one directly affected by carbon tax as it incurs
direct emissions from burning coal to generate power. Therefore the business will be indirectly
affected as upstream supplier may increase the cost of its service to compensate for its incurred
carbon tax. The business can mitigate this risk by investigating alternative energy sources,
which will have less of impact in terms of indirect carbon tax.
7.2 PET and Glass CSD packaging process unit processes’ GWPFigure 27 shows the GWP for the 500ml PET and 300ml Glass CSD packaging processes' unit
processes, as a result of purchased electricity.
ouao
6000
5000
4000
3000
2000
1000
0
5000
GWP 500m! PET CSD unit processes GWP 300ml Glass CSD unit processes
Figure 27: GIVP for CSD packaging process ’ unit processes of500mI PET and 300ml Glass
The GWP for the 500ml PET CSD packaging process’ unit processes is calculated as
5000gC02e/hl and the GWP for the 300ml Glass CSD packaging process' unit processes as
2000 gCChe/hl. Packaging CSD in PET therefore results in 2.5 times more CChe emissions
than packaging it in Glass. It can be noted that the higher the kWh/hl, the higher the kgCCEe/hl
will be. It is important to highlight that the aforementioned emissions will not contribute
75

directly to the business’ carbon tax, because those emissions are incurred by the upstream
purchased electricity supplier. Hence it is important, from cost point of view, for the business
to work on optimising its energy usage and look for alternative sources of energy other than
purchased electricity.
7.3 PET and Glass CSD packaging process key raw materials CED and GWPMain CSD packaging process raw materials are supplied to the business ready to be used by
the unit processes on the respective packaging lines. The CED for these raw materials is
therefore not calculated as it is outside of the scope for the study. The GWP for these materials
is however calculated based on theoretical factors. Figure 28 shows the main materials’ usage
in terms of g/hl for the 500ml PET CSD packaging process.
4500 4000 3500 3000
3= 2500'So 2000
15001000500
0
4230
HDPE Cap PP Label PET preform LDPE Case LDPE Palletshrinkwrap wrap
500ml PET
Figure 28: 500m/ PET CSD packaging process main materials usage g/lil
The total g/hl of main raw materials for the 500ml PET CSD packaging process is calculated
as 5146g/hl. The PET preform is the heaviest component of the fully packaged 500ml PET
container - 4230g/hl of CSD.
The GWP in terms of gCCTe/hl for the 500ml PET CSD main packaging raw materials is shown
in Figure 29:
76

2500
2000JC<D 1500o"uw> 1000
500 192
0 ■HHDPE Cap
2369
PP Label PET LDPE Case LDPE Pallet preform shrink wrap wrap
500ml PET
Figure 29: 500ml PET packaging process main raw materials' GWP
The total GWP for the 500ml PET CSD packaging process main raw materials is calculated
using published data (EPA USA, 2015) and it has a value of 2858gC02e/hl. The 500ml PET
preform has the highest GWP - 2369gC02e/hl. Reducing the weight of the 500ml PET preform
will have the greatest effect on the GWP of the packaging process of CSD in PET containers.
Although GWP due to material manufacture will not affect the company's carbon tax directly,
it will have indirect cost implications, similar to those of purchased electricity. PET preform
suppliers will incur this taxation instead and in turn will raise their prices to remain profitable.
This will result in higher material cost to the business and hence it will negatively impact its
profit margin.
Poor PET recycling in South Africa may require that new raw materials are always used for
PET preforms manufacture, therefore further increasing upstream supplier GWP. The chemical
composition of PET inherently requires environmentally costly materials (EPA USA, 2015),
which can be replaced by greener options with technology advances and new scientific
research. It is therefore important that the business together with suppliers continuously look
for opportunities to reduce PET preform weight, material composition and/ or rate at which
material is recycled and fed back into the system.
Figure 30 shows the main materials’ usage in terms of g/hl for the 300ml Glass CSD packaging
process.
77
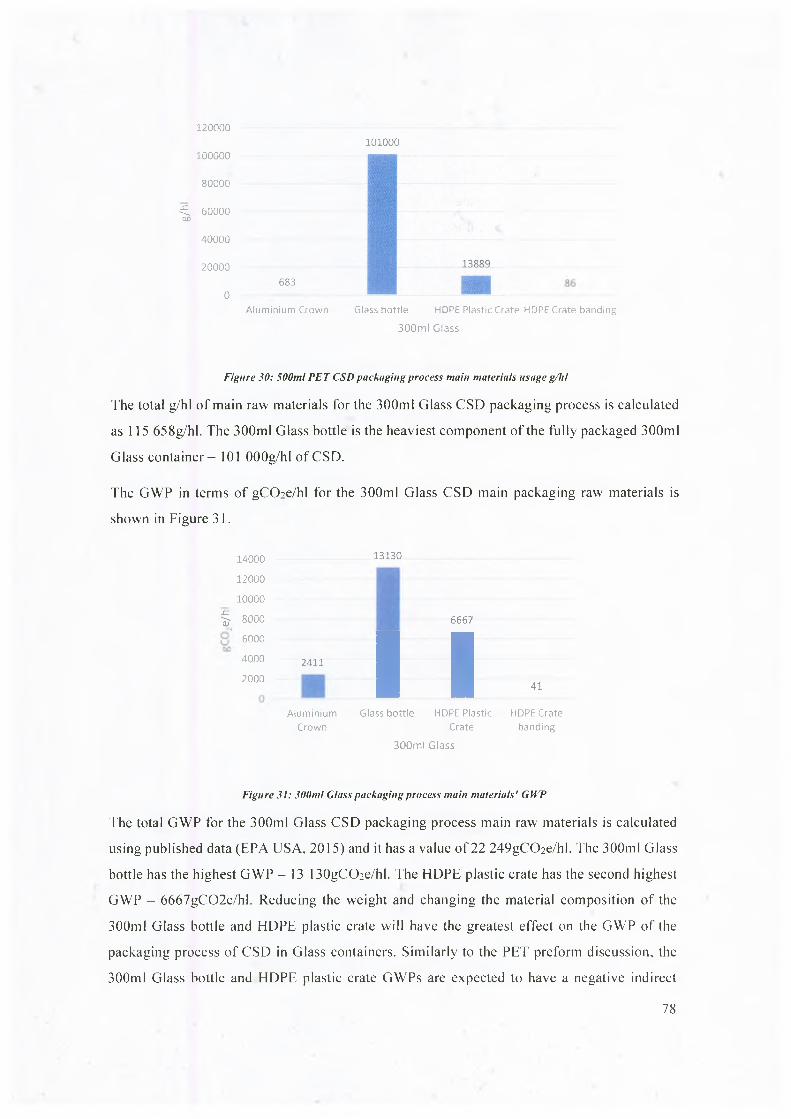
120000
100000
80000
^ 60000 oo40000
20000
0683
Aluminium Crown
101000
Glass bottle HOPE Plastic Crate HOPE Crate banding 300ml Glass
Figure 30: 500ml PET CSD packaging process main materials usage g/hl
The total g/hl of main raw materials for the 300ml Glass CSD packaging process is calculated
as 115 658g/hl. The 300ml Glass bottle is the heaviest component of the fully packaged 300ml
Glass container - 101 OOOg/hl of CSD.
The GWP in terms of gCCTe/hl for the 300ml Glass CSD main packaging raw materials is
shown in Figure 31.
14000 13130
12000
10000
§ 8000 6667
41
Aluminium Glass bottle HDPE Plastic HOPE Crate Crown Crate banding
300ml Glass
6000
40002000
2411
I I
Figure 31: 300ml Glass packaging process main materials' GWP
The total GWP for the 300ml Glass CSD packaging process main raw materials is calculated
using published data (EPA USA, 2015) and it has a value of 22 249gC02e/hl. The 300ml Glass
bottle has the highest GWP - 13 130gCO2e/hl. The HDPE plastic crate has the second highest
GWP - 6667gC02e/hl. Reducing the weight and changing the material composition of the
300ml Glass bottle and HDPE plastic crate will have the greatest effect on the GWP of the
packaging process of CSD in Glass containers. Similarly to the PET preform discussion, the
300ml Glass bottle and HDPE plastic crate GWPs are expected to have a negative indirect
78

effect on the business’ profit margin whenever a new batch of these materials is introduced to
the system. The return rate of 300ml Glass bottles and HDPE plastic crates is currently within
target levels (20 cycles), according to information supplied by the business under investigation.
Therefore the indirect effect on the business’ profit margin will be very small in comparison to
the 500ml PET counterpart, as discussed in the aforementioned paragraphs. Nonetheless,
investigation into lighter, better composed and environmentally friendlier Glass bottles and
plastic crates should be conducted between the business and its upstream suppliers.
The GWP comparison between the 300ml Glass and 500ml PET CSD packaging process main
raw materials is shown below. Figure 32 shows the gCCEe/hl for Glass vs. PET assuming new
raw materials ejections is required every time. Figure 33 shows the gCCEe/hl for Glass vs. PET,
as per company current operations.
25000
20000
2= 15000<U
I'M
& 10000
5000
0
Figure 32: 300ml Glass vs. 500ml PET packaging process main raw materials GlI'P, assuming new injections everyproduction cycle
Figure 33 shows the GWP of 300ml Glass when new RGB and F1DPE plastic crates are injected
into the system every 20 cycles. 500ml PET raw materials are always injected in full and the
GWP for 20 cycles per hi is also shown below.
79

90000 8317380000
70000
60000
=§. 50000
8 40000 no
30000
20000
10000
0
Figure 33: 300ml Glass vs. 300ml PET main packaging raw materials GWPper 20 cycles per Itl
Initial manufacture of 300ml Glass main packaging raw materials (22 248gC02e/hl) emits 7.8
times more GHGs than manufacture of 500ml PET main packaging raw materials
(2857gC02e/hl). However, this assumes that new Glass and PET containers are produced all
the time. This is not the case as Glass containers and HDPE plastic crates are returned to the
business (97%), which means that only continuous supply of new Aluminium crowns is
required for CSD production with minimum (3%) injection of new Glass and HDPE crates.
The number of cycles an RGB and an HDPE plastic crate remain in circulation before it can
no longer be used is 20, as provided by the business. Thus GWP for 300ml Glass packaging
raw materials over 20 cycles would be 83 173gC02e/hl and for 500ml PET - 57 147gC02e/hl.
The GWP for 300ml Glass packaging raw materials is thus 1.5 times greater than its 500ml
PET counterpart. Therefore, the business needs to drive its market to achieve 100% returns of
Glass and HDPE plastic crates. Co-operation with upstream suppliers and downstream
customers on projects which can further increase this number of life cycles before a bottle and
crate is destroyed is necessary to minimise the indirect effect of GWP due to new bottle and
crate manufacture on the business.
Reducing the weight and improving the material composition of the bottle and crate will also
have a positive impact on indirect carbon tax cost to the business. Lastly, the business should
seek an alternative to Aluminium crowns as they are environmentally costly and a greener
alternative will have a potential 241 lgCCEe/hl reduction in GWP for Glass.
80

7.4 PET and Glass CSD packaging process main utilities CED and GWP2.6kWh/hl is the HP (High Pressure) compressor consumption to generate 40bar pressurised
air for use by the two blow moulders on the 500ml PET packaging line. This has an indirect
impact on business cost as the emissions associated with generating this power come from
purchased electricity. The HP compressor itself does not emit any GHGs during its operation.
The 2.6kWh/hl can be reduced by investigating more efficient compressor alternatives as well
as compressed air transportation systems.
The coal boiler used to generate steam for the bottle washer on the 300ml Glass packaging line
contributes to direct emissions on site and thus has a direct impact on the business' carbon tax.
Figure 34 shows the CED for the HP compressor and the boiler. The kWh/hl for the boiler is a
calculated equivalent which is based on the amount of coal used by the boiler to generate steam
i.e. the consumption that would be required by the bottle washer if purchased electricity was
used to generate steam directly. This conversion to kWh is done for comparison purposes.
250
200
Z 150 _c
i ioo
50
0
Figure 34: CED for boiler and HP compressor
The CED for the boiler is 215kWh/hl and the one for the compressor is 2.6kWh/hl. If steam
was generated by using purchased electricity instead of coal in boilers, as shown above, the
Glass packaging process' utilities would require 83 times the amount of energy than the HP
compressor. Steam is used for the sterilisation of the Glass bottle before it is filled with CSD.
The business needs to investigate steam generation alternatives and steam recovery systems to
ensure that it drives the equivalent power consumption of the boilers down and/or completely
eliminates the need for them.
Figure 35 shows the GWP for the boiler and HP compressor. The boiler emits GHGs directly
into the atmosphere during its operation and the GHGs as a result of running the HP compressor
215
2,6
Coa! burned in boilers for steam 40 bar pressurised air
81

are indirect and come from upstream purchased electricity, which is generated by burning coal
also.
250000
200000
jE 150000ajO^ 100000
50000
0
209000
Coal burned in boilers for steam
3000
40 bar pressurised air
Figure 35: GWPfor boiler and HP compressor
Boilers emit 209 OOOgCCEe/hl directly into the atmosphere while the HP compressor results in
3000 gCChe/hl of indirect emissions. 70 times more GHGs are emitted by the use of the boiler
than the HP compressor. This makes the utilities of the Glass CSD packaging processes a lot
more environmentally costly than PET's. Major focus is thus required by the business to drive
projects which can reduce/eliminate these boiler emissions. Alternatives for Glass bottles
sterilization must be investigated.
82

7.5 PET and Glass CSD packaging process overall CED and GWPFigure 36 shows the overall CED for the Glass and PET CSD packaging process, which
includes the unit processes and utilities, but excludes the main packaging raw materials,
because they are produced off site and the CED associated with their manufacture is outside of
the scope for this research.
220
170
_c
-i:
120
70
20
-30300ml Glass 500ml PET
■ Utilities energy demand
S Unit porcesses energy demand
Figure 36: 300ml Glass vs. 500ml PET CED requirement
The CED for the 300ml Glass CSD packaging process is 216.56kWh/hl and the one for 500ml
PET 7.64kWh/hl. 300ml Glass packaging process requires 28 times more kWh/hl than 500ml
PET. This is a significant difference between the two processes. Furthermore, the utilities' CED
for 300ml Glass contribute 99% to the total Glass CED, while the utilities for 500ml PET
contribute 34% to the total PET CED.
Figure 37 shows the GWP for the Glass and PET CSD packaging process, which includes main
packaging raw materials. It is important to note that both direct and indirect emissions are
included.
83
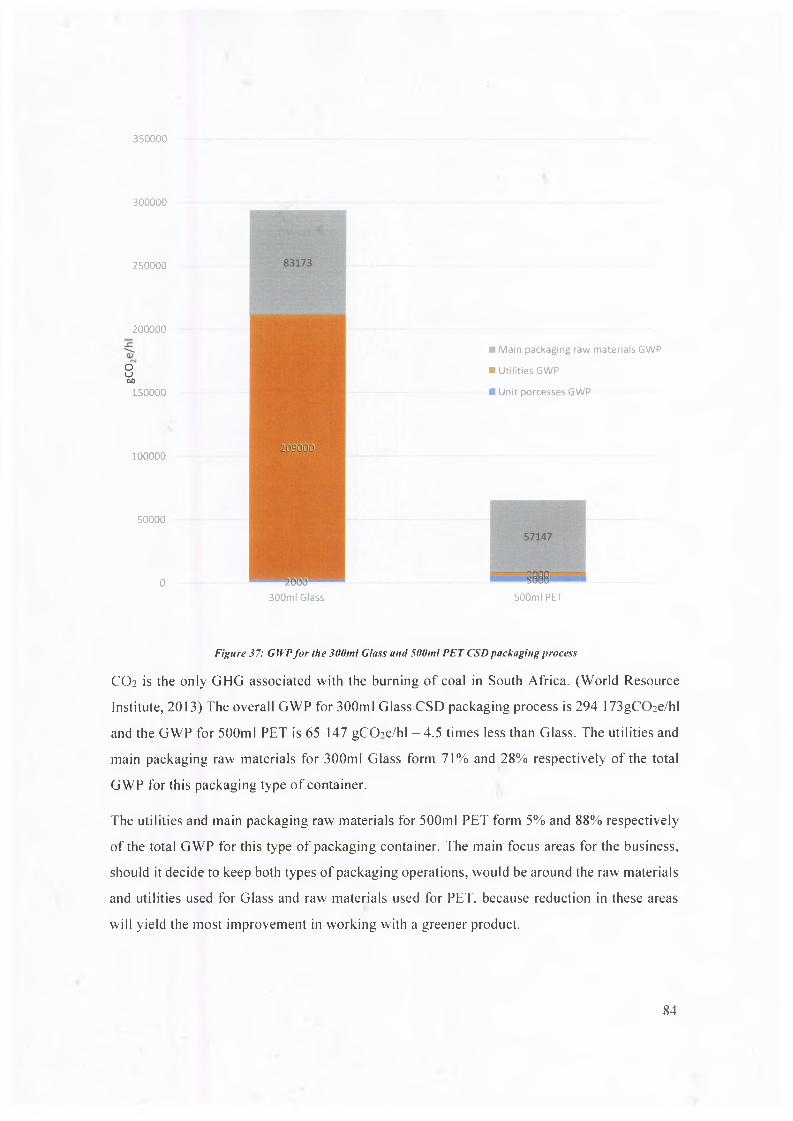
350000
300000
250000
200000
Ouoo150000
100000
50000
0300ml Glass
■ Main packaging raw materials GWP
■ Utilities GWP
■ Unit porcesses GWP
500ml PET
Figure 37: GWP for the 300ml Glass ant! 500ml PET CSD packaging process
CO2 is the only GHG associated with the burning of coal in South Africa. (World Resource
Institute, 2013) The overall GWP for 300ml Glass CSD packaging process is 294 173gC02e/hl
and the GWP for 500ml PET is 65 147 gCCTe/hl - 4.5 times less than Glass. The utilities and
main packaging raw materials for 300ml Glass form 71% and 28% respectively of the total
GWP for this packaging type of container.
The utilities and main packaging raw materials for 500ml PET form 5% and 88% respectively
of the total GWP for this type of packaging container. The main focus areas for the business,
should it decide to keep both types of packaging operations, would be around the raw materials
and utilities used for Glass and raw materials used for PET, because reduction in these areas
will yield the most improvement in working with a greener product.
84
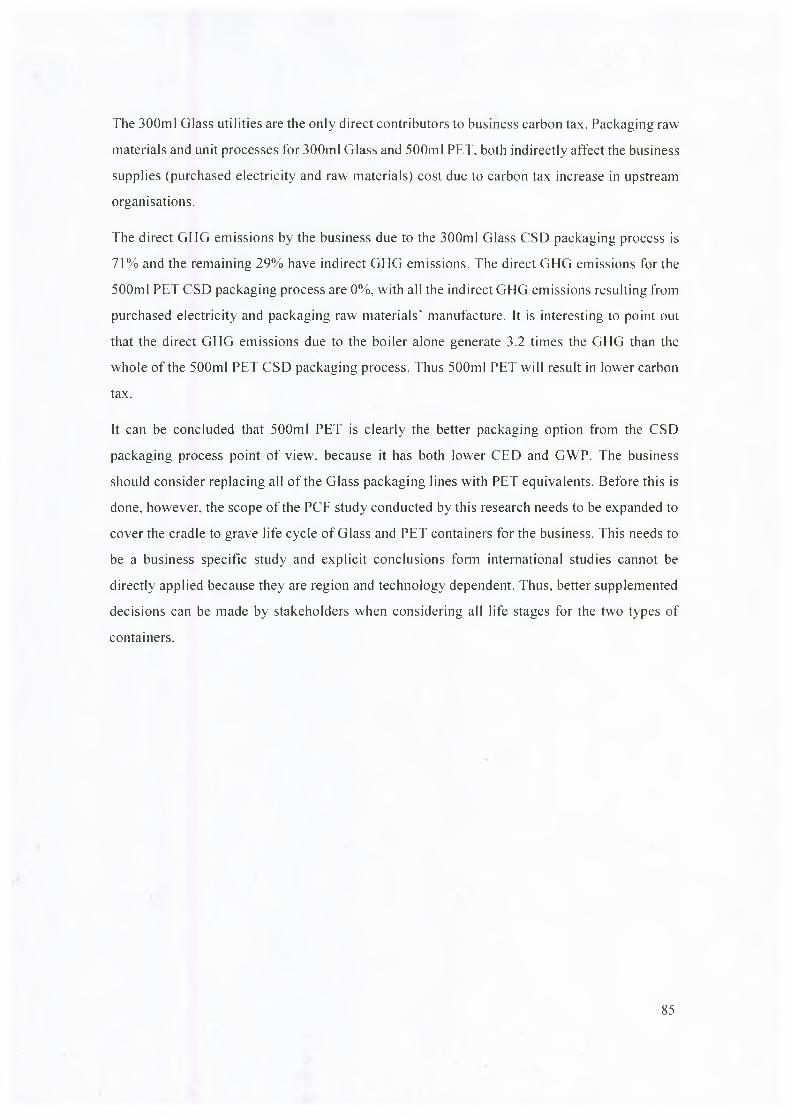
The 300ml Glass utilities are the only direct contributors to business carbon tax. Packaging raw
materials and unit processes for 300ml Glass and 500ml PET, both indirectly affect the business
supplies (purchased electricity and raw materials) cost due to carbon tax increase in upstream
organisations.
The direct GHG emissions by the business due to the 300ml Glass CSD packaging process is
71% and the remaining 29% have indirect GHG emissions. The direct GHG emissions for the
500ml PET CSD packaging process are 0%, with all the indirect GHG emissions resulting from
purchased electricity and packaging raw materials’ manufacture. It is interesting to point out
that the direct GHG emissions due to the boiler alone generate 3.2 times the GHG than the
whole of the 500ml PET CSD packaging process. Thus 500ml PET will result in lower carbon
tax.
It can be concluded that 500ml PET is clearly the better packaging option from the CSD
packaging process point of view, because it has both lower CED and GWP. The business
should consider replacing all of the Glass packaging lines with PET equivalents. Before this is
done, however, the scope of the PCF study conducted by this research needs to be expanded to
cover the cradle to grave life cycle of Glass and PET containers for the business. This needs to
be a business specific study and explicit conclusions form international studies cannot be
directly applied because they are region and technology dependent. Thus, better supplemented
decisions can be made by stakeholders when considering all life stages for the two types of
containers.
85
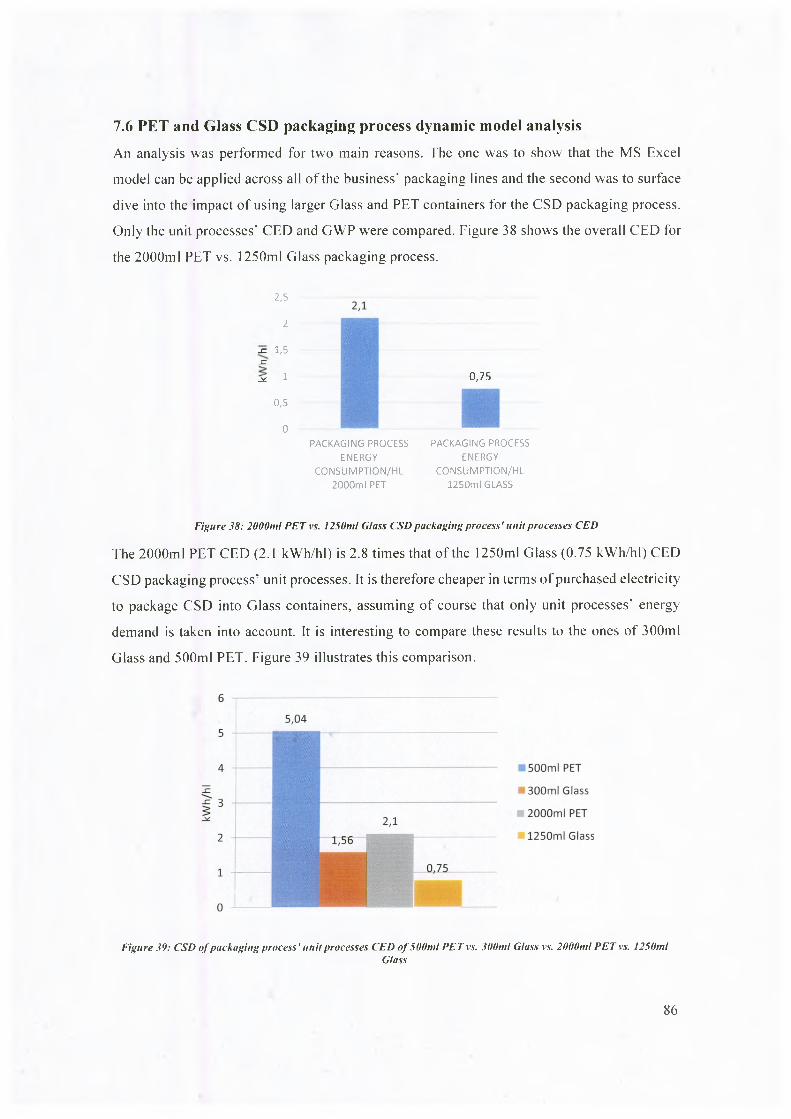
7.6 PET and Glass CSD packaging process dynamic model analysisAn analysis was performed for two main reasons. The one was to show that the MS Excel
model can be applied across all of the business' packaging lines and the second was to surface
dive into the impact of using larger Glass and PET containers for the CSD packaging process.
Only the unit processes' CED and GWP were compared. Figure 38 shows the overall CED for
the 2000ml PET vs. 1250ml Glass packaging process.
2,5
2
-C 1,5-C
12*
0,5
0
0,75
PACKAGING PROCESS PACKAGING PROCESS ENERGY ENERGY
CONSUMPTION/HL CONSUMPTION/HL2000ml PET 1250ml GLASS
Figure 38: 2000ml PET vs. 1250ml Glass CSD packaging process' unit processes CED
The 2000ml PET CED (2.1 kWh/hl) is 2.8 times that of the 1250ml Glass (0.75 kWh/hl) CED
CSD packaging process’ unit processes. It is therefore cheaper in terms of purchased electricity
to package CSD into Glass containers, assuming of course that only unit processes' energy
demand is taken into account. It is interesting to compare these results to the ones of 300ml
Glass and 500ml PET. Figure 39 illustrates this comparison.
Figure 39: CSD of packaging process’ unit processes CED of 500ml PET vs. 300ml Glass vs. 2000ml PET vs. 1250mlGlass
86

500ml PET packaging line’s unit processes consume the most CED (5.04 kWh/hl), which is
2.4 times that of its 2000ml equivalent and 6.7 times that of 1250ml Glass. Also, unit processes
for 300ml Glass (1.56 kWh/hl) consume 2 times more purchased electricity than its 1250ml
Glass equivalent (0.75 kWh/hl). Based on these findings, it can be established that producing
CSD in larger containers has a significant impact in reducing the purchased electricity drawn
from the grid by the packaging lines’ unit processes. It would be in the business' best interest
to focus its marketing efforts in promoting more sales to come from larger CSD containers.
This would make for a very good short term reduction in upstream purchased electricity
supplier cost. It must be noted that although 1250ml Glass unit processes consume 0.75
kWh/hl. it should not be the organisation's packaging container of choice. This low CED
number is expected to be offset drastically when main utilities’ CED, as was shown for 300ml
Glass and 500ml PET, is factored into the calculations.
Figure 40 shows the overall GWP for the 2000ml PET vs. 1250ml Glass packaging process.
2500
2000
]= 1500 \ cl)OKO 1000
500
0
2100
2000ml PET
750
1250ml Glass
Figure 40: 2000ml PET vs. 1250ml Glass CSD packaging process' unit processes GWP
2000ml PET unit processes, indirectly via purchased electricity, emit 2100 gCCEe/hl, which is
2.8 times that of the indirect emission during the packaging of CSD in 1250ml Glass containers.
Similarly to the CED comparison, it would be interesting to show how the different container
options rank up in terms of GWP. Figure 41 shows the 300ml Glass, 500ml PET, 1250ml Glass
and 2000ml PET unit processes' GWP.
87

6000
50005000
■ 500m! PET
■ 300m! Glass
■ 2000ml PET
■ 1250ml Glass
0
Figure 41: GUP of packaging process’ unit processes CED of 500ml PET vs. 500ml Glass vs. 2000ml PET vs. 1250mlGlass
500ml PET unit processes' GWP (5000 gCCHe/hl) is the highest across all four types of
containers selected for comparison and is 2.4 times that of its 2000ml PET equivalent (2100
gCCEe/hl). The GWP for 1250ml Glass has the lowest value (750 gCCTe/hl). However, as
discussed earlier when the CED for the four types of containers was compared, this value will
be offset when including the emissions due to main utilities i.e. coal boilers.
It is interesting to point out that because the 300ml and 1250ml Glass packaging lines both
make use of the same bottle washer, which is the most GWP intensive machinery on the Glass
line, producing CSD in larger containers is expected to have a significant reduction in direct
CCEe emission by the business. However, when considering the 300ml Glass and 500ml PET
overall GWP comparison, even halving this contribution will not favour the overall Glass
packaging process’ GWP.
The GWP for the 2000ml PET comes out as the best choice for the business, assuming raw
material and utilities indirect emissions are similar to those of 500ml PET, because it indirectly
emits half the gCChe/hl when compared to its 500ml PET equivalent and hence would add the
least indirect carbon tax cost to the organisation. The benefit becomes clearer when these
seemingly low values, which are expressed per the functional unit (hi), are factored into the
annual sales of the business.
88

7.7 PET and Glass CSD packaging process overall discussionThe results of the study are expressed per functional unit (hi) of CSD. Although the GWP for
the Glass and PET CSD packaging processes seem to consume little power and show a low
GWP per hi value, the effects change quite drastically when the business’ sales are factored in.
As an example a I 000 OOOhl/year business will result in 294 173 tonnesCO^e per annum during
its Glass operation and 65 147tonnesC02e per annum due to its PET operation for the 300ml
and 500ml packaging containers alone. If other CSD SKUs are factored in, the emissions would
be even higher. More accurate results can be achieved if the research model is applied across
the business’ SKU portfolio. This will provide the organisation with a complete representation
of its CSD packaging processes' CED and GWP and hence enable stakeholders to better
anticipate direct and indirect carbon tax costs.
The 300ml Glass CSD packaging process due to unit processes has half the environmental cost
of its 500ml PET equivalent. The greatest environmental cost for both processes lies with the
main utilities and packaging materials (99% for Glass and 93% for PET). Focusing on
eliminating or reducing these values will therefore add the most value to the business. Short
term, the business has to put strategies in place to ensure that the return rate of its empty Glass
is as high as possible. Also, the material, which makes up the plastic crate for the 300ml Glass
bottle, should be replaced with environmentally friendlier one, to reduce increased upstream
supplier costs driven by carbon tax policy.
The business should focus on understanding the implications of changing container size in
terms of possible market constraints and how this change would impact the business
profitability. This would provide an insight into the true impact carbon tax would have on
business profit. If possible, marketing efforts should be on driving sales in larger PET
containers as those are expected to result in the least amount of carbon taxation for the business
as well the least increase in upstream suppliers’ cost when compared to Glass alternatives
Based on direct carbon tax impact, the Glass packaging process would contribute the most to
the business’ direct carbon tax. Should the business decide to keep its Glass packaging lines,
due to market demand for example, its most important focus area must be reduction of the
emissions by the coal boilers on site. Alternative energy sources should be considered first as
well as improving the efficiency of the operation by investing in new bottle washer and/or
better steam recovery system.
89
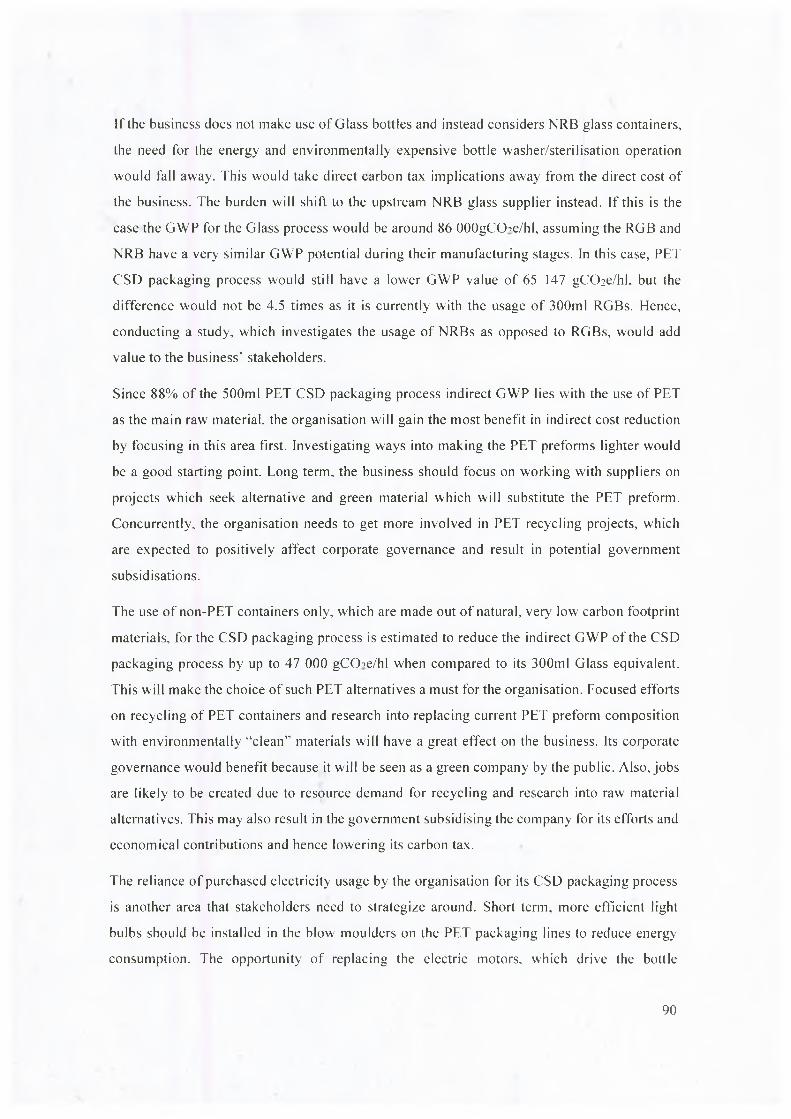
If the business does not make use of Glass bottles and instead considers NRB glass containers,
the need for the energy and environmentally expensive bottle washer/sterilisation operation
would fall away. This would take direct carbon tax implications away from the direct cost of
the business. The burden will shift to the upstream NRB glass supplier instead. If this is the
case the GWP for the Glass process would be around 86 OOOgCCEe/hl, assuming the RGB and
NRB have a very similar GWP potential during their manufacturing stages. In this case, PET
CSD packaging process would still have a lower GWP value of 65 147 gCO:e/hI, but the
difference would not be 4.5 times as it is currently with the usage of 300ml RGBs. Hence,
conducting a study, which investigates the usage of NRBs as opposed to RGBs, would add
value to the business' stakeholders.
Since 88% of the 500ml PET CSD packaging process indirect GWP lies with the use of PET
as the main raw material, the organisation will gain the most benefit in indirect cost reduction
by focusing in this area first. Investigating ways into making the PET preforms lighter would
be a good starting point. Long term, the business should focus on working with suppliers on
projects which seek alternative and green material which will substitute the PET preform.
Concurrently, the organisation needs to get more involved in PET recycling projects, which
are expected to positively affect corporate governance and result in potential government
subsidisations.
The use of non-PET containers only, which are made out of natural, very low carbon footprint
materials, for the CSD packaging process is estimated to reduce the indirect GWP of the CSD
packaging process by up to 47 000 gCCTe/hl when compared to its 300ml Glass equivalent.
This will make the choice of such PET alternatives a must for the organisation. Focused efforts
on recycling of PET containers and research into replacing current PET preform composition
with environmentally “clean” materials will have a great effect on the business. Its corporate
governance would benefit because it will be seen as a green company by the public. Also, jobs
are likely to be created due to resource demand for recycling and research into raw material
alternatives. This may also result in the government subsidising the company for its efforts and
economical contributions and hence lowering its carbon tax.
The reliance of purchased electricity usage by the organisation for its CSD packaging process
is another area that stakeholders need to strategize around. Short term, more efficient light
bulbs should be installed in the blow moulders on the PET packaging lines to reduce energy
consumption. The opportunity of replacing the electric motors, which drive the bottle
90

conveyors, with more efficient ones to save on purchased electricity demand should also be
investigated. Alternative energy source, which supplies the energy hungry air compressors is
likely to reduce the GWP of the PET packaging process. However, given the fossil fuel
generated power dependency of the country, this would be a very challenging issue to resolve.
Nevertheless, the business can attempt, via co-operation with suppliers and other industries, to
influence the government to shy away from non-renewable resources for energy generation as
part of a long term programme.
There seems to be a somewhat directly proportional relationship between the kWh/hl and the
gCCTe/hl when using the GHG calculation tool provided by (World Resource Institute, 2013).
The tool shows that when burning coal only CO2 is emitted as GHG. Since the tool is from an
internationally credible source its output will be taken as true. Further supplier specific research
would be required to better understand upstream GWP.
From the dynamic model analysis conducted, packaging in larger containers results in lower
overall GWP values because of economies of scale. Also, the overall GWP results would still
be in favour of PET, even if the PET and Glass containers are of identical volumetric capacity,
because of the large GWP contribution of utilities and main raw materials required for Glass.
The business has the option to consider alternative packaging materials for its CSD packaging
process. However, because the capital investment is in PET and Glass packaging lines only,
such an investigation would be futile. For example, if further research concludes that an
aluminium container is the “greenest" choice, replacing the entire existing infrastructure to
accommodate this type of container will not make business sense due to the high conversion
cost and rate of return on investment. The business should keep its existing Glass and PET
packaging lines until a full blown LCA analysis is done, which will reveal the entire carbon
footprint of Glass and PET packaging containers for the South African context.
Similar conclusions can be made when comparing the results of this research to the results
obtained by (Flanigan, et al., 2013). The choice of packaging container when considering GWP
into account largely depends on the raw materials chosen for its construction. For this research,
raw materials' GWP for both Glass and PET containers form a significant part of the finished
products' overall GWP. Comparing the results of this research to other academic literature, as
found in the literature review section of this report, would not be fruitful, because there are
numerous assumptions made for each study, which are not always disclosed in the publically
91

available reports. Hence further comments regarding the similarities and differences in findings
cannot be made at this stage.
92

The following conclusion can be drawn based on the results and discussion in the previous
section:
1. The 500ml PET packaging process’ unit processes were found to consume 5.04 kWh/hl
2. The 500ml PET packaging process’ main utilities were found to consume 2.6 kWh/hl
3. The 300ml Glass packaging process’ unit processes were found to consume 1.56
kWh/hl
4. The 300ml Glass packaging process' main utilities were found to consume 215 kWh/hl
5. Both the 500ml PET and 300ml Glass packaging process’ main raw materials are
produced off site and hence the CED associated with their manufacture was outside of
the scope for the study and thus not quantified
6. The CED for the 300ml Glass packaging process, which includes main utilities and unit
processes, was found to be 216.56 kWh/hl, which is 28 times that of 500ml PET (7.64
kWh/hl). The 500ml PET hence consumes the least amount of CED
7. For 500ml PET, 100% of the energy required for the CSD packaging process’ unit
processes and main utilities come from purchased electricity, which is obtained from
the national grid. This electricity is generated by burning coal
8. For 300ml Glass, 99% of the CSD packaging process’ CED was found to be drawn by
coal boilers on site and the remaining 1% from the national grid
9. The GHGs associated with the CSD packaging process CED requirements all come
from burning coal to generate power. The only GHG associated with burning coal in
South Africa is CO2 . (World Resource Institute, 2013) The GWP for the 500ml PET
CSD packaging process' unit processes, main utilities and raw materials was found to
be 65 147 gCCEe/hl, which is 4.5 times less than that for 300ml Glass (294 173
gCCEe/hl)
10. The direct GHG emissions by the business due to the 300ml Glass CSD packaging
process is 71% and the remaining 29% have indirect (off site) GHG emissions. The
direct GHG emissions for the 500ml PET CSD packaging process is 0%, with all the
indirect emissions resulting from purchased electricity and packaging raw materials
manufacture. The 500ml PET CSD packaging process was thus found to result in lower
carbon taxation to the business
8. Conclusions
93

11. Using larger PET (2000ml) and Glass (1250ml) containers was found to reduce the
GHG emissions for the CSD packaging process. Using a 2000ml PET container for the
CSD packaging process was found to be the best choice for the business
94

9. RecommendationsRecommendations for further academic research, which will build on the current study, are as
follows:
1. Short term, the business should not devote time in conducting research on
alternative packaging containers, which are incompatible with its existing
infrastructure as the packaging lines' conversion would not make business sense in
terms of return on investment
2. Due to site specific unit processes and utilities’ set-ups and connections, the results
from this study will not be directly applicable to another CSD manufacturing site
and hence the study must be repeated across the whole business SKUs portfolio and
all of its packaging lines across all of its sites in South Africa to fully quantify the
CSD packaging process" PCF
3. Expand the scope of the study to include all life stages for the Glass and PET CSD
packaging process and hence develop a full LCA
4. Conduct a detailed energy requirement study on the PET packaging lines’ unit
processes to find ways in reducing the overall power requirements
5. Conduct a detailed study on the Glass CSD packaging process’ main utility to find
ways in reducing the CED resulting from the bottle washer
6. Expand the study to consider the environmental impact of using water on the
packaging lines
95

10. ReferencesABI, 2015. SustainabiIity report, s. I.: A B i.
Amienyo, D., Gujba, H., Stichnothe, H. & Azapagic, A., 2013. Life cycle environmental
impacts of carbonated soft drinks. The international jo u rn a l o f life cycle assessm ent, 18(1), pp.
77-92.
BBC UK, 2015. Energy. [Online]
Available at:
http://www.bbc.co.uk/schools/gcsebitesize/geographv/energy resources/energy rev3.shtml
[Accessed 24 October 2015].
Berry, S., 2010. D oes weight matter. [Online]
Available at: http://www.colalife.org/2010/12/24/does-weight-matter/
[Accessed 16 December 2015],
Bieda, B„ Grzesik, K., Sala, D. & Gawe, B., 2015. Life cycle inventory processes of the
integrated steel plant (ISP) in Krakow, Poland—coke production, a case study. The
International Journal o f L ife Cycle Assessment, 20(8), pp. 1089-1101.
CAE, 2005. Glass vs PET. [Online]
Available at: https://ayl4-
15.moodle.wisc.edu/prod/pluginfile.php/72569/mod folder/content/O/glass vs plastic.ppt?fo
rcedownload=l.
[Accessed 25 October 2015].
Canadean, 2013. G lobal beverage forecasts, s.l.: Canadean.
Doublet, G.. 2012. LCA o f R ivella and M ichel soft drinks packaging, Zurich: Institute of
Environmental Engineering (IFU) at ETH Zurich.
Ecoinvent, 2015. w w w.ecoinvent.org. [Online]
Available at: www.ecoinvent.org
[Accessed 26 September 2015],
Eco-sapiens, n.d. Reduce the packaging. [Online]
Available at: http://www.eco-sapiens.com/dossier-76-Reduire-les-emballages.html
[Accessed 11 September 2015].
96

Emission Factors, 2014. G lobal warm ing poten tia ls gwp. [Online]
Available at: http://emissionfactors.com/knowledge/questions/29/global-warming-potentials-
g W £ /
[Accessed 6 December 2015],
Engineering News, 2008. Carbon em issions a cause o f concern. [Online]
Available at:
http://webcache.googleusercontent.com/search?q=cache:ST7HAS70k2AJ:www. engineering
news.co.za/article/sa039s-carbon-emissions-a-cause-for-concern-2008-01 -
25+&cd=6&hl=en&ct=clnk&gl=za
[Accessed 25 September 2015].
EPA USA, 2015. SW M G HG report. [Online]
Available at: http://www3.epa.gov/warm/SWMGHGreport.html
[Accessed 14 December 2015],
European Nuclear Society, 2015. Coal Equivalent. [Online]
Available at: https://www.euronuclear.org/info/encvclopedia/coalequivalent.htm
[Accessed 12 December 2015],
Fastcoexist, 2015. Visualising all the non-renewable resources we have left. [Online]
Available at: http://www.fastcoexist.com/1680136/visualizing-all-the-non-renewable-
resources-we-have-left
[Accessed 11 September 2015].
Flanigan, L., Frischknecht, R. & Montalbo, T., 2013. A n A nalysis o f Life Cycle Assessm ent in
P a cka ing for F ood & Beverage Applications, s.l.: UNEP.
Flanigan, L., Frischknecht, R. & Montalbo, T., 2013. A n A nalysis o f Life Cycle A ssessm ent in
Packaging fo r F ood & Beverage Applications, s.l.: UNEP/SETAC Life Cycle Initiative,.
Franklin Associates, A. D. o. E., 2009. LIF E C YC LE IN V E N TO R Y OF THREE SIN G LE
SERVIN G S O F T D R IN K C O N T A IN E R S , s.l.: s.n.
Frischknecht, R. et al., 2015. Cumulative energy demand in LCA: the energy harvested
approach. The International Journal o f L ife Cycle Assessm ent, 20(7), pp. 957-969.
Ganji, A. R., Hackett, B. & Chow, S., 2002. Energy Conservation O pportunities in C arbonated
Soft D rink Canning/Bottling Facilities. Texas, BASE Energy Inc.
97

Ghosh, T. & Socci, E., 2012. Life cycle assessm ent o f PepsiCo USA beverage pacaking.
Tacoma WA, PepsiCo.
Gleick, P. & Cooley, H. S., 2009. Energy implications of bottled water. Environm ental
research letters, 4(1), pp. 1-6.
Goedkoop, M. et al., 2009. ReCiPe 2008 A life cycle impact assessm ent m ethod which
com prises harm onised category indicators at the m idpoint and the endpoint level, s.h: Ministry
of housing. Spatial Planning and Environement (VROM).
Heineken, 2013. Sustainability report 2013 - R educing energy consum ption , s.h: Heineken.
Hirsheimer, M., 2015. Chapter 65 - Beverage Indsutry. [Online]
Available at: http://www.ilocis.org/documents/chpt65e.htm
[Accessed 25 September 2015].
Huang, C.-C. & Ma, H.-W., 2004. A multidimensional environmental evaluation of packaging
materials. Science o f the Total Environemnt, 11(324), pp. 161-172.
Humbert, S. R., Margni, V., Jolliet, M. & Loerincik, O., 2009. Life cycle assessment of two
baby food packaging alternatives: glass jars vs. plastic pots. International Journal o f Life Cycle
Assessm ent, Volume 14, pp. 95-106.
International Energy Agency, 2010. Pow er generation fi-om coal: M easuring and reporting
efficiency perform ance a nd C 0 2 emissions, Paris: IEA Publications.
Investopedia, 2015. Nonrenewable resource. [Online]
Available at: http://www.investopedia.eom/terms/n/nonrenewableresource.asp
[Accessed 11 September 2015].
ISO 14040/14044, 2006. Environm ental m anagem ent — Life cycle assessm ent
Requirem ents and guidelines. [Online]
Available at: https://www.iso.Org/obp/ui/#iso:std:iso:14040:ed-2:vl :en
[Accessed 21 November 2015].
ISO 14040, 2006. Environm ental m anagem ent — Life cycle assessm ent — Requirem ents and
guidelines. [Online]
Available at: https://www.iso.Org/obp/ui/#iso:std:iso: 14040:ed-2:vl :en
[Accessed 21 November 2015].
98

Jackson, D., n.d. Tip O ff - News, fa c ts and figures. [Online]
Available at: http://0-
web.a.ebscohost.com.innopac.wits.ac.za/ehost/pdfviewer/pdfviewer?sid=f51 b746c-9b 19-
4452-afl5-f640358a69fc%40sessionmgr4001 &vid=2&hid=4114
[Accessed 25 September 2015],
Jorgensen. S. V., Hauschild, M. Z. & Nielsen, P. H., 2014. Assessment of urgent impacts of
greenhouse gas emissions—the climate tipping potential (CTP). The International Journal o f
Life Cycle Assessm ent, 19(4), pp. 919-930.
Journey Staff - Coca-Cola, 2010. What's the carbon fo o tp rin t o f Coca-Cola. [Online]
Available at: http://www.coca-cola.co.uk/stories/sustainability/environment/whats-the-
carbon-footprint-of-a-coca-cola/
[Accessed 3 October 2015],
Marsh, K. & Bugusu, B., 2007. Food Packaging - Roles, Materials, and Environemental Issues.
Journal o f F ood Science, 72(3), pp. 39-55.
Martin, S., 2014. W hat’s the difference between a carbon fo o tp rin t a nd an LCA. [Online]
Available at: http://www.earthshift.com/blog/2014/Q2/what-s-difference-between-carbon-
footprint-and-lca
[Accessed 22 November 2015].
Minister of Finanace, 2015. w w w.treasury.gov.za. [Online]
Available at:
http://www.treasury.gov.za/public%20comments/CarbonTaxBill2015/Carbon%20Tax%20Bil
l%20final%20for%20release%20for%20comment.pdf
[Accessed 13 November 2015].
Parker, M. & Gilder, A., 2015. M ondaq - South A frica: South A frica A nnounces Timelines For
The Introduction O f The Carbon Tax. [Online]
Available at:
http://www.mondaq.eom/southafrica/x/396160/Corporate+Tax/South+Africa+announces+tim
elines+for+the+introduction+of+the+carbon+tax
[Accessed 17 August 2015].
99

Pasqualino, J., Meneses, M. & Castells, F„ 2011. The carbon footprint and energy consumption
of beverage packaging selection and disposal. Journal o f fo o d engineering, 4(103), pp. 357-
365.
Paster, P., 2007. A sk pab lo glass v.v P E T bottles. [Online]
Available at: http://www.triplepundit.com/2007/03/askpablo-glass-vs-pet-bottles/
[Accessed 11 September 2015].
Person, L. & Ekvall, T., 1998. Life cycle assessm ent o f packaging system s fo r beer and soft
drinks, s.l.: Danish environmental protection agency.
Pretium packaging, 2012. Shattering the myth p lastic v.v glass. [Online]
Available at: http://www.pretiumpkg.eom/wp-content/uploads/2012/l 1/Shattering-the-Myth-
Plastic-vs-Glass-P.pdf
[Accessed 11 September 2015].
Q uantifying environm ental impacts o f C arbonated Soft D rink (CSD) packag ing (2009) Husky
IMS Ltd.
Queensland Government, 2014. Business and Industry Portal. [Online]
Available at: https://www.business.qld.gov.au/business/running/environment/environment-
vour-business/benefits-environmentallv-friendlv
[Accessed 17 August 2015].
SABMiller, 2015. Our response. [Online]
Available at: http://www.sabmiller.com/sustainabilitv/a-clean-environinent/our-response
[Accessed 15 November 2015].
Shailesh, 2012. H ow to calculate carbon dioxide equivalent em issions fro m different GHG
sources?. [Online]
Available at: http://greencleanguide.com/2012/06/05/how-to-calculate-carbon-dioxide-
equivalent-emissions-from-different-ghg-sources/
[Accessed 6 December 2015].
Sidel, 2015. 5 reasons why P E T is becom ing the sustainable packag ing m aterial o f choice.
[Online]
Available at: http://www.sidel.com/about-sidel/media/inline-magazine/sustainable-pet
[Accessed 7 September 2015].
100

South Africa Info, 2015. Energy. [Online]
Available at:
http://www.southafrica.info/business/economv/infrastructure/energy.htm#.VmRS-
vmGRBc#ixzz3tYRvK.on3
[Accessed 12 November 2015],
South African Government, 2015. Presidency on impact o f climate change in South Africa.
[Online]
Available at: http://www.gov.za/speeches/climate-change-alreadv-seriously-affecting-south-
africa-30-nov-2015-0000
[Accessed 14 11 2015].
Spenser, C., n.d. Disposalhle D rinking Bottles - Plastic vs. Glass vs. A luminium , s.l.: Macquarie
University.
Statista, 2015. Per capita consum ption o f the coca cola com pany p e r country. [Online]
Available at: http://www.statista.com/statistics/271156/per-capita-consumption-of-soft-
drinks-of-the-coca-cola-companv-by-country/
[Accessed 17 September 2015].
Steenwerth, K. L. et al., 2015. Life cycle greenhouse gas, energy, and water assessment of wine
grape production in California. The International Journal o f L ife Cycle Assessm ent, 20(9), pp.
1243-1253.
The carbon report's blog, 2015. The p ro p o sed South A frican carbon tax. [Online]
Available at: http://www.thecarbonreport.co.za/the-proposed-south-african-carbon-tax/
[Accessed 31 August 2015],
United States Environmental Protection Agency, 2015. Climate change indicatros in the
United States - GHGs. [Online]
Available at: http://www3.epa.gov/climatechange/science/indicators/ghg/index.html
[Accessed 22 November 2015],
Vellini, M. & Savioli, M., 2009. Energy and environmental analysis of glass container
production and recycling. Energy, 34(12), pp. 2137-2143.
101
Wikipedia, 2015. L ist o f p ow er stations in South Africa. [Online]
Available at: https://en.wikipedia.oriz/wiki/List of power stations in South Africa
[Accessed 16 September 2015].
World Nuclear Association, 2015. N uclear p ow er in South Africa. [Online]
Available at: http://www.world-nuclear.org/info/Countrv-Profiles/Countries-Q-S/South-
Africa/
[Accessed 24 October 2015],
World Resource Institute, 2013. The Greenhouse Gas Protocol: A corporate accounting and
reporting standard, Washington: WRI.
Zokaei, K., 2013. The Guardian. [Online]
Available at: http://www.theguardian.com/sustainable-business/environmentallv-friendlv-
sustainable-business-profitable
[Accessed 17 August 2015].
102

Appendix A - South Africa’s Carbon TaxTable 36: South Africa's new carbon tax per industry (Parker & Gilder, 2015)
S e c to rB a s ic T a x F r e e
T h r e s h o l d
T r a d e e x p o s u r e
a l l o w a n c e
P ro c e s s e m is s io n
a l l o w a n c eT o ta l
O f fs e t
p e r c e n t a g e
E le c tric ity 60% “ " 60% 10%
P e tro le u m (coal / gas to
liq u id )60% 10% - 70% 10%
I........................................"... ... ............P e tro le u m - o il re fin e ry 60% 10% - 70% 10%
Iro n & stee l 60% 10% 10% 80% 5%
C e m e n t 60% 10% 10% 80% 5%
G lass & c e ram ic s 60% 10% 10% 80% 5%
C h e m ica ls 60% 10% 10% 80% 5%
P u lp & p a p e r 60% 10% - 70% 10%
S u g ar 60% 10% 70% 10%
A g ricu ltu re , F o re s try and
L and U se6 0 % - 40% 100% 10%
W aste 60% - 40% 100% -
F u g itiv e e m iss io n s: C oa l
m in in g60% 10% 10% 80% 5
O th e r 60% 10% " 70% 10%
103

Appendix B - Data Accuracy and Reliability Standards Used as a
GuidelineD A T A
T h e a c c u r a c y o f th e s tu d y is o n ly a s g o o d a s th e q u a l i ty o f i n p u t d a ta . T h e d e v e lo p m e n t o f m e th o d o lo g y f o r th e
c o l l e c t i o n o f d a ta is e s s e n t ia l to o b t a in in g q u a l i t y d a ta . C a r e f u l a d h e r e n c e to th a t m e th o d o lo g y d e t e r m in e s n o t
o n ly d a t a q u a l i t y b u t a l s o o b j e c t iv i t y . F r a n k l in A s s o c i a t e s h a s d e v e lo p e d a m e th o d o lo g y f o r i n c o r p o r a t in g d a ta
q u a l i t y a n d u n c e r t a in ty in to L C I c a l c u l a t i o n s . D a ta q u a l i t y a n d u n c e r ta in ty a r e d i s c u s s e d in m o r e d e ta i l a t th e e n d
o f t h i s s e c t io n . D a ta n e c e s s a r y f o r c o n d u c t in g th i s a n a ly s i s a r e s e p a r a te d in to tw o c a t e g o r i e s : p r o c e s s - r e l a t e d d a ta
a n d f u e l - r e l a t e d d a ta .
P r o c e s s D a t a
M e th o d o lo g y f o r C o l l e c t i o n /V e r i f i c a t io n . T h e p r o c e s s o f g a th e r in g d a t a is a n i t e r a t iv e o n e . T h e d a t a - g a th e r in g
p r o c e s s f o r e a c h s y s te m b e g in s w i th a l i t e r a tu r e s e a r c h to i d e n t i f y r a w m a te r ia l s a n d p r o c e s s e s n e c e s s a r y to
p r o d u c e th e f in a l p r o d u c t . T h e s e a r c h is t h e n e x te n d e d to id e n t i f y th e r a w m a te r i a l s a n d p r o c e s s e s u s e d to p r o d u c e
th e s e r a w m a te r i a l s . In t h i s w a y , a f lo w d ia g r a m is s y s t e m a t i c a l l y c o n s t r u c t e d to r e p r e s e n t th e p r o d u c t io n p a th w a y
o f e a c h s y s te m . E a c h p r o c e s s id e n t i f i e d d u r in g th e c o n s t r u c t io n o f th e f l o w d ia g r a m is t h e n r e s e a r c h e d to i d e n t i f y
p o te n t i a l i n d u s t r y s o u r c e s f o r d a ta . E a c h s o u r c e f o r p r o c e s s d a ta is c o n ta c t e d a n d w o r k s h e e t s a r e p r o v id e d to a s s i s t
in g a th e r in g th e n e c e s s a r y p r o c e s s d a t a f o r t h e i r p r o d u c t . E a c h w o r k s h e e t is a c c o m p a n ie d b y a d e s c r ip t i o n o f th e
p r o c e s s b o u n d a r ie s . U p o n r e c e ip t o f th e c o m p le t e d w o r k s h e e t s , t h e d a t a a r e e v a lu a te d f o r c o m p le t e n e s s a n d
r e v i e w e d f o r a n y m a te r ia l i n p u ts t h a t a r e a d d i t i o n s o r c h a n g e s to th e f lo w d i a g r a m s . In t h i s w a y , th e f lo w d ia g r a m
is r e v i s e d to r e p r e s e n t c u r r e n t in d u s t r ia l p r a c t i c e s . D a ta s u p p l i e r s a r e th e n c o n ta c te d a g a in to d i s c u s s th e d a ta ,
p r o c e s s t e c h n o lo g y , w a s t e t r e a tm e n t , id e n t i f y c o p r o d u c t s , a n d a n y a s s u m p t io n s n e c e s s a r y to u n d e r s t a n d th e d a ta
a n d b o u n d a r i e s . A f t e r e a c h d a t a s e t h a s b e e n c o m p le t e d a n d v e r i f i e d , th e d a t a s e t s f o r e a c h p r o c e s s a r e a g g r e g a te d
in to a s in g le s e t o f d a t a f o r t h a t p r o c e s s . T h e m e th o d o f a g g r e g a t io n f o r e a c h p r o c e s s is d e t e r m in e d o n a c a s e - b y -
c a s e b a s is . F o r e x a m p le , i f m o r e th a n o n e p r o c e s s t e c h n o lo g y is in v o lv e d , m a r k e t s h a r e s f o r th e s e p r o c e s s e s a r e
u s e d to c r e a te a w e ig h te d a v e r a g e . In t h i s w a y , a r e p r e s e n ta t i v e s e t o f d a t a c a n b e e s t im a te d f ro m a l im i te d n u m b e r
o f d a ta s o u r c e s . T h e p r o v id e d p r o c e s s d a ta s e t a n d a s s u m p t io n s a r e th e n d o c u m e n te d a n d r e tu r n e d w i th th e
a g g r e g a t e d d a t a t o e a c h d a ta s u p p l i e r f o r t h e i r r e v ie w . A t t im e s , th e s c o p e o r b u d g e t o f a n a n a ly s i s d o n o t a l lo w
f o r p r im a r y d a t a c o l l e c t i o n . I n th i s c a s e , s e c o n d a r y d a t a s o u r c e s a r e u s e d . T h e s e s o u r c e s m a y b e o th e r L C I
d a t a b a s e s , g o v e r n m e n t d o c u m e n t s , o r l i t e r a tu r e s o u r c e s .
C o n f id e n t ia l i t y
P o te n t i a l s u p p l i e r s o f d a ta o f te n c o n s id e r th e d a t a r e q u e s te d in th e w o r k s h e e t s p r o p r i e t a r y . T h e m e th o d u s e d to
c o l l e c t a n d r e v i e w d a t a p r o v id e s e a c h s u p p l i e r th e o p p o r tu n i ty to r e v i e w th e a g g r e g a t e d a v e r a g e d a ta c a lc u la te d
f ro m a ll d a t a s u p p l i e d b y in d u s t r y . T h is a l l o w s e a c h s u p p l i e r t o v e r i l y t h a t t h e i r c o m p a n y ’s d a t a a r e n o t b e in g
p u b l i s h e d a n d th a t t h e a v e r a g e d d a ta a r e n o t a g g r e g a t e d in s u c h a w a y th a t in d iv id u a l c o m p a n y d a ta c a n b e
c a lc u la te d o r id e n t i f i e d .
O b j e c t iv i t y
104

E a c h u n i t p r o c e s s is r e s e a r c h e d in d e p e n d e n t ly o f a l l o th e r p r o c e s s e s . N o c a l c u l a t i o n s a r e p e r f o r m e d to l in k
p r o c e s s e s to g e th e r w i th th e p r o d u c t io n o f t h e i r r a w m a te r i a l s u n t i l a f t e r d a t a g a th e r in g a n d r e v i e w a re c o m p le te .
T h e p r o c e d u r e o f p r o v id in g th e a g g r e g a t e d d a ta a n d d o c u m e n ta t io n to s u p p l i e r s a n d o th e r i n d u s t r y e x p e r t s
p r o v id e s s e v e r a l o p p o r tu n i t i e s to r e v i e w th e i n d iv id u a l d a t a s e ts w i th o u t a f f e c t in g th e o b je c t iv i ty o f th e r e s e a r c h .
T h is p r o c e s s s e r v e s a s a n e x te r n a l e x p e r t r e v ie w o f e a c h p r o c e s s . A l s o , b e c a u s e t h e s e d a t a a r e r e v ie w e d
in d iv id u a l ly , a s s u m p t io n s a r e r e v ie w e d b a s e d o n th e i r r e l e v a n c e to th e p r o c e s s r a th e r th a n t h e i r e f f e c t o n th e
o v e r a l l o u t c o m e o f th e s tu d y . D a ta S o u rc e s . T h e g la s s a n d s te e l p r o c e s s d a ta s e ts u s e d in t h i s s tu d y w e r e d r a w n
f r o m F r a n k l in A s s o c i a t e s ' U .S . L C I d a t a b a s e , w h ic h w a s d e v e l o p e d u s in g th e d a t a c o l l e c t i o n a n d r e v i e w p r o c e s s
d e s c r ib e d a b o v e . T h e p l a s t i c s a n d a lu m in u m p r o c e s s d a ta w a s t a k e n f ro m th e U S L C I D a ta b a s e . D a ta f o r th e
f a b r i c a t i o n o f p la s t i c b o t t l e , c a p a n d la b e l w e r e b a s e d o n a c o m b in a t io n o f d a ta p u b l i s h e d b y P l a s t i c s E u r o p e a n d
d a t a c o l l e c t e d b y F r a n k l in A s s o c i a t e s f o r c o n f id e n t ia l i n d u s t r y s o u r c e s . W h i le t h e s e s o u r c e s i n c lu d e E u r o p e a n
d a ta , F r a n k l in A s s o c i a t e s a s s u m e s th a t th e e n e r g y r e q u i r e m e n t s a n d s o l id w a s t e g e n e r a t i o n a s s o c ia te d w i th th e
b lo w m o ld in g o f p l a s t i c b o t t l e s is s im i l a r f o r E u r o p e a n d N o r th A m e r ic a .
F u e l D a t a
W h e n f u e ls a r e u s e d f o r p r o c e s s o r t r a n s p o r t a t i o n e n e r g y , t h e r e a r e e n e r g y a n d e m is s io n s a s s o c i a t e d w i th th e
p r o d u c t io n a n d d e l iv e r y o f th e fu e ls a s w e l l a s th e e n e r g y a n d e m is s io n s r e le a s e d w h e n th e f u e l s a r e b u r n e d . B e f o r e
e a c h f u e l is u s a b le , i t m u s t b e m in e d , a s in th e c a s e o f c o a l o r u r a n iu m , o r e x t r a c te d f ro m t h e e a r th in s o m e m a n n e r .
F u r th e r p r o c e s s in g is o f te n n e c e s s a r y b e f o r e th e fu e l is u s a b le . F o r e x a m p le , c o a l is c r u s h e d o r p u lv e r i z e d a n d
s o m e t im e s c le a n e d . C r u d e o il is r e f in e d to p r o d u c e fu e l o i l s , a n d " w e t " n a tu r a l g a s is p r o c e s s e d to p r o d u c e n a tu ra l
g a s l iq u id s f o r fu e l o r f e e d s to c k . T o d i s t in g u is h b e tw e e n e n v i r o n m e n ta l e m is s io n s f ro m th e c o m b u s t io n o f fu e ls
a n d e m is s io n s a s s o c ia te d w i th th e p r o d u c t io n o f f u e l s , d i f f e r e n t t e r m s a r e u s e d to d e s c r ib e th e d i f f e r e n t e m is s io n s .
T h e c o m b u s t io n p r o d u c t s o f f u e l s a r e d e f in e d a s " c o m b u s t io n d a t a . " E n e r g y c o n s u m p t io n a n d e m is s io n s t h a t r e s u l t
f ro m th e m in in g , r e f in in g , a n d t r a n s p o r t a t i o n o f f u e l s a r e d e f in e d a s “ p r e c o m b u s t io n d a t a . " P r e c o m b u s t io n d a t a
a n d c o m b u s t io n d a ta t o g e t h e r a r e r e f e r r e d to a s " f u e l - r e l a t e d d a t a . " F u e l - r e l a t e d d a t a a r e d e v e lo p e d f o r f u e l s th a t
a r e b u r n e d d i r e c t l y in i n d u s t r i a l f u r n a c e s , b o i l e r s , a n d t r a n s p o r t v e h i c l e s . F u e l - r e l a t e d d a t a a r e a l s o d e v e lo p e d f o r
th e p r o d u c t io n o f e l e c t r i c i t y . T h e s e d a t a a r e a s s e m b le d in to a d a ta b a s e f ro m w h ic h th e e n e r g y r e q u i r e m e n t s a n d
e n v i r o n m e n ta l e m is s io n s f o r th e p r o d u c t io n a n d c o m b u s t io n o f p r o c e s s f u e l s a r e c a lc u la te d . E n e r g y d a ta a re
d e v e lo p e d in th e f o rm o f u n i t s o f e a c h p r im a r y f u e l r e q u i r e d p e r u n i t o f e a c h fu e l ty p e . F o r e l e c t r i c i t y p r o d u c t io n .
I n te r n a t io n a l E n e r g y A g e n c y s ta t i s t i c a l r e c o r d s p r o v id e d d a t a f o r th e a m o u n t o f fu e l r e q u i r e d to p r o d u c e e le c t r i c i ty
f ro m e a c h fu e l s o u r c e a n d th e to ta l a m o u n t o f e l e c t r i c i ty g e n e r a t e d f ro m p e t r o l e u m , n a tu r a l g a s , c o a l , n u c le a r ,
h y d r o p o w e r , a n d o th e r ( s o la r , g e o th e r m a l , e tc .) . L i t e r a tu r e s o u r c e s a n d U .S . f e d e r a l g o v e r n m e n t s t a t i s t i c a l r e c o r d s
p r o v id e d d a t a f o r th e e m is s io n s r e s u l t i n g f r o m t h e c o m b u s t io n o f f u e ls in u t i l i ty b o i l e r s , in d u s t r i a l b o i le r s ,
s t a t i o n a r y e q u ip m e n t s u c h a s p u m p s a n d c o m p r e s s o r s , a n d t r a n s p o r t a t i o n e q u ip m e n t . B e c a u s e e l e c t r i c i t y is
r e q u i r e d to p r o d u c e p r im a r y f u e l s , w h ic h a r e in t u r n u s e d to g e n e r a te e le c t r i c i t y , a c i r c u l a r lo o p is c r e a te d . I t e r a t io n
t e c h n iq u e s a r e u t i l i z e d to r e s o lv e th i s lo o p . In 2 0 0 3 , F r a n k l in A s s o c i a t e s u p d a te d th e i r f u e ls a n d e n e r g y d a t a b a s e
f o r i n c lu s io n in th e U .S . L C I d a t a b a s e . W ith t h e e x c e p t io n o f th e e l e c t r i c i ty fu e l s o u r c e s a n d g e n e r a t io n , th i s U .S .
f u e ls a n d e n e r g y d a t a b a s e is u s e d in t h i s a n a ly s i s .
D a ta Q u a l i t y G o a ls f o r T h is S t u d y
105

I S O s t a n d a r d s 1 4 0 4 0 a n d 1 4 0 4 4 d e ta i l v a r io u s a s p e c t s o f d a ta q u a l i ty a n d d a ta q u a l i ty a n a ly s i s . T h e s e IS O
S ta n d a r d s s ta te : “ D e s c r ip t i o n s o f d a t a q u a l i t y a r e i m p o r t a n t t o u n d e r s t a n d th e r e l i a b i l i ty o f t h e s tu d y r e s u l t s a n d
p r o p e r ly in te r p r e t th e o u t c o m e o f th e s t u d y . ’7 T h e s e I S O S ta n d a r d s l i s t th r e e c r i t ic a l d a ta q u a l i ty r e q u i r e m e n t s :
t im e - r e l a t e d c o v e r a g e , g e o g r a p h ic a l c o v e r a g e , a n d t e c h n o lo g y c o v e r a g e . A d d i t io n a l d a ta q u a l i t y d e s c r ip to r s th a t
s h o u ld b e c o n s i d e r e d in c lu d e w h e th e r p r im a r y o r s e c o n d a r y d a ta w e r e u s e d a n d w h e th e r th e d a t a w e r e m e a s u r e d ,
c a l c u l a t e d , o r e s t im a te d . T h e d a t a q u a l i ty g o a l f o r t h i s s tu d y is to u s e th e b e s t a v a i l a b l e a n d m o s t r e p r e s e n ta t i v e
d a t a f o r th e m a te r ia l s u s e d a n d p r o c e s s e s p e r f o r m e d in t e r m s o f t im e , g e o g r a p h ic , a n d t e c h n o lo g y c o v e r a g e . A ll
f u e l d a t a w e r e r e v i e w e d a n d u p d a te d in 2 0 0 3 f o r th e U n i te d S ta te s . E le c t r i c i ty fu e l s o u r c e s a n d g e n e r a t io n m e e t
a ll th e d a ta q u a l i t y g o a l s .
D a ta A c c u r a c y
A n im p o r ta n t i s s u e t o c o n s id e r w h e n u s in g L C I s tu d y r e s u l t s is th e r e l i a b i l i t y o f th e d a ta . In a c o m p le x s tu d y w i th
l i te r a l ly th o u s a n d s o f n u m e r i c e n t r i e s , th e a c c u r a c y o f t h e d a ta a n d h o w it a f f e c t s c o n c lu s io n s is t r u ly a c o m p le x
s u b je c t , a n d o n e th a t d o e s n o t le n d i t s e l f to s ta n d a r d e r r o r a n a ly s i s t e c h n iq u e s . T e c h n iq u e s s u c h a s M o n te C a r lo
a n a ly s i s c a n b e u s e d to s tu d y u n c e r t a in ty , b u t th e g r e a t e s t c h a l l e n g e is th e la c k o f u n c e r t a in ty d a t a o r p r o b a b i l i t y
d i s t r i b u t io n s f o r k e y p a r a m e te r s , w h ic h a r e o f te n o n ly a v a i l a b l e a s s in g le p o in t e s t im a te s . H o w e v e r , th e r e l i a b i l i ty
o f th e s tu d y c a n b e a s s e s s e d in o th e r w a y s . A k e y q u e s t io n is w h e th e r th e L C I p r o f i l e s a r e a c c u r a te a n d s tu d y
c o n c lu s io n s a r e c o r r e c t . I t is im p o r t a n t th a t th e e n v i r o n m e n ta l p r o f i l e s a c c u r a t e ly r e f le c t th e r e l a t i v e m a g n i tu d e o f
e n e r g y r e q u i r e m e n t s a n d o t h e r e n v i r o n m e n ta l b u r d e n s f o r th e v a r io u s m a te r ia l s a n a ly z e d . T h e a c c u r a c y o f a n
e n v i r o n m e n ta l p r o f i l e d e p e n d s o n th e a c c u r a c y o f t h e n u m b e r s th a t a r e c o m b in e d to a r r i v e a t th a t c o n c lu s io n .
B e c a u s e o f th e m a n y p r o c e s s e s r e q u i r e d to p r o d u c e s o f t d r in k c o n ta in e r s , m a n y n u m b e r s in th e L C I a re a d d e d
t o g e th e r f o r a t o ta l n u m e r i c r e s u l t . E a c h n u m b e r b y i t s e l f m a y c o n t r ib u te l i t t le to th e to ta l , s o th e a c c u r a c y o f e a c h
n u m b e r b y i t s e l f h a s a s m a ll e f f e c t o n th e o v e r a l l a c c u r a c y o f th e to ta l . T h e r e is n o w id e ly a c c e p te d a n a ly t ic a l
m e th o d f o r a s s e s s in g t h e a c c u r a c y o f e a c h n u m b e r to a n y d e g r e e o f c o n f id e n c e . T h e r e a r e s e v e ra l o th e r im p o r ta n t
p o in t s w i th r e g a r d to d a ta a c c u r a c y . E a c h n u m b e r g e n e r a l ly c o n t r ib u te s a s m a ll p a r t to th e to ta l v a lu e , s o a la r g e
e r r o r in o n e d a ta p o in t d o e s n o t n e c e s s a r i l y c r e a t e a p r o b le m . F o r p r o c e s s s te p s th a t m a k e a l a r g e r th a n a v e r a g e
c o n t r ib u t io n to th e to ta l , s p e c ia l c a r e is t a k e n w i th th e d a t a q u a l i ty . I t is a s s u m e d th a t w i th c a r e f u l s c r u t in y o f th e
d a ta , a n y e r r o r s w il l b e r a n d o m . T h a t is , s o m e n u m b e r s w i l l b e a l i t t le h ig h d u e to e r r o r s , a n d s o m e w i l l b e s l ig h t ly
lo w , b u t in th e s u m m i n g p r o c e s s t h e s e r a n d o m h ig h a n d lo w e r r o r s w il l o f f s e t e a c h o t h e r to s o m e e x t e n t . T h e r e is
a n o th e r d i m e n s io n to th e r e l i a b i l i ty o f th e d a ta . C e r ta in n u m b e r s d o n o t s t a n d a lo n e , b u t r a th e r a f f e c t s e v e ra l
n u m b e r s in th e s y s te m . A n e x a m p le is th e a m o u n t o f a r a w m a te r ia l r e q u i r e d f o r a p r o c e s s . T h is n u m b e r w il l a f f e c t
e v e r y s te p in t h e p r o d u c t io n s e q u e n c e p r i o r t o th e p r o c e s s . E r r o r s s u c h a s t h i s t h a t p r o p a g a te t h r o u g h o u t t h e s y s te m
a r e m o r e s ig n i f i c a n t in s t e p s t h a t a r e c lo s e s t to th e e n d o f th e p r o d u c t io n s e q u e n c e . F o r e x a m p le , c h a n g in g th e
w e ig h t o f a n i n p u t t o th e f a b r i c a t i o n o f a c o n ta in e r c h a n g e s th e a m o u n t s o f th e i n p u ts to th a t p r o c e s s , a n d s o o n
b a c k to th e q u a n t i t i e s o f r a w m a te r ia l s .
” ( F r a n k l in A s s o c i a t e s , 2 0 0 9 )
106

Appendix C - MS Excel Model (CD)

Appendix D - GHG protocol calculation tool exampleFigure 42 is a snapshot of the (World Resource Institute, 2013) GWP calculation tool used by
this report.
A G R EEN H O U SE V GAS PROTOCOL
Facility information Consumption data Emissions
% of electricity used
by the facility Country or Region Region (if available) Year fu e l mix Amount Units C 0 , [ le n rw | CH« | l g | W , 0 M
C 0 2e
(tonnes)
Notes
MS>iMfo i3E U4 :r ' ■ ;a "■ * ■■■UMr/tvs Da ; % te § - ut —a Mirta “ ‘ “ ‘J5 Ut)C SoiihAfrica 3v:Vl. .' '2SIC Cd 2HMi
■■____:____ _____ . i___ 1
Figure 42: GH'P calculation too! example (World Resource Institute, 2013)