Embed Size (px)
Citation preview
8/3/2019 Producer Price Indexes -October 2011
http://slidepdf.com/reader/full/producer-price-indexes-october-2011 1/22
Transmission of material in this release is embargoed until USDL-11-1643
8:30 a.m. (EST), Tuesday, November 15, 2011
Technical information: (202) 691-7705 • [email protected] • www.bls.gov/ppiMedia contact: (202) 691-5902 • [email protected]
PRODUCER PRICE INDEXES – OCTOBER 2011
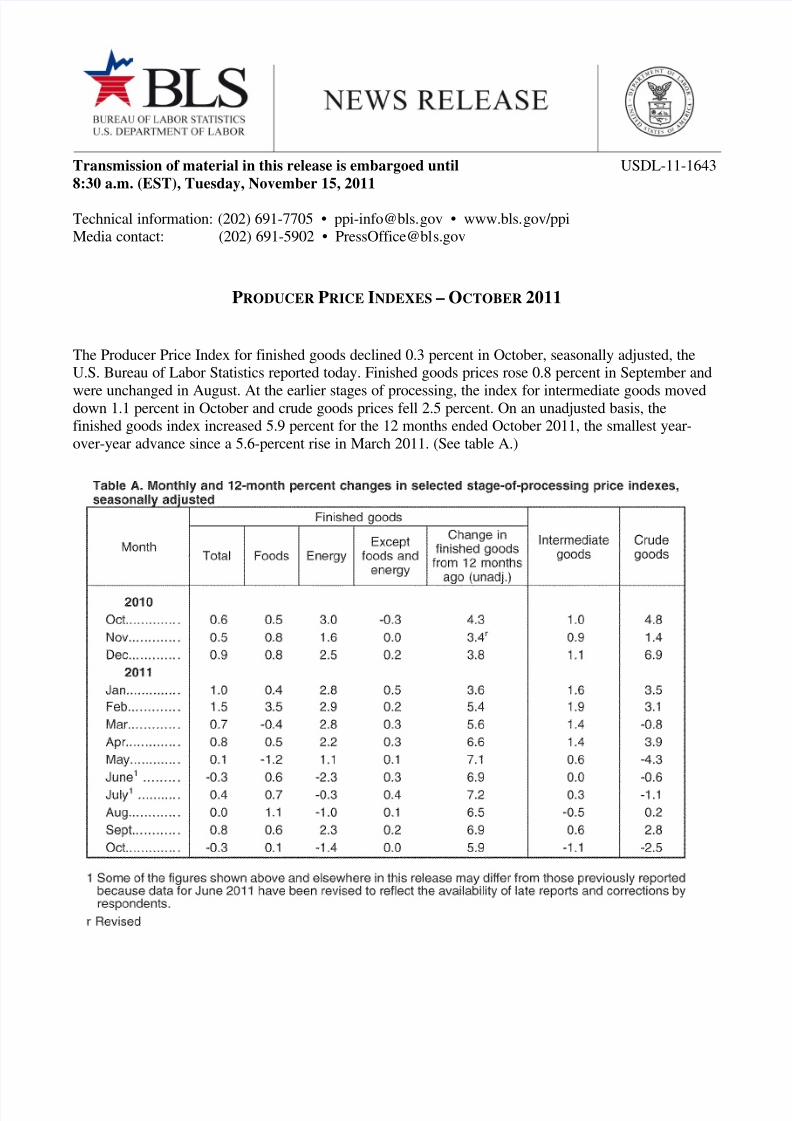
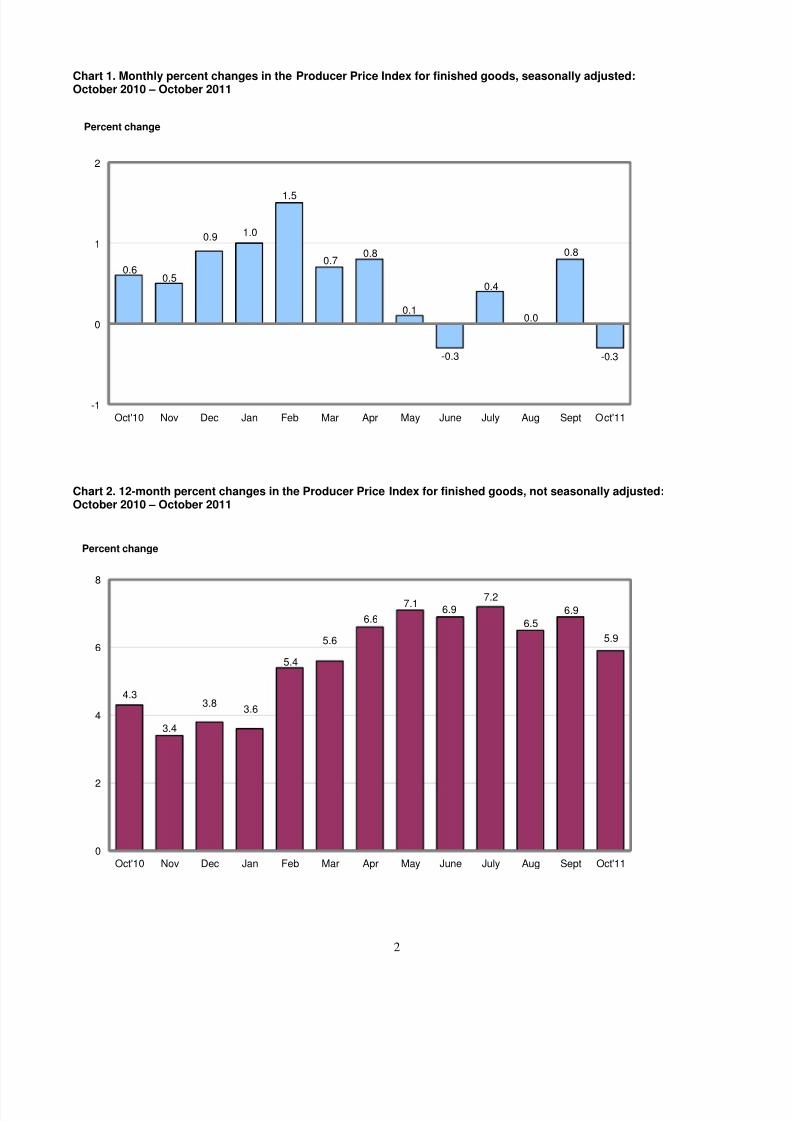
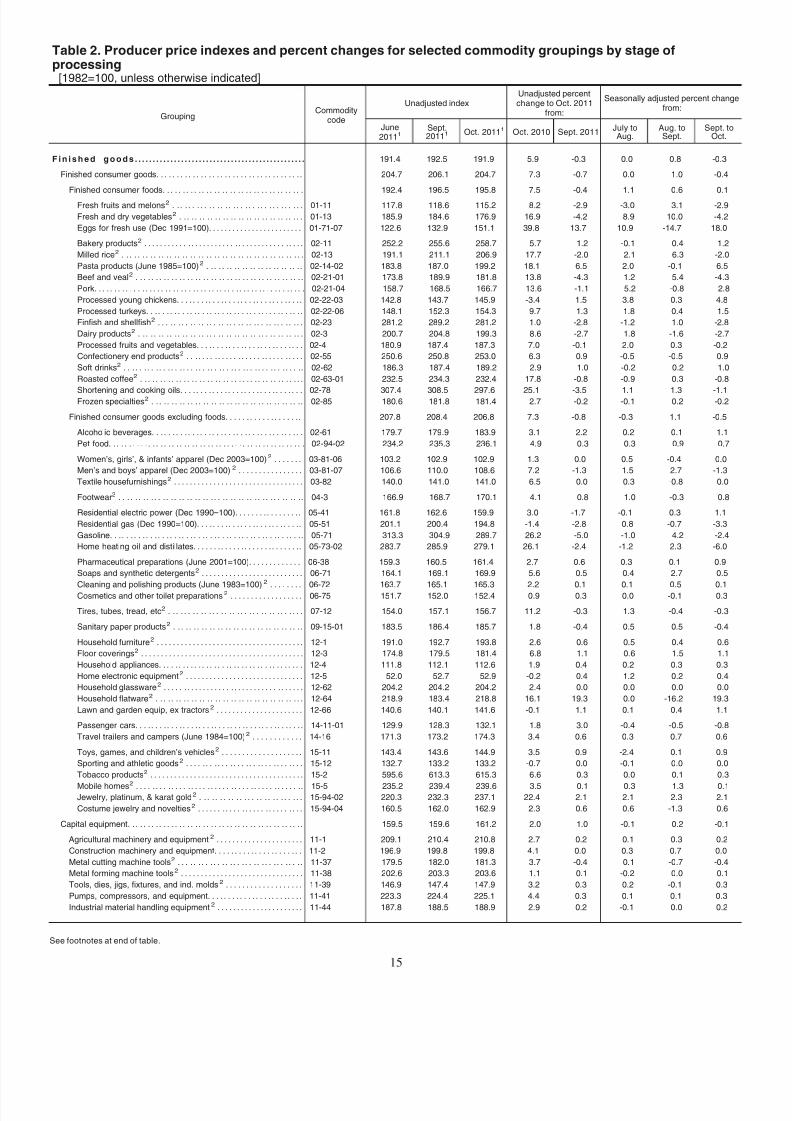
The Producer Price Index for finished goods declined 0.3 percent in October, seasonally adjusted, theU.S. Bureau of Labor Statistics reported today. Finished goods prices rose 0.8 percent in September and
were unchanged in August. At the earlier stages of processing, the index for intermediate goods moveddown 1.1 percent in October and crude goods prices fell 2.5 percent. On an unadjusted basis, thefinished goods index increased 5.9 percent for the 12 months ended October 2011, the smallest year-
over-year advance since a 5.6-percent rise in March 2011. (See table A.)
8/3/2019 Producer Price Indexes -October 2011
http://slidepdf.com/reader/full/producer-price-indexes-october-2011 2/22
2
Chart 1. Monthly percent changes in the Producer Price Index for finished goods, seasonally adjusted:October 2010 – October 2011
Chart 2. 12-month percent changes in the Producer Price Index for finished goods, not seasonally adjusted:October 2010 – October 2011
0.60.5
0.9 1.0
1.5
0.70.8
0.1
-0.3
0.4
0.0
0.8
-0.3
-1
0
1
2
Oct'10 Nov Dec Jan Feb Mar Apr May June July Aug Sept Oct'11
Percent change
4.3
3.4
3.83.6
5.4
5.6
6.6
7.16.9
7.2
6.5
6.9
5.9
0
2
4
6
8
Oct'10 Nov Dec Jan Feb Mar Apr May June July Aug Sept Oct'11
Percent change
8/3/2019 Producer Price Indexes -October 2011
http://slidepdf.com/reader/full/producer-price-indexes-october-2011 3/22
3
Stage-of-Processing Analysis
Finished goods
In October, the decrease in finished goods prices was the result of a 1.4-percent drop in the index for finished
energy goods. By contrast, prices for finished consumer foods inched up 0.1 percent. The index for finished
goods less foods and energy was unchanged.
Finished energy: Prices for finished energy goods moved down 1.4 percent in October, the largest decrease
since a 2.3-percent drop in June 2011. Nearly two-thirds of the October decline can be attributed to the
gasoline index, which fell 2.4 percent. Lower prices for residential natural gas and home heating oil also
were factors in the drop in the finished energy goods index. (See table 2.)
Finished foods: The index for finished consumer foods advanced 0.1 percent in October, the fifth
consecutive monthly increase. Leading the October rise were prices for processed poultry, which moved up
4.8 percent. An increase in the index for eggs for fresh use also contributed to higher prices for finished
consumer foods.
Finished core: The index for finished goods less foods and energy was unchanged in October following tenstraight monthly advances. In October, higher prices for pharmaceutical preparations and civilian aircraft
offset lower prices for light motor trucks and passenger cars, which declined 1.6 percent and 0.8 percent,
respectively. (On a not seasonally adjusted basis, the index for light motor trucks increased 4.5 percent and
prices for passenger cars moved up 3.0 percent.) In accordance with usual practice, most new-model-year
passenger cars and light motor trucks were introduced into the PPI in October. (See Report on Quality
Changes for 2012 Model Vehicles, at www.bls.gov/web/ppi/ppimotveh.htm).
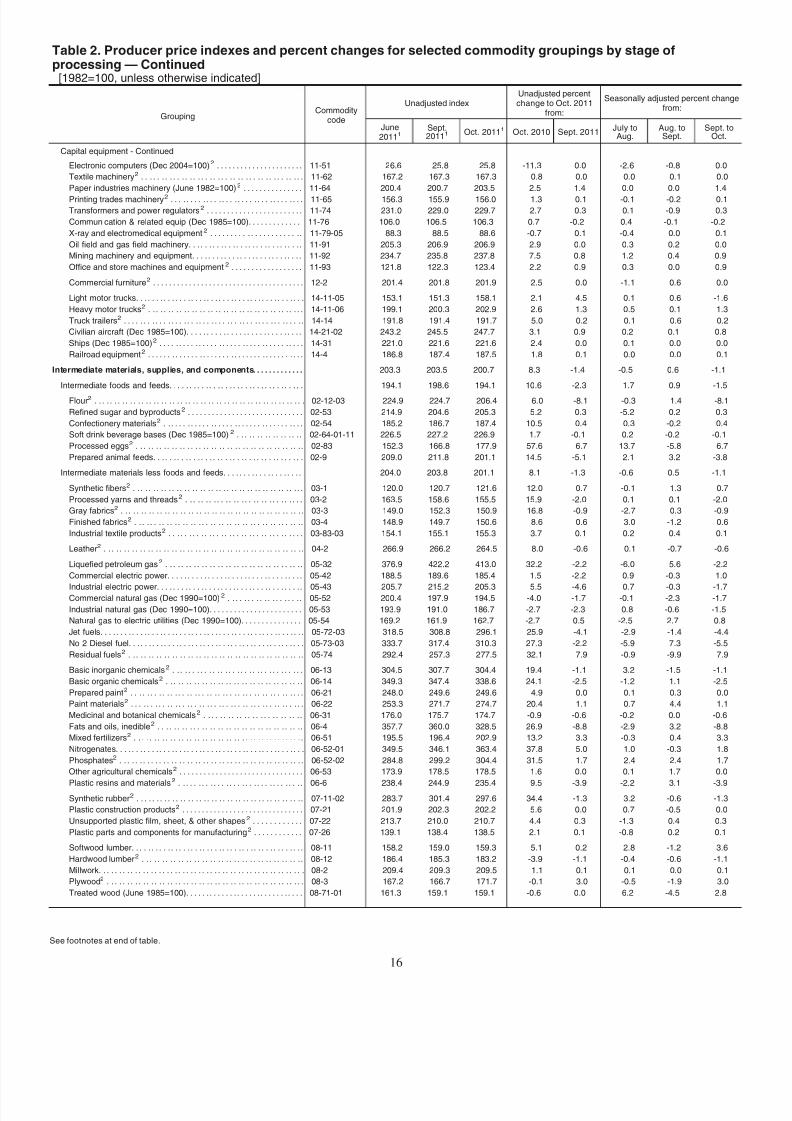
Intermediate goods
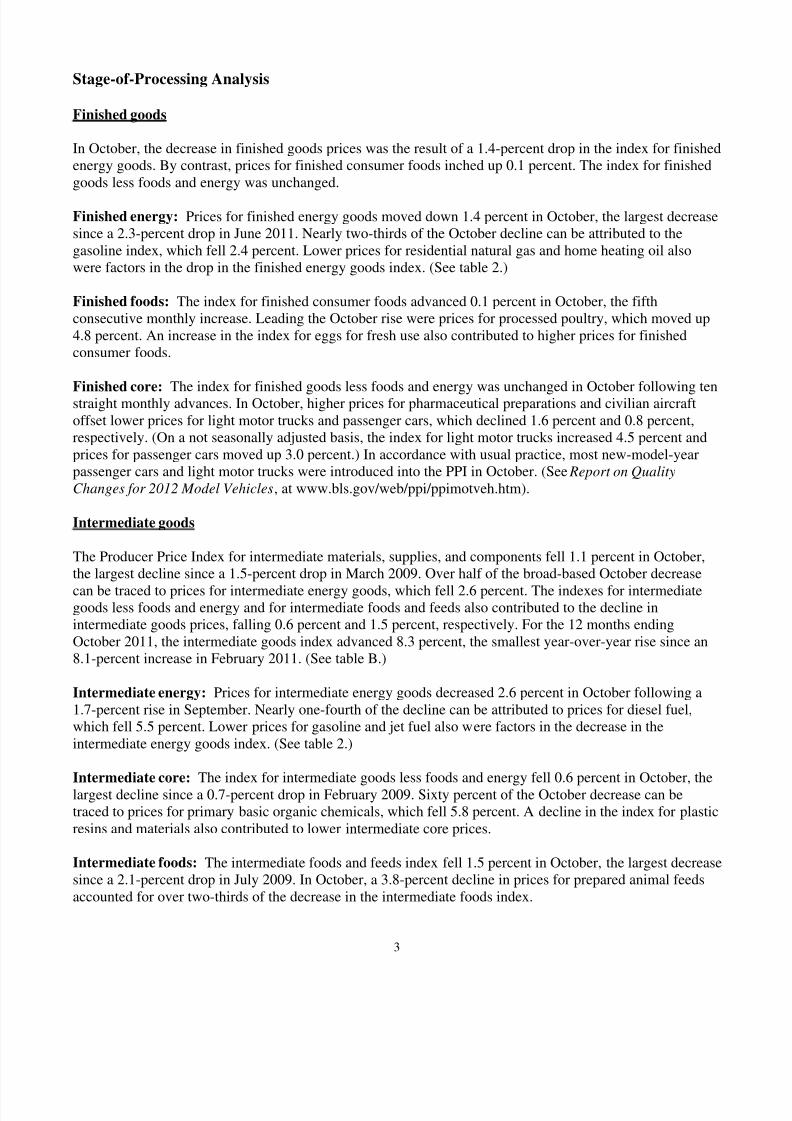
The Producer Price Index for intermediate materials, supplies, and components fell 1.1 percent in October,
the largest decline since a 1.5-percent drop in March 2009. Over half of the broad-based October decrease
can be traced to prices for intermediate energy goods, which fell 2.6 percent. The indexes for intermediategoods less foods and energy and for intermediate foods and feeds also contributed to the decline in
intermediate goods prices, falling 0.6 percent and 1.5 percent, respectively. For the 12 months ending
October 2011, the intermediate goods index advanced 8.3 percent, the smallest year-over-year rise since an
8.1-percent increase in February 2011. (See table B.)
Intermediate energy: Prices for intermediate energy goods decreased 2.6 percent in October following a
1.7-percent rise in September. Nearly one-fourth of the decline can be attributed to prices for diesel fuel,
which fell 5.5 percent. Lower prices for gasoline and jet fuel also were factors in the decrease in the
intermediate energy goods index. (See table 2.)
Intermediate core: The index for intermediate goods less foods and energy fell 0.6 percent in October, the
largest decline since a 0.7-percent drop in February 2009. Sixty percent of the October decrease can be
traced to prices for primary basic organic chemicals, which fell 5.8 percent. A decline in the index for plastic
resins and materials also contributed to lower intermediate core prices.
Intermediate foods: The intermediate foods and feeds index fell 1.5 percent in October, the largest decrease
since a 2.1-percent drop in July 2009. In October, a 3.8-percent decline in prices for prepared animal feeds
accounted for over two-thirds of the decrease in the intermediate foods index.
8/3/2019 Producer Price Indexes -October 2011
http://slidepdf.com/reader/full/producer-price-indexes-october-2011 4/22
4
Chart 3. Monthly percent changes in the Producer Price Index for intermediate goods, seasonally adjusted:October 2010 – October 2011
Chart 4. 12-month percent changes in the Producer Price Index for intermediate goods, not seasonally adjusted:October 2010 – October 2011
1.0 0.91.1
1.6
1.9
1.4 1.4
0.6
0.0
0.3
-0.5
0.6
-1.1
-2
-1
0
1
2
3
Oct'10 Nov Dec Jan Feb Mar Apr May June July Aug Sept Oct'11
Percent change
6.25.9
6.3 6.2
8.1
9.1
9.710.3
10.9
11.6
10.3 10.5
8.3
0
2
4
6
8
10
12
14
Oct'10 Nov Dec Jan Feb Mar Apr May June July Aug Sept Oct'11
Percent change
8/3/2019 Producer Price Indexes -October 2011
http://slidepdf.com/reader/full/producer-price-indexes-october-2011 5/22
5
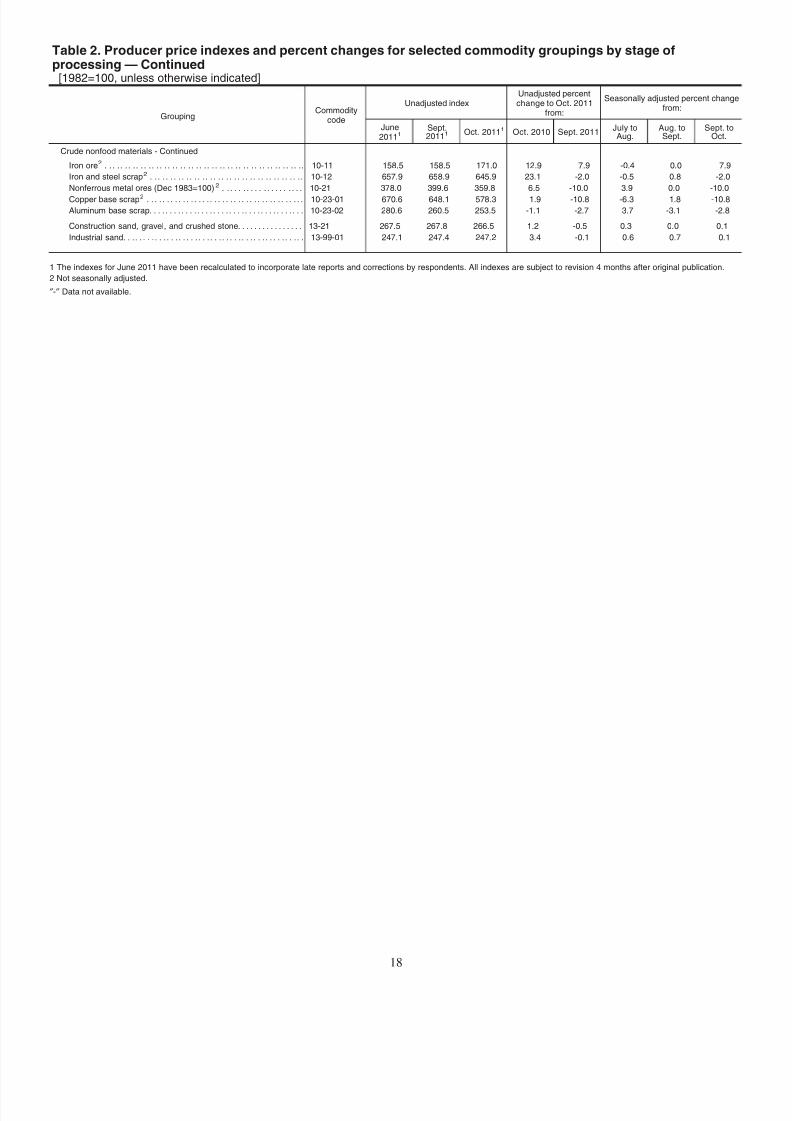
Crude goods
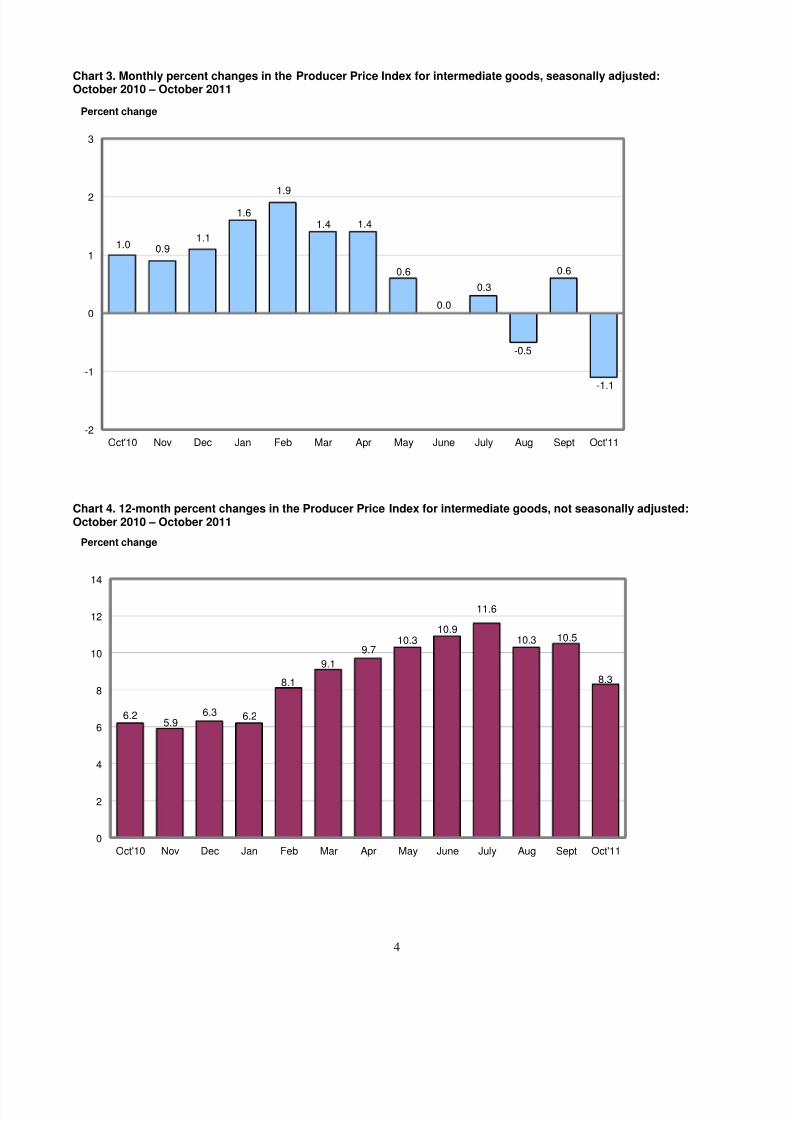
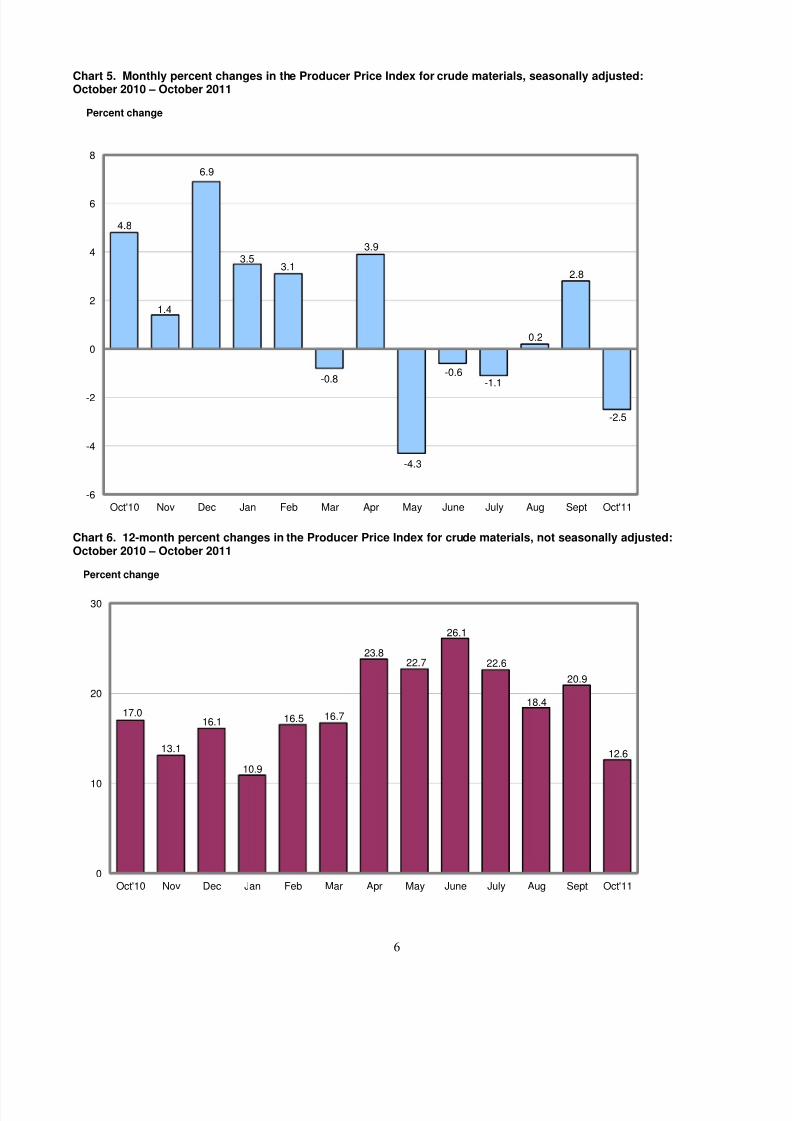
The Producer Price Index for crude materials for further processing fell 2.5 percent in October. For the 3
months ending in October, prices for crude materials advanced 0.4 percent following a 5.9-percent
decrease from April to July. In October, nearly forty percent of the broad-based monthly decline can betraced to a 4.3-percent drop in the index for crude nonfood materials less energy. Lower prices for crude
energy materials and for crude foodstuffs and feedstuffs – down 2.2 percent and 1.8 percent,
respectively – also contributed to the October decrease in the crude goods index. (See table B.)
Crude core: The index for crude nonfood materials less energy declined 4.3 percent in October. From
July to October, prices for crude nonfood materials less energy moved down 1.8 percent after increasing
0.3 percent in the preceding 3-month period. In October, over forty-five percent of the monthly decreaseis attributable to a 10.0-percent drop in the index for nonferrous metal ores. Falling prices for nonferrous
scrap and corn also were significant factors in the October decline in crude core prices. (See table 2.)
Crude energy: Prices for crude energy materials fell 2.2 percent in October. From July to October, the
crude energy materials index edged down 0.1 percent following an 11.6-percent drop for the 3 months
ending in July. In October, over eighty-five percent of the monthly decrease can be traced to the natural
gas index, which fell 5.9 percent. Lower prices for crude petroleum also contributed to the decline in theindex for crude energy materials.
Crude foods: Prices for crude foodstuffs and feedstuffs decreased 1.8 percent in October. For the 3months ending in October, the index for crude foodstuffs and feedstuffs advanced 1.9 percent after
moving down 3.2 percent from April to July. In October, a 9.3-percent drop in corn prices accounted for
over eighty percent of the decline in the crude foods index.
8/3/2019 Producer Price Indexes -October 2011
http://slidepdf.com/reader/full/producer-price-indexes-october-2011 6/22
6
Chart 5. Monthly percent changes in the Producer Price Index for crude materials, seasonally adjusted:October 2010 – October 2011
Chart 6. 12-month percent changes in the Producer Price Index for crude materials, not seasonally adjusted:October 2010 – October 2011
4.8
1.4
6.9
3.53.1
-0.8
3.9
-4.3
-0.6-1.1
0.2
2.8
-2.5
-6
-4
-2
0
2
4
6
8
Oct'10 Nov Dec Jan Feb Mar Apr May June July Aug Sept Oct'11
Percent change
17.0
13.1
16.1
10.9
16.5 16.7
23.822.7
26.1
22.6
18.4
20.9
12.6
0
10
20
30
Oct'10 Nov Dec Jan Feb Mar Apr May June July Aug Sept Oct'11
Percent change
8/3/2019 Producer Price Indexes -October 2011
http://slidepdf.com/reader/full/producer-price-indexes-october-2011 7/22
7
Services Analysis
Trade industries: The Producer Price Index for the net output of total trade industries moved down 1.0percent in October, the largest decrease since a 1.4-percent decline in June 2010. (Trade indexes
measure changes in margins received by wholesalers and retailers.) Nearly forty percent of the October
drop can be attributed to the index for merchant wholesalers of nondurable goods, which fell 2.0
percent. Lower margins received by gasoline stations with convenience stores and family clothing storesalso were factors in the decrease in the total trade industries index.
Transportation and warehousing industries: The Producer Price Index for the net output of transportation and warehousing industries climbed 0.4 percent in October, the largest increase since a
0.6-percent rise in May 2011. Leading the October advance, the index for the scheduled air
transportation industry group moved up 2.2 percent. Higher prices received for long-distance generalfreight trucking and inland water freight transportation also contributed to the increase in the
transportation and warehousing industries index.
Traditional service industries: The Producer Price Index for the net output of total traditional service
industries edged down 0.1 percent, the first decline since falling 0.4 percent in May 2011. The index for
the depository credit intermediation industry group led the October decrease, dropping 1.7 percent.
Lower prices for portfolio management services and passenger car rental also were factors in the declinein the total traditional service industries index.
____________
The Producer Price Index for November 2011 is scheduled to be released on Thursday, December
15, 2011 at 8:30 a.m. (EST).
PPI Weights to be Updated
The Bureau of Labor Statistics will soon update the value weights used to calculate Producer Price Indexes to
more accurately reflect recent production and marketing patterns. The new weights, which will be introduced inFebruary 2012 with the release of January 2012 index data, will be based on shipment values from the year 2007.
These value weights come from the Census of Manufactures, the Census of Mining, the Census of Services, and
the Census of Agriculture. PPI weights have been based on 2002 census shipment values since January 2007.
All PPIs will be affected by this weight update, including all the industry net output indexes, as well as indexes
for traditional commodity groupings. In addition, weights will be updated from the 2002 to the 2007 census for all
stage-of-processing indexes, durability of product indexes, and special commodity-grouping indexes. This weight
revision will not change any arithmetic reference bases for indexes, the dates when PPIs were set to 100.
The basic structures of the PPI commodity and stage-of-processing classification systems will not change as a
result of the weight revision. The PPIs classified according to the North American Industry Classification System
(NAICS), however, will be updated in February 2012 with the release of January 2012 index data to reflect 2012NAICS definitions established by the U.S. Census Bureau. The weight update will also result in significant shifts
in the relative importance of various industries and products. These shifts will impact aggregate indexes in a
manner commensurate with the relative gains and losses in value weights from 2002 to 2007.
Commodity and stage-of-processing relative importance figures for December 2011 will be available on February
14, 2012, two business days prior to the release of January 2012 PPI data. This information will be available on
the PPI website at www.bls.gov/ppi or by calling the Division of Industrial Prices and Price Indexes, Section of
Index Analysis and Public Information at (202) 691-7705.
8/3/2019 Producer Price Indexes -October 2011
http://slidepdf.com/reader/full/producer-price-indexes-october-2011 8/22
8
Technical Note
Brief Explanation of Producer Price Indexes
The Producer Price Index (PPI) of the Bureau of Labor Statistics (BLS) is a family of indexes that measure theaverage change over time in the prices received by domesticproducers of goods and services. PPIs measure price changefrom the perspective of the seller. This contrasts with othermeasures, such as the Consumer Price Index (CPI). CPIsmeasure price change from the purchaser’s perspective.Sellers’ and purchasers’ prices can differ due to governmentsubsidies, sales and excise taxes, and distribution costs.
More than 9,000 PPIs for individual products andgroups of products are released each month. PPIs areavailable for the products of virtually every industry in themining and manufacturing sectors of the U.S. economy. NewPPIs are gradually being introduced for the products of industries in the construction, trade, finance, and servicessectors of the economy.
More than 100,000 price quotations per month areorganized into three sets of PPIs: (1) Stage-of-processing
indexes, (2) commodity indexes, and (3) indexes for the netoutput of industries and their products. The stage-of-processing structure organizes products by class of buyer anddegree of fabrication. The commodity structure organizesproducts by similarity of end use or material composition.The entire output of various industries is sampled to deriveprice indexes for the net output of industries and theirproducts.
Stage-of-Processing Indexes
Within the stage-of-processing system, finishedgoods are commodities that will not undergo further
processing and are ready for sale to the final-demand user,either an individual consumer or business firm. Consumerfoods include unprocessed foods such as eggs and freshvegetables, as well as processed foods such as bakery productsand meats. Other finished consumer goods include durablegoods such as automobiles, household furniture, andappliances, as well as nondurable goods such as apparel andhome heating oil. Capital equipment includes durable goodssuch as heavy motor trucks, tractors, and machine tools.
The stage-of-processing category for intermediatematerials, supplies, and components consists partly of commodities that have been processed but require furtherprocessing. Examples of such semifinished goods include
flour, cotton yarn, steel mill products, and lumber. Theintermediate goods category also encompasses nondurable,physically complete items purchased by business firms asinputs for their operations. Examples include diesel fuel, beltsand belting, paper boxes, and fertilizers.
Crude materials for further processing are productsentering the market for the first time that have not beenmanufactured or fabricated and that are not sold directly toconsumers. Crude foodstuffs and feedstuffs include itemssuch as grains and livestock. Examples of crude nonfoodmaterials include raw cotton, crude petroleum, coal, hides andskins, and iron and steel scrap.
Commodity Indexes
The commodity classification structure of the PPIorganizes goods and services by similarity of materiacomposition or end use, disregarding their industry of originTable 6 of the PPI Detailed Report includes data forcommodity indexes, organized in a hierarchal structureincluding major commodity groupings (two-digit commoditycodes), subgroups (three-digit codes), product classes (fourdigit codes), subproduct classes (five- and six-digit codes)item groupings (seven-digit codes) and individual items(eight-, nine-, and ten-digit codes).
Industry Net-Output Price Indexes
PPIs for the net output of industries and theirproducts are grouped according to the North AmericanIndustry Classification System (NAICS). Prior to the releaseof January 2004, industry-based PPIs were publishedaccording to the Standard Industrial Classification (SIC)
system. Industry price indexes are compatible with otheeconomic time series organized by industry, such as data onemployment, wages, and productivity. Table 5 of the PPI
Detailed Report includes data for NAICS industries andindustry groups (3-, 4-, 5-, and 6-digit codes), Census productclasses (7- and 8-digit codes), products (9-digit codes), andmore detailed subproducts (11-digit codes), and, for someindustries, indexes for other sources of revenue.
Indexes may represent one of three kinds of produccategories. Every industry has primary product indexes toshow changes in prices received by establishments classifiedin the industry for products made primarily, but nonecessarily exclusively, by that industry. The industry
classification of an establishment is determined by whichproducts make up a plurality of its total shipment value. Inaddition, most industries have secondary product indexes thatshow changes in prices received by establishments classifiedin the industry for products chiefly made in some otherindustry. Finally, some industries have miscellaneous receiptsindexes to show price changes in other sources of revenuereceived by establishments within the industry that are notderived from sales of their products—for example, resales ofpurchased materials, or revenues from parking lots owned by amanufacturing plant.
Data Collection
PPIs are based on selling prices reported byestablishments of all sizes selected by probability samplingwith the probability of selection proportionate to sizeIndividual items and transaction terms from these firms alsoare chosen by probability proportionate to size. BLS stronglyencourages cooperating companies to supply actuatransaction prices at the time of shipment to minimize the useof list prices. Prices submitted by survey respondents areeffective on the Tuesday of the week containing the 13th dayof the month. This survey is conducted primarily through themail.
8/3/2019 Producer Price Indexes -October 2011
http://slidepdf.com/reader/full/producer-price-indexes-october-2011 9/22
9
Price data are provided on a voluntary andconfidential basis; only sworn BLS employees are allowedaccess to individual company price reports. BLS publishesprice indexes instead of actual prices. All PPIs are subject torevision 4 months after original publication to reflect theavailability of late reports and corrections by respondents.
BLS periodically updates the PPI sample of surveyrespondents to better reflect current conditions when thestructure, membership, technology, or product mix of anindustry shifts significantly and to spread reporting burdenamong smaller firms. Results of these resampling efforts areincorporated into the PPI with the release of data for Januaryand July.
As part of an ongoing effort to expand coverage tosectors of the economy other than mining and manufacturing,an increasing number of service sector industries have beenintroduced into the PPI. The following list of industriesintroduced since the mid-1990s includes the month and year inwhich an article describing the industry’s content appeared inthe PPI Detailed Report .
Service sector industries introduced into the Producer PriceIndex, by SIC or NAICS code and the PPI Detailed Report thatannounces their introduction
Title Code PPI Detailed Report Issue
SIC
Wireless telecommunications …………. 4812 July 1999
Telephone communications, exceptradio telephone …………………………. 4813 July 1995Television broadcasting ……………….. 4833 July 2002
Grocery stores ………………………….. 5411 July 2000
Meat and fish (seafood) markets ……... 5421 July 2000
Fruit and vegetable markets …………... 5431 July 2000
Candy, nut, and confectionery stores … 5441 July 2000
Retail bakeries ………………………….. 5461 July 2000
Miscellaneous food stores …………….. 5499 July 2000New car dealers ………………………… 5511 July 2000
Gasoline service stations ……………… 5541 January 2002
Boat dealers …………………………….. 5551 January 2002
Recreational vehicle dealers ………….. 5561 January 2002
Miscellaneous retail ……………………. 59 January 2001
Security brokers, dealers, andinvestment bankers …………………….. 6211 January 2001Investment advice ……………………… 6282 January 2003
Life insurance carriers …………………. 6311 January 1999
Property and casualty insurance ……… 6331 July 1998
Insurance agencies and brokerages …. 6412 January 2003
Operators and lessors of nonresidential
buildings …………………………………. 6512 January 1996Real estate agents and managers ……. 6531 January 1996
Prepackaged software …………………. 7372 January 1998
Data processing services ……………… 7374 January 2002
Home health care services ……………. 8082 January 1997
Legal services …………………………... 8111 January 1997
Engineering design, analysis, andconsulting services …………………….. 8711 January 1997Architectural design, analysis, andconsulting services ……………………... 8712 January 1997Premiums for property and casualtyinsurance ………………………………... 9331 July 1998
Title Code PPI Detailed Report Issue
NAICS
New Industrial building construction ….. 236211 January 2008
New warehouse building construction .. 236221 July 2005
New school construction ………………. 236222 July 2006
New office construction ………………... 236223 January 2007
Concrete contractors, nonresidential
building work ……………………………. 23811X July 2008Roofing contractors, nonresidentialbuilding work ……………………………. 23816X July 2008Electrical contractors, nonresidentialbuilding work ……………………………. 23821X July 2008Plumbing / HVAC contractors,nonresidential building work ..…………. 23822X July 2008Merchant wholesalers, durable goods .. 423 July 2005
Merchant wholesalers, nondurablegoods …………………………………….. 424 July 2005Wholesale trade agents and brokers … 425120 July 2005
Furniture and home furnishings stores . 442 January 2004
Electronics and appliance stores ……... 443 January 2004
Building material and garden equipmentand supplies dealers ……………………. 444 January 2004
Clothing and clothing accessoriesstores …………………………………….. 448 January 2004Sporting goods, hobby, book, andmusic stores ……………………………... 451 January 2004General merchandise stores ………….. 452 January 2004
Miscellaneous store retailers ………….. 453 January 2004
Internet service providers ………………. 518111 July 2005
Internet publishing and web searchportals ………………..…………………... 519130 January 2010Commercial banking ……………………. 522110 January 2005
Savings institutions ……………………... 522120 January 2005
Direct health and medical insurancecarriers …………………………………… 524114 July 2004Construction, mining, and forestrymachinery and equipment rental andleasing ……………………………………. 532412 January 2005Management consulting services ……... 541610 January 2007
Security guards and patrol services …... 561612 July 2005
Computer training ………….…………… 611420 July 2007
Offices of dentists ……………………….. 621210 January 2011
Blood and organ banks ………………… 621991 January 2007
Amusement and theme parks …………. 713110 July 2006
Golf courses and country clubs ……….. 713910 July 2006
Fitness and recreational sports centers . 713940 July 2005
Commercial machinery repair andmaintenance……………………………... 811310 July 2007
Weights Weights for most traditional commodity groupings o
the PPI, as well as weights for commodity-based aggregateindexes calculated using traditional commodity groupingssuch as stage-of-processing indexes, currently reflect 2002values of shipments as reported in the Census of Manufactures
and other sources. From January 2002 through December2006, PPI weights were derived from 1997 shipment valuesIndustry indexes now are calculated with 2002 weights and neoutput ratios. This periodic update of the value weights usedto calculate the PPI is done to more accurately reflect changes
8/3/2019 Producer Price Indexes -October 2011
http://slidepdf.com/reader/full/producer-price-indexes-october-2011 10/22
10
in production and marketing patterns in the economy. Netoutput values of shipments are used as weights for industryindexes. Net output values refer to the value of shipmentsfrom establishments within the industry to buyers outside theindustry. However, weights for commodity price indexes arebased on gross shipment values, including values of shipmentsbetween establishments within the same industry. As a result,broad commodity grouping indexes, such as the PPI for AllCommodities (which is comprised of major commoditygroupings 01 through 15), are affected by the multiplecounting of price change at successive stages of processing,which can lead to exaggerated or misleading signals aboutinflation. Stage-of-processing indexes partially correct for thisdefect, but industry indexes consistently correct for this at alllevels of aggregation. Therefore, industry and stage-of-processing indexes are more appropriate than broadcommodity groupings for economic analysis of general pricetrends.
Price Index Reference Base
Effective with publication of January 1988 data,many important PPI series (including stage-of-processing
groupings and most commodity groups and individual items)were placed on a new reference base, 1982 = 100. From1971 through 1987, the standard reference base for most PPIseries was 1967 = 100. Except for rounding differences, theshift to the new reference base did not alter any previouslypublished percent changes for affected PPI series. (See“Calculating Index Changes,” below.) The 1982 referencebase is not used for commodity indexes with a base later thanDecember 1981 or for industry net output indexes and theirproducts.
For further information on the underlying conceptsand methodology of the Producer Price Index, see chapter 14,“Producer Prices,” in the BLS Handbook of Methods (July
2010). This chapter can be downloaded from the BLS Website at www.bls.gov/opub/hom/homch14.htm.
Calculating Index Changes
Each PPI measures price changes from a referenceperiod that equals 100.0. An increase of 5.5 percent from thereference period in the Finished Goods Price Index, forexample, is shown as 105.5. This change also can beexpressed in dollars, as follows: prices received by domesticproducers of a sample of finished goods have risen from $100in 1982 to $105.50. Likewise, a current index of 90.0 wouldindicate that prices received by producers of finished goods
are 10 percent lower than they were in 1982.Movements of price indexes from one month to
another are usually expressed as percent changes, rather thanas changes in index points. Index point changes are affectedby the level of the index in relation to its base period, whereaspercent changes are not. The following example shows thecomputation of index point and percent changes.
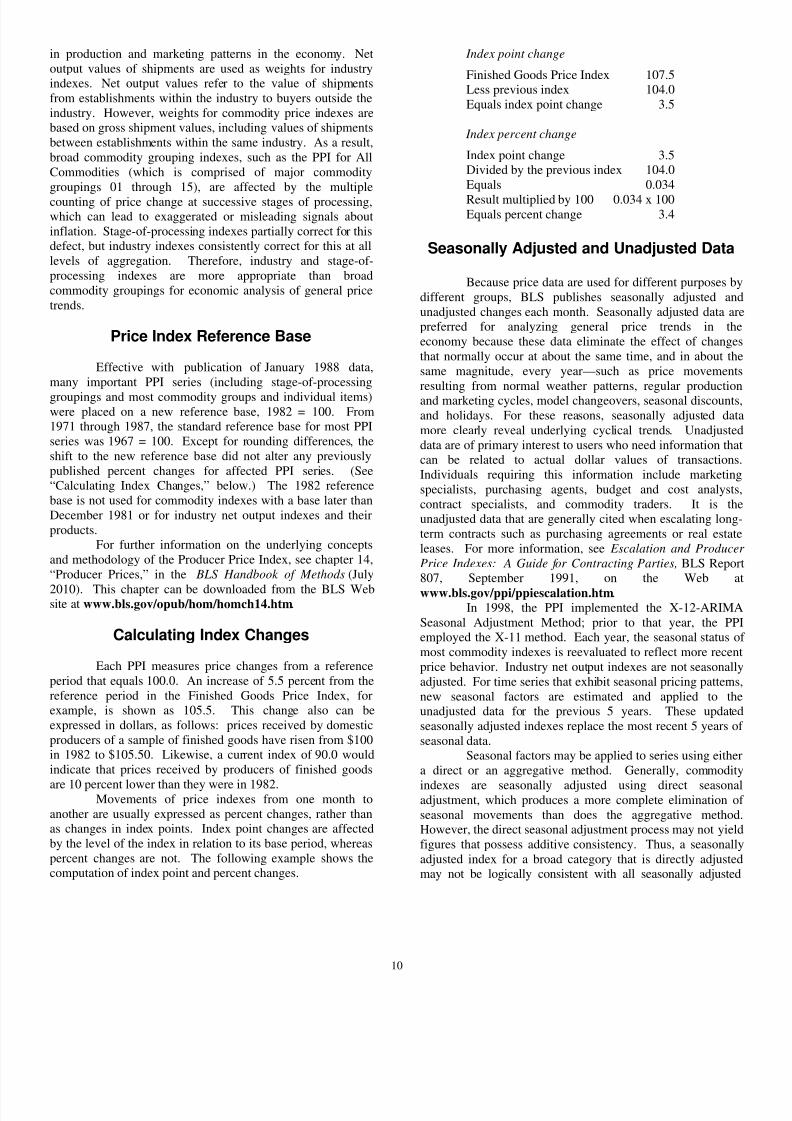
Index point change
Finished Goods Price Index 107.5Less previous index 104.0Equals index point change 3.5
Index percent change
Index point change 3.5Divided by the previous index 104.0Equals 0.034
Result multiplied by 100 0.034 x 100Equals percent change 3.4
Seasonally Adjusted and Unadjusted Data
Because price data are used for different purposes bydifferent groups, BLS publishes seasonally adjusted andunadjusted changes each month. Seasonally adjusted data arepreferred for analyzing general price trends in theeconomy because these data eliminate the effect of changesthat normally occur at about the same time, and in about thesame magnitude, every year—such as price movementsresulting from normal weather patterns, regular productionand marketing cycles, model changeovers, seasonal discountsand holidays. For these reasons, seasonally adjusted datamore clearly reveal underlying cyclical trends. Unadjusteddata are of primary interest to users who need information thacan be related to actual dollar values of transactionsIndividuals requiring this information include marketingspecialists, purchasing agents, budget and cost analystscontract specialists, and commodity traders. It is theunadjusted data that are generally cited when escalating long-term contracts such as purchasing agreements or real estateleases. For more information, see Escalation and Producer
Price Indexes: A Guide for Contracting Parties, BLS Repor807, September 1991, on the Web a
www.bls.gov/ppi/ppiescalation.htm.In 1998, the PPI implemented the X-12-ARIMA
Seasonal Adjustment Method; prior to that year, the PPemployed the X-11 method. Each year, the seasonal status omost commodity indexes is reevaluated to reflect more recenprice behavior. Industry net output indexes are not seasonallyadjusted. For time series that exhibit seasonal pricing patternsnew seasonal factors are estimated and applied to theunadjusted data for the previous 5 years. These updatedseasonally adjusted indexes replace the most recent 5 years ofseasonal data.
Seasonal factors may be applied to series using eithera direct or an aggregative method. Generally, commodity
indexes are seasonally adjusted using direct seasonaadjustment, which produces a more complete elimination oseasonal movements than does the aggregative methodHowever, the direct seasonal adjustment process may not yieldfigures that possess additive consistency. Thus, a seasonallyadjusted index for a broad category that is directly adjustedmay not be logically consistent with all seasonally adjusted
8/3/2019 Producer Price Indexes -October 2011
http://slidepdf.com/reader/full/producer-price-indexes-october-2011 11/22
11
indexes for its components. Seasonal movements for stage-of-processing indexes are derived indirectly through anaggregative method that combines movements of a widevariety of subproduct class (six-digit) series.
Seasonally adjusted indexes can become problematicwhen previously stable and predictable price patterns abruptlychange. If the new pattern persists, the seasonal adjustmentmethod will eventually reflect it adequately; if the patternkeeps shifting, however, seasonally adjusted data will becomechronically troublesome. This problem occurs relativelyinfrequently for farm and food-related products, but has moreoften affected manufactured products such as automobiles andsteel.
Since January 1988, the PPI has used InterventionAnalysis Seasonal Adjustment methods to enhance thecalculation of seasonal factors. With this technique, outliervalues that may distort the seasonal pattern are removed fromthe data prior to applying the standard seasonal factorestimation procedure. For example, a possible economiccause for large price movements for petroleum-based productsmight have been the Persian Gulf War. In this case,intervention techniques allowed for better estimates of seasonally adjusted data. On the whole, very few series have
required intervention. Out of almost 300 seasonally adjustedseries, only 27 were subject to intervention in 2009.
For more information relating to seasonal adjustmentmethods, see (1) “Appendix A: Seasonal AdjustmentMethodology at BLS,” in the BLS Handbook of Methods (July2010) and (2) “Summary of Changes to the PPI’s SeasonalAdjustment Methodology” in the January 1995 issue of Producer Price Indexes.
Producer Price Index Data on the Internet
In 1995, the BLS began posting PPI series, newsreleases, and technical information to both a World Wide Web
(WWW) site and a file transfer protocol (FTP) site. Duringthe years following the introduction of PPI Internet services,use of these sites eclipsed more traditional methods of datadissemination, such as subscriptions to the PPI Detailed
Report . There were more than 2.1 million instances of PPIseries being downloaded from the Internet during the 12months ended December 31, 2008.
Retrieving PPI data from the PPI Web site
PPI data can be obtained from the WWW address(www.bls.gov/ppi). Clicking on the “PPI Databases” link reveals the following methods of data retrieval:
• Top Picks is a form-based application for bothIndustry Data and Commodity Data that allows theuser to quickly obtain PPI time series data byselecting the most commonly requested time series,including the All Commodities Index and the stage-of-processing indexes (for example, Finished Goods).Within each list, any one—or all—of the time series
shown can be selected. A user can modify the daterange and output options after executing the queryusing the reformat button above the data output table.
• One-Screen Data Search and Multi-Screen Data
Search are form-based query applications for bothIndustry Data and Commodity Data designed forusers unfamiliar with the PPI coding structure. Theseapplications guide a user through the PPI
classification system by listing index titles and do norequire knowledge of commodity or industry codesData retrieved are based on a query formulated byselecting data characteristics from lists providedTwo options are available to create customizedtables, depending on a user’s browser capability. Theone-screen option is a JavaScript application that usesa single screen to guide a user through the availabletime series data. The second option is a multiplescreen, non-Java-based application. Both methodallow a user to browse the PPI coding structure andselect multiple series codes. Users can modify thedate range and output options after executing thequery using the reformat button above the data outpu
table.
• Series Report is a form-based application that usesformatted PPI time series identifiers (commodity orindustry codes) as input in extracting data accordingto a specified set of date ranges and output optionsThis application provides the most efficient path forusers who are familiar with the format of PPI timeseries identifiers. Up to 300 indexes can be extractedat a time.
There are five alphabetic prefixes used tocreate unique PPI time series identifiers: WP, WDPC, PD, and ND. Each provides the user access to a
different PPI database. Adding either a “u” (noseasonally adjusted) or an “s” (seasonally adjusted) tothe end of these prefixes further specifies the type ofdata needed.
EXAMPLES
For commodity and stage-of-processing indexes
series identifiers combine a “wpu” prefix (noseasonally adjusted) or a “wps” prefix (seasonallyadjusted) with a commodity code.
Commodity code Provides data for: wps141101 Passenger cars, seasonallyadjusted
wpu141101 Passenger cars, notseasonally adjusted
wpusop3000 Finished goods, notseasonally adjusted
8/3/2019 Producer Price Indexes -October 2011
http://slidepdf.com/reader/full/producer-price-indexes-october-2011 12/22
12
For discontinued commodity indexes, seriesidentifiers combine a “wdu” prefix (not seasonallyadjusted) or a “wds” prefix (seasonally adjusted) witha commodity code.
Commodity code Provides data for: wds019 Other farm products,
seasonally adjustedwdu0635 Preparations, ethical
(prescription), notseasonally adjusted
wdusi138011 Stainless steel millproducts, not seasonallyadjusted
Current price indexes grouped by industryaccording to NAICS have series identifiers thatbegin with the prefix “pcu.” After the prefix, thereare 12 digits (the 6-digit industry code is listed twice)followed by up to 7 alphanumeric charactersidentifying product detail. Dashes are used asplaceholders for higher-level industry group codes.
Industry-product code, current NAICS series Provides data for: pcu325---325--- Chemical manufacturing,
not seasonally adjustedpcu336110336110 Automobile and light duty
motor vehiclemanufacturing
pcu621111621111411 Offices of physicians, one-and two-physicianpractices and single-specialty group practices,general/family practice
pcu325412325412A Pharmaceutical
preparationmanufacturing,pharmaceuticals acting onthe respiratory system
Discontinued industry-product codes based on
SIC combine a “pdu” prefix and “#” between thefourth and fifth characters of the product code.Series identifiers for the discontinued dataset useunderscores as placeholders to complete a referenceto an SIC industry group code of fewer than fourdigits. (All PPI industry-based indexes organized bySIC were discontinued with the introduction of NAICS.)
Industry-product code, discontinued SIC series Provides data for: pdu28_ _# Chemicals and allied
products, not seasonallyadjusted
pdu331_# Blast furnaces, steelworks, and rolling andfinishing mills, notseasonally adjusted
pdu3711#111 Passenger cars
Price indexes for discontinued series grouped by
industry according to NAICS have identifiers thabegin with the prefix “ndu.” After the prefix, thereare 12 numeric digits (the 6-digit industry code islisted twice), and up to 7 additional alphanumericcharacters that identify product detail. Dashes areused as placeholders for higher-level industry groupcodes.
Industry-product code, discontinued NAICS series Provides data for
ndu212231212231 Lead ore and zincore mining
ndu2122312122312 Lead and zincconcentrates
ndu212231212231214 Leadconcentrates
• Text Files (FTP) and the FTP server are best suitedfor users requiring access to either a large volume oftime series data or other PPI-related documentation(such as seasonal factor and relative importancetables). The FTP sites can be accessed a
ftp://ftp.bls.gov or directly from the links on the“PPI Databases” page or the PPI homepage. Dataand documentation available for download includethe following:
Directory:Industry Data /pub/time.series/pc
Industry Data - Discontinued(NAICS basis) /pub/time.series/nd
(SIC basis) /pub/time.series/pd
Commodity Data /pub/time.series/wp
Commodity Data - DiscontinuedSeries / pub/time.series/wd
Special requests /pub/special.requests/pp
The FTP site maintains files to help with searchesand downloads. These files are centrally located in the
/pub/doc directory. Within this directory, the overview.tx
file contains an overview relating to all BLS data availablethrough the FTP site. For current commodity-based PPI datathe program help file is wp.txt; for discontinued commodityseries, wd.txt; for current industry-based PPI data based onNAICS, pc.txt; for industry-based SIC time series that havebeen discontinued, pd.txt; and for industry-based NAICSseries that have been discontinued, nd.txt.
Users who prefer downloading PPI datasets asindividual ZIP files should go to the directory labeled
/pub/time.series/compressed/tape.format/ on the FTP siteThis directory includes six PPI-specific ZIP files, one for eachof the PPI databases—WP, WD, PC, ND, and PD—and a ZIPfile for the annual 5-year revision to historical seasonal PPIs.
Other Sources of PPI Data
PPI data can also be accessed via the BLS homepage(www.bls.gov). Clicking on the “Databases & Tools” tab athe top of the homepage calls up a listing all available BLSprograms.

8/3/2019 Producer Price Indexes -October 2011
http://slidepdf.com/reader/full/producer-price-indexes-october-2011 13/22
13
Additional information
The PPI homepage (www.bls.gov/ppi) containsadditional information regarding PPI data and methodology.The top section of the homepage provides PPI news releases,both current and archived, as well as general PPI information.The “Tables Created by BLS” section found beneath the
statistics section provides relative importance and seasonalfactor tables. The remaining sections offer special notices andpublications pertaining to PPI methodology and applications.
For questions or comments regarding PPI dataclassification, methodology, or data availability on theInternet, call or e-mail the Section of Index Analysis andPublic Information at (202) 691-7705 or [email protected].
8/3/2019 Producer Price Indexes -October 2011
http://slidepdf.com/reader/full/producer-price-indexes-october-2011 14/22
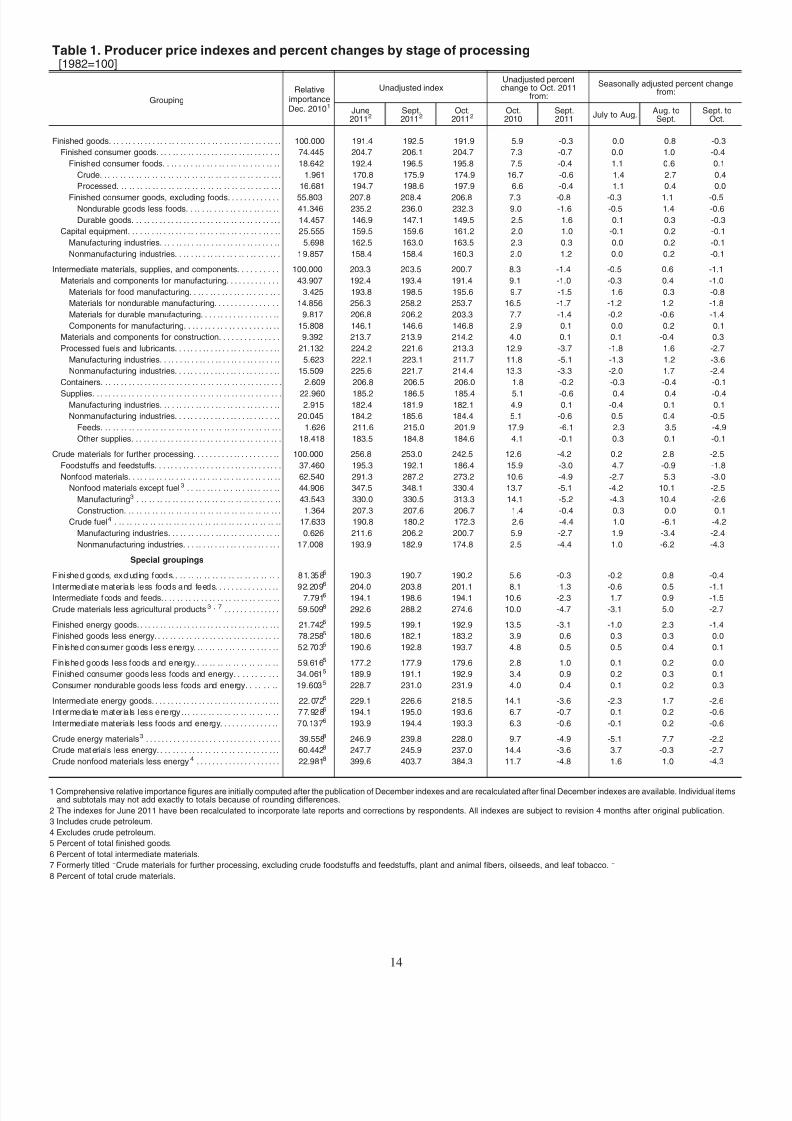
Table 1. Producer price indexes and percent changes by stage of processing[1982=100]
Grouping
RelativeimportanceDec. 20101
Unadjusted indexUnadjusted percent
change to Oct. 2011from:
Seasonally adjusted percent changefrom:
June20112
Sept.20112
Oct.20112
Oct.2010
Sept.2011
July to Aug.Aug. to
Sept.Sept. to
Oct.
Finished goods. . . . .. . .. . . . .. . .. . .. . . . .. . .. . .. . . . .. . .. . .. . . 100.000 191.4 192.5 191.9 5.9 -0.3 0.0 0.8 -0.3
Finished consumer goods. . . . .. . . . . . . . . . . . .. . . . . . . . . . . . .. 74.445 204.7 206.1 204.7 7.3 -0.7 0.0 1.0 -0.4
Finished consumer foods. . .. . .. . .. . . . . .. . .. . .. . . . . .. . . 18.642 192.4 196.5 195.8 7.5 -0.4 1.1 0.6 0.1
Crude. . . . . . . . . . . . . . . . . . . . . . . . . . . .. . . . . . . . . . . . . . . . . . 1.961 170.8 175.9 174.9 16.7 -0.6 1.4 2.7 0.4
Processed. . . .. . . . . .. . . . . .. . . . . .. . . .. . . . . .. . . . . .. . . . 16.681 194.7 198.6 197.9 6.6 -0.4 1.1 0.4 0.0
Finished consumer goods, excluding foods. . . . . . . . . . . . . 55.803 207.8 208.4 206.8 7.3 -0.8 -0.3 1.1 -0.5Nondurable goods less foods. . .. . . . . .. . .. . .. . .. . .. . . 41.346 235.2 236.0 232.3 9.0 -1.6 -0.5 1.4 -0.6
Durable goods. . . . . . . . . . . . . . . . . . . . . . . . . . . . . . . . . . . . . . 14.457 146.9 147.1 149.5 2.5 1.6 0.1 0.3 -0.3
Capital equipment. . . . .. . .. . . . . . . .. . . . . . . .. . .. . . . . . . .. . .. 25.555 159.5 159.6 161.2 2.0 1.0 -0.1 0.2 -0.1
Manufacturing industries. . . . .. . . . .. . . . .. . .. . . . .. . . . . . .. 5.698 162.5 163.0 163.5 2.3 0.3 0.0 0.2 -0.1
Nonmanufacturing industries. . .. . .. . .. . . . .. . .. . .. . . . .. . 19.857 158.4 158.4 160.3 2.0 1.2 0.0 0.2 -0.1
Intermediate materials, supplies, and components. . . . . . . . . . 100.000 203.3 203.5 200.7 8.3 -1.4 -0.5 0.6 -1.1
Materials and components for manufacturing. . . . . . . . . . . . . 43.907 192.4 193.4 191.4 9.1 -1.0 -0.3 0.4 -1.0
Materials for food manufacturing. . . . . .. . . . . . . . .. . . . . . . . 3.425 193.8 198.5 195.6 9.7 -1.5 1.6 0.3 -0.8
Materials for nondurable manufacturing. . . . . . . . . . . . . . . . 14.856 256.3 258.2 253.7 16.5 -1.7 -1.2 1.2 -1.8
Materials for durable manufacturing. . . . .. . . . . . . . . . . . . .. 9.817 206.8 206.2 203.3 7.7 -1.4 -0.2 -0.6 -1.4
Components for manufacturing. . . . . . . . . . . . . . . . . . . . . . . . 15.808 146.1 146.6 146.8 2.9 0.1 0.0 0.2 0.1
Materials and components for construction. . . . . . . . . . . . . . . 9.392 213.7 213.9 214.2 4.0 0.1 0.1 -0.4 0.3
Processed fuels and lubricants. . . .. . . . . . . . . . .. . . . . . . . . . .. 21.132 224.2 221.6 213.3 12.9 -3.7 -1.8 1.6 -2.7
Manufacturing industries. . . . . . .. . . .. . . .. . . .. . . .. . . . . . .. 5.623 222.1 223.1 211.7 11.8 -5.1 -1.3 1.2 -3.6
Nonmanufacturing industries. . . .. . . . . . . . . . .. . . . . . . . . . .. 15.509 225.6 221.7 214.4 13.3 -3.3 -2.0 1.7 -2.4
Containers. . . . . . . . . . . . . . . . . . . . . . . . . . . . . . . . . . . . . . . . . . . . . . 2.609 206.8 206.5 206.0 1.8 -0.2 -0.3 -0.4 -0.1
Supplies. . . . . . . . . . . . . . . . . . . . . . . . . . . . . . . . . . . . . . . . . . . . . . . . 22.960 185.2 186.5 185.4 5.1 -0.6 0.4 0.4 -0.4Manufacturing industries. . . . .. . . . .. . . . .. . .. . . . .. . . . . . .. 2.915 182.4 181.9 182.1 4.9 0.1 -0.4 0.1 0.1
Nonmanufacturing industries. . . .. . . . . . . . . . .. . . . . . . . . . .. 20.045 184.2 185.6 184.4 5.1 -0.6 0.5 0.4 -0.5
Feeds. . . . . . . .. . . . . . . . . . . .. . . . . . . . . . . .. . . . . . . . . . . .. . 1.626 211.6 215.0 201.9 17.9 -6.1 2.3 3.5 -4.9
Other supplies. . . . . . . . . . . . . . . . . . . . . . . . . . . . . . . . . . . . . . 18.418 183.5 184.8 184.6 4.1 -0.1 0.3 0.1 -0.1
Crude materials for further processing. . . . . . . . . . .. . . . . . . . . .. 100.000 256.8 253.0 242.5 12.6 -4.2 0.2 2.8 -2.5
Foodstuffs and feedstuffs. . . . . . . . . . . . . . . . . . . . .. . . . . . . . . . . 37.460 195.3 192.1 186.4 15.9 -3.0 4.7 -0.9 -1.8
Nonfood materials. . .. . .. . . . .. . .. . .. . . . .. . .. . .. . . . .. . .. . . 62.540 291.3 287.2 273.2 10.6 -4.9 -2.7 5.3 -3.0
Nonfood materials except fuel3 . . .. . .. . . .. . .. . .. . . .. . .. 44.906 347.5 348.1 330.4 13.7 -5.1 -4.2 10.1 -2.5
Manufacturing3 . . . . . .. . . .. . . .. . . .. . . .. . . . . .. . . .. . . .. 43.543 330.0 330.5 313.3 14.1 -5.2 -4.3 10.4 -2.6
Construction. .. . . . . . . . . . . .. . . . . . . . . . . .. . . . . . . .. . . . . . 1.364 207.3 207.6 206.7 1.4 -0.4 0.3 0.0 0.1
Crude fuel4 . .. .. . . .. .. .. . . .. .. . . .. .. .. . . .. .. .. . . .. .. .. 17.633 190.8 180.2 172.3 2.6 -4.4 1.0 -6.1 -4.2
Manufacturing industries. . . . . . . . . . . . .. . . . . . . . . . . . .. .. 0.626 211.6 206.2 200.7 5.9 -2.7 1.9 -3.4 -2.4
Nonmanufacturing industries. . . .. . . . . . . . . . . . .. . . . . . . . 17.008 193.9 182.9 174.8 2.5 -4.4 1.0 -6.2 -4.3
Special groupings
F ini she d g ood s, ex cl ud ing f ood s. . . . . . . . . . . . . . . . . . . . . . . . . . . 8 1. 35 85 190.3 190.7 190.2 5.6 -0.3 -0.2 0.8 -0.4
Intermediate materials less foods and feeds. . . . . . . . . . . . . . .. 92.2096
204.0 203.8 201.1 8.1 -1.3 -0.6 0.5 -1.1Intermediate f oods and feeds. . . . . . . . . . . . . . . . . . . . . . . . . . . . . . 7.7916 194.1 198.6 194.1 10.6 -2.3 1.7 0.9 -1.5
Crude materials less agricultural products3 , 7 . . . . . . . . . . . . . . 59.5098 292.6 288.2 274.6 10.0 -4.7 -3.1 5.0 -2.7
Finished energy goods. . . . . . . . . . . . . . . . . . . . . . . . . . . . . . . . . . . . . 21.7425 199.5 199.1 192.9 13.5 -3.1 -1.0 2.3 -1.4
Finished goods less energy. . . . . . . . . . . . . . . . . . . . . . . . . . . . . . . . 78.2585 180.6 182.1 183.2 3.9 0.6 0.3 0.3 0.0
Finished consumer goods less energy. .. . .. .. . .. . .. .. . .. . .. 52.7035 190.6 192.8 193.7 4.8 0.5 0.5 0.4 0.1
Finished goods less foods and energy.. .. .. .. .. .. .. .. .. .. .. 59.6165 177.2 177.9 179.6 2.8 1.0 0.1 0.2 0.0
Finished consumer goods less foods and energy. . . . . . . . . . . 34.0615 189.9 191.1 192.9 3.4 0.9 0.2 0.3 0.1
Consumer nondurable goods less foods and energy. . . . . . .. 19.6035 228.7 231.0 231.9 4.0 0.4 0.1 0.2 0.3
Intermediate energy goods. . . . . . . . . . . . . . . . . . . . . . . . . . . . . . . . . 22. 0726 229.1 226.6 218.5 14.1 -3.6 -2.3 1.7 -2.6
I nt er me dia te m at er ia ls l es s e ne rgy . . . . . . . . . . . . . . . . . . . . . . . . . 7 7. 92 86 194.1 195.0 193.6 6.7 -0.7 0.1 0.2 -0.6
Intermediate materials less foods and energy. . . . . . . . . . . . . .. 70.1376 193.9 194.4 193.3 6.3 -0.6 -0.1 0.2 -0.6
Crude energy materials3 . . . . . . . . . . . . . . . . . . . . . . . . . . . . . . . . . . 39.5588 246.9 239.8 228.0 9.7 -4.9 -5.1 7.7 -2.2
Crude mat erials less energy. . . . . . . . . . . . . . . . . . . . . . . . . . . . . . . 60.4428 247.7 245.9 237.0 14.4 -3.6 3.7 -0.3 -2.7
Crude nonfood materials less energy4 . . . . . . . . . . . . . . . . . . . . . 22.9818 399.6 403.7 384.3 11.7 -4.8 1.6 1.0 -4.3
1 Comprehensive relative importance figures are initially computed after the publication of December indexes and are recalculated after final December indexes are available. Individual itemsand subtotals may not add exactly to totals because of rounding differences.
2 The indexes for June 2011 have been recalculated to incorporate late reports and corrections by respondents. All indexes are subject to revision 4 months after original publication.
3 Includes crude petroleum.
4 Excludes crude petroleum.
5 Percent of total finished goods.
6 Percent of total intermediate materials.
7 Formerly titled ″ Crude materials for further processing, excluding crude foodstuffs and feedstuffs, plant and animal fibers, oilseeds, and leaf tobacco.″
8 Percent of total crude materials.
14
8/3/2019 Producer Price Indexes -October 2011
http://slidepdf.com/reader/full/producer-price-indexes-october-2011 15/22
Table 2. Producer price indexes and percent changes for selected commodity groupings by stage ofprocessing
[1982=100, unless otherwise indicated]
GroupingCommodity
code
Unadjusted indexUnadjusted percent
change to Oct. 2011from:
Seasonally adjusted percent changefrom:
June20111
Sept.20111
Oct. 20111 Oct. 2010 Sept. 2011July to
Aug.Aug. to
Sept.Sept. to
Oct.
F i n i s h e d g o o d s . . . . . . . . . . . . . . . . . . . . . . . . . . . . . . . . . . . . . . . . . . . . . . . . 191.4 192.5 191.9 5.9 -0.3 0.0 0.8 -0.3
Finished consumer goods. . . . . . . . . . . . . . . . . . . . . . . . . . . . . . . . . . . .. 204.7 206.1 204.7 7.3 -0.7 0.0 1.0 -0.4
Finished consumer foods. . . . . . . . . . . . . . . . . . . . . . . . . . . . . . . . . . . . 192.4 196.5 195.8 7.5 -0.4 1.1 0.6 0.1
Fresh fruits and melons2 . .. . . . . . . . . .. .. . . . . . . . . . . . . . . . . . . 01-11 117.8 118.6 115.2 8.2 -2.9 -3.0 3.1 -2.9
Fresh and dry vegetables2 . .. .. .. .. . . .. .. .. .. .. . . .. .. .. .. . 01-13 185.9 184.6 176.9 16.9 -4.2 8.9 10.0 -4.2
Eggs for fresh use (Dec 1991=100). . . . . . . . . . . . . . . . . . . . . . . . 01-71-07 122.6 132.9 151.1 39.8 13.7 10.9 -14.7 18.0
Bakery products2 . . . . . . . . . . . .. . . . . . . . . . . .. . . . . . . . . . . . .. . . . 02-11 252.2 255.6 258.7 5.7 1.2 -0.1 0.4 1.2
Milled rice2 . . . . . . . . . . . . . . . . . . . . . . . . . . . . . . . . . . . . . . . . . . . . . . 02-13 191.1 211.1 206.9 17.7 -2.0 2.1 6.3 -2.0
Pasta products (June 1985=100)2 . .. . . .. .. .. .. .. . . .. .. .. .. 02-14-02 183.8 187.0 199.2 18.1 6.5 2.0 -0.1 6.5
Beef and veal2 . . . . . . . . . . . . . . . . . . . . . . . . . . . . . . . . . . . . . . . . . .. 02-21-01 173.8 189.9 181.8 13.8 -4.3 1.2 5.4 -4.3
Pork. . . . . . . . . . . . .. . . . . . . . . . . . .. . . . . . . . . . .. . . . . . . . . . . . .. . . . 02-21-04 158.7 168.5 166.7 13.6 -1.1 5.2 -0.8 2.8
Processed young chickens. . . . . . . .. . . . . . . . . . . .. . . . . . . . . . .. 02-22-03 142.8 143.7 145.9 -3.4 1.5 3.8 0.3 4.8
Processed turkeys. . .. . . . . . . . . . . . . . . . . . . . . . .. . . . . . . .. . .. . . 02-22-06 148.1 152.3 154.3 9.7 1.3 1.8 0.4 1.5
Finfish and shellfish2 . . . .. .. . .. .. .. . .. .. . .. .. .. . .. .. . .. .. . 02-23 281.2 289.2 281.2 1.0 -2.8 -1.2 1.0 -2.8
Dairy products2 . .. .. .. .. .. .. .. .. .. . .. .. .. .. .. .. . .. .. .. .. . 02-3 200.7 204.8 199.3 8.6 -2.7 1.8 -1.6 -2.7
Processed fruits and vegetables. . . . . . . .. . . . . . . .. . . .. . . . . . . 02-4 180.9 187.4 187.3 7.0 -0.1 2.0 0.3 -0.2
Confectionery end products2 . . .. . . . .. . . . . .. . . . . .. . . . . .. . . . 02-55 250.6 250.8 253.0 6.3 0.9 -0.5 -0.5 0.9
Soft drinks2 . . .. . .. . .. . .. . .. . . .. . .. . .. . .. . .. . .. . . .. . .. . . .. 02-62 186.3 187.4 189.2 2.9 1.0 -0.2 0.2 1.0
Roasted coffee2 . . . . . . . . . . . . . . . . . . . . . . . . . . . . . . . . . . . . . . . . . . 02-63-01 232.5 234.3 232.4 17.8 -0.8 -0.9 0.3 -0.8
Shortening and cooking oils. . . . . . . . . . . . . . . . . . . . . . . .. . . . . . . 02-78 307.4 308.5 297.6 25.1 -3.5 1.1 1.3 -1.1Frozen specialties2 . . . .. . . .. . . .. . . .. .. . . .. . . .. . . .. . . .. . . .. 02-85 180.6 181.8 181.4 2.7 -0.2 -0.1 0.2 -0.2
Finished consumer goods excluding foods. . . . . . . . . . . . . . . . . .. 207.8 208.4 206.8 7.3 -0.8 -0.3 1.1 -0.5
Alcoholic beverages. . . . . . . . . . . . . . . . . . . . . . . . . . . . . . . . . . . .. . 02-61 179.7 179.9 183.9 3.1 2.2 0.2 0.1 1.1
Pet food. . . . . . . . . . . . . . . . . . . . . . . . . . . . . . . . . . . . . . . . . . . . . . . . . . 02-94-02 234.2 235.3 236.1 4.9 0.3 0.3 0.9 0.7
Women’s, girls’, & infants’ apparel (Dec 2003=100)2 . . . . . . . 03-81-06 103.2 102.9 102.9 1.3 0.0 0.5 -0.4 0.0
Men’s and boys’ apparel (Dec 2003=100)2 . . . . . . . . . . . . . . . . 03-81-07 106.6 110.0 108.6 7.2 -1.3 1.5 2.7 -1.3
Textile housefurnishings2 . . . . . . . . . . . . . . . . . . . . . . . . . . . . . . . . . 03-82 140.0 141.0 141.0 6.5 0.0 0.3 -0.8 0.0
Footwear2 . . .. .. .. .. . .. .. .. .. .. .. .. . .. .. .. .. .. .. .. . .. .. .. 04-3 166.9 168.7 170.1 4.1 0.8 1.0 -0.3 0.8
Residential electric power (Dec 1990=100). . . . . . . .. . . . . . . .. 05-41 161.8 162.6 159.9 3.0 -1.7 -0.1 0.3 1.1
Residential gas (Dec 1990=100). . . .. . . .. . . . . . .. . . .. . . . . . .. 05-51 201.1 200.4 194.8 -1.4 -2.8 0.8 -0.7 -3.3
Gasoline. . .. . . . . . . . .. . . . . .. . . . . .. . . . . .. . . . . .. . . . . .. . . . . .. 05-71 313.3 304.9 289.7 26.2 -5.0 -1.0 4.2 -2.4
Home heating oil and distillates. . . . . . .. . . . . .. . . . . . .. . . . . . .. 05-73-02 283.7 285.9 279.1 26.1 -2.4 -1.2 2.3 -6.0
Pharmaceutical preparations (June 2001=100). . . . . . . . . . . . . 06-38 159.3 160.5 161.4 2.7 0.6 0.3 0.1 0.9
Soaps and synthetic detergents2 . . . . . . . . . . . . . . . . . . . . . . . . . . 06-71 164.1 169.1 169.9 5.6 0.5 0.4 2.7 0.5
Cleaning and polishing products (June 1983=100)2 . . . . . . . . 06-72 163.7 165.1 165.3 2.2 0.1 0.1 0.5 0.1
Cosmetics and other toilet preparations2 . . . . . . . . . . . . . . . . . . 06-75 151.7 152.0 152.4 0.9 0.3 0.0 -0.1 0.3
Tires, tubes, tread, etc2 . .. . . . . . .. . . . . . .. . . . . . . . . .. . . . . . . . 07-12 154.0 157.1 156.7 11.2 -0.3 1.3 -0.4 -0.3
Sanitary paper products2 . . . . . . . . . . . . . . . . . . . . . . . . . . . . . . . .. 09-15-01 183.5 186.4 185.7 1.8 -0.4 0.5 0.5 -0.4
Household furniture2 . . . . . . . . . . . . . . . . . . . . . . . . . . . . . . . . . . . . . 12-1 191.0 192.7 193.8 2.6 0.6 0.5 0.4 0.6
Floor coverings2 . . . . . . . . . . . . . . . . . . . . . . . . . . . . . . . . . . . . . . . . . 12-3 174.8 179.5 181.4 6.8 1.1 0.6 1.5 1.1
Household appliances. . . . .. . . . . . . . . . . . .. . . . . . . . . . .. . . . . . . . 12-4 111.8 112.1 112.6 1.9 0.4 0.2 0.3 0.3
Home electronic equipment2 . . . . . . . . . . . . . . . . . . . . . . . . . . . . . . 12-5 52.0 52.7 52.9 -0.2 0.4 1.2 0.2 0.4
Household glassware2 . . . . . .. . . . . . . . . . . .. . . . . . . . . . . .. . . . . . 12-62 204.2 204.2 204.2 2.4 0.0 0.0 0.0 0.0
Household flatware2 . . . .. .. . . .. .. . . .. . . .. .. . . .. .. . . .. .. . . . 12-64 218.9 183.4 218.8 16.1 19.3 0.0 -16.2 19.3
Lawn and garden equip, ex tractors2 . . . . . . . . . . . . . . . . . . . . . . 12-66 140.6 140.1 141.6 -0.1 1.1 0.1 0.4 1.1
Passenger cars. . . .. . . .. . . .. . . .. . . .. . . .. . . .. . . .. . . .. . . . . . . 14-11-01 129.9 128.3 132.1 1.8 3.0 -0.4 -0.5 -0.8
Travel trailers and campers (June 1984=100)2 . . . . . . . . . . . . 14-16 171.3 173.2 174.3 3.4 0.6 0.3 0.7 0.6
Toys, games, and children’s vehicles2 . . . . . . . . . . . . . . . . . . . . 15-11 143.4 143.6 144.9 3.5 0.9 -2.4 0.1 0.9
Sporting and athletic goods2 . . . . .. . .. . . .. . . .. . .. . . .. . . .. . . 15-12 132.7 133.2 133.2 -0.7 0.0 -0.1 0.0 0.0
Tobacco products2 . . . . . . . . . . . . . . . . . . . . . . . . . . . . . . . . . . . . . . . 15-2 595.6 613.3 615.3 6.6 0.3 0.0 0.1 0.3
Mobile homes2
. . . . .. . . .. . . . .. . . . .. . . . . .. . . . .. . . . . .. . . . . .. 15-5 235.2 239.4 239.6 3.5 0.1 0.3 1.3 0.1Jewelry, platinum, & karat gold2 . . . .. . . . . . . . . . . . . . . . . . . . . . 15-94-02 220.3 232.3 237.1 22.4 2.1 2.1 2.3 2.1
Costume jewelry and novelties2 . . . . . . .. . . . .. . . . . .. . . . . .. . . 15-94-04 160.5 162.0 162.9 2.3 0.6 0.6 -1.3 0.6
Capital equipment. . . . . . . . . . . . . . . . . . . . . . . . . . . . . . . . . . . . . . . . . . . .. 159.5 159.6 161.2 2.0 1.0 -0.1 0.2 -0.1
Agricultural machinery and equipment2 . . . . . . . . . . . . . . . . . . . . . . 11-1 209.1 210.4 210.8 2.7 0.2 0.1 0.3 0.2
Construction machinery and equipment. . . . . . . . . .. . . . . . . . . . . . 11-2 196.9 199.8 199.8 4.1 0.0 0.3 0.7 0.0
Metal cutting machine tools2 . . . .. .. . .. . .. .. . .. . .. .. . .. . .. . .. 11-37 179.5 182.0 181.3 3.7 -0.4 0.1 -0.7 -0.4
Metal forming machine tools2 . . . . . . . . . . . . . . . . . . . . . . . . . . . . . . . 11-38 202.6 203.3 203.6 1.1 0.1 -0.2 0.0 0.1
Tools, dies, jigs, fixtures, and ind. molds2 . . . . . . . . . . . . . . . . . . . 11-39 146.9 147.4 147.9 3.2 0.3 0.2 -0.1 0.3
Pumps, compressors, and equipment. . . . . . . . . . . . . . . . . . . . . . . . 11-41 223.3 224.4 225.1 4.4 0.3 0.1 0.1 0.3
Industrial material handling equipment2 . . . . . . . . . . . . . . . . . . . . . . 11-44 187.8 188.5 188.9 2.9 0.2 -0.1 0.0 0.2
See footnotes at end of table.
15
8/3/2019 Producer Price Indexes -October 2011
http://slidepdf.com/reader/full/producer-price-indexes-october-2011 16/22
Table 2. Producer price indexes and percent changes for selected commodity groupings by stage ofprocessing — Continued
[1982=100, unless otherwise indicated]
GroupingCommodity
code
Unadjusted indexUnadjusted percent
change to Oct. 2011from:
Seasonally adjusted percent changefrom:
June20111
Sept.20111
Oct. 20111 Oct. 2010 Sept. 2011July to
Aug.Aug. to
Sept.Sept. to
Oct.
Capital equipment - Continued
Electronic computers (Dec 2004=100)2 . . . . . . . . . . . . . . . . . . . . . . 11-51 26.6 25.8 25.8 -11.3 0.0 -2.6 -0.8 0.0
Textile machinery2 . . . . . .. . . . .. .. . . . .. . . . .. .. . . . .. .. . . . .. .. . 11-62 167.2 167.3 167.3 0.8 0.0 0.0 0.1 0.0
Paper industries machinery (June 1982=100)2 . . . . . . . . . . . . . . . 11-64 200.4 200.7 203.5 2.5 1.4 0.0 0.0 1.4
Printing trades machinery2 . . . .. . . . .. . . .. . . .. . . . .. . . .. . . . .. . . 11-65 156.3 155.9 156.0 1.3 0.1 -0.1 -0.2 0.1
Transformers and power regulators2 . . . . . . . . . . . . . . . . . . . . . . . . 11-74 231.0 229.0 229.7 2.7 0.3 0.1 -0.9 0.3
Communication & related equip (Dec 1985=100). . . . . . . . . . . . . 11-76 106.0 106.5 106.3 0.7 -0.2 0.4 -0.1 -0.2
X-ray and electromedical equipment2 . . . . . . . . . . . . . . . . . . . . . .. 11-79-05 88.3 88.5 88.6 -0.7 0.1 -0.4 0.0 0.1
Oil field and gas field machinery. . .. . .. . .. . .. . . . . . . .. . . . . . . .. 11-91 205.3 206.9 206.9 2.9 0.0 0.3 0.2 0.0
Mining machinery and equipment. . . . . . . . . . . .. . . . . . . . . . . .. . . . 11-92 234.7 235.8 237.8 7.5 0.8 1.2 0.4 0.9
Office and store machines and equipment2 . . . . . . . . . . . . . . . . . . 11-93 121.8 122.3 123.4 2.2 0.9 0.3 0.0 0.9
Commercial furniture2 . . . . . . . . . . . . . . . . . . . . . . . . . . . . . . . . . . . . . . 12-2 201.4 201.8 201.9 2.5 0.0 -1.1 0.6 0.0
Light motor trucks. . . . . . .. . . . . . .. . . .. . . . . . .. . . .. . . . . . .. . . .. . . 14-11-05 153.1 151.3 158.1 2.1 4.5 0.1 0.6 -1.6
Heavy motor trucks2 . .. .. .. . . .. .. . . .. .. .. . . .. .. .. . . .. .. .. . . . 14-11-06 199.1 200.3 202.9 2.6 1.3 0.5 0.1 1.3
Truck trailers2 . . . . .. . .. . . .. . . .. . .. . . .. . . .. . .. . . .. . . .. . .. . . .. 14-14 191.8 191.4 191.7 5.0 0.2 0.1 0.6 0.2
Civilian aircraft (Dec 1985=100). . . . . . . . . . . . . . . . . . . . . . . . . . . . . 14-21-02 243.2 245.5 247.7 3.1 0.9 0.2 0.1 0.8
Ships (Dec 1985=100)2 . . . . .. . . . .. . . . . .. . . . . .. . . . .. . . . . .. . . . 14-31 221.0 221.6 221.6 2.4 0.0 0.1 0.0 0.0
Railroad equipment2 . . . . . . .. . . . . . .. . . . . . . .. . . . . . . .. . . . . . .. . . 14-4 186.8 187.4 187.5 1.8 0.1 0.0 0.0 0.1
Intermediate materials, supplies, and components. . . . . . . . . . . . . 203.3 203.5 200.7 8.3 -1.4 -0.5 0.6 -1.1
Intermediate foods and feeds. . . . . . . . . .. . .. . . . . . . .. . . . . . . .. . .. . 194.1 198.6 194.1 10.6 -2.3 1.7 0.9 -1.5
Flour2 . . . . . . . . . . . . . . . . . . . . . . . . . . . . . . . . . . . . . . . . . . . . . . . . . . . . . . 02-12-03 224.9 224.7 206.4 6.0 -8.1 -0.3 1.4 -8.1
Refined sugar and byproducts2 . . . . . . . . . . . . . . . . . . . . . . . . . . . . . 02-53 214.9 204.6 205.3 5.2 0.3 -5.2 0.2 0.3
Confectionery materials2 . .. . . . .. . . . . .. . . . . .. . . . . . .. . . . . . .. . . 02-54 185.2 186.7 187.4 10.5 0.4 0.3 -0.2 0.4
Soft drink beverage bases (Dec 1985=100)2 . . . .. . . .. .. . . .. .. 02-64-01-11 226.5 227.2 226.9 1.7 -0.1 0.2 -0.2 -0.1
Processed eggs2 . . . .. . . .. . . .. . . . . .. . . .. . . .. . . .. . . .. . . . . .. .. 02-83 152.3 166.8 177.9 57.6 6.7 13.7 -5.8 6.7
Prepared animal feeds. . .. . .. . . . . .. . . . . . . . . . .. . . . . . . . . . . . . . . 02-9 209.0 211.8 201.1 14.5 -5.1 2.1 3.2 -3.8
Intermediate materials less foods and feeds. . . . . . . . . . . . . . . . . . . . 204.0 203.8 201.1 8.1 -1.3 -0.6 0.5 -1.1
Synthetic fibers2 . .. . . .. .. .. .. . . .. .. .. .. .. . . .. .. .. .. .. .. . . .. . 03-1 120.0 120.7 121.6 12.0 0.7 -0.1 1.3 0.7
Processed yarns and threads2 . .. .. .. .. . .. .. .. . .. .. .. . .. .. . . 03-2 163.5 158.6 155.5 15.9 -2.0 0.1 0.1 -2.0
Gray fabrics2 . .. . . .. .. . . .. . . .. .. . . .. .. . . .. .. . . .. .. . . .. . . .. .. 03-3 149.0 152.3 150.9 16.8 -0.9 -2.7 0.3 -0.9
Finished fabrics2 . .. .. . .. .. .. .. .. .. . .. .. .. .. .. .. . .. .. .. . .. .. 03-4 148.9 149.7 150.6 8.6 0.6 3.0 -1.2 0.6
Industrial textile products2 . . . . . . . . .. . . . .. . . . .. . . . .. . . . .. . . . . 03-83-03 154.1 155.1 155.3 3.7 0.1 0.2 0.4 0.1
Leather2 . . . .. . . . . . . .. . . . . . . .. . . . . . . .. . . . . .. . . . . . . .. . . . . . . .. 04-2 266.9 266.2 264.5 8.0 -0.6 0.1 -0.7 -0.6
Liquefied petroleum gas2 . . . . . . . . . . . . . . . . . . . . . . . . . . . . . . . . . .. 05-32 376.9 422.2 413.0 32.2 -2.2 -6.0 5.6 -2.2
Commercial electric power. . . . .. . . . . . . . . .. . . . . . . . . .. . . . . . . . . 05-42 188.5 189.6 185.4 1.5 -2.2 0.9 -0.3 1.0
Industrial electric power. . . . . . . . . . . . . . . . . . . . . . . . . . . .. . . . . . . .. 05-43 205.7 215.2 205.3 5.5 -4.6 0.7 -0.3 -1.7Commercial natural gas (Dec 1990=100)2 . . . . . . . . . .. . . . . . . .. 05-52 200.4 197.9 194.5 -4.0 -1.7 -0.1 -2.3 -1.7
Industrial natural gas (Dec 1990=100). . . . . . . . . . . . . . . . . . . . . . . 05-53 193.9 191.0 186.7 -2.7 -2.3 0.8 -0.6 -1.5
Natural gas to electric utilities (Dec 1990=100). . . . . . . . . . . . . . . 05-54 169.2 161.9 162.7 -2.7 0.5 -2.5 2.7 0.8
Jet fuels. . . .. . . .. . . .. . . . . . . . . . .. . . . . . . . . . .. . . . . . . . . . .. . . . . . . 05-72-03 318.5 308.8 296.1 25.9 -4.1 -2.9 -1.4 -4.4
No 2 Diesel fuel. . . . . . . . . . . . .. . . . . . . . . .. . . . . . . . . . . . .. . . . . . . . . 05-73-03 333.7 317.4 310.3 27.3 -2.2 -5.9 7.3 -5.5
Residual fuels2 . .. . . .. .. . . .. . . .. . . .. . . .. .. . . .. . . .. . . .. . . .. .. 05-74 292.4 257.3 277.5 32.1 7.9 -0.9 -9.9 7.9
Basic inorganic chemicals2 . .. . . . . . . . . .. . . . . . . .. . . . . . . . . . . . . 06-13 304.5 307.7 304.4 19.4 -1.1 3.2 -1.5 -1.1
Basic organic chemicals2 . .. . . . . . . . . . . .. . . . . . . . . . . .. . . . . . . .. 06-14 349.3 347.4 338.6 24.1 -2.5 -1.2 1.1 -2.5
Prepared paint2 . . .. .. . .. .. .. . .. .. . .. .. .. . .. .. . .. .. .. . .. .. . . 06-21 248.0 249.6 249.6 4.9 0.0 0.1 0.3 0.0
Paint materials2 . . . .. . .. . .. .. . .. . .. .. . .. . .. . .. .. . .. . .. .. . .. . 06-22 253.3 271.7 274.7 20.4 1.1 0.7 4.4 1.1
Medicinal and botanical chemicals2 . . . . . . . . .. . . . . . . . . . . . .. .. 06-31 176.0 175.7 174.7 -0.9 -0.6 -0.2 0.0 -0.6
Fats and oils, inedible2 . . .. .. .. . . . .. .. .. .. .. .. .. .. .. .. .. .. .. 06-4 357.7 360.0 328.5 26.9 -8.8 -2.9 3.2 -8.8
Mixed fertilizers2 . . . . . . . . . . . . . . . . . . . . . . . . . . . . . . . . . . . . . . . . . .. 06-51 195.5 196.4 202.9 13.2 3.3 -0.3 0.4 3.3
Nitrogenates. . . . . . . . . . .. . . . . . . . . . .. . . . . . . . . . .. . . .. . . .. . . .. . . 06-52-01 349.5 346.1 363.4 37.8 5.0 1.0 -0.3 1.8
Phosphates2 . . . . . . . . . . . . . . . . . . . . . . . . . . . . . . . . . . . . . . . . . . . . . .. 06-52-02 284.8 299.2 304.4 31.5 1.7 2.4 2.4 1.7
Other agricultural chemicals2 . . . . . . . . . . . . . . . . . . . . . . . . . . . . . . . 06-53 173.9 178.5 178.5 1.6 0.0 0.1 1.7 0.0
Plastic resins and materials2
. .. . . .. . .. . . .. . . .. . .. . . .. . . .. . .. 06-6 238.4 244.9 235.4 9.5 -3.9 -2.2 3.1 -3.9Synthetic rubber2 . . . . . . . . . . . . . . . . . . . . . . . . . . . . . . . . . . . . . . . . . .. 07-11-02 283.7 301.4 297.6 34.4 -1.3 3.2 -0.6 -1.3
Plastic construction products2 . . . . . . . . . . . . . . . . . . . . . . . . . . . . . . . 07-21 201.9 202.3 202.2 5.6 0.0 0.7 -0.5 0.0
Unsupported plastic film, sheet, & other shapes2 . . . . . . . . . . . . 07-22 213.7 210.0 210.7 4.4 0.3 -1.3 0.4 0.3
Plastic parts and components for manufacturing2 . . . . . . . . . . . . 07-26 139.1 138.4 138.5 2.1 0.1 -0.8 0.2 0.1
Softwood lumber. . . . .. . . . .. . . . .. . .. . . . .. . . . .. . .. . . . .. . . . .. . . 08-11 158.2 159.0 159.3 5.1 0.2 2.8 -1.2 3.6
Hardwood lumber2 . . . . . . . . . . . . . . . . . . . . . . . . . . . . . . . . . . . . . . . .. 08-12 186.4 185.3 183.2 -3.9 -1.1 -0.4 -0.6 -1.1
Millwork. . . . . . . . . . . . . . . . . . . . . . . . . . . . . . . . . . . . . . . . . . . . . . . . . . . . 08-2 209.4 209.3 209.5 1.1 0.1 0.1 0.0 0.1
Plywood2 . . . . . . . . . . . . . . . .. . . . . . . . . . . .. . . . . . . . . . . .. . . . . . . . . . 08-3 167.2 166.7 171.7 -0.1 3.0 -0.5 -1.9 3.0
Treated wood (June 1985=100). . . . . .. . . . . . .. . . . . .. . . . . . .. . . . 08-71-01 161.3 159.1 159.1 -0.6 0.0 6.2 -4.5 2.8
See footnotes at end of table.
16

8/3/2019 Producer Price Indexes -October 2011
http://slidepdf.com/reader/full/producer-price-indexes-october-2011 17/22
Table 2. Producer price indexes and percent changes for selected commodity groupings by stage ofprocessing — Continued
[1982=100, unless otherwise indicated]
GroupingCommodity
code
Unadjusted indexUnadjusted percent
change to Oct. 2011from:
Seasonally adjusted percent changefrom:
June20111
Sept.20111
Oct. 20111 Oct. 2010 Sept. 2011July to
Aug.Aug. to
Sept.Sept. to
Oct.
Intermediate materials less foods and feeds - Continued
Woodpulp2 . . . . . . . . . . . . . . . . . . . . . . . . . . . . . . . . . . . . . . . . . . . . . . . .. 09-11 198.7 204.5 194.7 -0.7 -4.8 -0.2 0.2 -4.8
Paper2 . . . .. .. . . .. .. . . .. . . .. .. . . .. .. . . .. .. . . .. .. . . .. .. .. . . .. 09-13 191.8 192.8 193.6 3.8 0.4 0.3 -0.1 0.4
Paperboard2 . .. . . . . . . . . . . .. . . . . . . . . . . .. . . . . . . . . . . .. . . . . . . .. 09-14 232.0 231.6 230.1 -1.8 -0.6 -0.6 0.2 -0.6
Paper boxes and containers. . . . . . . .. . . . . . . . .. . . . . . . .. . . . . . .. 09-15-03 227.5 226.3 226.0 0.6 -0.1 -0.9 -0.6 0.0
Building paper and board2 . . .. . .. .. . .. .. . .. . .. . .. .. . .. . .. .. . 09-2 162.0 164.0 163.8 2.2 -0.1 -1.6 0.9 -0.1
Commercial printing (June 1982=100)2 . . . . . . . . . . . . . . . . . . . . . . 09-47 169.9 171.1 171.3 1.5 0.1 0.4 0.4 0.1
Foundry and forge shop products2 . . . . . . . . . . . . . . . . . . . . . . . . . . 10-15 201.8 203.5 204.3 4.9 0.4 0.3 0.4 0.4
Steel mill products2 . . . .. .. . . .. .. .. .. .. . . .. .. .. .. .. . . .. .. .. .. 10-17 219.5 216.9 217.8 13.6 0.4 -1.0 -0.6 0.4
Primary nonferrous metals2 . . . . . .. . . . . .. . . . . .. . . . . .. . . .. . . .. 10-22 245.8 241.3 226.4 -0.7 -6.2 -0.5 -2.5 -6.2
Aluminum mill shapes2 . . . . . . . . . . . . . . . . . . . . . . . . . . . . . . . . . . . .. 10-25-01 196.1 189.3 186.2 6.8 -1.6 0.8 -1.8 -1.6
Copper and brass mill shapes2 . . . . . . . . . . . . . . . . . . . . . . . . . . . .. 10-25-02 475.2 480.0 440.1 -0.2 -8.3 -3.3 -0.7 -8.3
Titanium mill shapes2 . .. .. .. .. .. . . .. .. .. .. .. . . .. .. .. .. .. . . .. 10-25-05 199.8 219.3 213.1 7.4 -2.8 0.9 3.9 -2.8
Nonferrous wire and cable2 . .. . .. . .. . .. . .. . .. . .. . .. . .. . .. . . . 10-26 284.7 281.1 264.9 0.6 -5.8 0.5 -3.5 -5.8
Metal containers2 . . . . . . .. . . . . . . . . . . .. . . . . . . . . . . .. . . . . . . . . . . . 10-3 152.7 152.8 152.2 1.3 -0.4 0.0 0.0 -0.4
Hardware2 . . .. . .. .. . .. . .. .. . .. . .. . .. .. . .. . .. .. . .. . .. . .. .. . . 10-4 199.5 200.6 201.4 3.8 0.4 0.7 -0.1 0.4
Plumbing fixtures and brass fittings. . . . .. . . . .. . . . .. . . . .. . . . .. 10-5 237.7 238.6 238.6 2.8 0.0 0.0 0.1 0.3
Heating equipment2 . . .. . .. .. .. .. .. .. . .. .. .. .. .. .. .. . .. .. .. . 10-6 226.8 229.2 230.5 3.6 0.6 -0.3 0.2 0.6
Fabricated structural metal products. . . . . . . . . . . . . . . . . . . . . . . .. 10-7 212.3 213.0 213.7 5.6 0.3 -0.5 0.0 0.4
Fabricated ferrous wire products (June 1982=100). . . . . . . . . . . 10-88 217.4 217.3 218.0 5.8 0.3 -1.0 0.7 0.4
Other misc metal products2 . .. . .. . .. . .. . .. . .. . .. . . .. . .. . .. . . 10-89 159.0 159.3 159.2 2.6 -0.1 0.2 -0.2 -0.1
Mechanical power transmission equipment2 . . . . . . . . . . . . . . . . . 11-45 240.4 242.1 243.9 4.3 0.7 -0.2 0.2 0.7
Air conditioning and refrigeration equipment2 . . . . . . . . . . . . . . . . 11-48 167.7 167.9 168.5 2.4 0.4 -0.1 -1.1 0.4
Metal valves, ex.fluid power (Dec. 1982=100). . . . . . . . . . . . . . . . 11-49-02 262.9 267.3 268.6 7.8 0.5 1.0 1.1 0.7
Ball and roller bearings2 . . . . . . . . . . . .. . . . . . . . . . . .. . . . . . . . . .. . 11-49-05 237.3 238.2 238.4 3.7 0.1 0.1 0.2 0.1
Wiring devices2 . .. .. .. .. .. .. .. .. .. .. .. .. .. . .. .. .. .. .. .. .. . . 11-71 217.8 219.2 219.2 3.3 0.0 0.2 0.5 0.0
Motors, generators, motor generator sets2 . . . . . . . . . . . . . . . . . . . 11-73 203.4 203.8 204.4 6.2 0.3 0.2 0.0 0.3
Switchgear, switchboard, etc, equipment2 . . . . . . . . . . . . . . . . . . . 11-75 211.2 211.2 210.5 2.0 -0.3 0.0 -0.1 -0.3
Electronic components and accessories2 . . . . . . . . . . . . . . . . . . . . 11-78 71.5 70.7 70.8 -2.5 0.1 0.0 -0.7 0.1
Internal combustion engines. . . . .. . .. . .. . .. . .. . .. . . . .. . .. . .. . 11-94 164.3 164.4 166.0 3.2 1.0 0.6 0.1 1.2
Machine shop products2 . . .. . .. . .. . .. . .. . .. . .. . .. . .. . . .. . .. . 11-95 179.8 180.3 180.3 3.1 0.0 -0.1 0.6 0.0
Flat glass2 . . . .. . . . . . . .. . . . . . . .. . . . . . . .. . . . . . . .. . . . . .. . . . . .. 13-11 112.0 114.4 114.2 2.1 -0.2 1.8 0.3 -0.2
Cement2 . . . . . . . . . . . . . . . . . . . . . . . . . . . . . . . . . . . . . . . . . . . . . . . . . .. 13-22 188.0 188.4 187.0 -1.7 -0.7 -2.3 1.3 -0.7
Concrete products. . . . . . . . . . . . . . . . . . . . . . . . . . . . . . . . . . . . . . . . . . 13-3 210.8 210.5 211.0 0.6 0.2 0.1 0.1 0.4
Asphalt felts and coatings2 . . . . . . . . . . . . . . . . . . . . . . . . . . . . . . . . . 13-6 237.8 235.9 240.9 8.7 2.1 -1.3 -1.9 2.1
Gypsum products2 . .. .. .. . . . .. .. . . . .. . . . .. .. . . . .. .. . . . .. .. . 13-7 204.5 196.5 202.4 -1.0 3.0 -1.7 -1.7 3.0
Glass containers. . . . . . . . . . . . . . . . . . . . . . . . . . . . . . . . . . . . . . . . . . . . 13-8 183.7 183.9 183.9 1.3 0.0 0.3 -1.8 0.3
Motor vehicle parts2
. . .. . .. . .. . .. .. . . .. . .. . .. . .. . .. . .. . .. . .. 14-12 123.8 124.6 124.6 2.0 0.0 0.2 0.3 0.0Aircraft engines & engine parts (Dec 1985=100). . . . . . . . .. . . . . 14-23 203.7 204.0 205.2 3.7 0.6 0.2 0.4 0.8
Aircraft parts & aux. equip.,nec (June 1985=100). . . . . . . . . . . .. 14-25 171.3 171.4 172.0 3.0 0.4 -0.2 -0.1 0.3
Photographic supplies2 . . . . . . . . . . . . . . . . . . . . . . . . . . . . . . . . . . . . . 15-42 124.4 124.4 125.7 1.2 1.0 0.0 0.1 1.0
Medical/surgical/personal aid devices. . . . . . . . . . . . . . .. . . . . . . . . 15-6 171.8 171.3 171.0 0.7 -0.2 -0.3 0.4 -0.1
Crude materials for further processing........................ 256.8 253.0 242.5 12.6 -4.2 0.2 2.8 -2.5
Crude foodstuffs and feedstuffs. . . . . .. . .. . .. . . . . .. . .. . .. . . . . .. . 195.3 192.1 186.4 15.9 -3.0 4.7 -0.9 -1.8
Wheat2 . . . . . .. . . . . . . . . . . .. . . . . . . . . . . .. . . . . . . . . . . .. . . . . . . .. . 01-21 235.3 208.5 201.2 9.6 -3.5 -0.9 0.4 -3.5
Corn. . .. . . . . .. . . . . .. . .. . . . . .. . . . . .. . .. . . . . .. . . . . .. . .. . . . . .. 01-22-02 301.7 286.7 252.5 24.8 -11.9 9.2 4.5 -9.3
Slaughter cattle2 . . .. .. .. .. .. .. .. .. .. .. .. .. .. .. .. .. .. .. . . . .. 01-31 165.2 171.1 173.6 22.1 1.5 3.0 0.1 1.5
Slaughter hogs. . .. . . . . . . . .. . . . . . . . .. . . . . . . . .. . . . . . . . .. . . . . . 01-32 111.9 110.3 117.4 27.5 6.4 11.2 -11.8 14.3
Slaughter broilers/fryers. . . . . . . . . . .. . . . . . . . . .. . . . . . . . . .. . . . . . 01-41-02 234.6 197.2 184.4 -12.8 -6.5 10.6 -7.9 -0.5
Slaughter turkeys. . .. . . . . . . . . . . . . . . .. . .. . .. . . . . .. . .. . .. . . . . . 01-42 206.2 216.0 225.2 8.1 4.3 -1.5 -1.1 2.0
Fluid milk. . . . .. . .. . .. . . . .. . .. . .. . . . .. . .. . . . .. . . . .. . .. . . . .. . . 01-6 158.5 156.2 148.8 7.4 -4.7 -1.4 -7.4 -7.0
Soybeans2 . . .. . .. . .. . . . .. . .. . .. . . . .. . . . .. . .. . . . .. . . . .. . .. . . 01-83-01-31 233.2 227.9 205.5 6.9 -9.8 -4.6 2.6 -9.8
Cane sugar, raw2 . . . . . . . . . . . . . . . . . . . . . . . . . . . . . . . . . . . . . . . . . . 02-52-01 191.5 209.7 198.4 5.1 -5.4 6.6 1.9 -5.4
Crude nonfood materials. . . . . . . . . . . . . . .. . . . . . . . . . . . . . .. . . . . . . . 291.3 287.2 273.2 10.6 -4.9 -2.7 5.3 -3.0
Raw cotton2 . . . . . . . . . . . . . . . . . . . . . . . . . . . . . . . . . . . . . . . . . . . . . . . . 01-51 135.6 158.9 152.4 17.1 -4.1 5.5 13.4 -4.1
Hides and skins2 . . . . . .. . . . . .. . . . . .. . . .. . . . . .. . . . . .. . . . . .. .. 04-1 283.8 280.4 270.5 12.8 -3.5 -1.0 0.5 -3.5
Coal. . . . . . . . . . . . . . . . . . . . . . . . . . . . . . . . . . . . . . . . . . . . . . . . . . . . . . . . 05-1 207.0 209.2 207.8 9.2 -0.7 2.3 0.6 -0.2
Natural gas2 . . . . . . . . . .. . . . . . . . . . . . . . . . . . . . . . . . . . . .. . . . . . . .. 05-31 183.9 168.9 158.9 -0.4 -5.9 0.4 -8.6 -5.9
Crude petroleum. . . .. . . .. . . .. . . .. . . . . . . . . . .. . . . . . . . . . .. . . . . . 05-61 277.7 275.9 260.7 16.4 -5.5 -11.3 23.0 -0.5
Logs, timber, etc2 . . . . . . . . . . . . . . . . . . . . . . . . . . . . . . . . . . . . . . . . . . 08-5 224.5 232.3 233.3 9.2 0.4 3.4 0.1 0.4
Wastepaper2 . . . .. . . .. . . .. . . .. . . .. .. . . .. . . .. . . .. . . .. . . .. .. .. 09-12 504.4 529.6 504.0 11.8 -4.8 3.7 -2.4 -4.8
See footnotes at end of table.
17
8/3/2019 Producer Price Indexes -October 2011
http://slidepdf.com/reader/full/producer-price-indexes-october-2011 18/22
Table 2. Producer price indexes and percent changes for selected commodity groupings by stage ofprocessing — Continued
[1982=100, unless otherwise indicated]
GroupingCommodity
code
Unadjusted indexUnadjusted percent
change to Oct. 2011from:
Seasonally adjusted percent changefrom:
June20111
Sept.20111
Oct. 20111 Oct. 2010 Sept. 2011July to
Aug.Aug. to
Sept.Sept. to
Oct.
Crude nonfood materials - Continued
Iron ore2 . . . .. . . .. . . .. . . . . .. . . .. . . .. . . .. . . .. . . . . .. . . .. . . .. .. 10-11 158.5 158.5 171.0 12.9 7.9 -0.4 0.0 7.9
Iron and steel scrap2 . . . . . . . . . . . . . .. . . . . . . . . . . .. . . . . . . . . . . .. 10-12 657.9 658.9 645.9 23.1 -2.0 -0.5 0.8 -2.0
Nonferrous metal ores (Dec 1983=100)2 . . . . . . . . . . . . . . . . . . . . 10-21 378.0 399.6 359.8 6.5 -10.0 3.9 0.0 -10.0
Copper base scrap2 . . . . . . . . . . . . . . . . . . . . . . . . . . . . . . . . . . . . . . . . 10-23-01 670.6 648.1 578.3 1.9 -10.8 -6.3 1.8 -10.8
Aluminum base scrap. . . . . . . . . . . .. . . . . . . . . . . .. . . . . . . . . . . .. . . 10-23-02 280.6 260.5 253.5 -1.1 -2.7 3.7 -3.1 -2.8
Construction sand, gravel, and crushed stone. . . . . . . . . . . . . . . . 13-21 267.5 267.8 266.5 1.2 -0.5 0.3 0.0 0.1
Industrial sand. . .. . . . .. . .. . .. . . . .. . .. . .. . . . .. . .. . .. . . . .. . .. . 13-99-01 247.1 247.4 247.2 3.4 -0.1 0.6 0.7 0.1
1 The indexes for June 2011 have been recalculated to incorporate late reports and corrections by respondents. All indexes are subject to revision 4 months after original publication.
2 Not seasonally adjusted.
″ -″ Data not available.
18
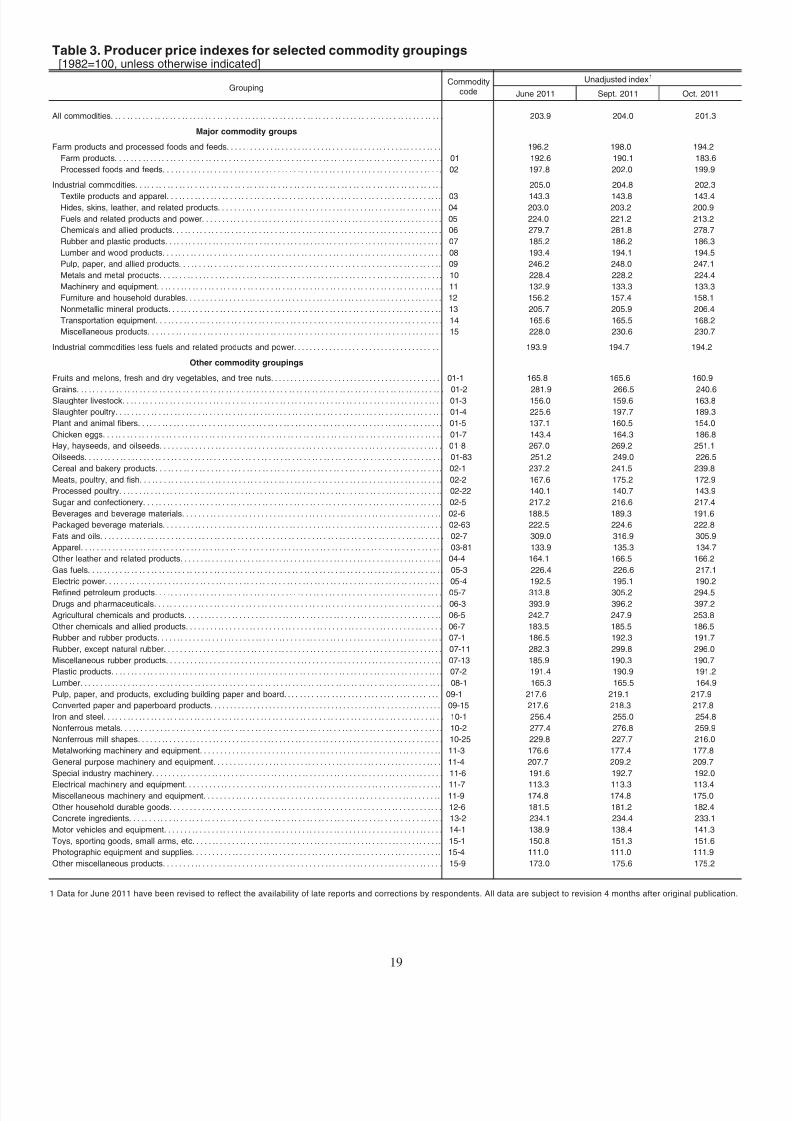
8/3/2019 Producer Price Indexes -October 2011
http://slidepdf.com/reader/full/producer-price-indexes-october-2011 19/22
Table 3. Producer price indexes for selected commodity groupings[1982=100, unless otherwise indicated]
GroupingCommodity
code
Unadjusted index1
June 2011 Sept. 2011 Oct. 2011
All commodities. . . . .. . . . . . .. . . . . . .. . . . . . . . .. . . . . . .. . . . . . .. . . . . . . . .. . . . . . .. . . . . . . . .. . . . . . .. . . . . . .. . . . 203.9 204.0 201.3
Major commodity groups
Farm products and processed foods and feeds. . . . . .. . . . . . .. . . . . . .. . . . . .. . . . . . .. . . . . .. . . . . . .. . . . . .. . . 196.2 198.0 194.2
Farm products. . .. . . . .. . . . . . .. . . . . . . . .. . . . . . .. . . . . . . . .. . . . . . .. . . . . . .. . . . . . . . .. . . . . . .. . . . . . .. . . . . . . 01 192.6 190.1 183.6
Processed foods and feeds. . . .. . . .. . . . . . . .. . . .. . . . . . . . . . . . . . .. . . .. . . . . . . .. . . .. . . .. . . . . . . .. . . .. . . . 02 197.8 202.0 199.9
Industrial commodities. . .. . .. . .. . .. . . . .. . .. . .. . .. . .. . .. . .. . .. . .. . .. . .. . .. . .. . .. . .. . .. . .. . .. . . . .. . .. . 205.0 204.8 202.3
Textile products and apparel. . . .. . . .. . . . . . . . . . .. . . . . . . . . . .. . . . . . . . . . .. . . . . . . . . . .. . . . . . . . . . .. . . . . . . 03 143.3 143.8 143.4Hides, skins, leather, and related products. . . . . . . .. . . . . . . .. . . . . . . .. . . . . . .. . . . . . . .. . . . . . . .. . . . . . . .. . 04 203.0 203.2 200.9
Fuels and related products and power. . . . . . . .. . . . . . . .. . . . . . . .. . . . . . . .. . . . . . .. . . . . . . .. . . . . . . .. . . . . . 05 224.0 221.2 213.2
Chemicals and allied products. . . .. . . . . . . . . .. . . . . . .. . . . . . .. . . . . . .. . . . . . . . . . . . .. . . . . . . . . . . . .. . . . . . . . 06 279.7 281.8 278.7
Rubber and plastic products. . . . . . . . . . . . .. . . . . . . . . . . . .. . . . . . . . . .. . . . . . . . . . . . .. . . . . . . . . . . . .. . . . . . . . . 07 185.2 186.2 186.3
Lumber and wood products. . . .. . . .. . . . . . . .. . . .. . . .. . . . . . . .. . . .. . . . . . . .. . . .. . . .. . . . . . . .. . . .. . . . . . . 08 193.4 194.1 194.5
Pulp, paper, and allied products. . . .. . . .. . . .. . . .. . . .. . . .. . . . . . .. . . .. . . .. . . .. . . .. . . .. . . .. . . . . . .. . . .. 09 246.2 248.0 247.1
Metals and metal products. . . .. . . .. . . .. . . .. . . . . . . . . . . . . . . . . .. . . . . . . . . . .. . . . . . . . . . .. . . . . . . . . . .. . . .. 10 228.4 228.2 224.4
Machinery and equipment. . . . . . .. . . . . . .. . . . . . . . . .. . . . . . .. . . . . . .. . . . . . .. . . . . . .. . . . . . . . . .. . . . . . .. . .. 11 132.9 133.3 133.3
Furniture and household durables. . . . . . . . .. . . . . . . .. . . . . . . . .. . . . . . . .. . . . . . . .. . . . . . . .. . . . . . . . .. . . . . . 12 156.2 157.4 158.1
Nonmetallic mineral products. . . .. . . . . . . . . .. . . . . . .. . . . . . .. . . . . . .. . . . . . .. . . . . . . . . .. . . . . . .. . . . . . .. . .. 13 205.7 205.9 206.4
Transportation equipment. . . .. . . .. . . .. . . .. . . .. . . . . . . . . . .. . . . . . . . . . .. . . . . . . . . . .. . . . . . . . . . .. . . . . . . . . 14 165.6 165.5 168.2
Miscellaneous products. . . .. . . .. . . .. . . .. . . .. . . .. . . .. . . .. . . . . . . . . . .. . . . . . . . . . .. . . . . . . . . . . . . . . . . .. . . 15 228.0 230.6 230.7
Industrial commodities less fuels and related products and power. . . . . . . . . . . . . . . . . . . . . . . . . . . . . . . . . . . . . 193.9 194.7 194.2
Other commodity groupings
Fruits and melons, fresh and dry vegetables, and tree nuts. . . . . . . . . . . . . . . . . . . . . . . . . . . . . . . . . . . . . . . . . . . 01-1 165.8 165.6 160.9
Grains. . . . . . . . .. . . . . . . . . . .. . . . . . . . . . .. . . . . . . . . . . . .. . . . . . . . . . .. . . . . . . . . . . . .. . . . . . . . . . . . .. . . . . . . . . . .. . 01-2 281.9 266.5 240.6Slaughter livestock. . . . . . . . . .. . . . . . .. . . . . . .. . . . . . .. . . . . . . . . .. . . . . . .. . . . . . .. . . . . . .. . . . . . .. . . . . . . . . .. . . 01-3 156.0 159.6 163.8
Slaughter poultry. . . . . . . . . .. . . . . . . . . . . . .. . . . . . . . . . . . .. . . . . . . . . .. . . . . . . . . . . . .. . . . . . . . . . . . .. . . . . . . . . .. . 01-4 225.6 197.7 189.3
Plant and animal fibers. . . . . . .. . . . . . .. . . . . . .. . . . . . . . . .. . . . . . .. . . . . . . . . .. . . . . . . . . .. . . . . . . . . . . . .. . . . . .. 01-5 137.1 160.5 154.0
Chicken eggs. . . .. . . . . . . . . .. . . . . . .. . . . . . .. . . . . . .. . . . . . . . . .. . . . . . .. . . . . . .. . . . . . .. . . . . . .. . . . . . . . . .. . .. 01-7 143.4 164.3 186.8
Hay, hayseeds, and oilseeds. . . . . . .. . . . . . . .. . . . . . . .. . . . . . . .. . . . . . .. . . . . . . .. . . . . . . .. . . . . . . .. . . . . . .. . . 01-8 267.0 269.2 251.1
Oilseeds. . . . . . . . . .. . . . . . . . . . . . .. . . . . . . . . . . . .. . . . . . . . . .. . . . . . . . . . . . .. . . . . . . . . . . . .. . . . . . . . . .. . . . . . . . .. 01-83 251.2 249.0 226.5
Cereal and bakery products. . . .. . . .. . . .. . . .. . . .. . . .. . . . . . . . . . .. . . . . . . . . . .. . . . . . . . . . .. . . . . . . . . . .. . . .. 02-1 237.2 241.5 239.8
Meats, poultry, and fish. . . .. . . .. . . . . . . .. . . .. . . . . . . .. . . .. . . .. . . . . . . . . . . . . . . . . . . . . . . . .. . . . . . . . . . .. . . .. 02-2 167.6 175.2 172.9
Processed poultry. . . . . . .. . . . . . . . . . . . .. . . . . . . . . . . . .. . . . . . . . . .. . . . . . . . . . . . .. . . . . . . . . . . . .. . . . . . . . . . . . .. 02-22 140.1 140.7 143.9
Sugar and confectionery. . . . . . . . . . . . . . .. . . .. . . . . . . .. . . .. . . .. . . . . . . .. . . .. . . . . . . .. . . .. . . .. . . . . . . .. . . .. 02-5 217.2 216.6 217.4
Beverages and beverage materials. . . . . . . .. . . . . . . .. . . . . . . . .. . . . . . . .. . . . . . . .. . . . . . . .. . . . . . . . .. . . . . . .. 02-6 188.5 189.3 191.6
Packaged beverage materials. . . . . . . . .. . . . . . . .. . . . . . . .. . . . . . . .. . . . . . . . .. . . . . . . .. . . . . . . .. . . . . . . .. . . . . 02-63 222.5 224.6 222.8
Fats and oils. . . . . . .. . . . . . . . . . . . .. . . . . . . . . .. . . . . . . . . . . . .. . . . . . . . . . . . .. . . . . . . . . . . . .. . . . . . . . . .. . . . . . . . . 02-7 309.0 316.9 305.9
Apparel. . . . . . . . . . . . .. . . . . . . . . . . . .. . . . . . . . . . . . .. . . . . . . . . .. . . . . . . . . . . . .. . . . . . . . . . . . .. . . . . . . . . .. . . . . . . . 03-81 133.9 135.3 134.7
Other leather and related products. . . . . . .. . . . . .. . . . . . .. . . . . . .. . . . . .. . . . . . .. . . . . .. . . . . . .. . . . . .. . . . . . .. 04-4 164.1 166.5 166.2
Gas fuels. . .. . . . . . .. . . . . . .. . . . . . . . .. . . . . . .. . . . . . . . .. . . . . . .. . . . . . .. . . . . . . . .. . . . . . .. . . . . . .. . . . . . . . .. . . 05-3 226.4 226.6 217.1
Electric power. . . . . . . . . . . . . .. . . . . . . . . . .. . . . . . . . . . .. . . . . . . . . . .. . . . . . . . . . . . . . . . . .. . . . . . . . . . .. . . . . . . . . . 05-4 192.5 195.1 190.2
Refined petroleum products. . . .. . . .. . . . . . . . . . .. . . . . . . . . . .. . . . . . . . . . .. . . . . . . . . . .. . . . . . . . . . .. . . . . . . . . . 05-7 313.8 305.2 294.5
Drugs and pharmaceuticals. . . .. . . . . . . .. . . . . . . .. . . . . . . .. . . . . . . .. . . . . . . .. . . . . . . .. . . . . . . .. . . . . . . .. . . .. 06-3 393.9 396.2 397.2
Agricultural chemicals and products. . . . . . .. . . . . .. . . . . . .. . . . . .. . . . . . .. . . . . .. . . . . . .. . . . . .. . . . . . .. . . . . .. 06-5 242.7 247.9 253.8
Other chemicals and allied products. . . . . . . . .. . . . . . . .. . . . . . . . .. . . . . . . .. . . . . . . .. . . . . . . .. . . . . . . . .. . . . . . 06-7 183.5 185.5 186.5
Rubber and rubber products. . . . . .. . . . . . .. . . . . .. . . . . . .. . . . . .. . . . . . .. . . . . .. . . . . . .. . . . . .. . . . . . .. . . . . .. . 07-1 186.5 192.3 191.7
Rubber, except natural rubber. . . . . . .. . . . . . . .. . . . . . . .. . . . . . .. . . . . . . .. . . . . . . .. . . . . . . .. . . . . . .. . . . . . .. . . 07-11 282.3 299.8 296.0
Miscellaneous rubber products. . . . . . . . .. . . . . . . . .. . . . . . . . .. . . . . . . .. . . . . . . . .. . . . . . . . .. . . . . . . . .. . . . . . .. 07-13 185.9 190.3 190.7
Plastic products. . . . . . . . . .. . . . . . . . . . . . .. . . . . . . . . . . . .. . . . . . . . . .. . . . . . . . . . . . .. . . . . . . . . . . . .. . . . . . . . . .. . . 07-2 191.4 190.9 191.2
Lumber. . . . . . .. . . . . . .. . . . . . .. . . . . . . . .. . . . . . .. . . . . . .. . . . . . . . .. . . . . . . . . . . . .. . . . . . . . . . .. . . . . . . . . . . . .. .. 08-1 165.3 165.5 164.9
Pulp, paper, and products, excluding building paper and board. . . . . . . . . . . . . . . . . . . . . . . . . . . . . . . . . . . . . . . 09-1 217.6 219.1 217.9
Converted paper and paperboard products. . . . . . . . . . . . . . . . . . . . . . . . . . . . . . . . . . . . . . . . . . . . . . . . . . . . . . . . . . . 09-15 217.6 218.3 217.8
Iron and steel. . . . . . .. . . . . . . . . .. . . . . . .. . . . . . .. . . . . . .. . . . . . . . . .. . . . . . . . . .. . . . . . . . . . . . .. . . . . . . . . . . . .. . . 10-1 256.4 255.0 254.8
Nonferrous metals. . . .. . . .. . . .. . . .. . . .. . . . . . . . . . .. . . . . . . . . . .. . . . . . . . . . .. . . . . . . . . . .. . . . . . . . . . .. . . . . . . 10-2 277.4 276.8 259.9
Nonferrous mill shapes. . . . . . .. . . . . . .. . . . . .. . . . . . .. . . . . . .. . . . . . .. . . . . . .. . . . . .. . . . . . .. . . . . .. . . . . . .. . . . 10-25 229.8 227.7 216.0
Metalworking machinery and equipment. . . . . . . . . . .. . . . . . . . . .. . . . . . . . . .. . . . . . . . . . .. . . . . . . . . .. . . . . . . .. 11-3 176.6 177.4 177.8
General purpose machinery and equipment. . . . . . .. . . . . . . . .. . . . . . . .. . . . . . . .. . . . . . . .. . . . . . .. . . . . . . .. . . 11-4 207.7 209.2 209.7
Special industry machinery. . . . . . . .. . . . . . . .. . . . . . .. . . . . . . .. . . . . . . .. . . . . . . .. . . . . . .. . . . . . .. . . . . . .. . . . . . 11-6 191.6 192.7 192.0
Electrical machinery and equipment. . . . . . . . . .. . . . . . . . . .. . . . . . . . .. . . . . . . . . .. . . . . . . . .. . . . . . . . . .. . . . . .. 11-7 113.3 113.3 113.4Miscellaneous machinery and equipment. . . . . . . . .. . . . . . . . . . .. . . . . . . . . .. . . . . . . . . .. . . . . . . . . . .. . . . . . . .. 11-9 174.8 174.8 175.0
Other household durable goods. . . . . . . . . .. . . . . . . . .. . . . . . . . . .. . . . . . . . .. . . . . . . . . .. . . . . . . . .. . . . . . . . .. . . 12-6 181.5 181.2 182.4
Concrete ingredients. . . .. . . .. . . .. . . .. . . .. . . .. . . . . . .. . . .. . . . . . .. . . .. . . . . . .. . . .. . . . . . .. . . .. . . . . . .. . . . . 13-2 234.1 234.4 233.1
Motor vehicles and equipment. . . . . . . .. . . . . . .. . . . . . .. . . . . . .. . . . . . . .. . . . . . .. . . . . . .. . . . . . . .. . . . . . .. . . . . 14-1 138.9 138.4 141.3
Toys, sporting goods, small arms, etc. . . . . .. . . . . . .. . . . . .. . . . . . .. . . . . .. . . . . . .. . . . . .. . . . . . .. . . . . .. . . . .. 15-1 150.8 151.3 151.6
Photographic equipment and supplies. . . . . . . . . . .. . . . . . . . . .. . . . . . . . . .. . . . . . . . . . .. . . . . . . . . .. . . . . . . . . .. 15-4 111.0 111.0 111.9
Other miscellaneous products. . . . . . . . .. . . . . . . .. . . . . . . .. . . . . . . .. . . . . . . . .. . . . . . . .. . . . . . . .. . . . . . . .. . . . . 15-9 173.0 175.6 175.2
1 Data for June 2011 have been revised to reflect the availability of late reports and corrections by respondents. All data are subject to revision 4 months after original publication.
19
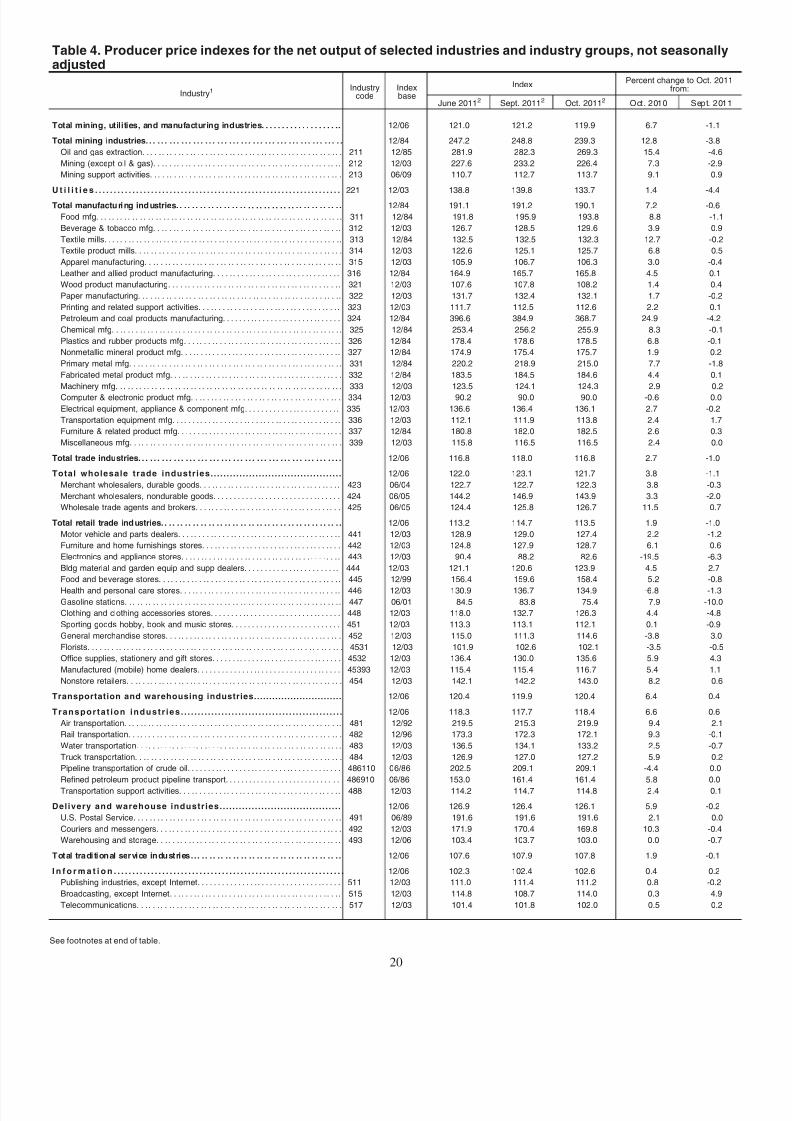
8/3/2019 Producer Price Indexes -October 2011
http://slidepdf.com/reader/full/producer-price-indexes-october-2011 20/22
Table 4. Producer price indexes for the net output of selected industries and industry groups, not seasonallyadjusted
Industry1Industry
codeIndexbase
IndexPercent change to Oct. 2011
from:
June 20112 Sept. 20112 Oct. 20112 Oct. 2010 Sept. 2011
Total mining, utilities, and manufacturing industries. . . . . . . . . . . . . . . . . . .. 12/06 121.0 121.2 119.9 6.7 -1.1
Total mining industries. . . . . . . . . . . . . . . . . . . . . . . . . . . . . . . . . . . . . . . . . . . . . . . . . . 12/84 247.2 248.8 239.3 12.8 -3.8
Oil and gas extraction. . . . .. . . . .. . .. . . . .. . . . .. . . . .. . .. . . . .. . . . .. . .. . . . .. . 211 12/85 281.9 282.3 269.3 15.4 -4.6
Mining (except oil & gas). . .. . .. . .. . .. . . . .. . .. . .. . . . .. . .. . .. . . . .. . .. . .. . . 212 12/03 227.6 233.2 226.4 7.3 -2.9
Mining support activities. . . . .. . .. . . . .. . . . .. . . . .. . . . . . .. . . . .. . . . .. . . . . . .. . 213 06/09 110.7 112.7 113.7 9.1 0.9
U t i l i t i e s . . . . . . . . . . . . . . . . . . . . . . . . . . . . . . . . . . . . . . . . . . . . . . . . . . . . . . . . . . . . . . . . . . 221 12/03 138.8 139.8 133.7 1.4 -4.4
Total manufactu ri ng ind ustries. . . . . . . . . . . . . . . . . . . . . . . . . . . . . . . . . . . . . . . . . . 12/84 191.1 191.2 190.1 7.2 -0.6
Food mfg. . . . . . . . . . . . . . . . . . . . . . . . . . . . . . . . . . . . . . . . . . . . . . . . . . . . . . . . . . . . . .. 311 12/84 191.8 195.9 193.8 8.8 -1.1
Beverage & tobacco mfg. . .. . .. . .. . . . .. . .. . .. . .. . .. . .. . .. . .. . .. . .. . .. . .. 312 12/03 126.7 128.5 129.6 3.9 0.9
Textile mills. . . . . . .. . . . . . .. . . . . . .. . . . . . . . .. . . . . . .. . . . . . .. . . . . . . . .. . . . . . .. 313 12/84 132.5 132.5 132.3 12.7 -0.2
Textile product mills. . .. . . . . . .. . . . .. . . . .. . . . .. . . . . . .. . . . .. . . . .. . . . . . .. . . . 314 12/03 122.6 125.1 125.7 6.8 0.5
Apparel manufacturing. . .. . . . . . . . . . .. . .. . . . . . . . . . . . . . . .. . .. . .. . . . . . . . . . . 315 12/03 105.9 106.7 106.3 3.0 -0.4
Leather and allied product manufacturing. . . . .. . . . . . . . . . . . . .. . . . . . . . . . . . . 316 12/84 164.9 165.7 165.8 4.5 0.1
Wood product manufacturing. . . . .. . . . . . . .. . . . . . . .. . .. . . . . . . .. . . . . . . .. . .. 321 12/03 107.6 107.8 108.2 1.4 0.4
Paper manufacturing. . . . .. . .. . .. . . . .. . .. . .. . . . .. . .. . . . .. . .. . . . .. . . . .. . .. 322 12/03 131.7 132.4 132.1 1.7 -0.2
Printing and related support activities. . . . . . . . . . . . . . . . . . . .. . . . . . . . . . . . . . . . 323 12/03 111.7 112.5 112.6 2.2 0.1
Petroleum and coal products manufacturing. . . . . . . .. . . . . . . .. . . . . . . .. . . . . . 324 12/84 396.6 384.9 368.7 24.9 -4.2
Chemical mfg. . .. . . . .. . . . .. . . . . . .. . . . .. . . . .. . . . .. . . . . . .. . . . .. . . . .. . . . . . . 325 12/84 253.4 256.2 255.9 8.3 -0.1
Plastics and rubber products mfg. . . .. . . . . . . .. . . . . . . .. . . . . . . .. . . . . . . .. . .. 326 12/84 178.4 178.6 178.5 6.8 -0.1
Nonmetallic mineral product mfg. . . .. . . . . . .. . . . . . .. . . .. . . . . . .. . . .. . . . . . .. 327 12/84 174.9 175.4 175.7 1.9 0.2
Primary metal mfg. . .. . .. . .. . . . . .. . .. . .. . . . . .. . .. . .. . . . . .. . .. . .. . . . . .. . . 331 12/84 220.2 218.9 215.0 7.7 -1.8
Fabricated metal product mfg. . . .. . . . . . . . . .. . . . . . .. . . . . . .. . . . . . . . . .. . . . . . 332 12/84 183.5 184.5 184.6 4.4 0.1
Machinery mfg. . . . . . . . . . . . . . . . . . . . . . . . . . . . . . . . . . . . . . . . . . . . . . . . . . . . . . . . . . 333 12/03 123.5 124.1 124.3 2.9 0.2
Computer & electronic product mfg. . .. . . . . .. . . . . .. . . . . .. . .. . . . . .. . . . . .. . 334 12/03 90.2 90.0 90.0 -0.6 0.0
Electrical equipment, appliance & component mfg. . . . . . . . . . . . .. . . . . . . . . .. 335 12/03 136.6 136.4 136.1 2.7 -0.2
Transportation equipment mfg. . . . . . . . . . .. . . .. . . . . . . .. . . .. . . .. . . . . . . .. . .. 336 12/03 112.1 111.9 113.8 2.4 1.7
Furniture & related product mfg. . . . . . .. . . . . . .. . . .. . . . . . .. . . .. . . . . . .. . . . . . 337 12/84 180.8 182.0 182.5 2.6 0.3
Miscellaneous mfg. . .. . .. . .. . .. . .. . .. . . . .. . .. . .. . .. . .. . .. . .. . . . .. . .. . .. . 339 12/03 115.8 116.5 116.5 2.4 0.0
Total trade industries. . . . . . . . . . . . . . . . . . . . . . . . . . . . . . . . . . . . . . . . . . . . . . . . . . . . 12/06 116.8 118.0 116.8 2.7 -1.0
Tot a l w hol e s a l e t r a de i ndus t r i e s . . . . . . . . . . . . . . . . . . . . . . . . . . . . . . . . . . . . . . . . . 12/06 122.0 123.1 121.7 3.8 -1.1
Merchant wholesalers, durable goods. . . .. . . .. . . .. . . .. . . .. . . .. . . .. . . .. . . . 423 06/04 122.7 122.7 122.3 3.8 -0.3
Merchant wholesalers, nondurable goods. . . . . . . . . . . .. . . . . . . . . . . . . .. . . . . . 424 06/05 144.2 146.9 143.9 3.3 -2.0
Wholesale trade agents and brokers. . . .. . . .. . . .. . . .. . . . . . . . . . .. . . . . . . . . . 425 06/05 124.4 125.8 126.7 11.5 0.7
Total retail trade ind ustries. . . . . . . . . . . . . . . . . . . . . . . . . . . . . . . . . . . . . . . . . . . . . . 12/06 113.2 114.7 113.5 1.9 -1.0
Motor vehicle and parts dealers. . . . . . . . .. . . . .. . . . . . . . . . . . . . . . . . . . . .. . . .. 441 12/03 128.9 129.0 127.4 2.2 -1.2
Furniture and home furnishings stores. . . . . . . . . . . . . . . . . . . . . . . . . . . . . . . . . . . 442 12/03 124.8 127.9 128.7 6.1 0.6
Electronics and appliance stores. . . . . . . . . .. . . . . . .. . . . . . .. . . . . . . . . . . . .. . .. 443 12/03 90.4 88.2 82.6 -19.5 -6.3
Bldg material and garden equip and supp dealers. . . . . . . . . . . . .. . . . . . . . . .. 444 12/03 121.1 120.6 123.9 4.5 2.7
Food and beverage stores. . . . . . . . . . . .. . . . . . . . .. . . . . . . . .. . . . . . . . .. . . . . .. 445 12/99 156.4 159.6 158.4 5.2 -0.8
Health and personal care stores. . . .. . . .. . . .. . . . . . . .. . . .. . . . . . . .. . . .. . . .. 446 12/03 130.9 136.7 134.9 -6.8 -1.3Gasoline stations. . . . . . . . . . . . . . . . . . . . . . . . . . . . . . . . . . . . . . . . . . . . . . . . . . . . . .. 447 06/01 84.5 83.8 75.4 7.9 -10.0
Clothing and clothing accessories stores. . . . . . . . .. . . . . . . . .. . . . . . . . .. . . . . . 448 12/03 118.0 132.7 126.3 4.4 -4.8
Sporting goods hobby, book and music stores. . . . . . . . . . . . . . . . . . . . . . . . . . . 451 12/03 113.3 113.1 112.1 0.1 -0.9
General merchandise stores. . . .. . . .. . . . . . .. . . . . . .. . . .. . . . . . .. . . . . . .. . . . . 452 12/03 115.0 111.3 114.6 -3.8 3.0
Florists. . . . .. . .. . . . .. . .. . .. . . . .. . .. . .. . . . .. . .. . .. . . . .. . .. . .. . . . .. . .. . .. . 4531 12/03 101.9 102.6 102.1 -3.5 -0.5
Office supplies, stationery and gift stores. . . . . . .. . . . . . .. . . . . .. . . . . . .. . . . . . 4532 12/03 136.4 130.0 135.6 5.9 4.3
Manufactured (mobile) home dealers. . . . . . . . . . . . . . .. . . . . . . . . . . . . . . .. . . . . 45393 12/03 115.4 115.4 116.7 5.4 1.1
Nonstore retailers. . .. . .. . .. . . . .. . .. . .. . . . .. . . . .. . . . .. . .. . . . .. . . . .. . .. . . . 454 12/03 142.1 142.2 143.0 8.2 0.6
Transportation and warehousing industries............................. 12/06 120.4 119.9 120.4 6.4 0.4
T r a n s p o r t a t i o n i n d u s t r i e s . . . . . . . . . . . . . . . . . . . . . . . . . . . . . . . . . . . . . . . . . . . . . . . . 12/06 118.3 117.7 118.4 6.6 0.6
Air transportation. . . . .. . . . . . . . . . . . .. . . . . . . . . . .. . . . . . . . . . . . .. . . . . . . . . . . . .. 481 12/92 219.5 215.3 219.9 9.4 2.1
Rail transportation. . . . . . . . . . .. . . . . .. . .. . . . . .. . . . . .. . .. . . . . .. . . . . . . . . . .. . 482 12/96 173.3 172.3 172.1 9.3 -0.1
Water transportation. . . . . .. . .. . . . . .. . . . . .. . .. . . . . .. . . . . .. . .. . . . . . . . . . . . . 483 12/03 136.5 134.1 133.2 2.5 -0.7
Truck transportation. . .. . . . .. . . . . . .. . . . .. . . . .. . . . . . .. . . . .. . . . .. . . . . . .. . . . 484 12/03 126.9 127.0 127.2 5.9 0.2
Pipeline transportation of crude oil. . . . . . . .. . . . . . . . .. . . . . . . . .. . . . . . . . .. . . . 486110 06/86 202.5 209.1 209.1 -4.4 0.0
Refined petroleum product pipeline transport. . . . . . . . . . . . . . . . . . . . . . . . . . . . . 486910 06/86 153.0 161.4 161.4 5.8 0.0
Transportation support activities. . . . . . . . . . . . . . . . . . . . . . . .. . . . . . . . . . . . . . . .. 488 12/03 114.2 114.7 114.8 2.4 0.1
D e l i v e r y a nd w a r e hous e i ndus t r i e s . . . . . . . . . . . . . . . . . . . . . . . . . . . . . . . . . . . . . . 12/06 126.9 126.4 126.1 5.9 -0.2
U.S. Postal Service. . . . . . . . . . . . . . .. . .. . . . . . . .. . . . . . . .. . .. . . . . . . .. . . . . . . . 491 06/89 191.6 191.6 191.6 2.1 0.0
Couriers and messengers. . . . . . . .. . . . . . . .. . . .. . . . . . . .. . . . . . . .. . . . . . . .. . . 492 12/03 171.9 170.4 169.8 10.3 -0.4
Warehousing and storage. . .. . .. . . . . . . .. . .. . . . . . . .. . . . . . . .. . .. . . . . . . .. . . 493 12/06 103.4 103.7 103.0 0.0 -0.7
Tot al tra di ti onal ser vi ce indust ri es . . . . . . . . . . . . . . . . . . . . . . . . . . . . . . . . . . . . . . . 12/06 107.6 107.9 107.8 1.9 -0.1
I n f o r m a t i o n . . . . . . . . . . . . . . . . . . . . . . . . . . . . . . . . . . . . . . . . . . . . . . . . . . . . . . . . . . . . . . 12/06 102.3 102.4 102.6 0.4 0.2
Publishing industries, except Internet. . . . . . . . . . . . . . .. . . . . . . . . . . . . . . .. . . . . 511 12/03 111.0 111.4 111.2 0.8 -0.2
Broadcasting, except Internet. . . . . . .. . . . . . .. . . .. . . . . . .. . . .. . . . . . .. . . .. . .. 515 12/03 114.8 108.7 114.0 0.3 4.9
Telecommunications. . .. . .. . . . . . . . . . .. . .. . .. . . . . .. . .. . .. . . . . .. . .. . .. . . . . 517 12/03 101.4 101.8 102.0 0.5 0.2
See footnotes at end of table.
20
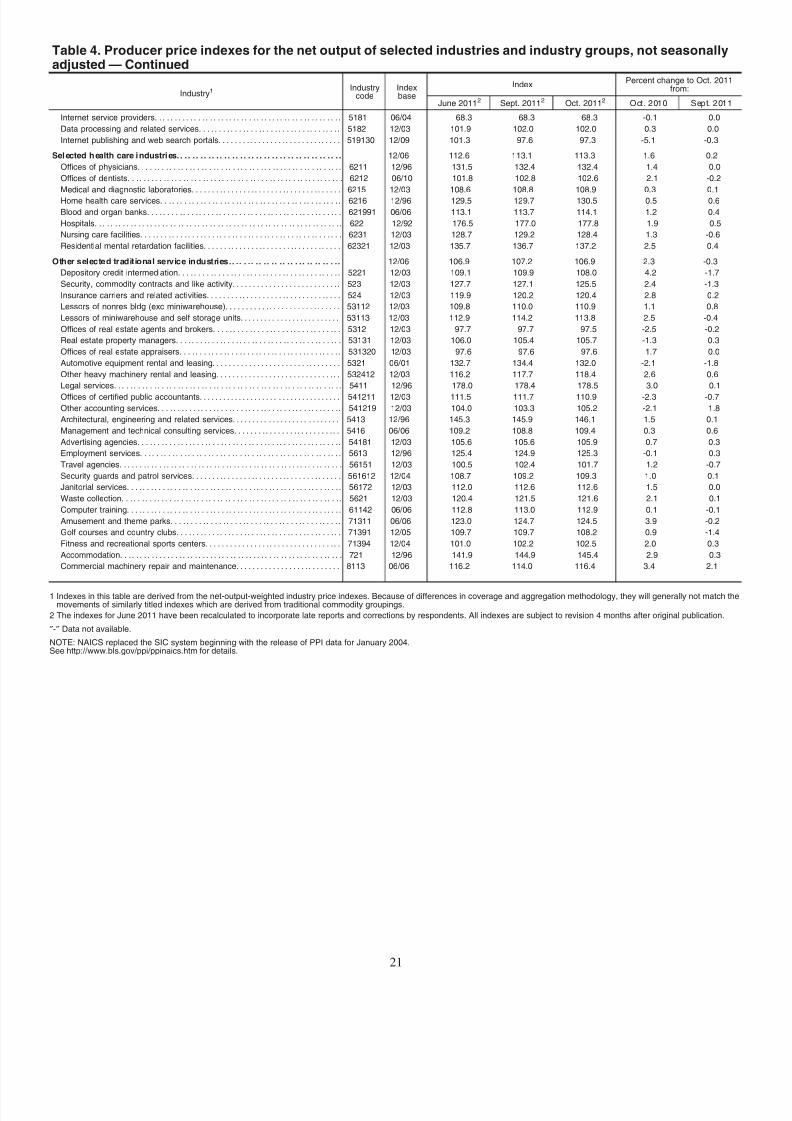
8/3/2019 Producer Price Indexes -October 2011
http://slidepdf.com/reader/full/producer-price-indexes-october-2011 21/22
Table 4. Producer price indexes for the net output of selected industries and industry groups, not seasonallyadjusted — Continued
Industry1Industry
codeIndexbase
IndexPercent change to Oct. 2011
from:
June 20112 Sept. 20112 Oct. 20112 Oct. 2010 Sept. 2011
Internet service providers. . . . . . . . . . . . .. . . . . . . . . . . . .. . . . . . . . . . . . .. . . . . . . . . 5181 06/04 68.3 68.3 68.3 -0.1 0.0
Data processing and related services. . . .. . . . . . . . . . . .. . . . . . . . . . . .. . . . . . .. 5182 12/03 101.9 102.0 102.0 0.3 0.0
Internet publishing and web search portals. . . . . . . .. . . . . . . . .. . . . . . . . .. . . . . 519130 12/09 101.3 97.6 97.3 -5.1 -0.3
Sel ected h ealth care i ndustri es. . . . . . . . . . . . . . . . . . . . . . . . . . . . . . . . . . . . . . . . . . 12/06 112.6 113.1 113.3 1.6 0.2
Offices of physicians. . . . .. . .. . .. . .. . .. . .. . .. . .. . .. . .. . .. . . . .. . .. . .. . .. . . 6211 12/96 131.5 132.4 132.4 1.4 0.0
Offices of dentists. . .. . . . . . .. . . . .. . . . .. . . . . . .. . . . .. . . . .. . . . . . .. . . . .. . . . . . 6212 06/10 101.8 102.8 102.6 2.1 -0.2
Medical and diagnostic laboratories. . . . . . . .. . . . . . . .. . . . . . . .. . . . . . . .. . . . . . 6215 12/03 108.6 108.8 108.9 0.3 0.1
Home health care services. . . . . . . . . . .. . .. . .. . .. . .. . .. . . . . . . .. . .. . . . . . . .. 6216 12/96 129.5 129.7 130.5 0.5 0.6
Blood and organ banks. . . . . . . . .. . . . . . . . .. . . . . . . . . . . . .. . . . . . . . . . . . . . . . . . 621991 06/06 113.1 113.7 114.1 1.2 0.4
Hospitals. . . . . . . . . . . . . . . . . . . . . . . . . . . . . . . . . . . . . . . . . . . . . . . . . . . . . . . . . . . . . .. 622 12/92 176.5 177.0 177.8 1.9 0.5
Nursing care facilities. . . . . . . .. . . . . . . . . . . .. . . . . . . . . . . .. . . . . . . . . . . .. . . . . . . 6231 12/03 128.7 129.2 128.4 1.3 -0.6
Residential mental retardation facilities. . . . . . .. . . . . . . .. . . . . . . .. . . . . . .. . . . . 62321 12/03 135.7 136.7 137.2 2.5 0.4
Other selected traditional service industries.. .. . .. .. .. .. .. .. . .. .. .. .. . .. 12/06 106.9 107.2 106.9 2.3 -0.3
Depository credit intermediation. . . . . . . . .. . . . . . . . . . . . . . . . . .. . . . . . . . .. . . .. 5221 12/03 109.1 109.9 108.0 4.2 -1.7
Security, commodity contracts and like activity. . . . . . . . . . . . . . . . . . . . . . . . . .. 523 12/03 127.7 127.1 125.5 2.4 -1.3
Insurance carriers and related activities. . . . . . . . .. . . . . . . . . . .. . . . . . . . . .. . . . 524 12/03 119.9 120.2 120.4 2.8 0.2
Lessors of nonres bldg (exc miniwarehouse). . . . . . . . . . .. . . . . . . . . . . .. . . . . . 53112 12/03 109.8 110.0 110.9 1.1 0.8
Lessors of miniwarehouse and self storage units. . . . . . . . . . . . . . . . . . . . . . . . . 53113 12/03 112.9 114.2 113.8 2.5 -0.4
Offices of real estate agents and brokers. . . . . . . . . . . . . . . . . . . . . . . . . . . . . .. . 5312 12/03 97.7 97.7 97.5 -2.5 -0.2
Real estate property managers. . . .. . . . . . . .. . . . . . . .. . . . . . . .. . . . . . . .. . . . . . 53131 12/03 106.0 105.4 105.7 -1.3 0.3
Offices of real estate appraisers. . . . . . . . . . . .. . . . . . . . . . . .. . . . . . . . . . . .. . . .. 531320 12/03 97.6 97.6 97.6 1.7 0.0
Automotive equipment rental and leasing. . . . . . . . . . . . . . . . . . . . . . . .. . . . . . . . 5321 06/01 132.7 134.4 132.0 -2.1 -1.8
Other heavy machinery rental and leasing. . . . . . . . . . . . . . . . . . . . . . . . . . . . .. . 532412 12/03 116.2 117.7 118.4 2.6 0.6
Legal services. . . . .. . .. . .. . .. . .. . .. . .. . .. . .. . .. . .. . .. . .. . .. . .. . .. . . . .. . . 5411 12/96 178.0 178.4 178.5 3.0 0.1
Offices of certified public accountants. . . . . . . . . . . . . . . . . . . . . . . . . . . . . . . . . . . . 541211 12/03 111.5 111.7 110.9 -2.3 -0.7
Other accounting services. . . . . . . . . . .. . . .. . . .. . . .. . . .. . . .. . . .. . . .. . . . . . .. 541219 12/03 104.0 103.3 105.2 -2.1 1.8
Architectural, engineering and related services. . . . . . . . . . . . . . . . . . . . . . . . . . . 5413 12/96 145.3 145.9 146.1 1.5 0.1
Management and technical consulting services. . . . . . . .. . . . . . . .. . . . . . . . .. . 5416 06/06 109.2 108.8 109.4 0.3 0.6
Advertising agencies. . . . . . . . . . . . . . . . . .. . . . . . . . . . .. . . . . . . . . . .. . . . . . . . . . .. 54181 12/03 105.6 105.6 105.9 0.7 0.3
Employment services. . . . . .. . . . . .. . .. . . . . .. . . . . .. . .. . . . . .. . . . . .. . .. . . . . . 5613 12/96 125.4 124.9 125.3 -0.1 0.3
Travel agencies. . . . . . .. . . . .. . . . . . .. . . . . . . . .. . . . . . .. . . . . . .. . . . . . . . .. . . . . . 56151 12/03 100.5 102.4 101.7 1.2 -0.7
Security guards and patrol services. . . . . . . .. . . . . . . .. . . . . . . .. . . . . . . .. . . . . . 561612 12/04 108.7 109.2 109.3 1.0 0.1
Janitorial services. . . .. . . . . . .. . . .. . . . . . .. . . .. . . . . . .. . . .. . . . . . .. . . . . . .. . .. 56172 12/03 112.0 112.6 112.6 1.5 0.0
Waste collection. . .. . .. . . . . . . .. . . . . . . .. . . . . . . .. . .. . . . . . . .. . . . . . . .. . .. . .. 5621 12/03 120.4 121.5 121.6 2.1 0.1
Computer training. . . .. . . . . . .. . . .. . . . . . .. . . .. . . . . . .. . . .. . . . . . .. . . .. . . . . .. 61142 06/06 112.8 113.0 112.9 0.1 -0.1
Amusement and theme parks. . . . . . . . .. . . . .. . . . .. . . . .. . . . . . . . .. . . . .. . . .. 71311 06/06 123.0 124.7 124.5 3.9 -0.2
Golf courses and country clubs. . . . . . . . . . . . . . . . . .. . . . . . . . . . .. . . . . . . . . . .. . 71391 12/05 109.7 109.7 108.2 0.9 -1.4
Fitness and recreational sports centers. . . . . . . . . . . . . . . .. . . . . . . . . . . . . . . .. . 71394 12/04 101.0 102.2 102.5 2.0 0.3
Accommodation. . .. . . . . . . . . . . . .. . . . . . . . . . . . .. . . . . . . . . . .. . . . . . . . . . . . .. . . . 721 12/96 141.9 144.9 145.4 2.9 0.3
Commercial machinery repair and maintenance. . . . . . . . . . . . . . . . . .. . . . . . . . 8113 06/06 116.2 114.0 116.4 3.4 2.1
1 Indexes in this table are derived from the net-output-weighted industry price indexes. Because of differences in coverage and aggregation methodology, they will generally not match themovements of similarly titled indexes which are derived from traditional commodity groupings.
2 The indexes for June 2011 have been recalculated to incorporate late reports and corrections by respondents. All indexes are subject to revision 4 months after original publication.
″ -″ Data not available.
NOTE: NAICS replaced the SIC system beginning with the release of PPI data for January 2004.See http://www.bls.gov/ppi/ppinaics.htm for details.
21
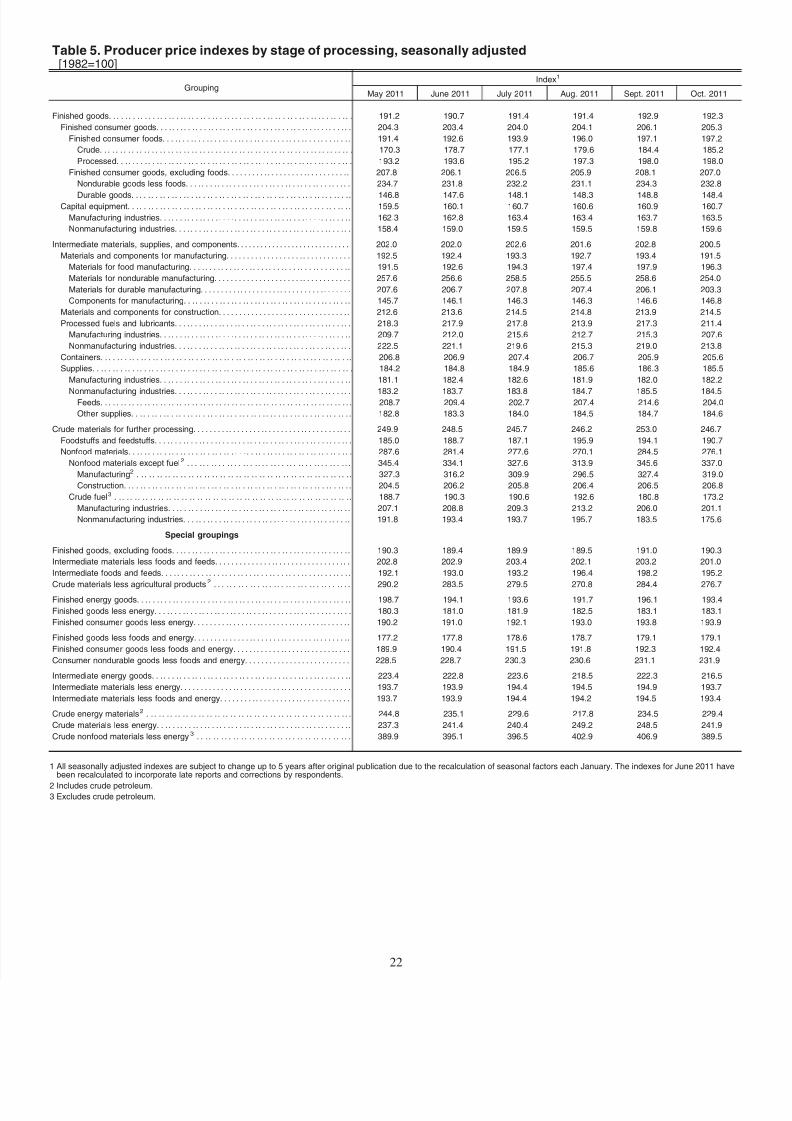
8/3/2019 Producer Price Indexes -October 2011
http://slidepdf.com/reader/full/producer-price-indexes-october-2011 22/22
Table 5. Producer price indexes by stage of processing, seasonally adjusted[1982=100]
GroupingIndex1
May 2011 June 2011 July 2011 Aug. 2011 Sept. 2011 Oct. 2011
Finished goods. . . . .. . .. . . . .. . .. . .. . . . .. . .. . .. . . . .. . .. . .. . . . .. . .. . .. . . . .. . .. . 191.2 190.7 191.4 191.4 192.9 192.3
Finished consumer goods. . . .. . . . . . . . . .. . . . . . .. . . . . . .. . . . . . .. . . . . . . . . . . . .. . 204.3 203.4 204.0 204.1 206.1 205.3
Finished consumer foods. . . .. . . .. . . . . . . .. . . .. . . .. . . . . . . .. . . .. . . . . . . .. . .. 191.4 192.6 193.9 196.0 197.1 197.2
Crude. . . . . . . . . . . . . . . . . . . . . . . . . . . . . . . . . . . . . . . . . . . . . . . . . . . . . . . . . . . . . . . . 170.3 178.7 177.1 179.6 184.4 185.2
Processed. . .. . . . .. . .. . .. . . . .. . .. . .. . . . .. . .. . .. . . . .. . .. . .. . . . .. . .. . .. . 193.2 193.6 195.2 197.3 198.0 198.0
Finished consumer goods, excluding foods. . . . . . . . . .. . . . . . . . . .. . . . . . . . . .. 207.8 206.1 206.5 205.9 208.1 207.0
Nondurable goods less foods. . . .. . . . . . . . . . . . . . . . . .. . . . . . . . . . .. . . . . . . . . 234.7 231.8 232.2 231.1 234.3 232.8
Durable goods. . . . .. . .. . .. . .. . .. . .. . .. . .. . .. . .. . .. . .. . .. . .. . .. . . . .. . .. 146.8 147.6 148.1 148.3 148.8 148.4Capital equipment. . .. . .. . .. . .. . .. . .. . .. . . . .. . .. . .. . . . .. . .. . .. . . . .. . .. . .. . . 159.5 160.1 160.7 160.6 160.9 160.7
Manufacturing industries. . . . . . .. . . .. . . .. . . .. . . . . . .. . . .. . . . . . .. . . .. . . . . . .. 162.3 162.8 163.4 163.4 163.7 163.5
Nonmanufacturing industries. . . .. . . .. . . .. . . .. . . .. . . .. . . .. . . . . . .. . . .. . . .. . 158.4 159.0 159.5 159.5 159.8 159.6
Intermediate materials, supplies, and components. . . . . . . . . . . . . . . . . . . . . . . . . . . . . 202.0 202.0 202.6 201.6 202.8 200.5
Materials and components for manufacturing. . . . . . . . . . . . . . . . . . .. . . . . . . . . . . . 192.5 192.4 193.3 192.7 193.4 191.5
Materials for food manufacturing. . . .. . . . . . . . . . . .. . . . . . . . . . . .. . . . . . . .. . . .. 191.5 192.6 194.3 197.4 197.9 196.3
Materials for nondurable manufacturing. . . . . . . . . . . . . . . . . . . . . .. . . . . . . . . . . . 257.6 256.6 258.5 255.5 258.6 254.0
Materials for durable manufacturing. . . . . . . . . .. . . . . . . . . .. . . . . . . . . . .. . . . . . . 207.6 206.7 207.8 207.4 206.1 203.3
Components for manufacturing. . . . . . . . . .. . . . . . . . . . . . .. . . . . . . . . . . . .. . . . . .. 145.7 146.1 146.3 146.3 146.6 146.8
Materials and components for construction. . . . . . . . . . . . . . . . . .. . . . . . . . . . . . . .. 212.6 213.6 214.5 214.8 213.9 214.5
Processed fuels and lubricants. . . .. . . .. . . .. . . .. . . .. . . .. . . . . . .. . . .. . . .. . . .. . 218.3 217.9 217.8 213.9 217.3 211.4
Manufacturing industries. . . . . . .. . . .. . . .. . . .. . . . . . .. . . .. . . . . . .. . . .. . . . . . .. 209.7 212.0 215.6 212.7 215.3 207.6
Nonmanufacturing industries. . . .. . . .. . . .. . . .. . . .. . . .. . . . . . .. . . .. . . .. . . .. . 222.5 221.1 219.6 215.3 219.0 213.8
Containers. . . . .. . .. . .. . .. . .. . .. . .. . .. . .. . .. . .. . .. . .. . . . .. . .. . .. . . . .. . .. . .. 206.8 206.9 207.4 206.7 205.9 205.6
Supplies. . .. . .. . .. . .. . .. . . . . . . .. . . . . . . .. . .. . . . . . . .. . . . . . . .. . . . . . . .. . .. . . . . 184.2 184.8 184.9 185.6 186.3 185.5
Manufacturing industries. . . . . . .. . . .. . . .. . . .. . . . . . .. . . .. . . . . . .. . . .. . . . . . .. 181.1 182.4 182.6 181.9 182.0 182.2
Nonmanufacturing industries. . . .. . . .. . . .. . . .. . . .. . . .. . . . . . .. . . .. . . .. . . .. . 183.2 183.7 183.8 184.7 185.5 184.5Feeds. . . . . . . . . . . . . . . . . . . . . . . . . . . . . . . . . . . . . . . . . . . . . . . . . . . . . . . . . . . . . . . . 208.7 209.4 202.7 207.4 214.6 204.0
Other supplies. . .. . .. . .. . .. . . . . . . .. . . . . . . .. . .. . . . . . . .. . . . . . . .. . .. . . . . . 182.8 183.3 184.0 184.5 184.7 184.6
Crude materials for further processing. . . . . . . . .. . . . . . . . .. . . . . . . . . .. . . . . . . . .. . . 249.9 248.5 245.7 246.2 253.0 246.7
Foodstuffs and feedstuffs. . . . . . . . . . . .. . . . . . . . . . . .. . . . . . . .. . . . . . . .. . . . . . . .. . 185.0 188.7 187.1 195.9 194.1 190.7
Nonfood materials. . .. . . . .. . .. . .. . . . .. . .. . .. . . . .. . .. . .. . . . .. . .. . .. . . . .. . .. . 287.6 281.4 277.6 270.1 284.5 276.1
Nonfood materials except fuel2 . . . .. . .. . . .. . . .. . .. . . .. . . .. . .. . . .. . . .. . .. . 345.4 334.1 327.6 313.9 345.6 337.0
Manufacturing2 . . . . . .. . . .. . . .. . . .. . . .. . . . . .. . . .. . . .. . . .. . . .. . . . . .. . . .. 327.3 316.2 309.9 296.5 327.4 319.0
Construction. . . . .. . .. . .. . .. . .. . .. . .. . .. . .. . .. . . . .. . .. . .. . .. . .. . .. . .. . . 204.5 206.2 205.8 206.4 206.5 206.8
Crude fuel3 . .. . . .. .. . . .. .. .. . . .. .. .. . . .. .. . . .. .. .. . . .. .. .. . . .. .. .. . . .. .. 188.7 190.3 190.6 192.6 180.8 173.2
Manufacturing industries. . . . . . . . . .. . . . . . .. . . . . . .. . . . . . . . . .. . . . . . . . . .. . . 207.1 208.8 209.3 213.2 206.0 201.1
Nonmanufacturing industries. . . .. . . . . . .. . . . . . . . . .. . . . . . .. . . . . . .. . . . . . .. 191.8 193.4 193.7 195.7 183.5 175.6
Special groupings
Finished goods, excluding foods. . . . . . . . . . . . .. . . . . . . . . . . . .. . . . . . . . . . . . .. . . . . .. 190.3 189.4 189.9 189.5 191.0 190.3
Intermediate materials less foods and feeds. . . . . . . . . . . . . . .. . . . . . . . . . . . . . . . .. . 202.8 202.9 203.4 202.1 203.2 201.0
Intermediate foods and feeds. . . . . . . . . . . . . . . . . . . . . . . . . . . . . . . . . . . . . . . . . . . . . . . . 192.1 193.0 193.2 196.4 198.2 195.2
Crude materials less agricultural products2 . . . .. . .. . .. . .. . .. . .. . .. . .. . .. . . .. . . 290.2 283.5 279.5 270.8 284.4 276.7
Finished energy goods. . . . . . . . . .. . . . . . .. . . . . . .. . . . . . .. . . . . . .. . . . . . . . . .. . . . . .. 198.7 194.1 193.6 191.7 196.1 193.4
Finished goods less energy. . . .. . . . . . . .. . . .. . . . . . . .. . . .. . . . . . . .. . . .. . . . . . . . . . 180.3 181.0 181.9 182.5 183.1 183.1
Finished consumer goods less energy. . . . . . . . .. . . . . . . .. . . . . . . .. . . . . . . .. . . . . .. 190.2 191.0 192.1 193.0 193.8 193.9
Finished goods less foods and energy. . . . . . . .. . . . . . .. . . . . . . .. . . . . . . .. . . . . . . .. 177.2 177.8 178.6 178.7 179.1 179.1
Finished consumer goods less foods and energy. . . . . .. . . . . . .. . . . . .. . . . . . .. . . . 189.9 190.4 191.5 191.8 192.3 192.4
Consumer nondurable goods less foods and energy. . . . . . . . . . . . . . . . . . . . . . . . . . 228.5 228.7 230.3 230.6 231.1 231.9
Intermediate energy goods. . . . . . .. . . .. . . .. . . .. . . .. . . .. . . . . . .. . . .. . . .. . . .. . . .. 223.4 222.8 223.6 218.5 222.3 216.5
Intermediate materials less energy. . . . . . . . . . . . . .. . . . . . . . . . . .. . . . . . . . . . . . .. . . . 193.7 193.9 194.4 194.5 194.9 193.7
Intermediate materials less foods and energy. . . . . . . . .. . . . . . . . . . .. . . . . . . . . .. . . 193.7 193.9 194.4 194.2 194.5 193.4
Crude energy materials2 . . . . . . . . . . . . . . . . . . . .. . . . . . . . . . . . . . . . . . . . . . . . . . . .. . . . 244.8 235.1 229.6 217.8 234.5 229.4
Crude materials less energy. . . . . . . . . .. . . . . . . . . . . . .. . . . . . . . . . . . .. . . . . . . . . . . . .. 237.3 241.4 240.4 249.2 248.5 241.9
Crude nonfood materials less energy3 . . .. .. . . . .. .. .. . . . .. .. . . . .. .. .. . . . .. .. . 389.9 395.1 396.5 402.9 406.9 389.5
1 All seasonally adjusted indexes are subject to change up to 5 years after original publication due to the recalculation of seasonal factors each January. The indexes for June 2011 havebeen recalculated to incorporate late reports and corrections by respondents.
2 Includes crude petroleum.3 Excludes crude petroleum.