Embed Size (px)
Citation preview
Transmission of material in this release is embargoed until USDL-14-0252 8:30 a.m. (EST), Wednesday, February 19, 2014
Technical information: (202) 691-7705 • [email protected] • www.bls.gov/ppi Media contact: (202) 691-5902 • [email protected]
PRODUCER PRICE INDEXES – JANUARY 2014
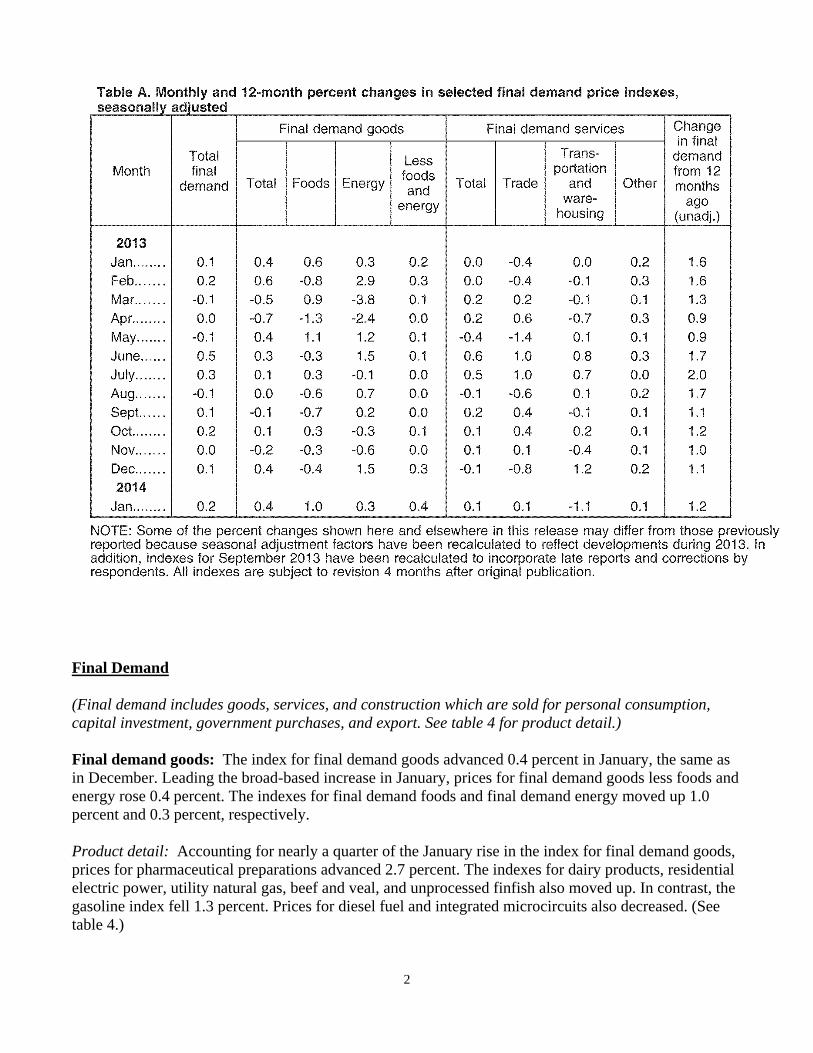
The Producer Price Index for final demand increased 0.2 percent in January, seasonally adjusted, the U.S. Bureau of Labor Statistics reported today. This advance followed a 0.1-percent rise in December and no change in November. On an unadjusted basis, the index for final demand moved up 1.2 percent for the 12 months ended in January, the largest 12-month advance since a 1.2-percent increase in October 2013. (See table A.) In January, the 0.2-percent advance in prices for final demand can be primarily traced to the index for final demand goods, which rose 0.4 percent. Prices for final demand services inched up 0.1 percent. Within intermediate demand, the index for processed goods increased 0.6 percent in January, prices for unprocessed goods moved up 0.9 percent, and the index for services was unchanged. (See tables B and C.) Chart 1. One-month percent changes in selected PPI final demand price indexes, seasonally adjusted
Chart 2. Twelve-month percent changes in selected PPI final demand price indexes, not seasonally adjusted
-1.0
-0.5
0.0
0.5
1.0
Jan'13 Feb Mar April May June July Aug Sep Oct Nov Dec Jan'14
Percent change
Final demand Final demand goods Final demand services
-1.0
0.0
1.0
2.0
3.0
Jan'13 Feb Mar April May June July Aug Sep Oct Nov Dec Jan'14
Percent change
Final demand Final demand goods Final demand services
2
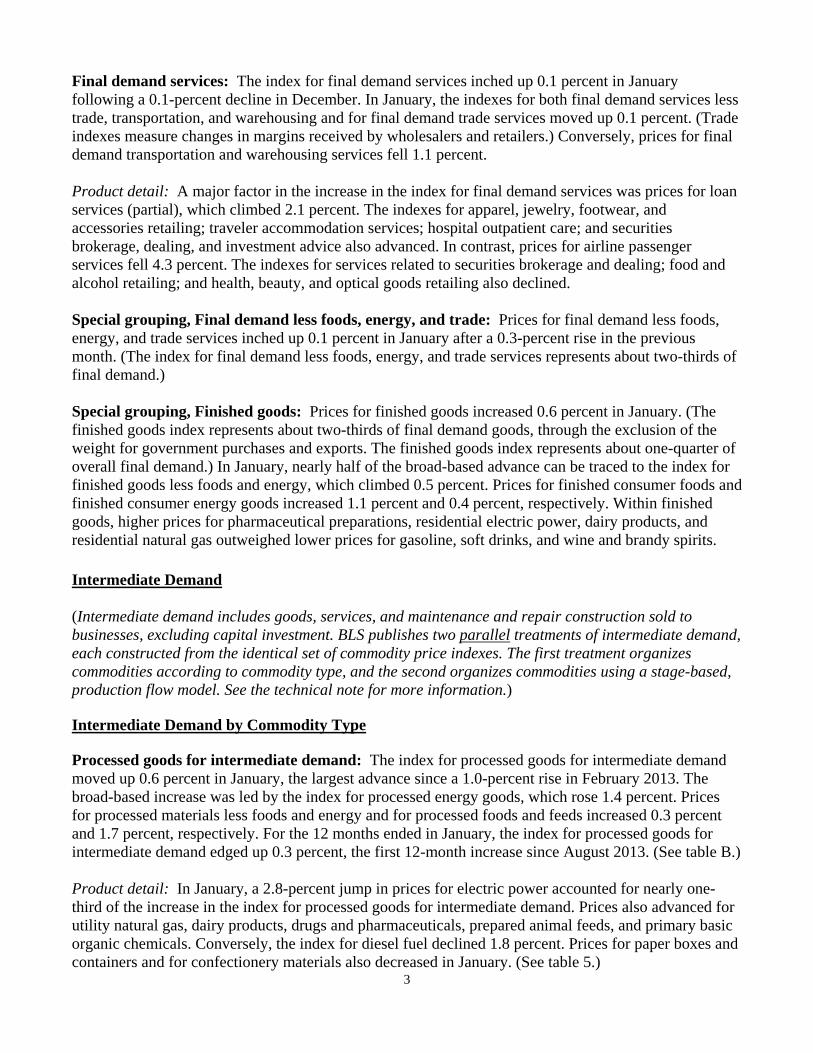
Final Demand (Final demand includes goods, services, and construction which are sold for personal consumption, capital investment, government purchases, and export. See table 4 for product detail.) Final demand goods: The index for final demand goods advanced 0.4 percent in January, the same as in December. Leading the broad-based increase in January, prices for final demand goods less foods and energy rose 0.4 percent. The indexes for final demand foods and final demand energy moved up 1.0 percent and 0.3 percent, respectively. Product detail: Accounting for nearly a quarter of the January rise in the index for final demand goods, prices for pharmaceutical preparations advanced 2.7 percent. The indexes for dairy products, residential electric power, utility natural gas, beef and veal, and unprocessed finfish also moved up. In contrast, the gasoline index fell 1.3 percent. Prices for diesel fuel and integrated microcircuits also decreased. (See table 4.)
3
Final demand services: The index for final demand services inched up 0.1 percent in January following a 0.1-percent decline in December. In January, the indexes for both final demand services less trade, transportation, and warehousing and for final demand trade services moved up 0.1 percent. (Trade indexes measure changes in margins received by wholesalers and retailers.) Conversely, prices for final demand transportation and warehousing services fell 1.1 percent. Product detail: A major factor in the increase in the index for final demand services was prices for loan services (partial), which climbed 2.1 percent. The indexes for apparel, jewelry, footwear, and accessories retailing; traveler accommodation services; hospital outpatient care; and securities brokerage, dealing, and investment advice also advanced. In contrast, prices for airline passenger services fell 4.3 percent. The indexes for services related to securities brokerage and dealing; food and alcohol retailing; and health, beauty, and optical goods retailing also declined. Special grouping, Final demand less foods, energy, and trade: Prices for final demand less foods, energy, and trade services inched up 0.1 percent in January after a 0.3-percent rise in the previous month. (The index for final demand less foods, energy, and trade services represents about two-thirds of final demand.) Special grouping, Finished goods: Prices for finished goods increased 0.6 percent in January. (The finished goods index represents about two-thirds of final demand goods, through the exclusion of the weight for government purchases and exports. The finished goods index represents about one-quarter of overall final demand.) In January, nearly half of the broad-based advance can be traced to the index for finished goods less foods and energy, which climbed 0.5 percent. Prices for finished consumer foods and finished consumer energy goods increased 1.1 percent and 0.4 percent, respectively. Within finished goods, higher prices for pharmaceutical preparations, residential electric power, dairy products, and residential natural gas outweighed lower prices for gasoline, soft drinks, and wine and brandy spirits. Intermediate Demand (Intermediate demand includes goods, services, and maintenance and repair construction sold to businesses, excluding capital investment. BLS publishes two parallel treatments of intermediate demand, each constructed from the identical set of commodity price indexes. The first treatment organizes commodities according to commodity type, and the second organizes commodities using a stage-based, production flow model. See the technical note for more information.) Intermediate Demand by Commodity Type Processed goods for intermediate demand: The index for processed goods for intermediate demand moved up 0.6 percent in January, the largest advance since a 1.0-percent rise in February 2013. The broad-based increase was led by the index for processed energy goods, which rose 1.4 percent. Prices for processed materials less foods and energy and for processed foods and feeds increased 0.3 percent and 1.7 percent, respectively. For the 12 months ended in January, the index for processed goods for intermediate demand edged up 0.3 percent, the first 12-month increase since August 2013. (See table B.) Product detail: In January, a 2.8-percent jump in prices for electric power accounted for nearly one-third of the increase in the index for processed goods for intermediate demand. Prices also advanced for utility natural gas, dairy products, drugs and pharmaceuticals, prepared animal feeds, and primary basic organic chemicals. Conversely, the index for diesel fuel declined 1.8 percent. Prices for paper boxes and containers and for confectionery materials also decreased in January. (See table 5.)
4
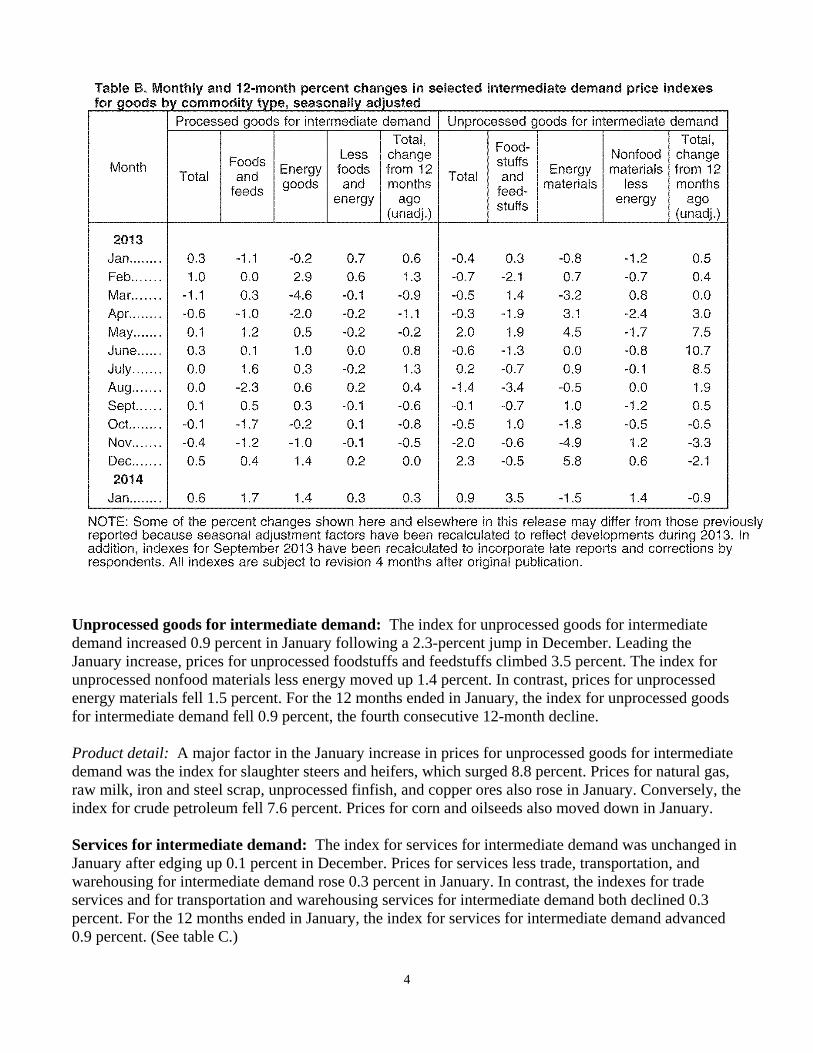
Unprocessed goods for intermediate demand: The index for unprocessed goods for intermediate demand increased 0.9 percent in January following a 2.3-percent jump in December. Leading the January increase, prices for unprocessed foodstuffs and feedstuffs climbed 3.5 percent. The index for unprocessed nonfood materials less energy moved up 1.4 percent. In contrast, prices for unprocessed energy materials fell 1.5 percent. For the 12 months ended in January, the index for unprocessed goods for intermediate demand fell 0.9 percent, the fourth consecutive 12-month decline. Product detail: A major factor in the January increase in prices for unprocessed goods for intermediate demand was the index for slaughter steers and heifers, which surged 8.8 percent. Prices for natural gas, raw milk, iron and steel scrap, unprocessed finfish, and copper ores also rose in January. Conversely, the index for crude petroleum fell 7.6 percent. Prices for corn and oilseeds also moved down in January. Services for intermediate demand: The index for services for intermediate demand was unchanged in January after edging up 0.1 percent in December. Prices for services less trade, transportation, and warehousing for intermediate demand rose 0.3 percent in January. In contrast, the indexes for trade services and for transportation and warehousing services for intermediate demand both declined 0.3 percent. For the 12 months ended in January, the index for services for intermediate demand advanced 0.9 percent. (See table C.)
5
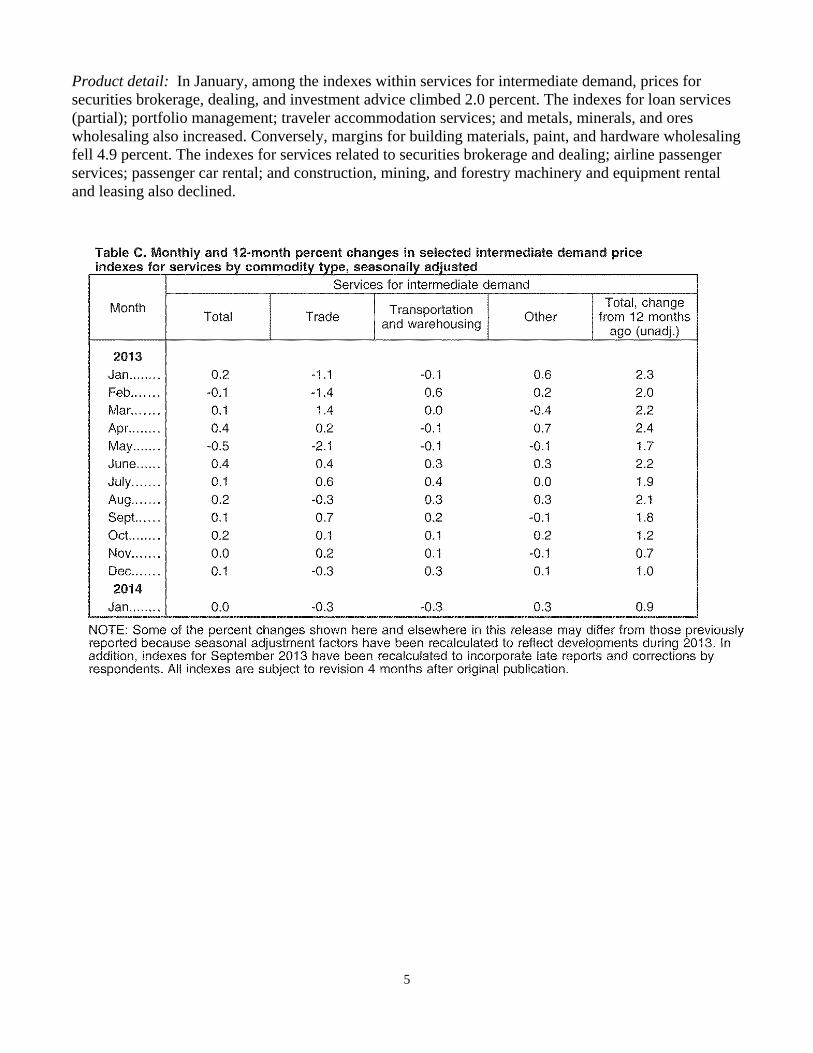
Product detail: In January, among the indexes within services for intermediate demand, prices for securities brokerage, dealing, and investment advice climbed 2.0 percent. The indexes for loan services (partial); portfolio management; traveler accommodation services; and metals, minerals, and ores wholesaling also increased. Conversely, margins for building materials, paint, and hardware wholesaling fell 4.9 percent. The indexes for services related to securities brokerage and dealing; airline passenger services; passenger car rental; and construction, mining, and forestry machinery and equipment rental and leasing also declined.
6
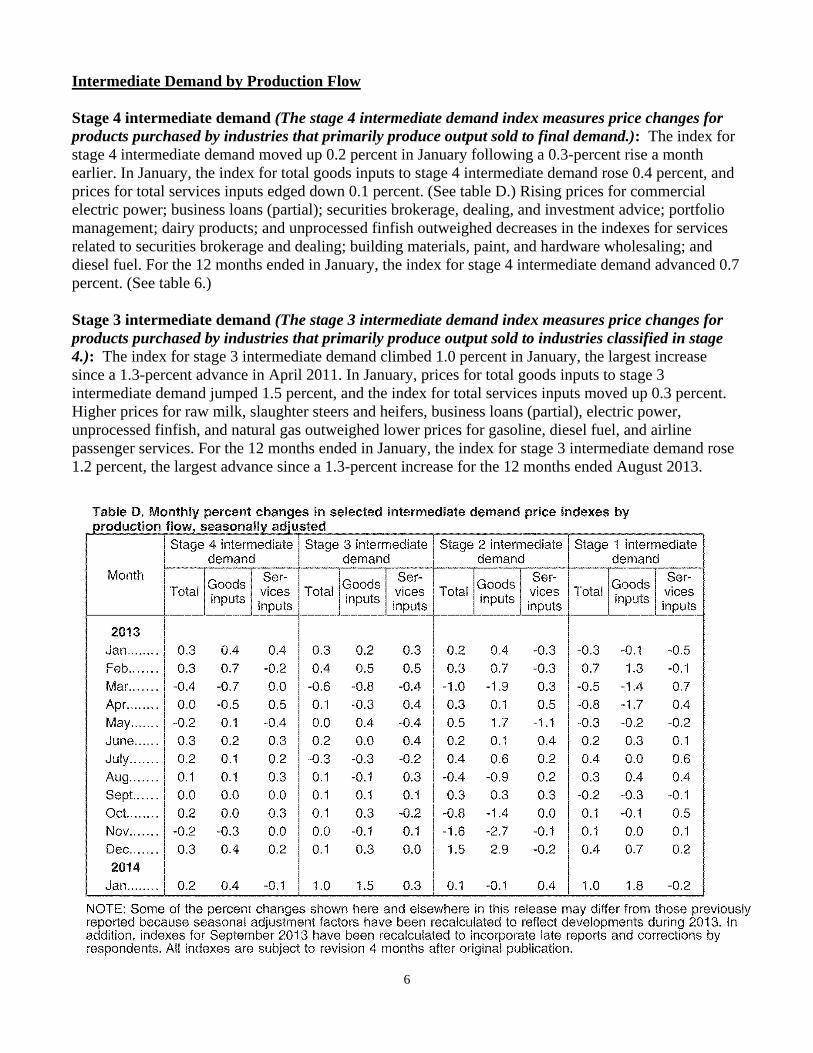
Intermediate Demand by Production Flow Stage 4 intermediate demand (The stage 4 intermediate demand index measures price changes for products purchased by industries that primarily produce output sold to final demand.): The index for stage 4 intermediate demand moved up 0.2 percent in January following a 0.3-percent rise a month earlier. In January, the index for total goods inputs to stage 4 intermediate demand rose 0.4 percent, and prices for total services inputs edged down 0.1 percent. (See table D.) Rising prices for commercial electric power; business loans (partial); securities brokerage, dealing, and investment advice; portfolio management; dairy products; and unprocessed finfish outweighed decreases in the indexes for services related to securities brokerage and dealing; building materials, paint, and hardware wholesaling; and diesel fuel. For the 12 months ended in January, the index for stage 4 intermediate demand advanced 0.7 percent. (See table 6.) Stage 3 intermediate demand (The stage 3 intermediate demand index measures price changes for products purchased by industries that primarily produce output sold to industries classified in stage 4.): The index for stage 3 intermediate demand climbed 1.0 percent in January, the largest increase since a 1.3-percent advance in April 2011. In January, prices for total goods inputs to stage 3 intermediate demand jumped 1.5 percent, and the index for total services inputs moved up 0.3 percent. Higher prices for raw milk, slaughter steers and heifers, business loans (partial), electric power, unprocessed finfish, and natural gas outweighed lower prices for gasoline, diesel fuel, and airline passenger services. For the 12 months ended in January, the index for stage 3 intermediate demand rose 1.2 percent, the largest advance since a 1.3-percent increase for the 12 months ended August 2013.

7
Stage 2 intermediate demand (The stage 2 intermediate demand index measures price changes for products purchased by industries that primarily produce output sold to industries classified in stage 3.): The index for stage 2 intermediate demand inched up 0.1 percent in January compared with a 1.5-percent increase in the previous month. In January, prices for total services inputs to stage 2 intermediate demand rose 0.4 percent, and the index for total goods inputs edged down 0.1 percent. Higher prices for business loans (partial), natural gas, soybean cake and meal, liquefied petroleum gas, and iron and steel scrap outweighed declines in the indexes for crude petroleum; services related to securities brokerage and dealing; grains; and building materials, paint, and hardware wholesaling. For the 12 months ended in January, the index for stage 2 intermediate demand fell 0.2 percent, the third consecutive 12-month decrease. Stage 1 intermediate demand (The stage 1 intermediate demand index measures price changes for products purchased by industries that primarily produce output sold to industries classified in stage 2.): The index for stage 1 intermediate demand advanced 1.0 percent in January, the largest increase since a similar 1.0-percent rise in September 2012. In January, prices for total goods inputs to stage 1 intermediate demand climbed 1.8 percent, and the index for total services inputs moved down 0.2 percent. Rising prices for electric power; iron and steel scrap; primary basic organic chemicals; securities brokerage, dealing, and investment advice; portfolio management; and traveler accommodation services outweighed decreases in the indexes for services related to securities brokerage and dealing; gasoline; and building materials, paint, and hardware wholesaling. For the 12 months ended in January, the index for stage 1 intermediate demand moved up 1.4 percent, the largest gain since a 1.4-percent advance in August 2013. ____________ The Producer Price Index for February 2014 is scheduled to be released on Friday, March 14, 2014 at 8:30 a.m. (EDT).
*****
8
Producer Price Index Transitions from Stage-of-Processing to Final Demand-Intermediate Demand Aggregation System
With this release, BLS transitions from the Stage of Processing (SOP) to the Final Demand-Intermediate Demand (FD-ID) aggregation system. This shift results in significant changes to the PPI news release, as well as other documents available from PPI. The transition to the FD-ID system is the culmination of a long-standing PPI objective to improve the current SOP aggregation system by incorporating PPIs for services, construction, government purchases, and exports. In comparison to the SOP system, the FD-ID system more than doubles current PPI coverage of the United States economy to over 75 percent of in-scope domestic production. The FD-ID system was introduced as a set of experimental indexes in January 2011. Nearly all new FD-ID goods, services, and construction indexes provide historical data back to either November 2009 or April 2010, while the indexes for goods that correspond with the historical SOP indexes go back to the 1970s or earlier. The FD-ID system highlights the index for final demand, which measures price changes for goods, services, and construction sold to final demand: personal consumption, capital investment, government purchases, and exports. The composition of products in the final demand price index differs from that of the finished goods index in two major respects. First, it includes government purchases and exports. Second, it includes services and construction, which are not reflected in finished goods. The FD-ID system also includes two separate parallel treatments of intermediate demand: price changes for goods, services, and construction sold to business as inputs to production. The first treatment, intermediate demand by commodity type, measures price changes based on similarity of product and includes aggregate indexes for processed goods for intermediate demand, unprocessed goods for intermediate demand, and services for intermediate demand. The second treatment, intermediate demand by production flow, is a stage-based system of price indexes, where price changes for goods, services, and construction can be studied as they move through the production chain of the economy to final demand. This treatment includes four stages of intermediate demand, which were established to maximize forward flow of production through the economy, while minimizing backflow of production. These FD-ID indexes are constructed using PPI commodity indexes for goods, services, and construction, where products are assigned to various categories according to buyer type and level of fabrication. A product purchased by different classes of buyers is assigned to multiple FD-ID aggregates, with unique weights allocated to each aggregate based on the product’s value of shipments to each buyer type. The webpage www.bls.gov/ppi/fdidaggregation.htm contains detailed methodological information for the FD-ID aggregation system. Further information is available from the PPI Section of Index Analysis and Public information, at [email protected] or (202) 691-7705.
*****
9
Resampling of Industries
Effective with this release, the Producer Price Index (PPI) includes data for 34 resampled industries classified according to the 2012 North American Industry Classification System (NAICS). The Bureau of Labor Statistics periodically updates the sample of producers providing data for the PPI to reflect current conditions more accurately when the structure, membership, technology, or product mix of an industry shifts. The first results of this systematic process were published in July 1986. Subsequent efforts have been completed at 6-month intervals.
For information on specific index additions, deletions, and recodes effective this month, see the January 2014 issue of the PPI Detailed Report online at www.bls.gov/ppi/ppidr201401.pdf, or contact the PPI’s Section of Index Analysis and Public Information at [email protected] or (202) 691-7705. NAICS Code Industry 212325 Clay, ceramic, and refractory minerals mining 311423 Dried and dehydrated food manufacturing 311710 Seafood product preparation and packaging 314110 Carpet and rug mills 315220 Men's and boys' cut and sew apparel manufacturing 315240 Women's, girls', and infants' cut and sew apparel manufacturing 323120 Support activities for printing 325110 Petrochemical manufacturing 325120 Industrial gas manufacturing 325130 Synthetic dye and pigment manufacturing 327991 Cut stone and stone product manufacturing 332119 Other metal stamping, except automotive 332216 Saw blade, handsaw, and hand and edge tool manufacturing 332811 Metal heat treating 332993 Ammunition, except small arms, manufacturing 333923 Overhead cranes, hoists and monorail systems 333993 Packaging machinery manufacturing 334118 Computer terminal and other computer peripheral equipment manufacturing 334210 Telephone apparatus manufacturing 33441K Capacitor, resistor, coil, transformer, and other inductor manufacturing 334516 Analytical laboratory instrument manufacturing 339115 Ophthalmic goods manufacturing 446130 Optical goods stores 451110 Sporting goods stores 451120 Hobby, toy, and game stores 483113 Coastal and Great Lakes freight transport 483211 Inland water freight transportation 511210 Software publishers 523110 Investment banking and securities dealing 523120 Securities brokerage 523930 Investment advice 561612 Security guards and patrol services 611420 Computer training 811310 Commercial machinery repair and maintenance
*****
10
Recalculation of Seasonal Adjustment Factors Effective with this release, seasonal adjustment factors have been recalculated to reflect price-movement patterns during 2013 for the Final Demand-Intermediate Demand (FD-ID) system and commodity-grouping indexes. This routine annual recalculation may affect previously published seasonally adjusted indexes and percent changes for January 2009 through December 2013. Revised seasonally adjusted data for this period, as well as seasonal adjustment factors for directly adjusted commodity indexes to be used through December 2014, were released February 14, 2014. To obtain this information, contact the Division of Industrial Prices and Price Indexes, Section of Index Analysis and Public Information at [email protected] or (202) 691-7705, or visit the Producer Price Index homepage at www.bls.gov/ppi. Tables E and F provide monthly seasonally adjusted percent changes for major FD-ID system indexes in 2013, based on former and recalculated seasonal factors. These percent changes include final price data through August 2013 and may differ from values shown in tables A through D of this release, which include final price data through September 2013. Table E. Over-the-month percent changes in major final demand indexes, seasonally adjusted, using former and recalculated seasonal factors for 2013 Final demand Final demand goods Final demand services
Month Former Recalculated Former Recalculated Former Recalculated January February March April May June July August September October November December
0.1 .4 .0
-.2 -.2 .6 .4
-.1 .0 .2
-.1 .1
0.1 .2
-.1 .0
-.1 .5 .3
-.1 .1 .2 .0 .1
0.2 .7
-.6 -.7 .3 .5 .2 .0 .1
-.2 -.2 .5
0.4 .6
-.5 -.7 .4 .3 .1 .0 .0 .0
-.2 .4
0.0 .2 .3 .1
-.4 .7 .5
-.2 .1 .3
-.1 -.1
0.0 .0 .2 .2
-.4 .6 .5
-.1 .1 .2 .1
-.1
Table F. Over-the-month percent changes in major intermediate demand indexes, seasonally adjusted, using former and recalculated seasonal factors for 2013 Processed goods for
intermediate demand Unprocessed goods for intermediate demand
Services for intermediate demand
Month Former Recalculated Former Recalculated Former Recalculated January February March April May June July August September October November December
0.2 1.2
-1.2 -.6 .0 .4 .1 .1 .2
-.4 -.5 .6
0.3 1.0
-1.1 -.6 .1 .3 .0 .0 .1
-.2 -.4 .5
0.0 .1
-1.7 -.9 2.2 -.2 .9
-1.8 .2
-.8 -2.6 2.4
-0.4 -.7 -.5 -.3 2.0 -.6 .2
-1.4 -.4 -.2
-2.0 2.3
0.1 .0 .1 .4
-.5 .3 .2 .2 .0 .2 .0 .1
0.2 -.1 .1 .4
-.5 .4 .1 .2 .1 .2 .0 .1
11
Technical Note Brief Explanation of Producer Price Indexes
The Producer Price Index (PPI) of the Bureau of Labor Statistics (BLS) is a family of indexes that measures the average change over time in prices received (price changes) by producers for domestically produced goods, services, and construction. PPIs measure price change from the perspective of the seller. This contrasts with other measures, such as the Consumer Price Index (CPI). CPIs measure price change from the purchaser’s perspective. More than 10,000 PPIs for individual products and groups of products are released each month. PPIs are available for the products of virtually every industry in the mining and manufacturing sectors. Over time, new PPIs have been introduced for products of industries in the services and construction sectors of the U.S. economy. As of January 2013, the PPI covered about 70 percent of services as measured by 2007 Census revenue, and 34 percent of construction.
More than 100,000 price quotations per month are organized into three sets of PPIs: (1) Final demand-Intermediate demand (FD-ID) indexes, (2) commodity indexes, and (3) indexes for the net output of industries and their products. The FD-ID structure organizes products by class of buyer and degree of fabrication as well as by stage of production. The commodity structure organizes products by similarity of end use or product type. The entire output of various industries is sampled to derive price indexes for the net output of industries and their products.
Final Demand–Intermediate Demand Indexes
The PPI FD-ID structure measures price change for goods, services, and construction sold to final demand and to intermediate demand. The FD-ID system replaced the PPI stage-of-processing (SOP) system as PPI’s primary aggregation model with the release of data for January 2014. The FD-ID model expands coverage beyond that of the SOP system through the addition of services, construction, exports, and government purchases. Compared with finished goods under the SOP system, the PPI for final demand goods includes nearly a 50 percent expansion of coverage. This increase can be traced to the addition of government purchases and exports. For overall final demand, expansion to include final demand services represents an even larger increase in coverage. In December 2012, final demand goods were about 34.5 percent of overall final demand, final demand services were roughly 63.5 percent, and final demand construction was about 2.0 percent of final demand. Within intermediate demand, coverage of services for intermediate demand resulted in about a 45 percent increase in coverage of the intermediate demand portion of the economy.
FD-ID indexes are constructed from commodity-based producer output price indexes. Commodities are allocated to aggregate indexes primarily based on the type of buyer. The main source of data used to determine the type of buyer is the “Use of commodities by industries, before redefinition,” table
from the Benchmark Input-Output Accounts of the U.S. In many cases, the same commodity is purchased by different types of buyers. As a result, commodities are often included in several FD-ID indexes. For example, regular gasoline is purchased for personal consumption, export, government use, and business use. The PPI program publishes only one commodity index for regular gasoline (wpu057104), reflecting sales to all types of buyers, and this index is used in all aggregations regardless of whether the gasoline is sold for personal consumption, as an export, to government, or to businesses. Proportions based on BEA “Use of Commodities” data are used to allocate the correct portion of the total weight of gasoline to each use category. In cases when buyer type is an important price determining characteristic, indexes are created based on specific buyer type. For example, within the PPI category for loan services, separate indexes for consumer loans and business loans were constructed. For more information relating to the FD-ID structure, see “A new, experimental system of indexes from the PPI program” in the February 2011 Monthly Labor Review. Final Demand: The final demand portion of the FD-ID structure measures price change for commodities sold for personal consumption, capital investment, government, and export. The system is composed of six main price indexes: final demand goods; final demand trade services; final demand transportation and warehousing services; final demand services less trade, transportation, and warehousing; final demand construction; and overall final demand. The final demand goods index measures price change for both unprocessed and processed goods sold to final demand. Fresh fruits sold to consumers and computers sold for capital investment are examples of transactions included in the final demand goods price index. The final demand trade services index measures price change for the retailing and wholesaling of merchandise sold to final demand, generally without transformation. (Trade indexes measure changes in margins received by wholesalers and retailers.) The final demand transportation and warehousing services index tracks price change for transportation of passengers, as well as, transportation of cargo sold to final demand, and also includes prices for warehousing and storage of goods sold to final demand. The final demand services less trade, transportation, and warehousing index measures price change for all services other than trade and transportation sold to final demand. Publishing, banking, lodging, and health care are examples of these services. The final demand construction index tracks price change for new construction, as well as maintenance and repair construction sold to final demand. Construction of office buildings is an example of a commodity that would be included in the final demand construction index. Lastly, the overall final demand index tracks price change for all types of commodities sold to final demand by combining the five final demand component indexes described above. Intermediate Demand: The intermediate demand portion of the FD-ID system tracks price change for goods, services, and construction products sold to businesses as inputs to

12
production, excluding capital investment. The system includes two parallel treatments of intermediate demand. The first treatment organizes intermediate demand commodities by type. The second organizes intermediate demand commodities into production stages, with the explicit goal of developing a forward-flow model of production and price change. The intermediate demand by commodity type portion of the system organizes commodities by similarity of product. The system is composed of six main price indexes: unprocessed goods for intermediate demand; processed goods for intermediate demand; intermediate demand trade services; intermediate demand transportation and warehousing services; intermediate demand services less trade, transportation, and warehousing; and intermediate demand construction. The unprocessed goods for intermediate demand price index measures price change for goods sold to businesses as inputs to production that have undergone no fabrication. Crude petroleum sold to refineries is an example of an unprocessed good sold to intermediate demand. The processed goods for intermediate demand index tracks price change for fabricated goods sold as business inputs. Examples include car parts sold to car manufacturers and gasoline sold to trucking companies. The index for trade services for intermediate demand measures price change for the services of retailing and wholesaling goods purchased by businesses as inputs to production. The intermediate demand transportation and warehousing services index measures price change for business travel, as well as, transportation and warehousing of cargo sold to intermediate demand. The intermediate demand services less trade, transportation, and warehousing index measures price change for services other than trade, transportation, and warehousing sold as inputs to production. Legal and accounting services purchased by businesses are examples of intermediate demand services excluding trade, transportation, and warehousing. Finally, the construction for intermediate demand index measures price change for construction purchased by firms as inputs to production. The index for construction for intermediate demand tracks price change for maintenance and repair construction purchased by firms.
The production flow treatment of intermediate demand is a stage-based system of price indexes. These indexes can be used to study price transmission across stages of production and final demand. This system is constructed in a manner that maximizes forward flow of production between stages, while minimizing back-flow of production. The production flow treatment contains four main indexes: intermediate demand stage 1, intermediate demand stage 2, intermediate demand stage 3, and intermediate demand stage 4.
Indexes for the four stages were developed by first assigning each industry in the economy to one of four stages of production, where industries assigned to the fourth stage primarily produce output consumed as final demand, industries in the third stage primarily produce output consumed by stage 4 industries, industries assigned to the second stage primarily produce output consumed by stage 3 industries, and industries assigned to the first stage produce output primarily consumed by stage 2 industries. The four indexes then track prices for the net inputs consumed by
industries in each of the four stages of production. The stage 4 intermediate demand index, for example, tracks price change for inputs consumed, but not produced, by industries included in the fourth stage of production. Hence, the index tracks price change in inputs to industries that primarily produce final demand commodities (stage 4 producers primarily produce commodities sold to final demand). Examples of heavily weighted goods-producing industries in stage 4 include the manufacture of light trucks and utility vehicles, automobiles, and pharmaceuticals. Retail trade, food service and drinking places, and hospitals are examples of heavily weighted service industries included in stage 4. Stage 4 also includes all new construction industries. Examples of goods consumed by stage 4 industries include motor vehicle parts, commercial electric power, plastic construction products, biological products, and beef and veal. Engineering services, machinery and equipment wholesaling, long distance motor carrying, and legal services constitute examples of services consumed by stage 4 industries. Examples of highly weighted goods-producing industries included in stage 3 are motor vehicle parts manufacturing, animal (except poultry) slaughtering and processing, and semiconductor manufacturing. Services industries classified in stage 3 include wholesale trade; insurance carriers; architecture, engineering, and related services; and hotels and motels. Examples of goods consumed by stage 3 industries include slaughter steers and heifers, industrial electric power, and hot rolled steel bars, plates, and structural shapes. Services commonly consumed by stage 3 industries include commissions from sales of property and casualty insurance, business loans, temporary help services, and administrative and general management consulting services. Petroleum refineries; electricity generation, transmission, and distribution; natural gas distribution; cattle ranching and farming; and plastic materials and resin manufacturing are among the goods-based industries assigned to stage 2. Services industries that are heavily weighted in stage 2 include management of companies and enterprises; non-depository credit intermediation; insurance agencies and brokerages; and services to buildings and dwellings. Goods commonly purchased by stage 2 industries include crude oil, natural gas, formula feeds, and primary basic organic chemicals. Services that are heavily weighted in the intermediate demand stage 2 index are legal services, business loans, and cellular phone and other wireless telecommunication. Goods producing industries in stage 1 include oil and gas extraction, paper mills, and grain farming. Real estate, legal services, and advertising services are examples of highly weighted services industries included in stage 1. Examples of goods consumed by stage 1 industries are commercial and industrial electric power and gasoline. Services commonly consumed by stage 1 industries include solid waste collection, chemicals and allied products wholesaling, and guestroom or unit rental. It should be noted that all inputs purchased by stage 1 industries are by definition produced either within stage 1 or by latter stages of processing, leaving stage 1 less useful for price transmission analysis. For additional information on industry stage assignments, see http://www.bls.gov/ppi/industryflowstage.htm.
13
Comparing the PPI with CPI Although some data users utilize the PPI as a potential indicator of the Consumer Price Index (CPI), there are many reasons why the PPI and the CPI may diverge. The scope of the personal consumption portion of the PPI includes all marketable output sold by domestic producers for households. The scope of the CPI includes goods and services provided by business or government, where explicit user charges are paid by consumers. For example, the most heavily weighted item in the CPI, owners’ equivalent rent, is excluded from the PPI. The scope of the CPI includes imports. The PPI excludes imports. The CPI only includes components of personal consumption directly paid for by the consumers, while the PPI includes components of personal consumption that may not be paid for by consumers. For example, the PPI includes medical services paid for by third parties. In contrast to CPI, PPI does not completely cover services. PPIs exclude taxes, since they do not represent producer revenue. Conversely, sales and other taxes paid by consumers are part of household expenditure and are included in the CPI. Additional technical differences between PPI and CPI also exist. For more information see “Comparing new final demand producer price indexes with other Government price indexes,” Monthly Labor Review, January 2014, at http://www.bls.gov/opub/mlr/.
Commodity Indexes
The commodity classification of the PPI organizes goods, services, and construction by similarity of product or end use, disregarding industry of origin. With the release of data for July 2009, PPI expanded its commodity structure to include indexes for services and construction products. Prior to this date, the PPI commodity structure only included products from goods producing sectors. Table 9 of the PPI Detailed Report includes data for commodity indexes, organized in a hierarchal structure, including major groupings, subgroups, product classes, sub-product classes, and individual items.
Industry Net-Output Price Indexes
PPIs for the net output of industries and their products are grouped according to the North American Industry Classification System (NAICS). Prior to the release of January 2004, industry-based PPIs were published according to the Standard Industrial Classification (SIC) system. Industry price indexes are compatible with other economic time series organized by industry, such as data on employment, wages, and productivity. Table 11 of the PPI Detailed Report includes data for NAICS industries and industry groups (3-, 4-, 5-, and 6-digit codes), Census product classes (7- and 8-digit codes), products (9-digit codes), more detailed sub-products (11-digit codes), and, for some industries, indexes for other sources of revenue. Indexes may represent one of three kinds of product categories. Every industry has primary product indexes that show changes in prices received by establishments classified in the industry for products made primarily, but not necessarily exclusively, by that industry. The industry classification of an establishment is determined by which products make up a plurality of its total shipment value. In
addition, most industries have secondary product indexes that show changes in prices received by establishments for products chiefly made in some other industry. Some industries have miscellaneous receipts indexes that track price changes for other sources of revenue received by establishments within the industry that are not derived from sales of their products; for example, resales of purchased materials, or revenues from parking lots owned by a manufacturing plant.
Data Collection
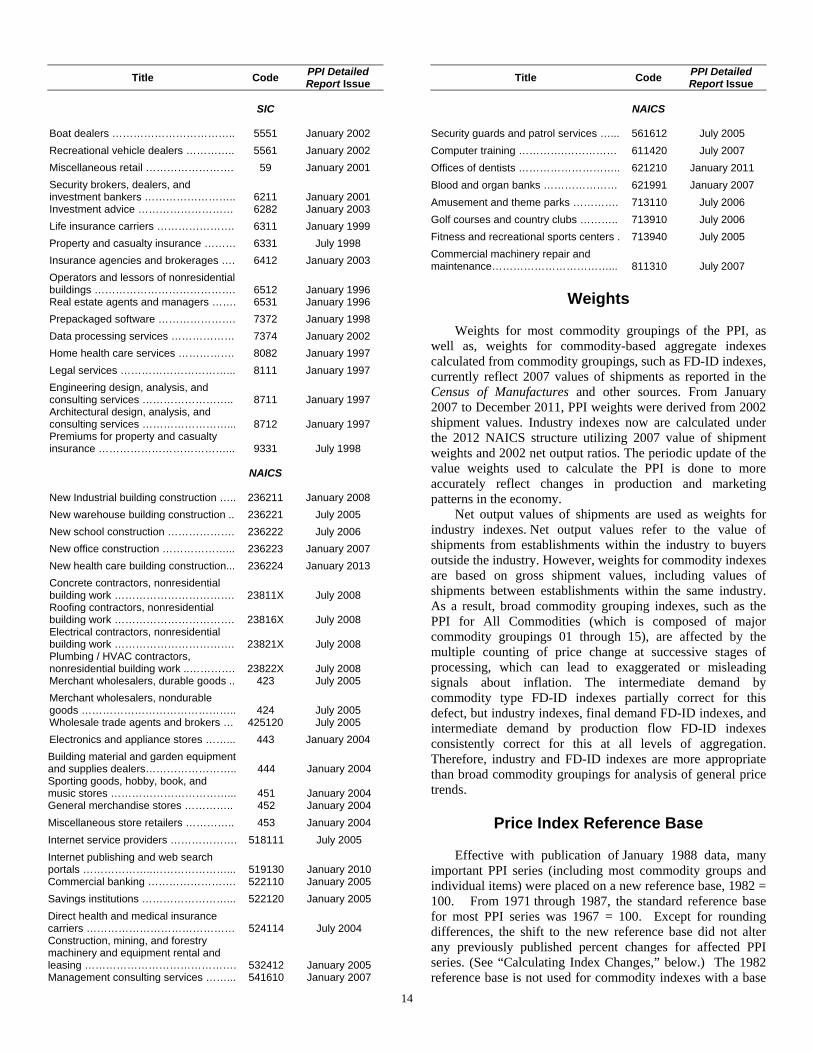
PPIs are constructed using selling prices reported by establishments of all sizes, selected by probability sampling, with the probability of selection proportionate to size. Individual items and transaction terms also are chosen by probability proportionate to size. BLS strongly encourages cooperating companies to supply actual transaction prices at the time of shipment to minimize the use of list prices. Prices submitted by survey respondents are effective on the Tuesday of the week containing the 13th day of the month. The survey is conducted via Internet, mail, and fax. Price data are provided on a voluntary and confidential basis; only sworn BLS employees are allowed access to individual company price reports. BLS publishes price indexes instead of actual prices. All PPIs are subject to revision 4 months after original publication to reflect the availability of late reports and corrections by respondents. BLS periodically updates the PPI sample of survey respondents to better reflect current conditions when the structure, membership, technology, or product mix of an industry shifts significantly and to spread reporting burden among smaller firms. Results of these resampling efforts are incorporated into the PPI with the release of data for January and July. As part of an ongoing effort to expand coverage to sectors of the economy other than mining and manufacturing, an increasing number of service and construction sector industries have been introduced into the PPI. The following list of industries introduced since the mid-1990s includes the month and year in which an article describing the industry’s content appeared in the PPI Detailed Report. Service and construction sector industries introduced into the Producer Price Index, by SIC or NAICS code and the PPI Detailed Report that announces their introduction
Title Code PPI Detailed Report Issue
SIC
Wireless telecommunications …………. 4812 July 1999
Telephone communications, except radio telephone ………………………….
4813
July 1995
Television broadcasting ……………….. 4833 July 2002
Grocery stores ………………………….. 5411 July 2000
Meat and fish (seafood) markets ……... 5421 July 2000
Fruit and vegetable markets …………... 5431 July 2000
Candy, nut, and confectionery stores … 5441 July 2000
Retail bakeries ………………………….. 5461 July 2000
Miscellaneous food stores …………….. 5499 July 2000
New car dealers ………………………… 5511 July 2000
Gasoline service stations ……………… 5541 January 2002
14
Title Code PPI Detailed Report Issue
SIC
Boat dealers …………………………….. 5551 January 2002
Recreational vehicle dealers ………….. 5561 January 2002
Miscellaneous retail ……………………. 59 January 2001
Security brokers, dealers, and investment bankers ……………………..
6211
January 2001
Investment advice ……………………… 6282 January 2003
Life insurance carriers …………………. 6311 January 1999
Property and casualty insurance ……… 6331 July 1998
Insurance agencies and brokerages …. 6412 January 2003
Operators and lessors of nonresidential buildings ………………………………….
6512
January 1996
Real estate agents and managers ……. 6531 January 1996
Prepackaged software …………………. 7372 January 1998
Data processing services ……………… 7374 January 2002
Home health care services ……………. 8082 January 1997
Legal services …………………………... 8111 January 1997
Engineering design, analysis, and consulting services ……………………..
8711
January 1997
Architectural design, analysis, and consulting services ……………………...
8712
January 1997
Premiums for property and casualty insurance ………………………………...
9331
July 1998
NAICS
New Industrial building construction ….. 236211 January 2008
New warehouse building construction .. 236221 July 2005
New school construction ………………. 236222 July 2006
New office construction ………………... 236223 January 2007
New health care building construction... 236224 January 2013
Concrete contractors, nonresidential building work …………………………….
23811X
July 2008
Roofing contractors, nonresidential building work …………………………….
23816X
July 2008
Electrical contractors, nonresidential building work …………………………….
23821X
July 2008
Plumbing / HVAC contractors, nonresidential building work ..………….
23822X
July 2008
Merchant wholesalers, durable goods .. 423 July 2005
Merchant wholesalers, nondurable goods ……………………………………..
424
July 2005
Wholesale trade agents and brokers … 425120 July 2005
Electronics and appliance stores ……... 443 January 2004
Building material and garden equipment and supplies dealers……………………..
444
January 2004
Sporting goods, hobby, book, and music stores ……………………………...
451
January 2004
General merchandise stores ………….. 452 January 2004
Miscellaneous store retailers ………….. 453 January 2004
Internet service providers ………………. 518111 July 2005
Internet publishing and web search portals ………………..…………………...
519130
January 2010
Commercial banking ……………………. 522110 January 2005
Savings institutions ……………………... 522120 January 2005
Direct health and medical insurance carriers ……………………………………
524114
July 2004
Construction, mining, and forestry machinery and equipment rental and leasing ……………………………………. 532412 January 2005 Management consulting services ……... 541610 January 2007
Title Code PPI Detailed Report Issue
NAICS
Security guards and patrol services …... 561612 July 2005
Computer training ………….…………… 611420 July 2007
Offices of dentists ……………………….. 621210 January 2011
Blood and organ banks ………………… 621991 January 2007
Amusement and theme parks …………. 713110 July 2006
Golf courses and country clubs ……….. 713910 July 2006
Fitness and recreational sports centers . 713940 July 2005
Commercial machinery repair and maintenance……………………………...
811310
July 2007
Weights
Weights for most commodity groupings of the PPI, as
well as, weights for commodity-based aggregate indexes calculated from commodity groupings, such as FD-ID indexes, currently reflect 2007 values of shipments as reported in the Census of Manufactures and other sources. From January 2007 to December 2011, PPI weights were derived from 2002 shipment values. Industry indexes now are calculated under the 2012 NAICS structure utilizing 2007 value of shipment weights and 2002 net output ratios. The periodic update of the value weights used to calculate the PPI is done to more accurately reflect changes in production and marketing patterns in the economy.
Net output values of shipments are used as weights for industry indexes. Net output values refer to the value of shipments from establishments within the industry to buyers outside the industry. However, weights for commodity indexes are based on gross shipment values, including values of shipments between establishments within the same industry. As a result, broad commodity grouping indexes, such as the PPI for All Commodities (which is composed of major commodity groupings 01 through 15), are affected by the multiple counting of price change at successive stages of processing, which can lead to exaggerated or misleading signals about inflation. The intermediate demand by commodity type FD-ID indexes partially correct for this defect, but industry indexes, final demand FD-ID indexes, and intermediate demand by production flow FD-ID indexes consistently correct for this at all levels of aggregation. Therefore, industry and FD-ID indexes are more appropriate than broad commodity groupings for analysis of general price trends.
Price Index Reference Base
Effective with publication of January 1988 data, many
important PPI series (including most commodity groups and individual items) were placed on a new reference base, 1982 = 100. From 1971 through 1987, the standard reference base for most PPI series was 1967 = 100. Except for rounding differences, the shift to the new reference base did not alter any previously published percent changes for affected PPI series. (See “Calculating Index Changes,” below.) The 1982 reference base is not used for commodity indexes with a base

15
later than December 1981 or for industry net output indexes and their products. The FD-ID indexes typically have a reference base of November 2009 = 100. For further information on the underlying concepts and methodology of the Producer Price Index, see chapter 14, “Producer Prices,” in the BLS Handbook of Methods. This chapter can be downloaded from the BLS Web site at www.bls.gov/opub/hom/homch14.htm.
Calculating Index Changes
Each PPI measures price changes from a reference period that equals 100.0. An increase of 5.5 percent from the reference period in the Final Demand Goods Price Index, for example, is shown as 105.5. This change also can be expressed in dollars, as follows: prices received by domestic producers of a sample of final demand goods have risen from $100 in November 2009 to $105.50. Likewise, a current index of 90.0 would indicate that prices received by producers of final demand goods are 10 percent lower than they were in November 2009. Movements of price indexes from one month to another are usually expressed as percent changes, rather than as changes in index points. Index point changes are affected by the level of the index in relation to its base period, whereas percent changes are not. The following example shows the computation of index point and percent changes.
Index point change
Final Demand Goods Price Index 107.5 Less previous index 104.0 Equals index point change 3.5
Index percent change
Index point change 3.5 Divided by the previous index 104.0 Equals 0.034 Result multiplied by 100 0.034 x 100 Equals percent change 3.4
Seasonally Adjusted and Unadjusted Data
Because price data are used for different purposes by
different groups, BLS publishes seasonally adjusted and unadjusted changes each month. Seasonally adjusted data are preferred for analyzing general price trends in the economy because these data eliminate the effect of changes that normally occur at about the same time, and in about the same magnitude, every year—such as price movements resulting from normal weather patterns, regular production and marketing cycles, model changeovers, seasonal discounts, and holidays. For these reasons, seasonally adjusted data more clearly reveal underlying trends. Unadjusted data are of primary interest to users who need information that can be related to actual dollar values of transactions. Individuals requiring this information include marketing specialists, purchasing agents, budget and cost analysts, contract specialists, and commodity traders. It is the unadjusted data that are generally cited when escalating long-term contracts
such as purchasing agreements or real estate leases. For more information, see Escalation Guide for Contracting Parties, on the Web at www.bls.gov/ppi/ppiescalation.htm.
In 1998, the PPI implemented the X-12-ARIMA Seasonal Adjustment Method; prior to that year, PPI employed the X-11 method. Each year, the seasonal status of most commodity indexes is reevaluated to reflect more recent price behavior. Industry net output indexes are not seasonally adjusted. For time series that exhibit seasonal pricing patterns, new seasonal factors are estimated and applied to the unadjusted data from the prior 5 years. Updated seasonally adjusted indexes replace the most recent 5 years of seasonal data. Seasonal factors may be applied to series using either a direct or an aggregative method. Generally, commodity indexes are seasonally adjusted using direct seasonal adjustment, which produces a more complete elimination of seasonal movements than does the aggregative method. However, the direct seasonal adjustment process may not yield figures that possess additive consistency. Thus, a seasonally adjusted index for a broad category that is directly adjusted may not be logically consistent with all seasonally adjusted indexes for its components. Seasonal movements for FD-ID indexes are derived indirectly through an aggregative method that combines movements of a wide variety of subproduct class (six-digit) series.
Seasonally adjusted indexes can become problematic when previously stable and predictable price patterns abruptly change. If the new pattern persists, the seasonal adjustment method will eventually reflect it; if the pattern keeps shifting, however, seasonally adjusted data will become chronically troublesome. This problem occurs relatively infrequently for farm and food-related products, but has more often affected manufactured products such as automobiles and steel.
Since January 1988, the PPI has used Intervention Analysis Seasonal Adjustment methods to enhance the calculation of seasonal factors. With this technique, outlier values that may distort the seasonal pattern are removed from the data prior to applying the standard seasonal factor estimation procedure. For example, a possible economic cause for large price movements for petroleum-based products might have been the Persian Gulf War. In this case, intervention techniques allowed for better estimates of seasonally adjusted data. On the whole, very few series have required intervention. Out of almost 300 seasonally adjusted series, only 31 were subject to intervention in 2013.
For more information relating to seasonal adjustment methods, see (1) “Appendix A: Seasonal Adjustment Methodology at BLS,” in the BLS Handbook of Methods (July 2010), (2) “Summary of Changes to the PPI’s Seasonal Adjustment Methodology” in the January 1995 issue of Producer Price Indexes, and (3) “PPI and CPI Seasonal Adjustment: an Update” in the July 2010 Monthly Labor Review.
Producer Price Index Data on the Internet
In 1995, the BLS began posting PPI series, news releases,
and technical information to both a World Wide Web (WWW) site and a file transfer protocol (FTP) site. During the years following the introduction of PPI Internet services, use of these sites eclipsed more traditional methods of data
16
dissemination, such as subscriptions to the PPI Detailed Report. There were more than 5 million instances of PPI data and tables being downloaded from the Internet during the 12 months ended December 31, 2012.
Retrieving PPI data from the PPI Web site
PPI data can be obtained from the WWW address (www.bls.gov/ppi). On this page, under the tab labeled “Featured PPI databases” links provide the following methods of data retrieval:
• Top Picks is a form-based application for both Industry
Data and Commodity Data that allows the user to quickly obtain PPI time series data by selecting the high-level aggregate and other commonly requested time series, including the All Commodities Index and the FD-ID indexes (for example, Final Demand). Within each list, any one—or all—of the time series shown can be selected. A user can modify the date range and output options after executing the query, using the reformat button above the data output table.
• One-Screen Data Search and Multi-Screen Data Search
are form-based query applications for both Industry Data and Commodity Data designed for users unfamiliar with the PPI coding structure. These applications guide a user through the PPI classification by listing index titles and do not require knowledge of commodity or industry codes. Data retrieved are based on a query formulated by selecting data characteristics from lists provided. Two options are available to create customized tables, depending on a user’s browser capability. The one-screen option is a JavaScript application that uses a single screen to guide a user through the available time series data. The second option is a multiple-screen, non-Java-based application. Both methods allow a user to browse the PPI coding structure and select multiple series. Users can modify the date range and output options after executing the query using the reformat button above the data output table.
• Series Report is a form-based application that allows
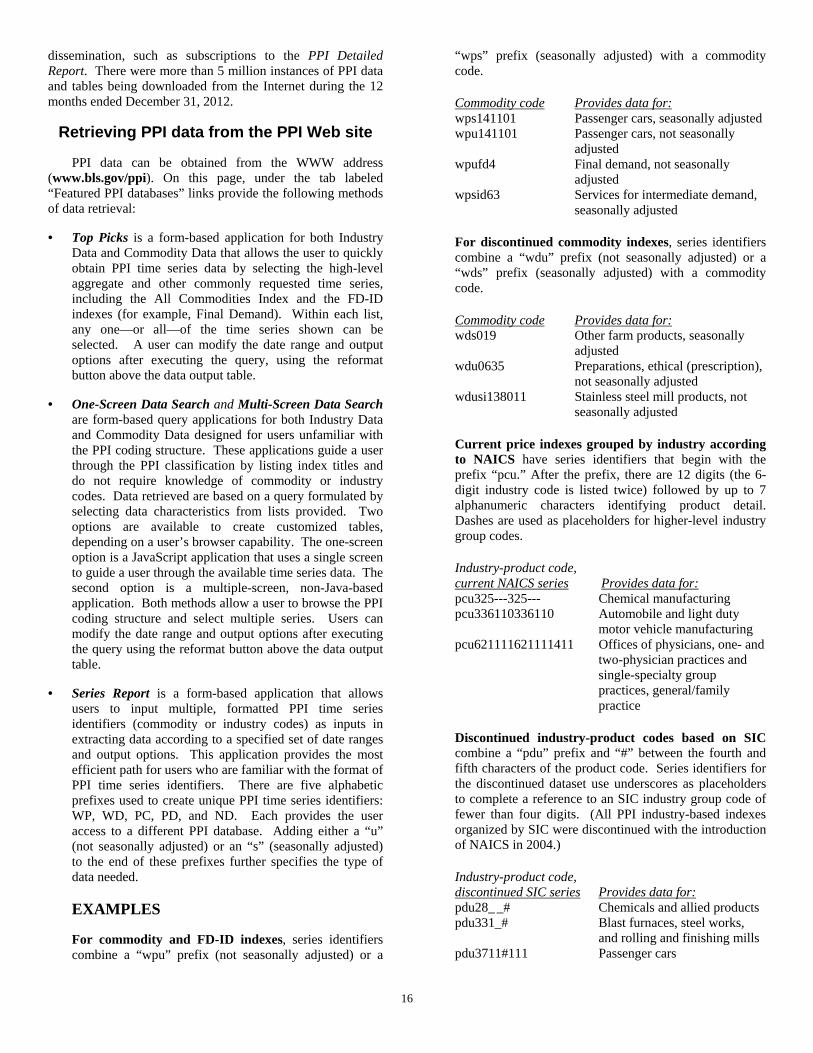
users to input multiple, formatted PPI time series identifiers (commodity or industry codes) as inputs in extracting data according to a specified set of date ranges and output options. This application provides the most efficient path for users who are familiar with the format of PPI time series identifiers. There are five alphabetic prefixes used to create unique PPI time series identifiers: WP, WD, PC, PD, and ND. Each provides the user access to a different PPI database. Adding either a “u” (not seasonally adjusted) or an “s” (seasonally adjusted) to the end of these prefixes further specifies the type of data needed.
EXAMPLES
For commodity and FD-ID indexes, series identifiers combine a “wpu” prefix (not seasonally adjusted) or a
“wps” prefix (seasonally adjusted) with a commodity code. Commodity code Provides data for: wps141101 Passenger cars, seasonally adjusted wpu141101 Passenger cars, not seasonally
adjusted wpufd4 Final demand, not seasonally
adjusted wpsid63 Services for intermediate demand,
seasonally adjusted
For discontinued commodity indexes, series identifiers combine a “wdu” prefix (not seasonally adjusted) or a “wds” prefix (seasonally adjusted) with a commodity code.
Commodity code Provides data for: wds019 Other farm products, seasonally
adjusted wdu0635 Preparations, ethical (prescription),
not seasonally adjusted wdusi138011 Stainless steel mill products, not
seasonally adjusted
Current price indexes grouped by industry according to NAICS have series identifiers that begin with the prefix “pcu.” After the prefix, there are 12 digits (the 6-digit industry code is listed twice) followed by up to 7 alphanumeric characters identifying product detail. Dashes are used as placeholders for higher-level industry group codes.
Industry-product code, current NAICS series Provides data for: pcu325---325--- Chemical manufacturing pcu336110336110 Automobile and light duty
motor vehicle manufacturing pcu621111621111411 Offices of physicians, one- and
two-physician practices and single-specialty group practices, general/family practice
Discontinued industry-product codes based on SIC combine a “pdu” prefix and “#” between the fourth and fifth characters of the product code. Series identifiers for the discontinued dataset use underscores as placeholders to complete a reference to an SIC industry group code of fewer than four digits. (All PPI industry-based indexes organized by SIC were discontinued with the introduction of NAICS in 2004.) Industry-product code, discontinued SIC series Provides data for: pdu28_ _# Chemicals and allied products pdu331_# Blast furnaces, steel works,
and rolling and finishing mills pdu3711#111 Passenger cars
17
Price indexes for discontinued series grouped by industry according to NAICS have identifiers that begin with the prefix “ndu.” After the prefix, there are 12 numeric digits (the 6-digit industry code is listed twice), and up to 7 additional alphanumeric characters that identify product detail. Dashes are used as placeholders for higher-level group codes. Industry-product code, discontinued NAICS series Provides data for ndu212231212231 Lead and zinc ore mining ndu2122312122312 Lead, zinc concentrates ndu212231212231214 Lead concentrates
• Text Files are best suited for users requiring access to
either a large volume of time series data or other PPI-related documentation, such as seasonal factor tables and relative importance tables. The text files can be accessed at http://download.bls.gov/ or directly from links on the “PPI Databases” page or the PPI homepage. Data and documentation available for download include the following:
Directory: Industry Data /pub/time.series/pc Industry Data - Discontinued (NAICS basis) /pub/time.series/nd
(SIC basis) /pub/time.series/pd Commodity Data (incl. FD-ID) /pub/time.series/wp Commodity Data – Discontinued /pub/time.series/wd Special requests /pub/special.requests/ppi
Additional information
The PPI homepage (www.bls.gov/ppi) contains additional information regarding PPI data and methodology. The top section of the homepage provides PPI news releases, both current and archived, as well as general PPI information. The “PPI Tables” section found beneath the statistics section provides relative importance and seasonal factor tables. The remaining sections offer special notices and publications pertaining to PPI methodology and applications.
For questions or comments regarding PPI data classification, methodology, or data availability on the Internet, call or e-mail the Section of Index Analysis and Public Information at (202) 691-7705 or [email protected].
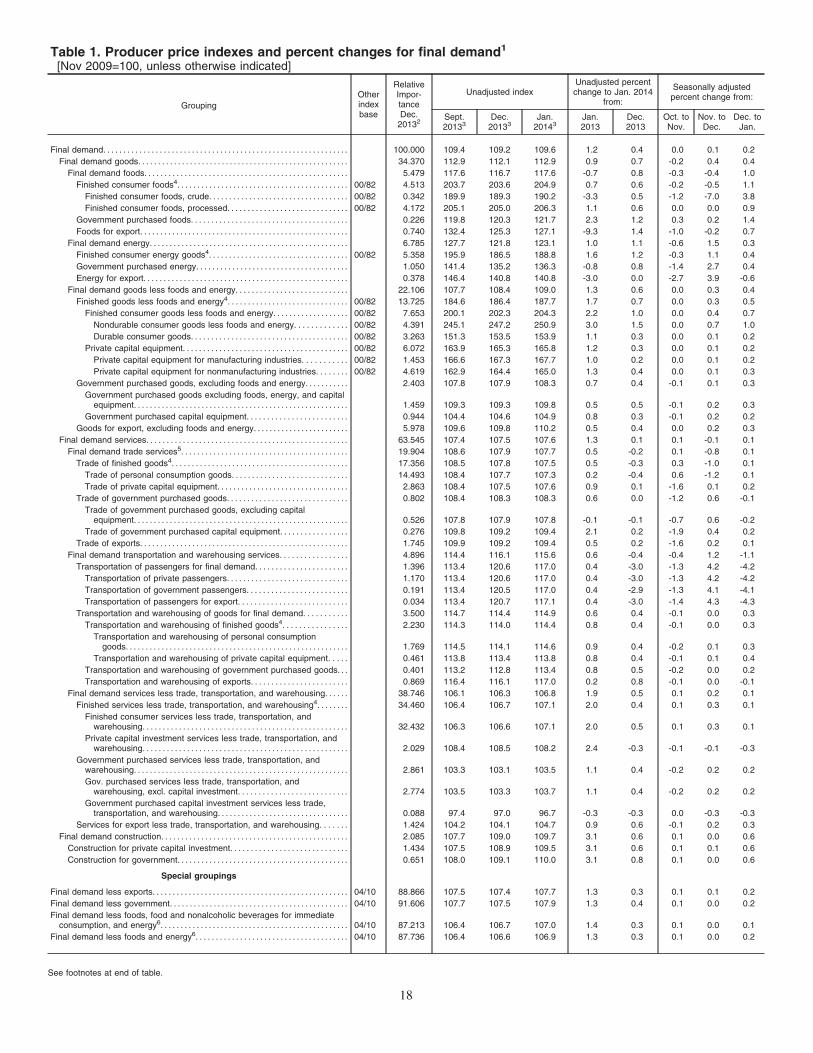
Table 1. Producer price indexes and percent changes for final demand1
[Nov 2009=100, unless otherwise indicated]
Grouping
Otherindexbase
RelativeImpor-tanceDec.
20132
Unadjusted indexUnadjusted percentchange to Jan. 2014
from:
Seasonally adjustedpercent change from:
Sept.20133
Dec.20133
Jan.20143
Jan.2013
Dec.2013
Oct. toNov.
Nov. toDec.
Dec. toJan.
Final demand. . . . . . . . . . . . . . . . . . . . . . . . . . . . . . . . . . . . . . . . . . . . . . . . . . . . . . . . . . . . . 100.000 109.4 109.2 109.6 1.2 0.4 0.0 0.1 0.2
Final demand goods. . . . . . . . . . . . . . . . . . . . . . . . . . . . . . . . . . . . . . . . . . . . . . . . . . . . . 34.370 112.9 112.1 112.9 0.9 0.7 -0.2 0.4 0.4
Final demand foods. . . . . . . . . . . . . . . . . . . . . . . . . . . . . . . . . . . . . . . . . . . . . . . . . . . 5.479 117.6 116.7 117.6 -0.7 0.8 -0.3 -0.4 1.0
Finished consumer foods4. . . . . . . . . . . . . . . . . . . . . . . . . . . . . . . . . . . . . . . . . . . 00/82 4.513 203.7 203.6 204.9 0.7 0.6 -0.2 -0.5 1.1
Finished consumer foods, crude. . . . . . . . . . . . . . . . . . . . . . . . . . . . . . . . . . . 00/82 0.342 189.9 189.3 190.2 -3.3 0.5 -1.2 -7.0 3.8
Finished consumer foods, processed. . . . . . . . . . . . . . . . . . . . . . . . . . . . . . 00/82 4.172 205.1 205.0 206.3 1.1 0.6 0.0 0.0 0.9
Government purchased foods. . . . . . . . . . . . . . . . . . . . . . . . . . . . . . . . . . . . . . . 0.226 119.8 120.3 121.7 2.3 1.2 0.3 0.2 1.4
Foods for export. . . . . . . . . . . . . . . . . . . . . . . . . . . . . . . . . . . . . . . . . . . . . . . . . . . . 0.740 132.4 125.3 127.1 -9.3 1.4 -1.0 -0.2 0.7
Final demand energy. . . . . . . . . . . . . . . . . . . . . . . . . . . . . . . . . . . . . . . . . . . . . . . . . . 6.785 127.7 121.8 123.1 1.0 1.1 -0.6 1.5 0.3
Finished consumer energy goods4. . . . . . . . . . . . . . . . . . . . . . . . . . . . . . . . . . . 00/82 5.358 195.9 186.5 188.8 1.6 1.2 -0.3 1.1 0.4
Government purchased energy. . . . . . . . . . . . . . . . . . . . . . . . . . . . . . . . . . . . . . 1.050 141.4 135.2 136.3 -0.8 0.8 -1.4 2.7 0.4
Energy for export. . . . . . . . . . . . . . . . . . . . . . . . . . . . . . . . . . . . . . . . . . . . . . . . . . . 0.378 146.4 140.8 140.8 -3.0 0.0 -2.7 3.9 -0.6
Final demand goods less foods and energy. . . . . . . . . . . . . . . . . . . . . . . . . . . . 22.106 107.7 108.4 109.0 1.3 0.6 0.0 0.3 0.4
Finished goods less foods and energy4. . . . . . . . . . . . . . . . . . . . . . . . . . . . . . 00/82 13.725 184.6 186.4 187.7 1.7 0.7 0.0 0.3 0.5
Finished consumer goods less foods and energy. . . . . . . . . . . . . . . . . . . 00/82 7.653 200.1 202.3 204.3 2.2 1.0 0.0 0.4 0.7
Nondurable consumer goods less foods and energy. . . . . . . . . . . . . 00/82 4.391 245.1 247.2 250.9 3.0 1.5 0.0 0.7 1.0
Durable consumer goods. . . . . . . . . . . . . . . . . . . . . . . . . . . . . . . . . . . . . . . 00/82 3.263 151.3 153.5 153.9 1.1 0.3 0.0 0.1 0.2
Private capital equipment. . . . . . . . . . . . . . . . . . . . . . . . . . . . . . . . . . . . . . . . . 00/82 6.072 163.9 165.3 165.8 1.2 0.3 0.0 0.1 0.2
Private capital equipment for manufacturing industries. . . . . . . . . . . 00/82 1.453 166.6 167.3 167.7 1.0 0.2 0.0 0.1 0.2
Private capital equipment for nonmanufacturing industries. . . . . . . . 00/82 4.619 162.9 164.4 165.0 1.3 0.4 0.0 0.1 0.3
Government purchased goods, excluding foods and energy. . . . . . . . . . . 2.403 107.8 107.9 108.3 0.7 0.4 -0.1 0.1 0.3
Government purchased goods excluding foods, energy, and capitalequipment. . . . . . . . . . . . . . . . . . . . . . . . . . . . . . . . . . . . . . . . . . . . . . . . . . . . . . 1.459 109.3 109.3 109.8 0.5 0.5 -0.1 0.2 0.3
Government purchased capital equipment. . . . . . . . . . . . . . . . . . . . . . . . . 0.944 104.4 104.6 104.9 0.8 0.3 -0.1 0.2 0.2
Goods for export, excluding foods and energy. . . . . . . . . . . . . . . . . . . . . . . . 5.978 109.6 109.8 110.2 0.5 0.4 0.0 0.2 0.3
Final demand services. . . . . . . . . . . . . . . . . . . . . . . . . . . . . . . . . . . . . . . . . . . . . . . . . . 63.545 107.4 107.5 107.6 1.3 0.1 0.1 -0.1 0.1
Final demand trade services5. . . . . . . . . . . . . . . . . . . . . . . . . . . . . . . . . . . . . . . . . . 19.904 108.6 107.9 107.7 0.5 -0.2 0.1 -0.8 0.1
Trade of finished goods4. . . . . . . . . . . . . . . . . . . . . . . . . . . . . . . . . . . . . . . . . . . . 17.356 108.5 107.8 107.5 0.5 -0.3 0.3 -1.0 0.1
Trade of personal consumption goods. . . . . . . . . . . . . . . . . . . . . . . . . . . . . 14.493 108.4 107.7 107.3 0.2 -0.4 0.6 -1.2 0.1
Trade of private capital equipment. . . . . . . . . . . . . . . . . . . . . . . . . . . . . . . . . 2.863 108.4 107.5 107.6 0.9 0.1 -1.6 0.1 0.2
Trade of government purchased goods. . . . . . . . . . . . . . . . . . . . . . . . . . . . . . 0.802 108.4 108.3 108.3 0.6 0.0 -1.2 0.6 -0.1
Trade of government purchased goods, excluding capitalequipment. . . . . . . . . . . . . . . . . . . . . . . . . . . . . . . . . . . . . . . . . . . . . . . . . . . . . . 0.526 107.8 107.9 107.8 -0.1 -0.1 -0.7 0.6 -0.2
Trade of government purchased capital equipment. . . . . . . . . . . . . . . . . 0.276 109.8 109.2 109.4 2.1 0.2 -1.9 0.4 0.2
Trade of exports. . . . . . . . . . . . . . . . . . . . . . . . . . . . . . . . . . . . . . . . . . . . . . . . . . . . 1.745 109.9 109.2 109.4 0.5 0.2 -1.6 0.2 0.1
Final demand transportation and warehousing services. . . . . . . . . . . . . . . . . 4.896 114.4 116.1 115.6 0.6 -0.4 -0.4 1.2 -1.1
Transportation of passengers for final demand. . . . . . . . . . . . . . . . . . . . . . . 1.396 113.4 120.6 117.0 0.4 -3.0 -1.3 4.2 -4.2
Transportation of private passengers. . . . . . . . . . . . . . . . . . . . . . . . . . . . . . 1.170 113.4 120.6 117.0 0.4 -3.0 -1.3 4.2 -4.2
Transportation of government passengers. . . . . . . . . . . . . . . . . . . . . . . . . 0.191 113.4 120.5 117.0 0.4 -2.9 -1.3 4.1 -4.1
Transportation of passengers for export. . . . . . . . . . . . . . . . . . . . . . . . . . . 0.034 113.4 120.7 117.1 0.4 -3.0 -1.4 4.3 -4.3
Transportation and warehousing of goods for final demand. . . . . . . . . . . 3.500 114.7 114.4 114.9 0.6 0.4 -0.1 0.0 0.3
Transportation and warehousing of finished goods4. . . . . . . . . . . . . . . . 2.230 114.3 114.0 114.4 0.8 0.4 -0.1 0.0 0.3
Transportation and warehousing of personal consumptiongoods. . . . . . . . . . . . . . . . . . . . . . . . . . . . . . . . . . . . . . . . . . . . . . . . . . . . . . . . 1.769 114.5 114.1 114.6 0.9 0.4 -0.2 0.1 0.3
Transportation and warehousing of private capital equipment. . . . . 0.461 113.8 113.4 113.8 0.8 0.4 -0.1 0.1 0.4
Transportation and warehousing of government purchased goods. . . 0.401 113.2 112.8 113.4 0.8 0.5 -0.2 0.0 0.2
Transportation and warehousing of exports. . . . . . . . . . . . . . . . . . . . . . . . 0.869 116.4 116.1 117.0 0.2 0.8 -0.1 0.0 -0.1
Final demand services less trade, transportation, and warehousing. . . . . . 38.746 106.1 106.3 106.8 1.9 0.5 0.1 0.2 0.1
Finished services less trade, transportation, and warehousing4. . . . . . . . 34.460 106.4 106.7 107.1 2.0 0.4 0.1 0.3 0.1
Finished consumer services less trade, transportation, andwarehousing. . . . . . . . . . . . . . . . . . . . . . . . . . . . . . . . . . . . . . . . . . . . . . . . . . . 32.432 106.3 106.6 107.1 2.0 0.5 0.1 0.3 0.1
Private capital investment services less trade, transportation, andwarehousing. . . . . . . . . . . . . . . . . . . . . . . . . . . . . . . . . . . . . . . . . . . . . . . . . . . 2.029 108.4 108.5 108.2 2.4 -0.3 -0.1 -0.1 -0.3
Government purchased services less trade, transportation, andwarehousing. . . . . . . . . . . . . . . . . . . . . . . . . . . . . . . . . . . . . . . . . . . . . . . . . . . . . . 2.861 103.3 103.1 103.5 1.1 0.4 -0.2 0.2 0.2
Gov. purchased services less trade, transportation, andwarehousing, excl. capital investment. . . . . . . . . . . . . . . . . . . . . . . . . . . 2.774 103.5 103.3 103.7 1.1 0.4 -0.2 0.2 0.2
Government purchased capital investment services less trade,transportation, and warehousing. . . . . . . . . . . . . . . . . . . . . . . . . . . . . . . . . 0.088 97.4 97.0 96.7 -0.3 -0.3 0.0 -0.3 -0.3
Services for export less trade, transportation, and warehousing. . . . . . . 1.424 104.2 104.1 104.7 0.9 0.6 -0.1 0.2 0.3
Final demand construction. . . . . . . . . . . . . . . . . . . . . . . . . . . . . . . . . . . . . . . . . . . . . . . 2.085 107.7 109.0 109.7 3.1 0.6 0.1 0.0 0.6
Construction for private capital investment. . . . . . . . . . . . . . . . . . . . . . . . . . . . . 1.434 107.5 108.9 109.5 3.1 0.6 0.1 0.1 0.6
Construction for government. . . . . . . . . . . . . . . . . . . . . . . . . . . . . . . . . . . . . . . . . . . 0.651 108.0 109.1 110.0 3.1 0.8 0.1 0.0 0.6
Special groupings
Final demand less exports. . . . . . . . . . . . . . . . . . . . . . . . . . . . . . . . . . . . . . . . . . . . . . . . . 04/10 88.866 107.5 107.4 107.7 1.3 0.3 0.1 0.1 0.2
Final demand less government. . . . . . . . . . . . . . . . . . . . . . . . . . . . . . . . . . . . . . . . . . . . . 04/10 91.606 107.7 107.5 107.9 1.3 0.4 0.1 0.0 0.2
Final demand less foods, food and nonalcoholic beverages for immediateconsumption, and energy6. . . . . . . . . . . . . . . . . . . . . . . . . . . . . . . . . . . . . . . . . . . . . . . 04/10 87.213 106.4 106.7 107.0 1.4 0.3 0.1 0.0 0.1
Final demand less foods and energy6. . . . . . . . . . . . . . . . . . . . . . . . . . . . . . . . . . . . . . 04/10 87.736 106.4 106.6 106.9 1.3 0.3 0.1 0.0 0.2
See footnotes at end of table.
18
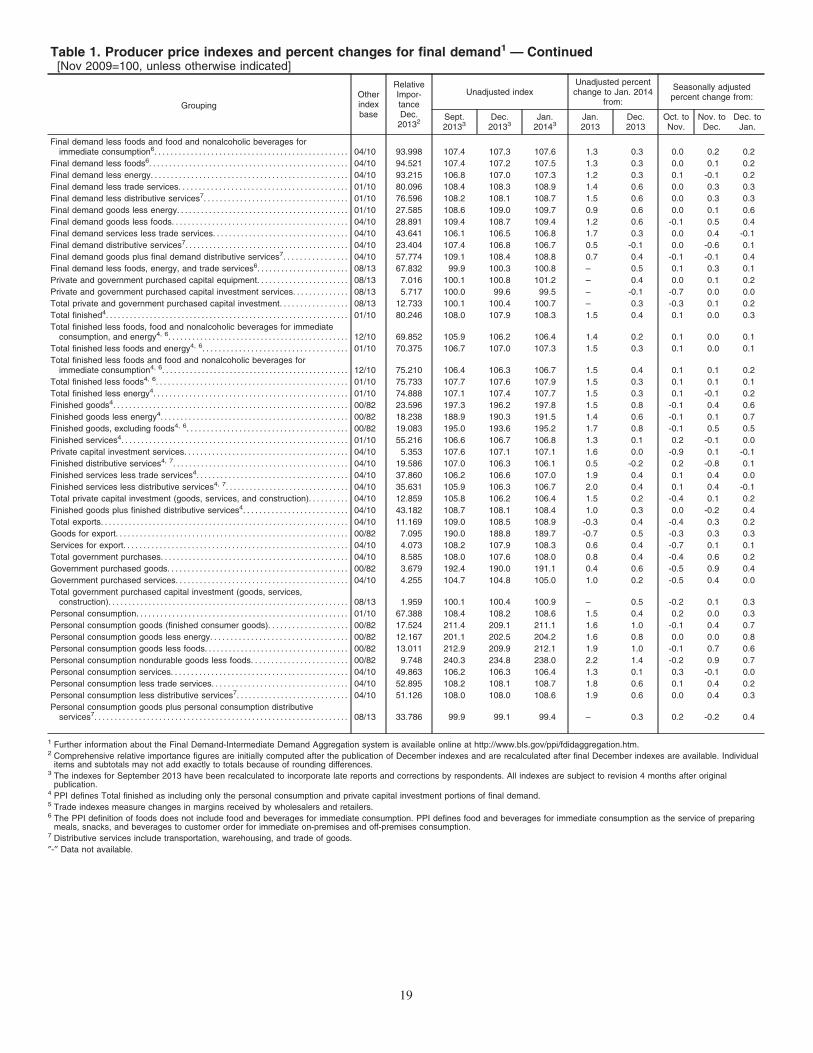
Table 1. Producer price indexes and percent changes for final demand1 — Continued[Nov 2009=100, unless otherwise indicated]
Grouping
Otherindexbase
RelativeImpor-tanceDec.
20132
Unadjusted indexUnadjusted percentchange to Jan. 2014
from:
Seasonally adjustedpercent change from:
Sept.20133
Dec.20133
Jan.20143
Jan.2013
Dec.2013
Oct. toNov.
Nov. toDec.
Dec. toJan.
Final demand less foods and food and nonalcoholic beverages forimmediate consumption6. . . . . . . . . . . . . . . . . . . . . . . . . . . . . . . . . . . . . . . . . . . . . . . . 04/10 93.998 107.4 107.3 107.6 1.3 0.3 0.0 0.2 0.2
Final demand less foods6. . . . . . . . . . . . . . . . . . . . . . . . . . . . . . . . . . . . . . . . . . . . . . . . . . 04/10 94.521 107.4 107.2 107.5 1.3 0.3 0.0 0.1 0.2
Final demand less energy. . . . . . . . . . . . . . . . . . . . . . . . . . . . . . . . . . . . . . . . . . . . . . . . . 04/10 93.215 106.8 107.0 107.3 1.2 0.3 0.1 -0.1 0.2
Final demand less trade services. . . . . . . . . . . . . . . . . . . . . . . . . . . . . . . . . . . . . . . . . . 01/10 80.096 108.4 108.3 108.9 1.4 0.6 0.0 0.3 0.3
Final demand less distributive services7. . . . . . . . . . . . . . . . . . . . . . . . . . . . . . . . . . . . 01/10 76.596 108.2 108.1 108.7 1.5 0.6 0.0 0.3 0.3
Final demand goods less energy. . . . . . . . . . . . . . . . . . . . . . . . . . . . . . . . . . . . . . . . . . . 01/10 27.585 108.6 109.0 109.7 0.9 0.6 0.0 0.1 0.6
Final demand goods less foods. . . . . . . . . . . . . . . . . . . . . . . . . . . . . . . . . . . . . . . . . . . . 04/10 28.891 109.4 108.7 109.4 1.2 0.6 -0.1 0.5 0.4
Final demand services less trade services. . . . . . . . . . . . . . . . . . . . . . . . . . . . . . . . . . 04/10 43.641 106.1 106.5 106.8 1.7 0.3 0.0 0.4 -0.1
Final demand distributive services7. . . . . . . . . . . . . . . . . . . . . . . . . . . . . . . . . . . . . . . . . 04/10 23.404 107.4 106.8 106.7 0.5 -0.1 0.0 -0.6 0.1
Final demand goods plus final demand distributive services7. . . . . . . . . . . . . . . . 04/10 57.774 109.1 108.4 108.8 0.7 0.4 -0.1 -0.1 0.4
Final demand less foods, energy, and trade services6. . . . . . . . . . . . . . . . . . . . . . . 08/13 67.832 99.9 100.3 100.8 – 0.5 0.1 0.3 0.1
Private and government purchased capital equipment. . . . . . . . . . . . . . . . . . . . . . . 08/13 7.016 100.1 100.8 101.2 – 0.4 0.0 0.1 0.2
Private and government purchased capital investment services. . . . . . . . . . . . . . 08/13 5.717 100.0 99.6 99.5 – -0.1 -0.7 0.0 0.0
Total private and government purchased capital investment. . . . . . . . . . . . . . . . . 08/13 12.733 100.1 100.4 100.7 – 0.3 -0.3 0.1 0.2
Total finished4. . . . . . . . . . . . . . . . . . . . . . . . . . . . . . . . . . . . . . . . . . . . . . . . . . . . . . . . . . . . . 01/10 80.246 108.0 107.9 108.3 1.5 0.4 0.1 0.0 0.3
Total finished less foods, food and nonalcoholic beverages for immediateconsumption, and energy4, 6. . . . . . . . . . . . . . . . . . . . . . . . . . . . . . . . . . . . . . . . . . . . . 12/10 69.852 105.9 106.2 106.4 1.4 0.2 0.1 0.0 0.1
Total finished less foods and energy4, 6. . . . . . . . . . . . . . . . . . . . . . . . . . . . . . . . . . . . 01/10 70.375 106.7 107.0 107.3 1.5 0.3 0.1 0.0 0.1
Total finished less foods and food and nonalcoholic beverages forimmediate consumption4, 6. . . . . . . . . . . . . . . . . . . . . . . . . . . . . . . . . . . . . . . . . . . . . . . 12/10 75.210 106.4 106.3 106.7 1.5 0.4 0.1 0.1 0.2
Total finished less foods4, 6. . . . . . . . . . . . . . . . . . . . . . . . . . . . . . . . . . . . . . . . . . . . . . . . 01/10 75.733 107.7 107.6 107.9 1.5 0.3 0.1 0.1 0.1
Total finished less energy4. . . . . . . . . . . . . . . . . . . . . . . . . . . . . . . . . . . . . . . . . . . . . . . . . 01/10 74.888 107.1 107.4 107.7 1.5 0.3 0.1 -0.1 0.2
Finished goods4. . . . . . . . . . . . . . . . . . . . . . . . . . . . . . . . . . . . . . . . . . . . . . . . . . . . . . . . . . . 00/82 23.596 197.3 196.2 197.8 1.5 0.8 -0.1 0.4 0.6
Finished goods less energy4. . . . . . . . . . . . . . . . . . . . . . . . . . . . . . . . . . . . . . . . . . . . . . . 00/82 18.238 188.9 190.3 191.5 1.4 0.6 -0.1 0.1 0.7
Finished goods, excluding foods4, 6. . . . . . . . . . . . . . . . . . . . . . . . . . . . . . . . . . . . . . . . 00/82 19.083 195.0 193.6 195.2 1.7 0.8 -0.1 0.5 0.5
Finished services4. . . . . . . . . . . . . . . . . . . . . . . . . . . . . . . . . . . . . . . . . . . . . . . . . . . . . . . . . 01/10 55.216 106.6 106.7 106.8 1.3 0.1 0.2 -0.1 0.0
Private capital investment services. . . . . . . . . . . . . . . . . . . . . . . . . . . . . . . . . . . . . . . . . 04/10 5.353 107.6 107.1 107.1 1.6 0.0 -0.9 0.1 -0.1
Finished distributive services4, 7. . . . . . . . . . . . . . . . . . . . . . . . . . . . . . . . . . . . . . . . . . . . 04/10 19.586 107.0 106.3 106.1 0.5 -0.2 0.2 -0.8 0.1
Finished services less trade services4. . . . . . . . . . . . . . . . . . . . . . . . . . . . . . . . . . . . . . 04/10 37.860 106.2 106.6 107.0 1.9 0.4 0.1 0.4 0.0
Finished services less distributive services4, 7. . . . . . . . . . . . . . . . . . . . . . . . . . . . . . . 04/10 35.631 105.9 106.3 106.7 2.0 0.4 0.1 0.4 -0.1
Total private capital investment (goods, services, and construction). . . . . . . . . . 04/10 12.859 105.8 106.2 106.4 1.5 0.2 -0.4 0.1 0.2
Finished goods plus finished distributive services4. . . . . . . . . . . . . . . . . . . . . . . . . . 04/10 43.182 108.7 108.1 108.4 1.0 0.3 0.0 -0.2 0.4
Total exports. . . . . . . . . . . . . . . . . . . . . . . . . . . . . . . . . . . . . . . . . . . . . . . . . . . . . . . . . . . . . . 04/10 11.169 109.0 108.5 108.9 -0.3 0.4 -0.4 0.3 0.2
Goods for export. . . . . . . . . . . . . . . . . . . . . . . . . . . . . . . . . . . . . . . . . . . . . . . . . . . . . . . . . . 00/82 7.095 190.0 188.8 189.7 -0.7 0.5 -0.3 0.3 0.3
Services for export. . . . . . . . . . . . . . . . . . . . . . . . . . . . . . . . . . . . . . . . . . . . . . . . . . . . . . . . 04/10 4.073 108.2 107.9 108.3 0.6 0.4 -0.7 0.1 0.1
Total government purchases. . . . . . . . . . . . . . . . . . . . . . . . . . . . . . . . . . . . . . . . . . . . . . . 04/10 8.585 108.0 107.6 108.0 0.8 0.4 -0.4 0.6 0.2
Government purchased goods. . . . . . . . . . . . . . . . . . . . . . . . . . . . . . . . . . . . . . . . . . . . . 00/82 3.679 192.4 190.0 191.1 0.4 0.6 -0.5 0.9 0.4
Government purchased services. . . . . . . . . . . . . . . . . . . . . . . . . . . . . . . . . . . . . . . . . . . 04/10 4.255 104.7 104.8 105.0 1.0 0.2 -0.5 0.4 0.0
Total government purchased capital investment (goods, services,construction). . . . . . . . . . . . . . . . . . . . . . . . . . . . . . . . . . . . . . . . . . . . . . . . . . . . . . . . . . . . 08/13 1.959 100.1 100.4 100.9 – 0.5 -0.2 0.1 0.3
Personal consumption. . . . . . . . . . . . . . . . . . . . . . . . . . . . . . . . . . . . . . . . . . . . . . . . . . . . . 01/10 67.388 108.4 108.2 108.6 1.5 0.4 0.2 0.0 0.3
Personal consumption goods (finished consumer goods). . . . . . . . . . . . . . . . . . . . 00/82 17.524 211.4 209.1 211.1 1.6 1.0 -0.1 0.4 0.7
Personal consumption goods less energy. . . . . . . . . . . . . . . . . . . . . . . . . . . . . . . . . . 00/82 12.167 201.1 202.5 204.2 1.6 0.8 0.0 0.0 0.8
Personal consumption goods less foods. . . . . . . . . . . . . . . . . . . . . . . . . . . . . . . . . . . . 00/82 13.011 212.9 209.9 212.1 1.9 1.0 -0.1 0.7 0.6
Personal consumption nondurable goods less foods. . . . . . . . . . . . . . . . . . . . . . . . 00/82 9.748 240.3 234.8 238.0 2.2 1.4 -0.2 0.9 0.7
Personal consumption services. . . . . . . . . . . . . . . . . . . . . . . . . . . . . . . . . . . . . . . . . . . . 04/10 49.863 106.2 106.3 106.4 1.3 0.1 0.3 -0.1 0.0
Personal consumption less trade services. . . . . . . . . . . . . . . . . . . . . . . . . . . . . . . . . . 04/10 52.895 108.2 108.1 108.7 1.8 0.6 0.1 0.4 0.2
Personal consumption less distributive services7. . . . . . . . . . . . . . . . . . . . . . . . . . . . 04/10 51.126 108.0 108.0 108.6 1.9 0.6 0.0 0.4 0.3
Personal consumption goods plus personal consumption distributiveservices7. . . . . . . . . . . . . . . . . . . . . . . . . . . . . . . . . . . . . . . . . . . . . . . . . . . . . . . . . . . . . . . 08/13 33.786 99.9 99.1 99.4 – 0.3 0.2 -0.2 0.4
1 Further information about the Final Demand-Intermediate Demand Aggregation system is available online at http://www.bls.gov/ppi/fdidaggregation.htm.2 Comprehensive relative importance figures are initially computed after the publication of December indexes and are recalculated after final December indexes are available. Individual
items and subtotals may not add exactly to totals because of rounding differences.3 The indexes for September 2013 have been recalculated to incorporate late reports and corrections by respondents. All indexes are subject to revision 4 months after original
publication.4 PPI defines Total finished as including only the personal consumption and private capital investment portions of final demand.5 Trade indexes measure changes in margins received by wholesalers and retailers.6 The PPI definition of foods does not include food and beverages for immediate consumption. PPI defines food and beverages for immediate consumption as the service of preparing
meals, snacks, and beverages to customer order for immediate on-premises and off-premises consumption.7 Distributive services include transportation, warehousing, and trade of goods.
″-″ Data not available.
19
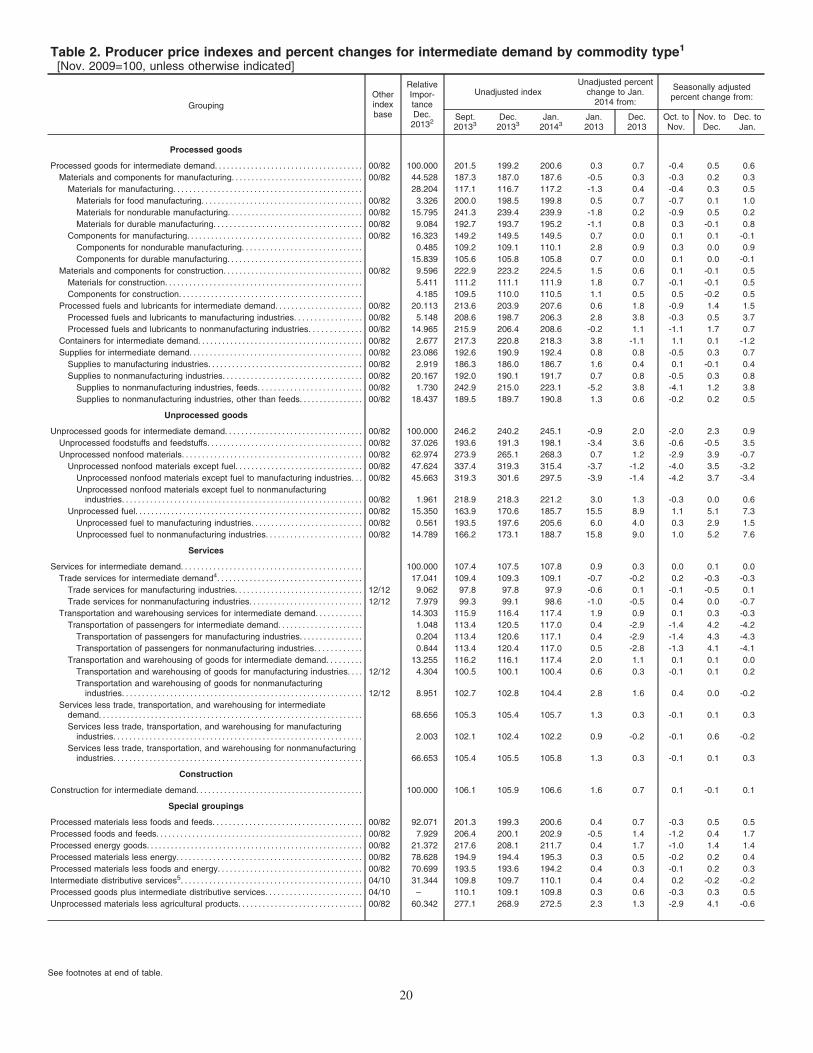
Table 2. Producer price indexes and percent changes for intermediate demand by commodity type1
[Nov. 2009=100, unless otherwise indicated]
Grouping
Otherindexbase
RelativeImpor-tanceDec.
20132
Unadjusted indexUnadjusted percent
change to Jan.2014 from:
Seasonally adjustedpercent change from:
Sept.20133
Dec.20133
Jan.20143
Jan.2013
Dec.2013
Oct. toNov.
Nov. toDec.
Dec. toJan.
Processed goods
Processed goods for intermediate demand. . . . . . . . . . . . . . . . . . . . . . . . . . . . . . . . . . . . . 00/82 100.000 201.5 199.2 200.6 0.3 0.7 -0.4 0.5 0.6
Materials and components for manufacturing. . . . . . . . . . . . . . . . . . . . . . . . . . . . . . . . . 00/82 44.528 187.3 187.0 187.6 -0.5 0.3 -0.3 0.2 0.3
Materials for manufacturing. . . . . . . . . . . . . . . . . . . . . . . . . . . . . . . . . . . . . . . . . . . . . . . 28.204 117.1 116.7 117.2 -1.3 0.4 -0.4 0.3 0.5
Materials for food manufacturing. . . . . . . . . . . . . . . . . . . . . . . . . . . . . . . . . . . . . . . . 00/82 3.326 200.0 198.5 199.8 0.5 0.7 -0.7 0.1 1.0
Materials for nondurable manufacturing. . . . . . . . . . . . . . . . . . . . . . . . . . . . . . . . . . 00/82 15.795 241.3 239.4 239.9 -1.8 0.2 -0.9 0.5 0.2
Materials for durable manufacturing. . . . . . . . . . . . . . . . . . . . . . . . . . . . . . . . . . . . . 00/82 9.084 192.7 193.7 195.2 -1.1 0.8 0.3 -0.1 0.8
Components for manufacturing. . . . . . . . . . . . . . . . . . . . . . . . . . . . . . . . . . . . . . . . . . . . 00/82 16.323 149.2 149.5 149.5 0.7 0.0 0.1 0.1 -0.1
Components for nondurable manufacturing. . . . . . . . . . . . . . . . . . . . . . . . . . . . . . 0.485 109.2 109.1 110.1 2.8 0.9 0.3 0.0 0.9
Components for durable manufacturing. . . . . . . . . . . . . . . . . . . . . . . . . . . . . . . . . . 15.839 105.6 105.8 105.8 0.7 0.0 0.1 0.0 -0.1
Materials and components for construction. . . . . . . . . . . . . . . . . . . . . . . . . . . . . . . . . . . 00/82 9.596 222.9 223.2 224.5 1.5 0.6 0.1 -0.1 0.5
Materials for construction. . . . . . . . . . . . . . . . . . . . . . . . . . . . . . . . . . . . . . . . . . . . . . . . . 5.411 111.2 111.1 111.9 1.8 0.7 -0.1 -0.1 0.5
Components for construction. . . . . . . . . . . . . . . . . . . . . . . . . . . . . . . . . . . . . . . . . . . . . . 4.185 109.5 110.0 110.5 1.1 0.5 0.5 -0.2 0.5
Processed fuels and lubricants for intermediate demand. . . . . . . . . . . . . . . . . . . . . . 00/82 20.113 213.6 203.9 207.6 0.6 1.8 -0.9 1.4 1.5
Processed fuels and lubricants to manufacturing industries. . . . . . . . . . . . . . . . . 00/82 5.148 208.6 198.7 206.3 2.8 3.8 -0.3 0.5 3.7
Processed fuels and lubricants to nonmanufacturing industries. . . . . . . . . . . . . 00/82 14.965 215.9 206.4 208.6 -0.2 1.1 -1.1 1.7 0.7
Containers for intermediate demand. . . . . . . . . . . . . . . . . . . . . . . . . . . . . . . . . . . . . . . . . 00/82 2.677 217.3 220.8 218.3 3.8 -1.1 1.1 0.1 -1.2
Supplies for intermediate demand. . . . . . . . . . . . . . . . . . . . . . . . . . . . . . . . . . . . . . . . . . . 00/82 23.086 192.6 190.9 192.4 0.8 0.8 -0.5 0.3 0.7
Supplies to manufacturing industries. . . . . . . . . . . . . . . . . . . . . . . . . . . . . . . . . . . . . . . 00/82 2.919 186.3 186.0 186.7 1.6 0.4 0.1 -0.1 0.4
Supplies to nonmanufacturing industries. . . . . . . . . . . . . . . . . . . . . . . . . . . . . . . . . . . 00/82 20.167 192.0 190.1 191.7 0.7 0.8 -0.5 0.3 0.8
Supplies to nonmanufacturing industries, feeds. . . . . . . . . . . . . . . . . . . . . . . . . . 00/82 1.730 242.9 215.0 223.1 -5.2 3.8 -4.1 1.2 3.8
Supplies to nonmanufacturing industries, other than feeds. . . . . . . . . . . . . . . . 00/82 18.437 189.5 189.7 190.8 1.3 0.6 -0.2 0.2 0.5
Unprocessed goods
Unprocessed goods for intermediate demand. . . . . . . . . . . . . . . . . . . . . . . . . . . . . . . . . . 00/82 100.000 246.2 240.2 245.1 -0.9 2.0 -2.0 2.3 0.9
Unprocessed foodstuffs and feedstuffs. . . . . . . . . . . . . . . . . . . . . . . . . . . . . . . . . . . . . . . 00/82 37.026 193.6 191.3 198.1 -3.4 3.6 -0.6 -0.5 3.5
Unprocessed nonfood materials. . . . . . . . . . . . . . . . . . . . . . . . . . . . . . . . . . . . . . . . . . . . . 00/82 62.974 273.9 265.1 268.3 0.7 1.2 -2.9 3.9 -0.7
Unprocessed nonfood materials except fuel. . . . . . . . . . . . . . . . . . . . . . . . . . . . . . . . 00/82 47.624 337.4 319.3 315.4 -3.7 -1.2 -4.0 3.5 -3.2
Unprocessed nonfood materials except fuel to manufacturing industries. . . 00/82 45.663 319.3 301.6 297.5 -3.9 -1.4 -4.2 3.7 -3.4
Unprocessed nonfood materials except fuel to nonmanufacturingindustries. . . . . . . . . . . . . . . . . . . . . . . . . . . . . . . . . . . . . . . . . . . . . . . . . . . . . . . . . . . . 00/82 1.961 218.9 218.3 221.2 3.0 1.3 -0.3 0.0 0.6
Unprocessed fuel. . . . . . . . . . . . . . . . . . . . . . . . . . . . . . . . . . . . . . . . . . . . . . . . . . . . . . . . . 00/82 15.350 163.9 170.6 185.7 15.5 8.9 1.1 5.1 7.3
Unprocessed fuel to manufacturing industries. . . . . . . . . . . . . . . . . . . . . . . . . . . . 00/82 0.561 193.5 197.6 205.6 6.0 4.0 0.3 2.9 1.5
Unprocessed fuel to nonmanufacturing industries. . . . . . . . . . . . . . . . . . . . . . . . 00/82 14.789 166.2 173.1 188.7 15.8 9.0 1.0 5.2 7.6
Services
Services for intermediate demand. . . . . . . . . . . . . . . . . . . . . . . . . . . . . . . . . . . . . . . . . . . . . 100.000 107.4 107.5 107.8 0.9 0.3 0.0 0.1 0.0
Trade services for intermediate demand4. . . . . . . . . . . . . . . . . . . . . . . . . . . . . . . . . . . . 17.041 109.4 109.3 109.1 -0.7 -0.2 0.2 -0.3 -0.3
Trade services for manufacturing industries. . . . . . . . . . . . . . . . . . . . . . . . . . . . . . . . 12/12 9.062 97.8 97.8 97.9 -0.6 0.1 -0.1 -0.5 0.1
Trade services for nonmanufacturing industries. . . . . . . . . . . . . . . . . . . . . . . . . . . . 12/12 7.979 99.3 99.1 98.6 -1.0 -0.5 0.4 0.0 -0.7
Transportation and warehousing services for intermediate demand. . . . . . . . . . . . 14.303 115.9 116.4 117.4 1.9 0.9 0.1 0.3 -0.3
Transportation of passengers for intermediate demand. . . . . . . . . . . . . . . . . . . . . 1.048 113.4 120.5 117.0 0.4 -2.9 -1.4 4.2 -4.2
Transportation of passengers for manufacturing industries. . . . . . . . . . . . . . . . 0.204 113.4 120.6 117.1 0.4 -2.9 -1.4 4.3 -4.3
Transportation of passengers for nonmanufacturing industries. . . . . . . . . . . . 0.844 113.4 120.4 117.0 0.5 -2.8 -1.3 4.1 -4.1
Transportation and warehousing of goods for intermediate demand. . . . . . . . . 13.255 116.2 116.1 117.4 2.0 1.1 0.1 0.1 0.0
Transportation and warehousing of goods for manufacturing industries. . . . 12/12 4.304 100.5 100.1 100.4 0.6 0.3 -0.1 0.1 0.2
Transportation and warehousing of goods for nonmanufacturingindustries. . . . . . . . . . . . . . . . . . . . . . . . . . . . . . . . . . . . . . . . . . . . . . . . . . . . . . . . . . . . 12/12 8.951 102.7 102.8 104.4 2.8 1.6 0.4 0.0 -0.2
Services less trade, transportation, and warehousing for intermediatedemand. . . . . . . . . . . . . . . . . . . . . . . . . . . . . . . . . . . . . . . . . . . . . . . . . . . . . . . . . . . . . . . . . . 68.656 105.3 105.4 105.7 1.3 0.3 -0.1 0.1 0.3
Services less trade, transportation, and warehousing for manufacturingindustries. . . . . . . . . . . . . . . . . . . . . . . . . . . . . . . . . . . . . . . . . . . . . . . . . . . . . . . . . . . . . . 2.003 102.1 102.4 102.2 0.9 -0.2 -0.1 0.6 -0.2
Services less trade, transportation, and warehousing for nonmanufacturingindustries. . . . . . . . . . . . . . . . . . . . . . . . . . . . . . . . . . . . . . . . . . . . . . . . . . . . . . . . . . . . . . 66.653 105.4 105.5 105.8 1.3 0.3 -0.1 0.1 0.3
Construction
Construction for intermediate demand. . . . . . . . . . . . . . . . . . . . . . . . . . . . . . . . . . . . . . . . . . 100.000 106.1 105.9 106.6 1.6 0.7 0.1 -0.1 0.1
Special groupings
Processed materials less foods and feeds. . . . . . . . . . . . . . . . . . . . . . . . . . . . . . . . . . . . . 00/82 92.071 201.3 199.3 200.6 0.4 0.7 -0.3 0.5 0.5
Processed foods and feeds. . . . . . . . . . . . . . . . . . . . . . . . . . . . . . . . . . . . . . . . . . . . . . . . . . . . 00/82 7.929 206.4 200.1 202.9 -0.5 1.4 -1.2 0.4 1.7
Processed energy goods. . . . . . . . . . . . . . . . . . . . . . . . . . . . . . . . . . . . . . . . . . . . . . . . . . . . . . 00/82 21.372 217.6 208.1 211.7 0.4 1.7 -1.0 1.4 1.4
Processed materials less energy. . . . . . . . . . . . . . . . . . . . . . . . . . . . . . . . . . . . . . . . . . . . . . 00/82 78.628 194.9 194.4 195.3 0.3 0.5 -0.2 0.2 0.4
Processed materials less foods and energy. . . . . . . . . . . . . . . . . . . . . . . . . . . . . . . . . . . . 00/82 70.699 193.5 193.6 194.2 0.4 0.3 -0.1 0.2 0.3
Intermediate distributive services5. . . . . . . . . . . . . . . . . . . . . . . . . . . . . . . . . . . . . . . . . . . . . 04/10 31.344 109.8 109.7 110.1 0.4 0.4 0.2 -0.2 -0.2
Processed goods plus intermediate distributive services. . . . . . . . . . . . . . . . . . . . . . . . 04/10 – 110.1 109.1 109.8 0.3 0.6 -0.3 0.3 0.5
Unprocessed materials less agricultural products. . . . . . . . . . . . . . . . . . . . . . . . . . . . . . . 00/82 60.342 277.1 268.9 272.5 2.3 1.3 -2.9 4.1 -0.6
See footnotes at end of table.
20
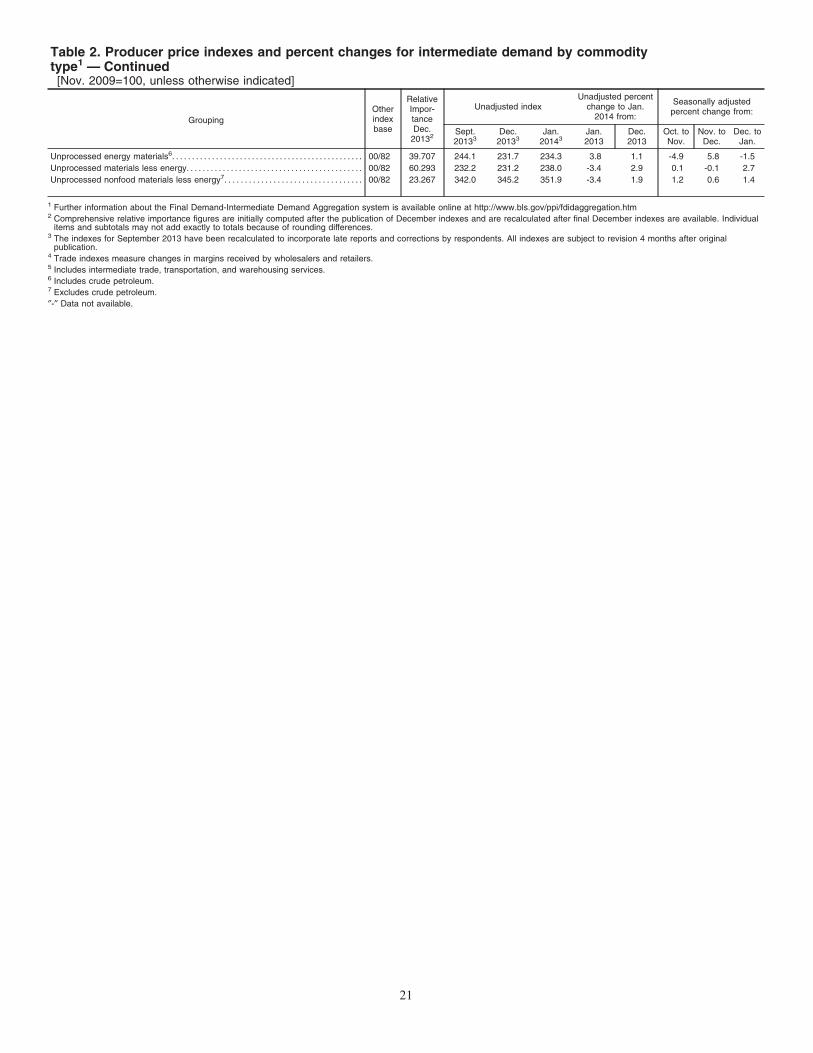
Table 2. Producer price indexes and percent changes for intermediate demand by commoditytype1 — Continued[Nov. 2009=100, unless otherwise indicated]
Grouping
Otherindexbase
RelativeImpor-tanceDec.
20132
Unadjusted indexUnadjusted percent
change to Jan.2014 from:
Seasonally adjustedpercent change from:
Sept.20133
Dec.20133
Jan.20143
Jan.2013
Dec.2013
Oct. toNov.
Nov. toDec.
Dec. toJan.
Unprocessed energy materials6. . . . . . . . . . . . . . . . . . . . . . . . . . . . . . . . . . . . . . . . . . . . . . . . 00/82 39.707 244.1 231.7 234.3 3.8 1.1 -4.9 5.8 -1.5
Unprocessed materials less energy. . . . . . . . . . . . . . . . . . . . . . . . . . . . . . . . . . . . . . . . . . . . 00/82 60.293 232.2 231.2 238.0 -3.4 2.9 0.1 -0.1 2.7
Unprocessed nonfood materials less energy7. . . . . . . . . . . . . . . . . . . . . . . . . . . . . . . . . . 00/82 23.267 342.0 345.2 351.9 -3.4 1.9 1.2 0.6 1.4
1 Further information about the Final Demand-Intermediate Demand Aggregation system is available online at http://www.bls.gov/ppi/fdidaggregation.htm2 Comprehensive relative importance figures are initially computed after the publication of December indexes and are recalculated after final December indexes are available. Individual
items and subtotals may not add exactly to totals because of rounding differences.3 The indexes for September 2013 have been recalculated to incorporate late reports and corrections by respondents. All indexes are subject to revision 4 months after original
publication.4 Trade indexes measure changes in margins received by wholesalers and retailers.5 Includes intermediate trade, transportation, and warehousing services.6 Includes crude petroleum.7 Excludes crude petroleum.
″-″ Data not available.
21
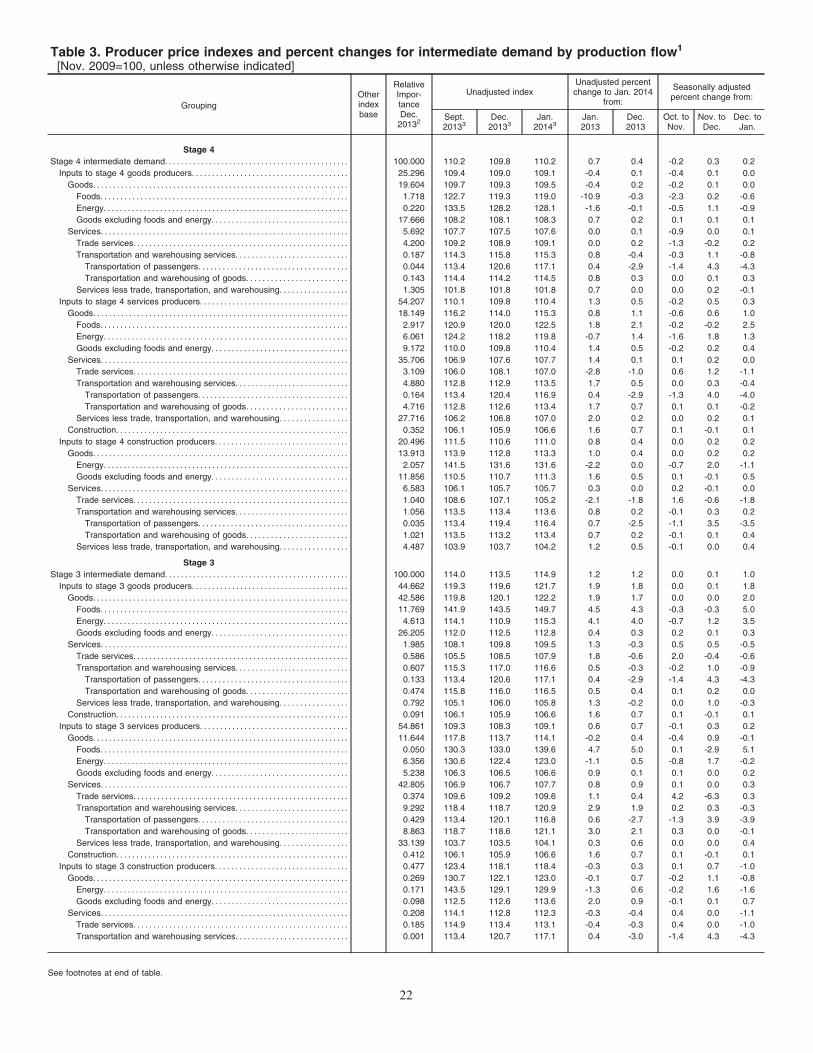
Table 3. Producer price indexes and percent changes for intermediate demand by production flow1
[Nov. 2009=100, unless otherwise indicated]
Grouping
Otherindexbase
RelativeImpor-tanceDec.
20132
Unadjusted indexUnadjusted percentchange to Jan. 2014
from:
Seasonally adjustedpercent change from:
Sept.20133
Dec.20133
Jan.20143
Jan.2013
Dec.2013
Oct. toNov.
Nov. toDec.
Dec. toJan.
Stage 4
Stage 4 intermediate demand. . . . . . . . . . . . . . . . . . . . . . . . . . . . . . . . . . . . . . . . . . . . . . 100.000 110.2 109.8 110.2 0.7 0.4 -0.2 0.3 0.2
Inputs to stage 4 goods producers. . . . . . . . . . . . . . . . . . . . . . . . . . . . . . . . . . . . . . . 25.296 109.4 109.0 109.1 -0.4 0.1 -0.4 0.1 0.0
Goods. . . . . . . . . . . . . . . . . . . . . . . . . . . . . . . . . . . . . . . . . . . . . . . . . . . . . . . . . . . . . . . . 19.604 109.7 109.3 109.5 -0.4 0.2 -0.2 0.1 0.0
Foods. . . . . . . . . . . . . . . . . . . . . . . . . . . . . . . . . . . . . . . . . . . . . . . . . . . . . . . . . . . . . . 1.718 122.7 119.3 119.0 -10.9 -0.3 -2.3 0.2 -0.6
Energy. . . . . . . . . . . . . . . . . . . . . . . . . . . . . . . . . . . . . . . . . . . . . . . . . . . . . . . . . . . . . 0.220 133.5 128.2 128.1 -1.6 -0.1 -0.5 1.1 -0.9
Goods excluding foods and energy. . . . . . . . . . . . . . . . . . . . . . . . . . . . . . . . . . 17.666 108.2 108.1 108.3 0.7 0.2 0.1 0.1 0.1
Services. . . . . . . . . . . . . . . . . . . . . . . . . . . . . . . . . . . . . . . . . . . . . . . . . . . . . . . . . . . . . . 5.692 107.7 107.5 107.6 0.0 0.1 -0.9 0.0 0.1
Trade services. . . . . . . . . . . . . . . . . . . . . . . . . . . . . . . . . . . . . . . . . . . . . . . . . . . . . . 4.200 109.2 108.9 109.1 0.0 0.2 -1.3 -0.2 0.2
Transportation and warehousing services. . . . . . . . . . . . . . . . . . . . . . . . . . . . 0.187 114.3 115.8 115.3 0.8 -0.4 -0.3 1.1 -0.8
Transportation of passengers. . . . . . . . . . . . . . . . . . . . . . . . . . . . . . . . . . . . . 0.044 113.4 120.6 117.1 0.4 -2.9 -1.4 4.3 -4.3
Transportation and warehousing of goods. . . . . . . . . . . . . . . . . . . . . . . . . 0.143 114.4 114.2 114.5 0.8 0.3 0.0 0.1 0.3
Services less trade, transportation, and warehousing. . . . . . . . . . . . . . . . . 1.305 101.8 101.8 101.8 0.7 0.0 0.0 0.2 -0.1
Inputs to stage 4 services producers. . . . . . . . . . . . . . . . . . . . . . . . . . . . . . . . . . . . . 54.207 110.1 109.8 110.4 1.3 0.5 -0.2 0.5 0.3
Goods. . . . . . . . . . . . . . . . . . . . . . . . . . . . . . . . . . . . . . . . . . . . . . . . . . . . . . . . . . . . . . . . 18.149 116.2 114.0 115.3 0.8 1.1 -0.6 0.6 1.0
Foods. . . . . . . . . . . . . . . . . . . . . . . . . . . . . . . . . . . . . . . . . . . . . . . . . . . . . . . . . . . . . . 2.917 120.9 120.0 122.5 1.8 2.1 -0.2 -0.2 2.5
Energy. . . . . . . . . . . . . . . . . . . . . . . . . . . . . . . . . . . . . . . . . . . . . . . . . . . . . . . . . . . . . 6.061 124.2 118.2 119.8 -0.7 1.4 -1.6 1.8 1.3
Goods excluding foods and energy. . . . . . . . . . . . . . . . . . . . . . . . . . . . . . . . . . 9.172 110.0 109.8 110.4 1.4 0.5 -0.2 0.2 0.4
Services. . . . . . . . . . . . . . . . . . . . . . . . . . . . . . . . . . . . . . . . . . . . . . . . . . . . . . . . . . . . . . 35.706 106.9 107.6 107.7 1.4 0.1 0.1 0.2 0.0
Trade services. . . . . . . . . . . . . . . . . . . . . . . . . . . . . . . . . . . . . . . . . . . . . . . . . . . . . . 3.109 106.0 108.1 107.0 -2.8 -1.0 0.6 1.2 -1.1
Transportation and warehousing services. . . . . . . . . . . . . . . . . . . . . . . . . . . . 4.880 112.8 112.9 113.5 1.7 0.5 0.0 0.3 -0.4
Transportation of passengers. . . . . . . . . . . . . . . . . . . . . . . . . . . . . . . . . . . . . 0.164 113.4 120.4 116.9 0.4 -2.9 -1.3 4.0 -4.0
Transportation and warehousing of goods. . . . . . . . . . . . . . . . . . . . . . . . . 4.716 112.8 112.6 113.4 1.7 0.7 0.1 0.1 -0.2
Services less trade, transportation, and warehousing. . . . . . . . . . . . . . . . . 27.716 106.2 106.8 107.0 2.0 0.2 0.0 0.2 0.1
Construction. . . . . . . . . . . . . . . . . . . . . . . . . . . . . . . . . . . . . . . . . . . . . . . . . . . . . . . . . . 0.352 106.1 105.9 106.6 1.6 0.7 0.1 -0.1 0.1
Inputs to stage 4 construction producers. . . . . . . . . . . . . . . . . . . . . . . . . . . . . . . . . 20.496 111.5 110.6 111.0 0.8 0.4 0.0 0.2 0.2
Goods. . . . . . . . . . . . . . . . . . . . . . . . . . . . . . . . . . . . . . . . . . . . . . . . . . . . . . . . . . . . . . . . 13.913 113.9 112.8 113.3 1.0 0.4 0.0 0.2 0.2
Energy. . . . . . . . . . . . . . . . . . . . . . . . . . . . . . . . . . . . . . . . . . . . . . . . . . . . . . . . . . . . . 2.057 141.5 131.6 131.6 -2.2 0.0 -0.7 2.0 -1.1
Goods excluding foods and energy. . . . . . . . . . . . . . . . . . . . . . . . . . . . . . . . . . 11.856 110.5 110.7 111.3 1.6 0.5 0.1 -0.1 0.5
Services. . . . . . . . . . . . . . . . . . . . . . . . . . . . . . . . . . . . . . . . . . . . . . . . . . . . . . . . . . . . . . 6.583 106.1 105.7 105.7 0.3 0.0 0.2 -0.1 0.0
Trade services. . . . . . . . . . . . . . . . . . . . . . . . . . . . . . . . . . . . . . . . . . . . . . . . . . . . . . 1.040 108.6 107.1 105.2 -2.1 -1.8 1.6 -0.6 -1.8
Transportation and warehousing services. . . . . . . . . . . . . . . . . . . . . . . . . . . . 1.056 113.5 113.4 113.6 0.8 0.2 -0.1 0.3 0.2
Transportation of passengers. . . . . . . . . . . . . . . . . . . . . . . . . . . . . . . . . . . . . 0.035 113.4 119.4 116.4 0.7 -2.5 -1.1 3.5 -3.5
Transportation and warehousing of goods. . . . . . . . . . . . . . . . . . . . . . . . . 1.021 113.5 113.2 113.4 0.7 0.2 -0.1 0.1 0.4
Services less trade, transportation, and warehousing. . . . . . . . . . . . . . . . . 4.487 103.9 103.7 104.2 1.2 0.5 -0.1 0.0 0.4
Stage 3
Stage 3 intermediate demand. . . . . . . . . . . . . . . . . . . . . . . . . . . . . . . . . . . . . . . . . . . . . . 100.000 114.0 113.5 114.9 1.2 1.2 0.0 0.1 1.0
Inputs to stage 3 goods producers. . . . . . . . . . . . . . . . . . . . . . . . . . . . . . . . . . . . . . . 44.662 119.3 119.6 121.7 1.9 1.8 0.0 0.1 1.8
Goods. . . . . . . . . . . . . . . . . . . . . . . . . . . . . . . . . . . . . . . . . . . . . . . . . . . . . . . . . . . . . . . . 42.586 119.8 120.1 122.2 1.9 1.7 0.0 0.0 2.0
Foods. . . . . . . . . . . . . . . . . . . . . . . . . . . . . . . . . . . . . . . . . . . . . . . . . . . . . . . . . . . . . . 11.769 141.9 143.5 149.7 4.5 4.3 -0.3 -0.3 5.0
Energy. . . . . . . . . . . . . . . . . . . . . . . . . . . . . . . . . . . . . . . . . . . . . . . . . . . . . . . . . . . . . 4.613 114.1 110.9 115.3 4.1 4.0 -0.7 1.2 3.5
Goods excluding foods and energy. . . . . . . . . . . . . . . . . . . . . . . . . . . . . . . . . . 26.205 112.0 112.5 112.8 0.4 0.3 0.2 0.1 0.3
Services. . . . . . . . . . . . . . . . . . . . . . . . . . . . . . . . . . . . . . . . . . . . . . . . . . . . . . . . . . . . . . 1.985 108.1 109.8 109.5 1.3 -0.3 0.5 0.5 -0.5
Trade services. . . . . . . . . . . . . . . . . . . . . . . . . . . . . . . . . . . . . . . . . . . . . . . . . . . . . . 0.586 105.5 108.5 107.9 1.8 -0.6 2.0 -0.4 -0.6
Transportation and warehousing services. . . . . . . . . . . . . . . . . . . . . . . . . . . . 0.607 115.3 117.0 116.6 0.5 -0.3 -0.2 1.0 -0.9
Transportation of passengers. . . . . . . . . . . . . . . . . . . . . . . . . . . . . . . . . . . . . 0.133 113.4 120.6 117.1 0.4 -2.9 -1.4 4.3 -4.3
Transportation and warehousing of goods. . . . . . . . . . . . . . . . . . . . . . . . . 0.474 115.8 116.0 116.5 0.5 0.4 0.1 0.2 0.0
Services less trade, transportation, and warehousing. . . . . . . . . . . . . . . . . 0.792 105.1 106.0 105.8 1.3 -0.2 0.0 1.0 -0.3
Construction. . . . . . . . . . . . . . . . . . . . . . . . . . . . . . . . . . . . . . . . . . . . . . . . . . . . . . . . . . 0.091 106.1 105.9 106.6 1.6 0.7 0.1 -0.1 0.1
Inputs to stage 3 services producers. . . . . . . . . . . . . . . . . . . . . . . . . . . . . . . . . . . . . 54.861 109.3 108.3 109.1 0.6 0.7 -0.1 0.3 0.2
Goods. . . . . . . . . . . . . . . . . . . . . . . . . . . . . . . . . . . . . . . . . . . . . . . . . . . . . . . . . . . . . . . . 11.644 117.8 113.7 114.1 -0.2 0.4 -0.4 0.9 -0.1
Foods. . . . . . . . . . . . . . . . . . . . . . . . . . . . . . . . . . . . . . . . . . . . . . . . . . . . . . . . . . . . . . 0.050 130.3 133.0 139.6 4.7 5.0 0.1 -2.9 5.1
Energy. . . . . . . . . . . . . . . . . . . . . . . . . . . . . . . . . . . . . . . . . . . . . . . . . . . . . . . . . . . . . 6.356 130.6 122.4 123.0 -1.1 0.5 -0.8 1.7 -0.2
Goods excluding foods and energy. . . . . . . . . . . . . . . . . . . . . . . . . . . . . . . . . . 5.238 106.3 106.5 106.6 0.9 0.1 0.1 0.0 0.2
Services. . . . . . . . . . . . . . . . . . . . . . . . . . . . . . . . . . . . . . . . . . . . . . . . . . . . . . . . . . . . . . 42.805 106.9 106.7 107.7 0.8 0.9 0.1 0.0 0.3
Trade services. . . . . . . . . . . . . . . . . . . . . . . . . . . . . . . . . . . . . . . . . . . . . . . . . . . . . . 0.374 109.6 109.2 109.6 1.1 0.4 4.2 -6.3 0.3
Transportation and warehousing services. . . . . . . . . . . . . . . . . . . . . . . . . . . . 9.292 118.4 118.7 120.9 2.9 1.9 0.2 0.3 -0.3
Transportation of passengers. . . . . . . . . . . . . . . . . . . . . . . . . . . . . . . . . . . . . 0.429 113.4 120.1 116.8 0.6 -2.7 -1.3 3.9 -3.9
Transportation and warehousing of goods. . . . . . . . . . . . . . . . . . . . . . . . . 8.863 118.7 118.6 121.1 3.0 2.1 0.3 0.0 -0.1
Services less trade, transportation, and warehousing. . . . . . . . . . . . . . . . . 33.139 103.7 103.5 104.1 0.3 0.6 0.0 0.0 0.4
Construction. . . . . . . . . . . . . . . . . . . . . . . . . . . . . . . . . . . . . . . . . . . . . . . . . . . . . . . . . . 0.412 106.1 105.9 106.6 1.6 0.7 0.1 -0.1 0.1
Inputs to stage 3 construction producers. . . . . . . . . . . . . . . . . . . . . . . . . . . . . . . . . 0.477 123.4 118.1 118.4 -0.3 0.3 0.1 0.7 -1.0
Goods. . . . . . . . . . . . . . . . . . . . . . . . . . . . . . . . . . . . . . . . . . . . . . . . . . . . . . . . . . . . . . . . 0.269 130.7 122.1 123.0 -0.1 0.7 -0.2 1.1 -0.8
Energy. . . . . . . . . . . . . . . . . . . . . . . . . . . . . . . . . . . . . . . . . . . . . . . . . . . . . . . . . . . . . 0.171 143.5 129.1 129.9 -1.3 0.6 -0.2 1.6 -1.6
Goods excluding foods and energy. . . . . . . . . . . . . . . . . . . . . . . . . . . . . . . . . . 0.098 112.5 112.6 113.6 2.0 0.9 -0.1 0.1 0.7
Services. . . . . . . . . . . . . . . . . . . . . . . . . . . . . . . . . . . . . . . . . . . . . . . . . . . . . . . . . . . . . . 0.208 114.1 112.8 112.3 -0.3 -0.4 0.4 0.0 -1.1
Trade services. . . . . . . . . . . . . . . . . . . . . . . . . . . . . . . . . . . . . . . . . . . . . . . . . . . . . . 0.185 114.9 113.4 113.1 -0.4 -0.3 0.4 0.0 -1.0
Transportation and warehousing services. . . . . . . . . . . . . . . . . . . . . . . . . . . . 0.001 113.4 120.7 117.1 0.4 -3.0 -1.4 4.3 -4.3
See footnotes at end of table.
22
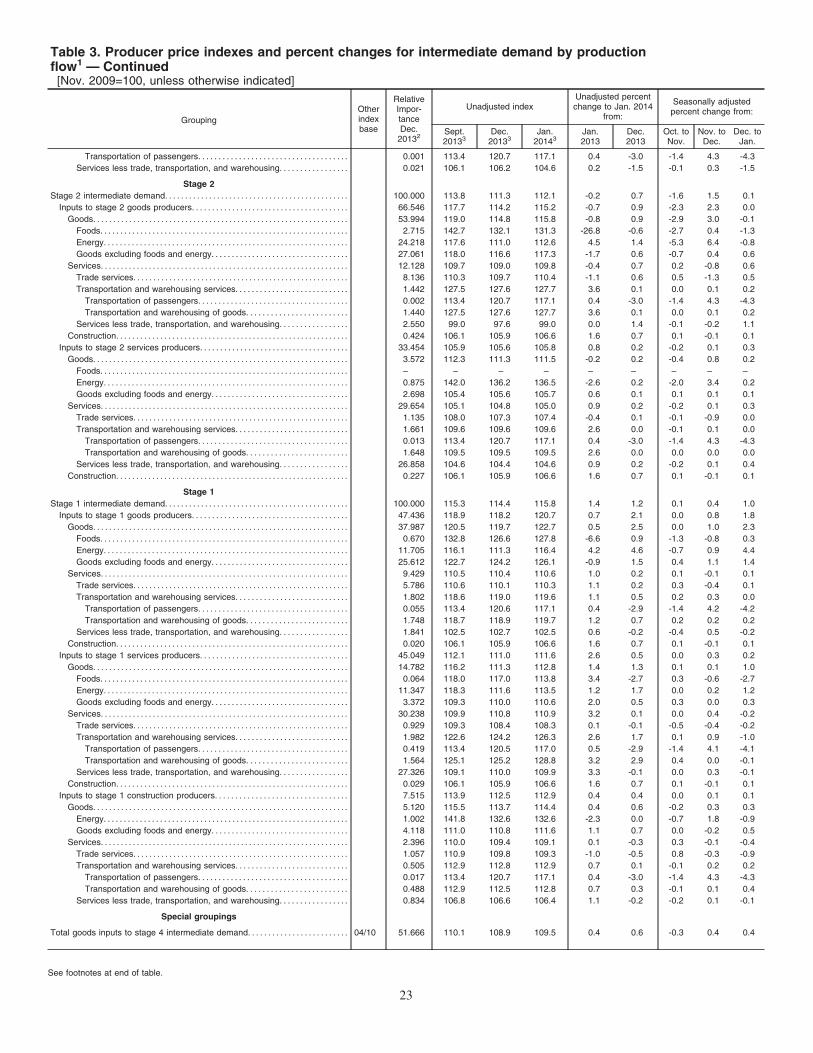
Table 3. Producer price indexes and percent changes for intermediate demand by productionflow1 — Continued[Nov. 2009=100, unless otherwise indicated]
Grouping
Otherindexbase
RelativeImpor-tanceDec.
20132
Unadjusted indexUnadjusted percentchange to Jan. 2014
from:
Seasonally adjustedpercent change from:
Sept.20133
Dec.20133
Jan.20143
Jan.2013
Dec.2013
Oct. toNov.
Nov. toDec.
Dec. toJan.
Transportation of passengers. . . . . . . . . . . . . . . . . . . . . . . . . . . . . . . . . . . . . 0.001 113.4 120.7 117.1 0.4 -3.0 -1.4 4.3 -4.3
Services less trade, transportation, and warehousing. . . . . . . . . . . . . . . . . 0.021 106.1 106.2 104.6 0.2 -1.5 -0.1 0.3 -1.5
Stage 2
Stage 2 intermediate demand. . . . . . . . . . . . . . . . . . . . . . . . . . . . . . . . . . . . . . . . . . . . . . 100.000 113.8 111.3 112.1 -0.2 0.7 -1.6 1.5 0.1
Inputs to stage 2 goods producers. . . . . . . . . . . . . . . . . . . . . . . . . . . . . . . . . . . . . . . 66.546 117.7 114.2 115.2 -0.7 0.9 -2.3 2.3 0.0
Goods. . . . . . . . . . . . . . . . . . . . . . . . . . . . . . . . . . . . . . . . . . . . . . . . . . . . . . . . . . . . . . . . 53.994 119.0 114.8 115.8 -0.8 0.9 -2.9 3.0 -0.1
Foods. . . . . . . . . . . . . . . . . . . . . . . . . . . . . . . . . . . . . . . . . . . . . . . . . . . . . . . . . . . . . . 2.715 142.7 132.1 131.3 -26.8 -0.6 -2.7 0.4 -1.3
Energy. . . . . . . . . . . . . . . . . . . . . . . . . . . . . . . . . . . . . . . . . . . . . . . . . . . . . . . . . . . . . 24.218 117.6 111.0 112.6 4.5 1.4 -5.3 6.4 -0.8
Goods excluding foods and energy. . . . . . . . . . . . . . . . . . . . . . . . . . . . . . . . . . 27.061 118.0 116.6 117.3 -1.7 0.6 -0.7 0.4 0.6
Services. . . . . . . . . . . . . . . . . . . . . . . . . . . . . . . . . . . . . . . . . . . . . . . . . . . . . . . . . . . . . . 12.128 109.7 109.0 109.8 -0.4 0.7 0.2 -0.8 0.6
Trade services. . . . . . . . . . . . . . . . . . . . . . . . . . . . . . . . . . . . . . . . . . . . . . . . . . . . . . 8.136 110.3 109.7 110.4 -1.1 0.6 0.5 -1.3 0.5
Transportation and warehousing services. . . . . . . . . . . . . . . . . . . . . . . . . . . . 1.442 127.5 127.6 127.7 3.6 0.1 0.0 0.1 0.2
Transportation of passengers. . . . . . . . . . . . . . . . . . . . . . . . . . . . . . . . . . . . . 0.002 113.4 120.7 117.1 0.4 -3.0 -1.4 4.3 -4.3
Transportation and warehousing of goods. . . . . . . . . . . . . . . . . . . . . . . . . 1.440 127.5 127.6 127.7 3.6 0.1 0.0 0.1 0.2
Services less trade, transportation, and warehousing. . . . . . . . . . . . . . . . . 2.550 99.0 97.6 99.0 0.0 1.4 -0.1 -0.2 1.1
Construction. . . . . . . . . . . . . . . . . . . . . . . . . . . . . . . . . . . . . . . . . . . . . . . . . . . . . . . . . . 0.424 106.1 105.9 106.6 1.6 0.7 0.1 -0.1 0.1
Inputs to stage 2 services producers. . . . . . . . . . . . . . . . . . . . . . . . . . . . . . . . . . . . . 33.454 105.9 105.6 105.8 0.8 0.2 -0.2 0.1 0.3
Goods. . . . . . . . . . . . . . . . . . . . . . . . . . . . . . . . . . . . . . . . . . . . . . . . . . . . . . . . . . . . . . . . 3.572 112.3 111.3 111.5 -0.2 0.2 -0.4 0.8 0.2
Foods. . . . . . . . . . . . . . . . . . . . . . . . . . . . . . . . . . . . . . . . . . . . . . . . . . . . . . . . . . . . . . – – – – – – – – –
Energy. . . . . . . . . . . . . . . . . . . . . . . . . . . . . . . . . . . . . . . . . . . . . . . . . . . . . . . . . . . . . 0.875 142.0 136.2 136.5 -2.6 0.2 -2.0 3.4 0.2
Goods excluding foods and energy. . . . . . . . . . . . . . . . . . . . . . . . . . . . . . . . . . 2.698 105.4 105.6 105.7 0.6 0.1 0.1 0.1 0.1
Services. . . . . . . . . . . . . . . . . . . . . . . . . . . . . . . . . . . . . . . . . . . . . . . . . . . . . . . . . . . . . . 29.654 105.1 104.8 105.0 0.9 0.2 -0.2 0.1 0.3
Trade services. . . . . . . . . . . . . . . . . . . . . . . . . . . . . . . . . . . . . . . . . . . . . . . . . . . . . . 1.135 108.0 107.3 107.4 -0.4 0.1 -0.1 -0.9 0.0
Transportation and warehousing services. . . . . . . . . . . . . . . . . . . . . . . . . . . . 1.661 109.6 109.6 109.6 2.6 0.0 -0.1 0.1 0.0
Transportation of passengers. . . . . . . . . . . . . . . . . . . . . . . . . . . . . . . . . . . . . 0.013 113.4 120.7 117.1 0.4 -3.0 -1.4 4.3 -4.3
Transportation and warehousing of goods. . . . . . . . . . . . . . . . . . . . . . . . . 1.648 109.5 109.5 109.5 2.6 0.0 0.0 0.0 0.0
Services less trade, transportation, and warehousing. . . . . . . . . . . . . . . . . 26.858 104.6 104.4 104.6 0.9 0.2 -0.2 0.1 0.4
Construction. . . . . . . . . . . . . . . . . . . . . . . . . . . . . . . . . . . . . . . . . . . . . . . . . . . . . . . . . . 0.227 106.1 105.9 106.6 1.6 0.7 0.1 -0.1 0.1
Stage 1
Stage 1 intermediate demand. . . . . . . . . . . . . . . . . . . . . . . . . . . . . . . . . . . . . . . . . . . . . . 100.000 115.3 114.4 115.8 1.4 1.2 0.1 0.4 1.0
Inputs to stage 1 goods producers. . . . . . . . . . . . . . . . . . . . . . . . . . . . . . . . . . . . . . . 47.436 118.9 118.2 120.7 0.7 2.1 0.0 0.8 1.8
Goods. . . . . . . . . . . . . . . . . . . . . . . . . . . . . . . . . . . . . . . . . . . . . . . . . . . . . . . . . . . . . . . . 37.987 120.5 119.7 122.7 0.5 2.5 0.0 1.0 2.3
Foods. . . . . . . . . . . . . . . . . . . . . . . . . . . . . . . . . . . . . . . . . . . . . . . . . . . . . . . . . . . . . . 0.670 132.8 126.6 127.8 -6.6 0.9 -1.3 -0.8 0.3
Energy. . . . . . . . . . . . . . . . . . . . . . . . . . . . . . . . . . . . . . . . . . . . . . . . . . . . . . . . . . . . . 11.705 116.1 111.3 116.4 4.2 4.6 -0.7 0.9 4.4
Goods excluding foods and energy. . . . . . . . . . . . . . . . . . . . . . . . . . . . . . . . . . 25.612 122.7 124.2 126.1 -0.9 1.5 0.4 1.1 1.4
Services. . . . . . . . . . . . . . . . . . . . . . . . . . . . . . . . . . . . . . . . . . . . . . . . . . . . . . . . . . . . . . 9.429 110.5 110.4 110.6 1.0 0.2 0.1 -0.1 0.1
Trade services. . . . . . . . . . . . . . . . . . . . . . . . . . . . . . . . . . . . . . . . . . . . . . . . . . . . . . 5.786 110.6 110.1 110.3 1.1 0.2 0.3 -0.4 0.1
Transportation and warehousing services. . . . . . . . . . . . . . . . . . . . . . . . . . . . 1.802 118.6 119.0 119.6 1.1 0.5 0.2 0.3 0.0
Transportation of passengers. . . . . . . . . . . . . . . . . . . . . . . . . . . . . . . . . . . . . 0.055 113.4 120.6 117.1 0.4 -2.9 -1.4 4.2 -4.2
Transportation and warehousing of goods. . . . . . . . . . . . . . . . . . . . . . . . . 1.748 118.7 118.9 119.7 1.2 0.7 0.2 0.2 0.2
Services less trade, transportation, and warehousing. . . . . . . . . . . . . . . . . 1.841 102.5 102.7 102.5 0.6 -0.2 -0.4 0.5 -0.2
Construction. . . . . . . . . . . . . . . . . . . . . . . . . . . . . . . . . . . . . . . . . . . . . . . . . . . . . . . . . . 0.020 106.1 105.9 106.6 1.6 0.7 0.1 -0.1 0.1
Inputs to stage 1 services producers. . . . . . . . . . . . . . . . . . . . . . . . . . . . . . . . . . . . . 45.049 112.1 111.0 111.6 2.6 0.5 0.0 0.3 0.2
Goods. . . . . . . . . . . . . . . . . . . . . . . . . . . . . . . . . . . . . . . . . . . . . . . . . . . . . . . . . . . . . . . . 14.782 116.2 111.3 112.8 1.4 1.3 0.1 0.1 1.0
Foods. . . . . . . . . . . . . . . . . . . . . . . . . . . . . . . . . . . . . . . . . . . . . . . . . . . . . . . . . . . . . . 0.064 118.0 117.0 113.8 3.4 -2.7 0.3 -0.6 -2.7
Energy. . . . . . . . . . . . . . . . . . . . . . . . . . . . . . . . . . . . . . . . . . . . . . . . . . . . . . . . . . . . . 11.347 118.3 111.6 113.5 1.2 1.7 0.0 0.2 1.2
Goods excluding foods and energy. . . . . . . . . . . . . . . . . . . . . . . . . . . . . . . . . . 3.372 109.3 110.0 110.6 2.0 0.5 0.3 0.0 0.3
Services. . . . . . . . . . . . . . . . . . . . . . . . . . . . . . . . . . . . . . . . . . . . . . . . . . . . . . . . . . . . . . 30.238 109.9 110.8 110.9 3.2 0.1 0.0 0.4 -0.2
Trade services. . . . . . . . . . . . . . . . . . . . . . . . . . . . . . . . . . . . . . . . . . . . . . . . . . . . . . 0.929 109.3 108.4 108.3 0.1 -0.1 -0.5 -0.4 -0.2
Transportation and warehousing services. . . . . . . . . . . . . . . . . . . . . . . . . . . . 1.982 122.6 124.2 126.3 2.6 1.7 0.1 0.9 -1.0
Transportation of passengers. . . . . . . . . . . . . . . . . . . . . . . . . . . . . . . . . . . . . 0.419 113.4 120.5 117.0 0.5 -2.9 -1.4 4.1 -4.1
Transportation and warehousing of goods. . . . . . . . . . . . . . . . . . . . . . . . . 1.564 125.1 125.2 128.8 3.2 2.9 0.4 0.0 -0.1
Services less trade, transportation, and warehousing. . . . . . . . . . . . . . . . . 27.326 109.1 110.0 109.9 3.3 -0.1 0.0 0.3 -0.1
Construction. . . . . . . . . . . . . . . . . . . . . . . . . . . . . . . . . . . . . . . . . . . . . . . . . . . . . . . . . . 0.029 106.1 105.9 106.6 1.6 0.7 0.1 -0.1 0.1
Inputs to stage 1 construction producers. . . . . . . . . . . . . . . . . . . . . . . . . . . . . . . . . 7.515 113.9 112.5 112.9 0.4 0.4 0.0 0.1 0.1
Goods. . . . . . . . . . . . . . . . . . . . . . . . . . . . . . . . . . . . . . . . . . . . . . . . . . . . . . . . . . . . . . . . 5.120 115.5 113.7 114.4 0.4 0.6 -0.2 0.3 0.3
Energy. . . . . . . . . . . . . . . . . . . . . . . . . . . . . . . . . . . . . . . . . . . . . . . . . . . . . . . . . . . . . 1.002 141.8 132.6 132.6 -2.3 0.0 -0.7 1.8 -0.9
Goods excluding foods and energy. . . . . . . . . . . . . . . . . . . . . . . . . . . . . . . . . . 4.118 111.0 110.8 111.6 1.1 0.7 0.0 -0.2 0.5
Services. . . . . . . . . . . . . . . . . . . . . . . . . . . . . . . . . . . . . . . . . . . . . . . . . . . . . . . . . . . . . . 2.396 110.0 109.4 109.1 0.1 -0.3 0.3 -0.1 -0.4
Trade services. . . . . . . . . . . . . . . . . . . . . . . . . . . . . . . . . . . . . . . . . . . . . . . . . . . . . . 1.057 110.9 109.8 109.3 -1.0 -0.5 0.8 -0.3 -0.9
Transportation and warehousing services. . . . . . . . . . . . . . . . . . . . . . . . . . . . 0.505 112.9 112.8 112.9 0.7 0.1 -0.1 0.2 0.2
Transportation of passengers. . . . . . . . . . . . . . . . . . . . . . . . . . . . . . . . . . . . . 0.017 113.4 120.7 117.1 0.4 -3.0 -1.4 4.3 -4.3
Transportation and warehousing of goods. . . . . . . . . . . . . . . . . . . . . . . . . 0.488 112.9 112.5 112.8 0.7 0.3 -0.1 0.1 0.4
Services less trade, transportation, and warehousing. . . . . . . . . . . . . . . . . 0.834 106.8 106.6 106.4 1.1 -0.2 -0.2 0.1 -0.1
Special groupings
Total goods inputs to stage 4 intermediate demand. . . . . . . . . . . . . . . . . . . . . . . . . 04/10 51.666 110.1 108.9 109.5 0.4 0.6 -0.3 0.4 0.4
See footnotes at end of table.
23
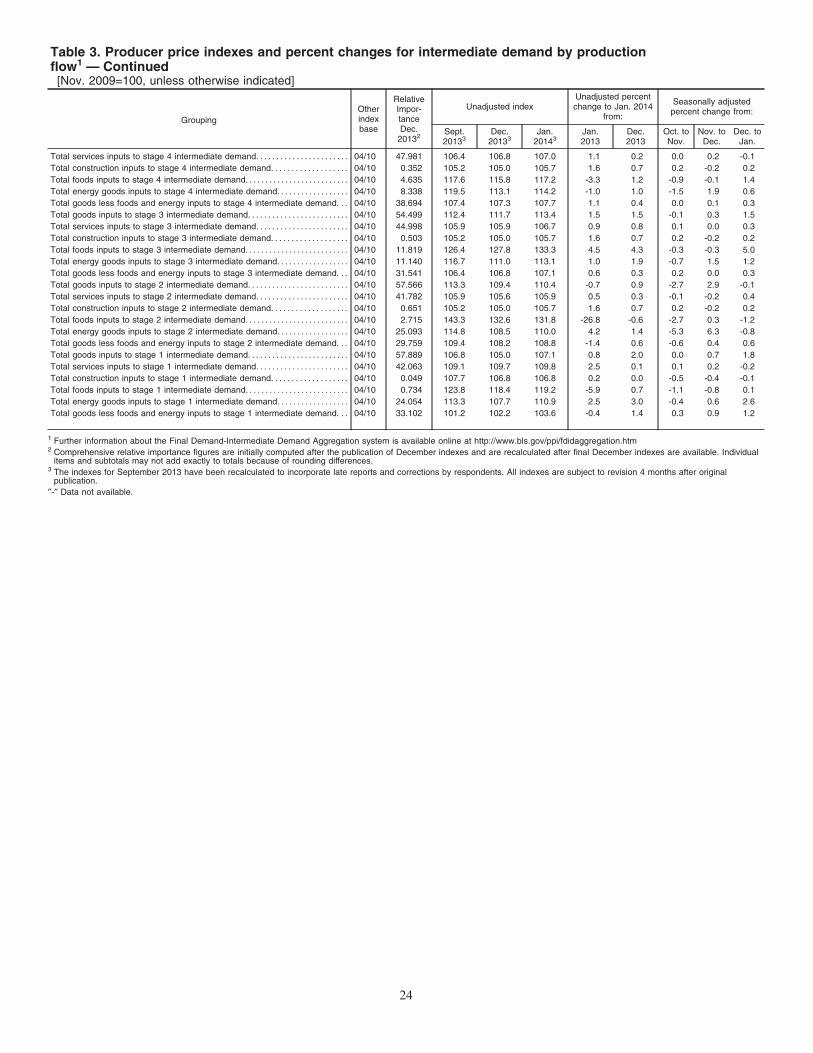
Table 3. Producer price indexes and percent changes for intermediate demand by productionflow1 — Continued[Nov. 2009=100, unless otherwise indicated]
Grouping
Otherindexbase
RelativeImpor-tanceDec.
20132
Unadjusted indexUnadjusted percentchange to Jan. 2014
from:
Seasonally adjustedpercent change from:
Sept.20133
Dec.20133
Jan.20143
Jan.2013
Dec.2013
Oct. toNov.
Nov. toDec.
Dec. toJan.
Total services inputs to stage 4 intermediate demand. . . . . . . . . . . . . . . . . . . . . . . 04/10 47.981 106.4 106.8 107.0 1.1 0.2 0.0 0.2 -0.1
Total construction inputs to stage 4 intermediate demand. . . . . . . . . . . . . . . . . . . 04/10 0.352 105.2 105.0 105.7 1.6 0.7 0.2 -0.2 0.2
Total foods inputs to stage 4 intermediate demand. . . . . . . . . . . . . . . . . . . . . . . . . . 04/10 4.635 117.6 115.8 117.2 -3.3 1.2 -0.9 -0.1 1.4
Total energy goods inputs to stage 4 intermediate demand. . . . . . . . . . . . . . . . . . 04/10 8.338 119.5 113.1 114.2 -1.0 1.0 -1.5 1.9 0.6
Total goods less foods and energy inputs to stage 4 intermediate demand. . . 04/10 38.694 107.4 107.3 107.7 1.1 0.4 0.0 0.1 0.3
Total goods inputs to stage 3 intermediate demand. . . . . . . . . . . . . . . . . . . . . . . . . 04/10 54.499 112.4 111.7 113.4 1.5 1.5 -0.1 0.3 1.5
Total services inputs to stage 3 intermediate demand. . . . . . . . . . . . . . . . . . . . . . . 04/10 44.998 105.9 105.9 106.7 0.9 0.8 0.1 0.0 0.3
Total construction inputs to stage 3 intermediate demand. . . . . . . . . . . . . . . . . . . 04/10 0.503 105.2 105.0 105.7 1.6 0.7 0.2 -0.2 0.2
Total foods inputs to stage 3 intermediate demand. . . . . . . . . . . . . . . . . . . . . . . . . . 04/10 11.819 126.4 127.8 133.3 4.5 4.3 -0.3 -0.3 5.0
Total energy goods inputs to stage 3 intermediate demand. . . . . . . . . . . . . . . . . . 04/10 11.140 116.7 111.0 113.1 1.0 1.9 -0.7 1.5 1.2
Total goods less foods and energy inputs to stage 3 intermediate demand. . . 04/10 31.541 106.4 106.8 107.1 0.6 0.3 0.2 0.0 0.3
Total goods inputs to stage 2 intermediate demand. . . . . . . . . . . . . . . . . . . . . . . . . 04/10 57.566 113.3 109.4 110.4 -0.7 0.9 -2.7 2.9 -0.1
Total services inputs to stage 2 intermediate demand. . . . . . . . . . . . . . . . . . . . . . . 04/10 41.782 105.9 105.6 105.9 0.5 0.3 -0.1 -0.2 0.4
Total construction inputs to stage 2 intermediate demand. . . . . . . . . . . . . . . . . . . 04/10 0.651 105.2 105.0 105.7 1.6 0.7 0.2 -0.2 0.2
Total foods inputs to stage 2 intermediate demand. . . . . . . . . . . . . . . . . . . . . . . . . . 04/10 2.715 143.3 132.6 131.8 -26.8 -0.6 -2.7 0.3 -1.2
Total energy goods inputs to stage 2 intermediate demand. . . . . . . . . . . . . . . . . . 04/10 25.093 114.8 108.5 110.0 4.2 1.4 -5.3 6.3 -0.8
Total goods less foods and energy inputs to stage 2 intermediate demand. . . 04/10 29.759 109.4 108.2 108.8 -1.4 0.6 -0.6 0.4 0.6
Total goods inputs to stage 1 intermediate demand. . . . . . . . . . . . . . . . . . . . . . . . . 04/10 57.889 106.8 105.0 107.1 0.8 2.0 0.0 0.7 1.8
Total services inputs to stage 1 intermediate demand. . . . . . . . . . . . . . . . . . . . . . . 04/10 42.063 109.1 109.7 109.8 2.5 0.1 0.1 0.2 -0.2
Total construction inputs to stage 1 intermediate demand. . . . . . . . . . . . . . . . . . . 04/10 0.049 107.7 106.8 106.8 0.2 0.0 -0.5 -0.4 -0.1
Total foods inputs to stage 1 intermediate demand. . . . . . . . . . . . . . . . . . . . . . . . . . 04/10 0.734 123.8 118.4 119.2 -5.9 0.7 -1.1 -0.8 0.1
Total energy goods inputs to stage 1 intermediate demand. . . . . . . . . . . . . . . . . . 04/10 24.054 113.3 107.7 110.9 2.5 3.0 -0.4 0.6 2.6
Total goods less foods and energy inputs to stage 1 intermediate demand. . . 04/10 33.102 101.2 102.2 103.6 -0.4 1.4 0.3 0.9 1.2
1 Further information about the Final Demand-Intermediate Demand Aggregation system is available online at http://www.bls.gov/ppi/fdidaggregation.htm2 Comprehensive relative importance figures are initially computed after the publication of December indexes and are recalculated after final December indexes are available. Individual
items and subtotals may not add exactly to totals because of rounding differences.3 The indexes for September 2013 have been recalculated to incorporate late reports and corrections by respondents. All indexes are subject to revision 4 months after original
publication.
″-″ Data not available.
24
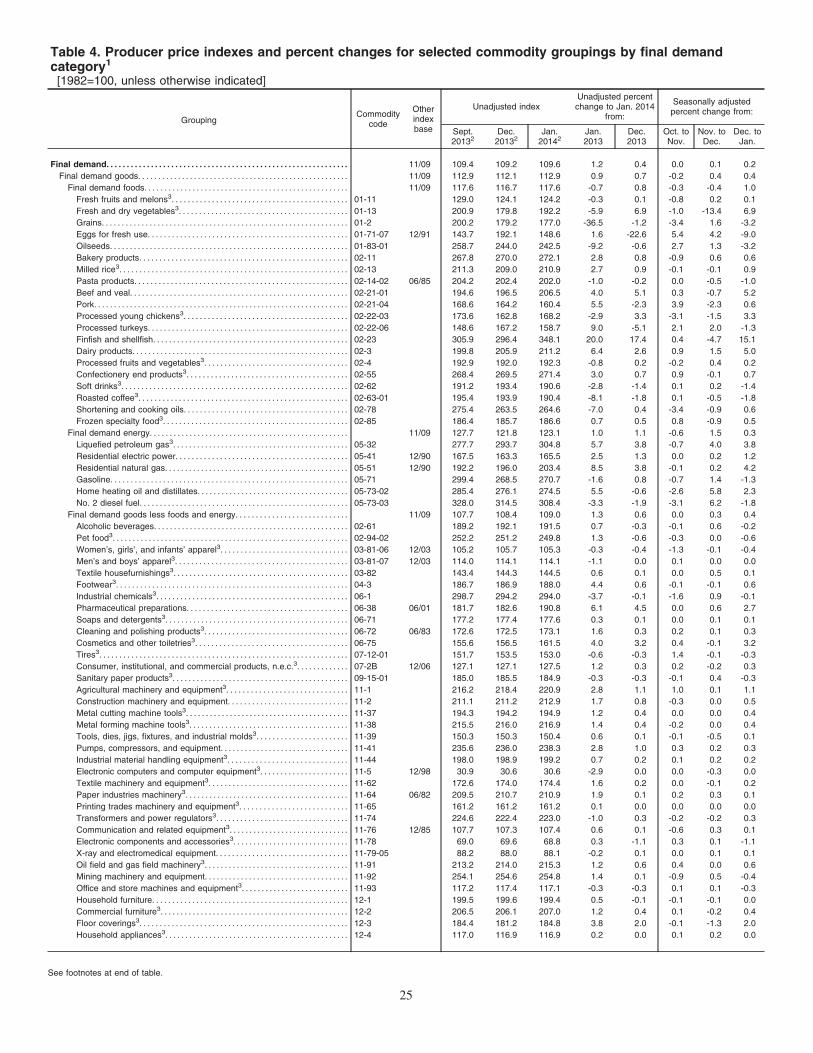
Table 4. Producer price indexes and percent changes for selected commodity groupings by final demandcategory1
[1982=100, unless otherwise indicated]
GroupingCommodity
code
Otherindexbase
Unadjusted indexUnadjusted percentchange to Jan. 2014
from:
Seasonally adjustedpercent change from:
Sept.20132
Dec.20132
Jan.20142
Jan.2013
Dec.2013
Oct. toNov.
Nov. toDec.
Dec. toJan.
Final demand. . . . . . . . . . . . . . . . . . . . . . . . . . . . . . . . . . . . . . . . . . . . . . . . . . . . . . . . . . . . 11/09 109.4 109.2 109.6 1.2 0.4 0.0 0.1 0.2
Final demand goods. . . . . . . . . . . . . . . . . . . . . . . . . . . . . . . . . . . . . . . . . . . . . . . . . . . . . 11/09 112.9 112.1 112.9 0.9 0.7 -0.2 0.4 0.4
Final demand foods. . . . . . . . . . . . . . . . . . . . . . . . . . . . . . . . . . . . . . . . . . . . . . . . . . . 11/09 117.6 116.7 117.6 -0.7 0.8 -0.3 -0.4 1.0
Fresh fruits and melons3. . . . . . . . . . . . . . . . . . . . . . . . . . . . . . . . . . . . . . . . . . . . 01-11 129.0 124.1 124.2 -0.3 0.1 -0.8 0.2 0.1
Fresh and dry vegetables3. . . . . . . . . . . . . . . . . . . . . . . . . . . . . . . . . . . . . . . . . . 01-13 200.9 179.8 192.2 -5.9 6.9 -1.0 -13.4 6.9
Grains. . . . . . . . . . . . . . . . . . . . . . . . . . . . . . . . . . . . . . . . . . . . . . . . . . . . . . . . . . . . . . 01-2 200.2 179.2 177.0 -36.5 -1.2 -3.4 1.6 -3.2
Eggs for fresh use. . . . . . . . . . . . . . . . . . . . . . . . . . . . . . . . . . . . . . . . . . . . . . . . . . 01-71-07 12/91 143.7 192.1 148.6 1.6 -22.6 5.4 4.2 -9.0
Oilseeds. . . . . . . . . . . . . . . . . . . . . . . . . . . . . . . . . . . . . . . . . . . . . . . . . . . . . . . . . . . . 01-83-01 258.7 244.0 242.5 -9.2 -0.6 2.7 1.3 -3.2
Bakery products. . . . . . . . . . . . . . . . . . . . . . . . . . . . . . . . . . . . . . . . . . . . . . . . . . . . 02-11 267.8 270.0 272.1 2.8 0.8 -0.9 0.6 0.6
Milled rice3. . . . . . . . . . . . . . . . . . . . . . . . . . . . . . . . . . . . . . . . . . . . . . . . . . . . . . . . . 02-13 211.3 209.0 210.9 2.7 0.9 -0.1 -0.1 0.9
Pasta products. . . . . . . . . . . . . . . . . . . . . . . . . . . . . . . . . . . . . . . . . . . . . . . . . . . . . 02-14-02 06/85 204.2 202.4 202.0 -1.0 -0.2 0.0 -0.5 -1.0
Beef and veal. . . . . . . . . . . . . . . . . . . . . . . . . . . . . . . . . . . . . . . . . . . . . . . . . . . . . . . 02-21-01 194.6 196.5 206.5 4.0 5.1 0.3 -0.7 5.2
Pork. . . . . . . . . . . . . . . . . . . . . . . . . . . . . . . . . . . . . . . . . . . . . . . . . . . . . . . . . . . . . . . . 02-21-04 168.6 164.2 160.4 5.5 -2.3 3.9 -2.3 0.6
Processed young chickens3. . . . . . . . . . . . . . . . . . . . . . . . . . . . . . . . . . . . . . . . . 02-22-03 173.6 162.8 168.2 -2.9 3.3 -3.1 -1.5 3.3
Processed turkeys. . . . . . . . . . . . . . . . . . . . . . . . . . . . . . . . . . . . . . . . . . . . . . . . . . 02-22-06 148.6 167.2 158.7 9.0 -5.1 2.1 2.0 -1.3
Finfish and shellfish. . . . . . . . . . . . . . . . . . . . . . . . . . . . . . . . . . . . . . . . . . . . . . . . . 02-23 305.9 296.4 348.1 20.0 17.4 0.4 -4.7 15.1
Dairy products. . . . . . . . . . . . . . . . . . . . . . . . . . . . . . . . . . . . . . . . . . . . . . . . . . . . . . 02-3 199.8 205.9 211.2 6.4 2.6 0.9 1.5 5.0
Processed fruits and vegetables3. . . . . . . . . . . . . . . . . . . . . . . . . . . . . . . . . . . . 02-4 192.9 192.0 192.3 -0.8 0.2 -0.2 0.4 0.2
Confectionery end products3. . . . . . . . . . . . . . . . . . . . . . . . . . . . . . . . . . . . . . . . 02-55 268.4 269.5 271.4 3.0 0.7 0.9 -0.1 0.7
Soft drinks3. . . . . . . . . . . . . . . . . . . . . . . . . . . . . . . . . . . . . . . . . . . . . . . . . . . . . . . . . 02-62 191.2 193.4 190.6 -2.8 -1.4 0.1 0.2 -1.4
Roasted coffee3. . . . . . . . . . . . . . . . . . . . . . . . . . . . . . . . . . . . . . . . . . . . . . . . . . . . 02-63-01 195.4 193.9 190.4 -8.1 -1.8 0.1 -0.5 -1.8
Shortening and cooking oils. . . . . . . . . . . . . . . . . . . . . . . . . . . . . . . . . . . . . . . . . 02-78 275.4 263.5 264.6 -7.0 0.4 -3.4 -0.9 0.6
Frozen specialty food3. . . . . . . . . . . . . . . . . . . . . . . . . . . . . . . . . . . . . . . . . . . . . . 02-85 186.4 185.7 186.6 0.7 0.5 0.8 -0.9 0.5
Final demand energy. . . . . . . . . . . . . . . . . . . . . . . . . . . . . . . . . . . . . . . . . . . . . . . . . . 11/09 127.7 121.8 123.1 1.0 1.1 -0.6 1.5 0.3
Liquefied petroleum gas3. . . . . . . . . . . . . . . . . . . . . . . . . . . . . . . . . . . . . . . . . . . . 05-32 277.7 293.7 304.8 5.7 3.8 -0.7 4.0 3.8
Residential electric power. . . . . . . . . . . . . . . . . . . . . . . . . . . . . . . . . . . . . . . . . . . 05-41 12/90 167.5 163.3 165.5 2.5 1.3 0.0 0.2 1.2
Residential natural gas. . . . . . . . . . . . . . . . . . . . . . . . . . . . . . . . . . . . . . . . . . . . . . 05-51 12/90 192.2 196.0 203.4 8.5 3.8 -0.1 0.2 4.2
Gasoline. . . . . . . . . . . . . . . . . . . . . . . . . . . . . . . . . . . . . . . . . . . . . . . . . . . . . . . . . . . 05-71 299.4 268.5 270.7 -1.6 0.8 -0.7 1.4 -1.3
Home heating oil and distillates. . . . . . . . . . . . . . . . . . . . . . . . . . . . . . . . . . . . . . 05-73-02 285.4 276.1 274.5 5.5 -0.6 -2.6 5.8 2.3
No. 2 diesel fuel. . . . . . . . . . . . . . . . . . . . . . . . . . . . . . . . . . . . . . . . . . . . . . . . . . . . 05-73-03 328.0 314.5 308.4 -3.3 -1.9 -3.1 6.2 -1.8
Final demand goods less foods and energy. . . . . . . . . . . . . . . . . . . . . . . . . . . . 11/09 107.7 108.4 109.0 1.3 0.6 0.0 0.3 0.4
Alcoholic beverages. . . . . . . . . . . . . . . . . . . . . . . . . . . . . . . . . . . . . . . . . . . . . . . . . 02-61 189.2 192.1 191.5 0.7 -0.3 -0.1 0.6 -0.2
Pet food3. . . . . . . . . . . . . . . . . . . . . . . . . . . . . . . . . . . . . . . . . . . . . . . . . . . . . . . . . . . 02-94-02 252.2 251.2 249.8 1.3 -0.6 -0.3 0.0 -0.6
Women’s, girls’, and infants’ apparel3. . . . . . . . . . . . . . . . . . . . . . . . . . . . . . . . 03-81-06 12/03 105.2 105.7 105.3 -0.3 -0.4 -1.3 -0.1 -0.4
Men’s and boys’ apparel3. . . . . . . . . . . . . . . . . . . . . . . . . . . . . . . . . . . . . . . . . . . 03-81-07 12/03 114.0 114.1 114.1 -1.1 0.0 0.1 0.0 0.0
Textile housefurnishings3. . . . . . . . . . . . . . . . . . . . . . . . . . . . . . . . . . . . . . . . . . . . 03-82 143.4 144.3 144.5 0.6 0.1 0.0 0.5 0.1
Footwear3. . . . . . . . . . . . . . . . . . . . . . . . . . . . . . . . . . . . . . . . . . . . . . . . . . . . . . . . . . 04-3 186.7 186.9 188.0 4.4 0.6 -0.1 -0.1 0.6
Industrial chemicals3. . . . . . . . . . . . . . . . . . . . . . . . . . . . . . . . . . . . . . . . . . . . . . . . 06-1 298.7 294.2 294.0 -3.7 -0.1 -1.6 0.9 -0.1
Pharmaceutical preparations. . . . . . . . . . . . . . . . . . . . . . . . . . . . . . . . . . . . . . . . 06-38 06/01 181.7 182.6 190.8 6.1 4.5 0.0 0.6 2.7
Soaps and detergents3. . . . . . . . . . . . . . . . . . . . . . . . . . . . . . . . . . . . . . . . . . . . . . 06-71 177.2 177.4 177.6 0.3 0.1 0.0 0.1 0.1
Cleaning and polishing products3. . . . . . . . . . . . . . . . . . . . . . . . . . . . . . . . . . . . 06-72 06/83 172.6 172.5 173.1 1.6 0.3 0.2 0.1 0.3
Cosmetics and other toiletries3. . . . . . . . . . . . . . . . . . . . . . . . . . . . . . . . . . . . . . 06-75 155.6 156.5 161.5 4.0 3.2 0.4 -0.1 3.2
Tires3. . . . . . . . . . . . . . . . . . . . . . . . . . . . . . . . . . . . . . . . . . . . . . . . . . . . . . . . . . . . . . 07-12-01 151.7 153.5 153.0 -0.6 -0.3 1.4 -0.1 -0.3
Consumer, institutional, and commercial products, n.e.c.3. . . . . . . . . . . . . 07-2B 12/06 127.1 127.1 127.5 1.2 0.3 0.2 -0.2 0.3
Sanitary paper products3. . . . . . . . . . . . . . . . . . . . . . . . . . . . . . . . . . . . . . . . . . . . 09-15-01 185.0 185.5 184.9 -0.3 -0.3 -0.1 0.4 -0.3
Agricultural machinery and equipment3. . . . . . . . . . . . . . . . . . . . . . . . . . . . . . 11-1 216.2 218.4 220.9 2.8 1.1 1.0 0.1 1.1
Construction machinery and equipment. . . . . . . . . . . . . . . . . . . . . . . . . . . . . . 11-2 211.1 211.2 212.9 1.7 0.8 -0.3 0.0 0.5
Metal cutting machine tools3. . . . . . . . . . . . . . . . . . . . . . . . . . . . . . . . . . . . . . . . . 11-37 194.3 194.2 194.9 1.2 0.4 0.0 0.0 0.4
Metal forming machine tools3. . . . . . . . . . . . . . . . . . . . . . . . . . . . . . . . . . . . . . . . 11-38 215.5 216.0 216.9 1.4 0.4 -0.2 0.0 0.4
Tools, dies, jigs, fixtures, and industrial molds3. . . . . . . . . . . . . . . . . . . . . . . 11-39 150.3 150.3 150.4 0.6 0.1 -0.1 -0.5 0.1
Pumps, compressors, and equipment. . . . . . . . . . . . . . . . . . . . . . . . . . . . . . . . 11-41 235.6 236.0 238.3 2.8 1.0 0.3 0.2 0.3
Industrial material handling equipment3. . . . . . . . . . . . . . . . . . . . . . . . . . . . . . 11-44 198.0 198.9 199.2 0.7 0.2 0.1 0.2 0.2
Electronic computers and computer equipment3. . . . . . . . . . . . . . . . . . . . . . 11-5 12/98 30.9 30.6 30.6 -2.9 0.0 0.0 -0.3 0.0
Textile machinery and equipment3. . . . . . . . . . . . . . . . . . . . . . . . . . . . . . . . . . . 11-62 172.6 174.0 174.4 1.6 0.2 0.0 -0.1 0.2
Paper industries machinery3. . . . . . . . . . . . . . . . . . . . . . . . . . . . . . . . . . . . . . . . . 11-64 06/82 209.5 210.7 210.9 1.9 0.1 0.2 0.3 0.1
Printing trades machinery and equipment3. . . . . . . . . . . . . . . . . . . . . . . . . . . 11-65 161.2 161.2 161.2 0.1 0.0 0.0 0.0 0.0
Transformers and power regulators3. . . . . . . . . . . . . . . . . . . . . . . . . . . . . . . . . 11-74 224.6 222.4 223.0 -1.0 0.3 -0.2 -0.2 0.3
Communication and related equipment3. . . . . . . . . . . . . . . . . . . . . . . . . . . . . . 11-76 12/85 107.7 107.3 107.4 0.6 0.1 -0.6 0.3 0.1
Electronic components and accessories3. . . . . . . . . . . . . . . . . . . . . . . . . . . . . 11-78 69.0 69.6 68.8 0.3 -1.1 0.3 0.1 -1.1
X-ray and electromedical equipment. . . . . . . . . . . . . . . . . . . . . . . . . . . . . . . . . 11-79-05 88.2 88.0 88.1 -0.2 0.1 0.0 0.1 0.1
Oil field and gas field machinery3. . . . . . . . . . . . . . . . . . . . . . . . . . . . . . . . . . . . 11-91 213.2 214.0 215.3 1.2 0.6 0.4 0.0 0.6
Mining machinery and equipment. . . . . . . . . . . . . . . . . . . . . . . . . . . . . . . . . . . . 11-92 254.1 254.6 254.8 1.4 0.1 -0.9 0.5 -0.4
Office and store machines and equipment3. . . . . . . . . . . . . . . . . . . . . . . . . . . 11-93 117.2 117.4 117.1 -0.3 -0.3 0.1 0.1 -0.3
Household furniture. . . . . . . . . . . . . . . . . . . . . . . . . . . . . . . . . . . . . . . . . . . . . . . . . 12-1 199.5 199.6 199.4 0.5 -0.1 -0.1 -0.1 0.0
Commercial furniture3. . . . . . . . . . . . . . . . . . . . . . . . . . . . . . . . . . . . . . . . . . . . . . . 12-2 206.5 206.1 207.0 1.2 0.4 0.1 -0.2 0.4
Floor coverings3. . . . . . . . . . . . . . . . . . . . . . . . . . . . . . . . . . . . . . . . . . . . . . . . . . . . 12-3 184.4 181.2 184.8 3.8 2.0 -0.1 -1.3 2.0
Household appliances3. . . . . . . . . . . . . . . . . . . . . . . . . . . . . . . . . . . . . . . . . . . . . . 12-4 117.0 116.9 116.9 0.2 0.0 0.1 0.2 0.0
See footnotes at end of table.
25
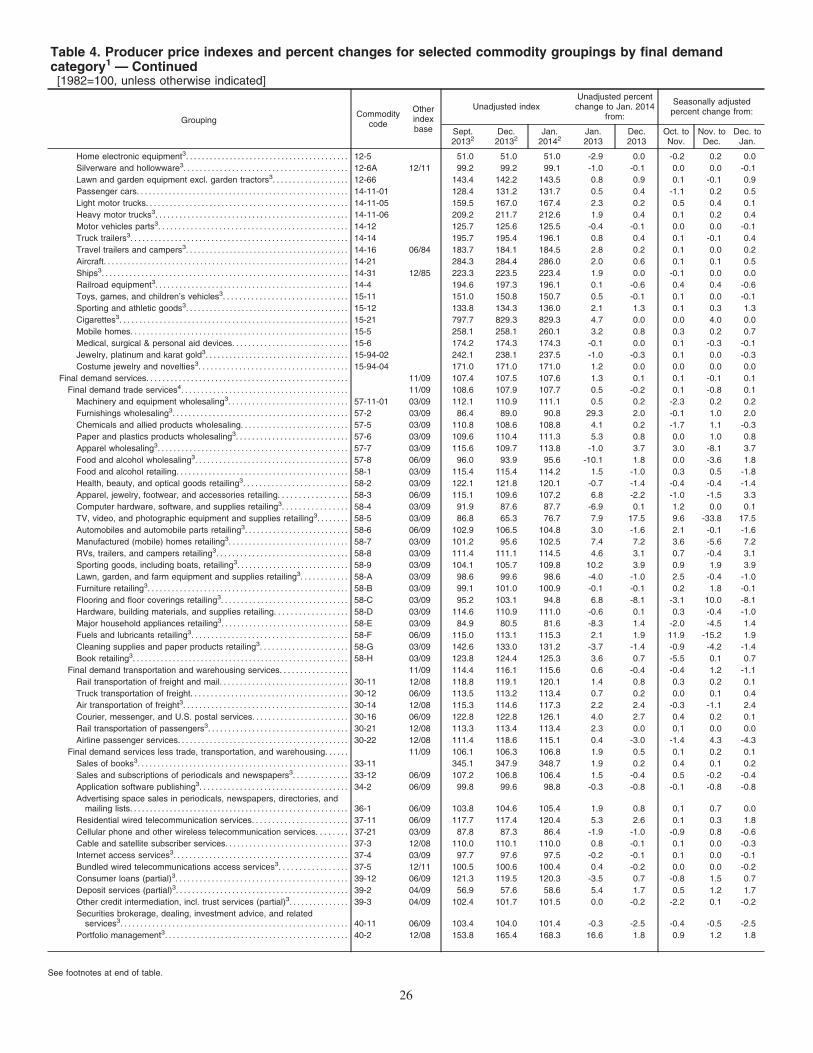
Table 4. Producer price indexes and percent changes for selected commodity groupings by final demandcategory1 — Continued[1982=100, unless otherwise indicated]
GroupingCommodity
code
Otherindexbase
Unadjusted indexUnadjusted percentchange to Jan. 2014
from:
Seasonally adjustedpercent change from:
Sept.20132
Dec.20132
Jan.20142
Jan.2013
Dec.2013
Oct. toNov.
Nov. toDec.
Dec. toJan.
Home electronic equipment3. . . . . . . . . . . . . . . . . . . . . . . . . . . . . . . . . . . . . . . . . 12-5 51.0 51.0 51.0 -2.9 0.0 -0.2 0.2 0.0
Silverware and hollowware3. . . . . . . . . . . . . . . . . . . . . . . . . . . . . . . . . . . . . . . . . 12-6A 12/11 99.2 99.2 99.1 -1.0 -0.1 0.0 0.0 -0.1
Lawn and garden equipment excl. garden tractors3. . . . . . . . . . . . . . . . . . . 12-66 143.4 142.2 143.5 0.8 0.9 0.1 -0.1 0.9
Passenger cars. . . . . . . . . . . . . . . . . . . . . . . . . . . . . . . . . . . . . . . . . . . . . . . . . . . . . 14-11-01 128.4 131.2 131.7 0.5 0.4 -1.1 0.2 0.5
Light motor trucks. . . . . . . . . . . . . . . . . . . . . . . . . . . . . . . . . . . . . . . . . . . . . . . . . . . 14-11-05 159.5 167.0 167.4 2.3 0.2 0.5 0.4 0.1
Heavy motor trucks3. . . . . . . . . . . . . . . . . . . . . . . . . . . . . . . . . . . . . . . . . . . . . . . . 14-11-06 209.2 211.7 212.6 1.9 0.4 0.1 0.2 0.4
Motor vehicles parts3. . . . . . . . . . . . . . . . . . . . . . . . . . . . . . . . . . . . . . . . . . . . . . . 14-12 125.7 125.6 125.5 -0.4 -0.1 0.0 0.0 -0.1
Truck trailers3. . . . . . . . . . . . . . . . . . . . . . . . . . . . . . . . . . . . . . . . . . . . . . . . . . . . . . 14-14 195.7 195.4 196.1 0.8 0.4 0.1 -0.1 0.4
Travel trailers and campers3. . . . . . . . . . . . . . . . . . . . . . . . . . . . . . . . . . . . . . . . . 14-16 06/84 183.7 184.1 184.5 2.8 0.2 0.1 0.0 0.2
Aircraft. . . . . . . . . . . . . . . . . . . . . . . . . . . . . . . . . . . . . . . . . . . . . . . . . . . . . . . . . . . . . 14-21 284.3 284.4 286.0 2.0 0.6 0.1 0.1 0.5
Ships3. . . . . . . . . . . . . . . . . . . . . . . . . . . . . . . . . . . . . . . . . . . . . . . . . . . . . . . . . . . . . . 14-31 12/85 223.3 223.5 223.4 1.9 0.0 -0.1 0.0 0.0
Railroad equipment3. . . . . . . . . . . . . . . . . . . . . . . . . . . . . . . . . . . . . . . . . . . . . . . . 14-4 194.6 197.3 196.1 0.1 -0.6 0.4 0.4 -0.6
Toys, games, and children’s vehicles3. . . . . . . . . . . . . . . . . . . . . . . . . . . . . . . 15-11 151.0 150.8 150.7 0.5 -0.1 0.1 0.0 -0.1
Sporting and athletic goods3. . . . . . . . . . . . . . . . . . . . . . . . . . . . . . . . . . . . . . . . . 15-12 133.8 134.3 136.0 2.1 1.3 0.1 0.3 1.3
Cigarettes3. . . . . . . . . . . . . . . . . . . . . . . . . . . . . . . . . . . . . . . . . . . . . . . . . . . . . . . . . 15-21 797.7 829.3 829.3 4.7 0.0 0.0 4.0 0.0
Mobile homes. . . . . . . . . . . . . . . . . . . . . . . . . . . . . . . . . . . . . . . . . . . . . . . . . . . . . . 15-5 258.1 258.1 260.1 3.2 0.8 0.3 0.2 0.7
Medical, surgical & personal aid devices. . . . . . . . . . . . . . . . . . . . . . . . . . . . . 15-6 174.2 174.3 174.3 -0.1 0.0 0.1 -0.3 -0.1
Jewelry, platinum and karat gold3. . . . . . . . . . . . . . . . . . . . . . . . . . . . . . . . . . . . 15-94-02 242.1 238.1 237.5 -1.0 -0.3 0.1 0.0 -0.3
Costume jewelry and novelties3. . . . . . . . . . . . . . . . . . . . . . . . . . . . . . . . . . . . . 15-94-04 171.0 171.0 171.0 1.2 0.0 0.0 0.0 0.0
Final demand services. . . . . . . . . . . . . . . . . . . . . . . . . . . . . . . . . . . . . . . . . . . . . . . . . . 11/09 107.4 107.5 107.6 1.3 0.1 0.1 -0.1 0.1
Final demand trade services4. . . . . . . . . . . . . . . . . . . . . . . . . . . . . . . . . . . . . . . . . . 11/09 108.6 107.9 107.7 0.5 -0.2 0.1 -0.8 0.1
Machinery and equipment wholesaling3. . . . . . . . . . . . . . . . . . . . . . . . . . . . . . 57-11-01 03/09 112.1 110.9 111.1 0.5 0.2 -2.3 0.2 0.2
Furnishings wholesaling3. . . . . . . . . . . . . . . . . . . . . . . . . . . . . . . . . . . . . . . . . . . . 57-2 03/09 86.4 89.0 90.8 29.3 2.0 -0.1 1.0 2.0
Chemicals and allied products wholesaling. . . . . . . . . . . . . . . . . . . . . . . . . . . 57-5 03/09 110.8 108.6 108.8 4.1 0.2 -1.7 1.1 -0.3
Paper and plastics products wholesaling3. . . . . . . . . . . . . . . . . . . . . . . . . . . . 57-6 03/09 109.6 110.4 111.3 5.3 0.8 0.0 1.0 0.8
Apparel wholesaling3. . . . . . . . . . . . . . . . . . . . . . . . . . . . . . . . . . . . . . . . . . . . . . . . 57-7 03/09 115.6 109.7 113.8 -1.0 3.7 3.0 -8.1 3.7
Food and alcohol wholesaling3. . . . . . . . . . . . . . . . . . . . . . . . . . . . . . . . . . . . . . 57-8 06/09 96.0 93.9 95.6 -10.1 1.8 0.0 -3.6 1.8
Food and alcohol retailing. . . . . . . . . . . . . . . . . . . . . . . . . . . . . . . . . . . . . . . . . . . 58-1 03/09 115.4 115.4 114.2 1.5 -1.0 0.3 0.5 -1.8
Health, beauty, and optical goods retailing3. . . . . . . . . . . . . . . . . . . . . . . . . . 58-2 03/09 122.1 121.8 120.1 -0.7 -1.4 -0.4 -0.4 -1.4
Apparel, jewelry, footwear, and accessories retailing. . . . . . . . . . . . . . . . . 58-3 06/09 115.1 109.6 107.2 6.8 -2.2 -1.0 -1.5 3.3
Computer hardware, software, and supplies retailing3. . . . . . . . . . . . . . . . 58-4 03/09 91.9 87.6 87.7 -6.9 0.1 1.2 0.0 0.1
TV, video, and photographic equipment and supplies retailing3. . . . . . . . 58-5 03/09 86.8 65.3 76.7 7.9 17.5 9.6 -33.8 17.5
Automobiles and automobile parts retailing3. . . . . . . . . . . . . . . . . . . . . . . . . . 58-6 06/09 102.9 106.5 104.8 3.0 -1.6 2.1 -0.1 -1.6
Manufactured (mobile) homes retailing3. . . . . . . . . . . . . . . . . . . . . . . . . . . . . . 58-7 03/09 101.2 95.6 102.5 7.4 7.2 3.6 -5.6 7.2
RVs, trailers, and campers retailing3. . . . . . . . . . . . . . . . . . . . . . . . . . . . . . . . . 58-8 03/09 111.4 111.1 114.5 4.6 3.1 0.7 -0.4 3.1
Sporting goods, including boats, retailing3. . . . . . . . . . . . . . . . . . . . . . . . . . . . 58-9 03/09 104.1 105.7 109.8 10.2 3.9 0.9 1.9 3.9
Lawn, garden, and farm equipment and supplies retailing3. . . . . . . . . . . . 58-A 03/09 98.6 99.6 98.6 -4.0 -1.0 2.5 -0.4 -1.0
Furniture retailing3. . . . . . . . . . . . . . . . . . . . . . . . . . . . . . . . . . . . . . . . . . . . . . . . . . 58-B 03/09 99.1 101.0 100.9 -0.1 -0.1 0.2 1.8 -0.1
Flooring and floor coverings retailing3. . . . . . . . . . . . . . . . . . . . . . . . . . . . . . . . 58-C 03/09 95.2 103.1 94.8 6.8 -8.1 -3.1 10.0 -8.1
Hardware, building materials, and supplies retailing. . . . . . . . . . . . . . . . . . 58-D 03/09 114.6 110.9 111.0 -0.6 0.1 0.3 -0.4 -1.0
Major household appliances retailing3. . . . . . . . . . . . . . . . . . . . . . . . . . . . . . . . 58-E 03/09 84.9 80.5 81.6 -8.3 1.4 -2.0 -4.5 1.4
Fuels and lubricants retailing3. . . . . . . . . . . . . . . . . . . . . . . . . . . . . . . . . . . . . . . 58-F 06/09 115.0 113.1 115.3 2.1 1.9 11.9 -15.2 1.9
Cleaning supplies and paper products retailing3. . . . . . . . . . . . . . . . . . . . . . 58-G 03/09 142.6 133.0 131.2 -3.7 -1.4 -0.9 -4.2 -1.4
Book retailing3. . . . . . . . . . . . . . . . . . . . . . . . . . . . . . . . . . . . . . . . . . . . . . . . . . . . . . 58-H 03/09 123.8 124.4 125.3 3.6 0.7 -5.5 0.1 0.7
Final demand transportation and warehousing services. . . . . . . . . . . . . . . . . 11/09 114.4 116.1 115.6 0.6 -0.4 -0.4 1.2 -1.1
Rail transportation of freight and mail. . . . . . . . . . . . . . . . . . . . . . . . . . . . . . . . 30-11 12/08 118.8 119.1 120.1 1.4 0.8 0.3 0.2 0.1
Truck transportation of freight. . . . . . . . . . . . . . . . . . . . . . . . . . . . . . . . . . . . . . . 30-12 06/09 113.5 113.2 113.4 0.7 0.2 0.0 0.1 0.4
Air transportation of freight3. . . . . . . . . . . . . . . . . . . . . . . . . . . . . . . . . . . . . . . . . 30-14 12/08 115.3 114.6 117.3 2.2 2.4 -0.3 -1.1 2.4
Courier, messenger, and U.S. postal services. . . . . . . . . . . . . . . . . . . . . . . . 30-16 06/09 122.8 122.8 126.1 4.0 2.7 0.4 0.2 0.1
Rail transportation of passengers3. . . . . . . . . . . . . . . . . . . . . . . . . . . . . . . . . . . 30-21 12/08 113.3 113.4 113.4 2.3 0.0 0.1 0.0 0.0
Airline passenger services. . . . . . . . . . . . . . . . . . . . . . . . . . . . . . . . . . . . . . . . . . . 30-22 12/08 111.4 118.6 115.1 0.4 -3.0 -1.4 4.3 -4.3
Final demand services less trade, transportation, and warehousing. . . . . . 11/09 106.1 106.3 106.8 1.9 0.5 0.1 0.2 0.1
Sales of books3. . . . . . . . . . . . . . . . . . . . . . . . . . . . . . . . . . . . . . . . . . . . . . . . . . . . . 33-11 345.1 347.9 348.7 1.9 0.2 0.4 0.1 0.2
Sales and subscriptions of periodicals and newspapers3. . . . . . . . . . . . . . 33-12 06/09 107.2 106.8 106.4 1.5 -0.4 0.5 -0.2 -0.4
Application software publishing3. . . . . . . . . . . . . . . . . . . . . . . . . . . . . . . . . . . . . 34-2 06/09 99.8 99.6 98.8 -0.3 -0.8 -0.1 -0.8 -0.8
Advertising space sales in periodicals, newspapers, directories, andmailing lists. . . . . . . . . . . . . . . . . . . . . . . . . . . . . . . . . . . . . . . . . . . . . . . . . . . . . . . 36-1 06/09 103.8 104.6 105.4 1.9 0.8 0.1 0.7 0.0
Residential wired telecommunication services. . . . . . . . . . . . . . . . . . . . . . . . 37-11 06/09 117.7 117.4 120.4 5.3 2.6 0.1 0.3 1.8
Cellular phone and other wireless telecommunication services. . . . . . . . 37-21 03/09 87.8 87.3 86.4 -1.9 -1.0 -0.9 0.8 -0.6
Cable and satellite subscriber services. . . . . . . . . . . . . . . . . . . . . . . . . . . . . . . 37-3 12/08 110.0 110.1 110.0 0.8 -0.1 0.1 0.0 -0.3
Internet access services3. . . . . . . . . . . . . . . . . . . . . . . . . . . . . . . . . . . . . . . . . . . . 37-4 03/09 97.7 97.6 97.5 -0.2 -0.1 0.1 0.0 -0.1
Bundled wired telecommunications access services3. . . . . . . . . . . . . . . . . 37-5 12/11 100.5 100.6 100.4 0.4 -0.2 0.0 0.0 -0.2
Consumer loans (partial)3. . . . . . . . . . . . . . . . . . . . . . . . . . . . . . . . . . . . . . . . . . . 39-12 06/09 121.3 119.5 120.3 -3.5 0.7 -0.8 1.5 0.7
Deposit services (partial)3. . . . . . . . . . . . . . . . . . . . . . . . . . . . . . . . . . . . . . . . . . . 39-2 04/09 56.9 57.6 58.6 5.4 1.7 0.5 1.2 1.7
Other credit intermediation, incl. trust services (partial)3. . . . . . . . . . . . . . . 39-3 04/09 102.4 101.7 101.5 0.0 -0.2 -2.2 0.1 -0.2
Securities brokerage, dealing, investment advice, and relatedservices3. . . . . . . . . . . . . . . . . . . . . . . . . . . . . . . . . . . . . . . . . . . . . . . . . . . . . . . . . 40-11 06/09 103.4 104.0 101.4 -0.3 -2.5 -0.4 -0.5 -2.5
Portfolio management3. . . . . . . . . . . . . . . . . . . . . . . . . . . . . . . . . . . . . . . . . . . . . . 40-2 12/08 153.8 165.4 168.3 16.6 1.8 0.9 1.2 1.8
See footnotes at end of table.
26
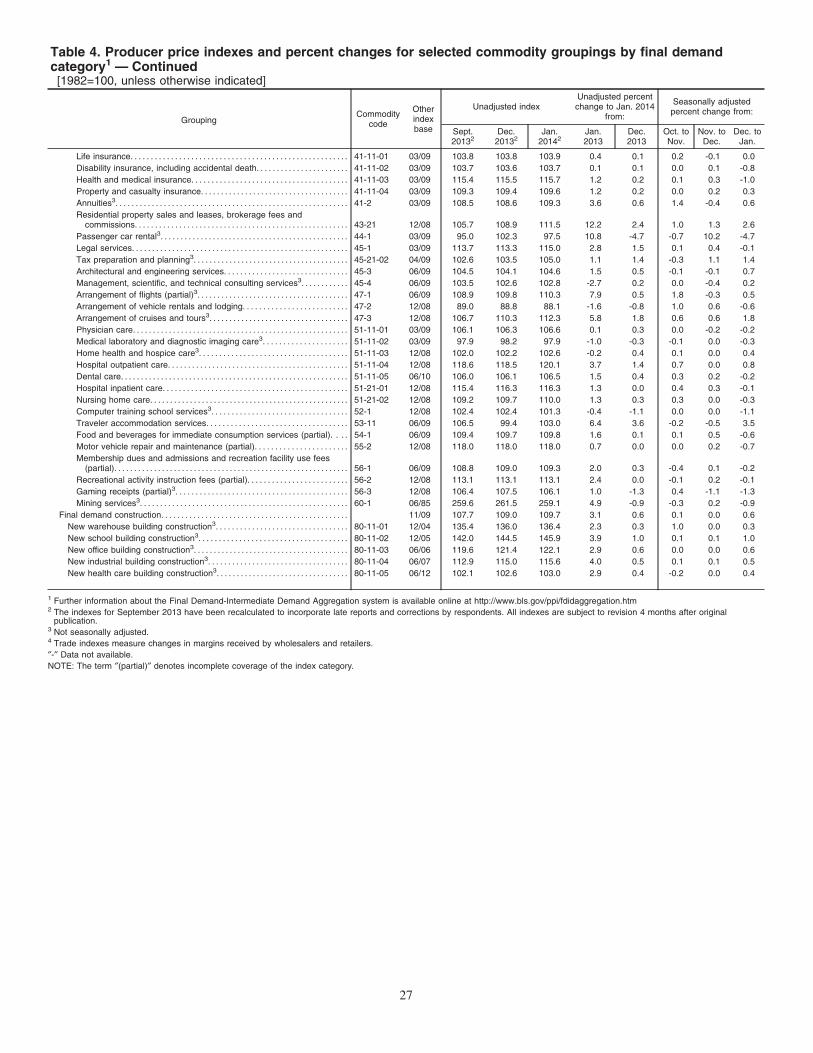
Table 4. Producer price indexes and percent changes for selected commodity groupings by final demandcategory1 — Continued[1982=100, unless otherwise indicated]
GroupingCommodity
code
Otherindexbase
Unadjusted indexUnadjusted percentchange to Jan. 2014
from:
Seasonally adjustedpercent change from:
Sept.20132
Dec.20132
Jan.20142
Jan.2013
Dec.2013
Oct. toNov.
Nov. toDec.
Dec. toJan.
Life insurance. . . . . . . . . . . . . . . . . . . . . . . . . . . . . . . . . . . . . . . . . . . . . . . . . . . . . . 41-11-01 03/09 103.8 103.8 103.9 0.4 0.1 0.2 -0.1 0.0
Disability insurance, including accidental death. . . . . . . . . . . . . . . . . . . . . . . 41-11-02 03/09 103.7 103.6 103.7 0.1 0.1 0.0 0.1 -0.8
Health and medical insurance. . . . . . . . . . . . . . . . . . . . . . . . . . . . . . . . . . . . . . . 41-11-03 03/09 115.4 115.5 115.7 1.2 0.2 0.1 0.3 -1.0
Property and casualty insurance. . . . . . . . . . . . . . . . . . . . . . . . . . . . . . . . . . . . . 41-11-04 03/09 109.3 109.4 109.6 1.2 0.2 0.0 0.2 0.3
Annuities3. . . . . . . . . . . . . . . . . . . . . . . . . . . . . . . . . . . . . . . . . . . . . . . . . . . . . . . . . . 41-2 03/09 108.5 108.6 109.3 3.6 0.6 1.4 -0.4 0.6
Residential property sales and leases, brokerage fees andcommissions. . . . . . . . . . . . . . . . . . . . . . . . . . . . . . . . . . . . . . . . . . . . . . . . . . . . . 43-21 12/08 105.7 108.9 111.5 12.2 2.4 1.0 1.3 2.6
Passenger car rental3. . . . . . . . . . . . . . . . . . . . . . . . . . . . . . . . . . . . . . . . . . . . . . . 44-1 03/09 95.0 102.3 97.5 10.8 -4.7 -0.7 10.2 -4.7
Legal services. . . . . . . . . . . . . . . . . . . . . . . . . . . . . . . . . . . . . . . . . . . . . . . . . . . . . . 45-1 03/09 113.7 113.3 115.0 2.8 1.5 0.1 0.4 -0.1
Tax preparation and planning3. . . . . . . . . . . . . . . . . . . . . . . . . . . . . . . . . . . . . . . 45-21-02 04/09 102.6 103.5 105.0 1.1 1.4 -0.3 1.1 1.4
Architectural and engineering services. . . . . . . . . . . . . . . . . . . . . . . . . . . . . . . 45-3 06/09 104.5 104.1 104.6 1.5 0.5 -0.1 -0.1 0.7
Management, scientific, and technical consulting services3. . . . . . . . . . . . 45-4 06/09 103.5 102.6 102.8 -2.7 0.2 0.0 -0.4 0.2
Arrangement of flights (partial)3. . . . . . . . . . . . . . . . . . . . . . . . . . . . . . . . . . . . . . 47-1 06/09 108.9 109.8 110.3 7.9 0.5 1.8 -0.3 0.5
Arrangement of vehicle rentals and lodging. . . . . . . . . . . . . . . . . . . . . . . . . . 47-2 12/08 89.0 88.8 88.1 -1.6 -0.8 1.0 0.6 -0.6
Arrangement of cruises and tours3. . . . . . . . . . . . . . . . . . . . . . . . . . . . . . . . . . . 47-3 12/08 106.7 110.3 112.3 5.8 1.8 0.6 0.6 1.8
Physician care. . . . . . . . . . . . . . . . . . . . . . . . . . . . . . . . . . . . . . . . . . . . . . . . . . . . . . 51-11-01 03/09 106.1 106.3 106.6 0.1 0.3 0.0 -0.2 -0.2
Medical laboratory and diagnostic imaging care3. . . . . . . . . . . . . . . . . . . . . 51-11-02 03/09 97.9 98.2 97.9 -1.0 -0.3 -0.1 0.0 -0.3
Home health and hospice care3. . . . . . . . . . . . . . . . . . . . . . . . . . . . . . . . . . . . . 51-11-03 12/08 102.0 102.2 102.6 -0.2 0.4 0.1 0.0 0.4
Hospital outpatient care. . . . . . . . . . . . . . . . . . . . . . . . . . . . . . . . . . . . . . . . . . . . . 51-11-04 12/08 118.6 118.5 120.1 3.7 1.4 0.7 0.0 0.8
Dental care. . . . . . . . . . . . . . . . . . . . . . . . . . . . . . . . . . . . . . . . . . . . . . . . . . . . . . . . . 51-11-05 06/10 106.0 106.1 106.5 1.5 0.4 0.3 0.2 -0.2
Hospital inpatient care. . . . . . . . . . . . . . . . . . . . . . . . . . . . . . . . . . . . . . . . . . . . . . 51-21-01 12/08 115.4 116.3 116.3 1.3 0.0 0.4 0.3 -0.1
Nursing home care. . . . . . . . . . . . . . . . . . . . . . . . . . . . . . . . . . . . . . . . . . . . . . . . . . 51-21-02 12/08 109.2 109.7 110.0 1.3 0.3 0.3 0.0 -0.3
Computer training school services3. . . . . . . . . . . . . . . . . . . . . . . . . . . . . . . . . . 52-1 12/08 102.4 102.4 101.3 -0.4 -1.1 0.0 0.0 -1.1
Traveler accommodation services. . . . . . . . . . . . . . . . . . . . . . . . . . . . . . . . . . . 53-11 06/09 106.5 99.4 103.0 6.4 3.6 -0.2 -0.5 3.5
Food and beverages for immediate consumption services (partial). . . . 54-1 06/09 109.4 109.7 109.8 1.6 0.1 0.1 0.5 -0.6
Motor vehicle repair and maintenance (partial). . . . . . . . . . . . . . . . . . . . . . . 55-2 12/08 118.0 118.0 118.0 0.7 0.0 0.0 0.2 -0.7
Membership dues and admissions and recreation facility use fees(partial). . . . . . . . . . . . . . . . . . . . . . . . . . . . . . . . . . . . . . . . . . . . . . . . . . . . . . . . . . . 56-1 06/09 108.8 109.0 109.3 2.0 0.3 -0.4 0.1 -0.2
Recreational activity instruction fees (partial). . . . . . . . . . . . . . . . . . . . . . . . . 56-2 12/08 113.1 113.1 113.1 2.4 0.0 -0.1 0.2 -0.1
Gaming receipts (partial)3. . . . . . . . . . . . . . . . . . . . . . . . . . . . . . . . . . . . . . . . . . . 56-3 12/08 106.4 107.5 106.1 1.0 -1.3 0.4 -1.1 -1.3
Mining services3. . . . . . . . . . . . . . . . . . . . . . . . . . . . . . . . . . . . . . . . . . . . . . . . . . . . 60-1 06/85 259.6 261.5 259.1 4.9 -0.9 -0.3 0.2 -0.9
Final demand construction. . . . . . . . . . . . . . . . . . . . . . . . . . . . . . . . . . . . . . . . . . . . . . . 11/09 107.7 109.0 109.7 3.1 0.6 0.1 0.0 0.6
New warehouse building construction3. . . . . . . . . . . . . . . . . . . . . . . . . . . . . . . . . 80-11-01 12/04 135.4 136.0 136.4 2.3 0.3 1.0 0.0 0.3
New school building construction3. . . . . . . . . . . . . . . . . . . . . . . . . . . . . . . . . . . . . 80-11-02 12/05 142.0 144.5 145.9 3.9 1.0 0.1 0.1 1.0
New office building construction3. . . . . . . . . . . . . . . . . . . . . . . . . . . . . . . . . . . . . . . 80-11-03 06/06 119.6 121.4 122.1 2.9 0.6 0.0 0.0 0.6
New industrial building construction3. . . . . . . . . . . . . . . . . . . . . . . . . . . . . . . . . . . 80-11-04 06/07 112.9 115.0 115.6 4.0 0.5 0.1 0.1 0.5
New health care building construction3. . . . . . . . . . . . . . . . . . . . . . . . . . . . . . . . . 80-11-05 06/12 102.1 102.6 103.0 2.9 0.4 -0.2 0.0 0.4
1 Further information about the Final Demand-Intermediate Demand Aggregation system is available online at http://www.bls.gov/ppi/fdidaggregation.htm2 The indexes for September 2013 have been recalculated to incorporate late reports and corrections by respondents. All indexes are subject to revision 4 months after original
publication.3 Not seasonally adjusted.4 Trade indexes measure changes in margins received by wholesalers and retailers.
″-″ Data not available.
NOTE: The term ″(partial)″ denotes incomplete coverage of the index category.
27
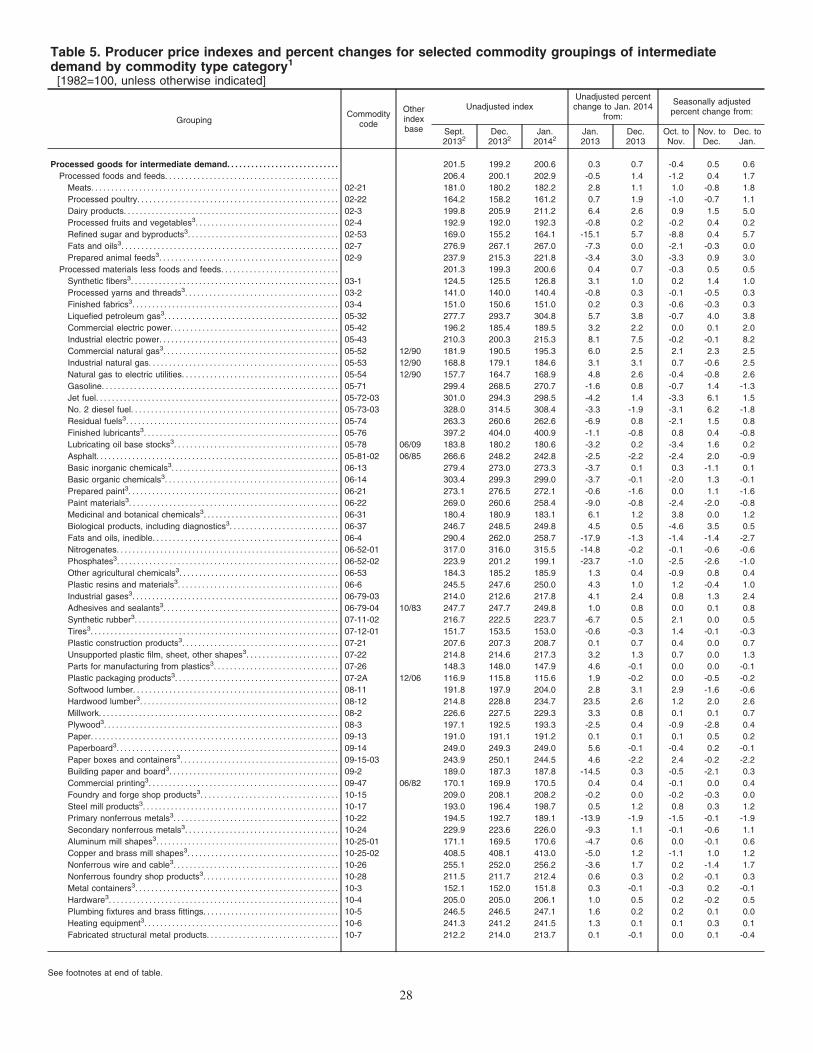
Table 5. Producer price indexes and percent changes for selected commodity groupings of intermediatedemand by commodity type category1
[1982=100, unless otherwise indicated]
GroupingCommodity
code
Otherindexbase
Unadjusted indexUnadjusted percentchange to Jan. 2014
from:
Seasonally adjustedpercent change from:
Sept.20132
Dec.20132
Jan.20142
Jan.2013
Dec.2013
Oct. toNov.
Nov. toDec.
Dec. toJan.
Processed goods for intermediate demand. . . . . . . . . . . . . . . . . . . . . . . . . . . . 201.5 199.2 200.6 0.3 0.7 -0.4 0.5 0.6
Processed foods and feeds. . . . . . . . . . . . . . . . . . . . . . . . . . . . . . . . . . . . . . . . . . . 206.4 200.1 202.9 -0.5 1.4 -1.2 0.4 1.7
Meats. . . . . . . . . . . . . . . . . . . . . . . . . . . . . . . . . . . . . . . . . . . . . . . . . . . . . . . . . . . . . . 02-21 181.0 180.2 182.2 2.8 1.1 1.0 -0.8 1.8
Processed poultry. . . . . . . . . . . . . . . . . . . . . . . . . . . . . . . . . . . . . . . . . . . . . . . . . . 02-22 164.2 158.2 161.2 0.7 1.9 -1.0 -0.7 1.1
Dairy products. . . . . . . . . . . . . . . . . . . . . . . . . . . . . . . . . . . . . . . . . . . . . . . . . . . . . . 02-3 199.8 205.9 211.2 6.4 2.6 0.9 1.5 5.0
Processed fruits and vegetables3. . . . . . . . . . . . . . . . . . . . . . . . . . . . . . . . . . . . 02-4 192.9 192.0 192.3 -0.8 0.2 -0.2 0.4 0.2
Refined sugar and byproducts3. . . . . . . . . . . . . . . . . . . . . . . . . . . . . . . . . . . . . . 02-53 169.0 155.2 164.1 -15.1 5.7 -8.8 0.4 5.7
Fats and oils3. . . . . . . . . . . . . . . . . . . . . . . . . . . . . . . . . . . . . . . . . . . . . . . . . . . . . . 02-7 276.9 267.1 267.0 -7.3 0.0 -2.1 -0.3 0.0
Prepared animal feeds3. . . . . . . . . . . . . . . . . . . . . . . . . . . . . . . . . . . . . . . . . . . . . 02-9 237.9 215.3 221.8 -3.4 3.0 -3.3 0.9 3.0
Processed materials less foods and feeds. . . . . . . . . . . . . . . . . . . . . . . . . . . . . 201.3 199.3 200.6 0.4 0.7 -0.3 0.5 0.5
Synthetic fibers3. . . . . . . . . . . . . . . . . . . . . . . . . . . . . . . . . . . . . . . . . . . . . . . . . . . . 03-1 124.5 125.5 126.8 3.1 1.0 0.2 1.4 1.0
Processed yarns and threads3. . . . . . . . . . . . . . . . . . . . . . . . . . . . . . . . . . . . . . 03-2 141.0 140.0 140.4 -0.8 0.3 -0.1 -0.5 0.3
Finished fabrics3. . . . . . . . . . . . . . . . . . . . . . . . . . . . . . . . . . . . . . . . . . . . . . . . . . . . 03-4 151.0 150.6 151.0 0.2 0.3 -0.6 -0.3 0.3
Liquefied petroleum gas3. . . . . . . . . . . . . . . . . . . . . . . . . . . . . . . . . . . . . . . . . . . . 05-32 277.7 293.7 304.8 5.7 3.8 -0.7 4.0 3.8
Commercial electric power. . . . . . . . . . . . . . . . . . . . . . . . . . . . . . . . . . . . . . . . . . 05-42 196.2 185.4 189.5 3.2 2.2 0.0 0.1 2.0
Industrial electric power. . . . . . . . . . . . . . . . . . . . . . . . . . . . . . . . . . . . . . . . . . . . . 05-43 210.3 200.3 215.3 8.1 7.5 -0.2 -0.1 8.2
Commercial natural gas3. . . . . . . . . . . . . . . . . . . . . . . . . . . . . . . . . . . . . . . . . . . . 05-52 12/90 181.9 190.5 195.3 6.0 2.5 2.1 2.3 2.5
Industrial natural gas. . . . . . . . . . . . . . . . . . . . . . . . . . . . . . . . . . . . . . . . . . . . . . . 05-53 12/90 168.8 179.1 184.6 3.1 3.1 0.7 -0.6 2.5
Natural gas to electric utilities. . . . . . . . . . . . . . . . . . . . . . . . . . . . . . . . . . . . . . . 05-54 12/90 157.7 164.7 168.9 4.8 2.6 -0.4 -0.8 2.6
Gasoline. . . . . . . . . . . . . . . . . . . . . . . . . . . . . . . . . . . . . . . . . . . . . . . . . . . . . . . . . . . 05-71 299.4 268.5 270.7 -1.6 0.8 -0.7 1.4 -1.3
Jet fuel. . . . . . . . . . . . . . . . . . . . . . . . . . . . . . . . . . . . . . . . . . . . . . . . . . . . . . . . . . . . . 05-72-03 301.0 294.3 298.5 -4.2 1.4 -3.3 6.1 1.5
No. 2 diesel fuel. . . . . . . . . . . . . . . . . . . . . . . . . . . . . . . . . . . . . . . . . . . . . . . . . . . . 05-73-03 328.0 314.5 308.4 -3.3 -1.9 -3.1 6.2 -1.8
Residual fuels3. . . . . . . . . . . . . . . . . . . . . . . . . . . . . . . . . . . . . . . . . . . . . . . . . . . . . 05-74 263.3 260.6 262.6 -6.9 0.8 -2.1 1.5 0.8
Finished lubricants3. . . . . . . . . . . . . . . . . . . . . . . . . . . . . . . . . . . . . . . . . . . . . . . . . 05-76 397.2 404.0 400.9 -1.1 -0.8 0.8 0.4 -0.8
Lubricating oil base stocks3. . . . . . . . . . . . . . . . . . . . . . . . . . . . . . . . . . . . . . . . . 05-78 06/09 183.8 180.2 180.6 -3.2 0.2 -3.4 1.6 0.2
Asphalt. . . . . . . . . . . . . . . . . . . . . . . . . . . . . . . . . . . . . . . . . . . . . . . . . . . . . . . . . . . . . 05-81-02 06/85 266.6 248.2 242.8 -2.5 -2.2 -2.4 2.0 -0.9
Basic inorganic chemicals3. . . . . . . . . . . . . . . . . . . . . . . . . . . . . . . . . . . . . . . . . . 06-13 279.4 273.0 273.3 -3.7 0.1 0.3 -1.1 0.1
Basic organic chemicals3. . . . . . . . . . . . . . . . . . . . . . . . . . . . . . . . . . . . . . . . . . . 06-14 303.4 299.3 299.0 -3.7 -0.1 -2.0 1.3 -0.1
Prepared paint3. . . . . . . . . . . . . . . . . . . . . . . . . . . . . . . . . . . . . . . . . . . . . . . . . . . . . 06-21 273.1 276.5 272.1 -0.6 -1.6 0.0 1.1 -1.6
Paint materials3. . . . . . . . . . . . . . . . . . . . . . . . . . . . . . . . . . . . . . . . . . . . . . . . . . . . 06-22 269.0 260.6 258.4 -9.0 -0.8 -2.4 -2.0 -0.8
Medicinal and botanical chemicals3. . . . . . . . . . . . . . . . . . . . . . . . . . . . . . . . . . 06-31 180.4 180.9 183.1 6.1 1.2 3.8 0.0 1.2
Biological products, including diagnostics3. . . . . . . . . . . . . . . . . . . . . . . . . . . 06-37 246.7 248.5 249.8 4.5 0.5 -4.6 3.5 0.5
Fats and oils, inedible. . . . . . . . . . . . . . . . . . . . . . . . . . . . . . . . . . . . . . . . . . . . . . 06-4 290.4 262.0 258.7 -17.9 -1.3 -1.4 -1.4 -2.7
Nitrogenates. . . . . . . . . . . . . . . . . . . . . . . . . . . . . . . . . . . . . . . . . . . . . . . . . . . . . . . . 06-52-01 317.0 316.0 315.5 -14.8 -0.2 -0.1 -0.6 -0.6
Phosphates3. . . . . . . . . . . . . . . . . . . . . . . . . . . . . . . . . . . . . . . . . . . . . . . . . . . . . . . 06-52-02 223.9 201.2 199.1 -23.7 -1.0 -2.5 -2.6 -1.0
Other agricultural chemicals3. . . . . . . . . . . . . . . . . . . . . . . . . . . . . . . . . . . . . . . . 06-53 184.3 185.2 185.9 1.3 0.4 -0.9 0.8 0.4
Plastic resins and materials3. . . . . . . . . . . . . . . . . . . . . . . . . . . . . . . . . . . . . . . . 06-6 245.5 247.6 250.0 4.3 1.0 1.2 -0.4 1.0
Industrial gases3. . . . . . . . . . . . . . . . . . . . . . . . . . . . . . . . . . . . . . . . . . . . . . . . . . . . 06-79-03 214.0 212.6 217.8 4.1 2.4 0.8 1.3 2.4
Adhesives and sealants3. . . . . . . . . . . . . . . . . . . . . . . . . . . . . . . . . . . . . . . . . . . . 06-79-04 10/83 247.7 247.7 249.8 1.0 0.8 0.0 0.1 0.8
Synthetic rubber3. . . . . . . . . . . . . . . . . . . . . . . . . . . . . . . . . . . . . . . . . . . . . . . . . . . 07-11-02 216.7 222.5 223.7 -6.7 0.5 2.1 0.0 0.5
Tires3. . . . . . . . . . . . . . . . . . . . . . . . . . . . . . . . . . . . . . . . . . . . . . . . . . . . . . . . . . . . . . 07-12-01 151.7 153.5 153.0 -0.6 -0.3 1.4 -0.1 -0.3
Plastic construction products3. . . . . . . . . . . . . . . . . . . . . . . . . . . . . . . . . . . . . . . 07-21 207.6 207.3 208.7 0.1 0.7 0.4 0.0 0.7
Unsupported plastic film, sheet, other shapes3. . . . . . . . . . . . . . . . . . . . . . . 07-22 214.8 214.6 217.3 3.2 1.3 0.7 0.0 1.3
Parts for manufacturing from plastics3. . . . . . . . . . . . . . . . . . . . . . . . . . . . . . . 07-26 148.3 148.0 147.9 4.6 -0.1 0.0 0.0 -0.1
Plastic packaging products3. . . . . . . . . . . . . . . . . . . . . . . . . . . . . . . . . . . . . . . . . 07-2A 12/06 116.9 115.8 115.6 1.9 -0.2 0.0 -0.5 -0.2
Softwood lumber. . . . . . . . . . . . . . . . . . . . . . . . . . . . . . . . . . . . . . . . . . . . . . . . . . . 08-11 191.8 197.9 204.0 2.8 3.1 2.9 -1.6 -0.6
Hardwood lumber3. . . . . . . . . . . . . . . . . . . . . . . . . . . . . . . . . . . . . . . . . . . . . . . . . . 08-12 214.8 228.8 234.7 23.5 2.6 1.2 2.0 2.6
Millwork. . . . . . . . . . . . . . . . . . . . . . . . . . . . . . . . . . . . . . . . . . . . . . . . . . . . . . . . . . . . 08-2 226.6 227.5 229.3 3.3 0.8 0.1 0.1 0.7
Plywood3. . . . . . . . . . . . . . . . . . . . . . . . . . . . . . . . . . . . . . . . . . . . . . . . . . . . . . . . . . . 08-3 197.1 192.5 193.3 -2.5 0.4 -0.9 -2.8 0.4
Paper. . . . . . . . . . . . . . . . . . . . . . . . . . . . . . . . . . . . . . . . . . . . . . . . . . . . . . . . . . . . . . 09-13 191.0 191.1 191.2 0.1 0.1 0.1 0.5 0.2
Paperboard3. . . . . . . . . . . . . . . . . . . . . . . . . . . . . . . . . . . . . . . . . . . . . . . . . . . . . . . . 09-14 249.0 249.3 249.0 5.6 -0.1 -0.4 0.2 -0.1
Paper boxes and containers3. . . . . . . . . . . . . . . . . . . . . . . . . . . . . . . . . . . . . . . . 09-15-03 243.9 250.1 244.5 4.6 -2.2 2.4 -0.2 -2.2
Building paper and board3. . . . . . . . . . . . . . . . . . . . . . . . . . . . . . . . . . . . . . . . . . 09-2 189.0 187.3 187.8 -14.5 0.3 -0.5 -2.1 0.3
Commercial printing3. . . . . . . . . . . . . . . . . . . . . . . . . . . . . . . . . . . . . . . . . . . . . . . 09-47 06/82 170.1 169.9 170.5 0.4 0.4 -0.1 0.0 0.4
Foundry and forge shop products3. . . . . . . . . . . . . . . . . . . . . . . . . . . . . . . . . . 10-15 209.0 208.1 208.2 -0.2 0.0 -0.2 -0.3 0.0
Steel mill products3. . . . . . . . . . . . . . . . . . . . . . . . . . . . . . . . . . . . . . . . . . . . . . . . . 10-17 193.0 196.4 198.7 0.5 1.2 0.8 0.3 1.2
Primary nonferrous metals3. . . . . . . . . . . . . . . . . . . . . . . . . . . . . . . . . . . . . . . . . 10-22 194.5 192.7 189.1 -13.9 -1.9 -1.5 -0.1 -1.9
Secondary nonferrous metals3. . . . . . . . . . . . . . . . . . . . . . . . . . . . . . . . . . . . . . 10-24 229.9 223.6 226.0 -9.3 1.1 -0.1 -0.6 1.1
Aluminum mill shapes3. . . . . . . . . . . . . . . . . . . . . . . . . . . . . . . . . . . . . . . . . . . . . . 10-25-01 171.1 169.5 170.6 -4.7 0.6 0.0 -0.1 0.6
Copper and brass mill shapes3. . . . . . . . . . . . . . . . . . . . . . . . . . . . . . . . . . . . . . 10-25-02 408.5 408.1 413.0 -5.0 1.2 -1.1 1.0 1.2
Nonferrous wire and cable3. . . . . . . . . . . . . . . . . . . . . . . . . . . . . . . . . . . . . . . . . 10-26 255.1 252.0 256.2 -3.6 1.7 0.2 -1.4 1.7
Nonferrous foundry shop products3. . . . . . . . . . . . . . . . . . . . . . . . . . . . . . . . . . 10-28 211.5 211.7 212.4 0.6 0.3 0.2 -0.1 0.3
Metal containers3. . . . . . . . . . . . . . . . . . . . . . . . . . . . . . . . . . . . . . . . . . . . . . . . . . . 10-3 152.1 152.0 151.8 0.3 -0.1 -0.3 0.2 -0.1
Hardware3. . . . . . . . . . . . . . . . . . . . . . . . . . . . . . . . . . . . . . . . . . . . . . . . . . . . . . . . . 10-4 205.0 205.0 206.1 1.0 0.5 0.2 -0.2 0.5
Plumbing fixtures and brass fittings. . . . . . . . . . . . . . . . . . . . . . . . . . . . . . . . . . 10-5 246.5 246.5 247.1 1.6 0.2 0.2 0.1 0.0
Heating equipment3. . . . . . . . . . . . . . . . . . . . . . . . . . . . . . . . . . . . . . . . . . . . . . . . . 10-6 241.3 241.2 241.5 1.3 0.1 0.1 0.3 0.1
Fabricated structural metal products. . . . . . . . . . . . . . . . . . . . . . . . . . . . . . . . . 10-7 212.2 214.0 213.7 0.1 -0.1 0.0 0.1 -0.4
See footnotes at end of table.
28
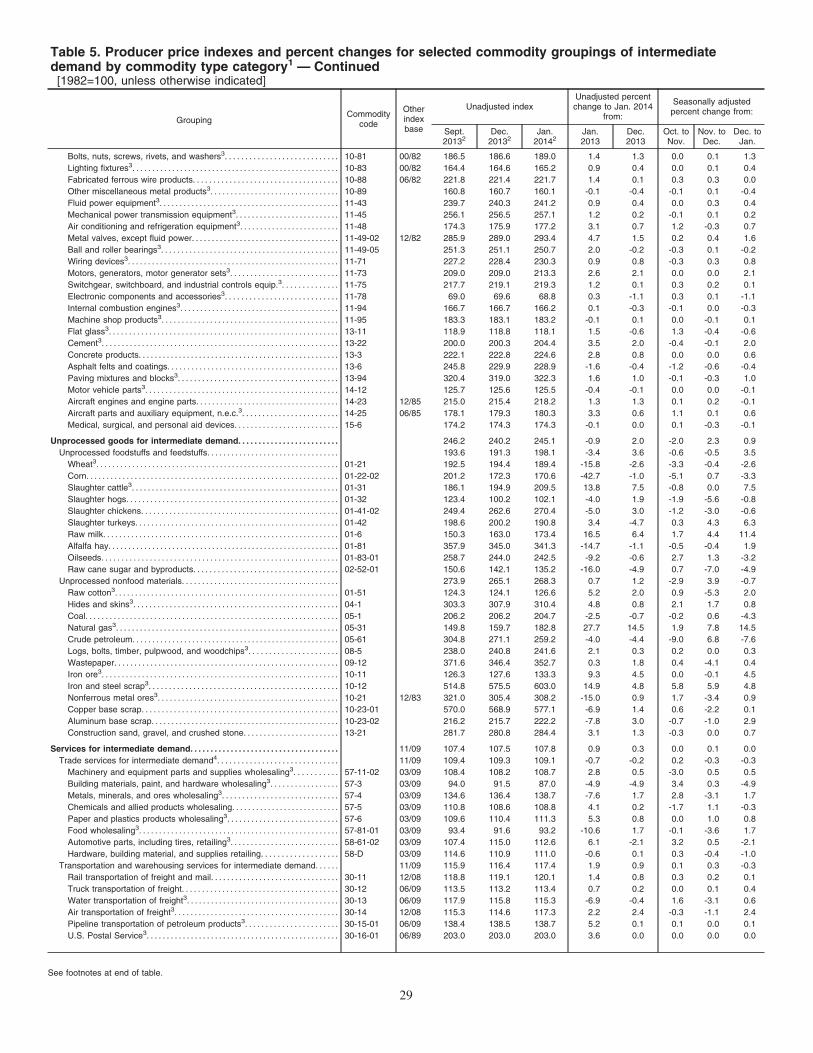
Table 5. Producer price indexes and percent changes for selected commodity groupings of intermediatedemand by commodity type category1 — Continued[1982=100, unless otherwise indicated]
GroupingCommodity
code
Otherindexbase
Unadjusted indexUnadjusted percentchange to Jan. 2014
from:
Seasonally adjustedpercent change from:
Sept.20132
Dec.20132
Jan.20142
Jan.2013
Dec.2013
Oct. toNov.
Nov. toDec.
Dec. toJan.
Bolts, nuts, screws, rivets, and washers3. . . . . . . . . . . . . . . . . . . . . . . . . . . . 10-81 00/82 186.5 186.6 189.0 1.4 1.3 0.0 0.1 1.3
Lighting fixtures3. . . . . . . . . . . . . . . . . . . . . . . . . . . . . . . . . . . . . . . . . . . . . . . . . . . . 10-83 00/82 164.4 164.6 165.2 0.9 0.4 0.0 0.1 0.4
Fabricated ferrous wire products. . . . . . . . . . . . . . . . . . . . . . . . . . . . . . . . . . . . 10-88 06/82 221.8 221.4 221.7 1.4 0.1 0.3 0.3 0.0
Other miscellaneous metal products3. . . . . . . . . . . . . . . . . . . . . . . . . . . . . . . . 10-89 160.8 160.7 160.1 -0.1 -0.4 -0.1 0.1 -0.4
Fluid power equipment3. . . . . . . . . . . . . . . . . . . . . . . . . . . . . . . . . . . . . . . . . . . . . 11-43 239.7 240.3 241.2 0.9 0.4 0.0 0.3 0.4
Mechanical power transmission equipment3. . . . . . . . . . . . . . . . . . . . . . . . . . 11-45 256.1 256.5 257.1 1.2 0.2 -0.1 0.1 0.2
Air conditioning and refrigeration equipment3. . . . . . . . . . . . . . . . . . . . . . . . . 11-48 174.3 175.9 177.2 3.1 0.7 1.2 -0.3 0.7
Metal valves, except fluid power. . . . . . . . . . . . . . . . . . . . . . . . . . . . . . . . . . . . . 11-49-02 12/82 285.9 289.0 293.4 4.7 1.5 0.2 0.4 1.6
Ball and roller bearings3. . . . . . . . . . . . . . . . . . . . . . . . . . . . . . . . . . . . . . . . . . . . 11-49-05 251.3 251.1 250.7 2.0 -0.2 -0.3 0.1 -0.2
Wiring devices3. . . . . . . . . . . . . . . . . . . . . . . . . . . . . . . . . . . . . . . . . . . . . . . . . . . . . 11-71 227.2 228.4 230.3 0.9 0.8 -0.3 0.3 0.8
Motors, generators, motor generator sets3. . . . . . . . . . . . . . . . . . . . . . . . . . . 11-73 209.0 209.0 213.3 2.6 2.1 0.0 0.0 2.1
Switchgear, switchboard, and industrial controls equip.3. . . . . . . . . . . . . . 11-75 217.7 219.1 219.3 1.2 0.1 0.3 0.2 0.1
Electronic components and accessories3. . . . . . . . . . . . . . . . . . . . . . . . . . . . 11-78 69.0 69.6 68.8 0.3 -1.1 0.3 0.1 -1.1
Internal combustion engines3. . . . . . . . . . . . . . . . . . . . . . . . . . . . . . . . . . . . . . . . 11-94 166.7 166.7 166.2 0.1 -0.3 -0.1 0.0 -0.3
Machine shop products3. . . . . . . . . . . . . . . . . . . . . . . . . . . . . . . . . . . . . . . . . . . . 11-95 183.3 183.1 183.2 -0.1 0.1 0.0 -0.1 0.1
Flat glass3. . . . . . . . . . . . . . . . . . . . . . . . . . . . . . . . . . . . . . . . . . . . . . . . . . . . . . . . . 13-11 118.9 118.8 118.1 1.5 -0.6 1.3 -0.4 -0.6
Cement3. . . . . . . . . . . . . . . . . . . . . . . . . . . . . . . . . . . . . . . . . . . . . . . . . . . . . . . . . . . 13-22 200.0 200.3 204.4 3.5 2.0 -0.4 -0.1 2.0
Concrete products. . . . . . . . . . . . . . . . . . . . . . . . . . . . . . . . . . . . . . . . . . . . . . . . . . 13-3 222.1 222.8 224.6 2.8 0.8 0.0 0.0 0.6
Asphalt felts and coatings. . . . . . . . . . . . . . . . . . . . . . . . . . . . . . . . . . . . . . . . . . . 13-6 245.8 229.9 228.9 -1.6 -0.4 -1.2 -0.6 -0.4
Paving mixtures and blocks3. . . . . . . . . . . . . . . . . . . . . . . . . . . . . . . . . . . . . . . . 13-94 320.4 319.0 322.3 1.6 1.0 -0.1 -0.3 1.0
Motor vehicle parts3. . . . . . . . . . . . . . . . . . . . . . . . . . . . . . . . . . . . . . . . . . . . . . . . 14-12 125.7 125.6 125.5 -0.4 -0.1 0.0 0.0 -0.1
Aircraft engines and engine parts. . . . . . . . . . . . . . . . . . . . . . . . . . . . . . . . . . . . 14-23 12/85 215.0 215.4 218.2 1.3 1.3 0.1 0.2 -0.1
Aircraft parts and auxiliary equipment, n.e.c.3. . . . . . . . . . . . . . . . . . . . . . . . 14-25 06/85 178.1 179.3 180.3 3.3 0.6 1.1 0.1 0.6
Medical, surgical, and personal aid devices. . . . . . . . . . . . . . . . . . . . . . . . . . 15-6 174.2 174.3 174.3 -0.1 0.0 0.1 -0.3 -0.1
Unprocessed goods for intermediate demand. . . . . . . . . . . . . . . . . . . . . . . . . 246.2 240.2 245.1 -0.9 2.0 -2.0 2.3 0.9
Unprocessed foodstuffs and feedstuffs. . . . . . . . . . . . . . . . . . . . . . . . . . . . . . . . . 193.6 191.3 198.1 -3.4 3.6 -0.6 -0.5 3.5
Wheat3. . . . . . . . . . . . . . . . . . . . . . . . . . . . . . . . . . . . . . . . . . . . . . . . . . . . . . . . . . . . . 01-21 192.5 194.4 189.4 -15.8 -2.6 -3.3 -0.4 -2.6
Corn. . . . . . . . . . . . . . . . . . . . . . . . . . . . . . . . . . . . . . . . . . . . . . . . . . . . . . . . . . . . . . . 01-22-02 201.2 172.3 170.6 -42.7 -1.0 -5.1 0.7 -3.3
Slaughter cattle3. . . . . . . . . . . . . . . . . . . . . . . . . . . . . . . . . . . . . . . . . . . . . . . . . . . . 01-31 186.1 194.9 209.5 13.8 7.5 -0.8 0.0 7.5
Slaughter hogs. . . . . . . . . . . . . . . . . . . . . . . . . . . . . . . . . . . . . . . . . . . . . . . . . . . . . 01-32 123.4 100.2 102.1 -4.0 1.9 -1.9 -5.6 -0.8
Slaughter chickens. . . . . . . . . . . . . . . . . . . . . . . . . . . . . . . . . . . . . . . . . . . . . . . . . 01-41-02 249.4 262.6 270.4 -5.0 3.0 -1.2 -3.0 -0.6
Slaughter turkeys. . . . . . . . . . . . . . . . . . . . . . . . . . . . . . . . . . . . . . . . . . . . . . . . . . . 01-42 198.6 200.2 190.8 3.4 -4.7 0.3 4.3 6.3
Raw milk. . . . . . . . . . . . . . . . . . . . . . . . . . . . . . . . . . . . . . . . . . . . . . . . . . . . . . . . . . . 01-6 150.3 163.0 173.4 16.5 6.4 1.7 4.4 11.4
Alfalfa hay. . . . . . . . . . . . . . . . . . . . . . . . . . . . . . . . . . . . . . . . . . . . . . . . . . . . . . . . . . 01-81 357.9 345.0 341.3 -14.7 -1.1 -0.5 -0.4 1.9
Oilseeds. . . . . . . . . . . . . . . . . . . . . . . . . . . . . . . . . . . . . . . . . . . . . . . . . . . . . . . . . . . 01-83-01 258.7 244.0 242.5 -9.2 -0.6 2.7 1.3 -3.2
Raw cane sugar and byproducts. . . . . . . . . . . . . . . . . . . . . . . . . . . . . . . . . . . . 02-52-01 150.6 142.1 135.2 -16.0 -4.9 0.7 -7.0 -4.9
Unprocessed nonfood materials. . . . . . . . . . . . . . . . . . . . . . . . . . . . . . . . . . . . . . . 273.9 265.1 268.3 0.7 1.2 -2.9 3.9 -0.7
Raw cotton3. . . . . . . . . . . . . . . . . . . . . . . . . . . . . . . . . . . . . . . . . . . . . . . . . . . . . . . . 01-51 124.3 124.1 126.6 5.2 2.0 0.9 -5.3 2.0
Hides and skins3. . . . . . . . . . . . . . . . . . . . . . . . . . . . . . . . . . . . . . . . . . . . . . . . . . . 04-1 303.3 307.9 310.4 4.8 0.8 2.1 1.7 0.8
Coal. . . . . . . . . . . . . . . . . . . . . . . . . . . . . . . . . . . . . . . . . . . . . . . . . . . . . . . . . . . . . . . 05-1 206.2 206.2 204.7 -2.5 -0.7 -0.2 0.6 -4.3
Natural gas3. . . . . . . . . . . . . . . . . . . . . . . . . . . . . . . . . . . . . . . . . . . . . . . . . . . . . . . . 05-31 149.8 159.7 182.8 27.7 14.5 1.9 7.8 14.5
Crude petroleum. . . . . . . . . . . . . . . . . . . . . . . . . . . . . . . . . . . . . . . . . . . . . . . . . . . . 05-61 304.8 271.1 259.2 -4.0 -4.4 -9.0 6.8 -7.6
Logs, bolts, timber, pulpwood, and woodchips3. . . . . . . . . . . . . . . . . . . . . . 08-5 238.0 240.8 241.6 2.1 0.3 0.2 0.0 0.3
Wastepaper. . . . . . . . . . . . . . . . . . . . . . . . . . . . . . . . . . . . . . . . . . . . . . . . . . . . . . . . 09-12 371.6 346.4 352.7 0.3 1.8 0.4 -4.1 0.4
Iron ore3. . . . . . . . . . . . . . . . . . . . . . . . . . . . . . . . . . . . . . . . . . . . . . . . . . . . . . . . . . . 10-11 126.3 127.6 133.3 9.3 4.5 0.0 -0.1 4.5
Iron and steel scrap3. . . . . . . . . . . . . . . . . . . . . . . . . . . . . . . . . . . . . . . . . . . . . . . 10-12 514.8 575.5 603.0 14.9 4.8 5.8 5.9 4.8
Nonferrous metal ores3. . . . . . . . . . . . . . . . . . . . . . . . . . . . . . . . . . . . . . . . . . . . . 10-21 12/83 321.0 305.4 308.2 -15.0 0.9 1.7 -3.4 0.9
Copper base scrap. . . . . . . . . . . . . . . . . . . . . . . . . . . . . . . . . . . . . . . . . . . . . . . . . 10-23-01 570.0 568.9 577.1 -6.9 1.4 0.6 -2.2 0.1
Aluminum base scrap. . . . . . . . . . . . . . . . . . . . . . . . . . . . . . . . . . . . . . . . . . . . . . . 10-23-02 216.2 215.7 222.2 -7.8 3.0 -0.7 -1.0 2.9
Construction sand, gravel, and crushed stone. . . . . . . . . . . . . . . . . . . . . . . . 13-21 281.7 280.8 284.4 3.1 1.3 -0.3 0.0 0.7
Services for intermediate demand. . . . . . . . . . . . . . . . . . . . . . . . . . . . . . . . . . . . . 11/09 107.4 107.5 107.8 0.9 0.3 0.0 0.1 0.0
Trade services for intermediate demand4. . . . . . . . . . . . . . . . . . . . . . . . . . . . . . 11/09 109.4 109.3 109.1 -0.7 -0.2 0.2 -0.3 -0.3
Machinery and equipment parts and supplies wholesaling3. . . . . . . . . . . 57-11-02 03/09 108.4 108.2 108.7 2.8 0.5 -3.0 0.5 0.5
Building materials, paint, and hardware wholesaling3. . . . . . . . . . . . . . . . . 57-3 03/09 94.0 91.5 87.0 -4.9 -4.9 3.4 0.3 -4.9
Metals, minerals, and ores wholesaling3. . . . . . . . . . . . . . . . . . . . . . . . . . . . . 57-4 03/09 134.6 136.4 138.7 -7.6 1.7 2.8 -3.1 1.7
Chemicals and allied products wholesaling. . . . . . . . . . . . . . . . . . . . . . . . . . . 57-5 03/09 110.8 108.6 108.8 4.1 0.2 -1.7 1.1 -0.3
Paper and plastics products wholesaling3. . . . . . . . . . . . . . . . . . . . . . . . . . . . 57-6 03/09 109.6 110.4 111.3 5.3 0.8 0.0 1.0 0.8
Food wholesaling3. . . . . . . . . . . . . . . . . . . . . . . . . . . . . . . . . . . . . . . . . . . . . . . . . . 57-81-01 03/09 93.4 91.6 93.2 -10.6 1.7 -0.1 -3.6 1.7
Automotive parts, including tires, retailing3. . . . . . . . . . . . . . . . . . . . . . . . . . . 58-61-02 03/09 107.4 115.0 112.6 6.1 -2.1 3.2 0.5 -2.1
Hardware, building material, and supplies retailing. . . . . . . . . . . . . . . . . . . 58-D 03/09 114.6 110.9 111.0 -0.6 0.1 0.3 -0.4 -1.0
Transportation and warehousing services for intermediate demand. . . . . . 11/09 115.9 116.4 117.4 1.9 0.9 0.1 0.3 -0.3
Rail transportation of freight and mail. . . . . . . . . . . . . . . . . . . . . . . . . . . . . . . . 30-11 12/08 118.8 119.1 120.1 1.4 0.8 0.3 0.2 0.1
Truck transportation of freight. . . . . . . . . . . . . . . . . . . . . . . . . . . . . . . . . . . . . . . 30-12 06/09 113.5 113.2 113.4 0.7 0.2 0.0 0.1 0.4
Water transportation of freight3. . . . . . . . . . . . . . . . . . . . . . . . . . . . . . . . . . . . . . 30-13 06/09 117.9 115.8 115.3 -6.9 -0.4 1.6 -3.1 0.6
Air transportation of freight3. . . . . . . . . . . . . . . . . . . . . . . . . . . . . . . . . . . . . . . . . 30-14 12/08 115.3 114.6 117.3 2.2 2.4 -0.3 -1.1 2.4
Pipeline transportation of petroleum products3. . . . . . . . . . . . . . . . . . . . . . . 30-15-01 06/09 138.4 138.5 138.7 5.2 0.1 0.1 0.0 0.1
U.S. Postal Service3. . . . . . . . . . . . . . . . . . . . . . . . . . . . . . . . . . . . . . . . . . . . . . . . 30-16-01 06/89 203.0 203.0 203.0 3.6 0.0 0.0 0.0 0.0
See footnotes at end of table.
29
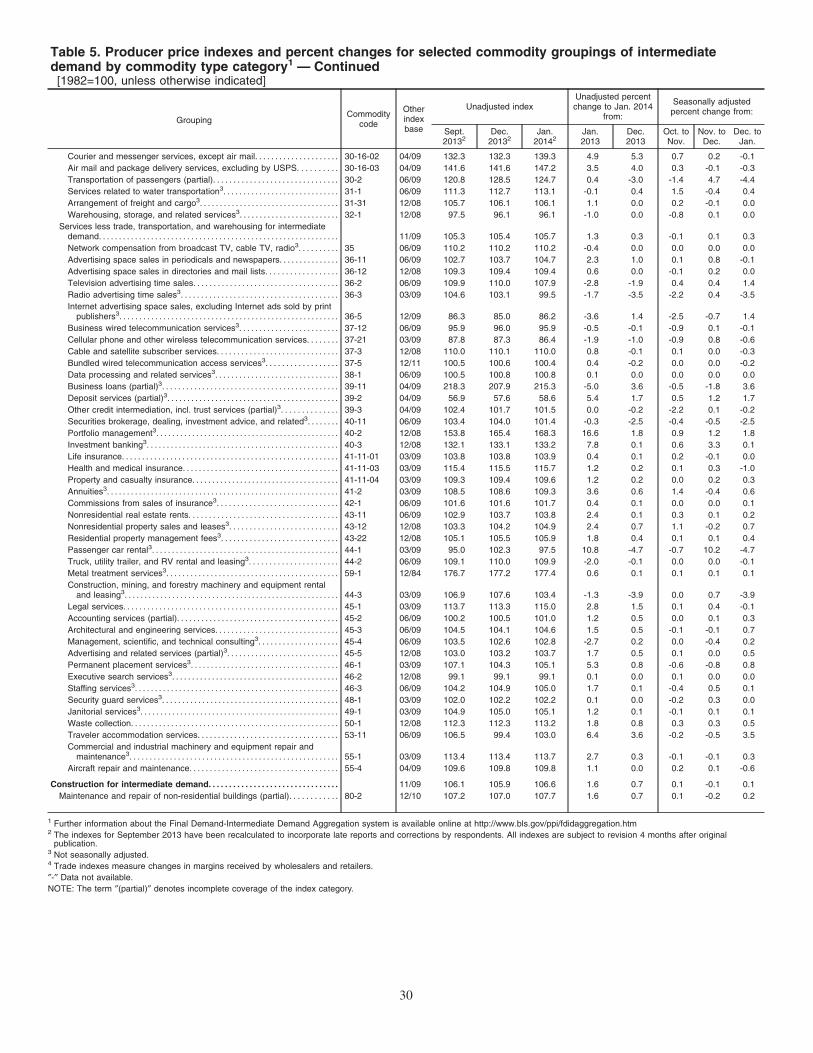
Table 5. Producer price indexes and percent changes for selected commodity groupings of intermediatedemand by commodity type category1 — Continued[1982=100, unless otherwise indicated]
GroupingCommodity
code
Otherindexbase
Unadjusted indexUnadjusted percentchange to Jan. 2014
from:
Seasonally adjustedpercent change from:
Sept.20132
Dec.20132
Jan.20142
Jan.2013
Dec.2013
Oct. toNov.
Nov. toDec.
Dec. toJan.
Courier and messenger services, except air mail. . . . . . . . . . . . . . . . . . . . . 30-16-02 04/09 132.3 132.3 139.3 4.9 5.3 0.7 0.2 -0.1
Air mail and package delivery services, excluding by USPS. . . . . . . . . . 30-16-03 04/09 141.6 141.6 147.2 3.5 4.0 0.3 -0.1 -0.3
Transportation of passengers (partial). . . . . . . . . . . . . . . . . . . . . . . . . . . . . . . 30-2 06/09 120.8 128.5 124.7 0.4 -3.0 -1.4 4.7 -4.4
Services related to water transportation3. . . . . . . . . . . . . . . . . . . . . . . . . . . . . 31-1 06/09 111.3 112.7 113.1 -0.1 0.4 1.5 -0.4 0.4
Arrangement of freight and cargo3. . . . . . . . . . . . . . . . . . . . . . . . . . . . . . . . . . . 31-31 12/08 105.7 106.1 106.1 1.1 0.0 0.2 -0.1 0.0
Warehousing, storage, and related services3. . . . . . . . . . . . . . . . . . . . . . . . . 32-1 12/08 97.5 96.1 96.1 -1.0 0.0 -0.8 0.1 0.0
Services less trade, transportation, and warehousing for intermediatedemand. . . . . . . . . . . . . . . . . . . . . . . . . . . . . . . . . . . . . . . . . . . . . . . . . . . . . . . . . . . . 11/09 105.3 105.4 105.7 1.3 0.3 -0.1 0.1 0.3
Network compensation from broadcast TV, cable TV, radio3. . . . . . . . . . 35 06/09 110.2 110.2 110.2 -0.4 0.0 0.0 0.0 0.0
Advertising space sales in periodicals and newspapers. . . . . . . . . . . . . . . 36-11 06/09 102.7 103.7 104.7 2.3 1.0 0.1 0.8 -0.1
Advertising space sales in directories and mail lists. . . . . . . . . . . . . . . . . . 36-12 12/08 109.3 109.4 109.4 0.6 0.0 -0.1 0.2 0.0
Television advertising time sales. . . . . . . . . . . . . . . . . . . . . . . . . . . . . . . . . . . . 36-2 06/09 109.9 110.0 107.9 -2.8 -1.9 0.4 0.4 1.4
Radio advertising time sales3. . . . . . . . . . . . . . . . . . . . . . . . . . . . . . . . . . . . . . . 36-3 03/09 104.6 103.1 99.5 -1.7 -3.5 -2.2 0.4 -3.5
Internet advertising space sales, excluding Internet ads sold by printpublishers3. . . . . . . . . . . . . . . . . . . . . . . . . . . . . . . . . . . . . . . . . . . . . . . . . . . . . . . 36-5 12/09 86.3 85.0 86.2 -3.6 1.4 -2.5 -0.7 1.4
Business wired telecommunication services3. . . . . . . . . . . . . . . . . . . . . . . . . 37-12 06/09 95.9 96.0 95.9 -0.5 -0.1 -0.9 0.1 -0.1
Cellular phone and other wireless telecommunication services. . . . . . . . 37-21 03/09 87.8 87.3 86.4 -1.9 -1.0 -0.9 0.8 -0.6
Cable and satellite subscriber services. . . . . . . . . . . . . . . . . . . . . . . . . . . . . . 37-3 12/08 110.0 110.1 110.0 0.8 -0.1 0.1 0.0 -0.3
Bundled wired telecommunication access services3. . . . . . . . . . . . . . . . . . 37-5 12/11 100.5 100.6 100.4 0.4 -0.2 0.0 0.0 -0.2
Data processing and related services3. . . . . . . . . . . . . . . . . . . . . . . . . . . . . . . 38-1 06/09 100.5 100.8 100.8 0.1 0.0 0.0 0.0 0.0
Business loans (partial)3. . . . . . . . . . . . . . . . . . . . . . . . . . . . . . . . . . . . . . . . . . . . 39-11 04/09 218.3 207.9 215.3 -5.0 3.6 -0.5 -1.8 3.6
Deposit services (partial)3. . . . . . . . . . . . . . . . . . . . . . . . . . . . . . . . . . . . . . . . . . . 39-2 04/09 56.9 57.6 58.6 5.4 1.7 0.5 1.2 1.7
Other credit intermediation, incl. trust services (partial)3. . . . . . . . . . . . . . 39-3 04/09 102.4 101.7 101.5 0.0 -0.2 -2.2 0.1 -0.2
Securities brokerage, dealing, investment advice, and related3. . . . . . . . 40-11 06/09 103.4 104.0 101.4 -0.3 -2.5 -0.4 -0.5 -2.5
Portfolio management3. . . . . . . . . . . . . . . . . . . . . . . . . . . . . . . . . . . . . . . . . . . . . . 40-2 12/08 153.8 165.4 168.3 16.6 1.8 0.9 1.2 1.8
Investment banking3. . . . . . . . . . . . . . . . . . . . . . . . . . . . . . . . . . . . . . . . . . . . . . . . 40-3 12/08 132.1 133.1 133.2 7.8 0.1 0.6 3.3 0.1
Life insurance. . . . . . . . . . . . . . . . . . . . . . . . . . . . . . . . . . . . . . . . . . . . . . . . . . . . . . 41-11-01 03/09 103.8 103.8 103.9 0.4 0.1 0.2 -0.1 0.0
Health and medical insurance. . . . . . . . . . . . . . . . . . . . . . . . . . . . . . . . . . . . . . . 41-11-03 03/09 115.4 115.5 115.7 1.2 0.2 0.1 0.3 -1.0
Property and casualty insurance. . . . . . . . . . . . . . . . . . . . . . . . . . . . . . . . . . . . . 41-11-04 03/09 109.3 109.4 109.6 1.2 0.2 0.0 0.2 0.3
Annuities3. . . . . . . . . . . . . . . . . . . . . . . . . . . . . . . . . . . . . . . . . . . . . . . . . . . . . . . . . . 41-2 03/09 108.5 108.6 109.3 3.6 0.6 1.4 -0.4 0.6
Commissions from sales of insurance3. . . . . . . . . . . . . . . . . . . . . . . . . . . . . . 42-1 06/09 101.6 101.6 101.7 0.4 0.1 0.0 0.0 0.1
Nonresidential real estate rents. . . . . . . . . . . . . . . . . . . . . . . . . . . . . . . . . . . . . 43-11 06/09 102.9 103.7 103.8 2.4 0.1 0.3 0.1 0.2
Nonresidential property sales and leases3. . . . . . . . . . . . . . . . . . . . . . . . . . . 43-12 12/08 103.3 104.2 104.9 2.4 0.7 1.1 -0.2 0.7
Residential property management fees3. . . . . . . . . . . . . . . . . . . . . . . . . . . . . 43-22 12/08 105.1 105.5 105.9 1.8 0.4 0.1 0.1 0.4
Passenger car rental3. . . . . . . . . . . . . . . . . . . . . . . . . . . . . . . . . . . . . . . . . . . . . . . 44-1 03/09 95.0 102.3 97.5 10.8 -4.7 -0.7 10.2 -4.7
Truck, utility trailer, and RV rental and leasing3. . . . . . . . . . . . . . . . . . . . . . 44-2 06/09 109.1 110.0 109.9 -2.0 -0.1 0.0 0.0 -0.1
Metal treatment services3. . . . . . . . . . . . . . . . . . . . . . . . . . . . . . . . . . . . . . . . . . . 59-1 12/84 176.7 177.2 177.4 0.6 0.1 0.1 0.1 0.1
Construction, mining, and forestry machinery and equipment rentaland leasing3. . . . . . . . . . . . . . . . . . . . . . . . . . . . . . . . . . . . . . . . . . . . . . . . . . . . . . 44-3 03/09 106.9 107.6 103.4 -1.3 -3.9 0.0 0.7 -3.9
Legal services. . . . . . . . . . . . . . . . . . . . . . . . . . . . . . . . . . . . . . . . . . . . . . . . . . . . . . 45-1 03/09 113.7 113.3 115.0 2.8 1.5 0.1 0.4 -0.1
Accounting services (partial). . . . . . . . . . . . . . . . . . . . . . . . . . . . . . . . . . . . . . . . 45-2 06/09 100.2 100.5 101.0 1.2 0.5 0.0 0.1 0.3
Architectural and engineering services. . . . . . . . . . . . . . . . . . . . . . . . . . . . . . . 45-3 06/09 104.5 104.1 104.6 1.5 0.5 -0.1 -0.1 0.7
Management, scientific, and technical consulting3. . . . . . . . . . . . . . . . . . . . 45-4 06/09 103.5 102.6 102.8 -2.7 0.2 0.0 -0.4 0.2
Advertising and related services (partial)3. . . . . . . . . . . . . . . . . . . . . . . . . . . . 45-5 12/08 103.0 103.2 103.7 1.7 0.5 0.1 0.0 0.5
Permanent placement services3. . . . . . . . . . . . . . . . . . . . . . . . . . . . . . . . . . . . . 46-1 03/09 107.1 104.3 105.1 5.3 0.8 -0.6 -0.8 0.8
Executive search services3. . . . . . . . . . . . . . . . . . . . . . . . . . . . . . . . . . . . . . . . . . 46-2 12/08 99.1 99.1 99.1 0.1 0.0 0.1 0.0 0.0
Staffing services3. . . . . . . . . . . . . . . . . . . . . . . . . . . . . . . . . . . . . . . . . . . . . . . . . . . 46-3 06/09 104.2 104.9 105.0 1.7 0.1 -0.4 0.5 0.1
Security guard services3. . . . . . . . . . . . . . . . . . . . . . . . . . . . . . . . . . . . . . . . . . . . 48-1 03/09 102.0 102.2 102.2 0.1 0.0 -0.2 0.3 0.0
Janitorial services3. . . . . . . . . . . . . . . . . . . . . . . . . . . . . . . . . . . . . . . . . . . . . . . . . . 49-1 03/09 104.9 105.0 105.1 1.2 0.1 -0.1 0.1 0.1
Waste collection. . . . . . . . . . . . . . . . . . . . . . . . . . . . . . . . . . . . . . . . . . . . . . . . . . . . 50-1 12/08 112.3 112.3 113.2 1.8 0.8 0.3 0.3 0.5
Traveler accommodation services. . . . . . . . . . . . . . . . . . . . . . . . . . . . . . . . . . . 53-11 06/09 106.5 99.4 103.0 6.4 3.6 -0.2 -0.5 3.5
Commercial and industrial machinery and equipment repair andmaintenance3. . . . . . . . . . . . . . . . . . . . . . . . . . . . . . . . . . . . . . . . . . . . . . . . . . . . 55-1 03/09 113.4 113.4 113.7 2.7 0.3 -0.1 -0.1 0.3
Aircraft repair and maintenance. . . . . . . . . . . . . . . . . . . . . . . . . . . . . . . . . . . . . 55-4 04/09 109.6 109.8 109.8 1.1 0.0 0.2 0.1 -0.6
Construction for intermediate demand. . . . . . . . . . . . . . . . . . . . . . . . . . . . . . . . 11/09 106.1 105.9 106.6 1.6 0.7 0.1 -0.1 0.1
Maintenance and repair of non-residential buildings (partial). . . . . . . . . . . . 80-2 12/10 107.2 107.0 107.7 1.6 0.7 0.1 -0.2 0.2
1 Further information about the Final Demand-Intermediate Demand Aggregation system is available online at http://www.bls.gov/ppi/fdidaggregation.htm2 The indexes for September 2013 have been recalculated to incorporate late reports and corrections by respondents. All indexes are subject to revision 4 months after original
publication.3 Not seasonally adjusted.4 Trade indexes measure changes in margins received by wholesalers and retailers.
″-″ Data not available.
NOTE: The term ″(partial)″ denotes incomplete coverage of the index category.
30

Table 6. Producer price indexes and percent changes for selected commodity groupings of intermediatedemand by production flow category1
[1982=100, unless otherwise indicated]
GroupingCommodity
code
Otherindexbase
Unadjusted indexUnadjusted percent
change to Jan.2014 from:
Seasonally adjustedpercent change from:
Sept.20132
Dec.20132
Jan.20142
Jan.2013
Dec.2013
Oct. toNov.
Nov. toDec.
Dec. toJan.
Stage 4 intermediate demand. . . . . . . . . . . . . . . . . . . . . . . . . . . . . . . . . . . . . . . . . . . . . . 11/09 110.2 109.8 110.2 0.7 0.4 -0.2 0.3 0.2
Stage 4 intermediate demand goods. . . . . . . . . . . . . . . . . . . . . . . . . . . . . . . . . . . . . . . 04/10 110.1 108.9 109.5 0.4 0.6 -0.3 0.4 0.4
Grains. . . . . . . . . . . . . . . . . . . . . . . . . . . . . . . . . . . . . . . . . . . . . . . . . . . . . . . . . . . . . . . . . . 01-2 200.2 179.2 177.0 -36.5 -1.2 -3.4 1.6 -3.2
Meats. . . . . . . . . . . . . . . . . . . . . . . . . . . . . . . . . . . . . . . . . . . . . . . . . . . . . . . . . . . . . . . . . . . 02-21 181.0 180.2 182.2 2.8 1.1 1.0 -0.8 1.8
Unprocessed and packaged fish. . . . . . . . . . . . . . . . . . . . . . . . . . . . . . . . . . . . . . . . . 02-23 305.9 296.4 348.1 20.0 17.4 0.4 -4.7 15.1
Dairy products. . . . . . . . . . . . . . . . . . . . . . . . . . . . . . . . . . . . . . . . . . . . . . . . . . . . . . . . . . . 02-3 199.8 205.9 211.2 6.4 2.6 0.9 1.5 5.0
Commercial electric power. . . . . . . . . . . . . . . . . . . . . . . . . . . . . . . . . . . . . . . . . . . . . . . 05-42 196.2 185.4 189.5 3.2 2.2 0.0 0.1 2.0
Commercial natural gas3. . . . . . . . . . . . . . . . . . . . . . . . . . . . . . . . . . . . . . . . . . . . . . . . . 05-52 12/90 181.9 190.5 195.3 6.0 2.5 2.1 2.3 2.5
Gasoline. . . . . . . . . . . . . . . . . . . . . . . . . . . . . . . . . . . . . . . . . . . . . . . . . . . . . . . . . . . . . . . . 05-71 299.4 268.5 270.7 -1.6 0.8 -0.7 1.4 -1.3
Jet fuel. . . . . . . . . . . . . . . . . . . . . . . . . . . . . . . . . . . . . . . . . . . . . . . . . . . . . . . . . . . . . . . . . 05-72-03 301.0 294.3 298.5 -4.2 1.4 -3.3 6.1 1.5
No. 2 diesel fuel. . . . . . . . . . . . . . . . . . . . . . . . . . . . . . . . . . . . . . . . . . . . . . . . . . . . . . . . . 05-73-03 328.0 314.5 308.4 -3.3 -1.9 -3.1 6.2 -1.8
Basic organic chemicals3. . . . . . . . . . . . . . . . . . . . . . . . . . . . . . . . . . . . . . . . . . . . . . . . 06-14 303.4 299.3 299.0 -3.7 -0.1 -2.0 1.3 -0.1
Prepared paint3. . . . . . . . . . . . . . . . . . . . . . . . . . . . . . . . . . . . . . . . . . . . . . . . . . . . . . . . . 06-21 273.1 276.5 272.1 -0.6 -1.6 0.0 1.1 -1.6
Medicinal and botanical chemicals3. . . . . . . . . . . . . . . . . . . . . . . . . . . . . . . . . . . . . . 06-31 180.4 180.9 183.1 6.1 1.2 3.8 0.0 1.2
Biological products for human use3. . . . . . . . . . . . . . . . . . . . . . . . . . . . . . . . . . . . . . . 06-37-19 06/09 115.6 115.6 115.8 2.0 0.2 0.0 -0.3 0.2
Pharmaceutical preparations. . . . . . . . . . . . . . . . . . . . . . . . . . . . . . . . . . . . . . . . . . . . . 06-38 06/01 181.7 182.6 190.8 6.1 4.5 0.0 0.6 2.7
Plastic construction products3. . . . . . . . . . . . . . . . . . . . . . . . . . . . . . . . . . . . . . . . . . . . 07-21 00/82 207.6 207.3 208.7 0.1 0.7 0.4 0.0 0.7
Unsupported plastic film, sheet, and other shapes3. . . . . . . . . . . . . . . . . . . . . . . 07-22 214.8 214.6 217.3 3.2 1.3 0.7 0.0 1.3
Parts for manufacturing from plastics3. . . . . . . . . . . . . . . . . . . . . . . . . . . . . . . . . . . . 07-26 148.3 148.0 147.9 4.6 -0.1 0.0 0.0 -0.1
Plastic packaging products3. . . . . . . . . . . . . . . . . . . . . . . . . . . . . . . . . . . . . . . . . . . . . . 07-2A 12/06 116.9 115.8 115.6 1.9 -0.2 0.0 -0.5 -0.2
Lumber. . . . . . . . . . . . . . . . . . . . . . . . . . . . . . . . . . . . . . . . . . . . . . . . . . . . . . . . . . . . . . . . . 08-1 00/82 196.3 205.3 211.2 10.6 2.9 2.0 -0.7 1.4
Millwork. . . . . . . . . . . . . . . . . . . . . . . . . . . . . . . . . . . . . . . . . . . . . . . . . . . . . . . . . . . . . . . . . 08-2 226.6 227.5 229.3 3.3 0.8 0.1 0.1 0.7
Sanitary paper products3. . . . . . . . . . . . . . . . . . . . . . . . . . . . . . . . . . . . . . . . . . . . . . . . 09-15-01 185.0 185.5 184.9 -0.3 -0.3 -0.1 0.4 -0.3
Paper boxes and containers3. . . . . . . . . . . . . . . . . . . . . . . . . . . . . . . . . . . . . . . . . . . . 09-15-03 243.9 250.1 244.5 4.6 -2.2 2.4 -0.2 -2.2
Commercial printing3. . . . . . . . . . . . . . . . . . . . . . . . . . . . . . . . . . . . . . . . . . . . . . . . . . . . 09-47 06/82 170.1 169.9 170.5 0.4 0.4 -0.1 0.0 0.4
Steel mill products3. . . . . . . . . . . . . . . . . . . . . . . . . . . . . . . . . . . . . . . . . . . . . . . . . . . . . . 10-17 193.0 196.4 198.7 0.5 1.2 0.8 0.3 1.2
Nonferrous wire and cable3. . . . . . . . . . . . . . . . . . . . . . . . . . . . . . . . . . . . . . . . . . . . . . 10-26 255.1 252.0 256.2 -3.6 1.7 0.2 -1.4 1.7
Fabricated structural metal products. . . . . . . . . . . . . . . . . . . . . . . . . . . . . . . . . . . . . . 10-7 212.2 214.0 213.7 0.1 -0.1 0.0 0.1 -0.4
Other miscellaneous metal products3. . . . . . . . . . . . . . . . . . . . . . . . . . . . . . . . . . . . . 10-89 160.8 160.7 160.1 -0.1 -0.4 -0.1 0.1 -0.4
Air conditioning and refrigeration equipment3. . . . . . . . . . . . . . . . . . . . . . . . . . . . . 11-48 174.3 175.9 177.2 3.1 0.7 1.2 -0.3 0.7
Electronic components and accessories3. . . . . . . . . . . . . . . . . . . . . . . . . . . . . . . . . 11-78 69.0 69.6 68.8 0.3 -1.1 0.3 0.1 -1.1
Miscellaneous electrical machinery and equipment3. . . . . . . . . . . . . . . . . . . . . . . 11-79 118.4 118.3 118.3 -0.3 0.0 0.0 -0.1 0.0
Internal combustion engines3. . . . . . . . . . . . . . . . . . . . . . . . . . . . . . . . . . . . . . . . . . . . 11-94 166.7 166.7 166.2 0.1 -0.3 -0.1 0.0 -0.3
Machine shop products3. . . . . . . . . . . . . . . . . . . . . . . . . . . . . . . . . . . . . . . . . . . . . . . . . 11-95 183.3 183.1 183.2 -0.1 0.1 0.0 -0.1 0.1
Concrete ingredients and related products. . . . . . . . . . . . . . . . . . . . . . . . . . . . . . . . 13-2 247.0 246.6 250.2 3.2 1.5 -0.4 0.0 1.0
Concrete products. . . . . . . . . . . . . . . . . . . . . . . . . . . . . . . . . . . . . . . . . . . . . . . . . . . . . . . 13-3 222.1 222.8 224.6 2.8 0.8 0.0 0.0 0.6
Prepared asphalt, tar roofing and siding products. . . . . . . . . . . . . . . . . . . . . . . . . 13-61 239.1 222.0 221.3 -0.8 -0.3 -1.2 -0.9 -0.4
Paving mixtures and blocks3. . . . . . . . . . . . . . . . . . . . . . . . . . . . . . . . . . . . . . . . . . . . . 13-94 320.4 319.0 322.3 1.6 1.0 -0.1 -0.3 1.0
Motor vehicle parts3. . . . . . . . . . . . . . . . . . . . . . . . . . . . . . . . . . . . . . . . . . . . . . . . . . . . . 14-12 125.7 125.6 125.5 -0.4 -0.1 0.0 0.0 -0.1
Aircraft engines and engine parts. . . . . . . . . . . . . . . . . . . . . . . . . . . . . . . . . . . . . . . . 14-23 12/85 215.0 215.4 218.2 1.3 1.3 0.1 0.2 -0.1
Aircraft parts and auxiliary equipment, n.e.c.3. . . . . . . . . . . . . . . . . . . . . . . . . . . . . 14-25 06/85 178.1 179.3 180.3 3.3 0.6 1.1 0.1 0.6
Medical, surgical and personal aid devices. . . . . . . . . . . . . . . . . . . . . . . . . . . . . . . 15-6 174.2 174.3 174.3 -0.1 0.0 0.1 -0.3 -0.1
Stage 4 intermediate demand services. . . . . . . . . . . . . . . . . . . . . . . . . . . . . . . . . . . . . 04/10 106.4 106.8 107.0 1.1 0.2 0.0 0.2 -0.1
Truck transportation of freight. . . . . . . . . . . . . . . . . . . . . . . . . . . . . . . . . . . . . . . . . . . . 30-12 06/09 113.5 113.2 113.4 0.7 0.2 0.0 0.1 0.4
Courier, messenger, and U.S. postal services. . . . . . . . . . . . . . . . . . . . . . . . . . . . 30-16 06/09 122.8 122.8 126.1 4.0 2.7 0.4 0.2 0.1
Warehousing, storage, and related services3. . . . . . . . . . . . . . . . . . . . . . . . . . . . . 32-1 12/08 97.5 96.1 96.1 -1.0 0.0 -0.8 0.1 0.0
Advertising space sales in periodicals and newspapers. . . . . . . . . . . . . . . . . . . 36-11 06/09 102.7 103.7 104.7 2.3 1.0 0.1 0.8 -0.1
Business wired telecommunication services3. . . . . . . . . . . . . . . . . . . . . . . . . . . . . . 37-12 06/09 95.9 96.0 95.9 -0.5 -0.1 -0.9 0.1 -0.1
Wireless telecommunication services. . . . . . . . . . . . . . . . . . . . . . . . . . . . . . . . . . . . . 37-2 06/09 89.8 89.4 88.5 -1.9 -1.0 -1.1 1.0 -0.7
Data processing and related services3. . . . . . . . . . . . . . . . . . . . . . . . . . . . . . . . . . . . 38-1 06/09 100.5 100.8 100.8 0.1 0.0 0.0 0.0 0.0
Business loans (partial)3. . . . . . . . . . . . . . . . . . . . . . . . . . . . . . . . . . . . . . . . . . . . . . . . . 39-11 04/09 218.3 207.9 215.3 -5.0 3.6 -0.5 -1.8 3.6
Deposit services (partial)3. . . . . . . . . . . . . . . . . . . . . . . . . . . . . . . . . . . . . . . . . . . . . . . . 39-2 04/09 56.9 57.6 58.6 5.4 1.7 0.5 1.2 1.7
Securities brokerage, dealing, investment advice, and related services3. . . . 40-11 06/09 103.4 104.0 101.4 -0.3 -2.5 -0.4 -0.5 -2.5
Portfolio management3. . . . . . . . . . . . . . . . . . . . . . . . . . . . . . . . . . . . . . . . . . . . . . . . . . 40-2 12/08 153.8 165.4 168.3 16.6 1.8 0.9 1.2 1.8
Investment banking3. . . . . . . . . . . . . . . . . . . . . . . . . . . . . . . . . . . . . . . . . . . . . . . . . . . . . 40-3 12/08 132.1 133.1 133.2 7.8 0.1 0.6 3.3 0.1
Insurance. . . . . . . . . . . . . . . . . . . . . . . . . . . . . . . . . . . . . . . . . . . . . . . . . . . . . . . . . . . . . . . 41-11 06/09 110.1 110.2 110.3 1.0 0.1 0.2 0.1 -0.3
Annuities3. . . . . . . . . . . . . . . . . . . . . . . . . . . . . . . . . . . . . . . . . . . . . . . . . . . . . . . . . . . . . . . 41-2 03/09 108.5 108.6 109.3 3.6 0.6 1.4 -0.4 0.6
Nonresidential real estate rents. . . . . . . . . . . . . . . . . . . . . . . . . . . . . . . . . . . . . . . . . . 43-11 06/09 102.9 103.7 103.8 2.4 0.1 0.3 0.1 0.2
Nonresidential property sales and leases3. . . . . . . . . . . . . . . . . . . . . . . . . . . . . . . . 43-12 12/08 103.3 104.2 104.9 2.4 0.7 1.1 -0.2 0.7
Nonresidential property management fees3. . . . . . . . . . . . . . . . . . . . . . . . . . . . . . . 43-13 12/08 93.5 93.9 93.8 1.1 -0.1 1.2 -0.2 -0.1
Residential property management fees3. . . . . . . . . . . . . . . . . . . . . . . . . . . . . . . . . . 43-22 12/08 105.1 105.5 105.9 1.8 0.4 0.1 0.1 0.4
Construction, mining, and forestry machinery and equipment rental andleasing3. . . . . . . . . . . . . . . . . . . . . . . . . . . . . . . . . . . . . . . . . . . . . . . . . . . . . . . . . . . . . . . 44-3 03/09 106.9 107.6 103.4 -1.3 -3.9 0.0 0.7 -3.9
Legal services. . . . . . . . . . . . . . . . . . . . . . . . . . . . . . . . . . . . . . . . . . . . . . . . . . . . . . . . . . . 45-1 03/09 113.7 113.3 115.0 2.8 1.5 0.1 0.4 -0.1
Accounting services (partial). . . . . . . . . . . . . . . . . . . . . . . . . . . . . . . . . . . . . . . . . . . . . 45-2 06/09 100.2 100.5 101.0 1.2 0.5 0.0 0.1 0.3
Architectural and engineering services. . . . . . . . . . . . . . . . . . . . . . . . . . . . . . . . . . . . 45-3 06/09 104.5 104.1 104.6 1.5 0.5 -0.1 -0.1 0.7
Management, scientific, and technical consulting3. . . . . . . . . . . . . . . . . . . . . . . . . 45-4 06/09 103.5 102.6 102.8 -2.7 0.2 0.0 -0.4 0.2
See footnotes at end of table.
31
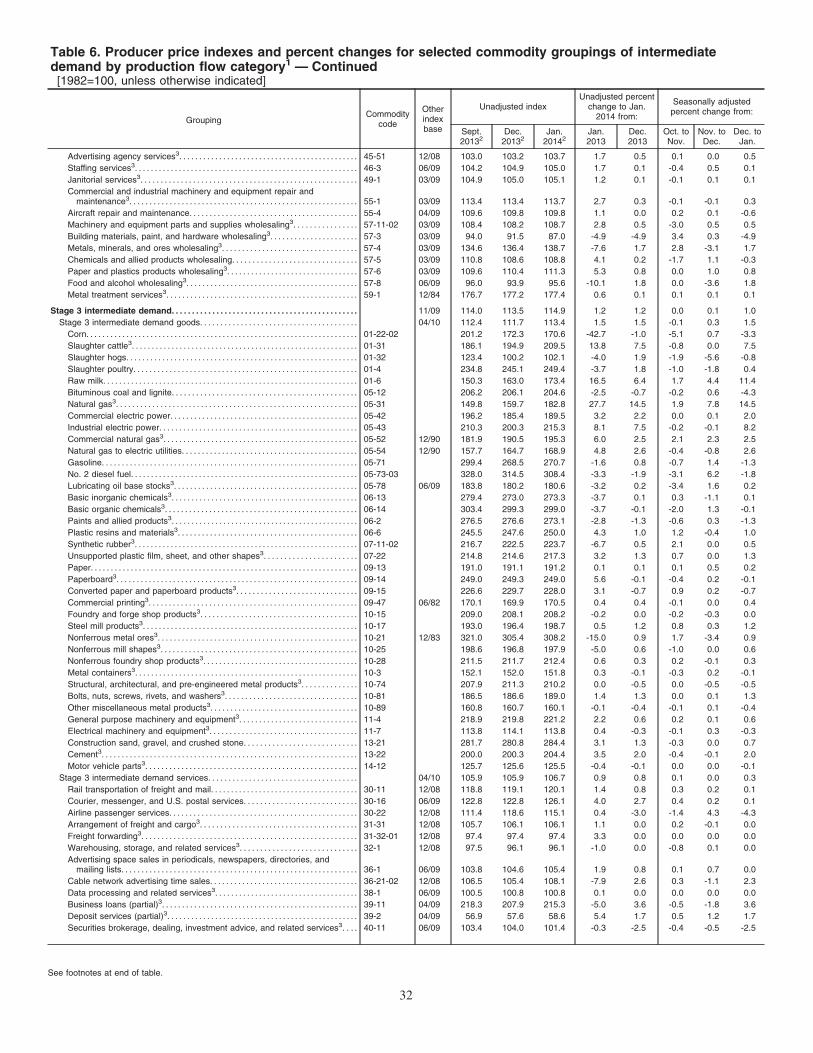
Table 6. Producer price indexes and percent changes for selected commodity groupings of intermediatedemand by production flow category1 — Continued[1982=100, unless otherwise indicated]
GroupingCommodity
code
Otherindexbase
Unadjusted indexUnadjusted percent
change to Jan.2014 from:
Seasonally adjustedpercent change from:
Sept.20132
Dec.20132
Jan.20142
Jan.2013
Dec.2013
Oct. toNov.
Nov. toDec.
Dec. toJan.
Advertising agency services3. . . . . . . . . . . . . . . . . . . . . . . . . . . . . . . . . . . . . . . . . . . . . 45-51 12/08 103.0 103.2 103.7 1.7 0.5 0.1 0.0 0.5
Staffing services3. . . . . . . . . . . . . . . . . . . . . . . . . . . . . . . . . . . . . . . . . . . . . . . . . . . . . . . . 46-3 06/09 104.2 104.9 105.0 1.7 0.1 -0.4 0.5 0.1
Janitorial services3. . . . . . . . . . . . . . . . . . . . . . . . . . . . . . . . . . . . . . . . . . . . . . . . . . . . . . 49-1 03/09 104.9 105.0 105.1 1.2 0.1 -0.1 0.1 0.1
Commercial and industrial machinery and equipment repair andmaintenance3. . . . . . . . . . . . . . . . . . . . . . . . . . . . . . . . . . . . . . . . . . . . . . . . . . . . . . . . . 55-1 03/09 113.4 113.4 113.7 2.7 0.3 -0.1 -0.1 0.3
Aircraft repair and maintenance. . . . . . . . . . . . . . . . . . . . . . . . . . . . . . . . . . . . . . . . . . 55-4 04/09 109.6 109.8 109.8 1.1 0.0 0.2 0.1 -0.6
Machinery and equipment parts and supplies wholesaling3. . . . . . . . . . . . . . . . 57-11-02 03/09 108.4 108.2 108.7 2.8 0.5 -3.0 0.5 0.5
Building materials, paint, and hardware wholesaling3. . . . . . . . . . . . . . . . . . . . . . 57-3 03/09 94.0 91.5 87.0 -4.9 -4.9 3.4 0.3 -4.9
Metals, minerals, and ores wholesaling3. . . . . . . . . . . . . . . . . . . . . . . . . . . . . . . . . . 57-4 03/09 134.6 136.4 138.7 -7.6 1.7 2.8 -3.1 1.7
Chemicals and allied products wholesaling. . . . . . . . . . . . . . . . . . . . . . . . . . . . . . . 57-5 03/09 110.8 108.6 108.8 4.1 0.2 -1.7 1.1 -0.3
Paper and plastics products wholesaling3. . . . . . . . . . . . . . . . . . . . . . . . . . . . . . . . . 57-6 03/09 109.6 110.4 111.3 5.3 0.8 0.0 1.0 0.8
Food and alcohol wholesaling3. . . . . . . . . . . . . . . . . . . . . . . . . . . . . . . . . . . . . . . . . . . 57-8 06/09 96.0 93.9 95.6 -10.1 1.8 0.0 -3.6 1.8
Metal treatment services3. . . . . . . . . . . . . . . . . . . . . . . . . . . . . . . . . . . . . . . . . . . . . . . . 59-1 12/84 176.7 177.2 177.4 0.6 0.1 0.1 0.1 0.1
Stage 3 intermediate demand. . . . . . . . . . . . . . . . . . . . . . . . . . . . . . . . . . . . . . . . . . . . . . 11/09 114.0 113.5 114.9 1.2 1.2 0.0 0.1 1.0
Stage 3 intermediate demand goods. . . . . . . . . . . . . . . . . . . . . . . . . . . . . . . . . . . . . . . 04/10 112.4 111.7 113.4 1.5 1.5 -0.1 0.3 1.5
Corn. . . . . . . . . . . . . . . . . . . . . . . . . . . . . . . . . . . . . . . . . . . . . . . . . . . . . . . . . . . . . . . . . . . . 01-22-02 201.2 172.3 170.6 -42.7 -1.0 -5.1 0.7 -3.3
Slaughter cattle3. . . . . . . . . . . . . . . . . . . . . . . . . . . . . . . . . . . . . . . . . . . . . . . . . . . . . . . . . 01-31 186.1 194.9 209.5 13.8 7.5 -0.8 0.0 7.5
Slaughter hogs. . . . . . . . . . . . . . . . . . . . . . . . . . . . . . . . . . . . . . . . . . . . . . . . . . . . . . . . . . 01-32 123.4 100.2 102.1 -4.0 1.9 -1.9 -5.6 -0.8
Slaughter poultry. . . . . . . . . . . . . . . . . . . . . . . . . . . . . . . . . . . . . . . . . . . . . . . . . . . . . . . . 01-4 234.8 245.1 249.4 -3.7 1.8 -1.0 -1.8 0.4
Raw milk. . . . . . . . . . . . . . . . . . . . . . . . . . . . . . . . . . . . . . . . . . . . . . . . . . . . . . . . . . . . . . . . 01-6 150.3 163.0 173.4 16.5 6.4 1.7 4.4 11.4
Bituminous coal and lignite. . . . . . . . . . . . . . . . . . . . . . . . . . . . . . . . . . . . . . . . . . . . . . 05-12 206.2 206.1 204.6 -2.5 -0.7 -0.2 0.6 -4.3
Natural gas3. . . . . . . . . . . . . . . . . . . . . . . . . . . . . . . . . . . . . . . . . . . . . . . . . . . . . . . . . . . . 05-31 149.8 159.7 182.8 27.7 14.5 1.9 7.8 14.5
Commercial electric power. . . . . . . . . . . . . . . . . . . . . . . . . . . . . . . . . . . . . . . . . . . . . . . 05-42 196.2 185.4 189.5 3.2 2.2 0.0 0.1 2.0
Industrial electric power. . . . . . . . . . . . . . . . . . . . . . . . . . . . . . . . . . . . . . . . . . . . . . . . . . 05-43 210.3 200.3 215.3 8.1 7.5 -0.2 -0.1 8.2
Commercial natural gas3. . . . . . . . . . . . . . . . . . . . . . . . . . . . . . . . . . . . . . . . . . . . . . . . . 05-52 12/90 181.9 190.5 195.3 6.0 2.5 2.1 2.3 2.5
Natural gas to electric utilities. . . . . . . . . . . . . . . . . . . . . . . . . . . . . . . . . . . . . . . . . . . . 05-54 12/90 157.7 164.7 168.9 4.8 2.6 -0.4 -0.8 2.6
Gasoline. . . . . . . . . . . . . . . . . . . . . . . . . . . . . . . . . . . . . . . . . . . . . . . . . . . . . . . . . . . . . . . . 05-71 299.4 268.5 270.7 -1.6 0.8 -0.7 1.4 -1.3
No. 2 diesel fuel. . . . . . . . . . . . . . . . . . . . . . . . . . . . . . . . . . . . . . . . . . . . . . . . . . . . . . . . . 05-73-03 328.0 314.5 308.4 -3.3 -1.9 -3.1 6.2 -1.8
Lubricating oil base stocks3. . . . . . . . . . . . . . . . . . . . . . . . . . . . . . . . . . . . . . . . . . . . . . 05-78 06/09 183.8 180.2 180.6 -3.2 0.2 -3.4 1.6 0.2
Basic inorganic chemicals3. . . . . . . . . . . . . . . . . . . . . . . . . . . . . . . . . . . . . . . . . . . . . . . 06-13 279.4 273.0 273.3 -3.7 0.1 0.3 -1.1 0.1
Basic organic chemicals3. . . . . . . . . . . . . . . . . . . . . . . . . . . . . . . . . . . . . . . . . . . . . . . . 06-14 303.4 299.3 299.0 -3.7 -0.1 -2.0 1.3 -0.1
Paints and allied products3. . . . . . . . . . . . . . . . . . . . . . . . . . . . . . . . . . . . . . . . . . . . . . . 06-2 276.5 276.6 273.1 -2.8 -1.3 -0.6 0.3 -1.3
Plastic resins and materials3. . . . . . . . . . . . . . . . . . . . . . . . . . . . . . . . . . . . . . . . . . . . . 06-6 245.5 247.6 250.0 4.3 1.0 1.2 -0.4 1.0
Synthetic rubber3. . . . . . . . . . . . . . . . . . . . . . . . . . . . . . . . . . . . . . . . . . . . . . . . . . . . . . . . 07-11-02 216.7 222.5 223.7 -6.7 0.5 2.1 0.0 0.5
Unsupported plastic film, sheet, and other shapes3. . . . . . . . . . . . . . . . . . . . . . . 07-22 214.8 214.6 217.3 3.2 1.3 0.7 0.0 1.3
Paper. . . . . . . . . . . . . . . . . . . . . . . . . . . . . . . . . . . . . . . . . . . . . . . . . . . . . . . . . . . . . . . . . . . 09-13 191.0 191.1 191.2 0.1 0.1 0.1 0.5 0.2
Paperboard3. . . . . . . . . . . . . . . . . . . . . . . . . . . . . . . . . . . . . . . . . . . . . . . . . . . . . . . . . . . . 09-14 249.0 249.3 249.0 5.6 -0.1 -0.4 0.2 -0.1
Converted paper and paperboard products3. . . . . . . . . . . . . . . . . . . . . . . . . . . . . . 09-15 226.6 229.7 228.0 3.1 -0.7 0.9 0.2 -0.7
Commercial printing3. . . . . . . . . . . . . . . . . . . . . . . . . . . . . . . . . . . . . . . . . . . . . . . . . . . . 09-47 06/82 170.1 169.9 170.5 0.4 0.4 -0.1 0.0 0.4
Foundry and forge shop products3. . . . . . . . . . . . . . . . . . . . . . . . . . . . . . . . . . . . . . . 10-15 209.0 208.1 208.2 -0.2 0.0 -0.2 -0.3 0.0
Steel mill products3. . . . . . . . . . . . . . . . . . . . . . . . . . . . . . . . . . . . . . . . . . . . . . . . . . . . . . 10-17 193.0 196.4 198.7 0.5 1.2 0.8 0.3 1.2
Nonferrous metal ores3. . . . . . . . . . . . . . . . . . . . . . . . . . . . . . . . . . . . . . . . . . . . . . . . . . 10-21 12/83 321.0 305.4 308.2 -15.0 0.9 1.7 -3.4 0.9
Nonferrous mill shapes3. . . . . . . . . . . . . . . . . . . . . . . . . . . . . . . . . . . . . . . . . . . . . . . . . 10-25 198.6 196.8 197.9 -5.0 0.6 -1.0 0.0 0.6
Nonferrous foundry shop products3. . . . . . . . . . . . . . . . . . . . . . . . . . . . . . . . . . . . . . . 10-28 211.5 211.7 212.4 0.6 0.3 0.2 -0.1 0.3
Metal containers3. . . . . . . . . . . . . . . . . . . . . . . . . . . . . . . . . . . . . . . . . . . . . . . . . . . . . . . . 10-3 152.1 152.0 151.8 0.3 -0.1 -0.3 0.2 -0.1
Structural, architectural, and pre-engineered metal products3. . . . . . . . . . . . . . 10-74 207.9 211.3 210.2 0.0 -0.5 0.0 -0.5 -0.5
Bolts, nuts, screws, rivets, and washers3. . . . . . . . . . . . . . . . . . . . . . . . . . . . . . . . . 10-81 186.5 186.6 189.0 1.4 1.3 0.0 0.1 1.3
Other miscellaneous metal products3. . . . . . . . . . . . . . . . . . . . . . . . . . . . . . . . . . . . . 10-89 160.8 160.7 160.1 -0.1 -0.4 -0.1 0.1 -0.4
General purpose machinery and equipment3. . . . . . . . . . . . . . . . . . . . . . . . . . . . . . 11-4 218.9 219.8 221.2 2.2 0.6 0.2 0.1 0.6
Electrical machinery and equipment3. . . . . . . . . . . . . . . . . . . . . . . . . . . . . . . . . . . . . 11-7 113.8 114.1 113.8 0.4 -0.3 -0.1 0.3 -0.3
Construction sand, gravel, and crushed stone. . . . . . . . . . . . . . . . . . . . . . . . . . . . 13-21 281.7 280.8 284.4 3.1 1.3 -0.3 0.0 0.7
Cement3. . . . . . . . . . . . . . . . . . . . . . . . . . . . . . . . . . . . . . . . . . . . . . . . . . . . . . . . . . . . . . . . 13-22 200.0 200.3 204.4 3.5 2.0 -0.4 -0.1 2.0
Motor vehicle parts3. . . . . . . . . . . . . . . . . . . . . . . . . . . . . . . . . . . . . . . . . . . . . . . . . . . . . 14-12 125.7 125.6 125.5 -0.4 -0.1 0.0 0.0 -0.1
Stage 3 intermediate demand services. . . . . . . . . . . . . . . . . . . . . . . . . . . . . . . . . . . . . 04/10 105.9 105.9 106.7 0.9 0.8 0.1 0.0 0.3
Rail transportation of freight and mail. . . . . . . . . . . . . . . . . . . . . . . . . . . . . . . . . . . . . 30-11 12/08 118.8 119.1 120.1 1.4 0.8 0.3 0.2 0.1
Courier, messenger, and U.S. postal services. . . . . . . . . . . . . . . . . . . . . . . . . . . . 30-16 06/09 122.8 122.8 126.1 4.0 2.7 0.4 0.2 0.1
Airline passenger services. . . . . . . . . . . . . . . . . . . . . . . . . . . . . . . . . . . . . . . . . . . . . . . 30-22 12/08 111.4 118.6 115.1 0.4 -3.0 -1.4 4.3 -4.3
Arrangement of freight and cargo3. . . . . . . . . . . . . . . . . . . . . . . . . . . . . . . . . . . . . . . 31-31 12/08 105.7 106.1 106.1 1.1 0.0 0.2 -0.1 0.0
Freight forwarding3. . . . . . . . . . . . . . . . . . . . . . . . . . . . . . . . . . . . . . . . . . . . . . . . . . . . . . 31-32-01 12/08 97.4 97.4 97.4 3.3 0.0 0.0 0.0 0.0
Warehousing, storage, and related services3. . . . . . . . . . . . . . . . . . . . . . . . . . . . . 32-1 12/08 97.5 96.1 96.1 -1.0 0.0 -0.8 0.1 0.0
Advertising space sales in periodicals, newspapers, directories, andmailing lists. . . . . . . . . . . . . . . . . . . . . . . . . . . . . . . . . . . . . . . . . . . . . . . . . . . . . . . . . . . 36-1 06/09 103.8 104.6 105.4 1.9 0.8 0.1 0.7 0.0
Cable network advertising time sales. . . . . . . . . . . . . . . . . . . . . . . . . . . . . . . . . . . . . 36-21-02 12/08 106.5 105.4 108.1 -7.9 2.6 0.3 -1.1 2.3
Data processing and related services3. . . . . . . . . . . . . . . . . . . . . . . . . . . . . . . . . . . . 38-1 06/09 100.5 100.8 100.8 0.1 0.0 0.0 0.0 0.0
Business loans (partial)3. . . . . . . . . . . . . . . . . . . . . . . . . . . . . . . . . . . . . . . . . . . . . . . . . 39-11 04/09 218.3 207.9 215.3 -5.0 3.6 -0.5 -1.8 3.6
Deposit services (partial)3. . . . . . . . . . . . . . . . . . . . . . . . . . . . . . . . . . . . . . . . . . . . . . . . 39-2 04/09 56.9 57.6 58.6 5.4 1.7 0.5 1.2 1.7
Securities brokerage, dealing, investment advice, and related services3. . . . 40-11 06/09 103.4 104.0 101.4 -0.3 -2.5 -0.4 -0.5 -2.5
See footnotes at end of table.
32
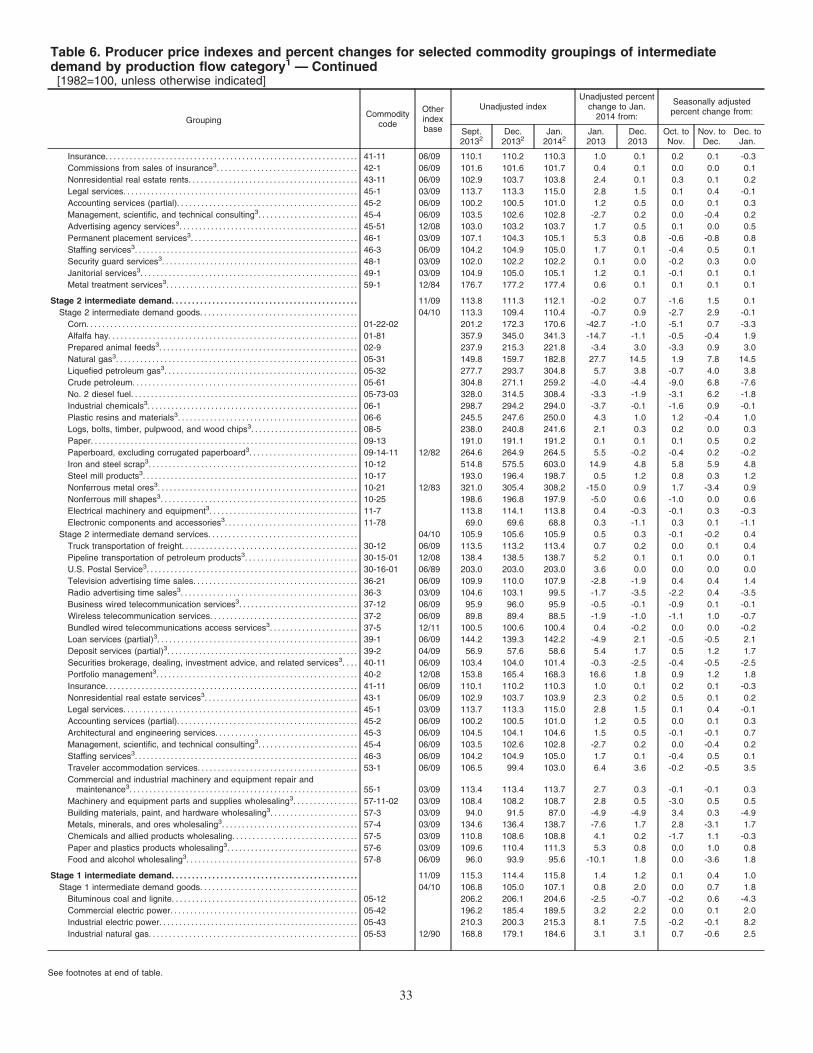
Table 6. Producer price indexes and percent changes for selected commodity groupings of intermediatedemand by production flow category1 — Continued[1982=100, unless otherwise indicated]
GroupingCommodity
code
Otherindexbase
Unadjusted indexUnadjusted percent
change to Jan.2014 from:
Seasonally adjustedpercent change from:
Sept.20132
Dec.20132
Jan.20142
Jan.2013
Dec.2013
Oct. toNov.
Nov. toDec.
Dec. toJan.
Insurance. . . . . . . . . . . . . . . . . . . . . . . . . . . . . . . . . . . . . . . . . . . . . . . . . . . . . . . . . . . . . . . 41-11 06/09 110.1 110.2 110.3 1.0 0.1 0.2 0.1 -0.3
Commissions from sales of insurance3. . . . . . . . . . . . . . . . . . . . . . . . . . . . . . . . . . . 42-1 06/09 101.6 101.6 101.7 0.4 0.1 0.0 0.0 0.1
Nonresidential real estate rents. . . . . . . . . . . . . . . . . . . . . . . . . . . . . . . . . . . . . . . . . . 43-11 06/09 102.9 103.7 103.8 2.4 0.1 0.3 0.1 0.2
Legal services. . . . . . . . . . . . . . . . . . . . . . . . . . . . . . . . . . . . . . . . . . . . . . . . . . . . . . . . . . . 45-1 03/09 113.7 113.3 115.0 2.8 1.5 0.1 0.4 -0.1
Accounting services (partial). . . . . . . . . . . . . . . . . . . . . . . . . . . . . . . . . . . . . . . . . . . . . 45-2 06/09 100.2 100.5 101.0 1.2 0.5 0.0 0.1 0.3
Management, scientific, and technical consulting3. . . . . . . . . . . . . . . . . . . . . . . . . 45-4 06/09 103.5 102.6 102.8 -2.7 0.2 0.0 -0.4 0.2
Advertising agency services3. . . . . . . . . . . . . . . . . . . . . . . . . . . . . . . . . . . . . . . . . . . . . 45-51 12/08 103.0 103.2 103.7 1.7 0.5 0.1 0.0 0.5
Permanent placement services3. . . . . . . . . . . . . . . . . . . . . . . . . . . . . . . . . . . . . . . . . . 46-1 03/09 107.1 104.3 105.1 5.3 0.8 -0.6 -0.8 0.8
Staffing services3. . . . . . . . . . . . . . . . . . . . . . . . . . . . . . . . . . . . . . . . . . . . . . . . . . . . . . . . 46-3 06/09 104.2 104.9 105.0 1.7 0.1 -0.4 0.5 0.1
Security guard services3. . . . . . . . . . . . . . . . . . . . . . . . . . . . . . . . . . . . . . . . . . . . . . . . . 48-1 03/09 102.0 102.2 102.2 0.1 0.0 -0.2 0.3 0.0
Janitorial services3. . . . . . . . . . . . . . . . . . . . . . . . . . . . . . . . . . . . . . . . . . . . . . . . . . . . . . 49-1 03/09 104.9 105.0 105.1 1.2 0.1 -0.1 0.1 0.1
Metal treatment services3. . . . . . . . . . . . . . . . . . . . . . . . . . . . . . . . . . . . . . . . . . . . . . . . 59-1 12/84 176.7 177.2 177.4 0.6 0.1 0.1 0.1 0.1
Stage 2 intermediate demand. . . . . . . . . . . . . . . . . . . . . . . . . . . . . . . . . . . . . . . . . . . . . . 11/09 113.8 111.3 112.1 -0.2 0.7 -1.6 1.5 0.1
Stage 2 intermediate demand goods. . . . . . . . . . . . . . . . . . . . . . . . . . . . . . . . . . . . . . . 04/10 113.3 109.4 110.4 -0.7 0.9 -2.7 2.9 -0.1
Corn. . . . . . . . . . . . . . . . . . . . . . . . . . . . . . . . . . . . . . . . . . . . . . . . . . . . . . . . . . . . . . . . . . . . 01-22-02 201.2 172.3 170.6 -42.7 -1.0 -5.1 0.7 -3.3
Alfalfa hay. . . . . . . . . . . . . . . . . . . . . . . . . . . . . . . . . . . . . . . . . . . . . . . . . . . . . . . . . . . . . . 01-81 357.9 345.0 341.3 -14.7 -1.1 -0.5 -0.4 1.9
Prepared animal feeds3. . . . . . . . . . . . . . . . . . . . . . . . . . . . . . . . . . . . . . . . . . . . . . . . . . 02-9 237.9 215.3 221.8 -3.4 3.0 -3.3 0.9 3.0
Natural gas3. . . . . . . . . . . . . . . . . . . . . . . . . . . . . . . . . . . . . . . . . . . . . . . . . . . . . . . . . . . . 05-31 149.8 159.7 182.8 27.7 14.5 1.9 7.8 14.5
Liquefied petroleum gas3. . . . . . . . . . . . . . . . . . . . . . . . . . . . . . . . . . . . . . . . . . . . . . . . 05-32 277.7 293.7 304.8 5.7 3.8 -0.7 4.0 3.8
Crude petroleum. . . . . . . . . . . . . . . . . . . . . . . . . . . . . . . . . . . . . . . . . . . . . . . . . . . . . . . . 05-61 304.8 271.1 259.2 -4.0 -4.4 -9.0 6.8 -7.6
No. 2 diesel fuel. . . . . . . . . . . . . . . . . . . . . . . . . . . . . . . . . . . . . . . . . . . . . . . . . . . . . . . . . 05-73-03 328.0 314.5 308.4 -3.3 -1.9 -3.1 6.2 -1.8
Industrial chemicals3. . . . . . . . . . . . . . . . . . . . . . . . . . . . . . . . . . . . . . . . . . . . . . . . . . . . . 06-1 298.7 294.2 294.0 -3.7 -0.1 -1.6 0.9 -0.1
Plastic resins and materials3. . . . . . . . . . . . . . . . . . . . . . . . . . . . . . . . . . . . . . . . . . . . . 06-6 245.5 247.6 250.0 4.3 1.0 1.2 -0.4 1.0
Logs, bolts, timber, pulpwood, and wood chips3. . . . . . . . . . . . . . . . . . . . . . . . . . . 08-5 238.0 240.8 241.6 2.1 0.3 0.2 0.0 0.3
Paper. . . . . . . . . . . . . . . . . . . . . . . . . . . . . . . . . . . . . . . . . . . . . . . . . . . . . . . . . . . . . . . . . . . 09-13 191.0 191.1 191.2 0.1 0.1 0.1 0.5 0.2
Paperboard, excluding corrugated paperboard3. . . . . . . . . . . . . . . . . . . . . . . . . . . 09-14-11 12/82 264.6 264.9 264.5 5.5 -0.2 -0.4 0.2 -0.2
Iron and steel scrap3. . . . . . . . . . . . . . . . . . . . . . . . . . . . . . . . . . . . . . . . . . . . . . . . . . . . 10-12 514.8 575.5 603.0 14.9 4.8 5.8 5.9 4.8
Steel mill products3. . . . . . . . . . . . . . . . . . . . . . . . . . . . . . . . . . . . . . . . . . . . . . . . . . . . . . 10-17 193.0 196.4 198.7 0.5 1.2 0.8 0.3 1.2
Nonferrous metal ores3. . . . . . . . . . . . . . . . . . . . . . . . . . . . . . . . . . . . . . . . . . . . . . . . . . 10-21 12/83 321.0 305.4 308.2 -15.0 0.9 1.7 -3.4 0.9
Nonferrous mill shapes3. . . . . . . . . . . . . . . . . . . . . . . . . . . . . . . . . . . . . . . . . . . . . . . . . 10-25 198.6 196.8 197.9 -5.0 0.6 -1.0 0.0 0.6
Electrical machinery and equipment3. . . . . . . . . . . . . . . . . . . . . . . . . . . . . . . . . . . . . 11-7 113.8 114.1 113.8 0.4 -0.3 -0.1 0.3 -0.3
Electronic components and accessories3. . . . . . . . . . . . . . . . . . . . . . . . . . . . . . . . . 11-78 69.0 69.6 68.8 0.3 -1.1 0.3 0.1 -1.1
Stage 2 intermediate demand services. . . . . . . . . . . . . . . . . . . . . . . . . . . . . . . . . . . . . 04/10 105.9 105.6 105.9 0.5 0.3 -0.1 -0.2 0.4
Truck transportation of freight. . . . . . . . . . . . . . . . . . . . . . . . . . . . . . . . . . . . . . . . . . . . 30-12 06/09 113.5 113.2 113.4 0.7 0.2 0.0 0.1 0.4
Pipeline transportation of petroleum products3. . . . . . . . . . . . . . . . . . . . . . . . . . . . 30-15-01 12/08 138.4 138.5 138.7 5.2 0.1 0.1 0.0 0.1
U.S. Postal Service3. . . . . . . . . . . . . . . . . . . . . . . . . . . . . . . . . . . . . . . . . . . . . . . . . . . . . 30-16-01 06/89 203.0 203.0 203.0 3.6 0.0 0.0 0.0 0.0
Television advertising time sales. . . . . . . . . . . . . . . . . . . . . . . . . . . . . . . . . . . . . . . . . 36-21 06/09 109.9 110.0 107.9 -2.8 -1.9 0.4 0.4 1.4
Radio advertising time sales3. . . . . . . . . . . . . . . . . . . . . . . . . . . . . . . . . . . . . . . . . . . . 36-3 03/09 104.6 103.1 99.5 -1.7 -3.5 -2.2 0.4 -3.5
Business wired telecommunication services3. . . . . . . . . . . . . . . . . . . . . . . . . . . . . . 37-12 06/09 95.9 96.0 95.9 -0.5 -0.1 -0.9 0.1 -0.1
Wireless telecommunication services. . . . . . . . . . . . . . . . . . . . . . . . . . . . . . . . . . . . . 37-2 06/09 89.8 89.4 88.5 -1.9 -1.0 -1.1 1.0 -0.7
Bundled wired telecommunications access services3. . . . . . . . . . . . . . . . . . . . . . 37-5 12/11 100.5 100.6 100.4 0.4 -0.2 0.0 0.0 -0.2
Loan services (partial)3. . . . . . . . . . . . . . . . . . . . . . . . . . . . . . . . . . . . . . . . . . . . . . . . . . 39-1 06/09 144.2 139.3 142.2 -4.9 2.1 -0.5 -0.5 2.1
Deposit services (partial)3. . . . . . . . . . . . . . . . . . . . . . . . . . . . . . . . . . . . . . . . . . . . . . . . 39-2 04/09 56.9 57.6 58.6 5.4 1.7 0.5 1.2 1.7
Securities brokerage, dealing, investment advice, and related services3. . . . 40-11 06/09 103.4 104.0 101.4 -0.3 -2.5 -0.4 -0.5 -2.5
Portfolio management3. . . . . . . . . . . . . . . . . . . . . . . . . . . . . . . . . . . . . . . . . . . . . . . . . . 40-2 12/08 153.8 165.4 168.3 16.6 1.8 0.9 1.2 1.8
Insurance. . . . . . . . . . . . . . . . . . . . . . . . . . . . . . . . . . . . . . . . . . . . . . . . . . . . . . . . . . . . . . . 41-11 06/09 110.1 110.2 110.3 1.0 0.1 0.2 0.1 -0.3
Nonresidential real estate services3. . . . . . . . . . . . . . . . . . . . . . . . . . . . . . . . . . . . . . 43-1 06/09 102.9 103.7 103.9 2.3 0.2 0.5 0.1 0.2
Legal services. . . . . . . . . . . . . . . . . . . . . . . . . . . . . . . . . . . . . . . . . . . . . . . . . . . . . . . . . . . 45-1 03/09 113.7 113.3 115.0 2.8 1.5 0.1 0.4 -0.1
Accounting services (partial). . . . . . . . . . . . . . . . . . . . . . . . . . . . . . . . . . . . . . . . . . . . . 45-2 06/09 100.2 100.5 101.0 1.2 0.5 0.0 0.1 0.3
Architectural and engineering services. . . . . . . . . . . . . . . . . . . . . . . . . . . . . . . . . . . . 45-3 06/09 104.5 104.1 104.6 1.5 0.5 -0.1 -0.1 0.7
Management, scientific, and technical consulting3. . . . . . . . . . . . . . . . . . . . . . . . . 45-4 06/09 103.5 102.6 102.8 -2.7 0.2 0.0 -0.4 0.2
Staffing services3. . . . . . . . . . . . . . . . . . . . . . . . . . . . . . . . . . . . . . . . . . . . . . . . . . . . . . . . 46-3 06/09 104.2 104.9 105.0 1.7 0.1 -0.4 0.5 0.1
Traveler accommodation services. . . . . . . . . . . . . . . . . . . . . . . . . . . . . . . . . . . . . . . . 53-1 06/09 106.5 99.4 103.0 6.4 3.6 -0.2 -0.5 3.5
Commercial and industrial machinery and equipment repair andmaintenance3. . . . . . . . . . . . . . . . . . . . . . . . . . . . . . . . . . . . . . . . . . . . . . . . . . . . . . . . . 55-1 03/09 113.4 113.4 113.7 2.7 0.3 -0.1 -0.1 0.3
Machinery and equipment parts and supplies wholesaling3. . . . . . . . . . . . . . . . 57-11-02 03/09 108.4 108.2 108.7 2.8 0.5 -3.0 0.5 0.5
Building materials, paint, and hardware wholesaling3. . . . . . . . . . . . . . . . . . . . . . 57-3 03/09 94.0 91.5 87.0 -4.9 -4.9 3.4 0.3 -4.9
Metals, minerals, and ores wholesaling3. . . . . . . . . . . . . . . . . . . . . . . . . . . . . . . . . . 57-4 03/09 134.6 136.4 138.7 -7.6 1.7 2.8 -3.1 1.7
Chemicals and allied products wholesaling. . . . . . . . . . . . . . . . . . . . . . . . . . . . . . . 57-5 03/09 110.8 108.6 108.8 4.1 0.2 -1.7 1.1 -0.3
Paper and plastics products wholesaling3. . . . . . . . . . . . . . . . . . . . . . . . . . . . . . . . . 57-6 03/09 109.6 110.4 111.3 5.3 0.8 0.0 1.0 0.8
Food and alcohol wholesaling3. . . . . . . . . . . . . . . . . . . . . . . . . . . . . . . . . . . . . . . . . . . 57-8 06/09 96.0 93.9 95.6 -10.1 1.8 0.0 -3.6 1.8
Stage 1 intermediate demand. . . . . . . . . . . . . . . . . . . . . . . . . . . . . . . . . . . . . . . . . . . . . . 11/09 115.3 114.4 115.8 1.4 1.2 0.1 0.4 1.0
Stage 1 intermediate demand goods. . . . . . . . . . . . . . . . . . . . . . . . . . . . . . . . . . . . . . . 04/10 106.8 105.0 107.1 0.8 2.0 0.0 0.7 1.8
Bituminous coal and lignite. . . . . . . . . . . . . . . . . . . . . . . . . . . . . . . . . . . . . . . . . . . . . . 05-12 206.2 206.1 204.6 -2.5 -0.7 -0.2 0.6 -4.3
Commercial electric power. . . . . . . . . . . . . . . . . . . . . . . . . . . . . . . . . . . . . . . . . . . . . . . 05-42 196.2 185.4 189.5 3.2 2.2 0.0 0.1 2.0
Industrial electric power. . . . . . . . . . . . . . . . . . . . . . . . . . . . . . . . . . . . . . . . . . . . . . . . . . 05-43 210.3 200.3 215.3 8.1 7.5 -0.2 -0.1 8.2
Industrial natural gas. . . . . . . . . . . . . . . . . . . . . . . . . . . . . . . . . . . . . . . . . . . . . . . . . . . . 05-53 12/90 168.8 179.1 184.6 3.1 3.1 0.7 -0.6 2.5
See footnotes at end of table.
33

Table 6. Producer price indexes and percent changes for selected commodity groupings of intermediatedemand by production flow category1 — Continued[1982=100, unless otherwise indicated]
GroupingCommodity
code
Otherindexbase
Unadjusted indexUnadjusted percent
change to Jan.2014 from:
Seasonally adjustedpercent change from:
Sept.20132
Dec.20132
Jan.20142
Jan.2013
Dec.2013
Oct. toNov.
Nov. toDec.
Dec. toJan.
Gasoline. . . . . . . . . . . . . . . . . . . . . . . . . . . . . . . . . . . . . . . . . . . . . . . . . . . . . . . . . . . . . . . . 05-71 299.4 268.5 270.7 -1.6 0.8 -0.7 1.4 -1.3
No. 2 diesel fuel. . . . . . . . . . . . . . . . . . . . . . . . . . . . . . . . . . . . . . . . . . . . . . . . . . . . . . . . . 05-73-03 328.0 314.5 308.4 -3.3 -1.9 -3.1 6.2 -1.8
Lubricating oil base stocks3. . . . . . . . . . . . . . . . . . . . . . . . . . . . . . . . . . . . . . . . . . . . . . 05-78 06/09 183.8 180.2 180.6 -3.2 0.2 -3.4 1.6 0.2
Industrial chemicals3. . . . . . . . . . . . . . . . . . . . . . . . . . . . . . . . . . . . . . . . . . . . . . . . . . . . . 06-1 298.7 294.2 294.0 -3.7 -0.1 -1.6 0.9 -0.1
Plastic construction products3. . . . . . . . . . . . . . . . . . . . . . . . . . . . . . . . . . . . . . . . . . . . 07-21 207.6 207.3 208.7 0.1 0.7 0.4 0.0 0.7
Wastepaper. . . . . . . . . . . . . . . . . . . . . . . . . . . . . . . . . . . . . . . . . . . . . . . . . . . . . . . . . . . . . 09-12 371.6 346.4 352.7 0.3 1.8 0.4 -4.1 0.4
Commercial printing3. . . . . . . . . . . . . . . . . . . . . . . . . . . . . . . . . . . . . . . . . . . . . . . . . . . . 09-47 06/82 170.1 169.9 170.5 0.4 0.4 -0.1 0.0 0.4
Iron and steel scrap3. . . . . . . . . . . . . . . . . . . . . . . . . . . . . . . . . . . . . . . . . . . . . . . . . . . . 10-12 514.8 575.5 603.0 14.9 4.8 5.8 5.9 4.8
Steel mill products3. . . . . . . . . . . . . . . . . . . . . . . . . . . . . . . . . . . . . . . . . . . . . . . . . . . . . . 10-17 193.0 196.4 198.7 0.5 1.2 0.8 0.3 1.2
Primary nonferrous metals3. . . . . . . . . . . . . . . . . . . . . . . . . . . . . . . . . . . . . . . . . . . . . . 10-22 194.5 192.7 189.1 -13.9 -1.9 -1.5 -0.1 -1.9
Nonferrous scrap. . . . . . . . . . . . . . . . . . . . . . . . . . . . . . . . . . . . . . . . . . . . . . . . . . . . . . . . 10-23 366.6 364.2 370.4 -7.2 1.7 -0.9 -1.1 1.2
Nonferrous wire and cable3. . . . . . . . . . . . . . . . . . . . . . . . . . . . . . . . . . . . . . . . . . . . . . 10-26 255.1 252.0 256.2 -3.6 1.7 0.2 -1.4 1.7
Fabricated structural metal products. . . . . . . . . . . . . . . . . . . . . . . . . . . . . . . . . . . . . . 10-7 212.2 214.0 213.7 0.1 -0.1 0.0 0.1 -0.4
General purpose machinery and equipment3. . . . . . . . . . . . . . . . . . . . . . . . . . . . . . 11-4 218.9 219.8 221.2 2.2 0.6 0.2 0.1 0.6
Construction sand, gravel, and crushed stone. . . . . . . . . . . . . . . . . . . . . . . . . . . . 13-21 281.7 280.8 284.4 3.1 1.3 -0.3 0.0 0.7
Stage 1 intermediate demand services. . . . . . . . . . . . . . . . . . . . . . . . . . . . . . . . . . . . . 04/10 109.1 109.7 109.8 2.5 0.1 0.1 0.2 -0.2
Rail transportation of freight and mail. . . . . . . . . . . . . . . . . . . . . . . . . . . . . . . . . . . . . 30-11 12/08 118.8 119.1 120.1 1.4 0.8 0.3 0.2 0.1
Truck transportation of freight. . . . . . . . . . . . . . . . . . . . . . . . . . . . . . . . . . . . . . . . . . . . 30-12 06/09 113.5 113.2 113.4 0.7 0.2 0.0 0.1 0.4
Courier, messenger, and U.S. postal services. . . . . . . . . . . . . . . . . . . . . . . . . . . . 30-16 06/09 122.8 122.8 126.1 4.0 2.7 0.4 0.2 0.1
Book, periodical, and newspaper publishing sales and subscriptions3. . . . . . 33-1 06/09 109.7 109.9 109.8 1.8 -0.1 0.5 0.0 -0.1
Advertising space sales in periodicals, newspapers, directories, andmailing lists. . . . . . . . . . . . . . . . . . . . . . . . . . . . . . . . . . . . . . . . . . . . . . . . . . . . . . . . . . . 36-1 06/09 103.8 104.6 105.4 1.9 0.8 0.1 0.7 0.0
Business wired telecommunication services3. . . . . . . . . . . . . . . . . . . . . . . . . . . . . . 37-12 06/09 95.9 96.0 95.9 -0.5 -0.1 -0.9 0.1 -0.1
Wireless telecommunication services. . . . . . . . . . . . . . . . . . . . . . . . . . . . . . . . . . . . . 37-2 06/09 89.8 89.4 88.5 -1.9 -1.0 -1.1 1.0 -0.7
Data processing and related services3. . . . . . . . . . . . . . . . . . . . . . . . . . . . . . . . . . . . 38-1 06/09 100.5 100.8 100.8 0.1 0.0 0.0 0.0 0.0
Securities brokerage, dealing, investment advice, and related services3. . . . 40-11 06/09 103.4 104.0 101.4 -0.3 -2.5 -0.4 -0.5 -2.5
Portfolio management3. . . . . . . . . . . . . . . . . . . . . . . . . . . . . . . . . . . . . . . . . . . . . . . . . . 40-2 12/08 153.8 165.4 168.3 16.6 1.8 0.9 1.2 1.8
Investment banking3. . . . . . . . . . . . . . . . . . . . . . . . . . . . . . . . . . . . . . . . . . . . . . . . . . . . . 40-3 12/08 132.1 133.1 133.2 7.8 0.1 0.6 3.3 0.1
Insurance. . . . . . . . . . . . . . . . . . . . . . . . . . . . . . . . . . . . . . . . . . . . . . . . . . . . . . . . . . . . . . . 41-11 06/09 110.1 110.2 110.3 1.0 0.1 0.2 0.1 -0.3
Architectural and engineering services. . . . . . . . . . . . . . . . . . . . . . . . . . . . . . . . . . . . 45-3 06/09 104.5 104.1 104.6 1.5 0.5 -0.1 -0.1 0.7
Janitorial services3. . . . . . . . . . . . . . . . . . . . . . . . . . . . . . . . . . . . . . . . . . . . . . . . . . . . . . 49-1 03/09 104.9 105.0 105.1 1.2 0.1 -0.1 0.1 0.1
Waste collection. . . . . . . . . . . . . . . . . . . . . . . . . . . . . . . . . . . . . . . . . . . . . . . . . . . . . . . . . 50-1 12/08 112.3 112.3 113.2 1.8 0.8 0.3 0.3 0.5
Traveler accommodation services. . . . . . . . . . . . . . . . . . . . . . . . . . . . . . . . . . . . . . . . 53-11 06/09 106.5 99.4 103.0 6.4 3.6 -0.2 -0.5 3.5
Commercial and industrial machinery and equipment repair andmaintenance3. . . . . . . . . . . . . . . . . . . . . . . . . . . . . . . . . . . . . . . . . . . . . . . . . . . . . . . . . 55-1 03/09 113.4 113.4 113.7 2.7 0.3 -0.1 -0.1 0.3
Machinery and equipment parts and supplies wholesaling3. . . . . . . . . . . . . . . . 57-11-02 03/09 108.4 108.2 108.7 2.8 0.5 -3.0 0.5 0.5
Building materials, paint, and hardware wholesaling3. . . . . . . . . . . . . . . . . . . . . . 57-3 03/09 94.0 91.5 87.0 -4.9 -4.9 3.4 0.3 -4.9
Metals, minerals, and ores wholesaling3. . . . . . . . . . . . . . . . . . . . . . . . . . . . . . . . . . 57-4 03/09 134.6 136.4 138.7 -7.6 1.7 2.8 -3.1 1.7
Chemicals and allied products wholesaling. . . . . . . . . . . . . . . . . . . . . . . . . . . . . . . 57-5 03/09 110.8 108.6 108.8 4.1 0.2 -1.7 1.1 -0.3
Paper and plastics products wholesaling3. . . . . . . . . . . . . . . . . . . . . . . . . . . . . . . . . 57-6 03/09 109.6 110.4 111.3 5.3 0.8 0.0 1.0 0.8
Mining services3. . . . . . . . . . . . . . . . . . . . . . . . . . . . . . . . . . . . . . . . . . . . . . . . . . . . . . . . . 60-1 06/85 259.6 261.5 259.1 4.9 -0.9 -0.3 0.2 -0.9
1 Further information about the Final Demand-Intermediate Demand Aggregation system is available online at http://www.bls.gov/ppi/fdidaggregation.htm2 The indexes for September 2013 have been recalculated to incorporate late reports and corrections by respondents. All indexes are subject to revision 4 months after original
publication.3 Not seasonally adjusted.
″-″ Data not available.
NOTE: The term ″(partial)″ denotes incomplete coverage of the index category.
34
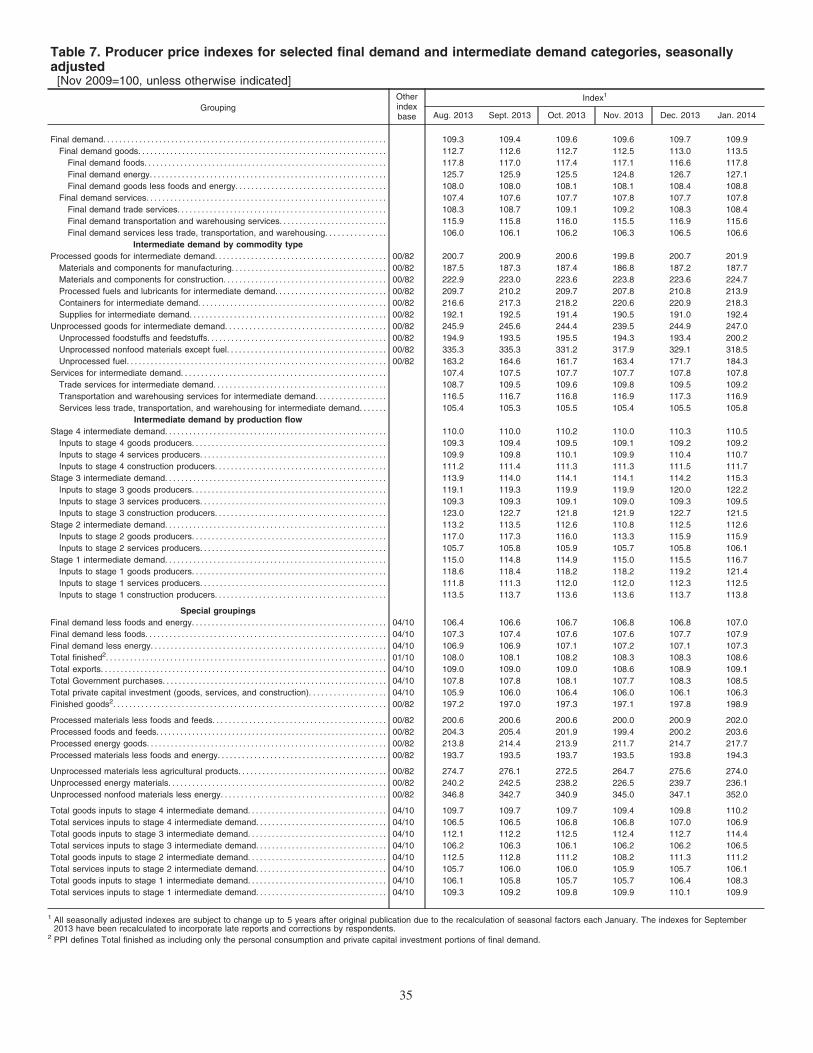
Table 7. Producer price indexes for selected final demand and intermediate demand categories, seasonallyadjusted[Nov 2009=100, unless otherwise indicated]
Grouping
Otherindexbase
Index1
Aug. 2013 Sept. 2013 Oct. 2013 Nov. 2013 Dec. 2013 Jan. 2014
Final demand. . . . . . . . . . . . . . . . . . . . . . . . . . . . . . . . . . . . . . . . . . . . . . . . . . . . . . . . . . . . . . . . . . . . . . . 109.3 109.4 109.6 109.6 109.7 109.9
Final demand goods. . . . . . . . . . . . . . . . . . . . . . . . . . . . . . . . . . . . . . . . . . . . . . . . . . . . . . . . . . . . . . 112.7 112.6 112.7 112.5 113.0 113.5
Final demand foods. . . . . . . . . . . . . . . . . . . . . . . . . . . . . . . . . . . . . . . . . . . . . . . . . . . . . . . . . . . . . 117.8 117.0 117.4 117.1 116.6 117.8
Final demand energy. . . . . . . . . . . . . . . . . . . . . . . . . . . . . . . . . . . . . . . . . . . . . . . . . . . . . . . . . . . 125.7 125.9 125.5 124.8 126.7 127.1
Final demand goods less foods and energy. . . . . . . . . . . . . . . . . . . . . . . . . . . . . . . . . . . . . . 108.0 108.0 108.1 108.1 108.4 108.8
Final demand services. . . . . . . . . . . . . . . . . . . . . . . . . . . . . . . . . . . . . . . . . . . . . . . . . . . . . . . . . . . . 107.4 107.6 107.7 107.8 107.7 107.8
Final demand trade services. . . . . . . . . . . . . . . . . . . . . . . . . . . . . . . . . . . . . . . . . . . . . . . . . . . . 108.3 108.7 109.1 109.2 108.3 108.4
Final demand transportation and warehousing services. . . . . . . . . . . . . . . . . . . . . . . . . . . 115.9 115.8 116.0 115.5 116.9 115.6
Final demand services less trade, transportation, and warehousing. . . . . . . . . . . . . . . 106.0 106.1 106.2 106.3 106.5 106.6
Intermediate demand by commodity type
Processed goods for intermediate demand. . . . . . . . . . . . . . . . . . . . . . . . . . . . . . . . . . . . . . . . . . . 00/82 200.7 200.9 200.6 199.8 200.7 201.9
Materials and components for manufacturing. . . . . . . . . . . . . . . . . . . . . . . . . . . . . . . . . . . . . . . 00/82 187.5 187.3 187.4 186.8 187.2 187.7
Materials and components for construction. . . . . . . . . . . . . . . . . . . . . . . . . . . . . . . . . . . . . . . . . 00/82 222.9 223.0 223.6 223.8 223.6 224.7
Processed fuels and lubricants for intermediate demand. . . . . . . . . . . . . . . . . . . . . . . . . . . . 00/82 209.7 210.2 209.7 207.8 210.8 213.9
Containers for intermediate demand. . . . . . . . . . . . . . . . . . . . . . . . . . . . . . . . . . . . . . . . . . . . . . . 00/82 216.6 217.3 218.2 220.6 220.9 218.3
Supplies for intermediate demand. . . . . . . . . . . . . . . . . . . . . . . . . . . . . . . . . . . . . . . . . . . . . . . . . 00/82 192.1 192.5 191.4 190.5 191.0 192.4
Unprocessed goods for intermediate demand. . . . . . . . . . . . . . . . . . . . . . . . . . . . . . . . . . . . . . . . 00/82 245.9 245.6 244.4 239.5 244.9 247.0
Unprocessed foodstuffs and feedstuffs. . . . . . . . . . . . . . . . . . . . . . . . . . . . . . . . . . . . . . . . . . . . . 00/82 194.9 193.5 195.5 194.3 193.4 200.2
Unprocessed nonfood materials except fuel. . . . . . . . . . . . . . . . . . . . . . . . . . . . . . . . . . . . . . . . 00/82 335.3 335.3 331.2 317.9 329.1 318.5
Unprocessed fuel. . . . . . . . . . . . . . . . . . . . . . . . . . . . . . . . . . . . . . . . . . . . . . . . . . . . . . . . . . . . . . . . . 00/82 163.2 164.6 161.7 163.4 171.7 184.3
Services for intermediate demand. . . . . . . . . . . . . . . . . . . . . . . . . . . . . . . . . . . . . . . . . . . . . . . . . . . 107.4 107.5 107.7 107.7 107.8 107.8
Trade services for intermediate demand. . . . . . . . . . . . . . . . . . . . . . . . . . . . . . . . . . . . . . . . . . . 108.7 109.5 109.6 109.8 109.5 109.2
Transportation and warehousing services for intermediate demand. . . . . . . . . . . . . . . . . . 116.5 116.7 116.8 116.9 117.3 116.9
Services less trade, transportation, and warehousing for intermediate demand. . . . . . . 105.4 105.3 105.5 105.4 105.5 105.8
Intermediate demand by production flow
Stage 4 intermediate demand. . . . . . . . . . . . . . . . . . . . . . . . . . . . . . . . . . . . . . . . . . . . . . . . . . . . . . . 110.0 110.0 110.2 110.0 110.3 110.5
Inputs to stage 4 goods producers. . . . . . . . . . . . . . . . . . . . . . . . . . . . . . . . . . . . . . . . . . . . . . . . . 109.3 109.4 109.5 109.1 109.2 109.2
Inputs to stage 4 services producers. . . . . . . . . . . . . . . . . . . . . . . . . . . . . . . . . . . . . . . . . . . . . . . 109.9 109.8 110.1 109.9 110.4 110.7
Inputs to stage 4 construction producers. . . . . . . . . . . . . . . . . . . . . . . . . . . . . . . . . . . . . . . . . . . 111.2 111.4 111.3 111.3 111.5 111.7
Stage 3 intermediate demand. . . . . . . . . . . . . . . . . . . . . . . . . . . . . . . . . . . . . . . . . . . . . . . . . . . . . . . 113.9 114.0 114.1 114.1 114.2 115.3
Inputs to stage 3 goods producers. . . . . . . . . . . . . . . . . . . . . . . . . . . . . . . . . . . . . . . . . . . . . . . . . 119.1 119.3 119.9 119.9 120.0 122.2
Inputs to stage 3 services producers. . . . . . . . . . . . . . . . . . . . . . . . . . . . . . . . . . . . . . . . . . . . . . . 109.3 109.3 109.1 109.0 109.3 109.5
Inputs to stage 3 construction producers. . . . . . . . . . . . . . . . . . . . . . . . . . . . . . . . . . . . . . . . . . . 123.0 122.7 121.8 121.9 122.7 121.5
Stage 2 intermediate demand. . . . . . . . . . . . . . . . . . . . . . . . . . . . . . . . . . . . . . . . . . . . . . . . . . . . . . . 113.2 113.5 112.6 110.8 112.5 112.6
Inputs to stage 2 goods producers. . . . . . . . . . . . . . . . . . . . . . . . . . . . . . . . . . . . . . . . . . . . . . . . . 117.0 117.3 116.0 113.3 115.9 115.9
Inputs to stage 2 services producers. . . . . . . . . . . . . . . . . . . . . . . . . . . . . . . . . . . . . . . . . . . . . . . 105.7 105.8 105.9 105.7 105.8 106.1
Stage 1 intermediate demand. . . . . . . . . . . . . . . . . . . . . . . . . . . . . . . . . . . . . . . . . . . . . . . . . . . . . . . 115.0 114.8 114.9 115.0 115.5 116.7
Inputs to stage 1 goods producers. . . . . . . . . . . . . . . . . . . . . . . . . . . . . . . . . . . . . . . . . . . . . . . . . 118.6 118.4 118.2 118.2 119.2 121.4
Inputs to stage 1 services producers. . . . . . . . . . . . . . . . . . . . . . . . . . . . . . . . . . . . . . . . . . . . . . . 111.8 111.3 112.0 112.0 112.3 112.5
Inputs to stage 1 construction producers. . . . . . . . . . . . . . . . . . . . . . . . . . . . . . . . . . . . . . . . . . . 113.5 113.7 113.6 113.6 113.7 113.8
Special groupings
Final demand less foods and energy. . . . . . . . . . . . . . . . . . . . . . . . . . . . . . . . . . . . . . . . . . . . . . . . . 04/10 106.4 106.6 106.7 106.8 106.8 107.0
Final demand less foods. . . . . . . . . . . . . . . . . . . . . . . . . . . . . . . . . . . . . . . . . . . . . . . . . . . . . . . . . . . . 04/10 107.3 107.4 107.6 107.6 107.7 107.9
Final demand less energy. . . . . . . . . . . . . . . . . . . . . . . . . . . . . . . . . . . . . . . . . . . . . . . . . . . . . . . . . . . 04/10 106.9 106.9 107.1 107.2 107.1 107.3
Total finished2. . . . . . . . . . . . . . . . . . . . . . . . . . . . . . . . . . . . . . . . . . . . . . . . . . . . . . . . . . . . . . . . . . . . . . 01/10 108.0 108.1 108.2 108.3 108.3 108.6
Total exports. . . . . . . . . . . . . . . . . . . . . . . . . . . . . . . . . . . . . . . . . . . . . . . . . . . . . . . . . . . . . . . . . . . . . . . . 04/10 109.0 109.0 109.0 108.6 108.9 109.1
Total Government purchases. . . . . . . . . . . . . . . . . . . . . . . . . . . . . . . . . . . . . . . . . . . . . . . . . . . . . . . . 04/10 107.8 107.8 108.1 107.7 108.3 108.5
Total private capital investment (goods, services, and construction). . . . . . . . . . . . . . . . . . . 04/10 105.9 106.0 106.4 106.0 106.1 106.3
Finished goods2. . . . . . . . . . . . . . . . . . . . . . . . . . . . . . . . . . . . . . . . . . . . . . . . . . . . . . . . . . . . . . . . . . . . 00/82 197.2 197.0 197.3 197.1 197.8 198.9
Processed materials less foods and feeds. . . . . . . . . . . . . . . . . . . . . . . . . . . . . . . . . . . . . . . . . . . 00/82 200.6 200.6 200.6 200.0 200.9 202.0
Processed foods and feeds. . . . . . . . . . . . . . . . . . . . . . . . . . . . . . . . . . . . . . . . . . . . . . . . . . . . . . . . . . 00/82 204.3 205.4 201.9 199.4 200.2 203.6
Processed energy goods. . . . . . . . . . . . . . . . . . . . . . . . . . . . . . . . . . . . . . . . . . . . . . . . . . . . . . . . . . . . 00/82 213.8 214.4 213.9 211.7 214.7 217.7
Processed materials less foods and energy. . . . . . . . . . . . . . . . . . . . . . . . . . . . . . . . . . . . . . . . . . 00/82 193.7 193.5 193.7 193.5 193.8 194.3
Unprocessed materials less agricultural products. . . . . . . . . . . . . . . . . . . . . . . . . . . . . . . . . . . . . 00/82 274.7 276.1 272.5 264.7 275.6 274.0
Unprocessed energy materials. . . . . . . . . . . . . . . . . . . . . . . . . . . . . . . . . . . . . . . . . . . . . . . . . . . . . . . 00/82 240.2 242.5 238.2 226.5 239.7 236.1
Unprocessed nonfood materials less energy. . . . . . . . . . . . . . . . . . . . . . . . . . . . . . . . . . . . . . . . . 00/82 346.8 342.7 340.9 345.0 347.1 352.0
Total goods inputs to stage 4 intermediate demand. . . . . . . . . . . . . . . . . . . . . . . . . . . . . . . . . . . 04/10 109.7 109.7 109.7 109.4 109.8 110.2
Total services inputs to stage 4 intermediate demand. . . . . . . . . . . . . . . . . . . . . . . . . . . . . . . . . 04/10 106.5 106.5 106.8 106.8 107.0 106.9
Total goods inputs to stage 3 intermediate demand. . . . . . . . . . . . . . . . . . . . . . . . . . . . . . . . . . . 04/10 112.1 112.2 112.5 112.4 112.7 114.4
Total services inputs to stage 3 intermediate demand. . . . . . . . . . . . . . . . . . . . . . . . . . . . . . . . . 04/10 106.2 106.3 106.1 106.2 106.2 106.5
Total goods inputs to stage 2 intermediate demand. . . . . . . . . . . . . . . . . . . . . . . . . . . . . . . . . . . 04/10 112.5 112.8 111.2 108.2 111.3 111.2
Total services inputs to stage 2 intermediate demand. . . . . . . . . . . . . . . . . . . . . . . . . . . . . . . . . 04/10 105.7 106.0 106.0 105.9 105.7 106.1
Total goods inputs to stage 1 intermediate demand. . . . . . . . . . . . . . . . . . . . . . . . . . . . . . . . . . . 04/10 106.1 105.8 105.7 105.7 106.4 108.3
Total services inputs to stage 1 intermediate demand. . . . . . . . . . . . . . . . . . . . . . . . . . . . . . . . . 04/10 109.3 109.2 109.8 109.9 110.1 109.9
1 All seasonally adjusted indexes are subject to change up to 5 years after original publication due to the recalculation of seasonal factors each January. The indexes for September2013 have been recalculated to incorporate late reports and corrections by respondents.
2 PPI defines Total finished as including only the personal consumption and private capital investment portions of final demand.
35
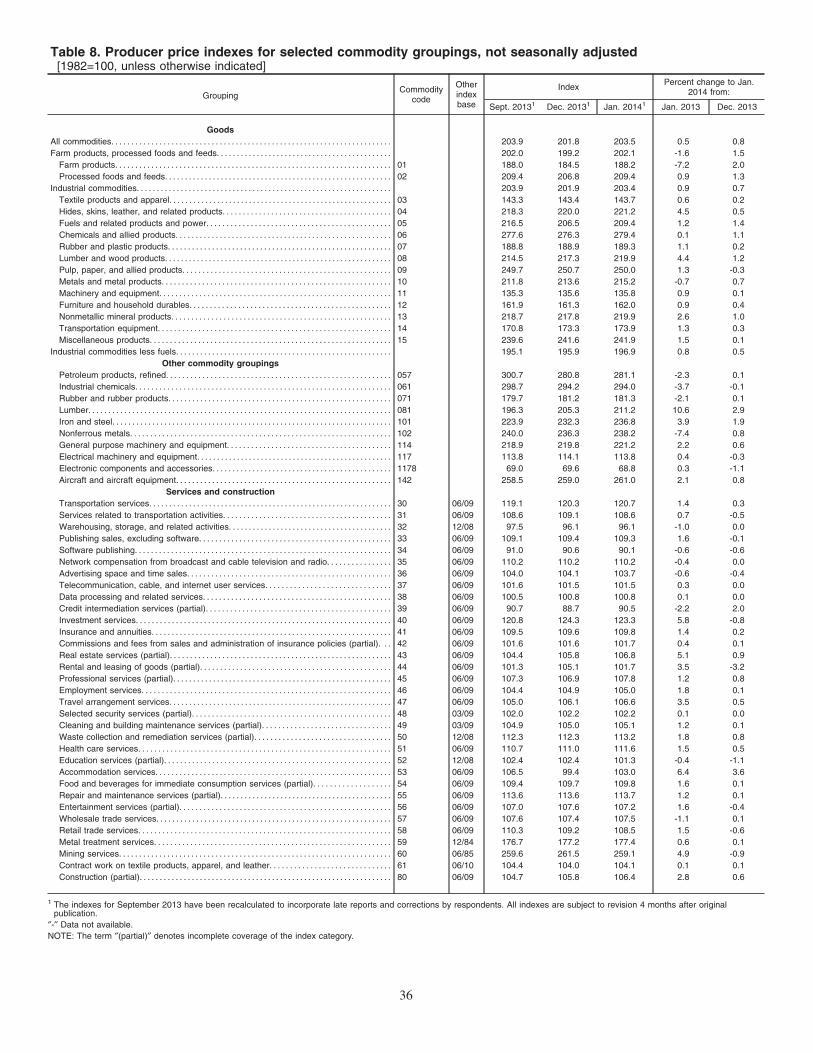
Table 8. Producer price indexes for selected commodity groupings, not seasonally adjusted[1982=100, unless otherwise indicated]
GroupingCommodity
code
Otherindexbase
IndexPercent change to Jan.
2014 from:
Sept. 20131 Dec. 20131 Jan. 20141 Jan. 2013 Dec. 2013
Goods
All commodities. . . . . . . . . . . . . . . . . . . . . . . . . . . . . . . . . . . . . . . . . . . . . . . . . . . . . . . . . . . . . . . . . . . . . . 203.9 201.8 203.5 0.5 0.8
Farm products, processed foods and feeds. . . . . . . . . . . . . . . . . . . . . . . . . . . . . . . . . . . . . . . . . . . . 202.0 199.2 202.1 -1.6 1.5
Farm products. . . . . . . . . . . . . . . . . . . . . . . . . . . . . . . . . . . . . . . . . . . . . . . . . . . . . . . . . . . . . . . . . . . . . 01 188.0 184.5 188.2 -7.2 2.0
Processed foods and feeds. . . . . . . . . . . . . . . . . . . . . . . . . . . . . . . . . . . . . . . . . . . . . . . . . . . . . . . . . 02 209.4 206.8 209.4 0.9 1.3
Industrial commodities. . . . . . . . . . . . . . . . . . . . . . . . . . . . . . . . . . . . . . . . . . . . . . . . . . . . . . . . . . . . . . . . 203.9 201.9 203.4 0.9 0.7
Textile products and apparel. . . . . . . . . . . . . . . . . . . . . . . . . . . . . . . . . . . . . . . . . . . . . . . . . . . . . . . . 03 143.3 143.4 143.7 0.6 0.2
Hides, skins, leather, and related products. . . . . . . . . . . . . . . . . . . . . . . . . . . . . . . . . . . . . . . . . . 04 218.3 220.0 221.2 4.5 0.5
Fuels and related products and power. . . . . . . . . . . . . . . . . . . . . . . . . . . . . . . . . . . . . . . . . . . . . . 05 216.5 206.5 209.4 1.2 1.4
Chemicals and allied products. . . . . . . . . . . . . . . . . . . . . . . . . . . . . . . . . . . . . . . . . . . . . . . . . . . . . . 06 277.6 276.3 279.4 0.1 1.1
Rubber and plastic products. . . . . . . . . . . . . . . . . . . . . . . . . . . . . . . . . . . . . . . . . . . . . . . . . . . . . . . . 07 188.8 188.9 189.3 1.1 0.2
Lumber and wood products. . . . . . . . . . . . . . . . . . . . . . . . . . . . . . . . . . . . . . . . . . . . . . . . . . . . . . . . . 08 214.5 217.3 219.9 4.4 1.2
Pulp, paper, and allied products. . . . . . . . . . . . . . . . . . . . . . . . . . . . . . . . . . . . . . . . . . . . . . . . . . . . 09 249.7 250.7 250.0 1.3 -0.3
Metals and metal products. . . . . . . . . . . . . . . . . . . . . . . . . . . . . . . . . . . . . . . . . . . . . . . . . . . . . . . . . 10 211.8 213.6 215.2 -0.7 0.7
Machinery and equipment. . . . . . . . . . . . . . . . . . . . . . . . . . . . . . . . . . . . . . . . . . . . . . . . . . . . . . . . . . 11 135.3 135.6 135.8 0.9 0.1
Furniture and household durables. . . . . . . . . . . . . . . . . . . . . . . . . . . . . . . . . . . . . . . . . . . . . . . . . . 12 161.9 161.3 162.0 0.9 0.4
Nonmetallic mineral products. . . . . . . . . . . . . . . . . . . . . . . . . . . . . . . . . . . . . . . . . . . . . . . . . . . . . . . 13 218.7 217.8 219.9 2.6 1.0
Transportation equipment. . . . . . . . . . . . . . . . . . . . . . . . . . . . . . . . . . . . . . . . . . . . . . . . . . . . . . . . . . 14 170.8 173.3 173.9 1.3 0.3
Miscellaneous products. . . . . . . . . . . . . . . . . . . . . . . . . . . . . . . . . . . . . . . . . . . . . . . . . . . . . . . . . . . . 15 239.6 241.6 241.9 1.5 0.1
Industrial commodities less fuels. . . . . . . . . . . . . . . . . . . . . . . . . . . . . . . . . . . . . . . . . . . . . . . . . . . . . . 195.1 195.9 196.9 0.8 0.5
Other commodity groupings
Petroleum products, refined. . . . . . . . . . . . . . . . . . . . . . . . . . . . . . . . . . . . . . . . . . . . . . . . . . . . . . . . 057 300.7 280.8 281.1 -2.3 0.1
Industrial chemicals. . . . . . . . . . . . . . . . . . . . . . . . . . . . . . . . . . . . . . . . . . . . . . . . . . . . . . . . . . . . . . . . 061 298.7 294.2 294.0 -3.7 -0.1
Rubber and rubber products. . . . . . . . . . . . . . . . . . . . . . . . . . . . . . . . . . . . . . . . . . . . . . . . . . . . . . . . 071 179.7 181.2 181.3 -2.1 0.1
Lumber. . . . . . . . . . . . . . . . . . . . . . . . . . . . . . . . . . . . . . . . . . . . . . . . . . . . . . . . . . . . . . . . . . . . . . . . . . . . 081 196.3 205.3 211.2 10.6 2.9
Iron and steel. . . . . . . . . . . . . . . . . . . . . . . . . . . . . . . . . . . . . . . . . . . . . . . . . . . . . . . . . . . . . . . . . . . . . . 101 223.9 232.3 236.8 3.9 1.9
Nonferrous metals. . . . . . . . . . . . . . . . . . . . . . . . . . . . . . . . . . . . . . . . . . . . . . . . . . . . . . . . . . . . . . . . . 102 240.0 236.3 238.2 -7.4 0.8
General purpose machinery and equipment. . . . . . . . . . . . . . . . . . . . . . . . . . . . . . . . . . . . . . . . . 114 218.9 219.8 221.2 2.2 0.6
Electrical machinery and equipment. . . . . . . . . . . . . . . . . . . . . . . . . . . . . . . . . . . . . . . . . . . . . . . . . 117 113.8 114.1 113.8 0.4 -0.3
Electronic components and accessories. . . . . . . . . . . . . . . . . . . . . . . . . . . . . . . . . . . . . . . . . . . . . 1178 69.0 69.6 68.8 0.3 -1.1
Aircraft and aircraft equipment. . . . . . . . . . . . . . . . . . . . . . . . . . . . . . . . . . . . . . . . . . . . . . . . . . . . . . 142 258.5 259.0 261.0 2.1 0.8
Services and construction
Transportation services. . . . . . . . . . . . . . . . . . . . . . . . . . . . . . . . . . . . . . . . . . . . . . . . . . . . . . . . . . . . . 30 06/09 119.1 120.3 120.7 1.4 0.3
Services related to transportation activities. . . . . . . . . . . . . . . . . . . . . . . . . . . . . . . . . . . . . . . . . . 31 06/09 108.6 109.1 108.6 0.7 -0.5
Warehousing, storage, and related activities. . . . . . . . . . . . . . . . . . . . . . . . . . . . . . . . . . . . . . . . . 32 12/08 97.5 96.1 96.1 -1.0 0.0
Publishing sales, excluding software. . . . . . . . . . . . . . . . . . . . . . . . . . . . . . . . . . . . . . . . . . . . . . . . 33 06/09 109.1 109.4 109.3 1.6 -0.1
Software publishing. . . . . . . . . . . . . . . . . . . . . . . . . . . . . . . . . . . . . . . . . . . . . . . . . . . . . . . . . . . . . . . . 34 06/09 91.0 90.6 90.1 -0.6 -0.6
Network compensation from broadcast and cable television and radio. . . . . . . . . . . . . . . . 35 06/09 110.2 110.2 110.2 -0.4 0.0
Advertising space and time sales. . . . . . . . . . . . . . . . . . . . . . . . . . . . . . . . . . . . . . . . . . . . . . . . . . . 36 06/09 104.0 104.1 103.7 -0.6 -0.4
Telecommunication, cable, and internet user services. . . . . . . . . . . . . . . . . . . . . . . . . . . . . . . 37 06/09 101.6 101.5 101.5 0.3 0.0
Data processing and related services. . . . . . . . . . . . . . . . . . . . . . . . . . . . . . . . . . . . . . . . . . . . . . . 38 06/09 100.5 100.8 100.8 0.1 0.0
Credit intermediation services (partial). . . . . . . . . . . . . . . . . . . . . . . . . . . . . . . . . . . . . . . . . . . . . . 39 06/09 90.7 88.7 90.5 -2.2 2.0
Investment services. . . . . . . . . . . . . . . . . . . . . . . . . . . . . . . . . . . . . . . . . . . . . . . . . . . . . . . . . . . . . . . . 40 06/09 120.8 124.3 123.3 5.8 -0.8
Insurance and annuities. . . . . . . . . . . . . . . . . . . . . . . . . . . . . . . . . . . . . . . . . . . . . . . . . . . . . . . . . . . . 41 06/09 109.5 109.6 109.8 1.4 0.2
Commissions and fees from sales and administration of insurance policies (partial). . . 42 06/09 101.6 101.6 101.7 0.4 0.1
Real estate services (partial). . . . . . . . . . . . . . . . . . . . . . . . . . . . . . . . . . . . . . . . . . . . . . . . . . . . . . . 43 06/09 104.4 105.8 106.8 5.1 0.9
Rental and leasing of goods (partial). . . . . . . . . . . . . . . . . . . . . . . . . . . . . . . . . . . . . . . . . . . . . . . . 44 06/09 101.3 105.1 101.7 3.5 -3.2
Professional services (partial). . . . . . . . . . . . . . . . . . . . . . . . . . . . . . . . . . . . . . . . . . . . . . . . . . . . . . . 45 06/09 107.3 106.9 107.8 1.2 0.8
Employment services. . . . . . . . . . . . . . . . . . . . . . . . . . . . . . . . . . . . . . . . . . . . . . . . . . . . . . . . . . . . . . 46 06/09 104.4 104.9 105.0 1.8 0.1
Travel arrangement services. . . . . . . . . . . . . . . . . . . . . . . . . . . . . . . . . . . . . . . . . . . . . . . . . . . . . . . . 47 06/09 105.0 106.1 106.6 3.5 0.5
Selected security services (partial). . . . . . . . . . . . . . . . . . . . . . . . . . . . . . . . . . . . . . . . . . . . . . . . . . 48 03/09 102.0 102.2 102.2 0.1 0.0
Cleaning and building maintenance services (partial). . . . . . . . . . . . . . . . . . . . . . . . . . . . . . . . 49 03/09 104.9 105.0 105.1 1.2 0.1
Waste collection and remediation services (partial). . . . . . . . . . . . . . . . . . . . . . . . . . . . . . . . . . 50 12/08 112.3 112.3 113.2 1.8 0.8
Health care services. . . . . . . . . . . . . . . . . . . . . . . . . . . . . . . . . . . . . . . . . . . . . . . . . . . . . . . . . . . . . . . 51 06/09 110.7 111.0 111.6 1.5 0.5
Education services (partial). . . . . . . . . . . . . . . . . . . . . . . . . . . . . . . . . . . . . . . . . . . . . . . . . . . . . . . . . 52 12/08 102.4 102.4 101.3 -0.4 -1.1
Accommodation services. . . . . . . . . . . . . . . . . . . . . . . . . . . . . . . . . . . . . . . . . . . . . . . . . . . . . . . . . . . 53 06/09 106.5 99.4 103.0 6.4 3.6
Food and beverages for immediate consumption services (partial). . . . . . . . . . . . . . . . . . . 54 06/09 109.4 109.7 109.8 1.6 0.1
Repair and maintenance services (partial). . . . . . . . . . . . . . . . . . . . . . . . . . . . . . . . . . . . . . . . . . . 55 06/09 113.6 113.6 113.7 1.2 0.1
Entertainment services (partial). . . . . . . . . . . . . . . . . . . . . . . . . . . . . . . . . . . . . . . . . . . . . . . . . . . . . 56 06/09 107.0 107.6 107.2 1.6 -0.4
Wholesale trade services. . . . . . . . . . . . . . . . . . . . . . . . . . . . . . . . . . . . . . . . . . . . . . . . . . . . . . . . . . . 57 06/09 107.6 107.4 107.5 -1.1 0.1
Retail trade services. . . . . . . . . . . . . . . . . . . . . . . . . . . . . . . . . . . . . . . . . . . . . . . . . . . . . . . . . . . . . . . 58 06/09 110.3 109.2 108.5 1.5 -0.6
Metal treatment services. . . . . . . . . . . . . . . . . . . . . . . . . . . . . . . . . . . . . . . . . . . . . . . . . . . . . . . . . . . 59 12/84 176.7 177.2 177.4 0.6 0.1
Mining services. . . . . . . . . . . . . . . . . . . . . . . . . . . . . . . . . . . . . . . . . . . . . . . . . . . . . . . . . . . . . . . . . . . . 60 06/85 259.6 261.5 259.1 4.9 -0.9
Contract work on textile products, apparel, and leather. . . . . . . . . . . . . . . . . . . . . . . . . . . . . . 61 06/10 104.4 104.0 104.1 0.1 0.1
Construction (partial). . . . . . . . . . . . . . . . . . . . . . . . . . . . . . . . . . . . . . . . . . . . . . . . . . . . . . . . . . . . . . . 80 06/09 104.7 105.8 106.4 2.8 0.6
1 The indexes for September 2013 have been recalculated to incorporate late reports and corrections by respondents. All indexes are subject to revision 4 months after originalpublication.
″-″ Data not available.
NOTE: The term ″(partial)″ denotes incomplete coverage of the index category.
36