Embed Size (px)
Citation preview
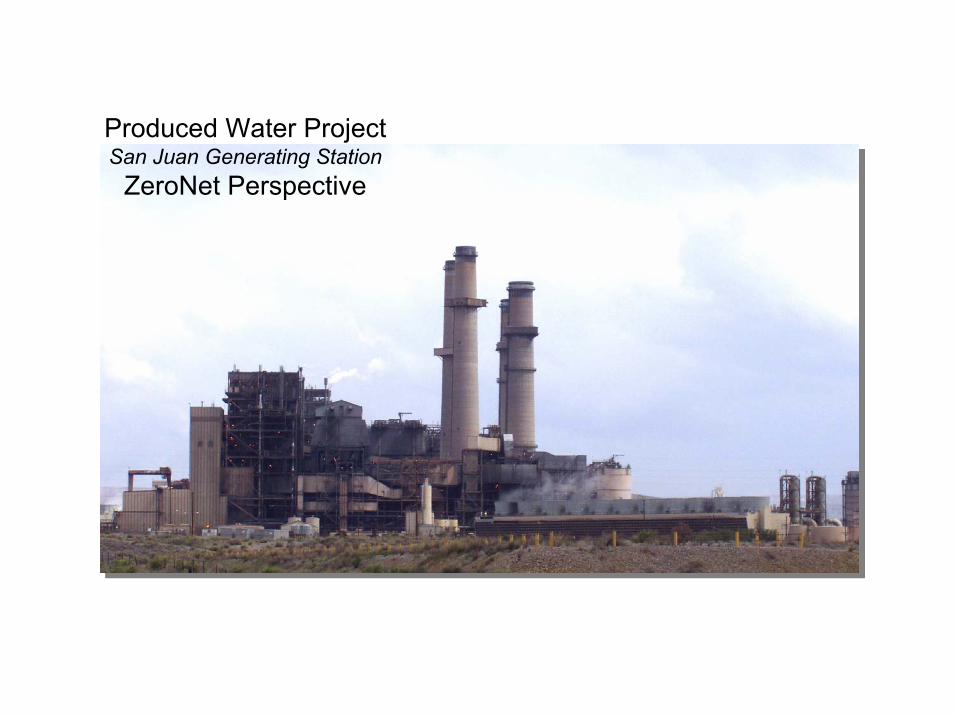
Produced Water ProjectSan Juan Generating Station
ZeroNet Perspective
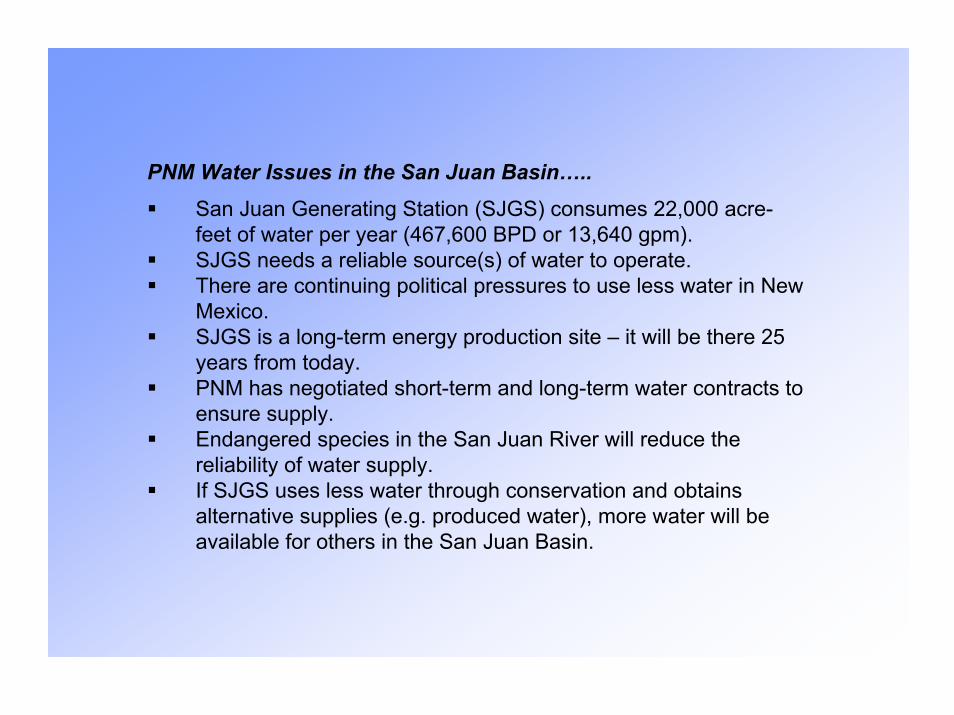
PNM Water Issues in the San Juan Basin…..
San Juan Generating Station (SJGS) consumes 22,000 acre-feet of water per year (467,600 BPD or 13,640 gpm).SJGS needs a reliable source(s) of water to operate.There are continuing political pressures to use less water in New Mexico.SJGS is a long-term energy production site – it will be there 25 years from today.PNM has negotiated short-term and long-term water contracts to ensure supply.Endangered species in the San Juan River will reduce the reliability of water supply.If SJGS uses less water through conservation and obtains alternative supplies (e.g. produced water), more water will be available for others in the San Juan Basin.
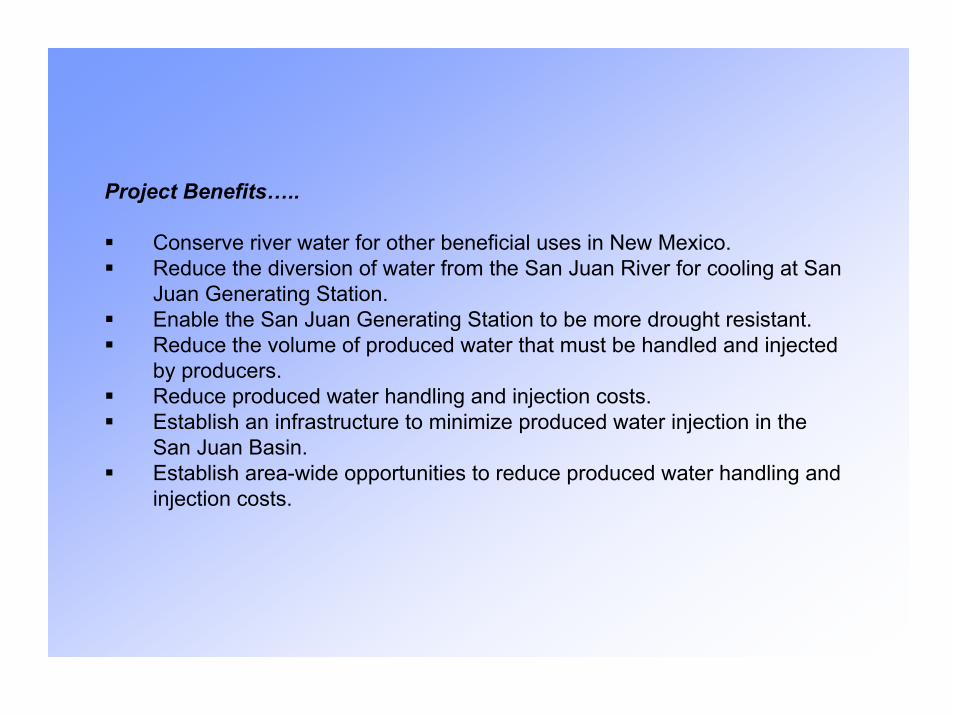
Project Benefits…..
Conserve river water for other beneficial uses in New Mexico.Reduce the diversion of water from the San Juan River for cooling at San Juan Generating Station.Enable the San Juan Generating Station to be more drought resistant.Reduce the volume of produced water that must be handled and injected by producers.Reduce produced water handling and injection costs.Establish an infrastructure to minimize produced water injection in the San Juan Basin.Establish area-wide opportunities to reduce produced water handling and injection costs.
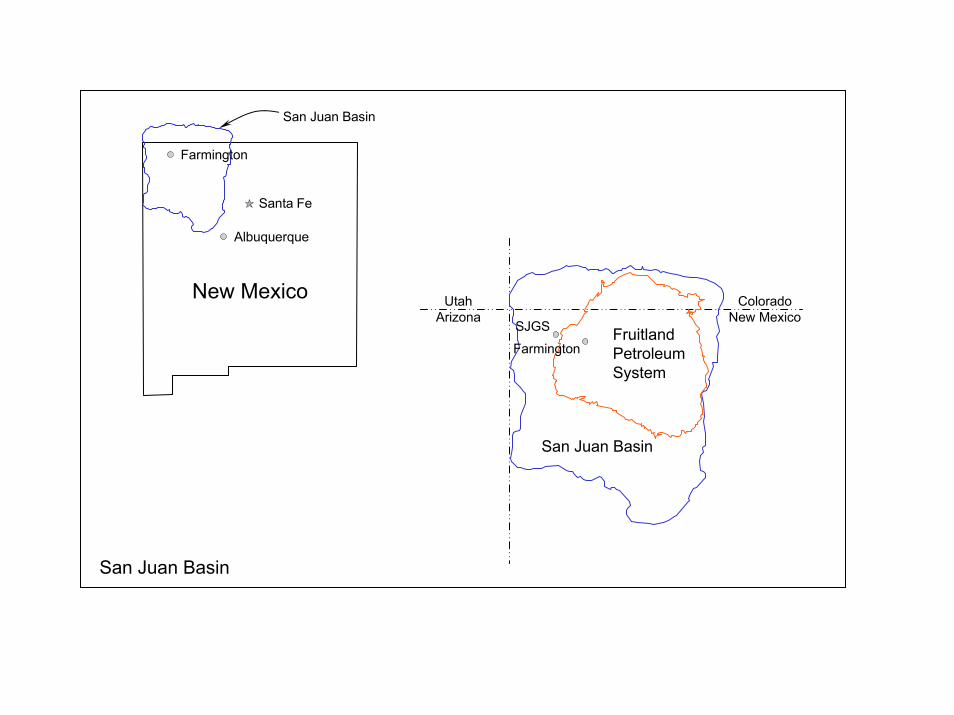
San Juan Basin
UtahArizona
ColoradoNew Mexico
San Juan Basin
FruitlandPetroleumSystem
Farmington
New Mexico
Albuquerque
Santa Fe
Farmington
San Juan Basin
SJGS
20 miles 510 0
13W 7W 6W 5W 4W12W 11W 10W 9W 8W 3W14W15W16W
32N
31N
30N
29N
27N
28N
Township Grid
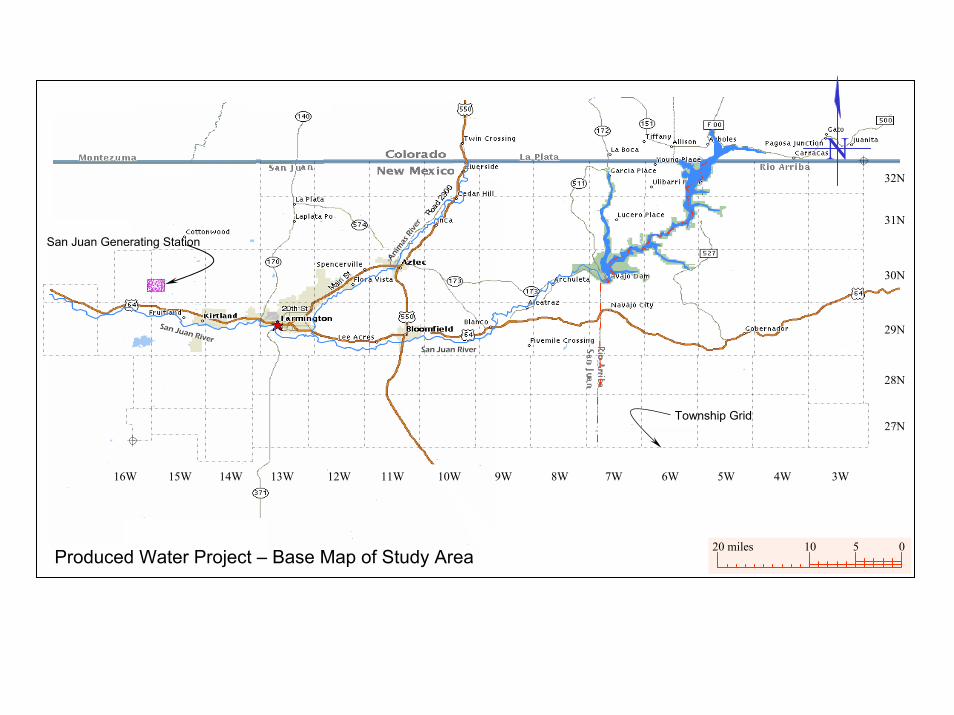
Produced Water Project – Base Map of Study Area
San Juan Generating Station
San Juan River
San Juan River
Anim
as R
iver
N
13W 7W 6W 5W 4W12W 11W 10W 9W 8W 3W14W15W16W
32N
31N
30N
29N
27N
28N
ColoradoNew Mexico
64 64
550
550
Farmington
Kirtland
Bloomfield
Aztec
SJGS
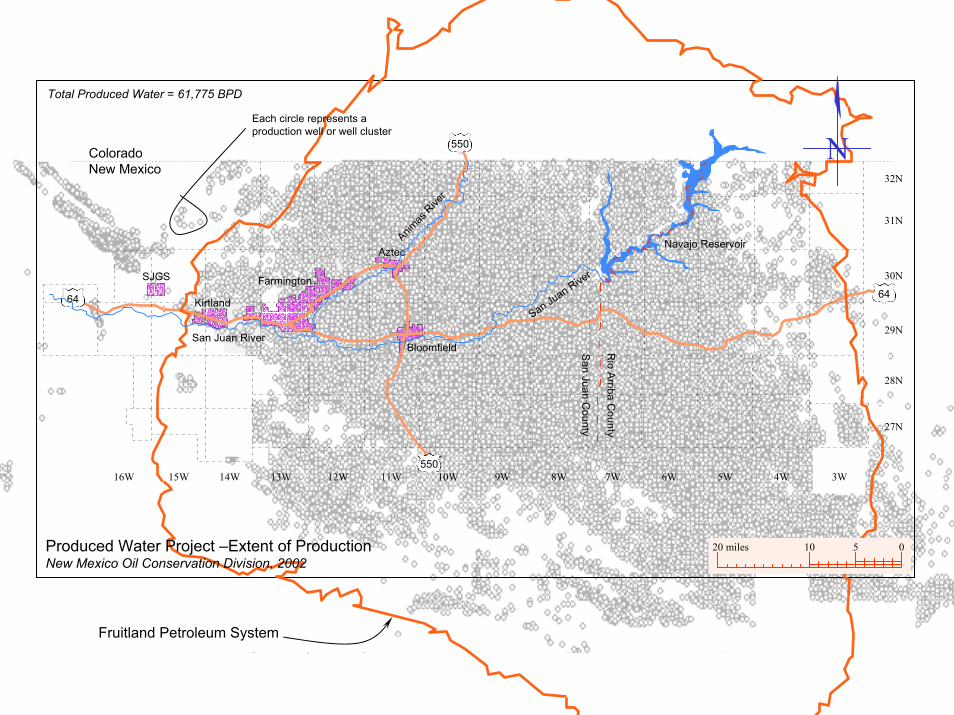
Produced Water Project –Extent of ProductionNew Mexico Oil Conservation Division, 2002
20 miles 510 0
Each circle represents a production well or well cluster
Fruitland Petroleum System
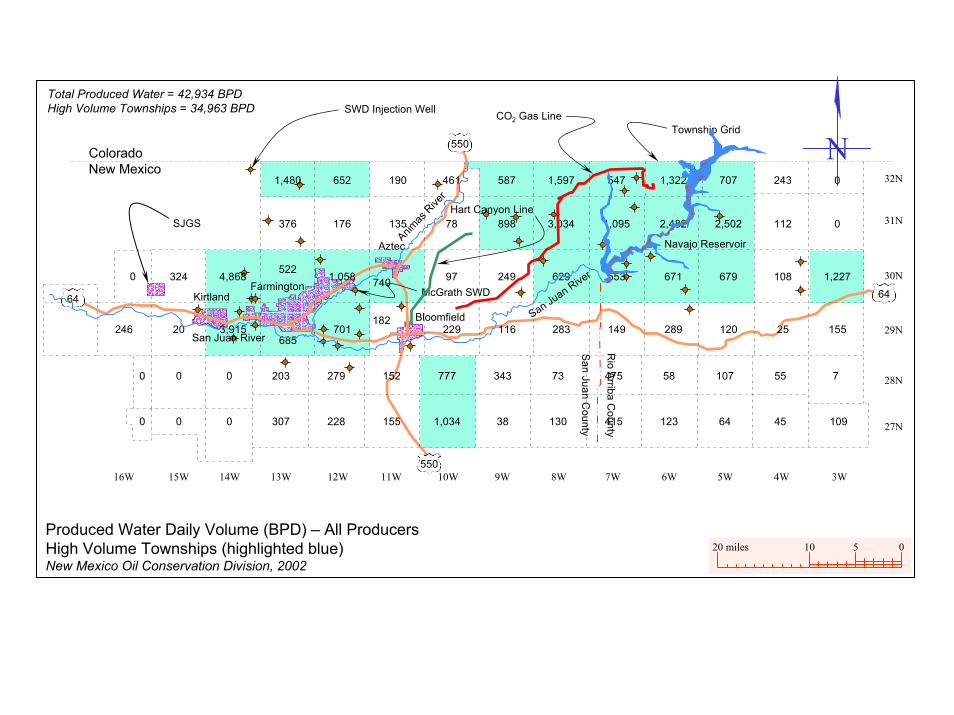
Total Produced Water = 61,775 BPD
N
San Juan River
San Juan Rive
r
Animas
Rive
r
Navajo Reservoir
San Juan C
ounty
Rio A
rriba County
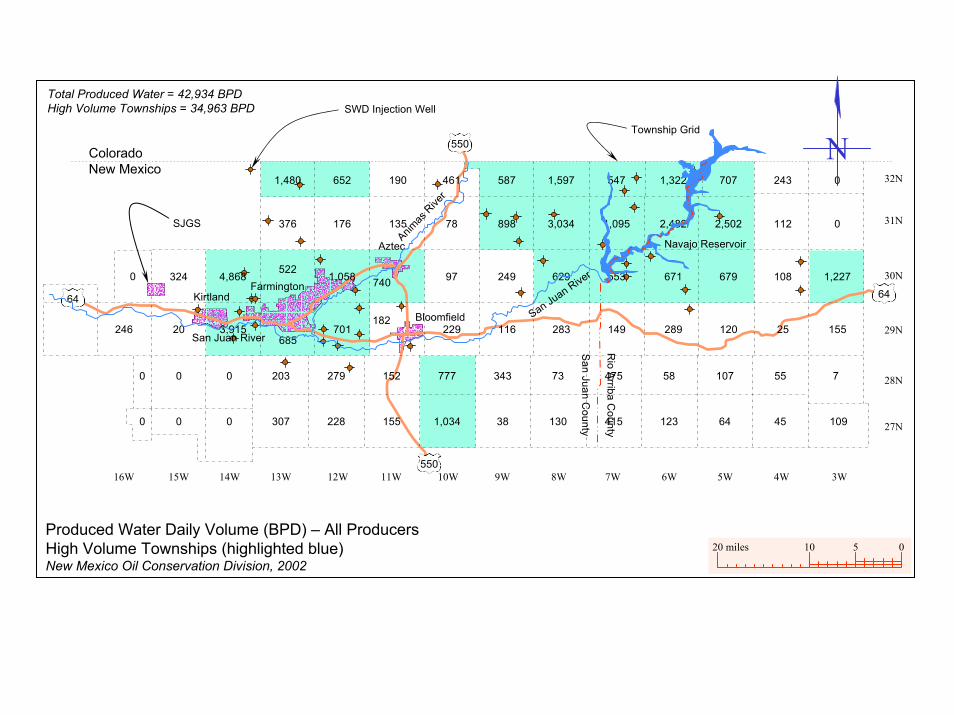
Produced Water Daily Volume (BPD) – All ProducersHigh Volume Townships (highlighted blue)New Mexico Oil Conservation Division, 2002
20 miles 510 0
13W 7W 6W 5W 4W12W 11W 10W 9W 8W 3W14W15W16W
32N
31N
30N
29N
27N
28N
ColoradoNew Mexico
64
550
550
64
1,480 652 190 461 587 1,597 547 1,322 707 243 0
376 176 135 78 898 3,034 1,095 2,482 2,502 112 0
5221,058 740 97 249 629 553 671 679 108 1,227324 4,868
685701 229 116 283 149 289 120 25 15520246
203 279 152 777 343 73 475 58 107 55 70 00
307 228 155 1,034 38 130 415 123 64 45 1090 00
3,915182
0
Township Grid
Total Produced Water = 42,934 BPDHigh Volume Townships = 34,963 BPD
SJGS
SWD Injection Well
FarmingtonKirtland
Bloomfield
Aztec
N
San Juan River
San Juan Rive
r
Animas
Rive
r
Navajo Reservoir
San Juan C
ounty
Rio A
rriba County
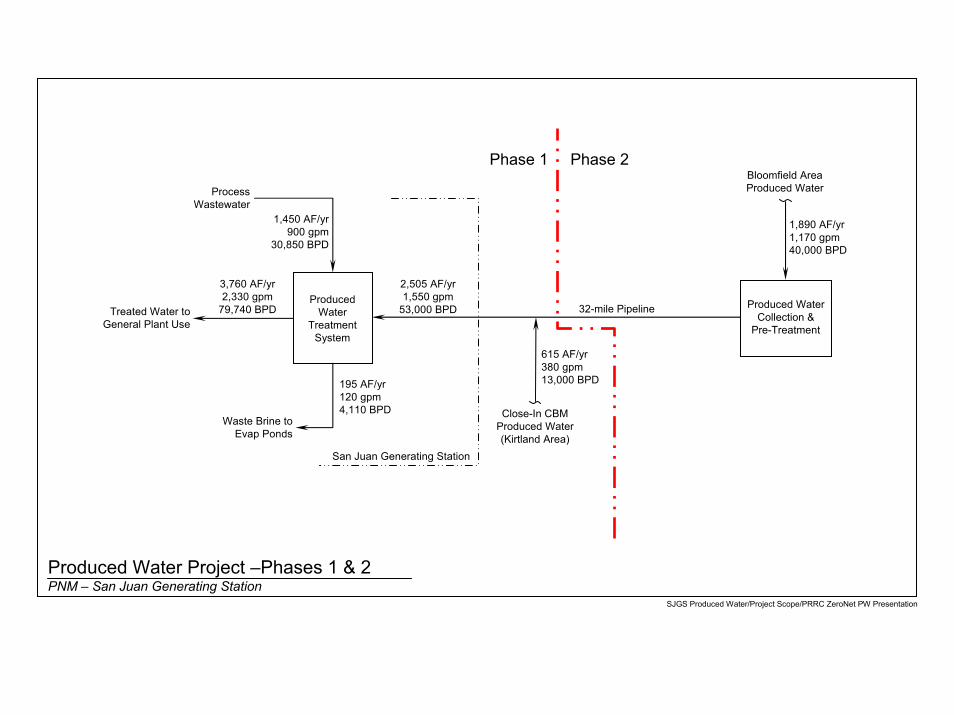
Produced Water Project –Phases 1 & 2PNM – San Juan Generating Station
SJGS Produced Water/Project Scope/PRRC ZeroNet PW Presentation
San Juan Generating Station
Treated Water toGeneral Plant Use
ProducedWater
TreatmentSystem
Bloomfield AreaProduced Water
Produced WaterCollection &
Pre-Treatment
32-mile Pipeline
Close-In CBMProduced Water(Kirtland Area)
1,890 AF/yr1,170 gpm40,000 BPD
615 AF/yr380 gpm13,000 BPD
2,505 AF/yr1,550 gpm
53,000 BPD
3,760 AF/yr2,330 gpm
79,740 BPD
195 AF/yr120 gpm4,110 BPD
Waste Brine toEvap Ponds
ProcessWastewater
1,450 AF/yr900 gpm
30,850 BPD
Phase 1 Phase 2
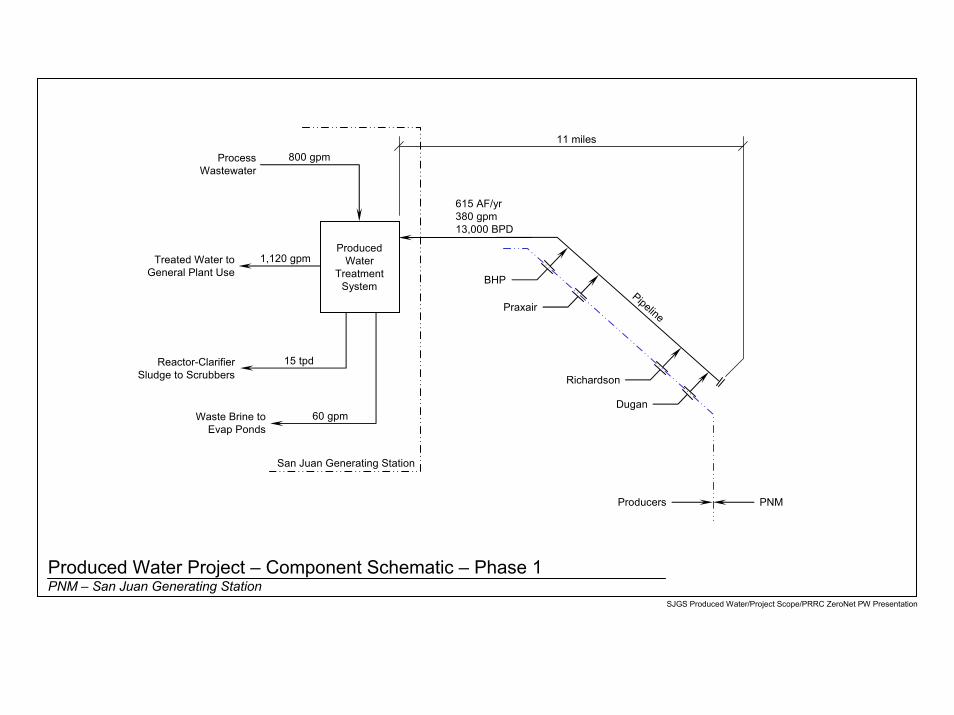
Produced Water Project – Component Schematic – Phase 1PNM – San Juan Generating Station
SJGS Produced Water/Project Scope/PRRC ZeroNet PW Presentation
Pipeline
BHP
Praxair
Richardson
Dugan
Producers PNM
Treated Water toGeneral Plant Use
Reactor-ClarifierSludge to Scrubbers
Waste Brine to Evap Ponds
ProducedWater
TreatmentSystem
ProcessWastewater
11 miles
San Juan Generating Station
615 AF/yr380 gpm13,000 BPD
800 gpm
60 gpm
15 tpd
1,120 gpm
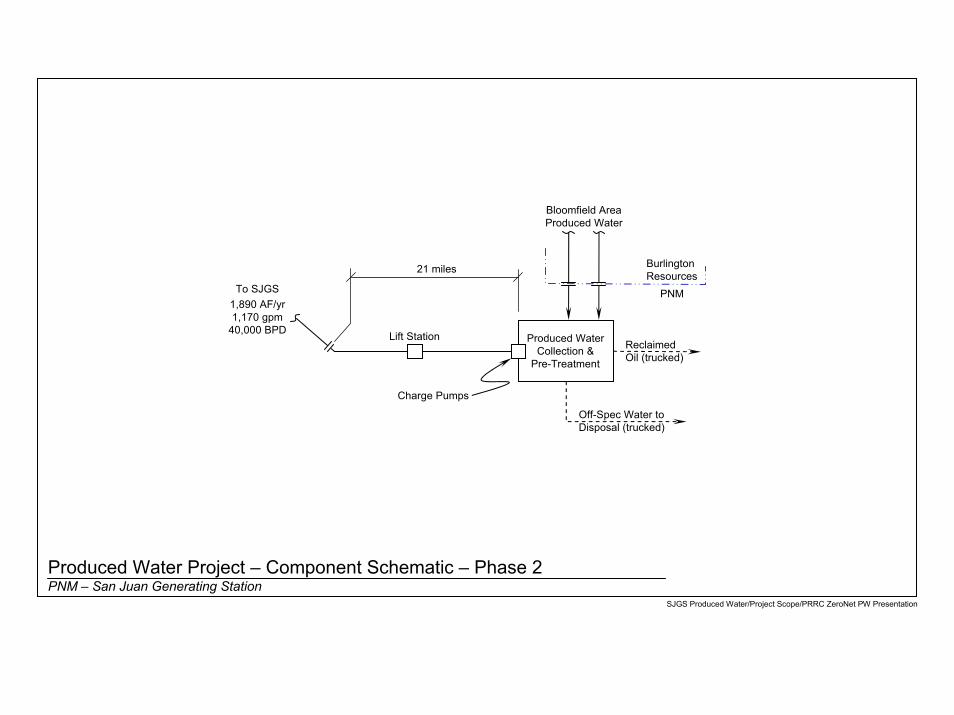
Produced Water Project – Component Schematic – Phase 2PNM – San Juan Generating Station
SJGS Produced Water/Project Scope/PRRC ZeroNet PW Presentation
Bloomfield AreaProduced Water
BurlingtonResources
PNM
Lift Station
Charge Pumps
Produced WaterCollection &
Pre-Treatment
ReclaimedOil (trucked)
Off-Spec Water toDisposal (trucked)
21 miles
To SJGS1,890 AF/yr1,170 gpm
40,000 BPD
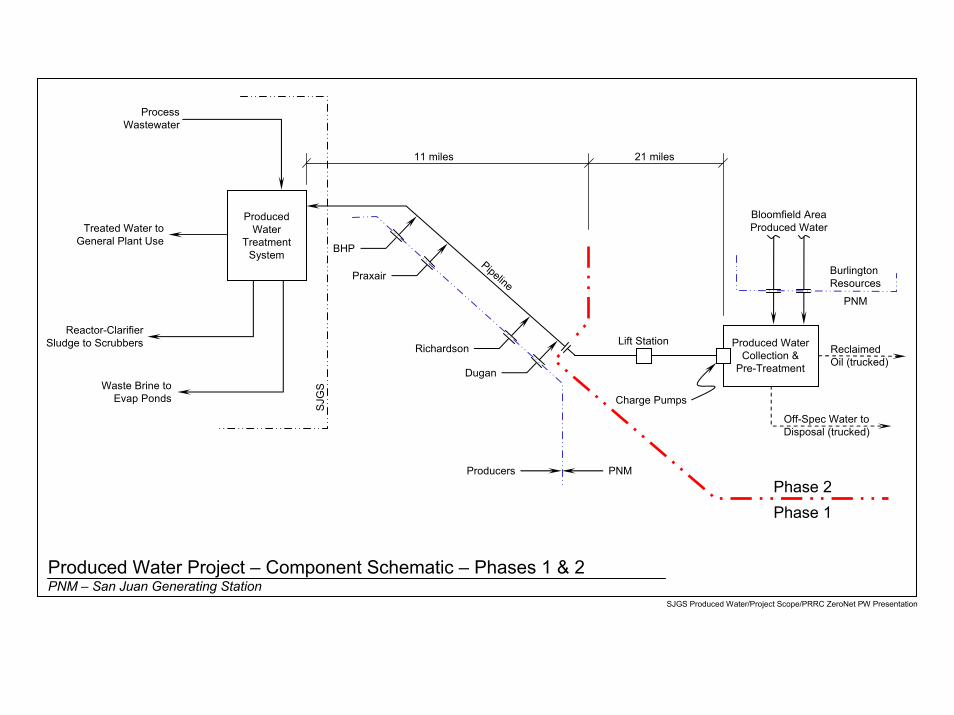
Produced Water Project – Component Schematic – Phases 1 & 2PNM – San Juan Generating Station
Bloomfield AreaProduced Water
BurlingtonResources
PNM
Pipeline
Lift Station
Charge Pumps
Produced WaterCollection &
Pre-Treatment
BHP
Praxair
Richardson
Dugan
Producers PNM
SJG
S
Treated Water toGeneral Plant Use
Reactor-ClarifierSludge to Scrubbers
Waste Brine to Evap Ponds
ProducedWater
TreatmentSystem
ProcessWastewater
Phase 2Phase 1
ReclaimedOil (trucked)
Off-Spec Water toDisposal (trucked)
11 miles 21 miles
SJGS Produced Water/Project Scope/PRRC ZeroNet PW Presentation
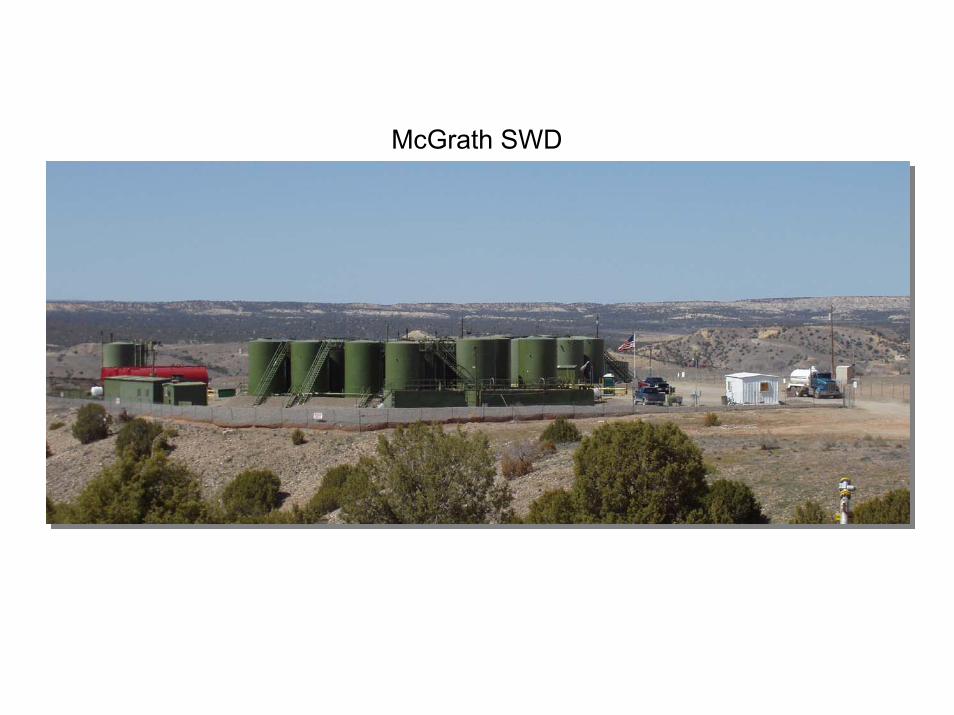
McGrath SWD
Produced Water Daily Volume (BPD) – All ProducersHigh Volume Townships (highlighted blue)New Mexico Oil Conservation Division, 2002
20 miles 510 0
13W 7W 6W 5W 4W12W 11W 10W 9W 8W 3W14W15W16W
32N
31N
30N
29N
27N
28N
ColoradoNew Mexico
64
550
550
64
1,480 652 190 461 587 1,597 547 1,322 707 243 0
376 176 135 78 898 3,034 1,095 2,482 2,502 112 0
5221,058 740 97 249 629 553 671 679 108 1,227324 4,868
685701 229 116 283 149 289 120 25 15520246
203 279 152 777 343 73 475 58 107 55 70 00
307 228 155 1,034 38 130 415 123 64 45 1090 00
3,915182
0
Township Grid
Total Produced Water = 42,934 BPDHigh Volume Townships = 34,963 BPD
SJGS
SWD Injection Well
FarmingtonKirtland
Bloomfield
Aztec
McGrath SWD
N
San Juan River
San Juan Rive
r
Animas
Rive
r
Navajo Reservoir
San Juan C
ounty
Rio A
rriba County
CO2 Gas Line
Hart Canyon Line
Produced Water TreatmentProcess Schematics
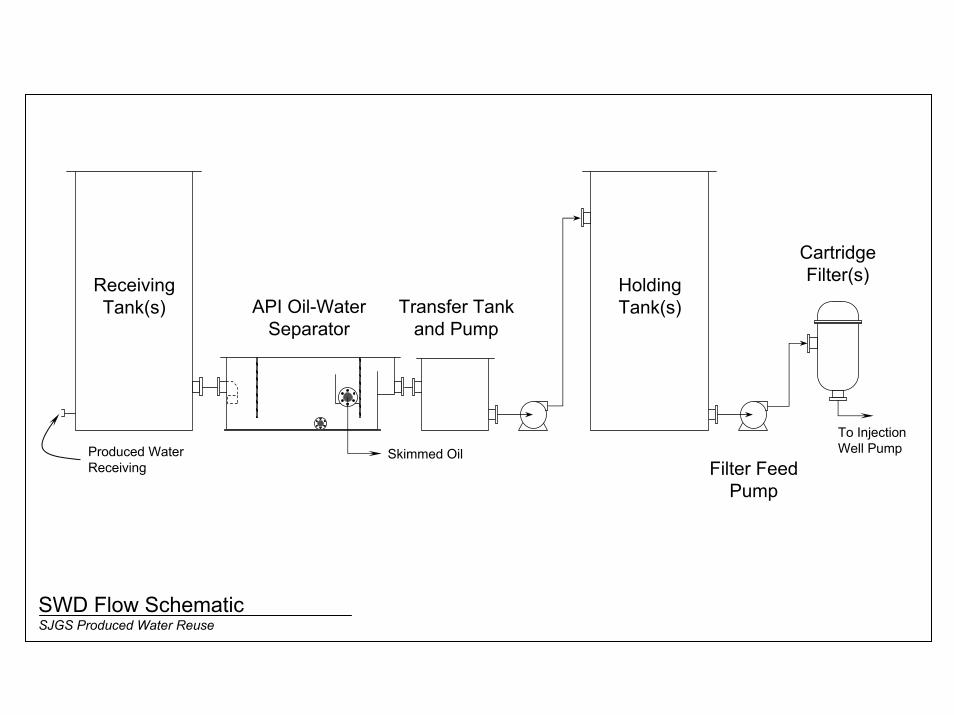
ReceivingTank(s) API Oil-Water
SeparatorTransfer Tank
and Pump
HoldingTank(s)
Filter FeedPump
CartridgeFilter(s)
Skimmed OilProduced WaterReceiving
To InjectionWell Pump
SWD Flow SchematicSJGS Produced Water Reuse
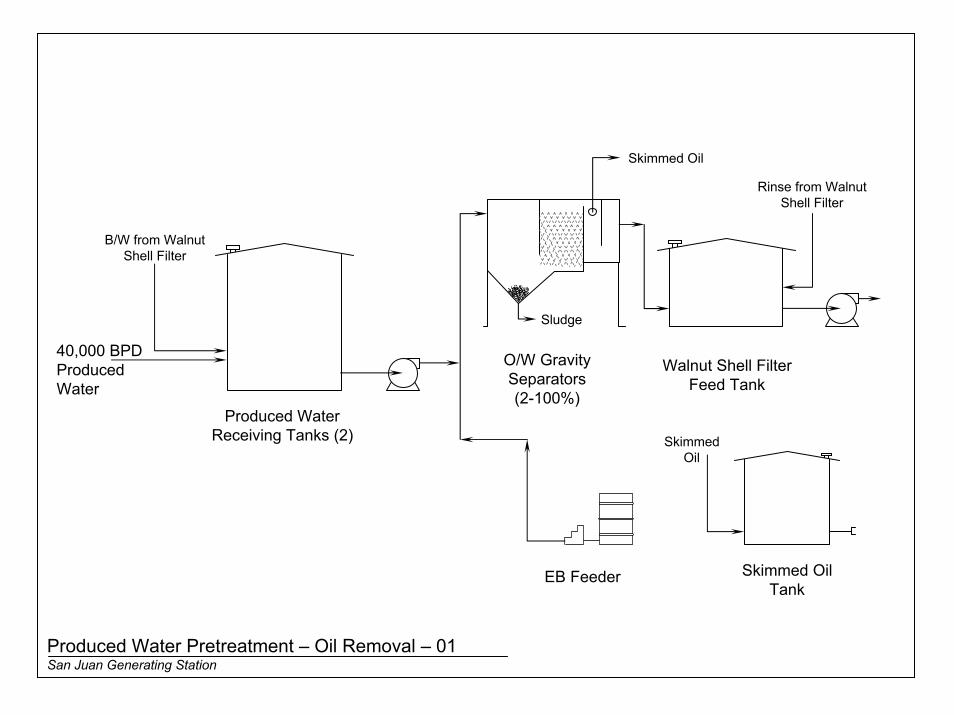
Produced Water Pretreatment – Oil Removal – 01 San Juan Generating Station
O/W GravitySeparators(2-100%)
Walnut Shell FilterFeed Tank
Produced WaterReceiving Tanks (2)
EB Feeder Skimmed OilTank
B/W from WalnutShell Filter
40,000 BPDProducedWater
Skimmed Oil
Sludge
Rinse from WalnutShell Filter
SkimmedOil
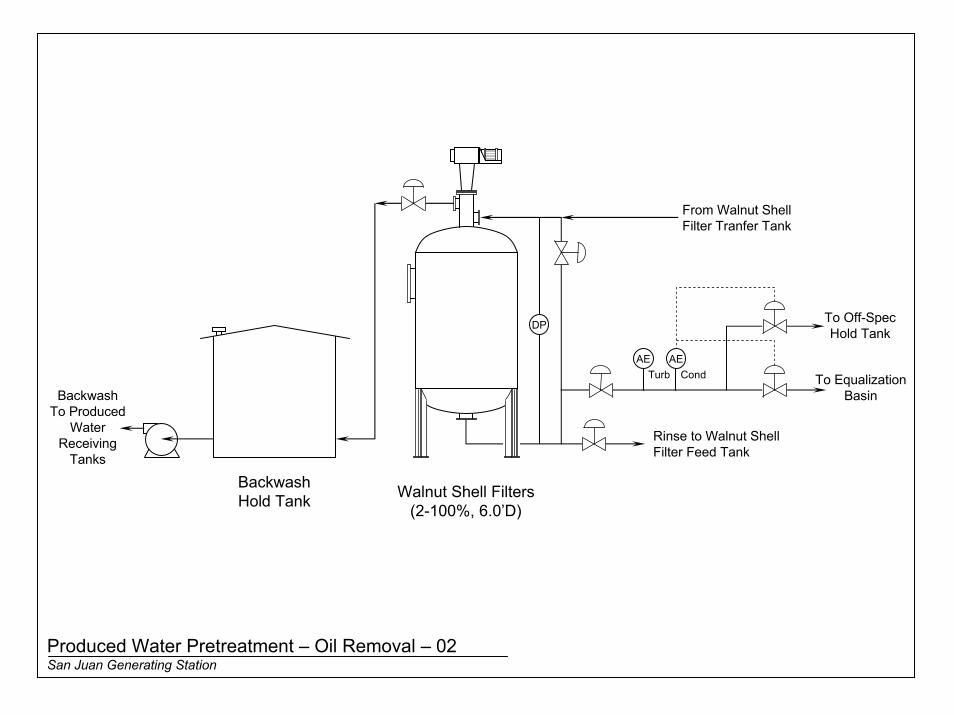
AETurb
AECond
DP
Walnut Shell Filters(2-100%, 6.0’D)
BackwashHold Tank
BackwashTo Produced
WaterReceiving
Tanks
To Off-SpecHold Tank
To EqualizationBasin
From Walnut ShellFilter Tranfer Tank
Rinse to Walnut ShellFilter Feed Tank
Produced Water Pretreatment – Oil Removal – 02 San Juan Generating Station
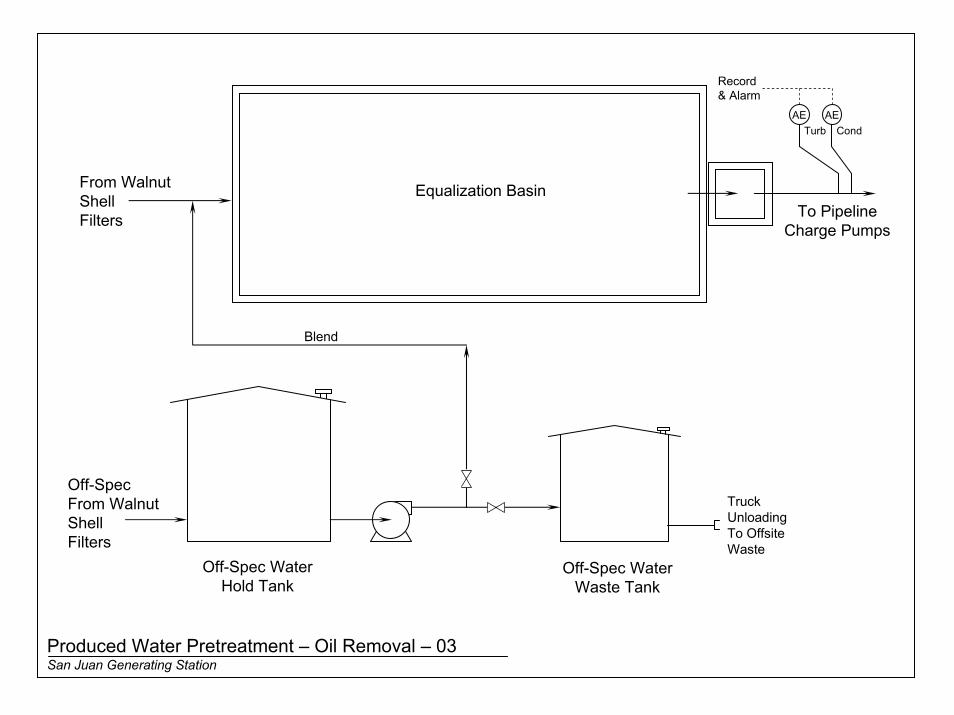
Produced Water Pretreatment – Oil Removal – 03 San Juan Generating Station
From WalnutShellFilters
Equalization Basin
Off-Spec WaterHold Tank
Off-Spec WaterWaste Tank
Blend
TruckUnloadingTo OffsiteWaste
To PipelineCharge Pumps
Off-SpecFrom WalnutShellFilters
AETurb
AECond
Record& Alarm
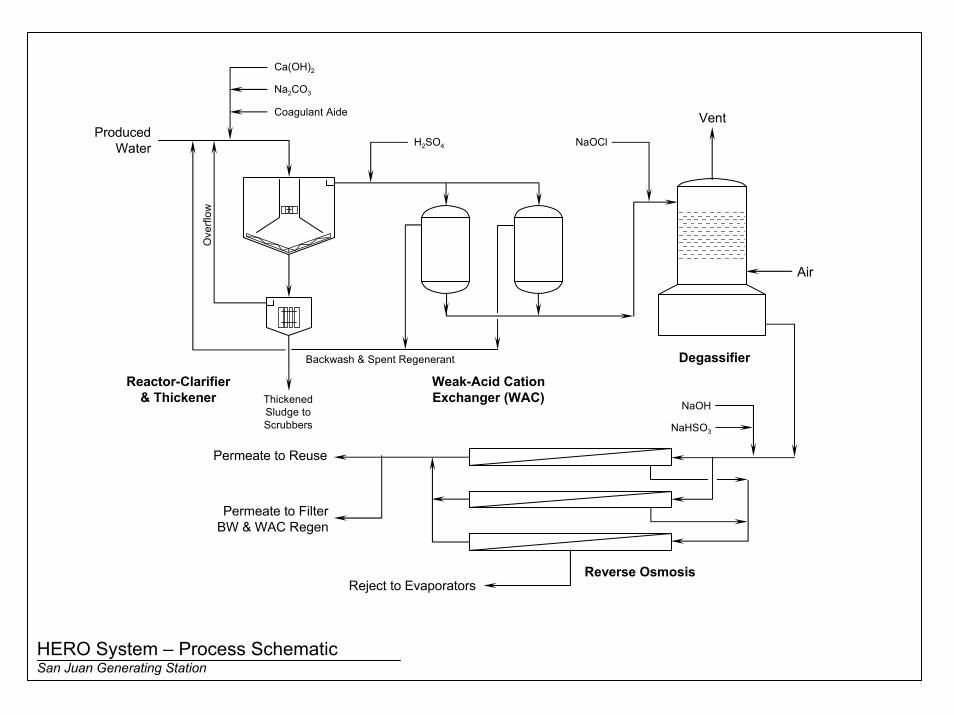
HERO System – Process SchematicSan Juan Generating Station
Degassifier
Ca(OH)2
Na2CO3
Coagulant Aide
H2SO4 NaOCl
Vent
Air
Reactor-Clarifier& Thickener
Weak-Acid CationExchanger (WAC)
Backwash & Spent Regenerant
ThickenedSludge toScrubbers
NaOH
Reverse Osmosis
Permeate to Reuse
Reject to Evaporators
NaHSO3
ProducedWater
Permeate to FilterBW & WAC Regen
Ove
rflow
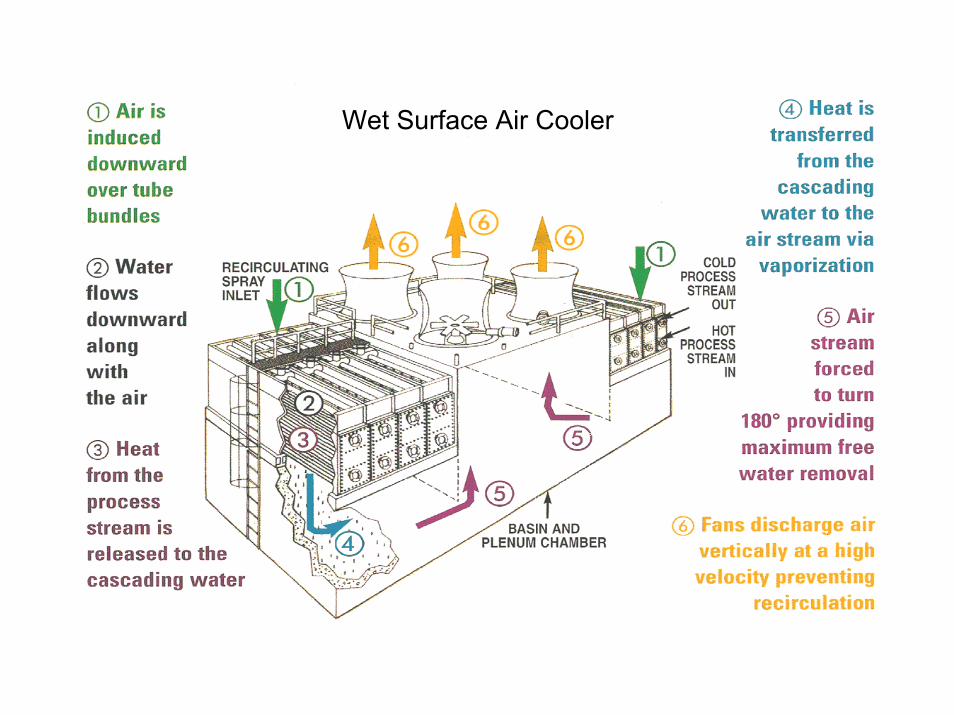
Wet Surface Air Cooler


![Platform for Translational Research on Transgenic Crops [PTTC]](https://img.pdfslide.us/doc/110x75/55c1ac7abb61ebc20a8b4738/platform-for-translational-research-on-transgenic-crops-pttc-55c21d5420cac.jpg)