Embed Size (px)
Citation preview
PRODUCCIÓN, PÉRDIDA DE PESO Y TASAS DE DESCOMPOSICIÓN DE HOJARASCA EN CAFETALES TRADICIONAL Y RÚSTICO, Y SELVA MEDIANA, EN VERACRUZ, MÉXICO
PRODUCTION, WEIGHT LOSS AND DECOMPOSITION RATES OF LEAF LITTER IN TRADITIONAL AND RUSTIC COFFEE SYSTEMS AND MEDIUM TROPICAL FOREST IN VERACRUZ, MEXICOLuis Villavicencio-EnríquezUniversity of Bangor, Wales. Correo-e: [email protected]
Recibido: 11 de agosto, 2010Aceptado: 16 de abril, 2012
doi: 10.5154/r.rchscfa/2010.08.049http:// www.chapingo.mx./revistas
RESUMENSe realizó un estudio para analizar la producción, pérdida de masa y tasa de descomposición de ho-jarasca en parcelas agroforestales con Sistema Tradicional de Café (STC), Sistemas Rústico de Café (SRC) y Selva mediana subperennifolia (Smsp), en San Miguel, Veracruz, México. En cada sistema se establecieron tres cuadrantes al azar (1000 m2). La colecta de hojarasca producida por el dosel se realizó cada 15 días, durante un año calendario. La descomposición de la hojarasca se evaluó en bolsas de polietileno que contenían10 g (peso seco) de las especies dominantes y una mezcla representativa por sistema. Las bolsas se colectaron en siete fechas durante 352 días. La tasa de descomposición (k) fue alta para Piper hispidum y para la hojarasca en SRC, en todas las fechas de muestreo, indicando un posible efecto del microclima o de la calidad de hojarasca. Las k menores se obtuvieron en Robinsonella mirandae/Coffea arabica y Mastichodendron capirii, en STC y Smsp. El resto de hojarascas mostraron tasas medianas de descomposición; R. mirandae no mostró diferen-cias entre sistemas. El estudio demostró la importancia de la producción y calidad de hojarasca, así como de los factores medioambientales, en la descomposición, en los sistemas de estudio.
ABSTRACTA study was conducted to analyze production, mass loss and decomposition rates of leaf litter in agroforestry plots with traditional coffee system (TCS), rustic coffee system (RCS) and medium tropi-cal forest (mtf), in San Miguel, Veracruz, Mexico. In each system, three quadrants were randomly established (1000 m2). The collection of leaf litter produced by the canopy was performed every 15 days, during a calendar year. Leaf litter decomposition was evaluated in litterbags containing 10 g (dry weight) of the dominant species and a representative mixture per system. Litterbags were collected on seven dates during 352 days. The decomposition rate (k) was high for Piper hispidum and leaf litter in RCS, in all sampling dates, indicating a possible effect of microclimate or quality of leaf litter. The low-est k values were obtained in Robinsonella mirandae/Coffea arabica and Mastichodendron capirii, in TCS and mtf. The rest of the leaf litter showed average rates of decomposition; Robinsonella mirandae showed no differences among systems. The study demonstrates the importance of leaf litter quality and production, and the environmental factors in the decomposition of the study systems.
PALABRAS CLAVE: Agroforestería, ecología forestal, descomposición
de materia orgánica, producción primaria
KEYWORDS: agroforestry, forest ecology, organic matter decom-
position, primary production.
INTRODUCTIÓN
Net primary production (NPP) is a basic process in terrestrial ecosystems. The bond between organic decomposition and nutrient cycling processes is estab-lished in NPP, which is the major route of energy transfer within the ecosystem (Aerts & De Caluwe, 1997; Álva-rez-Sánchez, 1995; Álvarez-Sánchez & Guevara, 1993; Meentemeyer, Box, & Thompson, 1982). NPP is distrib-uted in four ways: 1) stored as biomass (including roots), 2) obtained from soluble organic matter, 3) consumed by animals and insects and 4) deposited on soil as leaf litter. The production of large amounts of annual leaf lit-
INTRODUCCIÓN
La producción primaria neta (PPN) es un proceso básico en los ecosistemas terrestres. En él se establece el vínculo entre la descomposición orgánica y los pro-cesos de ciclaje de nutrientes, que es la ruta más impor-tante de transferencia de energía dentro del ecosistema (Aerts & De Caluwe, 1997; Álvarez-Sánchez, 1995; Álvarez-Sánchez & Guevara, 1993; Meentemeyer, Box, & Thompson, 1982). La NPP se distribuye de cuatro formas: 1) se almacena como biomasa (incluyendo las raíces), 2) se segrega de materia orgánica soluble, 3) se consume por animales e insectos y 4) se deposita
Revista Chapingo Serie Ciencias Forestales y del Ambiente, Año 18, Vol. 18 (2): 159-173, 2012.
Producción, perdida... Luis Villavicencio-Enríquez
160
ter is a characteristic of tropical ecosystems, especially in perennial forests and medium tropical forests. It is also characterized due to the heterogeneity of leaf litter, which is influenced by quantity, quality and seasonality (Burghouts, Ernsting, Korthals, & De Vries, 1992).
Typically, decomposition is measured as the weight loss over time. Some factors that have been considered in organic matter decomposition are: the influence of de-composing microorganisms, emission of CO2, isotope fractionation and 13C enrichment in soil profiles (Bjorn & Comstedt, 2007). Most studies on decomposition in forests have focused on tree aerial components, such as foliage (Melillo et al., 1989; Proctor, 1983; Sundara-pandiam & Swamy, 1999), barks, branches and wood (Harmon, Whigham, Sexton, & Olmsted, 1995).
For Aerts (1997), there are three important factors that control the processes of decomposition in ecosys-tems: climate, quality of the resource and colonies of de-composing microorganisms. These microorganisms are considered the main factor in areas with extreme weather conditions (Swift, Heal & Anderson, 1979; Melillo et al., 1993; Couteaux, Bottner & Berg, 1995; Bjorn & Comstedt, 2007; Zhou et al., 2008). Theoretically, leaf litter is com-posed of a labile fraction of sugars and proteins, which decompose quickly, and another more recalcitrant frac-tion, consisting of lignin, phenols, celluloses and hemicel-luloses, which decompose slowly (Binkley, 1986).
Two basic stages are involved in the decomposition process. The first stage comprises physical and chemi-cal fragmentation of organic matter caused by small herbivores, insects and other organisms. Subsequently, microorganisms such as bacteria and fungi continue re-ducing organic matter, which is mineralized in basic or-ganic molecules such as ammonium, phosphate, dioxide and water, which remain available for plants and micro-organisms or can be leached out of the system. The sec-ond stage in the decomposition process is catabolism, in which organic matter is divided into even smaller parts by means of chemical processes (Aerts, 1997; Swift and Anderson, 1989). Once the leaf litter is fragmented, its components are mixed with the rest of the substrate in soil, and the most labile components such as N, P, and phenols are washed by the action of water. These com-ponents affect the first stage of the decomposition pro-cess, when mineralization and humification occur; later, other more resistant compounds such as lignin, phenols and tannins act as primary agents to decrease decom-position. The early stages of decomposition are strongly influenced by weather, water soluble nutrient concentra-tions and structural carbohydrates in leaf litter, while the later stages of decomposition are influenced by the lignin concentration (Berg, 2000). The most common model to describe the process of decomposition has been the simple or negative exponential (Jenny, Gessei, & Bing-
como hojarasca en el suelo. La producción anual de cantidades grandes de hojarasca es característica de ecosistemas tropicales, particularmente, en las selvas perennifolias y subperennifolias. También se caracteri-zan por la heterogeneidad de la hojarasca que está influ-ida por la cantidad, calidad y estacionalidad (Burghouts, Ernsting, Korthals, & De Vries, 1992).
Usualmente, la descomposición se mide como la pérdida de peso a través del tiempo. Algunos factores considerados en la descomposición de materia orgáni-ca son la influencia de microorganismos descompone-dores, emanación de CO2, fraccionamiento isotópico y enriquecimiento de 13C en los perfiles del suelo (Bjorn & Comstedt, 2007). La mayoría de los estudios sobre la descomposición en selvas y bosques, se han cen-trado en los componentes aéreos del árbol, como el fol-laje (Melillo et al., 1989; Proctor, 1983; Sundarapandiam & Swamy, 1999), cortezas, ramas y madera (Harmon, Whigham, Sexton, & Olmsted, 1995).
Para Aerts (1997) existen tres factores de impor-tancia que controlan los procesos de descomposición en los ecosistemas: el clima, la calidad del recurso y las colonias de microorganismos descomponedores. Estos microorganismos se consideran el factor principal en las zonas con condiciones climáticas extremas (Bjorn & Comstedt, 2007; Couteaux, Bottner, & Berg, 1995; Me-lillo et al., 1993; Swift, Heal, & Anderson, 1979; Zhou et al., 2008). Teóricamente, la hojarasca se compone de una fracción lábil de azúcares y proteínas que se descompone con rapidez, y de otra fracción más recal-citrante, formada de lignina, fenoles, celulosa y hemice-lulosa que se descomponen lentamente (Binkley, 1986).
Dos etapas básicas están involucradas en el pro-ceso de descomposición. La primera implica la fragmen-tación física y química que sufre la materia orgánica por medio de herbívoros pequeños, insectos y otros organis-mos. Posteriormente, los microorganismos como bacte-rias y hongos reducen aún más la materia. Ésta se min-eraliza en moléculas orgánicas básicas como amonio, fosfato, dióxido y agua, que permanecen disponibles para las plantas y microorganismos o que pueden ser lixiviados fuera del sistema. La segunda etapa en el proceso de descomposición es el catabolismo, donde la materia orgánica se divide en partes todavía más peque-ñas, a través de procesos químicos (Aerts, 1997; Swift & Anderson, 1989). Una vez fragmentada la hojarasca, sus componentes se mezclan con el resto del sustrato en el suelo, y los componentes más lábiles como el N, P y fenoles son lavados por la acción del agua, prin- son lavados por la acción del agua, prin-cipalmente. Estos influyen en la primera etapa del pro-ceso de descomposición, cuando la mineralización y la humificación ocurren; después, otros compuestos más resistentes como la lignina, fenoles y taninos actúan como principales agentes para desacelerar el proceso
161
Revista Chapingo Serie Ciencias Forestales y del Ambiente, Año 18, Vol. 18 (2): 159-173, 2012.
ham, 1949); also common in tropical studies (Álvarez-Sánchez & Becerra-Enriquez, 1996; Cuevas & Medina, 1988; Frangi & Lugo, 1985; Gong & Ong, 1983; Harmon et al., 1995; Landsberg & Gower, 1997; Saldarriaga, 1994; Songwe, Okali, & Fesehun, 1995).
In Mexico, the litterbag method is the most widely used to measure decomposition and weight loss in situ. Such studies have been conducted in ecosystems such as: low deciduous forest (Martínez-Yrizar, 1980, 1984), secondary deciduous forest (Xuluc-Tolosa, Vester, Ramírez-Marcial, Castellanos-Albores & Laurece, 2003), arid regions (Maya & Arriaga, 1996; Montaña, Ezcurra, Carrillo, 1988), temperate forests (Ezcurra and Becerra, 1987) pine-oak forest and grassland (Montaña et al., 1988), high evergreen forest (Álvarez-Sánchez and Guevara, 1993) and medium tropical forest (Har- and medium tropical forest (Har-mon et al., 1995). This study was carried out to evalu-ate the influence of the basic processes of production and decomposition of leaf litter in traditional and rustic coffee plots and medium tropical forest, for functioning and management of these systems.
MATERIALS AND METHODS
The municipality of Amatlán de los Reyes is located at 18° 51’ N and 96° 55’ W and 830 m altitude, with a total surface of 148.88 ha. Average annual rainfall is 1913 mm per year, average annual temperature of 23.5 °C. The climate is semi-warm with rains in summer (A)C (m) a (i´)g (García, 1987). Soils are classified as vertisols and rendzina with a pH of 6.0 (Food and Agriculture Organi-zation [FAO] 2007).
Three quadrants (1000 m2) representative for each of the following agroforestry systems were established: 1) traditional coffee system (TCS), 2) rustic coffee system (RCS) and 3) medium tropical forest (mtf). At each site, three funnel-shaped trap nettings made of polyethylene (1cm aperture), were randomly placed to collect leaf litter (1 m2). Traps were positioned at a height of 50 cm from the soil to prevent damages caused by microorganisms or moisture, due to a greater air flow (Swift et al., 1979).
Fresh leaf litter was collected every 15 days during a calendar year (2006). Each collection was processed, sorting out leaf litter from that material damaged by mi-croorganisms, insects or animals; and also according to the dominant species and others. Samples were manu-ally cleaned with distilled water and dried for 48 h in an oven at 60 °C. The production of dry weight (kg·ha-1) was measured per system, dominant species and others (An-derson and Ingram, 1989; Palm & Rowland, 1997). To measure decomposition, 252 litterbags of 10 x 10 cm and 1 mm mesh aperture were prepared to enable the entry of moisture and microorganisms (Swift et al., 1979). Litterb-ags were filled with 10 g leaf litter of the dominant species and representative mixtures from each system (Table 1).
de descomposición. Las primeras etapas de descom-posición se ven fuertemente influidas por el clima, las concentraciones de nutrientes solubles en agua y carbo-hidratos estructurales en hojarasca, mientras que las últi-mas etapas de la descomposición por la concentración de lignina (Berg, 2000). El modelo más utilizado para describir el proceso de descomposición ha sido el expo-nencial sencillo o negativo (Jenny, Gessei, & Bingham, 1949), al igual que en estudios realizados en los trópicos (Álvarez-Sánchez & Becerra-Enriquez, 1996; Cuevas & Medina, 1988; Frangi & Lugo, 1985; Gong & Ong, 1983; Harmon et al., 1995; Landsberg & Gower, 1997; Saldar-riaga, 1994; Songwe, Okali, & Fesehun, 1995).
En México, en los estudios de descomposición de hojarasca se ha utilizado el método de bolsas para descomposición (litterbags) o la observación directa de la pérdida de peso en campo. Tales estudios se han real-izado en ecosistemas como: selva baja caducifolia (Mar-tínez-Yrizar, 1980; 1984), selva caducifolia secundaria (Xuluc-Tolosa, Vester, Ramírez-Marcial, Castellanos-Al-bores, & Laurece, 2003), zonas áridas (Maya & Arriaga, 1996; Montaña, Ezcurra, & Carrillo,1988), bosques temp-lados (Ezcurra & Becerra, 1987), bosque de pino-encino y pastizales (Montaña et al., 1988), selva alta perennifo-lia (Álvarez-Sánchez & Guevara, 1993) y selva mediana subperennifolia (Harmon et al., 1995). Este estudio se realizó con el objeto de estudiar la influencia de los pro-cesos básicos de producción y descomposición de hojar-asca en cafetales tradicionales y rústicos, y selva media-fetales tradicionales y rústicos, y selva media-na subperennifolia, para el funcionamiento y manejo de estos sistemas.
MATERIALES Y MÉTODOS
El municipio de Amatlán de los Reyes está situado en la latitud 18° 51’ N y longitud 96° 55’ O, a una altitud de 830 m, con una superficie total de 148,88 ha. La precipit-ación media anual es de 1,913 mm y la temperatura me-dia anual de 23.5 °C. El clima es semicálido húmedo con lluvias en verano (A)C (m) a (i´)g (García, 1987). Los sue-los se clasifican como vertisoles y rendzinas con un pH de 6.0 (Food and Agriculture Organization [FAO], 2007).
Se establecieron tres cuadrantes (100 m2) rep-resentativos para cada uno de los siguientes sistemas agroforestales: 1) Sistema Tradicional de Café (STC), 2) Sistema Rústico de Café (SRC) y 3) Sistemas de selva mediana subperennifolia (Smsp). En cada sitio se co-locaron aleatoriamente tres trampas de red de polietile-no (abertura de 1 cm) con forma de embudo para colecta de hojarasca (1 m2). Las trampas se colocaron a una altura aproximada de 50 cm del suelo, para evitar daños por microorganismos o por humedad al permitir un flujo mayor de aire (Swift et al., 1979).
La hojarasca fresca se colectó cada 15 días du-rante un año calendario (2006). Cada colecta se procesó
Producción, perdida... Luis Villavicencio-Enríquez
162
CUADRO 1. Contenidos de hojarasca en bolsas para medir descomposición por sistema (litterbags).
STC SRC Smsp
+Robinsonella mirandae +Robinsonella mirandae +Robinsonella mirandae
^Robinsonella-mirandae/Coffea arabica
^Robinsonella-mirandae/Coffea arabica
^Robinsonella-mirandae/Coffea arabica
*Mastichodendron capirii *Piper hispidum *Croton officinalis
Mezcla de hojarasca Mezcla de hojarasca Mezcla de hojarasca
Nota: + = Robinsonella mirandae; ^ = Robinsonella mirandae/Coffea arabica; *= Especies dominantes; mezcla= Mezcla de hojarasca general por sistema.
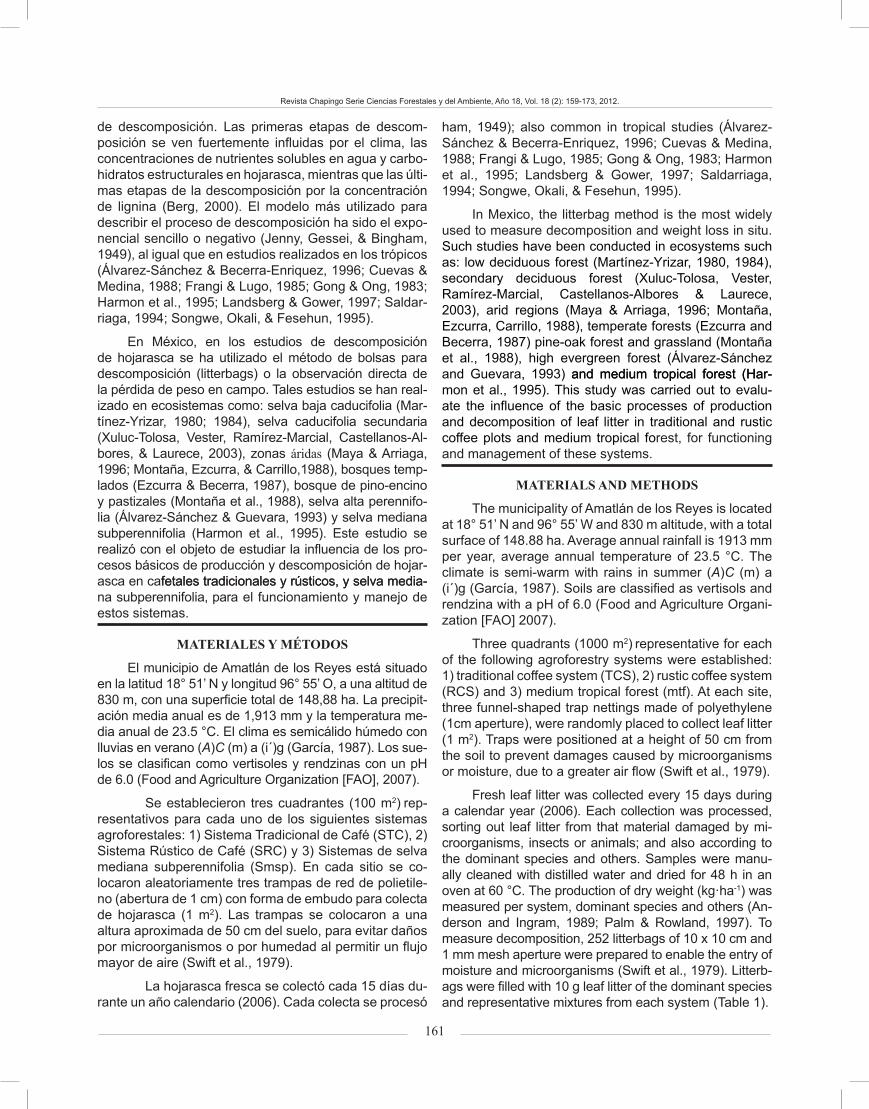
TABLE 1. Leaf litter content in litterbags to obtain the decomposition per system.
TCS RCS mtf
+Robinsonella mirandae +Robinsonella mirandae +Robinsonella mirandae
^Robinsonella-mirandae/Coffea arabica
^Robinsonella-mirandae/Coffea arabica
^Robinsonella-mirandae/Coffea arabica
*Mastichodendron capirii *Piper hispidum *Croton officinalis
Litter mixture Litter mixture Litter mixture
Note: TCS: traditional coffee system, RCS: rustic coffee system, mtf: medium tropical forest, *=dominant species, Mixture= leaf litter mixture per system.
A set of litterbags were placed at ground level. These samples were collected during the sampling intervals on days: 1, 11, 22, 44, 88, 176 and 352. At each sampling collection, the remaining material in litterbags was pro-cessed to obtain the dry weight after washing and drying the samples in an oven (48 h at 60 °C) (Palm & Rowland, 1997). The simple exponential model was used to deter-mine weight loss:
Wt = W0 e-kt,
Where W0 and Wt represent the initial weight and weight after t (years), respectively; k is the decomposi-tion rate constant.
separando el material que no fuera hojarasca y aquél dañado por microorganismos, insectos o animales; tam-bién de acuerdo con las especies dominantes y otras. La hojarasca se limpió manualmente con agua destilada y se secó por 48 h en un horno a 60 °C. La producción de peso seco (kg·ha-1) se midió por sistema, por especies dominantes y otras (Anderson & Ingram, 1989; Palm & Rowland, 1997). Para medir la descomposición se pre-pararon 252 bolsas de polietileno de 10 x 10 cm y 1 mm de apertura de malla, para permitir la entrada de micro-organismos y humedad (Swift et al., 1979). Las bolsas se llenaron con un peso seco de 10 g de hojarasca de las especies dominantes y mezclas representativas por sistema (Cuadro 1).
Las series de bolsas se colocaron en los sitios a nivel del suelo. Éstas se recolectaron durante los inter-valos de muestreo, los días 1, 11, 22, 44, 88, 176 y 352. En cada muestreo, el material restante en las bolsas con hojarasca se procesó para obtener el peso seco por me-dio de limpiado y secado en estufa (48 h a 60 °C) (Palm & Rowland, 1997). La pérdida de peso se determinó con el modelo exponencial simple:
Wt = W0 e-kt
Donde W0 y Wt son el peso al inicio del experimento y después del tiempo t (años), respectivamente; k es la constante de la tasa de descomposición.
La constante k se calculó de acuerdo con la fór-mula de Olson (1963):
Ln (x0 / xt) = -ktDonde x0 es el peso original de la hojarasca, xt es el
peso remanente en el momento t.
El análisis de los datos se realizó con ANDEVA univariadas y regresiones simples, para determinar la
The constant k was obtained according to Olson’s formula (1963):
Ln (x0/xt) = -kt,Where x0 is the original litter weight, xt is the remain-
ing weight at the moment t, and t is the time in years.
The data analysis was performed using univariate Anova and simple regressions to determine the correlation between weight loss and litter quality (Steel & Torrie, 1986).
RESULTS AND DISCUSSION
Results of the total leaf litter production (Table 2) show that TCS had the highest production throughout the year with 9121.45 t·ha-1·year-1, followed by mtf and RCS with 8,190.03 and 5,752.66 t·ha-1·year-1, respec-tively. These results are similar to those reported by Did-ham (1998) in ranges of continuous forest, where leaf litter production was 6,196 and 7,948 kg·ha-1·year-1, and to those reported by McDonald & Healey (2000), who re-ported an average litter production of 9,319 kg·ha-1·year-1
in a secondary rainforest of Jamaica. It also agrees with
163
Revista Chapingo Serie Ciencias Forestales y del Ambiente, Año 18, Vol. 18 (2): 159-173, 2012.
correlación entre la pérdida de peso y la calidad de hoja-rasca (Steel & Torrie, 1986).
RESULTADOS Y DISCUSIÓN
Los resultados de la producción total de hojarasca (Cuadro 2) muestran que en el STC se obtuvo la produc-ción mayor a lo largo del año con 9,121.45 t·ha-1·año-1, seguido por Smsp y SRC con 8,190.03 y 5,752.66 t·ha-1·año-1, respectivamente. Estos resultados son sim-ilares a los reportados por Didham (1998) en rangos de bosque continuo, donde la producción de hojarasca fue de 6,196 a 7,948 kg·ha-1·año-1, y a los de McDonald y Healey (2000), quienes reportaron una media de pro-ducción de hojarasca de 9,319 kg·ha-1·año-1 en selva tropical secundaria en Jamaica. También concuerdan con la revisión realizada por Proctor, Anderson, Fogden, y Vallack (1983), la cual muestra medias similares de producción de hojarasca en otros bosques tropicales.
El peso promedio total de hojarasca recogida en el STC fue 9,121.50 kg·ha-1·año-1. Las especies domi-nantes fueron Cecropia obtusifolia (27.6 %), Heliocar-pus appendiculatus (18.2 %) y R. mirandae (14.1 %). El total de hojarasca colectada en el SRC fue 5,752.7 kg·ha-1·año-1, y las especies con mayor producción fue-ron R. mirandae (14.3 %), H. appendiculatus (13.5 %), Stemmaldenia donell-smithii y Croton officinalis (11.3 %). El total de hojarasca colectada en Smsp fue 8,190 kg·ha-1·año-1, con C. officinalis (27.5 %), Syderoxylon ca-piri (17.4 %), P. hispidum (1.9 %) y R. mirandae (10.2 %) como principales especies productoras (Cuadro 2). C. arabica tuvo un pequeño aporte de hojarasca en el STC y SRC, similar al encontrado por Beer (1988).
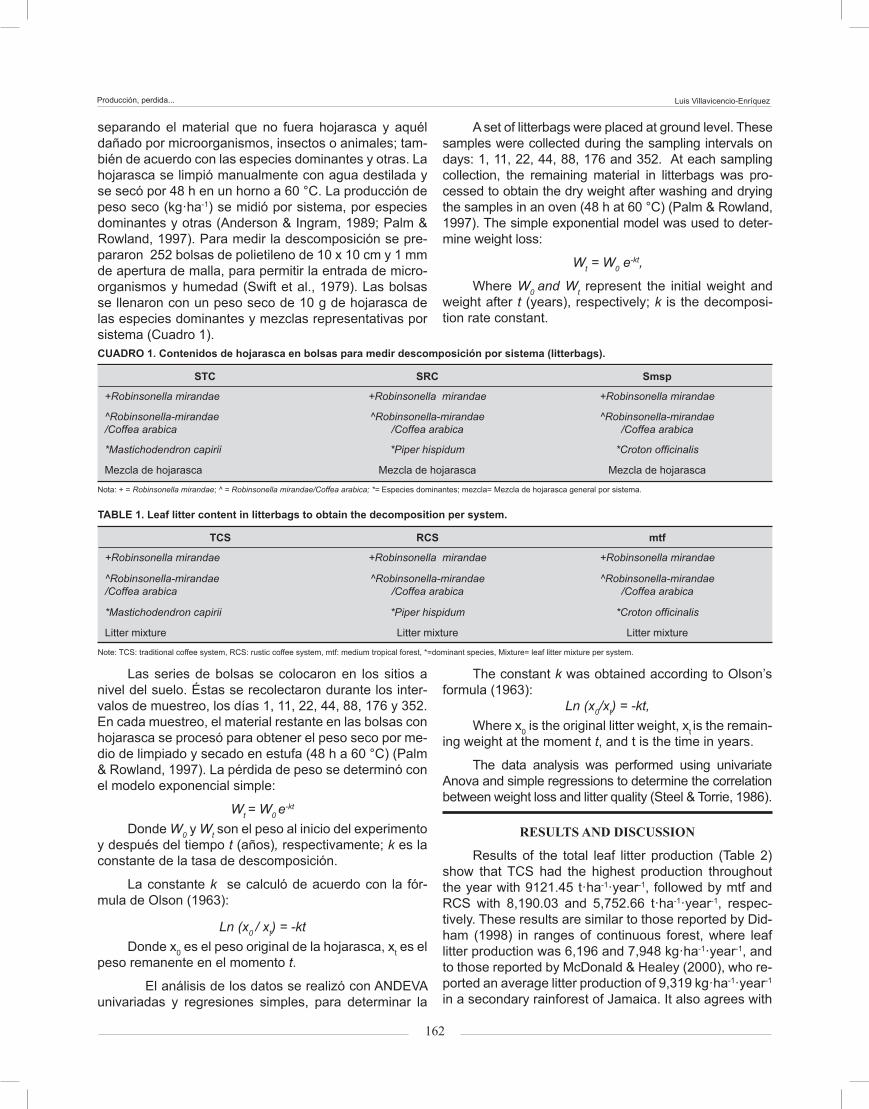
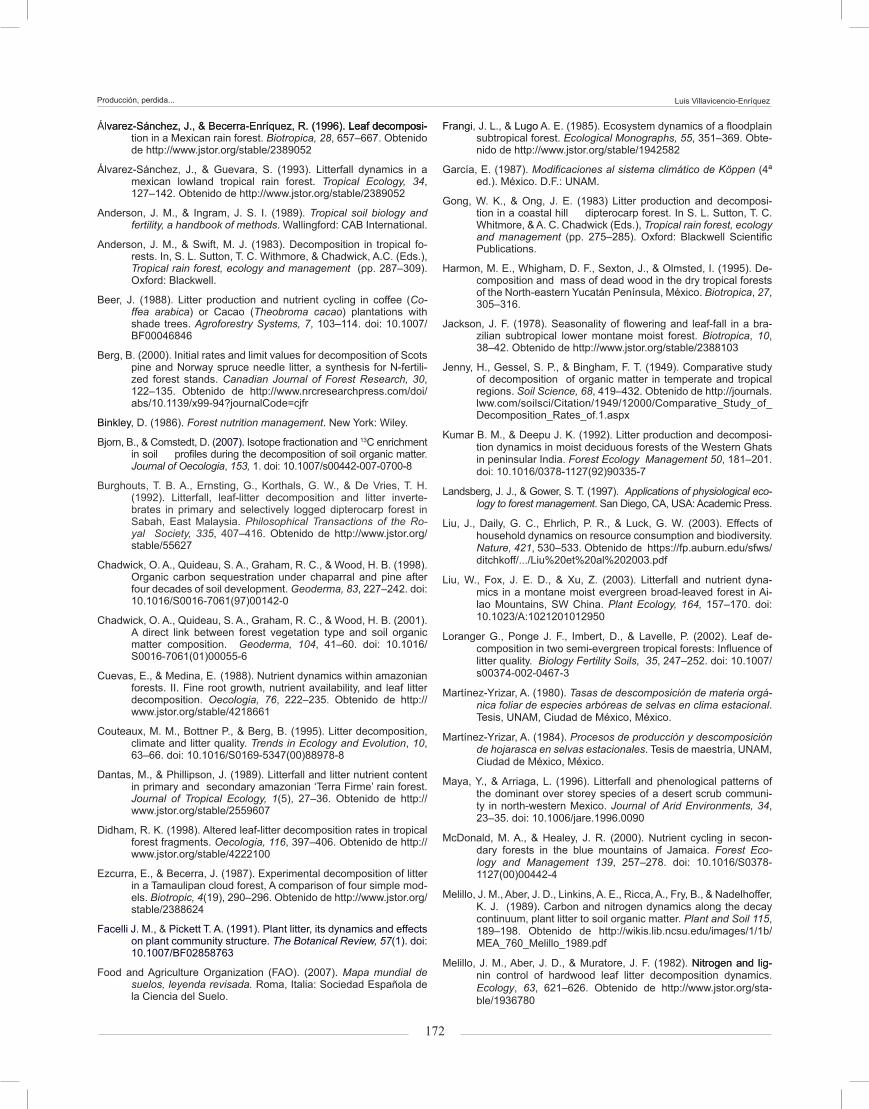
La producción mayor de hojarasca se obtuvo durante la época seca (enero a mayo). Una segunda temporada de producción se estableció al final de la época de lluvias, en el mes de noviembre (Figura 1) y coincide con la temporada de huracanes en el golfo de CUADRO 2. Producción promedio de hojarasca de especies dominantes por sistema.
EspecieSTC SRC Smsp
__________________ kg·ha-1·año-1_______________Robinsonella mirandae 604.86 772.14 837.93
Coffea arabica 145.86 58.74 11.88
Mastichodendron capirii 385.70 3.80 63.08
Piper hispidum 47.19 299.91 976.56
Croton officinalis 20.16 584.64 2,252.16
Cecropia obtusifolia 2,519.20 451.20 582.80
Heliocarpus appendiculatus 1,657.50 650.25 441.15
Spondias mombin N.d. 260.48 520.96
Syderoxylon capiri 176.88 344.38 1,425.76
Stemmaldenia donnel-smithii 8.32 588.80 336
Otras species 3,555.78 1,738.33 741.75STC: Sistema Tradicional de Café, SRC: Sistema Rústico de Café, Smsp: Selva mediana subperennifolia. N.d. = no hay datos.
a review of other studies conducted by Proctor, Ander-son, Fogden & Vallack (1983), showing average litter production similar to those in other tropical forests.
The total average weight of leaf litter collected in TCS was 9,121.50 kg·ha-1 year-1. The dominant species were Cecropia obtusifolia (27.6 %), Heliocarpus appen-diculatus (18.2 %) and R. mirandae (14.1 %). The total weight of leaf litter collected in RCS was 5752.7 kg·ha-1 year-1, and the species with the highest production were: R. mirandae (14.3 %), H. appendiculatus (13.5 %), Stemmaldenia donellsmithii and Croton officinalis (11.3 %). The total leaf litter collected in mtf was 8,190.00 kg·ha-1·year-1, with C. officinalis (27.5 %), Syderoxylon capiri (17.4 %), Piperhispidum (1.9 %) and R. mirandae (10.2 %) as the main producing species (Table 2). Coffea arabica had a small litter contribution in TCS and RCS, similar to that reported by Beer (1988).
The highest leaf litter production occurred during the drought season (January to May). A second produc-tion season was set at the end of the rainy season in November (Figure 1), coinciding with the hurricane sea-son in the Gulf of Mexico. Changes in leaf litter produc-tion may be an effect of the phenology of species and seasonality. These results are similar to those shown by Álvarez-Sánchez & Guevara (1993)
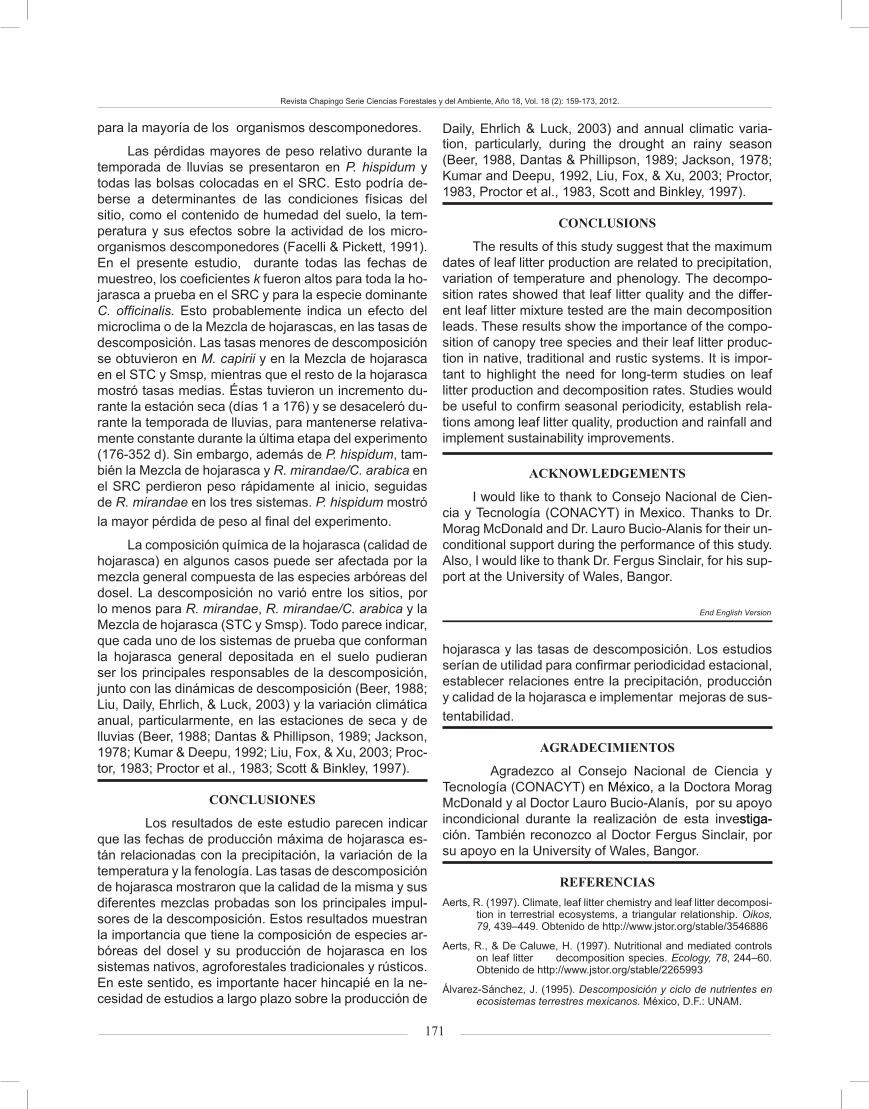
Leaf litter weight loss through time
Leaf litter weight loss during the drought season (January to June) showed patterns of the first stage of decomposition, with an accelerated weight loss and a consequent deceleration of the decomposition process during the rainy season (July to December). In all sys-tems R. mirandae decomposed rapidly during the first 176 days, almost linearly, but showed a slower rate during the last 176 days, with a percentage remaining weight of 14 to 16 % and no differences in weight loss between systems (Figure 2 a). The average weight loss
Producción, perdida... Luis Villavicencio-Enríquez
164
FIGURA 1. Variaciones en la media mensual de producción de hojarasca en a) Sistema Tradicional de Café (STC), b) Sistema Rústico de Café (SRC) y c) Selva mediana subperennifolia (Smsp).
c
12001000
800
600
400
200
0E F M A M J J A S O N DM
edia
de
prod
ucci
ón d
e ho
jara
sca
(kg·
ha-1)
Mes
b
700600500400300200100
0E F M A M J J A S O N DM
edia
de
prod
ucci
ón d
e ho
jara
sca
(kg·
ha-1)
Mes
a
E F M A M J J A S O N DMes
18001600
140012001000
800600
400200
0
Med
ia d
e pr
oduc
ción
de
hoja
rasc
a (k
g·ha
-1)
FIGURE 1. Variation in average monthly leaf litter production in a) Traditional Coffee System (TCS), b) Rustic Coffee Sys-tem (RCS) and c) medium tropical forest (mtf).
c
12001000
800
600
400
200
0J F M A M J J A S O N D
Aver
age
leaf
litte
r pro
duct
ion
(k
g·ha
-1)
Month
b
700600500400300200100
0J F M A M J J A S O N DAv
erag
e le
af li
tter p
rodu
ctio
n (k
g·ha
-1)
Month
a
J F M A M J J A S O N DMonth
18001600
140012001000
800600
400200
0Aver
age
leaf
litte
r pro
duct
ion
(kg·
ha-1)
TABLE 2. Average leaf litter production (kg·ha-1·year-1) per dominant species.
Species TCS RCS mtf
Robinsonella mirandae 604.86 772.14 837.93
Coffea arabica 145.86 58.74 11.88
Mastichodendron capirii 385.70 3.80 63.08
Piper hispidum 47.19 299.91 976.56
Croton officinalis 20.16 584.64 2,252.16
Cecropia obtusifolia 2,519.20 451.20 582.80
Heliocarpus appendiculatus 1,657.50 650.25 441.15
Spondias mombin N.d. 260.48 520.96
Syderoxylon capiri 176.88 344.38 1,425.76
Stemmaldenia donnel-smithii 8.32 588.80 336
Other species 3,555.78 1,738.33 741.75TCS: traditional coffee system, RCS: rustic coffee system, mtf: medium tropical forest, N.d. = no data
165
Revista Chapingo Serie Ciencias Forestales y del Ambiente, Año 18, Vol. 18 (2): 159-173, 2012.
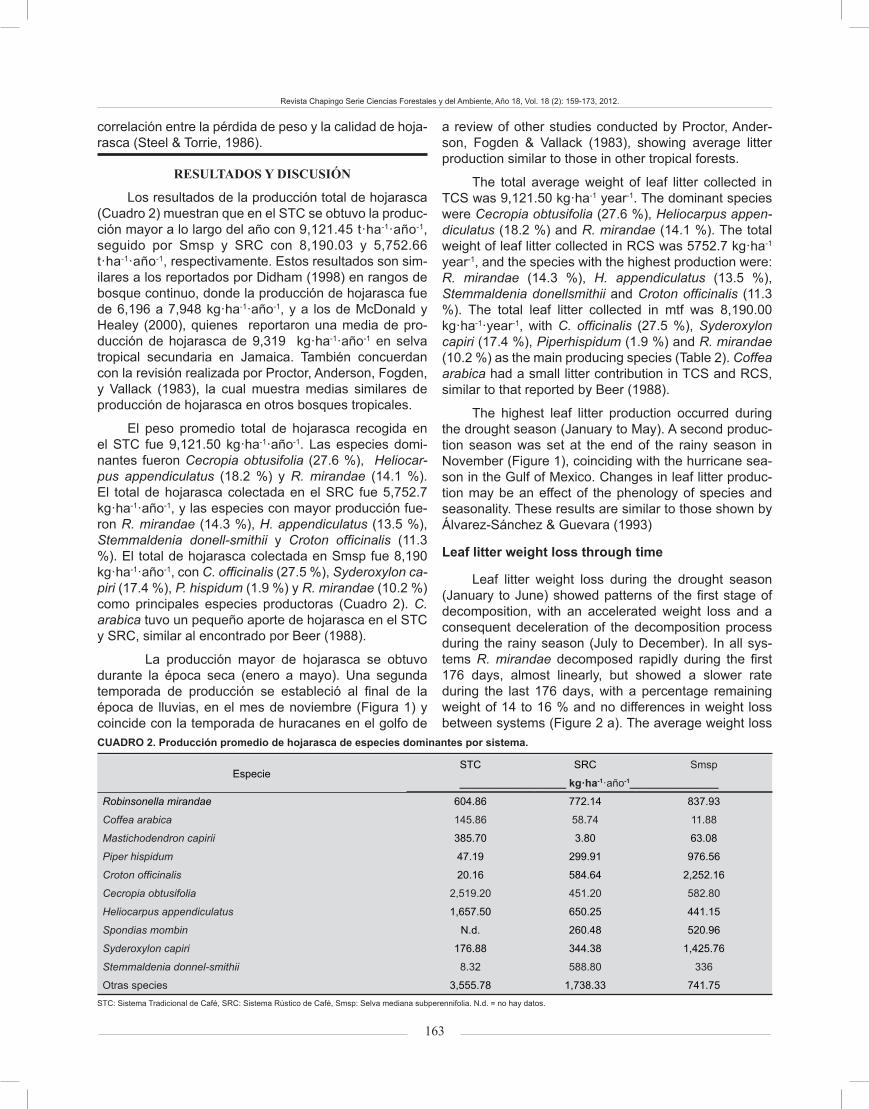
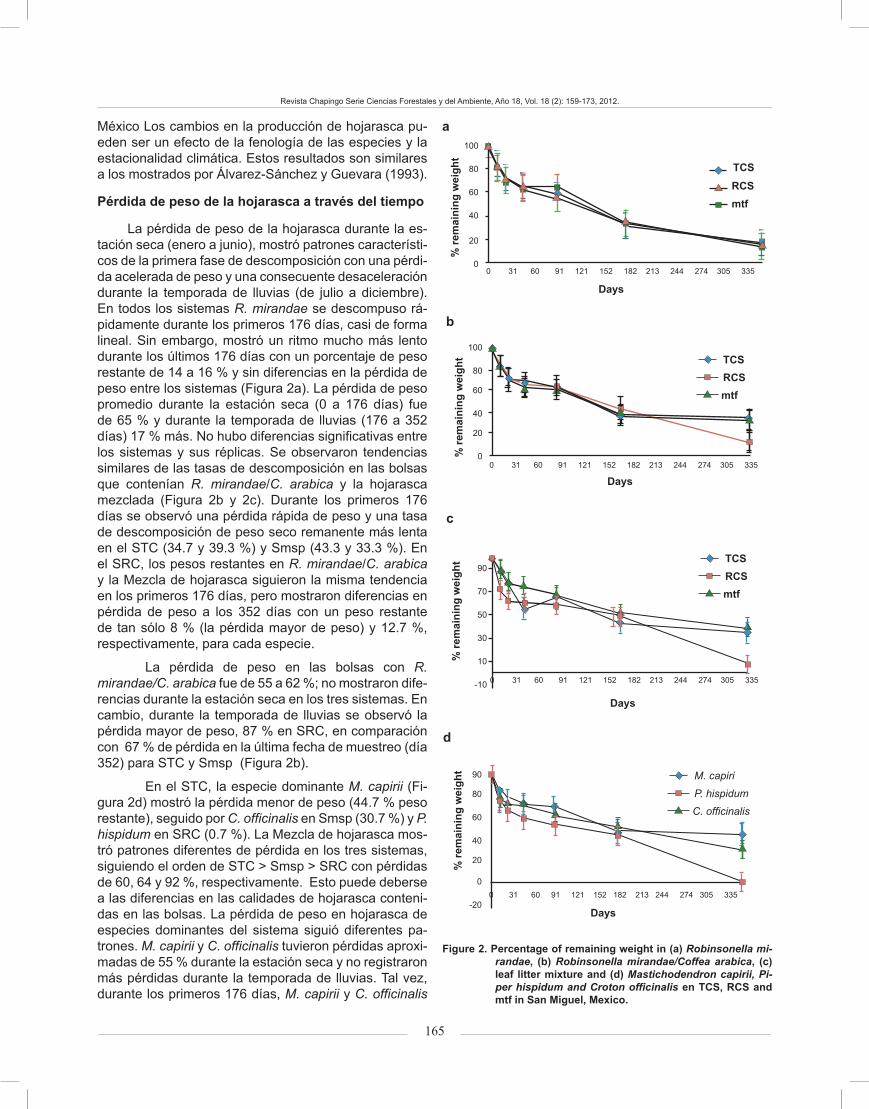
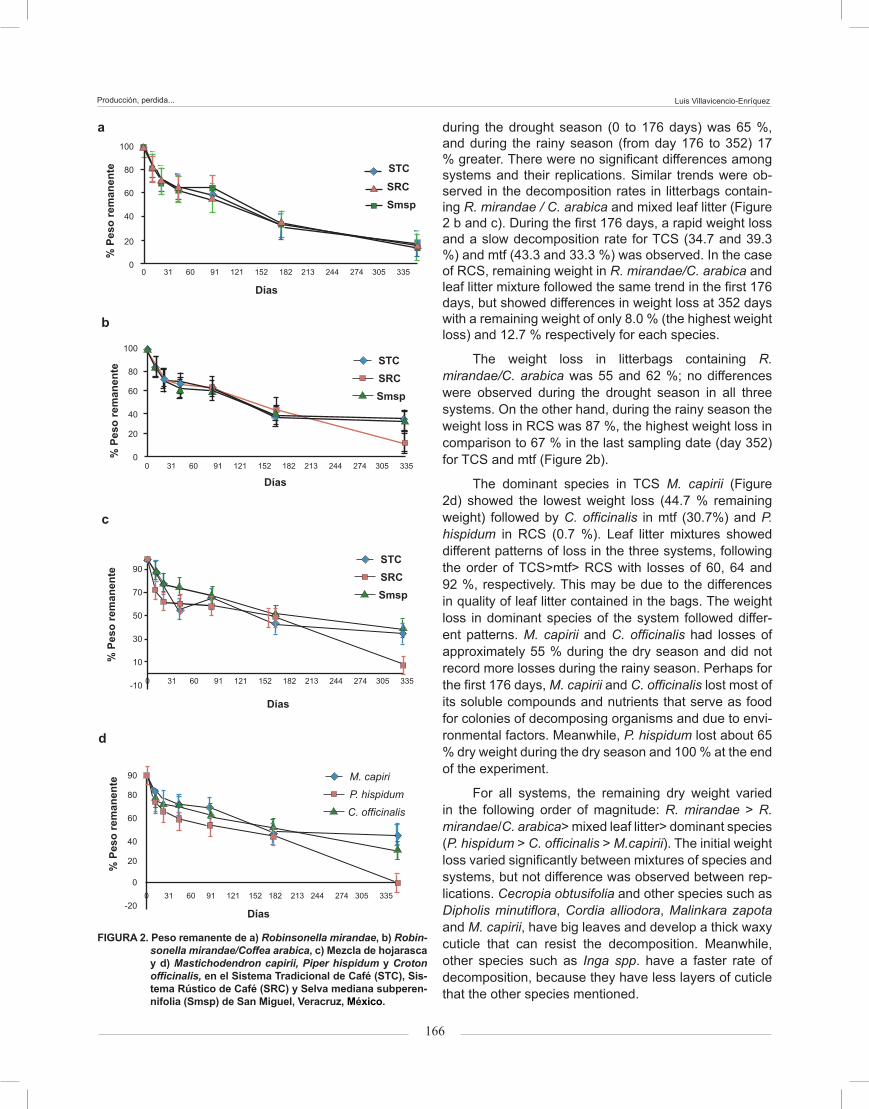
Figure 2. Percentage of remaining weight in (a) Robinsonella mi-randae, (b) Robinsonella mirandae/Coffea arabica, (c) leaf litter mixture and (d) Mastichodendron capirii, Pi-per hispidum and Croton officinalis en TCS, RCS and mtf in San Miguel, Mexico.
a100
80
60
40
20
00 31 60 91 121 152 182 213 244 274 305 335
Days
TCS
% re
mai
ning
wei
ght
RCSmtf
c
90
70
50
30
10
-10 0 31 60 91 121 152 182 213 244 274 305 335
Days
% re
mai
ning
wei
ght TCS
RCSmtf
d
90
80
60
40
20
0
-200 31 60 91 121 152 182 213 244 274 305 335
Days
% re
mai
ning
wei
ght M. capiri
P. hispidum
C. officinalis
b
100
80
60
40
20
00 31 60 91 121 152 182 213 244 274 305 335
Days
TCS
% re
mai
ning
wei
ght
RCSmtf
México Los cambios en la producción de hojarasca pu-eden ser un efecto de la fenología de las especies y la estacionalidad climática. Estos resultados son similares a los mostrados por Álvarez-Sánchez y Guevara (1993).
Pérdida de peso de la hojarasca a través del tiempo
La pérdida de peso de la hojarasca durante la es-tación seca (enero a junio), mostró patrones característi-cos de la primera fase de descomposición con una pérdi-da acelerada de peso y una consecuente desaceleración durante la temporada de lluvias (de julio a diciembre). En todos los sistemas R. mirandae se descompuso rá-pidamente durante los primeros 176 días, casi de forma lineal. Sin embargo, mostró un ritmo mucho más lento durante los últimos 176 días con un porcentaje de peso restante de 14 a 16 % y sin diferencias en la pérdida de peso entre los sistemas (Figura 2a). La pérdida de peso promedio durante la estación seca (0 a 176 días) fue de 65 % y durante la temporada de lluvias (176 a 352 días) 17 % más. No hubo diferencias significativas entre los sistemas y sus réplicas. Se observaron tendencias similares de las tasas de descomposición en las bolsas que contenían R. mirandae/C. arabica y la hojarasca mezclada (Figura 2b y 2c). Durante los primeros 176 días se observó una pérdida rápida de peso y una tasa de descomposición de peso seco remanente más lenta en el STC (34.7 y 39.3 %) y Smsp (43.3 y 33.3 %). En el SRC, los pesos restantes en R. mirandae/C. arabica y la Mezcla de hojarasca siguieron la misma tendencia en los primeros 176 días, pero mostraron diferencias en pérdida de peso a los 352 días con un peso restante de tan sólo 8 % (la pérdida mayor de peso) y 12.7 %, respectivamente, para cada especie.
La pérdida de peso en las bolsas con R. mirandae/C. arabica fue de 55 a 62 %; no mostraron dife-rencias durante la estación seca en los tres sistemas. En cambio, durante la temporada de lluvias se observó la pérdida mayor de peso, 87 % en SRC, en comparación con 67 % de pérdida en la última fecha de muestreo (día 352) para STC y Smsp (Figura 2b).
En el STC, la especie dominante M. capirii (Fi-gura 2d) mostró la pérdida menor de peso (44.7 % peso restante), seguido por C. officinalis en Smsp (30.7 %) y P. hispidum en SRC (0.7 %). La Mezcla de hojarasca mos-tró patrones diferentes de pérdida en los tres sistemas, siguiendo el orden de STC > Smsp > SRC con pérdidas de 60, 64 y 92 %, respectivamente. Esto puede deberse a las diferencias en las calidades de hojarasca conteni-das en las bolsas. La pérdida de peso en hojarasca de especies dominantes del sistema siguió diferentes pa-trones. M. capirii y C. officinalis tuvieron pérdidas aproxi-madas de 55 % durante la estación seca y no registraron más pérdidas durante la temporada de lluvias. Tal vez, durante los primeros 176 días, M. capirii y C. officinalis
Producción, perdida... Luis Villavicencio-Enríquez
166
FIGURA 2. Peso remanente de a) Robinsonella mirandae, b) Robin-sonella mirandae/Coffea arabica, c) Mezcla de hojarasca y d) Mastichodendron capirii, Piper hispidum y Croton officinalis, en el Sistema Tradicional de Café (STC), Sis-tema Rústico de Café (SRC) y Selva mediana subperen-nifolia (Smsp) de San Miguel, Veracruz, México.
a100
80
60
40
20
00 31 60 91 121 152 182 213 244 274 305 335
Días
STC
% P
eso
rem
anen
te
SRCSmsp
c
90
70
50
30
10
-10 0 31 60 91 121 152 182 213 244 274 305 335
Días
% P
eso
rem
anen
te
STCSRCSmsp
d
90
80
60
40
20
0
-200 31 60 91 121 152 182 213 244 274 305 335
Días
% P
eso
rem
anen
te M. capiri
P. hispidum
C. officinalis
b
100
80
60
40
20
00 31 60 91 121 152 182 213 244 274 305 335
Días
STC
% P
eso
rem
anen
te
SRCSmsp
during the drought season (0 to 176 days) was 65 %, and during the rainy season (from day 176 to 352) 17 % greater. There were no significant differences among systems and their replications. Similar trends were ob-served in the decomposition rates in litterbags contain-ing R. mirandae / C. arabica and mixed leaf litter (Figure 2 b and c). During the first 176 days, a rapid weight loss and a slow decomposition rate for TCS (34.7 and 39.3 %) and mtf (43.3 and 33.3 %) was observed. In the case of RCS, remaining weight in R. mirandae/C. arabica and leaf litter mixture followed the same trend in the first 176 days, but showed differences in weight loss at 352 days with a remaining weight of only 8.0 % (the highest weight loss) and 12.7 % respectively for each species.
The weight loss in litterbags containing R. mirandae/C. arabica was 55 and 62 %; no differences were observed during the drought season in all three systems. On the other hand, during the rainy season the weight loss in RCS was 87 %, the highest weight loss in comparison to 67 % in the last sampling date (day 352) for TCS and mtf (Figure 2b).
The dominant species in TCS M. capirii (Figure 2d) showed the lowest weight loss (44.7 % remaining weight) followed by C. officinalis in mtf (30.7%) and P. hispidum in RCS (0.7 %). Leaf litter mixtures showed different patterns of loss in the three systems, following the order of TCS>mtf> RCS with losses of 60, 64 and 92 %, respectively. This may be due to the differences in quality of leaf litter contained in the bags. The weight loss in dominant species of the system followed differ-ent patterns. M. capirii and C. officinalis had losses of approximately 55 % during the dry season and did not record more losses during the rainy season. Perhaps for the first 176 days, M. capirii and C. officinalis lost most of its soluble compounds and nutrients that serve as food for colonies of decomposing organisms and due to envi-ronmental factors. Meanwhile, P. hispidum lost about 65 % dry weight during the dry season and 100 % at the end of the experiment.
For all systems, the remaining dry weight varied in the following order of magnitude: R. mirandae > R. mirandae/C. arabica> mixed leaf litter> dominant species (P. hispidum > C. officinalis > M.capirii). The initial weight loss varied significantly between mixtures of species and systems, but not difference was observed between rep-lications. Cecropia obtusifolia and other species such as Dipholis minutiflora, Cordia alliodora, Malinkara zapota and M. capirii, have big leaves and develop a thick waxy cuticle that can resist the decomposition. Meanwhile, other species such as Inga spp. have a faster rate of decomposition, because they have less layers of cuticle that the other species mentioned.
167
Revista Chapingo Serie Ciencias Forestales y del Ambiente, Año 18, Vol. 18 (2): 159-173, 2012.
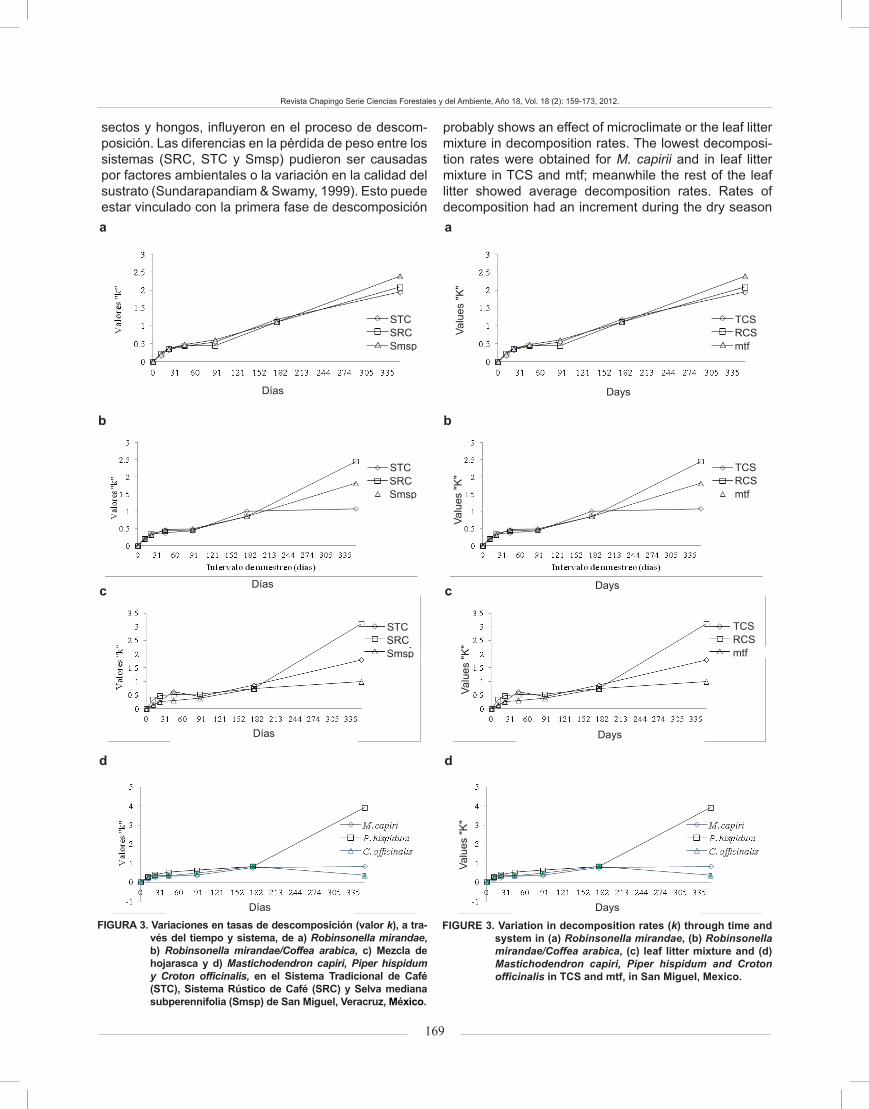
Variation in leaf litter decomposition rates (k) through time
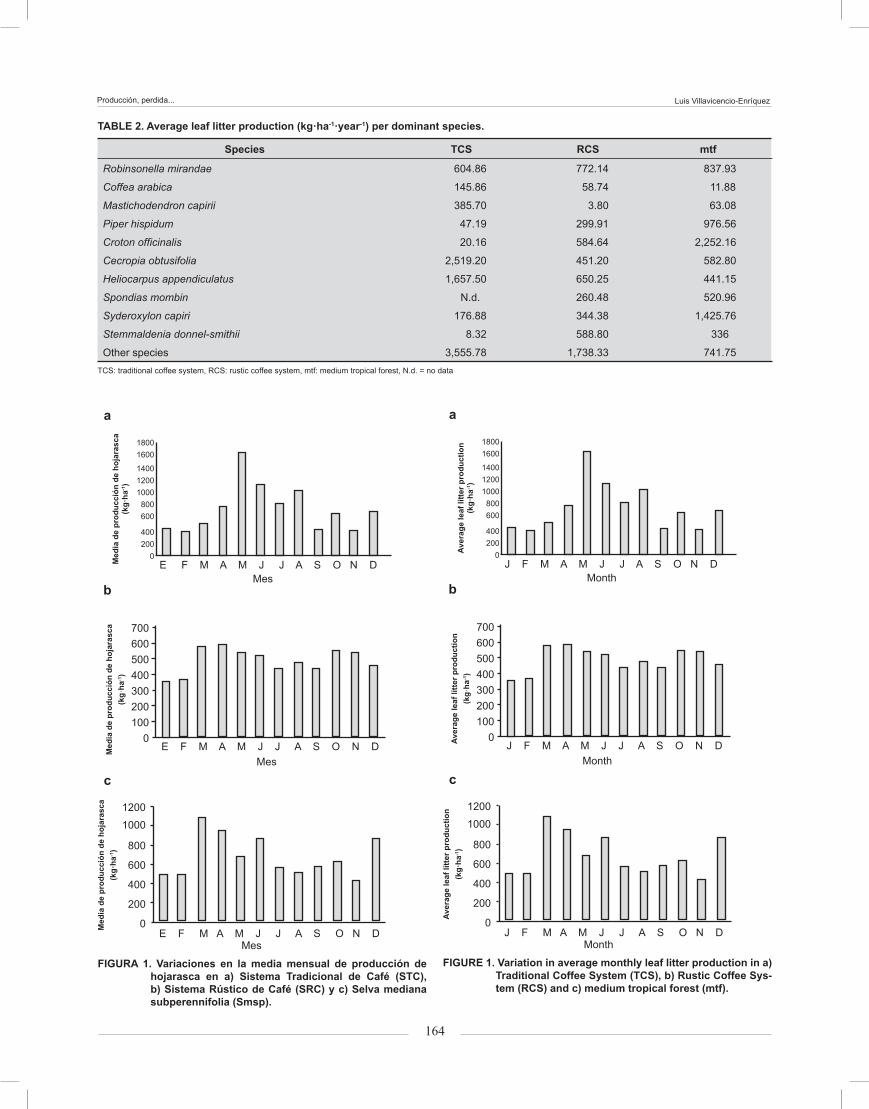
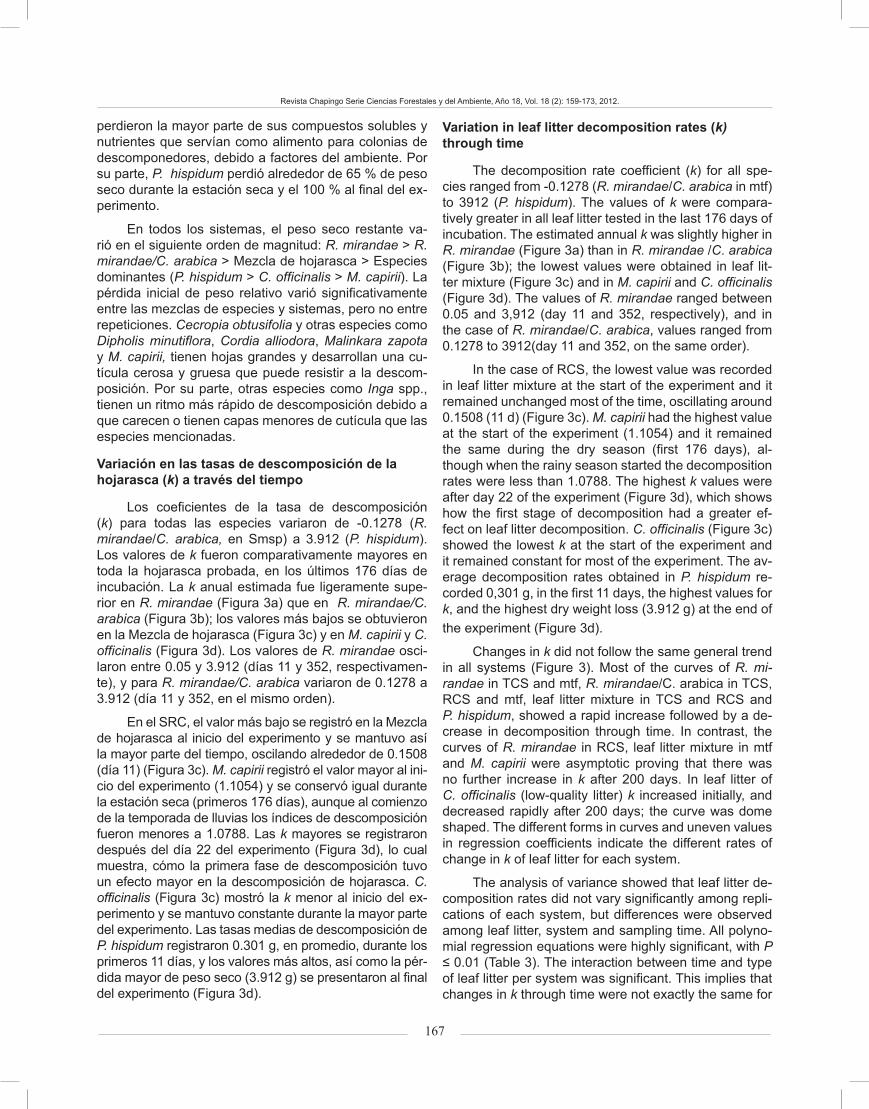
The decomposition rate coefficient (k) for all spe-cies ranged from -0.1278 (R. mirandae/C. arabica in mtf) to 3912 (P. hispidum). The values of k were compara-tively greater in all leaf litter tested in the last 176 days of incubation. The estimated annual k was slightly higher in R. mirandae (Figure 3a) than in R. mirandae /C. arabica (Figure 3b); the lowest values were obtained in leaf lit-ter mixture (Figure 3c) and in M. capirii and C. officinalis (Figure 3d). The values of R. mirandae ranged between 0.05 and 3,912 (day 11 and 352, respectively), and in the case of R. mirandae/C. arabica, values ranged from 0.1278 to 3912(day 11 and 352, on the same order).
In the case of RCS, the lowest value was recorded in leaf litter mixture at the start of the experiment and it remained unchanged most of the time, oscillating around 0.1508 (11 d) (Figure 3c). M. capirii had the highest value at the start of the experiment (1.1054) and it remained the same during the dry season (first 176 days), al-though when the rainy season started the decomposition rates were less than 1.0788. The highest k values were after day 22 of the experiment (Figure 3d), which shows how the first stage of decomposition had a greater ef-fect on leaf litter decomposition. C. officinalis (Figure 3c) showed the lowest k at the start of the experiment and it remained constant for most of the experiment. The av-erage decomposition rates obtained in P. hispidum re-corded 0,301 g, in the first 11 days, the highest values for k, and the highest dry weight loss (3.912 g) at the end of the experiment (Figure 3d).
Changes in k did not follow the same general trend in all systems (Figure 3). Most of the curves of R. mi-randae in TCS and mtf, R. mirandae/C. arabica in TCS, RCS and mtf, leaf litter mixture in TCS and RCS and P. hispidum, showed a rapid increase followed by a de-crease in decomposition through time. In contrast, the curves of R. mirandae in RCS, leaf litter mixture in mtf and M. capirii were asymptotic proving that there was no further increase in k after 200 days. In leaf litter of C. officinalis (low-quality litter) k increased initially, and decreased rapidly after 200 days; the curve was dome shaped. The different forms in curves and uneven values in regression coefficients indicate the different rates of change in k of leaf litter for each system.
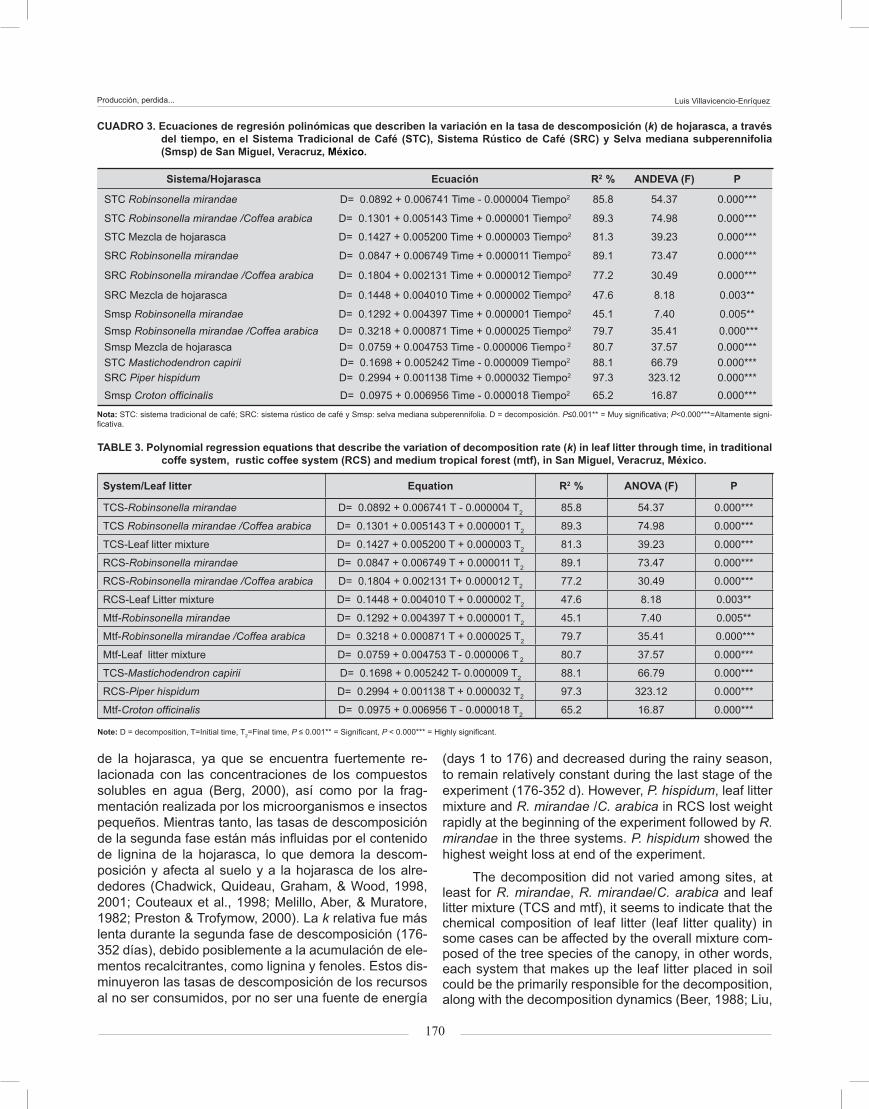
The analysis of variance showed that leaf litter de-composition rates did not vary significantly among repli-cations of each system, but differences were observed among leaf litter, system and sampling time. All polyno-mial regression equations were highly significant, with P ≤ 0.01 (Table 3). The interaction between time and type of leaf litter per system was significant. This implies that changes in k through time were not exactly the same for
perdieron la mayor parte de sus compuestos solubles y nutrientes que servían como alimento para colonias de descomponedores, debido a factores del ambiente. Por su parte, P. hispidum perdió alrededor de 65 % de peso seco durante la estación seca y el 100 % al final del ex-perimento.
En todos los sistemas, el peso seco restante va-rió en el siguiente orden de magnitud: R. mirandae > R. mirandae/C. arabica > Mezcla de hojarasca > Especies dominantes (P. hispidum > C. officinalis > M. capirii). La pérdida inicial de peso relativo varió significativamente entre las mezclas de especies y sistemas, pero no entre repeticiones. Cecropia obtusifolia y otras especies como Dipholis minutiflora, Cordia alliodora, Malinkara zapota y M. capirii, tienen hojas grandes y desarrollan una cu-tícula cerosa y gruesa que puede resistir a la descom-posición. Por su parte, otras especies como Inga spp., tienen un ritmo más rápido de descomposición debido a que carecen o tienen capas menores de cutícula que las especies mencionadas.
Variación en las tasas de descomposición de la hojarasca (k) a través del tiempo
Los coeficientes de la tasa de descomposición (k) para todas las especies variaron de -0.1278 (R. mirandae/C. arabica, en Smsp) a 3.912 (P. hispidum). Los valores de k fueron comparativamente mayores en toda la hojarasca probada, en los últimos 176 días de incubación. La k anual estimada fue ligeramente supe-rior en R. mirandae (Figura 3a) que en R. mirandae/C. arabica (Figura 3b); los valores más bajos se obtuvieron en la Mezcla de hojarasca (Figura 3c) y en M. capirii y C. officinalis (Figura 3d). Los valores de R. mirandae osci-laron entre 0.05 y 3.912 (días 11 y 352, respectivamen-te), y para R. mirandae/C. arabica variaron de 0.1278 a 3.912 (día 11 y 352, en el mismo orden).
En el SRC, el valor más bajo se registró en la Mezcla de hojarasca al inicio del experimento y se mantuvo así la mayor parte del tiempo, oscilando alrededor de 0.1508 (día 11) (Figura 3c). M. capirii registró el valor mayor al ini-cio del experimento (1.1054) y se conservó igual durante la estación seca (primeros 176 días), aunque al comienzo de la temporada de lluvias los índices de descomposición fueron menores a 1.0788. Las k mayores se registraron después del día 22 del experimento (Figura 3d), lo cual muestra, cómo la primera fase de descomposición tuvo un efecto mayor en la descomposición de hojarasca. C. officinalis (Figura 3c) mostró la k menor al inicio del ex-perimento y se mantuvo constante durante la mayor parte del experimento. Las tasas medias de descomposición de P. hispidum registraron 0.301 g, en promedio, durante los primeros 11 días, y los valores más altos, así como la pér-dida mayor de peso seco (3.912 g) se presentaron al final del experimento (Figura 3d).
Producción, perdida... Luis Villavicencio-Enríquez
168
each system; they vary regarding their own differences (Figure 3).
Leaf litter weight loss through time
There are several decomposition leads including the environment effect (macro and microclimate), quality of the resource (Meentemeyer, 1978) and the colonies of decomposing organisms (Aerts, 1997; Aerts & De Calu-we, 1997; Parton et al., 2007; Swift et al., 1979). These losses are due to the influence of catabolism, removal or export, grinding and lixiviation. The average dry weight loss was determined for each mixture tested in litter bags on incubation time in situ.
A rapid initial k was followed by a subsequent slower rate, which indicates that the decomposition pro-cess apparently is divided into two phases, controlled by several factors: an initial phase with a faster k rate and weight loss followed by a later stage with slower de-composition rates. This is consistent with those results reported by other authors (Anderson & Swift, 1983; Lor-anger, Ponge, Imbert & Lavalle, 2002, Swift & Anderson, 1989; Sundarapandian & Swamy, 1999; Xuluc-Tolosa et al., 2003).
During the litterbag collection on 352 days, it was observed that different types of microorganisms, insects and fungi influenced the decomposition process. The dif-ferences in weight loss between sites (RCS, TCS and mtf) have been caused by environmental factors or vari-ation in litter quality (Sundarapandiam & Swamy, 1999). This may be linked to the first decomposition stage, since it is strongly related to leaf litter water soluble compounds (Berg, 2000), and fragmentation caused by microorganisms and small insects. Meanwhile, the sec-ond stage decomposition rates are more influenced by the lignin content of leaf litter, delaying the decomposi-tion and affecting soil and leaf litter around (Chadwick, Quideau, Graham & Wood, 1998, 2001; Couteaux et al., 1998, Melillo, Aber & Muratore, 1982, Preston & Trofy-mow, 2000). The relative k was slower during the second phase of decomposition (176-352 days), possibly due the accumulation of recalcitrant elements, such as lig-nin and phenols. These elements decreased the rates of decomposition of resources when are not consumed, because these are not a source of energy for most de-composing organisms.
The greatest relative weight losses during the rainy season were for P. hispidum and all litterbags placed in the RCS, this could be due to physical site conditions such as soil moisture content, temperature and effects on the activity of decomposing microorganisms (Facelli & Pickett, 1991). During all sampling dates, the k coef-ficients were high for the entire leaf litter tested in the RCS and for the dominant species C. officinalis, which
Los cambios en k de las hojarascas no siguieron la misma tendencia en todos los sistemas (Figura 3). La mayoría de las curvas de R. mirandae en el STC y Smsp; R. mirandae/C. arabica en el STC, SRC y Smsp; la Mez-cla de hojarasca en el STC y SRC; y las de P. hispidum, mostraron un incremento rápido, seguido por una dis- rápido, seguido por una dis-, seguido por una dis-minución en la descomposición a través del tiempo. En cambio, las curvas de R. mirandae en el SRC, la Mez-cla de hojarasca en Smsp, y M. capirii fueron asintóti-cas, lo que prueba que no hubo mayor incremento en k, después de 200 días. En la hojarasca de C. officinalis (hojarasca de baja calidad), k se incrementó en un ini-cio, para disminuir rápidamente después de 200 días; la curva presentó forma de cúpula. Las formas diferentes en las curvas y los valores desiguales en los coeficien-tes de regresión, indicaron los diferentes cambios en k de la hojarasca para cada sistema.
El ANDEVA mostró que las tasas de descom-posición de la hojarasca no variaron significativamente entre las repeticiones de cada sistema, pero sí entre la hojarasca, los sistemas y el tiempo de muestreo. Todas las ecuaciones polinomiales de regresión fueron alta-mente significativas (P ≤ 0.01) (Cuadro 3). La interacción fue significativa entre el tiempo y tipo de hojarasca por sistema. Esto implica que los cambios en k a través del tiempo no fueron exactamente iguales en los sistemas, sino que varían con respecto a las diferencias de los mismos (Figura 3).
Pérdida de peso en hojarasca a través del tiempo
Hay muchos conductores de descomposición que incluyen el efecto del entorno (macro y microclimático), la calidad del sustrato (Meentemeyer, 1978) y la com-posición de la comunidad de organismos descompone-dores (Aerts, 1997; Aerts & De Caluwe, 1997; Parton et al., 2007; Swift et al., 1979). Estas pérdidas se deben a la influencia del catabolismo, remoción o exportación y consiguiente trituración y lixiviación. El porcentaje medio de pérdida de peso seco se determinó para cada una de las mezclas probadas en las bolsas de hojarasca sobre el tiempo de incubación in situ.
Una k inicial rápida fue seguida de una tasa más lenta. Esto indica un proceso de descomposición apar-entemente divido en dos fases controladas por diferen-tes factores: una fase inicial con un ritmo más rápido de k en peso, seguida de una fase con tasas de descom-posición más lentas. Esto es congruente con los resul-tados reportados por otros autores (Anderson & Swift, 1983; Loranger, Ponge, Imbert, & Lavalle, 2002; Sun-darapandian & Swamy, 1999; Swift & Anderson, 1989; Xuluc-Tolosa et al., 2003).
Durante los 352 d se observó en la colecta de las bolsas, que diferentes tipos de microorganismos, in-
169
Revista Chapingo Serie Ciencias Forestales y del Ambiente, Año 18, Vol. 18 (2): 159-173, 2012.
b
a
c
d
FIGURE 3. Variation in decomposition rates (k) through time and system in (a) Robinsonella mirandae, (b) Robinsonella mirandae/Coffea arabica, (c) leaf litter mixture and (d) Mastichodendron capiri, Piper hispidum and Croton officinalis in TCS and mtf, in San Miguel, Mexico.
Days
Days
Days
Days
TCSRCSmtf
TCSRCSmtf
TCSRCSmtf
FIGURA 3. Variaciones en tasas de descomposición (valor k), a tra-vés del tiempo y sistema, de a) Robinsonella mirandae, b) Robinsonella mirandae/Coffea arabica, c) Mezcla de hojarasca y d) Mastichodendron capiri, Piper hispidum y Croton officinalis, en el Sistema Tradicional de Café (STC), Sistema Rústico de Café (SRC) y Selva mediana subperennifolia (Smsp) de San Miguel, Veracruz, México.
b
a
c
d
Días
Días
Días
Días
STCSRCSmsp
STCSRCSmsp
STCSRCSmsp
probably shows an effect of microclimate or the leaf litter mixture in decomposition rates. The lowest decomposi-tion rates were obtained for M. capirii and in leaf litter mixture in TCS and mtf; meanwhile the rest of the leaf litter showed average decomposition rates. Rates of decomposition had an increment during the dry season
Valu
es "K
"Va
lues
"K"
Valu
es "K
"Va
lues
"K"
sectos y hongos, influyeron en el proceso de descom-posición. Las diferencias en la pérdida de peso entre los sistemas (SRC, STC y Smsp) pudieron ser causadas por factores ambientales o la variación en la calidad del sustrato (Sundarapandiam & Swamy, 1999). Esto puede estar vinculado con la primera fase de descomposición
Producción, perdida... Luis Villavicencio-Enríquez
170
CUADRO 3. Ecuaciones de regresión polinómicas que describen la variación en la tasa de descomposición (k) de hojarasca, a través del tiempo, en el Sistema Tradicional de Café (STC), Sistema Rústico de Café (SRC) y Selva mediana subperennifolia (Smsp) de San Miguel, Veracruz, México.
Sistema/Hojarasca Ecuación R2 % ANDEVA (F) P
STC Robinsonella mirandae D= 0.0892 + 0.006741 Time - 0.000004 Tiempo2 85.8 54.37 0.000***
STC Robinsonella mirandae /Coffea arabica D= 0.1301 + 0.005143 Time + 0.000001 Tiempo2 89.3 74.98 0.000***
STC Mezcla de hojarasca D= 0.1427 + 0.005200 Time + 0.000003 Tiempo2 81.3 39.23 0.000***
SRC Robinsonella mirandae D= 0.0847 + 0.006749 Time + 0.000011 Tiempo2 89.1 73.47 0.000***
SRC Robinsonella mirandae /Coffea arabica D= 0.1804 + 0.002131 Time + 0.000012 Tiempo2 77.2 30.49 0.000***
SRC Mezcla de hojarasca D= 0.1448 + 0.004010 Time + 0.000002 Tiempo2 47.6 8.18 0.003**
Smsp Robinsonella mirandae D= 0.1292 + 0.004397 Time + 0.000001 Tiempo2 45.1 7.40 0.005**Smsp Robinsonella mirandae /Coffea arabica D= 0.3218 + 0.000871 Time + 0.000025 Tiempo2 79.7 35.41 0.000***Smsp Mezcla de hojarasca D= 0.0759 + 0.004753 Time - 0.000006 Tiempo 2 80.7 37.57 0.000***STC Mastichodendron capirii D= 0.1698 + 0.005242 Time - 0.000009 Tiempo2 88.1 66.79 0.000***SRC Piper hispidum D= 0.2994 + 0.001138 Time + 0.000032 Tiempo2 97.3 323.12 0.000***
Smsp Croton officinalis D= 0.0975 + 0.006956 Time - 0.000018 Tiempo2 65.2 16.87 0.000***
Nota: STC: sistema tradicional de café; SRC: sistema rústico de café y Smsp: selva mediana subperennifolia. D = decomposición. P≤0.001** = Muy significativa; P<0.000***=Altamente signi-ficativa.
(days 1 to 176) and decreased during the rainy season, to remain relatively constant during the last stage of the experiment (176-352 d). However, P. hispidum, leaf litter mixture and R. mirandae /C. arabica in RCS lost weight rapidly at the beginning of the experiment followed by R. mirandae in the three systems. P. hispidum showed the highest weight loss at end of the experiment.
The decomposition did not varied among sites, at least for R. mirandae, R. mirandae/C. arabica and leaf litter mixture (TCS and mtf), it seems to indicate that the chemical composition of leaf litter (leaf litter quality) in some cases can be affected by the overall mixture com-posed of the tree species of the canopy, in other words, each system that makes up the leaf litter placed in soil could be the primarily responsible for the decomposition, along with the decomposition dynamics (Beer, 1988; Liu,
TABLE 3. Polynomial regression equations that describe the variation of decomposition rate (k) in leaf litter through time, in traditional coffe system, rustic coffee system (RCS) and medium tropical forest (mtf), in San Miguel, Veracruz, México.
System/Leaf litter Equation R2 % ANOVA (F) P
TCS-Robinsonella mirandae D= 0.0892 + 0.006741 T - 0.000004 T2 85.8 54.37 0.000***
TCS Robinsonella mirandae /Coffea arabica D= 0.1301 + 0.005143 T + 0.000001 T2 89.3 74.98 0.000***
TCS-Leaf litter mixture D= 0.1427 + 0.005200 T + 0.000003 T2 81.3 39.23 0.000***
RCS-Robinsonella mirandae D= 0.0847 + 0.006749 T + 0.000011 T2 89.1 73.47 0.000***
RCS-Robinsonella mirandae /Coffea arabica D= 0.1804 + 0.002131 T+ 0.000012 T2 77.2 30.49 0.000***
RCS-Leaf Litter mixture D= 0.1448 + 0.004010 T + 0.000002 T2 47.6 8.18 0.003**
Mtf-Robinsonella mirandae D= 0.1292 + 0.004397 T + 0.000001 T2 45.1 7.40 0.005**
Mtf-Robinsonella mirandae /Coffea arabica D= 0.3218 + 0.000871 T + 0.000025 T2 79.7 35.41 0.000***
Mtf-Leaf litter mixture D= 0.0759 + 0.004753 T - 0.000006 T 2 80.7 37.57 0.000***
TCS-Mastichodendron capirii D= 0.1698 + 0.005242 T- 0.000009 T2 88.1 66.79 0.000***
RCS-Piper hispidum D= 0.2994 + 0.001138 T + 0.000032 T2 97.3 323.12 0.000***
Mtf-Croton officinalis D= 0.0975 + 0.006956 T - 0.000018 T2 65.2 16.87 0.000***
Note: D = decomposition, T=Initial time, T2=Final time, P ≤ 0.001** = Significant, P < 0.000*** = Highly significant.
de la hojarasca, ya que se encuentra fuertemente re-lacionada con las concentraciones de los compuestos solubles en agua (Berg, 2000), así como por la frag-mentación realizada por los microorganismos e insectos pequeños. Mientras tanto, las tasas de descomposición de la segunda fase están más influidas por el contenido de lignina de la hojarasca, lo que demora la descom-posición y afecta al suelo y a la hojarasca de los alre-dedores (Chadwick, Quideau, Graham, & Wood, 1998, 2001; Couteaux et al., 1998; Melillo, Aber, & Muratore, 1982; Preston & Trofymow, 2000). La k relativa fue más lenta durante la segunda fase de descomposición (176-352 días), debido posiblemente a la acumulación de ele-mentos recalcitrantes, como lignina y fenoles. Estos dis-minuyeron las tasas de descomposición de los recursos al no ser consumidos, por no ser una fuente de energía
171
Revista Chapingo Serie Ciencias Forestales y del Ambiente, Año 18, Vol. 18 (2): 159-173, 2012.
para la mayoría de los organismos descomponedores.
Las pérdidas mayores de peso relativo durante la temporada de lluvias se presentaron en P. hispidum y todas las bolsas colocadas en el SRC. Esto podría de-berse a determinantes de las condiciones físicas del sitio, como el contenido de humedad del suelo, la tem-peratura y sus efectos sobre la actividad de los micro-organismos descomponedores (Facelli & Pickett, 1991). En el presente estudio, durante todas las fechas de muestreo, los coeficientes k fueron altos para toda la ho-jarasca a prueba en el SRC y para la especie dominante C. officinalis. Esto probablemente indica un efecto del microclima o de la Mezcla de hojarascas, en las tasas de descomposición. Las tasas menores de descomposición se obtuvieron en M. capirii y en la Mezcla de hojarasca en el STC y Smsp, mientras que el resto de la hojarasca mostró tasas medias. Éstas tuvieron un incremento du-rante la estación seca (días 1 a 176) y se desaceleró du-rante la temporada de lluvias, para mantenerse relativa-mente constante durante la última etapa del experimento (176-352 d). Sin embargo, además de P. hispidum, tam-bién la Mezcla de hojarasca y R. mirandae/C. arabica en el SRC perdieron peso rápidamente al inicio, seguidas de R. mirandae en los tres sistemas. P. hispidum mostró la mayor pérdida de peso al final del experimento.
La composición química de la hojarasca (calidad de hojarasca) en algunos casos puede ser afectada por la mezcla general compuesta de las especies arbóreas del dosel. La descomposición no varió entre los sitios, por lo menos para R. mirandae, R. mirandae/C. arabica y la Mezcla de hojarasca (STC y Smsp). Todo parece indicar, que cada uno de los sistemas de prueba que conforman la hojarasca general depositada en el suelo pudieran ser los principales responsables de la descomposición, junto con las dinámicas de descomposición (Beer, 1988; Liu, Daily, Ehrlich, & Luck, 2003) y la variación climática anual, particularmente, en las estaciones de seca y de lluvias (Beer, 1988; Dantas & Phillipson, 1989; Jackson, 1978; Kumar & Deepu, 1992; Liu, Fox, & Xu, 2003; Proc-tor, 1983; Proctor et al., 1983; Scott & Binkley, 1997).
CONCLUSIONES
Los resultados de este estudio parecen indicar que las fechas de producción máxima de hojarasca es-tán relacionadas con la precipitación, la variación de la temperatura y la fenología. Las tasas de descomposición de hojarasca mostraron que la calidad de la misma y sus diferentes mezclas probadas son los principales impul-sores de la descomposición. Estos resultados muestran la importancia que tiene la composición de especies ar-bóreas del dosel y su producción de hojarasca en los sistemas nativos, agroforestales tradicionales y rústicos. En este sentido, es importante hacer hincapié en la ne-cesidad de estudios a largo plazo sobre la producción de
Daily, Ehrlich & Luck, 2003) and annual climatic varia-tion, particularly, during the drought an rainy season (Beer, 1988, Dantas & Phillipson, 1989; Jackson, 1978; Kumar and Deepu, 1992, Liu, Fox, & Xu, 2003; Proctor, 1983, Proctor et al., 1983, Scott and Binkley, 1997).
CONCLUSIONS
The results of this study suggest that the maximum dates of leaf litter production are related to precipitation, variation of temperature and phenology. The decompo-sition rates showed that leaf litter quality and the differ-ent leaf litter mixture tested are the main decomposition leads. These results show the importance of the compo-sition of canopy tree species and their leaf litter produc-tion in native, traditional and rustic systems. It is impor-tant to highlight the need for long-term studies on leaf litter production and decomposition rates. Studies would be useful to confirm seasonal periodicity, establish rela-tions among leaf litter quality, production and rainfall and implement sustainability improvements.
ACKNOWLEDGEMENTS
I would like to thank to Consejo Nacional de Cien-cia y Tecnología (CONACYT) in Mexico. Thanks to Dr. Morag McDonald and Dr. Lauro Bucio-Alanis for their un-conditional support during the performance of this study. Also, I would like to thank Dr. Fergus Sinclair, for his sup-port at the University of Wales, Bangor.
End English Version
hojarasca y las tasas de descomposición. Los estudios serían de utilidad para confirmar periodicidad estacional, establecer relaciones entre la precipitación, producción y calidad de la hojarasca e implementar mejoras de sus-tentabilidad.
AGRADECIMIENTOS
Agradezco al Consejo Nacional de Ciencia y Tecnología (CONACYT) en México, a la Doctora Morag McDonald y al Doctor Lauro Bucio-Alanís, por su apoyo incondicional durante la realización de esta investiga-stiga-ción. También reconozco al Doctor Fergus Sinclair, por su apoyo en la University of Wales, Bangor.
REFERENCIASAerts, R. (1997). Climate, leaf litter chemistry and leaf litter decomposi-
tion in terrestrial ecosystems, a triangular relationship. Oikos, 79, 439‒449. Obtenido de http://www.jstor.org/stable/3546886
Aerts, R., & De Caluwe, H. (1997). Nutritional and mediated controls on leaf litter decomposition species. Ecology, 78, 244‒60. Obtenido de http://www.jstor.org/stable/2265993
Álvarez-Sánchez, J. (1995). Descomposición y ciclo de nutrientes en ecosistemas terrestres mexicanos. México, D.F.: UNAM.
Producción, perdida... Luis Villavicencio-Enríquez
172
Álvarez-Sánchez, J., & Becerra-Enríquez, R. (1996). Leaf decomposi-varez-Sánchez, J., & Becerra-Enríquez, R. (1996). Leaf decomposi-Leaf decomposi-tion in a Mexican rain forest. Biotropica, 28, 657‒667. Obtenido de http://www.jstor.org/stable/2389052
Álvarez-Sánchez, J., & Guevara, S. (1993). Litterfall dynamics in a mexican lowland tropical rain forest. Tropical Ecology, 34, 127‒142. Obtenido de http://www.jstor.org/stable/2389052
Anderson, J. M., & Ingram, J. S. I. (1989). Tropical soil biology and fertility, a handbook of methods. Wallingford: CAB International.
Anderson, J. M., & Swift, M. J. (1983). Decomposition in tropical fo-rests. In, S. L. Sutton, T. C. Withmore, & Chadwick, A.C. (Eds.), Tropical rain forest, ecology and management (pp. 287‒309). Oxford: Blackwell.
Beer, J. (1988). Litter production and nutrient cycling in coffee (Co-ffea arabica) or Cacao (Theobroma cacao) plantations with shade trees. Agroforestry Systems, 7, 103‒114. doi: 10.1007/BF00046846
Berg, B. (2000). Initial rates and limit values for decomposition of Scots pine and Norway spruce needle litter, a synthesis for N-fertili-zed forest stands. Canadian Journal of Forest Research, 30, 122‒135. Obtenido de http://www.nrcresearchpress.com/doi/abs/10.1139/x99-94?journalCode=cjfr
Binkley, D. (1986). Forest nutrition management. New York: Wiley.
Bjorn, B., & Comstedt, D. (2007). Isotope fractionation and 13C enrichment in soil profiles during the decomposition of soil organic matter. Journal of Oecologia, 153, 1. doi: 10.1007/s00442-007-0700-8
Burghouts, T. B. A., Ernsting, G., Korthals, G. W., & De Vries, T. H. (1992). Litterfall, leaf-litter decomposition and litter inverte-brates in primary and selectively logged dipterocarp forest in Sabah, East Malaysia. Philosophical Transactions of the Ro-yal Society, 335, 407‒416. Obtenido de http://www.jstor.org/stable/55627
Chadwick, O. A., Quideau, S. A., Graham, R. C., & Wood, H. B. (1998). Organic carbon sequestration under chaparral and pine after four decades of soil development. Geoderma, 83, 227‒242. doi: 10.1016/S0016-7061(97)00142-0
Chadwick, O. A., Quideau, S. A., Graham, R. C., & Wood, H. B. (2001). A direct link between forest vegetation type and soil organic matter composition. Geoderma, 104, 41‒60. doi: 10.1016/S0016-7061(01)00055-6
Cuevas, E., & Medina, E. (1988). Nutrient dynamics within amazonian forests. II. Fine root growth, nutrient availability, and leaf litter decomposition. Oecologia, 76, 222‒235. Obtenido de http://www.jstor.org/stable/4218661
Couteaux, M. M., Bottner P., & Berg, B. (1995). Litter decomposition, climate and litter quality. Trends in Ecology and Evolution, 10, 63‒66. doi: 10.1016/S0169-5347(00)88978-8
Dantas, M., & Phillipson, J. (1989). Litterfall and litter nutrient content in primary and secondary amazonian ‘Terra Firme’ rain forest. Journal of Tropical Ecology, 1(5), 27‒36. Obtenido de http://www.jstor.org/stable/2559607
Didham, R. K. (1998). Altered leaf-litter decomposition rates in tropical forest fragments. Oecologia, 116, 397‒406. Obtenido de http://www.jstor.org/stable/4222100
Ezcurra, E., & Becerra, J. (1987). Experimental decomposition of litter in a Tamaulipan cloud forest, A comparison of four simple mod-els. Biotropic, 4(19), 290‒296. Obtenido de http://www.jstor.org/stable/2388624
Facelli J. M., & Pickett T. A. (1991). Plant litter, its dynamics and effects on plant community structure. The Botanical Review, 57(1). doi: 10.1007/BF02858763
Food and Agriculture Organization (FAO). (2007). Mapa mundial de suelos, leyenda revisada. Roma, Italia: Sociedad Española de la Ciencia del Suelo.
Frangi, J. L., & Lugo A. E. (1985). Ecosystem dynamics of a floodplain subtropical forest. Ecological Monographs, 55, 351‒369. Obte-nido de http://www.jstor.org/stable/1942582
García, E. (1987). Modificaciones al sistema climático de Köppen (4ª ed.). México. D.F.: UNAM.
Gong, W. K., & Ong, J. E. (1983) Litter production and decomposi-tion in a coastal hill dipterocarp forest. In S. L. Sutton, T. C. Whitmore, & A. C. Chadwick (Eds.), Tropical rain forest, ecology and management (pp. 275‒285). Oxford: Blackwell Scientific Publications.
Harmon, M. E., Whigham, D. F., Sexton, J., & Olmsted, I. (1995). De-composition and mass of dead wood in the dry tropical forests of the North-eastern Yucatán Península, México. Biotropica, 27, 305‒316.
Jackson, J. F. (1978). Seasonality of flowering and leaf-fall in a bra-zilian subtropical lower montane moist forest. Biotropica, 10, 38‒42. Obtenido de http://www.jstor.org/stable/2388103
Jenny, H., Gessel, S. P., & Bingham, F. T. (1949). Comparative study of decomposition of organic matter in temperate and tropical regions. Soil Science, 68, 419‒432. Obtenido de http://journals.lww.com/soilsci/Citation/1949/12000/Comparative_Study_of_Decomposition_Rates_of.1.aspx
Kumar B. M., & Deepu J. K. (1992). Litter production and decomposi-tion dynamics in moist deciduous forests of the Western Ghats in peninsular India. Forest Ecology Management 50, 181‒201. doi: 10.1016/0378-1127(92)90335-7
Landsberg, J. J., & Gower, S. T. (1997). Applications of physiological eco-logy to forest management. San Diego, CA, USA: Academic Press.
Liu, J., Daily, G. C., Ehrlich, P. R., & Luck, G. W. (2003). Effects of household dynamics on resource consumption and biodiversity. Nature, 421, 530‒533. Obtenido de https://fp.auburn.edu/sfws/ditchkoff/.../Liu%20et%20al%202003.pdf
Liu, W., Fox, J. E. D., & Xu, Z. (2003). Litterfall and nutrient dyna-mics in a montane moist evergreen broad-leaved forest in Ai-lao Mountains, SW China. Plant Ecology, 164, 157‒170. doi: 10.1023/A:1021201012950
Loranger G., Ponge J. F., Imbert, D., & Lavelle, P. (2002). Leaf de-composition in two semi-evergreen tropical forests: Influence of litter quality. Biology Fertility Soils, 35, 247‒252. doi: 10.1007/s00374-002-0467-3
Martínez-Yrizar, A. (1980). Tasas de descomposición de materia orgá-nica foliar de especies arbóreas de selvas en clima estacional. Tesis, UNAM, Ciudad de México, México.
Martínez-Yrizar, A. (1984). Procesos de producción y descomposición de hojarasca en selvas estacionales. Tesis de maestría, UNAM, Ciudad de México, México.
Maya, Y., & Arriaga, L. (1996). Litterfall and phenological patterns of the dominant over storey species of a desert scrub communi-ty in north-western Mexico. Journal of Arid Environments, 34, 23‒35. doi: 10.1006/jare.1996.0090
McDonald, M. A., & Healey, J. R. (2000). Nutrient cycling in secon-dary forests in the blue mountains of Jamaica. Forest Eco-logy and Management 139, 257‒278. doi: 10.1016/S0378-1127(00)00442-4
Melillo, J. M., Aber, J. D., Linkins, A. E., Ricca, A., Fry, B., & Nadelhoffer, K. J. (1989). Carbon and nitrogen dynamics along the decay continuum, plant litter to soil organic matter. Plant and Soil 115, 189‒198. Obtenido de http://wikis.lib.ncsu.edu/images/1/1b/MEA_760_Melillo_1989.pdf
Melillo, J. M., Aber, J. D., & Muratore, J. F. (1982). Nitrogen and lig-Nitrogen and lig-nin control of hardwood leaf litter decomposition dynamics. Ecology, 63, 621‒626. Obtenido de http://www.jstor.org/sta-ble/1936780
173
Revista Chapingo Serie Ciencias Forestales y del Ambiente, Año 18, Vol. 18 (2): 159-173, 2012.
Melillo, J. M., McGuire, A. D., Kicklighter, D. W., Moore, B., Voros-Marty, C. J., & Schloss, A. L. (1993). Global climate change and terrestrial net primary production. Nature, 363, 234‒240. Obtenido de http://www.mendeley.com/research/global-clima-techange-and-terrestrial-net-primary-production/
Meentemeyer, V. E. (1978). Macroclimate and lignin control of decom-position rates. Ecology, 59, 465‒472. doi: 10.2307/1936576
Meentemeyer, V. E., Box, O., & Thompson, R. (1982). World patterns and amounts of terrestrial plant litter production. BioScience, 32, 125‒128. Obtenido de http://www.jstor.org/stable/1308565
Montaña, C., Ezcurra, A., Carrillo, A., & Delhoume J. P. (1988). The de-The de-composition of litter, grasslands of northern Mexico, a compari-son between arid and non arid environments. Journal of Arid Environments, 14, 55‒60. Obtenido de http://horizon.documen-tation.ird.fr/exl-doc/pleins_textes/pleins_textes_6/b_fdi_39-40/43444.pdf
Olson, J. S. (1963). Energy storage and the balance of producers and decomposers in ecological systems. Ecology, 44, 322‒331. Ob-tenido de http://www.jstor.org/stable/1932179
Palm, C. A., & Rowland, A. P. (1997). A minimum dataset for characte-rization of plant quality for decomposition. In G. Cadisch, & K. E. Giller (Eds). Driven by nature, plant litter quality and decom-position (pp. 379‒392). Wallingford: CAB.
Parton, W., Silver, W. L., Burke, I. C., Grassens, L., Harmon, M. E., Currie, W. S., & Fasth, B. (2007). Global-scale similarities in ni-trogen release patterns during long-term decomposition. Scien-ce, 315, 362‒364. Obtenido de http://www.planta.cn/forum/files_planta/science_361_148.pdf
Preston, C. M., & Trofymow, J. A. (2000). Variability in litter quality and its relationship to litter decay in Canadian forests. Canadian Journal Botany, 78, 1269‒1287. doi: 10.1139/cjb-78-10-1269
Proctor J. (1983). Tropical forest litter fall. I. Problems of data compari-son. In S. L. Sutton, T. C. Whitmore, & A. C. Chadwick (Eds.), Tropical rain forest, ecology and management (pp. 267‒273). Oxford: Blackwell Scientific Publications.
Proctor, J., Anderson, J. M., Fogden, S., & Vallack, H. W. (1983). Eco-logical studies in four contrasting lowland rain forests in Gunung Mulu National Park, Sarawak. 2. Litterfall, litter standing crop
and preliminary observations on herbivory. Journal of Ecology, 71, 261–283. Obtenido de http://www.mendeley.com/research/ecological-studies-four-contrasting-lowland-rain-forests-gu-nung-mulu-national-park-sarawak-ii-litterfall-litter-standing-crop-preliminary-observations-herbivory/
Saldarriaga, J. G. (1994). Recuperación de la selva de “Tierra Firme” en el alto río Negro. Amazonia colombiana-venezolana. Estu-dios en la Amazonia Colombiana. Colombia: Ed. Presencia.
Scott, N. A., & Binkley, D. (1997). Foliage litter quality and annual net N mineralization, Comparison across North American forest sites. Oecologia, 111, 151‒159. Obtenido de http://warnercnr.colosta-Obtenido de http://warnercnr.colosta-te.edu/~dan/papers/Oecologia_111_1997.pdf
Songwe N. C., Okali D. U. U., & Fasehun F. E. (1995). Litter decompo-Litter decompo-sition and nutrient release in a tropical rainforest, Southern Ba-kundu Forest Reserve, Cameroon. Journal of Tropical Ecology, 11, 333‒350. Obtenido de http://www.jstor.org/stable/2560217
Steel, R., & Torrie, J. H. (1986). Bioestadística, principios y procedi-mientos (2ª ed). Mexico, D. F.: McGraw-Hill.
Sundarapandian, S. M., & Swamy, P. S. (1999). Litter production and leaf-litter decomposition of selected tree species intropical for-ests at Koydyar in the Western Ghats, India. Forest Ecology and Management, 123, 231‒244.
Swift, M. J., & Anderson J. M. (1989). Decomposition. In H. Lieth, M. J. A. Werger, (Eds.), Tropical rain forest ecosystems, biogeo-graphical and ecological studies. Ecosystems of the World 14A (pp. 547-569). New York: Elsevier Science.
Swift, M. J., Heal, O. W., & Anderson, J. M. (1979). Decomposition in terrestrial ecosystems. Oxford: Blackwell Scientific Publications.
Xuluc-Tolosa, F. J., Vester, H. F. M., Ramírez-Marcial N, Castellanos-Albores, J., & Lawrence, D. (2003). Leaf litter decomposition of tree species in three sucessional phases of tropical dry sec-ondary forest in Campeche, Mexico. Forest Ecolology Manage-ment, 174, 401‒412. doi: 10.1016/S0378-1127(02)00059-2
Zhou, G., Guan, L., Wei, X., Tang, X., Liu, S., Liu, J., Zhang, D., & Yan, J. (2008). Factors influencing leaf litter decomposition, an intersite experiment across China. Plant and Soil, 311, 61‒72. doi:10.1007/s11104-008-9658-5