Embed Size (px)
Citation preview
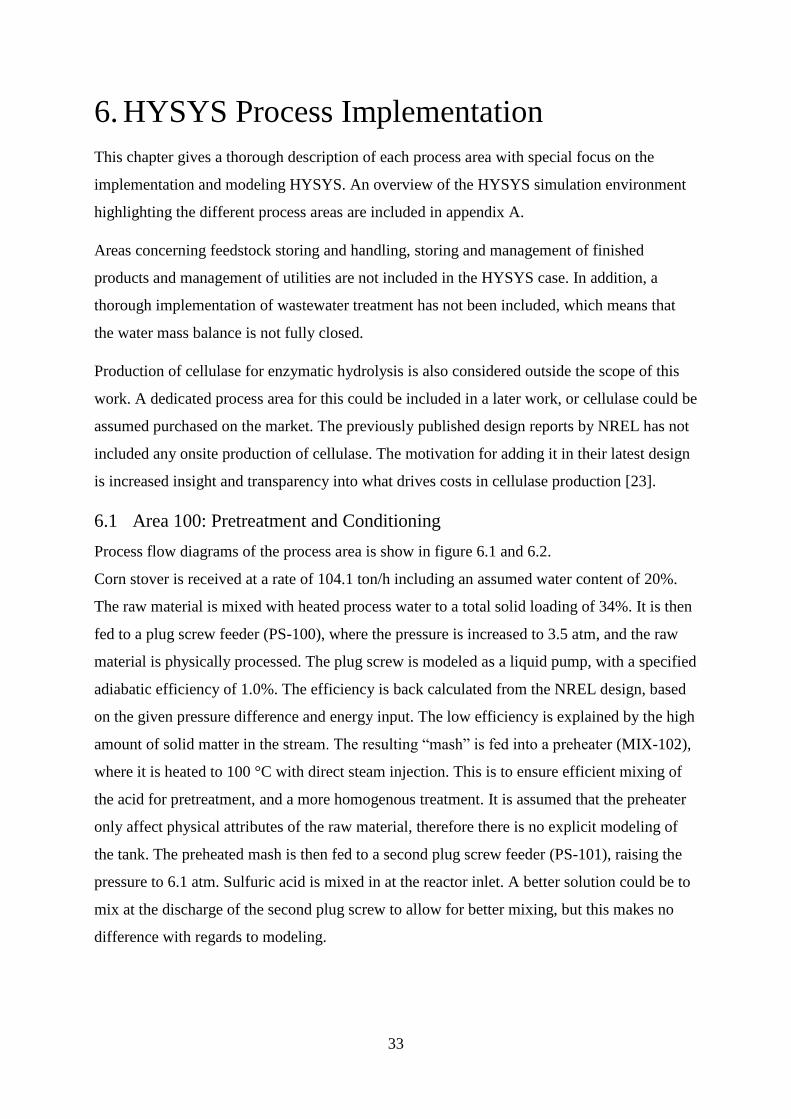
Process Modeling of a Biorefinery forIntegrated Production of Ethanol andFurfural in HYSYS
Lars Moen Strømsnes
Chemical Engineering and Biotechnology
Supervisor: Størker Moe, IKPCo-supervisor: Magne Hillestad, IKP
Department of Chemical Engineering
Submission date: June 2016
Norwegian University of Science and Technology

i
Preface
This thesis is written as part of the Master’s of Science in Chemical Engineering at the
Norwegian University of Science and Technology (NTNU). The work presented here was
carried out during the period from January 2016 to June 2016 at the Department of Chemical
Engineering.
I would like to thank my main supervisor Associate Professor Størker Moe for providing an
interesting and challenging topic for my thesis. His guidance and insight has been of great
value for the progress towards the work presented here.
I would also like to thank my co-supervisor Professor Magne Hillestad for his technical
assistance and support on modeling and simulation.
Declaration of Compliance
I hereby declare that this thesis is an independent work according to the exam regulations of
the Norwegian University of Science and Technology (NTNU).
Lars Moen Strømsnes
Trondheim, June 10, 2016.

ii
iii
Abstract
Existing bioethanol production relies heavily on the use of corn and sugarcane as feedstocks.
A prerequisite for increased consumption of bioethanol is the transition from the current use
of corn and sugarcane to lignocellulosic biomass. This includes the use of wood, straws and
agricultural residue such as sugarcane bagasse and corn stover, which do not compete directly
with food production. Cellulosic ethanol also offers increased reduction in greenhouse gas
emissions over both current bioethanol and petroleum based fuels.
A biorefinery utilizing corn stover as feedstock has been designed and implemented in
HYSYS. The model is based on the process for biochemical conversion of lignocellulosic
biomass to ethanol designed by the U.S. National Renewable Energy Laboratory (NREL).
The Marcotullio process for the production of furfural from aqueous xylose is integrated by
selectively fractionating the feedstock into hemicellulose and cellulose. The model also
includes a steam boiler cycle for co-generation of heat and electricity from residual solid
material, and the biorefinery is found to be energy self-sufficient.
The performance of the biorefinery is comparable to the NREL and Marcotullio processes.
The combined conversion of useful carbohydrates into ethanol and furfural is found to be
81.1%, which corresponds to 47% of the total energy content in the corn stover feedstock.
The heating demand is slightly increased compared to the NREL process, and generation of
electricity is reduced.

iv
v
Sammendrag
Eksisterende produksjon av bioetanol er i stor grad basert på bruk av mais og sukkerrør som
råstoff. En forutsetning for fortsatt økt bruk av bioetanol er å gå over til bruk av lignocellulose
som råmaterial til fordel for dagens bruk av mais og sukkerrør. Dette inkluderer for eksempel
bruk av tre og avfall fra skogsvirksomhet, ulike typer gress og strå og landbruksavfall, som
ikke konkurrerer direkte med matproduksjon. Spesielt avfall fra mais- og sukkerproduksjon er
foreslått som aktuelle råstoff. Hovedfordelen med bioetanol laget fra slike råstoff er redusert
utslipp av drivhusgasser sammenlignet både med eksisterende produksjon av bioetanol og
petroleumsbaserte drivstoff spesielt.
Et bioraffineri med avfall fra maisproduksjon som råstoff er blitt utviklet og modellert i
HYSYS. Modellen er basert på en prosess for biokjemisk prosessering av lignocellulose til
bioetanol, utviklet og publisert av U.S. National Renewable Energy Laboratory (NREL).
Produksjon av furfural fra xylose basert på en prosess utviklet og patentert av Marcotullio er
inkludert ved hjelp av selektiv fraksjonering av råstoffet til hemicellulose og cellulose.
Modellen inkluderer også et eget anlegg for kraftvarmeproduksjon ved forbrenning av
uutnyttede rester av råstoffet.
Modellen viser tilsvarende ytelse sammenlignet med prosessene foreslått av NREL og
Marcotullio. Den kombinerte omgjøringen av nyttige karbohydrater i råstoffet til enten etanol
eller furfural er 81.1%, som tilsvarer 47% av energiinnholdet i råstoffet. Bioraffineriet har et
noe høyere varmebehov sammenlignet med prosessen foreslått av NREL, noe som reduserer
den totale produksjonen av elektrisitet.

vi
vii
Table of Contents
1. Introduction ........................................................................................................................ 1
1.1 Motivation ................................................................................................................... 1
1.2 Objectives .................................................................................................................... 2
1.3 Structure ....................................................................................................................... 2
2. Theory ................................................................................................................................ 5
2.1 Lignocellulosic Material .............................................................................................. 5
2.2 Lignocellulosic Biorefinery ......................................................................................... 6
2.3 Processing of Lignocellulosic Material ....................................................................... 8
2.3.1 Pretreatment ......................................................................................................... 8
2.3.2 Acid Hydrolysis of Lignocellulose ...................................................................... 9
2.3.3 Enzymatic Hydrolysis of Cellulose .................................................................... 11
2.3.4 Fermentation ....................................................................................................... 12
2.3.5 Washing .............................................................................................................. 12
3. Current Technology .......................................................................................................... 15
3.1 Corn Stover ................................................................................................................ 15
3.2 Ethanol Production .................................................................................................... 16
3.3 Furfural Production .................................................................................................... 17
3.4 Proposed Integrated Furfural and Ethanol Production .............................................. 18
3.4.1 Marcotullio Process ............................................................................................ 19
4. Process Basis .................................................................................................................... 21
4.1 Process description .................................................................................................... 21
4.1.1 Pretreatment and Conditioning ........................................................................... 21
4.1.2 Enzymatic Hydrolysis and Fermentation ........................................................... 22
4.1.3 Ethanol Recovery ............................................................................................... 22
4.1.4 Furfural Production and Recovery ..................................................................... 22
viii
4.1.5 Wastewater Treatment and Steam Boiler ........................................................... 22
4.2 Design Basis .............................................................................................................. 23
4.3 Report Conventions ................................................................................................... 24
5. HYSYS Setup ................................................................................................................... 25
5.1 Component List ......................................................................................................... 25
5.1.1 Hypotheticals ...................................................................................................... 25
5.1.2 Modeling of Corn Stover .................................................................................... 26
5.2 Reaction Sets ............................................................................................................. 27
5.3 Choosing Property Package ....................................................................................... 28
5.4 Estimating Binary Coefficients ................................................................................. 29
6. HYSYS Process Implementation ..................................................................................... 33
6.1 Area 100: Pretreatment and Conditioning ................................................................. 33
6.2 Area 200: Enzymatic Hydrolysis and Fermentation .................................................. 38
6.3 Area 300: Ethanol Recovery ...................................................................................... 41
6.4 Area 400: Furfural Production and Recovery ............................................................ 44
6.5 Area 500: Wastewater Treatment and Steam Boiler ................................................. 48
7. Heat Integration ................................................................................................................ 53
7.1 Alternative Heat Integration ...................................................................................... 55
8. Analysis and Discussion ................................................................................................... 57
8.1 Carbon and Energy Balance ...................................................................................... 57
8.2 Ethanol Recovery Performance ................................................................................. 59
8.3 Furfural Production and Recovery Performance ....................................................... 59
8.4 Heat Recovery and Electricity Production ................................................................ 63
8.5 Process Optimization ................................................................................................. 65
8.5.1 Area 400 Column Integration ............................................................................. 65
8.5.2 COL-401 Vapour Draw Composition ................................................................ 67
8.5.3 COL-300 Vapour Draw Composition ................................................................ 68

ix
8.5.4 Steam Boiler Cycle Pressure .............................................................................. 68
8.6 Market Considerations ............................................................................................... 69
9. Conclusion ........................................................................................................................ 73
References ................................................................................................................................ 75

x
xi
List of Figures
2.1 Schematic representation of the physical structure of lignocellulosic material in its natural
form (left) and the goal of pretreatment (right). Cellulose (black); Hemicellulose (green); Lignin
(pink). Adapted from [15].
2.2 Schematic overview of possible reactions during acid hydrolysis of lignocellulose.
2.3 Simple kinetic model of acid catalyzed hydrolysis of sugar polymers to monomers and
decomposition products.
2.4 Kinetic model of hydrolysis of cellulose to glucose, which degrades into 5-HMF.
2.5 Schematic representation of a single washing stage. V is the wash filtrate, L is the slurry
containing solid material, and x and y is the concentration of dissolved matter in wash filtrate and
liquid slurry respectively. Adapted from [21].
2.6 Washing yield for a single stage washing unit, as a function of liquid weight ratio and
efficiency, taken from [21].
3.1 U.S. Corn Consumption, 2015 [26].
3.2 Global fuel ethanol production by country/region and year [29].
3.3 Block diagram of the NREL ethanol process.
3.4 Schematic of a modern Chinese furfural plant, taken from [4].
3.5 Simplified process flow diagram of the Marcotullio process with a production rate of 2.8 ton/h
95 wt% furfural [4].
4.1 Block diagram of a process for integrated production of furfural with ethanol.
5.1 XY plot of the binary mixture of furfural and water at 1.0 atm. Composition is given in wt%.
5.2 T-XY plot of the binary mixture of furfural and water at 1.0 atm. Composition is given in
wt%.
5.3 XY plot of the binary mixture of ethanol and water at 1.0 atm. Composition is given in wt%.
5.4 LLE plot of the tertiary mixture of water, furfural and acetic acid at 1.0 atm and 20.0 C.
Composition is given in wt%.
xii
6.1 Process flow diagram of the first part of pretreatment.
6.2 Process flow diagram of the second part of pretreatment.
6.3 Process flow diagram of the enzymatic hydrolysis and fermentation.
6.4 Process flow diagram of the ethanol recovery process.
6.5 Process flow diagram of the furfural production process.
6.6 Process flow diagram of the furfural recovery process.
6.7 Process flow diagram of the steam boiler process.
8.1 Total flow of furfural in vapour and liquid phase as a function of column tray number.
8.2 Installed reboiler heat exchanger area and compressor duty as a function of outlet pressure in
the compressor [COMP-400]. Purchase cost of reboiler and compressor is included. The vertical line
indicates the design pressure.
8.3 Installed reboiler heat exchanger area and compressor duty as a function of outlet pressure in
the compressor [COMP-401]. Purchase cost of reboiler and compressor is included. The vertical line
indicates the design pressure.
8.4 Column recycle inlet, reboiler heat deficit and overall plant electricity surplus as a function of
varying composition in the column vapour draw. The vertical line indicates the design composition.
8.5 Reboiler duty in beer column and rectification column as a function of varying composition in
the beer column vapour draw. The vertical line indicates the design composition.
8.6 Produced electricity in the two steam turbines in the steam boiler cycle as a function of the
cycle pressure in the boiler.
8.7 Ethanol and furfural production rate as a function of pretreatment washing yield.
xiii
List of Tables
4.1 Corn stover feedstock composition on dry-weight basis.
5.1 Overview of all hypothetical components used, and information about basic properties.
5.2 Overview of kinetic parameters used in the acid catalyzed formation and decomposition of
glucose and xylose [17,37].
6.1 Pretreatment reactor operating conditions.
6.2 Oligomer conversion tank operating conditions.
6.3 Reaction conversion after pretreatment- and oligomer conversion reactor.
6.4 Enzymatic hydrolysis operating conditions.
6.5 Seed train reactions and assumed conversions.
6.6 Batch fermentation reactions and assumed conversions.
6.7 Design specifications and operating conditions of ethanol distillation columns.
6.8 Design specifications and operating conditions of furfural distillation columns.
7.1 Heating requirements for the plant. Start and end temperatures for the stream to be heated are
given. These are set equal for the reboilers.
7.2 Cooling requirements for the plant. Start and end temperatures for the stream to be cooled are
given. These are set equal for the condenser.
8.1 Overall Carbon Mole Balance.
8.2 Lower heating value (LHV) of corn stover feedstock and products. Excess electricity is also
included.
8.3 Comparison of data for ethanol recovery. The data is given as specific values relative to the
given ethanol production rate, for easy comparison. Data for comparison is taken from [23].
8.4 Comparison of main performance data for production and recovery of furfural. The data are
given as specific values relative to the given furfural production rate, for easy comparison. The COL-
401 Recycle Factor described the ratio of the recycle stream into the azeotropic distillation column
relative to the main feed into the same column. Data for comparison are taken from [4].

xiv
8.5 Steam boiler cycle performance data, and data from the NREL ethanol plant for comparison
[23]. The amount of wastewater, and the produced methane from anaerobic digestion, is also included.
These are given as absolute values, while the rest are given as specific values relative to the boiler
duty.
8.6 Overall electricity production and consumption for the plant.
8.7 Overview of main feedstock costs and products revenue [27, 31, 35, 44].
1
1. Introduction
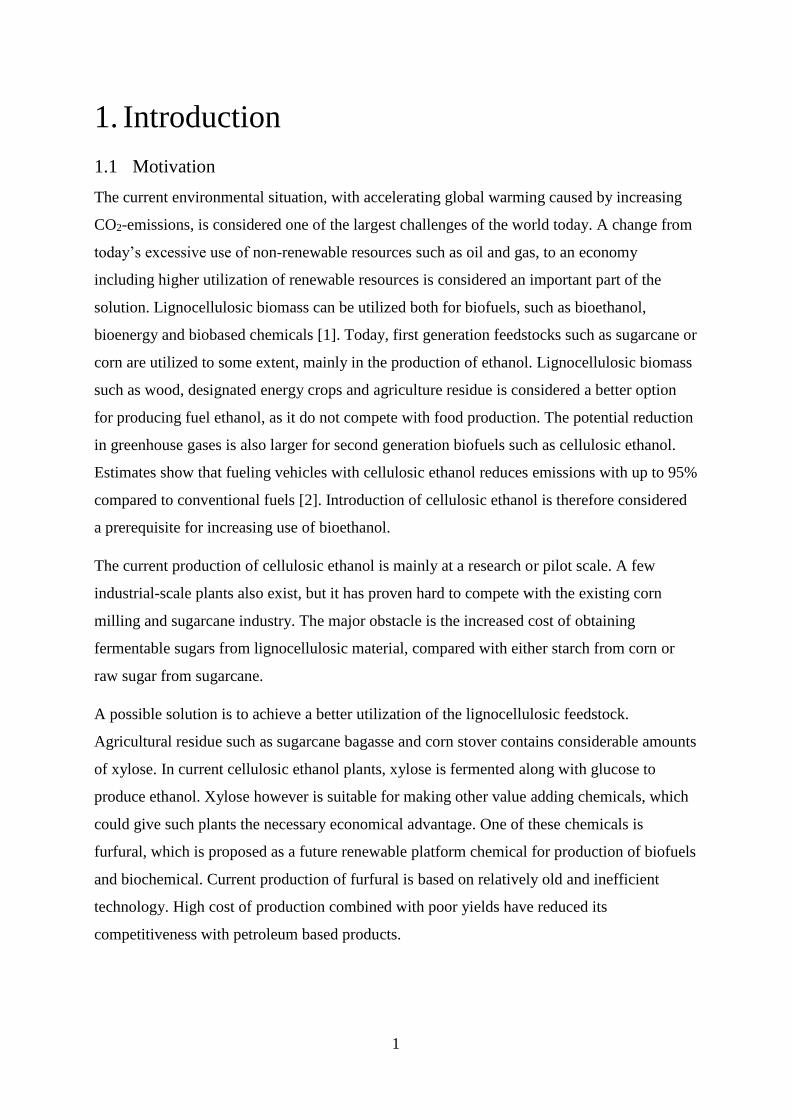
1.1 Motivation
The current environmental situation, with accelerating global warming caused by increasing
CO2-emissions, is considered one of the largest challenges of the world today. A change from
today’s excessive use of non-renewable resources such as oil and gas, to an economy
including higher utilization of renewable resources is considered an important part of the
solution. Lignocellulosic biomass can be utilized both for biofuels, such as bioethanol,
bioenergy and biobased chemicals [1]. Today, first generation feedstocks such as sugarcane or
corn are utilized to some extent, mainly in the production of ethanol. Lignocellulosic biomass
such as wood, designated energy crops and agriculture residue is considered a better option
for producing fuel ethanol, as it do not compete with food production. The potential reduction
in greenhouse gases is also larger for second generation biofuels such as cellulosic ethanol.
Estimates show that fueling vehicles with cellulosic ethanol reduces emissions with up to 95%
compared to conventional fuels [2]. Introduction of cellulosic ethanol is therefore considered
a prerequisite for increasing use of bioethanol.
The current production of cellulosic ethanol is mainly at a research or pilot scale. A few
industrial-scale plants also exist, but it has proven hard to compete with the existing corn
milling and sugarcane industry. The major obstacle is the increased cost of obtaining
fermentable sugars from lignocellulosic material, compared with either starch from corn or
raw sugar from sugarcane.
A possible solution is to achieve a better utilization of the lignocellulosic feedstock.
Agricultural residue such as sugarcane bagasse and corn stover contains considerable amounts
of xylose. In current cellulosic ethanol plants, xylose is fermented along with glucose to
produce ethanol. Xylose however is suitable for making other value adding chemicals, which
could give such plants the necessary economical advantage. One of these chemicals is
furfural, which is proposed as a future renewable platform chemical for production of biofuels
and biochemical. Current production of furfural is based on relatively old and inefficient
technology. High cost of production combined with poor yields have reduced its
competitiveness with petroleum based products.
2
Several studies have indicated that an integrated production of furfural in biorefineries could
both reduce energy consumption and increase production yields [3]. Integrated production of
furfural with cellulosic ethanol may therefore improve process economy for both processes.
1.2 Objectives
The main objective for this thesis is to implemented a working model of an integrated process
for furfural and ethanol in the process simulation software HYSYS. The model is based on the
process for biochemical conversion of lignocellulosic biomass to ethanol, proposed by the
U.S. National Renewable Energy Laboratory (NREL). The implementation of the integrated
furfural production is based on the innovative process proposed by Marcotullio. [4]
The following subjects is investigated in this thesis:
1. Modeling of the corn stover feedstock as a solid material in HYSYS, including the
creation of necessary hypothetical components.
2. Implementation of kinetic reactions for the feedstock pretreatment and the furfural
production.
3. Investigate the use of residual solid material for co-generation of heat and electricity,
and if the plant is self-sufficient in energy.
4. Compare the plant performance to NREL and Marcotullio, with emphasis on changes
in heating demand.
1.3 Structure
The thesis consist of nine chapters including this introduction.
Chapter 2 Theory
Contains an introduction to lignocellulosic materials, biorefineries and processes that are
important for lignocellulosic material.
Chapter 3 Current Technology
Overview of current processes for production of fuel ethanol and furfural. Also discussed
processes for integrated production of furfural.
Chapter 4 Process Basis
Introduction and outline of the process studied in this work, including the various process
areas. Also defines the design basis for the process.
3
Chapter 5 HYSYS Setup
Description of the HYSYS setup, including component list and reaction sets. Discussion of
property package and estimation of binary coefficients.
Chapter 6 HYSYS Process Implementation
Thorough description of each process area, and how they are implemented in HYSYS.
Chapter 7 Heat Integration
Discussion of the process heat integration, and opportunities for further integration. Overview
of heating and cooling demand is included.
Chapter 8 Analysis and Discussion
Analysis of the plant performance, including comparison of performance of specific plant
areas compared to the NREL and Marcotullio designs. Some important design parameters are
also discussed.
Chapter 9 Conclusion
Summary of the process performance and energy requirements, and recommendations for
further work on the developed model.

4
5
2. Theory
2.1 Lignocellulosic Material
Lignocellulosic material is a generic classification of biomass derived from both non-woody
and woody plants. The definition of the term is somewhat unclear, but strictly speaking, it is a
mixture of cellulose, hemicellulose and lignin, which together constitutes the largest fraction
of all plant cell walls [5]. Some definitions also include plant oils, protein and ash, which are
the main non-cell wall constituents [6, 7]. The variety of macroscopic appearance and
structure of lignocellulosic materials is extensive, and although the chemical composition also
varies, some trends are observed. In general, the largest polymeric fraction is cellulose, in the
range of 35-55%. The next largest fraction is hemicellulose, in the range of 20-35%, and then
follows lignin, with about 15-30%.
Cellulose is a polysaccharide made up of ᴅ-glucopyranose units, linked together by β-(1-4)-
glucosidic bonds, the smallest repeating unit being cellubiose [8]. It is a strictly linear
molecule with a high average degree of polymerization, up to 10,000 and above for some
species. Cellulose chains are able to form both intra- and inter-molecular hydrogen bonds, and
easily forms aggregates (microfibrils), which is the smallest structural component in cellulose
fibers [9]. Cellulose fibers consist of regions of varying crystallinity. For most species, the
degree of crystallinity is 50% or more, rendering it insoluble in most solvents [10].
Hemicellulose is a group of polysaccharides made up of different sugar units, such as ᴅ-
glucopyranose, ᴅ-xylopyranose, ᴅ-galactopyranose, ι-arabinofuranose , ᴅ-mannopyranose and
minor amounts of other sugars [8]. The DP of hemicelluloses are much smaller than for
cellulose, with an average of about 100-200. Most hemicellulose polymers usually consist of a
combination of different sugar types, and are often named by the sugar content, for example
arabinogalactan, glucomannan or galactoglucomannan. Because of its branched structure, its
physical structure is purely amorphous. This makes it more soluble than cellulose, and
generally reacts faster.
Lignin is a group of highly amorphous, highly complex, and mainly aromatic polymers.
Lignins are polymerized from three different monomers, often referred to as monolignols.
These are p-coumaryl alcohol, conifer alcohol and sinapyl alcohol. The tree monomers are
bound together via C-C and C-O-C linkages, forming a three dimensional structure, or web
[8]. It also forms bonds with hemicellulose chains. The interaction between hemicellulose and
6
cellulose, together with the crystalline nature of cellulose makes lignocellulosics a type of
natural composite material. The composite structure gives all plant material a natural
resistance to pest, deceases and chemical modification, known as recalcitrance [11].
All biomass also contain varying amounts of extractives and ash. Extractives is a group of low
molecular mass compounds that can be extracted by either polar or non-polar solvents. Such
compounds are often a combination of fats, fatty alcohols, fatty acids and esters. The
extractives- and ash content varies not only between different species, but are also affected by
location, time of harvesting and age.
2.2 Lignocellulosic Biorefinery
The research on utilizing renewable resources for the production of non-food products has
gained increased attention since the early 1990s. This has led to the development of new
integrated processes, biomass conversion technology and biorefinery technology [1].
Alongside this development, the term “biorefinery” was established during the 90s. Today,
the U.S. Department of Energy (DOE) defines a biorefinery as “…and overall concept of a
processing plant where biomass feedstocks are converted and extracted into a spectrum of
valuable products”. Similarly, the American Nation Renewable Energy Laboratory (NREL)
has published the following definition: “A biorefinery is a facility that integrates biomass
conversion processes and equipment to produce fuels, power, and chemicals from biomass”
[1]. An important aspect in this regard is the adaptability of the plant with respect to
production technology and products. A biorefinery must be able to use a mix of biomass
feedstocks to produce a variety of products, using several different processing technologies.
Such a biorefinery is often recognized as a phase III-biorefinery.
A phase I-biorefinery uses only one feedstock to produce a fixed amount of a specific product
and co-products. An example of this is the dry-milling of grain to produce ethanol and feed. A
phase II-biorefinery also uses one feedstock, but has the ability to produce a variety of
valuable products, based on market demand. An example of this is the wet-milling, which
produces starch, corn syrup, ethanol, corn oil, corn gluten and meal [1].
Complex biorefinery systems are often classified into four categories:
The lignocellulosic feedstock (LCF) biorefinery, which uses nature-dry raw materials,
such as cellulose containing biomass, waste etc.
The whole crop biorefinery, which uses raw materials such as cereals or corn.
7
The green biorefineries, which uses nature-wet biomasses such as grass, alfalfa, clover
and immature cereals.
The two platform biorefineries, combining the use of sugar and syngas as platforms
for processing.
Of these, the LCF biorefinery technology will most probably be used for large-scale industrial
biorefineries [1]. The general idea is to fractionate the feedstock into its major constituents,
i.e. Cellulose, hemicellulose and lignin. Cellulose, hemicellulose and lignin can then be
further processes into fuel, chemicals, materials, heat or power. An approach that has received
a lot of attention, and that is partially implemented at a pilot/commercial scale, is the use of
chemicals or enzymes to depolymerize the feedstock into fermentable sugars and lignin.
Sugars can be fermented into a variety of products, but the main motivation has been the
production of fuel ethanol [12]. The basic process is:
Lignocellulose + Water +Acid xylose + Cellulose/Lignin
Cellulose + Water + Enzyme Glucose
Glucose/Xylose Fermentation Ethanol + CO2 + Residual Biomass
Lignin + Residual Biomass Heat + Steam + Power
Despite extensive research and development, it has proven hard to establish a profitable
process with ethanol as the sole product [12]. This may in part be explained by the recalcitrant
nature of lignocellulosic material, making it harder to chemically process than feedstocks used
in competing processes, for example corn grain. It is also difficult to introduce new
technology in a large scale marked that is based on well established- and developed
technology. A solution that has been considered is using the xylose fraction to produce
higher-value chemicals, such as furfural/furfural-derivatives. Competing industry use
feedstocks that lack a pentose-fraction, which could make this solution a competitive
advantage. The present market of furfural is limited, but it is considered a highly versatile
intermediate chemical. It is proposed as one of several platform-chemicals, the building
blocks of future biorefinery value-chains. There exists several proposed processes for the co-
production of furfural, for example the biofine process, which produces furfural and levulinic
acid [13]. Several studies indicates that large scale industrial biorefineries producing ethanol
and furfural can be economically viable [12, 14].
8
2.3 Processing of Lignocellulosic Material
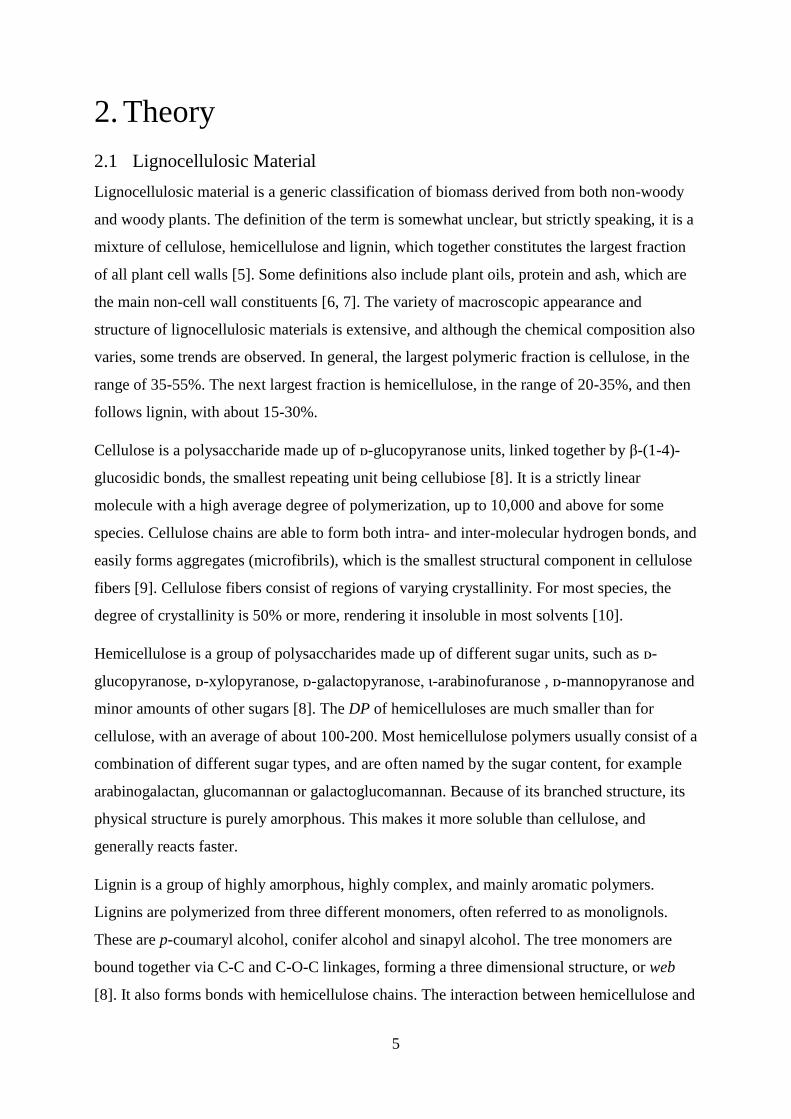
2.3.1 Pretreatment
Pretreatment is the process of altering the physical structure of lignocellulose, as indicated in
figure 2.1.
Figure 2.1: Schematic representation of the physical structure of lignocellulosic material in its natural
form (left) and the goal of pretreatment (right). Cellulose (black); Hemicellulose (green); Lignin
(pink). Adapted from [15].
The goal is to break the protecting seal that lignin forms, and to disrupt the crystalline
structure of cellulose, making it more accessible for further treatment. Pretreatment can be
chemical, physical or a combination of both [16].
Physical pretreatment involves mechanical processing such as chipping, grinding and milling,
to reduce both particle/chip size of the raw material, and the crystallinity of cellulose. If done
to a high extent, it is often seen as a separate form of treatment. It is often used in combination
with other forms of treatment, to help speed up the process. Steam explosion is often
considered a physical treatment, as it do not involve any use of chemicals, except water [15].
The raw material is exposed to steam at high pressure and temperature, degrading both
hemicellulose and lignin. The pressure is then rapidly decreased, causing high mechanical
stress on the material, causing it to break apart. The process can also include the use of acids
and alkali, to increase the degradation of lignin and hemicellulose.
Chemical pretreatment often involves the use of reactive chemicals at elevated temperature
and pressure. A range of chemicals has been used for this purpose, such as acids, alkali,
ozone, strong oxidizers, organic solvents or even specific microorganisms. The mechanisms
at which the chemicals alter the raw material structure varies, but the results are similar for
all. Lignin and hemicellulose are degraded, while crystalline cellulose is transformed into an
9
amorphous state. After pretreatment, the raw material structure is more susceptible for further
saccharification of cellulose, and what is left of the hemicellulose.
2.3.2 Acid Hydrolysis of Lignocellulose
The use of mineral acids such as hydrochloric acid, phosphoric acid and sulfuric acid in
particular, is one of the most commonly used methods of hydrolyzing lignocellulosic
materials. Sulfuric acid has been used both for pretreatment and as a regular hydrolyzing
agent. This is done by using concentrated acid at relatively low temperature (50-150 °C), or
by using dilute acid at elevated temperature (150-300 °C). Using concentrated acid as a
method for pretreatment or hydrolysis cause a number of difficulties that must be overcome,
such as toxicity, corrosion and acid recovery. Dilute sulfuric acid however is easier to handle,
and is the preferred choice in industry. Hemicelluloses are easily hydrolysed in dilute acid,
while cellulose are more resistant. It has proven hard to get higher yields than 60-70% glucose
from cellulose by the use of dilute acid alone [17]. Achieving high yields of glucose also has
the effect of degrading hemicellulose monosaccharides into degradation products, such as
furfural and 5-Hydroxymethylfurfural (5-HMF). Such compounds are known to have
significant inhibitory effects on the fermentation of sugar. An often preferred solution is to
use a combination of acid hydrolysis and enzymatic hydrolysis in two stages. The acid
hydrolyses the hemicellulose fraction, while at the same time serving as a form of
pretreatment for the cellulose fraction. The hemicellulose fraction is solubilized and the
cellulose is altered into a more amorphous state, which makes enzymatic hydrolysis in the
next stage possible [18].
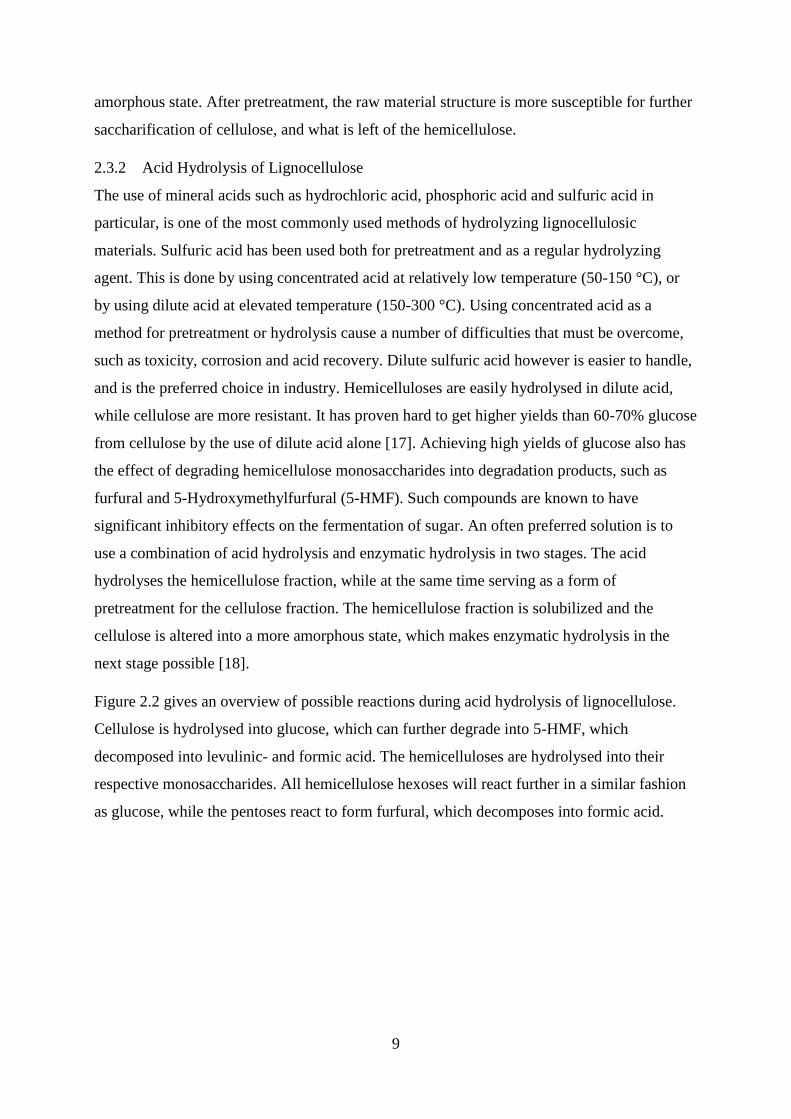
Figure 2.2 gives an overview of possible reactions during acid hydrolysis of lignocellulose.
Cellulose is hydrolysed into glucose, which can further degrade into 5-HMF, which
decomposed into levulinic- and formic acid. The hemicelluloses are hydrolysed into their
respective monosaccharides. All hemicellulose hexoses will react further in a similar fashion
as glucose, while the pentoses react to form furfural, which decomposes into formic acid.
10
Figure 2.2: Schematic overview of possible reactions during acid hydrolysis of lignocellulose.
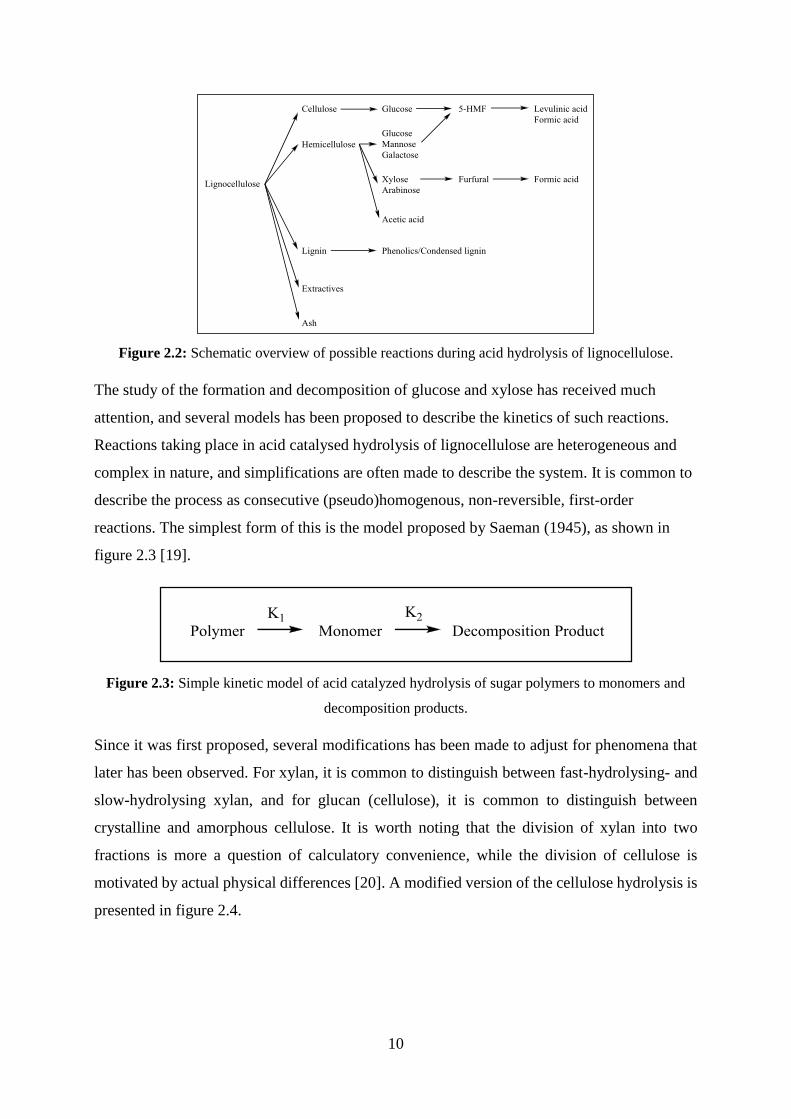
The study of the formation and decomposition of glucose and xylose has received much
attention, and several models has been proposed to describe the kinetics of such reactions.
Reactions taking place in acid catalysed hydrolysis of lignocellulose are heterogeneous and
complex in nature, and simplifications are often made to describe the system. It is common to
describe the process as consecutive (pseudo)homogenous, non-reversible, first-order
reactions. The simplest form of this is the model proposed by Saeman (1945), as shown in
figure 2.3 [19].
Figure 2.3: Simple kinetic model of acid catalyzed hydrolysis of sugar polymers to monomers and
decomposition products.
Since it was first proposed, several modifications has been made to adjust for phenomena that
later has been observed. For xylan, it is common to distinguish between fast-hydrolysing- and
slow-hydrolysing xylan, and for glucan (cellulose), it is common to distinguish between
crystalline and amorphous cellulose. It is worth noting that the division of xylan into two
fractions is more a question of calculatory convenience, while the division of cellulose is
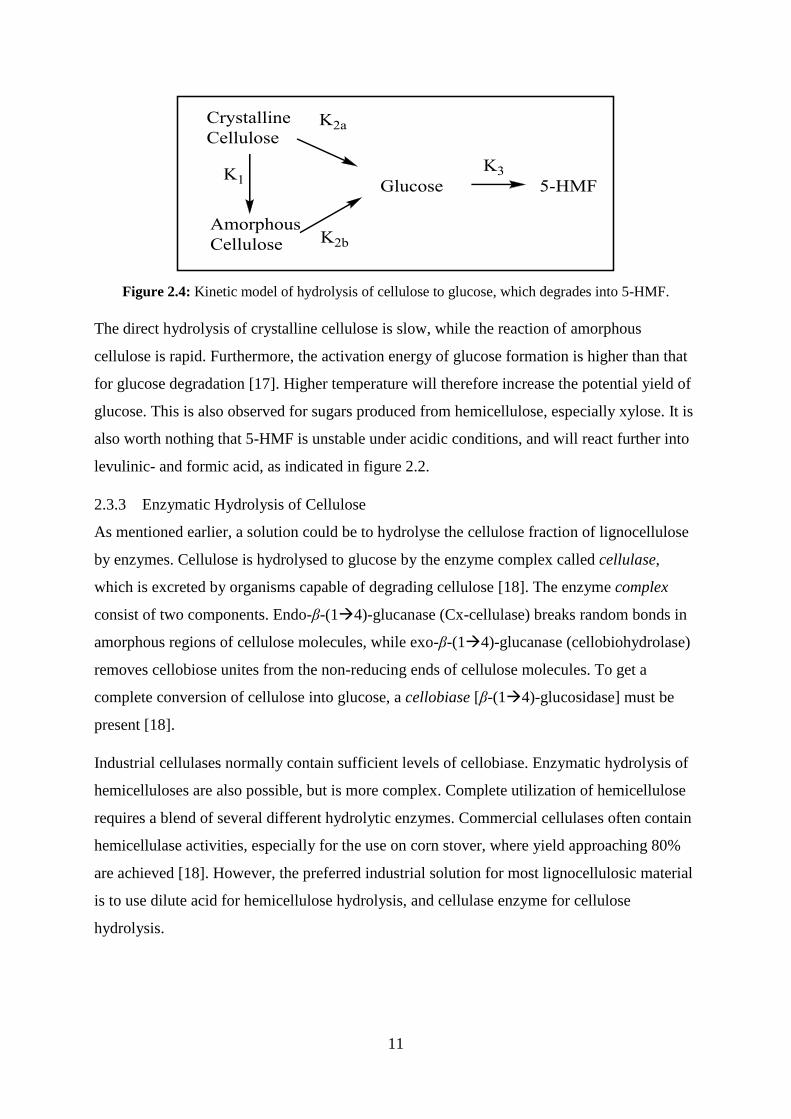
motivated by actual physical differences [20]. A modified version of the cellulose hydrolysis is
presented in figure 2.4.
11
Figure 2.4: Kinetic model of hydrolysis of cellulose to glucose, which degrades into 5-HMF.
The direct hydrolysis of crystalline cellulose is slow, while the reaction of amorphous
cellulose is rapid. Furthermore, the activation energy of glucose formation is higher than that
for glucose degradation [17]. Higher temperature will therefore increase the potential yield of
glucose. This is also observed for sugars produced from hemicellulose, especially xylose. It is
also worth nothing that 5-HMF is unstable under acidic conditions, and will react further into
levulinic- and formic acid, as indicated in figure 2.2.
2.3.3 Enzymatic Hydrolysis of Cellulose
As mentioned earlier, a solution could be to hydrolyse the cellulose fraction of lignocellulose
by enzymes. Cellulose is hydrolysed to glucose by the enzyme complex called cellulase,
which is excreted by organisms capable of degrading cellulose [18]. The enzyme complex
consist of two components. Endo-β-(14)-glucanase (Cx-cellulase) breaks random bonds in
amorphous regions of cellulose molecules, while exo-β-(14)-glucanase (cellobiohydrolase)
removes cellobiose unites from the non-reducing ends of cellulose molecules. To get a
complete conversion of cellulose into glucose, a cellobiase [β-(14)-glucosidase] must be
present [18].
Industrial cellulases normally contain sufficient levels of cellobiase. Enzymatic hydrolysis of
hemicelluloses are also possible, but is more complex. Complete utilization of hemicellulose
requires a blend of several different hydrolytic enzymes. Commercial cellulases often contain
hemicellulase activities, especially for the use on corn stover, where yield approaching 80%
are achieved [18]. However, the preferred industrial solution for most lignocellulosic material
is to use dilute acid for hemicellulose hydrolysis, and cellulase enzyme for cellulose
hydrolysis.
12
2.3.4 Fermentation
Hydrolysis of lignocellulosic material yields an aqueous mixture of sugars, including glucose,
xylose, mannose, arabinose and galactose. The yeast used for industrial production of ethanol,
Saccharomyces Cerevisiae, is only able to metabolize glucose under anaerobic conditions.
Therefore, a lot of work has been done to develop microorganisms capable of metabolizing
other sugars in a mixture with glucose. The fermentation reactions are given in equation 2.1
and 2.2.
𝐶6𝐻12𝑂6 → 2𝐶2𝐻5𝑂𝐻 + 2𝐶𝑂2 (2.1)
3𝐶5𝐻10𝑂5 → 5𝐶2𝐻5𝑂𝐻 + 5𝐶𝑂2 (2.2)
NREL have studied the use of Zymomonas mobilis, as it effectively converts glucose into
ethanol with superior ethanol tolerance. Recombinant, integrated strains have been made, able
to consume a mixture of glucose, xylose and arabinose, the three largest sugar constituents of
corn stover. While all sugars are nearly fully consumed, there is a preferred order of
consumption; glucose, then xylose and arabinose last. This represents a challenge for
processes where a mixture of different sugars are present, and makes for an reduction of
overall utilization of the carbon present in the feedstock.
2.3.5 Washing
Washing is the process of separating liquids containing dissolved matter or chemicals from
solids. Washing is an important unit operation in all pulp manufacturing, and a lot of the
notation and definitions comes from the field of pulp processing. Washing processes usually
consist of different operations, such as dilution, thickening or displacement, often in
combination. The goal of all washing is to remove as much dissolved matter using as little
wash water as possible.
Washing often includes several washing stages in series to obtain a sufficient washing yield,
Y, defined as the amount of dissolved matter removed as a fraction of the incoming amount of
dissolved matter. A schematic representation of a single wash stage is shown in figure 2.5
13
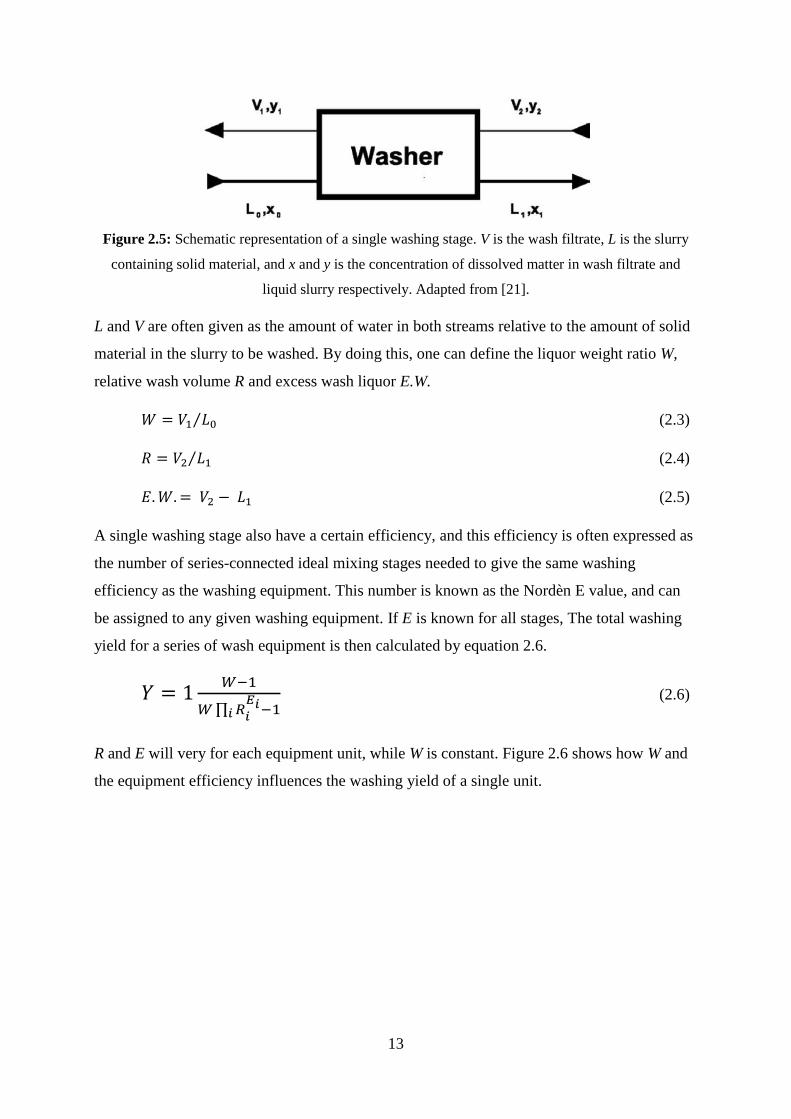
Figure 2.5: Schematic representation of a single washing stage. V is the wash filtrate, L is the slurry
containing solid material, and x and y is the concentration of dissolved matter in wash filtrate and
liquid slurry respectively. Adapted from [21].
L and V are often given as the amount of water in both streams relative to the amount of solid
material in the slurry to be washed. By doing this, one can define the liquor weight ratio W,
relative wash volume R and excess wash liquor E.W.
𝑊 = 𝑉1 𝐿0⁄ (2.3)
𝑅 = 𝑉2 𝐿1⁄ (2.4)
𝐸. 𝑊. = 𝑉2 − 𝐿1 (2.5)
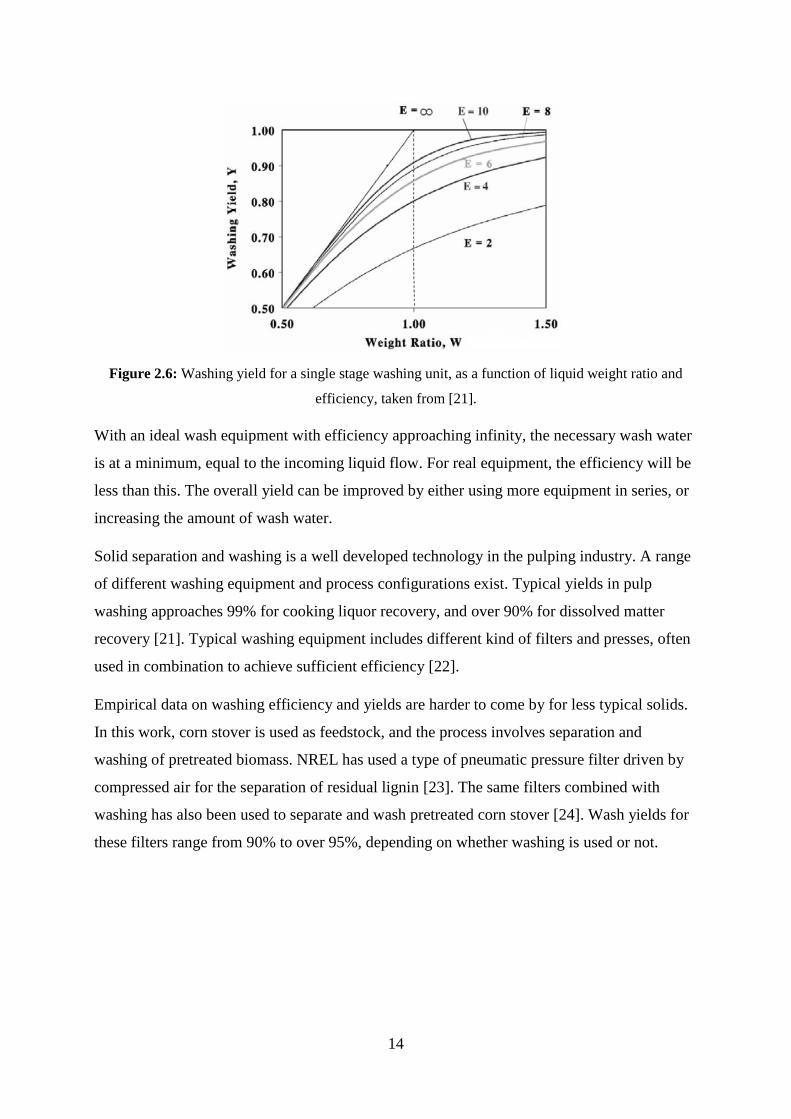
A single washing stage also have a certain efficiency, and this efficiency is often expressed as
the number of series-connected ideal mixing stages needed to give the same washing
efficiency as the washing equipment. This number is known as the Nordèn E value, and can
be assigned to any given washing equipment. If E is known for all stages, The total washing
yield for a series of wash equipment is then calculated by equation 2.6.
𝑌 = 1𝑊−1
𝑊 ∏ 𝑅𝑖
𝐸𝑖𝑖 −1
(2.6)
R and E will very for each equipment unit, while W is constant. Figure 2.6 shows how W and
the equipment efficiency influences the washing yield of a single unit.
14
Figure 2.6: Washing yield for a single stage washing unit, as a function of liquid weight ratio and
efficiency, taken from [21].
With an ideal wash equipment with efficiency approaching infinity, the necessary wash water
is at a minimum, equal to the incoming liquid flow. For real equipment, the efficiency will be
less than this. The overall yield can be improved by either using more equipment in series, or
increasing the amount of wash water.
Solid separation and washing is a well developed technology in the pulping industry. A range
of different washing equipment and process configurations exist. Typical yields in pulp
washing approaches 99% for cooking liquor recovery, and over 90% for dissolved matter
recovery [21]. Typical washing equipment includes different kind of filters and presses, often
used in combination to achieve sufficient efficiency [22].
Empirical data on washing efficiency and yields are harder to come by for less typical solids.
In this work, corn stover is used as feedstock, and the process involves separation and
washing of pretreated biomass. NREL has used a type of pneumatic pressure filter driven by
compressed air for the separation of residual lignin [23]. The same filters combined with
washing has also been used to separate and wash pretreated corn stover [24]. Wash yields for
these filters range from 90% to over 95%, depending on whether washing is used or not.
15
3. Current Technology
3.1 Corn Stover
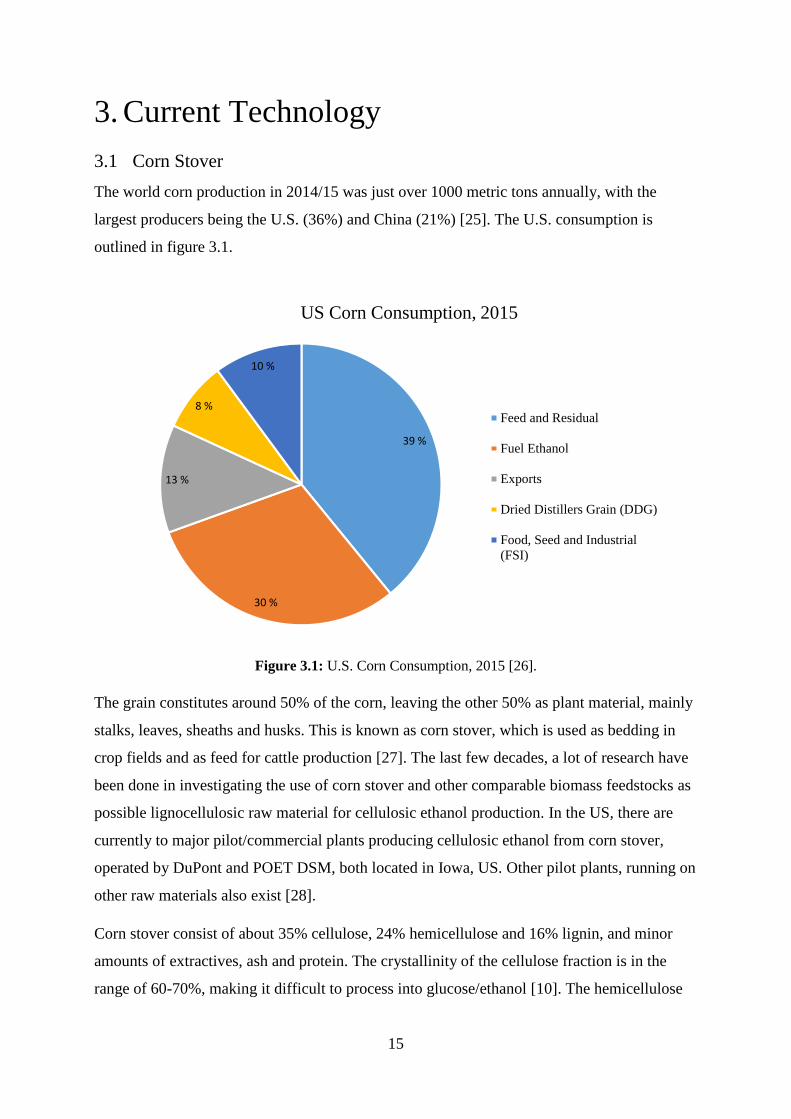
The world corn production in 2014/15 was just over 1000 metric tons annually, with the
largest producers being the U.S. (36%) and China (21%) [25]. The U.S. consumption is
outlined in figure 3.1.
Figure 3.1: U.S. Corn Consumption, 2015 [26].
The grain constitutes around 50% of the corn, leaving the other 50% as plant material, mainly
stalks, leaves, sheaths and husks. This is known as corn stover, which is used as bedding in
crop fields and as feed for cattle production [27]. The last few decades, a lot of research have
been done in investigating the use of corn stover and other comparable biomass feedstocks as
possible lignocellulosic raw material for cellulosic ethanol production. In the US, there are
currently to major pilot/commercial plants producing cellulosic ethanol from corn stover,
operated by DuPont and POET DSM, both located in Iowa, US. Other pilot plants, running on
other raw materials also exist [28].
Corn stover consist of about 35% cellulose, 24% hemicellulose and 16% lignin, and minor
amounts of extractives, ash and protein. The crystallinity of the cellulose fraction is in the
range of 60-70%, making it difficult to process into glucose/ethanol [10]. The hemicellulose
39 %
30 %
13 %
8 %
10 %
US Corn Consumption, 2015
Feed and Residual
Fuel Ethanol
Exports
Dried Distillers Grain (DDG)
Food, Seed and Industrial
(FSI)
16
fraction mostly contain xylose, making it an excellent feedstock for co-production of ethanol
and furfural.
3.2 Ethanol Production
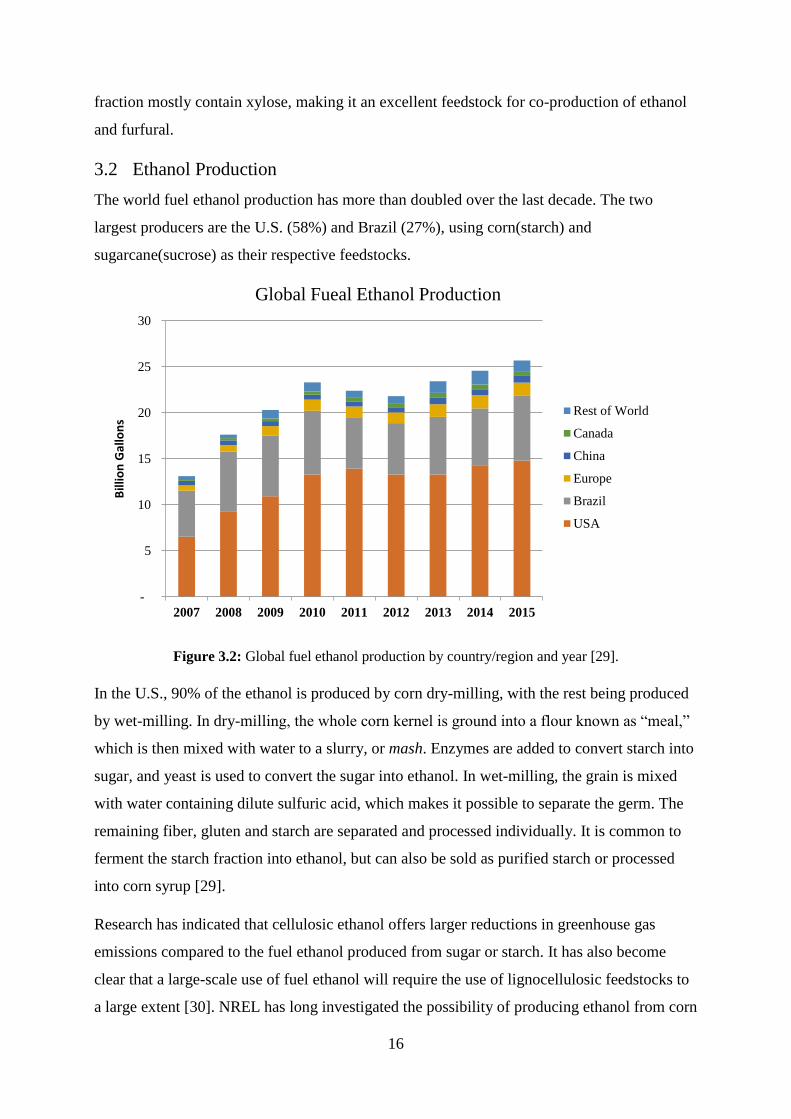
The world fuel ethanol production has more than doubled over the last decade. The two
largest producers are the U.S. (58%) and Brazil (27%), using corn(starch) and
sugarcane(sucrose) as their respective feedstocks.
Figure 3.2: Global fuel ethanol production by country/region and year [29].
In the U.S., 90% of the ethanol is produced by corn dry-milling, with the rest being produced
by wet-milling. In dry-milling, the whole corn kernel is ground into a flour known as “meal,”
which is then mixed with water to a slurry, or mash. Enzymes are added to convert starch into
sugar, and yeast is used to convert the sugar into ethanol. In wet-milling, the grain is mixed
with water containing dilute sulfuric acid, which makes it possible to separate the germ. The
remaining fiber, gluten and starch are separated and processed individually. It is common to
ferment the starch fraction into ethanol, but can also be sold as purified starch or processed
into corn syrup [29].
Research has indicated that cellulosic ethanol offers larger reductions in greenhouse gas
emissions compared to the fuel ethanol produced from sugar or starch. It has also become
clear that a large-scale use of fuel ethanol will require the use of lignocellulosic feedstocks to
a large extent [30]. NREL has long investigated the possibility of producing ethanol from corn
-
5
10
15
20
25
30
2007 2008 2009 2010 2011 2012 2013 2014 2015
Bill
ion
Gal
lon
s
Global Fueal Ethanol Production
Rest of World
Canada
China
Europe
Brazil
USA
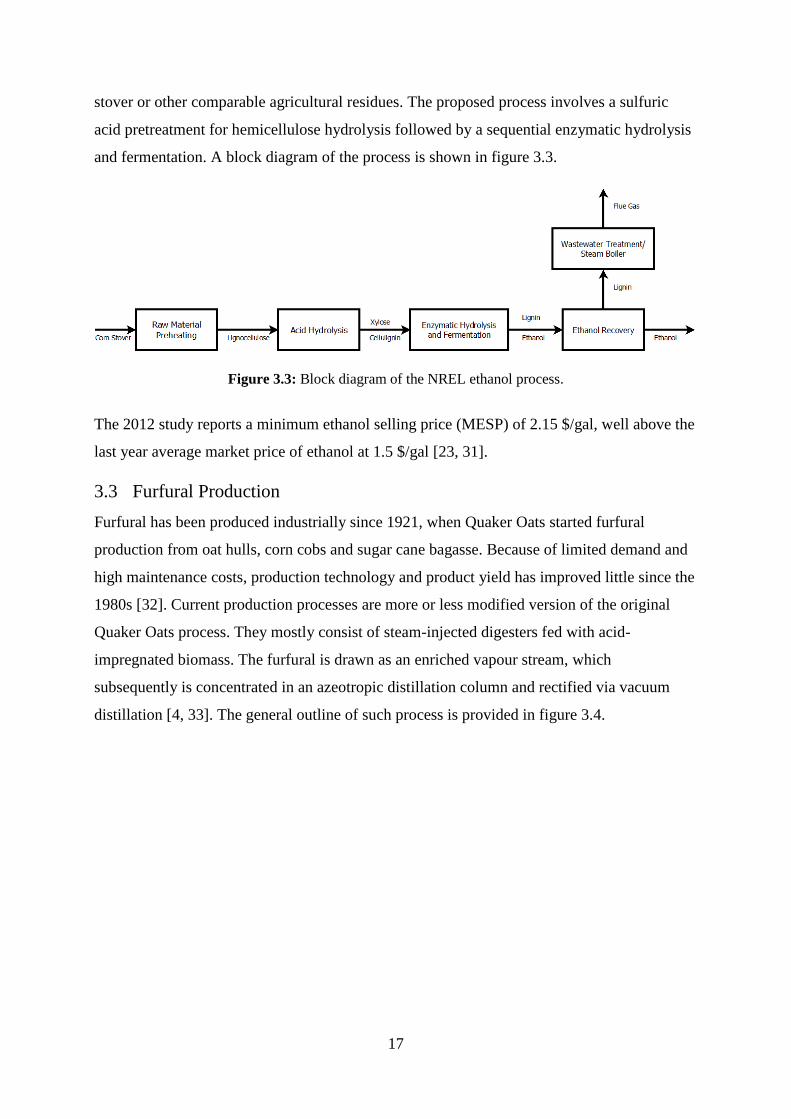
17
stover or other comparable agricultural residues. The proposed process involves a sulfuric
acid pretreatment for hemicellulose hydrolysis followed by a sequential enzymatic hydrolysis
and fermentation. A block diagram of the process is shown in figure 3.3.
Figure 3.3: Block diagram of the NREL ethanol process.
The 2012 study reports a minimum ethanol selling price (MESP) of 2.15 $/gal, well above the
last year average market price of ethanol at 1.5 $/gal [23, 31].
3.3 Furfural Production
Furfural has been produced industrially since 1921, when Quaker Oats started furfural
production from oat hulls, corn cobs and sugar cane bagasse. Because of limited demand and
high maintenance costs, production technology and product yield has improved little since the
1980s [32]. Current production processes are more or less modified version of the original
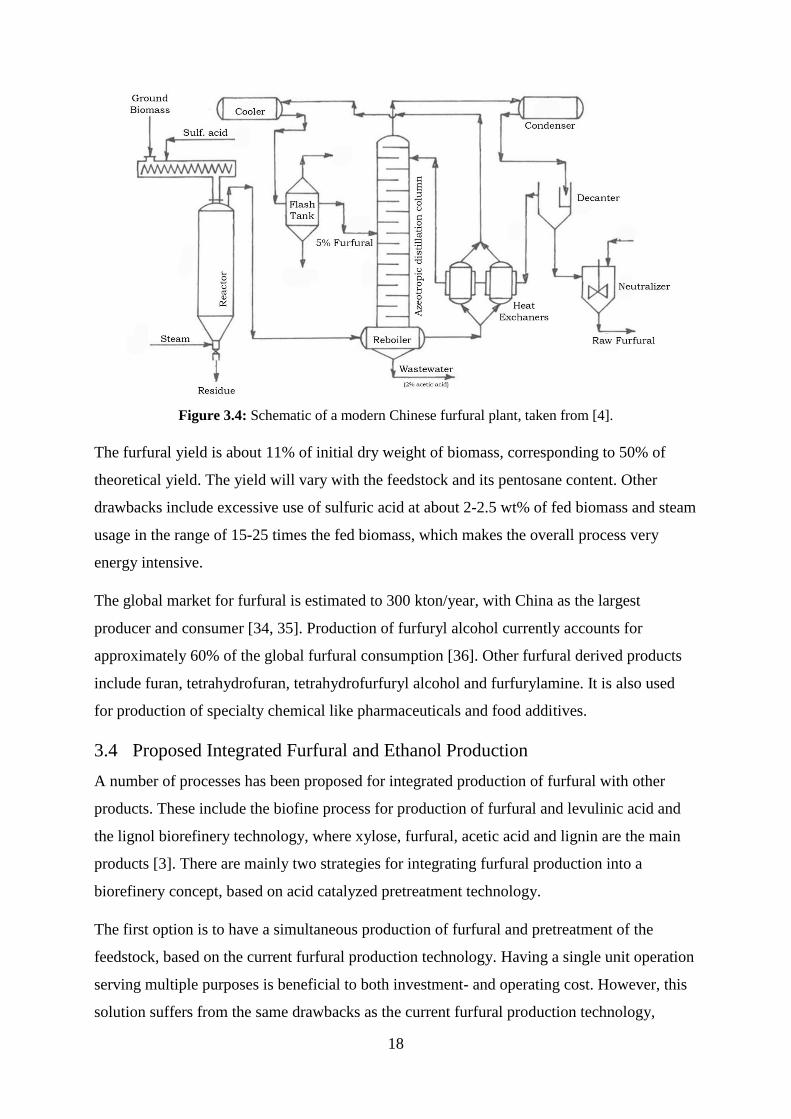
Quaker Oats process. They mostly consist of steam-injected digesters fed with acid-
impregnated biomass. The furfural is drawn as an enriched vapour stream, which
subsequently is concentrated in an azeotropic distillation column and rectified via vacuum
distillation [4, 33]. The general outline of such process is provided in figure 3.4.
18
Figure 3.4: Schematic of a modern Chinese furfural plant, taken from [4].
The furfural yield is about 11% of initial dry weight of biomass, corresponding to 50% of
theoretical yield. The yield will vary with the feedstock and its pentosane content. Other
drawbacks include excessive use of sulfuric acid at about 2-2.5 wt% of fed biomass and steam
usage in the range of 15-25 times the fed biomass, which makes the overall process very
energy intensive.
The global market for furfural is estimated to 300 kton/year, with China as the largest
producer and consumer [34, 35]. Production of furfuryl alcohol currently accounts for
approximately 60% of the global furfural consumption [36]. Other furfural derived products
include furan, tetrahydrofuran, tetrahydrofurfuryl alcohol and furfurylamine. It is also used
for production of specialty chemical like pharmaceuticals and food additives.
3.4 Proposed Integrated Furfural and Ethanol Production
A number of processes has been proposed for integrated production of furfural with other
products. These include the biofine process for production of furfural and levulinic acid and
the lignol biorefinery technology, where xylose, furfural, acetic acid and lignin are the main
products [3]. There are mainly two strategies for integrating furfural production into a
biorefinery concept, based on acid catalyzed pretreatment technology.
The first option is to have a simultaneous production of furfural and pretreatment of the
feedstock, based on the current furfural production technology. Having a single unit operation
serving multiple purposes is beneficial to both investment- and operating cost. However, this
solution suffers from the same drawbacks as the current furfural production technology,
19
mainly poor yields combined with high steam/energy consumption. It will also require
substantial washing and cleaning of the residual cellulose/lignin (cellulignin) for further
hydrolysation and fermentation, as it will contain high amounts of fermentation inhibitors.
The second option is to have a dedicated pretreatment process, where hemicellulose is
selectively hydrolysed. This pentose-rich liquid stream is then diverted to a dedicated furfural-
production area or facility. Having pentose/xylose in a liquid stream could make the
production of furfural more cost effective, as both furfural yield and energy consumption
could be improved significantly. Further processing of the residual cellulignin is also eased, as
the formation of fermentation inhibitors are greatly reduced. The main drawback of this
approach is potential high investment costs associated with a dedicated step for fractionating
xylose from the feedstock [4].
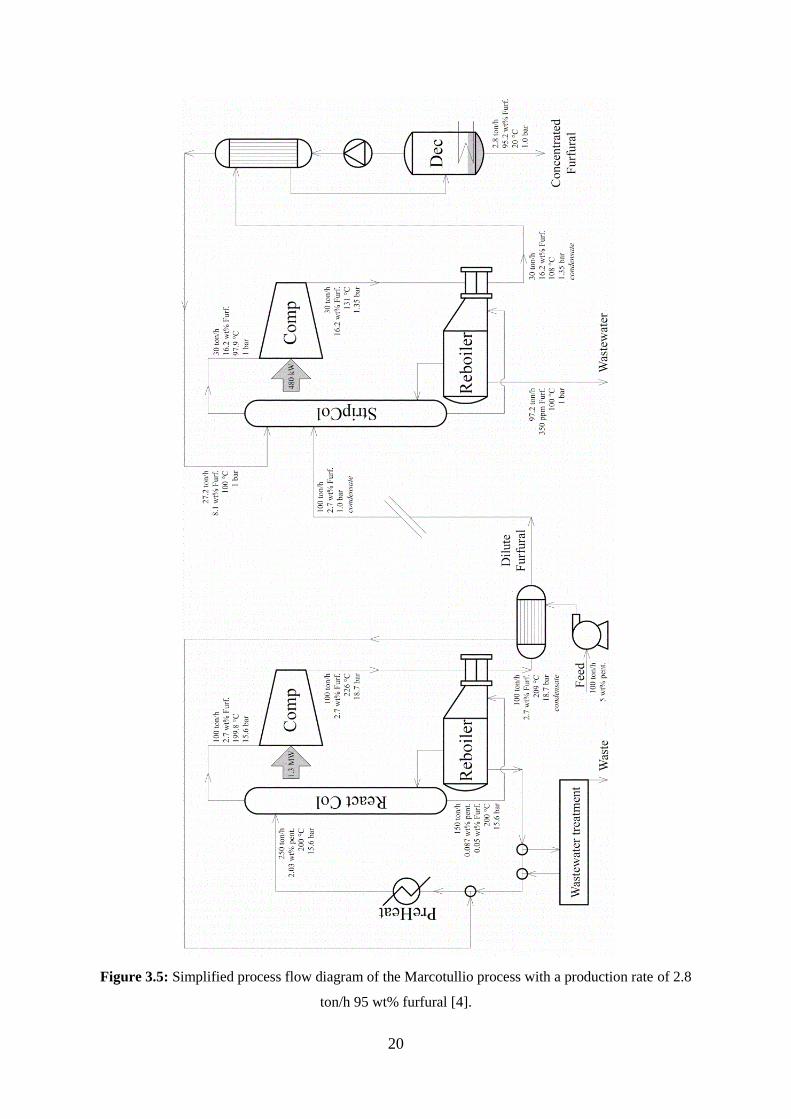
3.4.1 Marcotullio Process
Marcotullio has proposed an innovative process for the production of furfural [4]. The process
is envisioned as an integrated part of a biorefinery, utilizing the dilute aqueous pentose stream
resulting from a dedicated pretreatment process. Furfural production is performed in a
reactive countercurrent distillation column. As furfural forms, it immediately vapourizes and
is separated from the reactive liquid phase [4]. Figure 3.5 shows a simplified process flow
diagram of the process proposed by Marcotullio. The furfural product stream can be
compared to the raw furfural obtained in the process outlined in figure 3.4. A higher purity is
often wanted, and remaining water must be distilled off in a rectification column, analogous
to current furfural separation processes [33].
20
Figure 3.5: Simplified process flow diagram of the Marcotullio process with a production rate of 2.8
ton/h 95 wt% furfural [4].
21
4. Process Basis
4.1 Process description
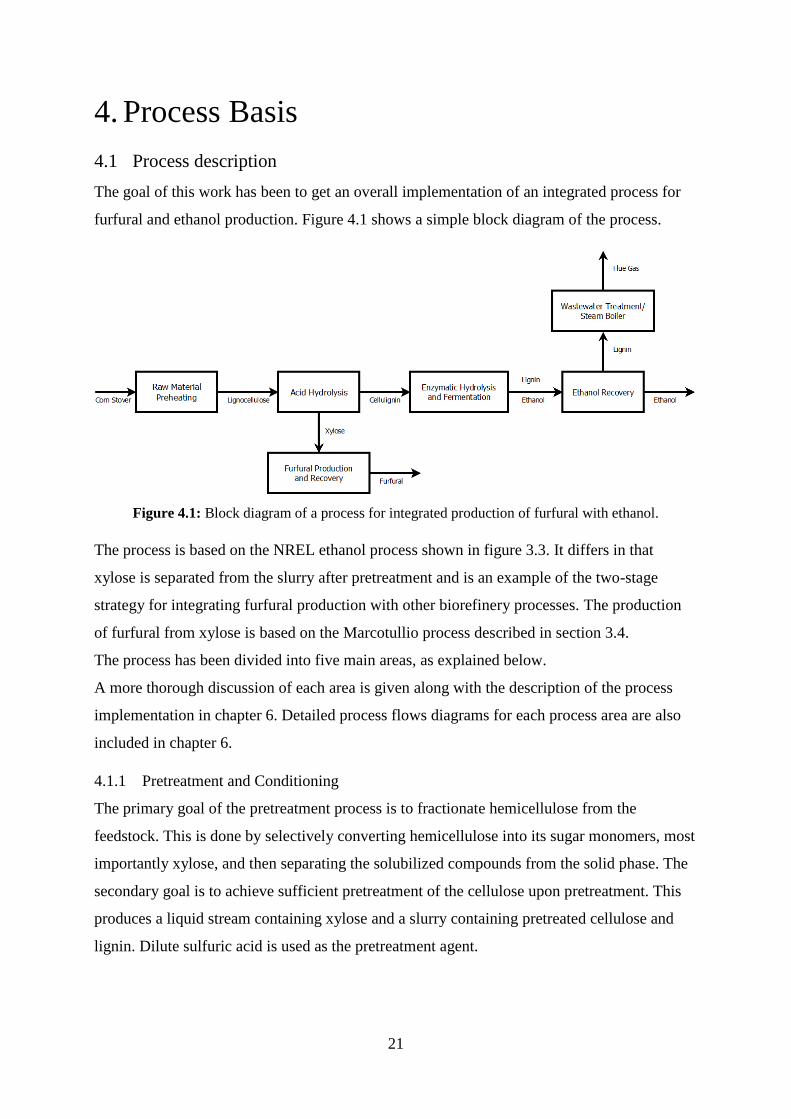
The goal of this work has been to get an overall implementation of an integrated process for
furfural and ethanol production. Figure 4.1 shows a simple block diagram of the process.
Figure 4.1: Block diagram of a process for integrated production of furfural with ethanol.
The process is based on the NREL ethanol process shown in figure 3.3. It differs in that
xylose is separated from the slurry after pretreatment and is an example of the two-stage
strategy for integrating furfural production with other biorefinery processes. The production
of furfural from xylose is based on the Marcotullio process described in section 3.4.
The process has been divided into five main areas, as explained below.
A more thorough discussion of each area is given along with the description of the process
implementation in chapter 6. Detailed process flows diagrams for each process area are also
included in chapter 6.
4.1.1 Pretreatment and Conditioning
The primary goal of the pretreatment process is to fractionate hemicellulose from the
feedstock. This is done by selectively converting hemicellulose into its sugar monomers, most
importantly xylose, and then separating the solubilized compounds from the solid phase. The
secondary goal is to achieve sufficient pretreatment of the cellulose upon pretreatment. This
produces a liquid stream containing xylose and a slurry containing pretreated cellulose and
lignin. Dilute sulfuric acid is used as the pretreatment agent.
22
4.1.2 Enzymatic Hydrolysis and Fermentation
A sequential hydrolysis and fermentation process (SHF) is used to hydrolyse cellulose into
glucose, which is then fermented into ethanol. The slurry received from pretreatment is mixed
with cellulase enzyme and partially hydrolysed in a continuous reactor. It is then fed to a
batch system for final hydrolysis and fermentation. The inoculum used in fermentation is
produced by diverting a fraction of the hydrolysed slurry into an inoculum seed train. This
stream is then pumped back to the batch system to initiate fermentation.
4.1.3 Ethanol Recovery
The finished beer from fermentation is distilled in two ordinary distillation columns,
producing an ethanol azeotrope. Anhydrous ethanol is produced by adsorbing water in a
molecular sieve adsorbing system. The beer from fermentation contains residual solids,
mainly lignin. The beer is not filtrated prior to distillation, which means that the solids will
flow with the beer column bottom stream. This stream is further treated in a wastewater
treatment process.
4.1.4 Furfural Production and Recovery
The liquid stream obtained from pretreatment is used to produce furfural. The reaction is
catalyzed by sulfuric acid reused from the pretreatment process, and performed in a reactive
distillation column. Furfural is recovered by using two distillation columns, called an
azeotropic distillation column and a purification column. The azeotropic stream from the first
column is split in a decanter. The rich phase is further purified in the purification column.
4.1.5 Wastewater Treatment and Steam Boiler
The wastewater from ethanol recovery contain residual lignin. This is filtrated to produce a
stream of combustible solids. Remaining wastewater from ethanol and furfural recovery
processes is used to produce methane by anaerobic digestion. This is the first step in
wastewater treatment and removes the majority of organic material in the water. Methane and
solids are burned in a boiler to produce steam. The steam is used to cover the heating demand
of the process and for generating electricity.
23
4.2 Design Basis
The 2011 NREL design report on biochemical conversion of corn stover to ethanol and
Marcotullio process for integrated production of furfural constitutes the basis for the plant
design described in this report [4, 23].
The feedstock input is 2000 ton/day of dry corn stover, corresponding to an annual feedstock
requirement of 700,400 dry ton/year with an anticipated uptime of 96%. The annual
production is 120,400 tons of 99.5 wt% ethanol and 93,300 tons of 99.0 wt% furfural. The
lignin is used as fuel for a high pressure steam boiler. The steam is used for electricity
production and for internal heating purposes.
The type of feedstock and its composition may influence the overall plant design. The amount
of cellulose and hemicellulose/xylose in the feedstock will be decisive to the sizing of the
etanol and furfural specific areas of the plant, and may affect design of important process
units, such as the pretreatment reactor and solid/liquid separation equipment. In this design,
corn stover is chosen as feedstock. The high content of xylan makes it a good choice for
integrated furfural production. The feedstock composition and the annual feedstock
requirements is equal to that used by NREL, making comparisons of flowsheet calculations
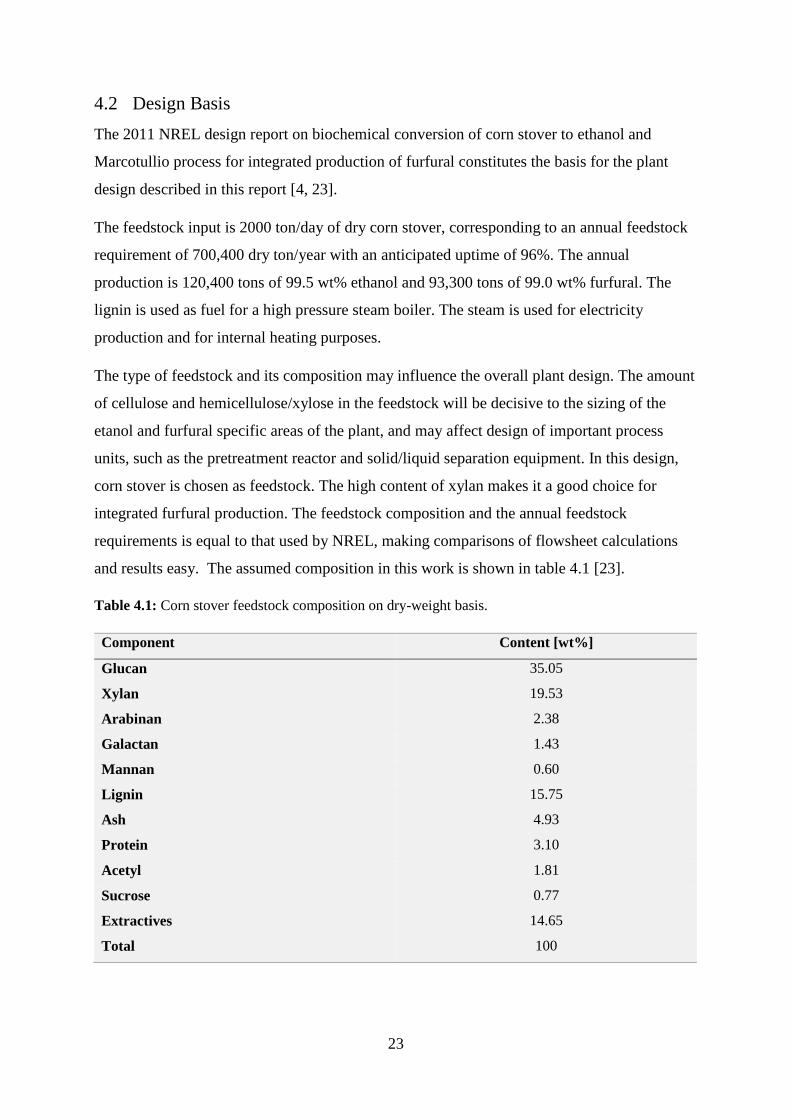
and results easy. The assumed composition in this work is shown in table 4.1 [23].
Table 4.1: Corn stover feedstock composition on dry-weight basis.
Component Content [wt%]
Glucan 35.05
Xylan 19.53
Arabinan 2.38
Galactan 1.43
Mannan 0.60
Lignin 15.75
Ash 4.93
Protein 3.10
Acetyl 1.81
Sucrose 0.77
Extractives 14.65
Total 100
24
4.3 Report Conventions
The units used in the report are mainly metric units. One exception is the use of atm for
pressure, as most of the design data are given in atm. Furthermore, ton is used for most mass
streams, and represent a standard metric ton (1,000 kg).
The process implemented in this work converts solid material into liquid products, and some
streams will contain both a liquid and solid phase. The total solid loading is defined as the
sum of all soluble solids such as sugars and salts, and insoluble solids such as the structural
carbohydrates in the feedstock. To avoid confusion, the terms are used through the discussion
of the process implementation and performance.
Yield and conversion are used to the describe the extent of various reactions, and are both a
percentage of the maximum theoretical. Conversion is mostly used for a specific reaction,
while yield is a measure of the amount of various compounds after reaction.
The numbering of trays/stages in distillation column is top down, with number 1 as the top
tray.
25
5. HYSYS Setup
5.1 Component List
The component list consist of 28 individual components, of which most is “pure components”
retrieved from the native HYSYS source databank. An option to using the HYSYS databank
would be to use the Aspen Plus databank, which offers a greater variety of components
available for selection. However, when using the Aspen Plus databank, there are some
limitations regarding property package set up.
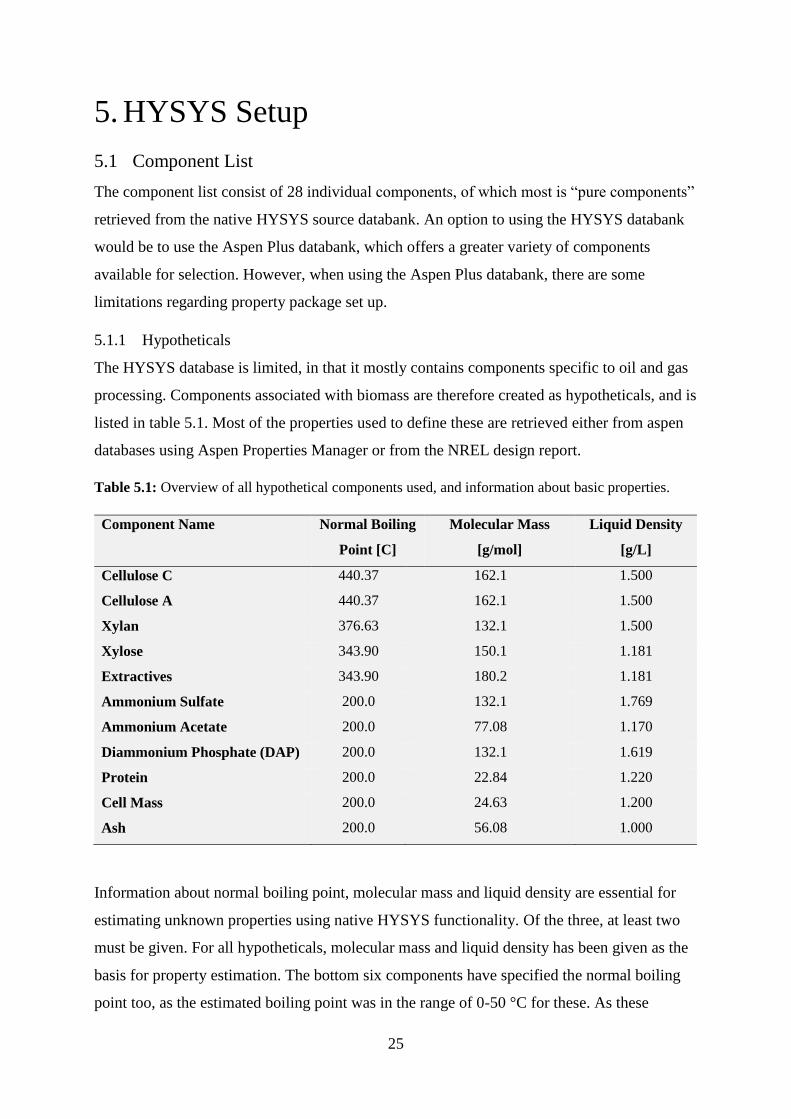
5.1.1 Hypotheticals
The HYSYS database is limited, in that it mostly contains components specific to oil and gas
processing. Components associated with biomass are therefore created as hypotheticals, and is
listed in table 5.1. Most of the properties used to define these are retrieved either from aspen
databases using Aspen Properties Manager or from the NREL design report.
Table 5.1: Overview of all hypothetical components used, and information about basic properties.
Component Name Normal Boiling
Point [C]
Molecular Mass
[g/mol]
Liquid Density
[g/L]
Cellulose C 440.37 162.1 1.500
Cellulose A 440.37 162.1 1.500
Xylan 376.63 132.1 1.500
Xylose 343.90 150.1 1.181
Extractives 343.90 180.2 1.181
Ammonium Sulfate 200.0 132.1 1.769
Ammonium Acetate 200.0 77.08 1.170
Diammonium Phosphate (DAP) 200.0 132.1 1.619
Protein 200.0 22.84 1.220
Cell Mass 200.0 24.63 1.200
Ash 200.0 56.08 1.000
Information about normal boiling point, molecular mass and liquid density are essential for
estimating unknown properties using native HYSYS functionality. Of the three, at least two
must be given. For all hypotheticals, molecular mass and liquid density has been given as the
basis for property estimation. The bottom six components have specified the normal boiling
point too, as the estimated boiling point was in the range of 0-50 °C for these. As these
26
components are solids, thermodynamic data related to boiling is assumed to be irrelevant for
the energy balance in the simulation. All hypotheticals are solid in reality, but modeled as
liquids in HYSYS. The high boiling points is important to keep the components in the liquid
phase during simulation. To help with this, the antoine vapour pressure coefficients used to
calculate the vapour pressure of components are changed to ensure non-boiling behavior, as
explained in the NREL design report. Additional information may also be provided, for
example heat of formation, heat of combustion and other property package-specific
parameters.
The Cell Mass component are made from ZYMO (Z. mobilis) specified in the NREL design
report, and is used to represent both Z. mobilis and the TRICHO (T. reesei) in the NREL
design report, as they are comparable both in molecular weight and composition and physical
properties.
5.1.2 Modeling of Corn Stover
The corn stover feedstock consist of several different structural carbohydrates. For simplicity,
all pentosans are modeled as xylan, and all hexosans are modeled as cellulose, as these two
are by far the most abundant components in the feedstock.
Cellulose is modeled as a crystalline component (Cellulose C) and an amorphous component
(Cellulose A). Cellulose A is a duplicate of Cellulose C, and meant to represent the
amorphous cellulose and the hexosan fraction of hemicellulose. The reason for this is the
assumed similarity in physical properties of the two, and that the reaction kinetics will be
similar.
The crystallinity of corn stover varies, but usually is between 60-70%. The crystalline fraction
as implemented in HYSYS is chosen higher than this, to account for the fact that not all of the
amorphous cellulose is available for reaction in untreated feedstock. Specifically, the fraction
is adjusted so that the yield of glucose after pretreatment is comparable of that reported by
NREL. The motivation for making the duplication of cellulose is not to get an accurate
representation of crystallinity, but to account for different reaction kinetics in cellulose and
expected yields after acid pretreatment.
Xylan is made as a duplicate of Cellulose C, accounting for different molecular weight, and
appropriately scaling the heat of formation property by a factor 5/6 [23]. It represents the total
pentosan content in the corn stover.
27
As mentioned, not all components are available in the native databank. However, some
components give good approximations. In accordance with the NREL design report, vanillin
is used to represent lignin, as the heat of combustion along with other relevant properties are
similar. Other minor components present in the corn stover is modeled as follows:
Ash is modeled as CaO, based on properties found in the NREL design report and
Aspen Properties Managers.
Sucrose is modeled as dextrose (glucose), and not included as an own component.
Protein is modeled based on molecular weight and composition of Wheat gliadin,
obtained from the NREL design report.
Acetyl groups present in hemicellulose is modeled as Acetic acid, as it is assumed that
it will fully solubilize during acid pretreatment.
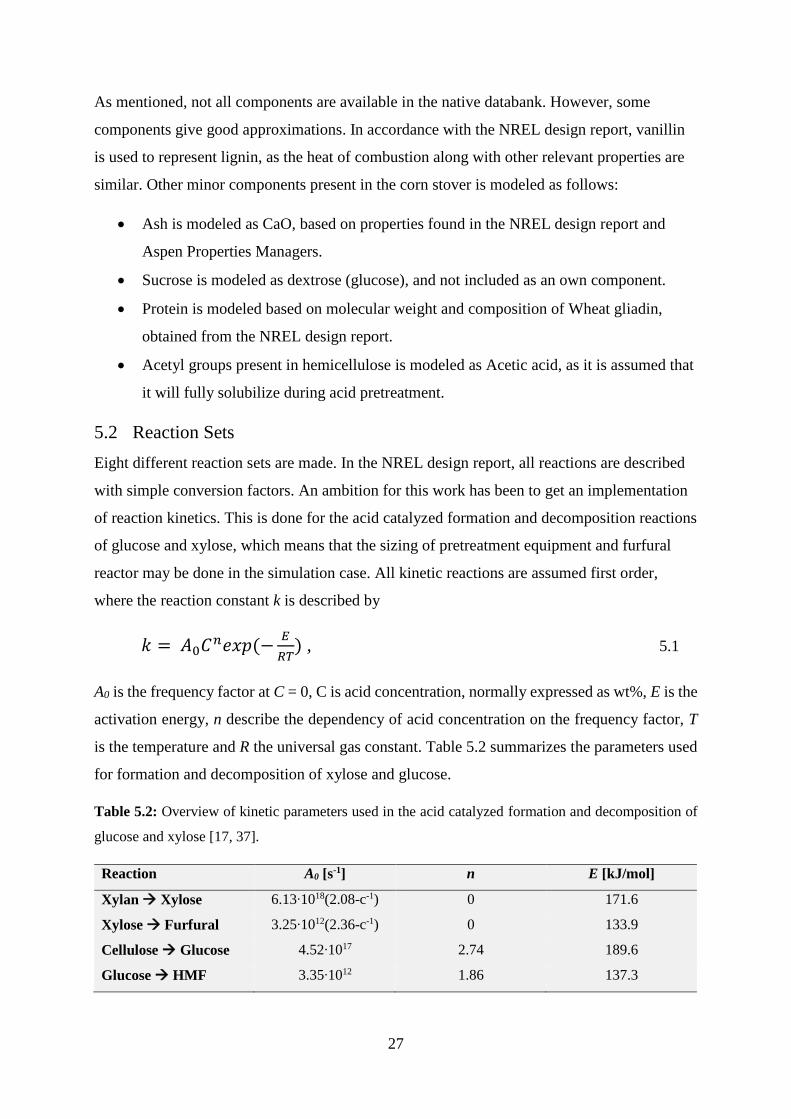
5.2 Reaction Sets
Eight different reaction sets are made. In the NREL design report, all reactions are described
with simple conversion factors. An ambition for this work has been to get an implementation
of reaction kinetics. This is done for the acid catalyzed formation and decomposition reactions
of glucose and xylose, which means that the sizing of pretreatment equipment and furfural
reactor may be done in the simulation case. All kinetic reactions are assumed first order,
where the reaction constant k is described by
𝑘 = 𝐴0𝐶𝑛𝑒𝑥𝑝 (−𝐸
𝑅𝑇) , 5.1
A0 is the frequency factor at C = 0, C is acid concentration, normally expressed as wt%, E is the
activation energy, n describe the dependency of acid concentration on the frequency factor, T
is the temperature and R the universal gas constant. Table 5.2 summarizes the parameters used
for formation and decomposition of xylose and glucose.
Table 5.2: Overview of kinetic parameters used in the acid catalyzed formation and decomposition of
glucose and xylose [17, 37].
Reaction A0 [s-1] n E [kJ/mol]
Xylan Xylose 6.13∙1018(2.08-c-1) 0 171.6
Xylose Furfural 3.25∙1012(2.36-c-1) 0 133.9
Cellulose Glucose 4.52∙1017 2.74 189.6
Glucose HMF 3.35∙1012 1.86 137.3
28
The kinetic parameters for the reaction from cellulose to glucose is used for the crystalline
fraction of cellulose, while the parameters for the reaction of xylan to xylose is assumed to be
valid for the amorphous fraction of cellulose, as the physical and structural properties of these
are similar.
HMF is the direct product of glucose degradation, but is highly unstable. In the reaction set, it
is modeled as levulinic acid and formic acid, as HMF is assumed to react into these. The validity
of this assumption with respect to the furfural reactive distillation column is questionable. HMF
has a lower boiling point than furfural, and would be expected to vapourize upon formation,
analogously to how furfural is expected to behave. However, experiments show that the yield
of levulinic acid and formic acid is higher than for HMF even at a retention time shorter than
one minute [38]. This is the main motivation for modeling the reaction products as levulinic
acid and formic acid even in the reactive distillation column.
The remaining reaction sets are all described by conversion factors, which will be discussed in
chapter 6. A dummy reaction set is also created for use in the continuous enzymatic hydrolysis
reactor, which also is discussed in chapter 6.
5.3 Choosing Property Package
The property package includes a set off specialized methods for calculating the properties of
components and values for properties in the simulation itself. HYSYS includes a range of
different property packages for selection.
Equation of State (EoS) models are used for predicting properties for most
hydrocarbons and other non-polar components. These include the Peng-Robinson
equation and the Soave-Redlich-Kwong equation, and variations of these.
Activity models handles highly non-ideal systems, and by nature are more empirical
than EoS models. These models are mostly used for non-ideal systems or polar
components. It is common to use an EoS model to predict vapour behavior, and use an
activity model for the liquid phase. Since activity models are empirical, the application
is limited to the data range used to predict its parameters.
Vapour Pressure models are used at low pressures for ideal mixtures, such as
hydrocarbon systems and mixtures of slightly polar ketones and alcohols.
A system consisting of mainly water, furfural and ethanol is considered non-ideal. Mixtures of
both water-furfural and water-ethanol forms azeotropes. Both the Non-Random-Two-Liquid
29
(NRTL) equation and the Universal Quasi Chemical (UNIQUAC) equation have been used to
successfully represent such systems. Both models uses a combination of temperature- and
non-temperature dependent parameters to calculate each components activity coefficient.
They are good choices for representing both vapour-liquid equilibria (VLE) and liquid-liquid
equilibria (LLE), although UNIQUAC is more detailed, and applicable for a broader range of
components.
For the water/furfural/ethanol system, both NREL and Marcotullio have preferred the use of
NRTL. For the purpose of comparability of results, NRTL is chosen for this work to.
5.4 Estimating Binary Coefficients
Binary coefficients are important for accurate representation of equilibria for both pure
components and mixtures. In this work, vapour-liquid equilibria (VLE) of binary and tertiary
mixtures containing water, ethanol, furfural and acetic acid is important. The liquid-liquid
equilibria (LLE) for water, furfural and acetic acid is also important for the phase separation
process described in chapter 3. Binary coefficients for these components are provided natively
by the HYSYS database; however, these do not yield good representations of any of the
equilibria of interest.
Binary coefficients can either be obtained directly from the literature, or experimental data of
equilibrium behavior can be used to calculate the coefficients by regression. HYSYS also
provide an automated function for parameter estimation based on the UNIFAC (UNIQUAC
Functional-group Activity Coefficients) group-contributing method. It predicts interactions
between molecules by applying standardized contributions for functional groups present on
the molecules that make up the liquid. The components of special interest in this work, such
as water, ethanol, acetic acid and furfural, have well defined values for this method. Furfural
as a molecule is specifically defined as its own functional group in the estimation method.
Binary coefficients used in this work are all estimated by using the UNIFAC estimation
method with emphasis on representing vapour-liquid equilibria. One drawback of using only
one property package based on activity coefficients is that simultaneous representation of
VLE and LLE behavior is difficult. The obtained binary coefficients is almost always a
compromise between the two. Some properties of the most important mixtures are given in
the following figures. All the plots are at atmospheric, as most of the processes are performed
at or slightly above 1.0 atm.
30
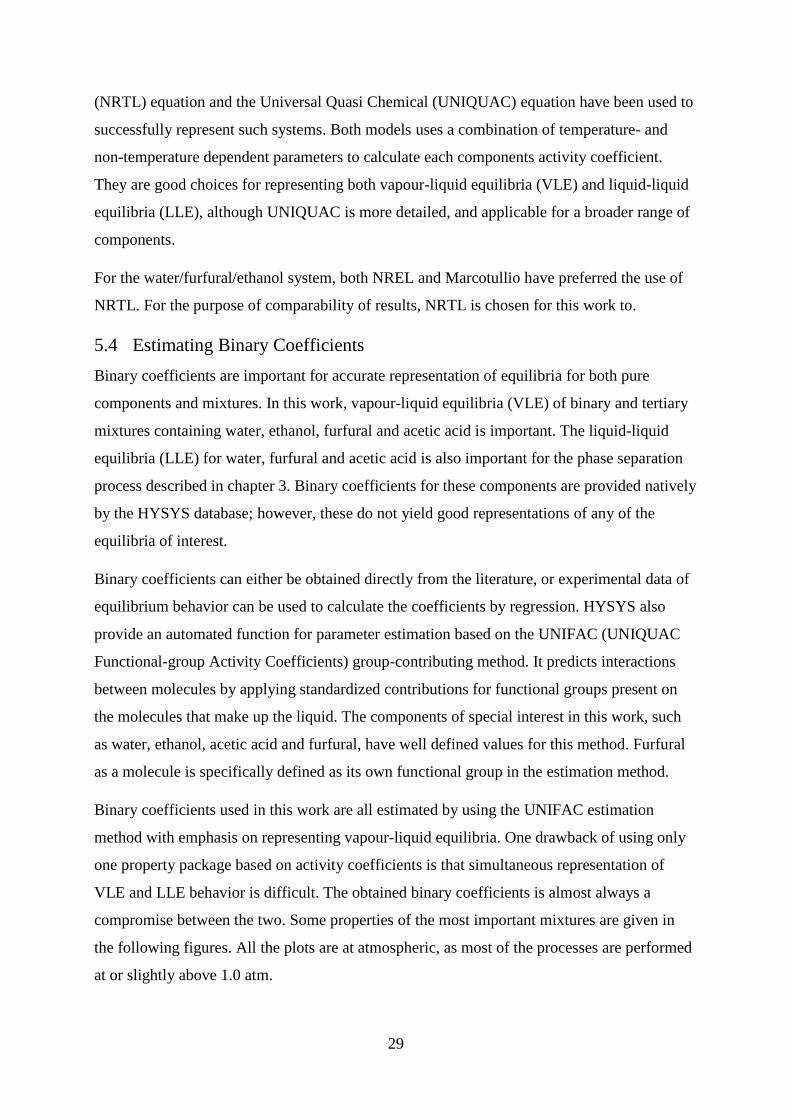
Figure 5.1 shows the equilibrium composition of furfural and water in liquid and vapour
phase. The estimated azeotropic point is at 34.2 wt% furfural, which is a little under the real
composition of 35.0% [39]. The furfural concentration in this work is either far below or
above the azeotropic point (shaded area in figure), and the accuracy is considered sufficient.
Figure 5.1: XY plot of the binary mixture of furfural and water at 1.0 atm. Composition is given in
wt%.
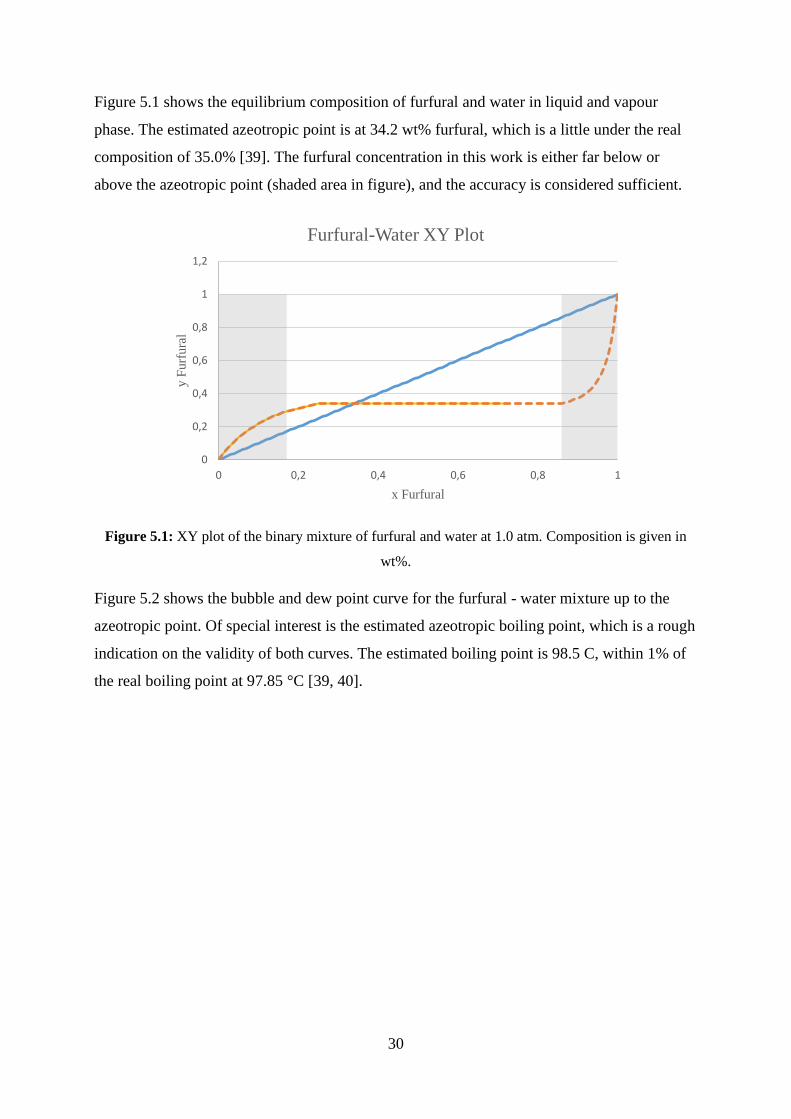
Figure 5.2 shows the bubble and dew point curve for the furfural - water mixture up to the
azeotropic point. Of special interest is the estimated azeotropic boiling point, which is a rough
indication on the validity of both curves. The estimated boiling point is 98.5 C, within 1% of
the real boiling point at 97.85 °C [39, 40].
0
0,2
0,4
0,6
0,8
1
1,2
0 0,2 0,4 0,6 0,8 1
y F
urf
ura
l
x Furfural
Furfural-Water XY Plot
31
Figure 5.2: T-XY plot of the binary mixture of furfural and water at 1.0 atm. Composition is given in
wt%.
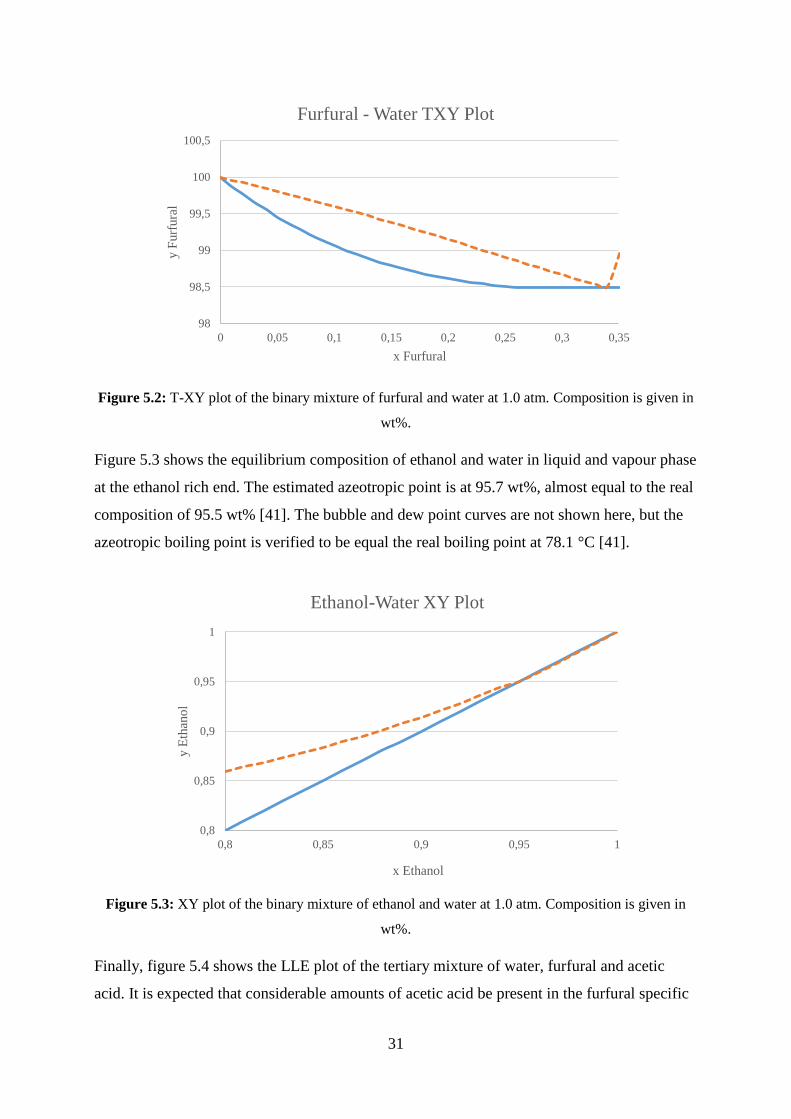
Figure 5.3 shows the equilibrium composition of ethanol and water in liquid and vapour phase
at the ethanol rich end. The estimated azeotropic point is at 95.7 wt%, almost equal to the real
composition of 95.5 wt% [41]. The bubble and dew point curves are not shown here, but the
azeotropic boiling point is verified to be equal the real boiling point at 78.1 °C [41].
Figure 5.3: XY plot of the binary mixture of ethanol and water at 1.0 atm. Composition is given in
wt%.
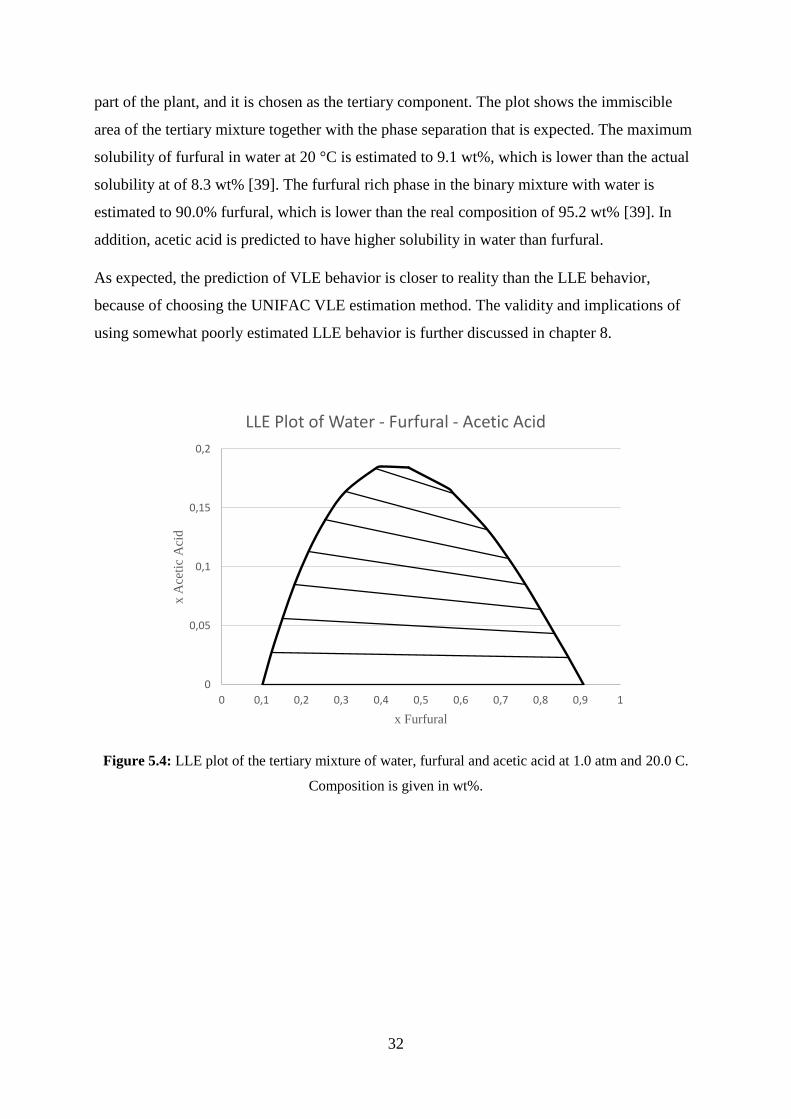
Finally, figure 5.4 shows the LLE plot of the tertiary mixture of water, furfural and acetic
acid. It is expected that considerable amounts of acetic acid be present in the furfural specific
98
98,5
99
99,5
100
100,5
0 0,05 0,1 0,15 0,2 0,25 0,3 0,35
y F
urf
ura
l
x Furfural
Furfural - Water TXY Plot
0,8
0,85
0,9
0,95
1
0,8 0,85 0,9 0,95 1
y E
than
ol
x Ethanol
Ethanol-Water XY Plot
32
part of the plant, and it is chosen as the tertiary component. The plot shows the immiscible
area of the tertiary mixture together with the phase separation that is expected. The maximum
solubility of furfural in water at 20 °C is estimated to 9.1 wt%, which is lower than the actual
solubility at of 8.3 wt% [39]. The furfural rich phase in the binary mixture with water is
estimated to 90.0% furfural, which is lower than the real composition of 95.2 wt% [39]. In
addition, acetic acid is predicted to have higher solubility in water than furfural.
As expected, the prediction of VLE behavior is closer to reality than the LLE behavior,
because of choosing the UNIFAC VLE estimation method. The validity and implications of
using somewhat poorly estimated LLE behavior is further discussed in chapter 8.
Figure 5.4: LLE plot of the tertiary mixture of water, furfural and acetic acid at 1.0 atm and 20.0 C.
Composition is given in wt%.
0
0,05
0,1
0,15
0,2
0 0,1 0,2 0,3 0,4 0,5 0,6 0,7 0,8 0,9 1
x A
ceti
c A
cid
x Furfural
LLE Plot of Water - Furfural - Acetic Acid
33
6. HYSYS Process Implementation
This chapter gives a thorough description of each process area with special focus on the
implementation and modeling HYSYS. An overview of the HYSYS simulation environment
highlighting the different process areas are included in appendix A.
Areas concerning feedstock storing and handling, storing and management of finished
products and management of utilities are not included in the HYSYS case. In addition, a
thorough implementation of wastewater treatment has not been included, which means that
the water mass balance is not fully closed.
Production of cellulase for enzymatic hydrolysis is also considered outside the scope of this
work. A dedicated process area for this could be included in a later work, or cellulase could be
assumed purchased on the market. The previously published design reports by NREL has not
included any onsite production of cellulase. The motivation for adding it in their latest design
is increased insight and transparency into what drives costs in cellulase production [23].
6.1 Area 100: Pretreatment and Conditioning
Process flow diagrams of the process area is show in figure 6.1 and 6.2.
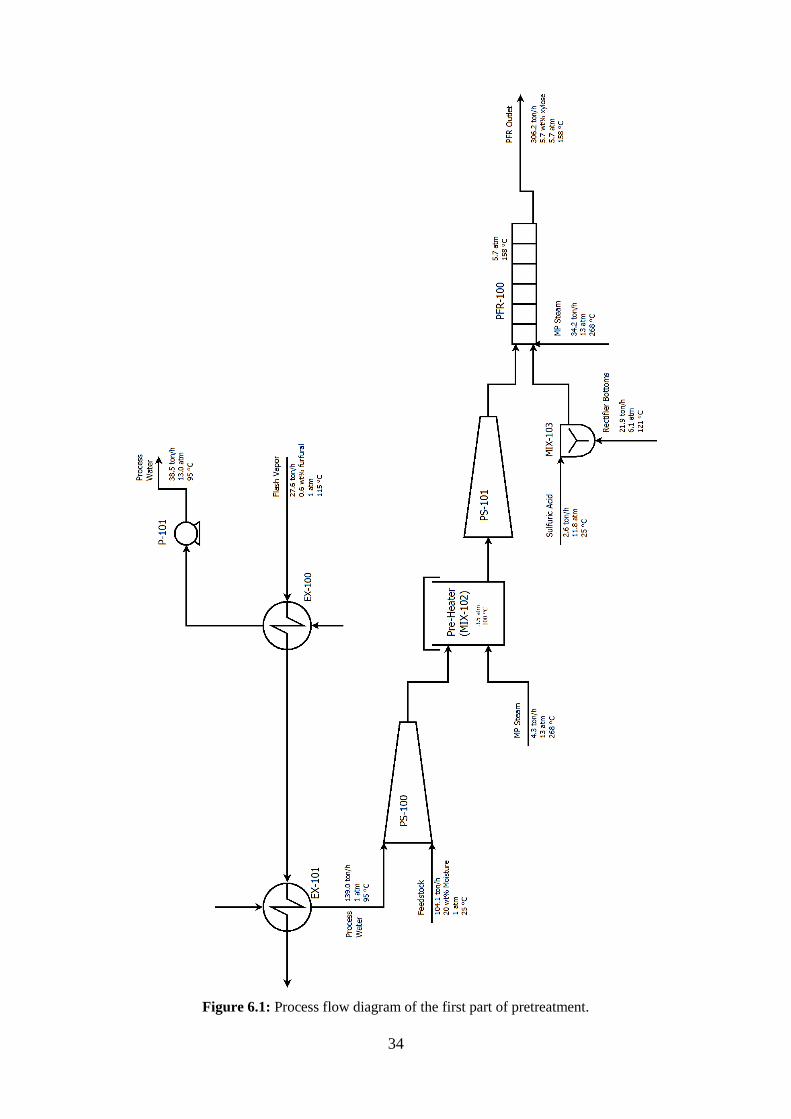
Corn stover is received at a rate of 104.1 ton/h including an assumed water content of 20%.
The raw material is mixed with heated process water to a total solid loading of 34%. It is then
fed to a plug screw feeder (PS-100), where the pressure is increased to 3.5 atm, and the raw
material is physically processed. The plug screw is modeled as a liquid pump, with a specified
adiabatic efficiency of 1.0%. The efficiency is back calculated from the NREL design, based
on the given pressure difference and energy input. The low efficiency is explained by the high
amount of solid matter in the stream. The resulting “mash” is fed into a preheater (MIX-102),
where it is heated to 100 °C with direct steam injection. This is to ensure efficient mixing of
the acid for pretreatment, and a more homogenous treatment. It is assumed that the preheater
only affect physical attributes of the raw material, therefore there is no explicit modeling of
the tank. The preheated mash is then fed to a second plug screw feeder (PS-101), raising the
pressure to 6.1 atm. Sulfuric acid is mixed in at the reactor inlet. A better solution could be to
mix at the discharge of the second plug screw to allow for better mixing, but this makes no
difference with regards to modeling.
34
Figure 6.1: Process flow diagram of the first part of pretreatment.
35
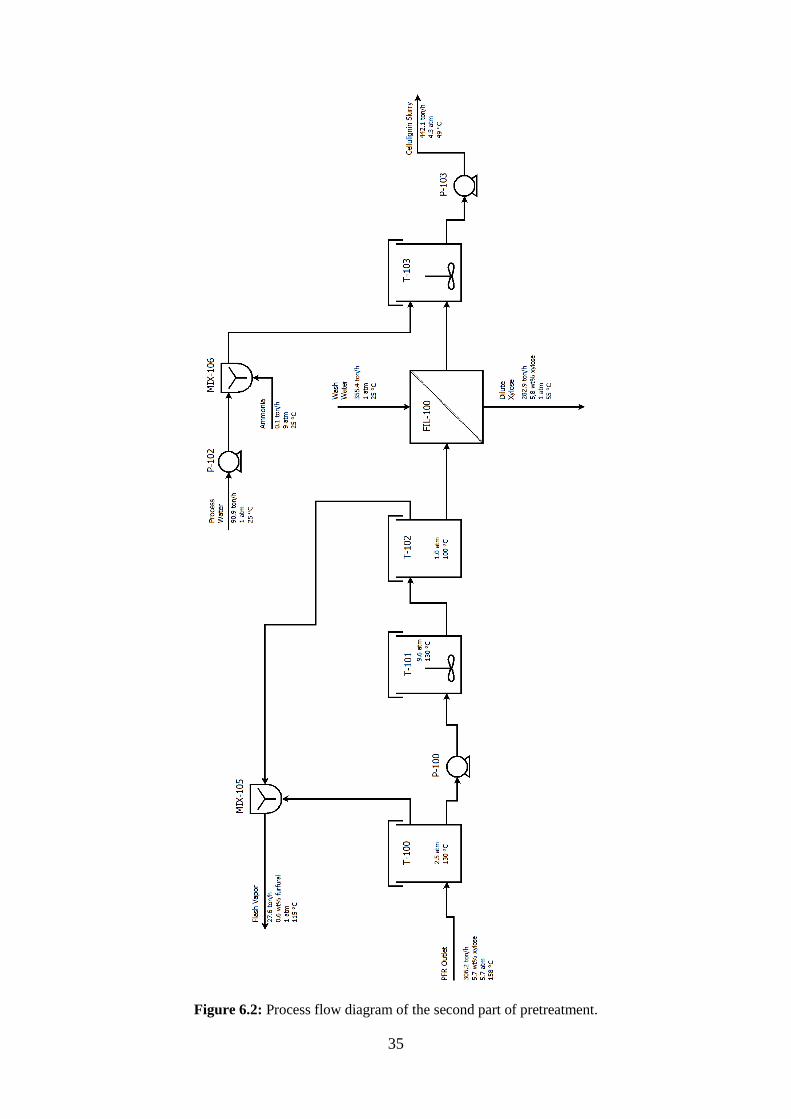
Figure 6.2: Process flow diagram of the second part of pretreatment.
36
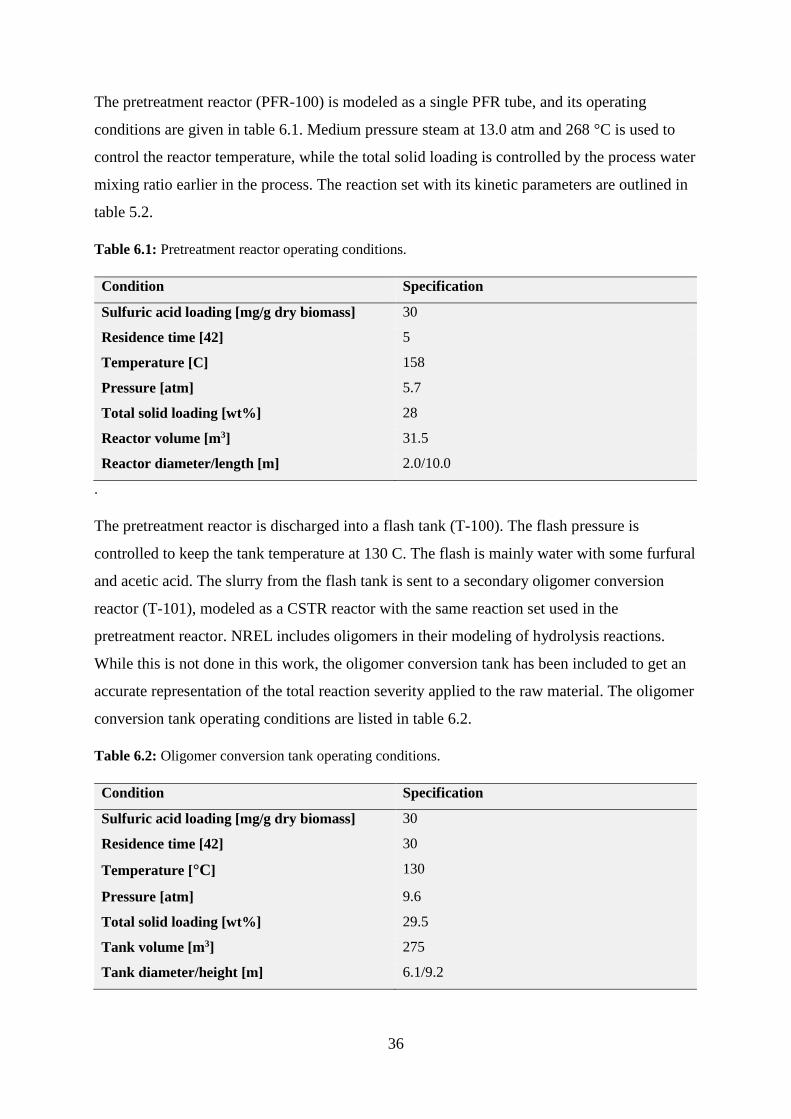
The pretreatment reactor (PFR-100) is modeled as a single PFR tube, and its operating
conditions are given in table 6.1. Medium pressure steam at 13.0 atm and 268 °C is used to
control the reactor temperature, while the total solid loading is controlled by the process water
mixing ratio earlier in the process. The reaction set with its kinetic parameters are outlined in
table 5.2.
Table 6.1: Pretreatment reactor operating conditions.
Condition Specification
Sulfuric acid loading [mg/g dry biomass] 30
Residence time [42] 5
Temperature [C] 158
Pressure [atm] 5.7
Total solid loading [wt%] 28
Reactor volume [m3] 31.5
Reactor diameter/length [m] 2.0/10.0
.
The pretreatment reactor is discharged into a flash tank (T-100). The flash pressure is
controlled to keep the tank temperature at 130 C. The flash is mainly water with some furfural
and acetic acid. The slurry from the flash tank is sent to a secondary oligomer conversion
reactor (T-101), modeled as a CSTR reactor with the same reaction set used in the
pretreatment reactor. NREL includes oligomers in their modeling of hydrolysis reactions.
While this is not done in this work, the oligomer conversion tank has been included to get an
accurate representation of the total reaction severity applied to the raw material. The oligomer
conversion tank operating conditions are listed in table 6.2.
Table 6.2: Oligomer conversion tank operating conditions.
Condition Specification
Sulfuric acid loading [mg/g dry biomass] 30
Residence time [42] 30
Temperature [°C] 130
Pressure [atm] 9.6
Total solid loading [wt%] 29.5
Tank volume [m3] 275
Tank diameter/height [m] 6.1/9.2
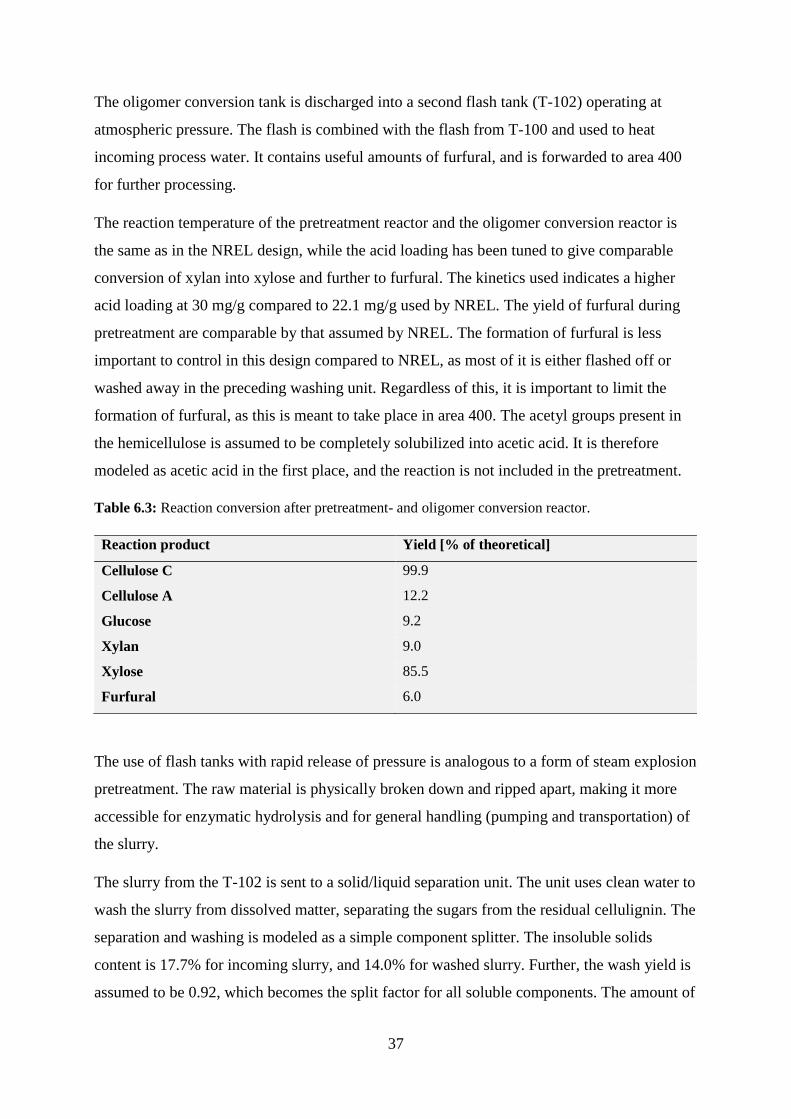
37
The oligomer conversion tank is discharged into a second flash tank (T-102) operating at
atmospheric pressure. The flash is combined with the flash from T-100 and used to heat
incoming process water. It contains useful amounts of furfural, and is forwarded to area 400
for further processing.
The reaction temperature of the pretreatment reactor and the oligomer conversion reactor is
the same as in the NREL design, while the acid loading has been tuned to give comparable
conversion of xylan into xylose and further to furfural. The kinetics used indicates a higher
acid loading at 30 mg/g compared to 22.1 mg/g used by NREL. The yield of furfural during
pretreatment are comparable by that assumed by NREL. The formation of furfural is less
important to control in this design compared to NREL, as most of it is either flashed off or
washed away in the preceding washing unit. Regardless of this, it is important to limit the
formation of furfural, as this is meant to take place in area 400. The acetyl groups present in
the hemicellulose is assumed to be completely solubilized into acetic acid. It is therefore
modeled as acetic acid in the first place, and the reaction is not included in the pretreatment.
Table 6.3: Reaction conversion after pretreatment- and oligomer conversion reactor.
Reaction product Yield [% of theoretical]
Cellulose C 99.9
Cellulose A 12.2
Glucose 9.2
Xylan 9.0
Xylose 85.5
Furfural 6.0
The use of flash tanks with rapid release of pressure is analogous to a form of steam explosion
pretreatment. The raw material is physically broken down and ripped apart, making it more
accessible for enzymatic hydrolysis and for general handling (pumping and transportation) of
the slurry.
The slurry from the T-102 is sent to a solid/liquid separation unit. The unit uses clean water to
wash the slurry from dissolved matter, separating the sugars from the residual cellulignin. The
separation and washing is modeled as a simple component splitter. The insoluble solids
content is 17.7% for incoming slurry, and 14.0% for washed slurry. Further, the wash yield is
assumed to be 0.92, which becomes the split factor for all soluble components. The amount of
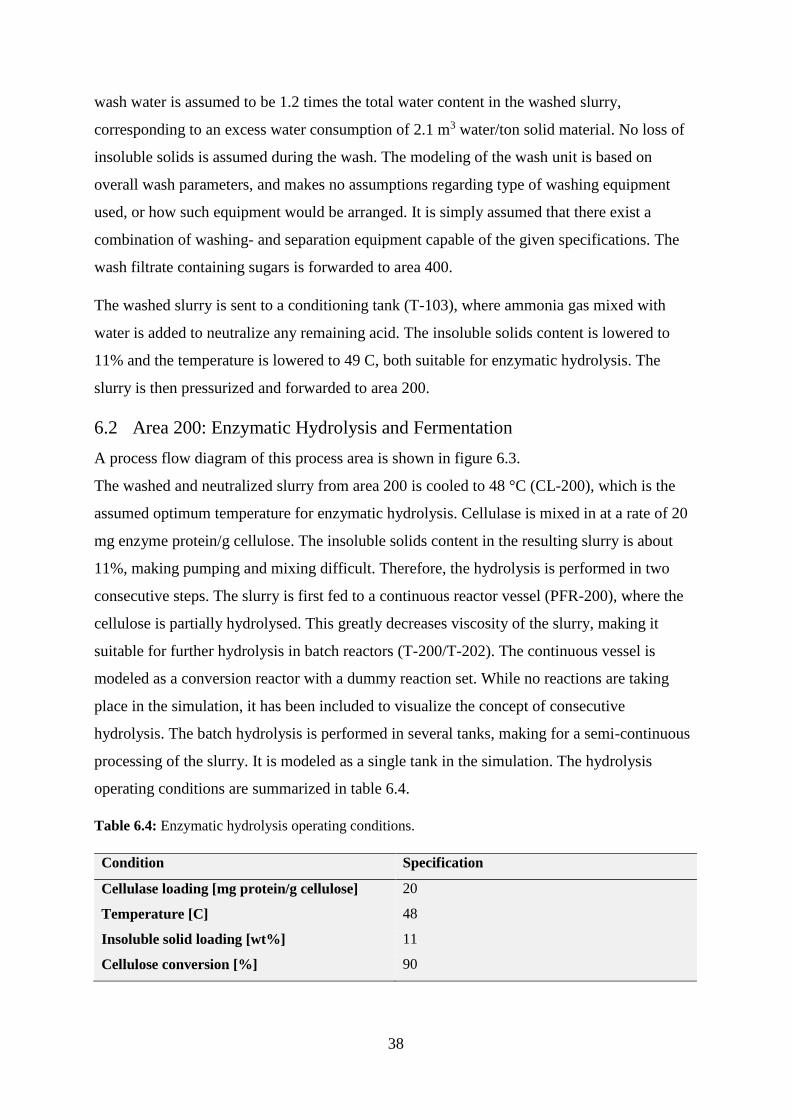
38
wash water is assumed to be 1.2 times the total water content in the washed slurry,
corresponding to an excess water consumption of 2.1 m3 water/ton solid material. No loss of
insoluble solids is assumed during the wash. The modeling of the wash unit is based on
overall wash parameters, and makes no assumptions regarding type of washing equipment
used, or how such equipment would be arranged. It is simply assumed that there exist a
combination of washing- and separation equipment capable of the given specifications. The
wash filtrate containing sugars is forwarded to area 400.
The washed slurry is sent to a conditioning tank (T-103), where ammonia gas mixed with
water is added to neutralize any remaining acid. The insoluble solids content is lowered to
11% and the temperature is lowered to 49 C, both suitable for enzymatic hydrolysis. The
slurry is then pressurized and forwarded to area 200.
6.2 Area 200: Enzymatic Hydrolysis and Fermentation
A process flow diagram of this process area is shown in figure 6.3.
The washed and neutralized slurry from area 200 is cooled to 48 °C (CL-200), which is the
assumed optimum temperature for enzymatic hydrolysis. Cellulase is mixed in at a rate of 20
mg enzyme protein/g cellulose. The insoluble solids content in the resulting slurry is about
11%, making pumping and mixing difficult. Therefore, the hydrolysis is performed in two
consecutive steps. The slurry is first fed to a continuous reactor vessel (PFR-200), where the
cellulose is partially hydrolysed. This greatly decreases viscosity of the slurry, making it
suitable for further hydrolysis in batch reactors (T-200/T-202). The continuous vessel is
modeled as a conversion reactor with a dummy reaction set. While no reactions are taking
place in the simulation, it has been included to visualize the concept of consecutive
hydrolysis. The batch hydrolysis is performed in several tanks, making for a semi-continuous
processing of the slurry. It is modeled as a single tank in the simulation. The hydrolysis
operating conditions are summarized in table 6.4.
Table 6.4: Enzymatic hydrolysis operating conditions.
Condition Specification
Cellulase loading [mg protein/g cellulose] 20
Temperature [C] 48
Insoluble solid loading [wt%] 11
Cellulose conversion [%] 90
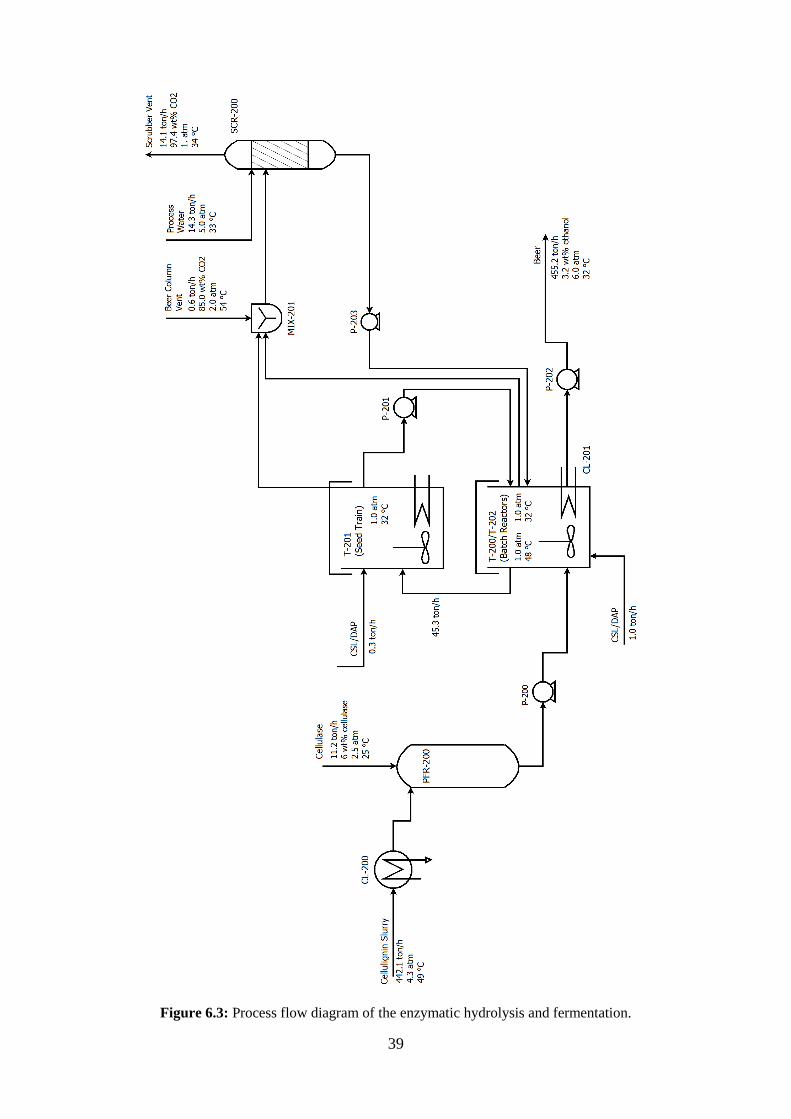
39
Figure 6.3: Process flow diagram of the enzymatic hydrolysis and fermentation.
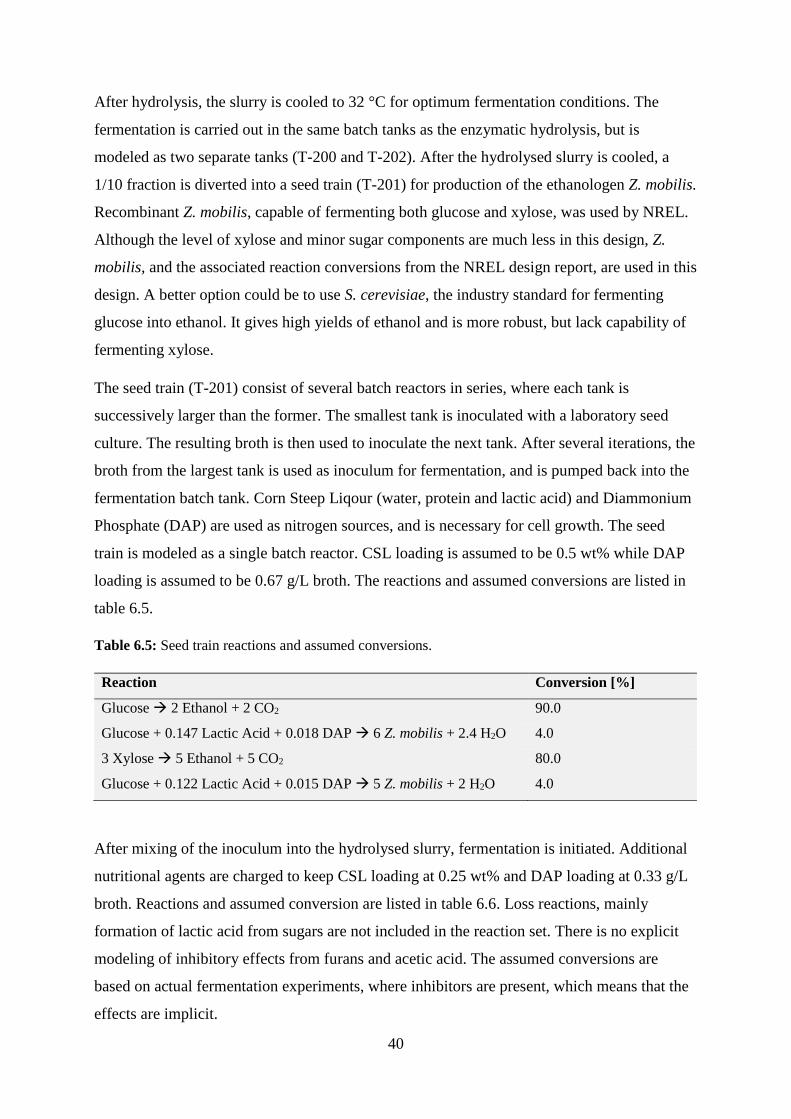
40
After hydrolysis, the slurry is cooled to 32 °C for optimum fermentation conditions. The
fermentation is carried out in the same batch tanks as the enzymatic hydrolysis, but is
modeled as two separate tanks (T-200 and T-202). After the hydrolysed slurry is cooled, a
1/10 fraction is diverted into a seed train (T-201) for production of the ethanologen Z. mobilis.
Recombinant Z. mobilis, capable of fermenting both glucose and xylose, was used by NREL.
Although the level of xylose and minor sugar components are much less in this design, Z.
mobilis, and the associated reaction conversions from the NREL design report, are used in this
design. A better option could be to use S. cerevisiae, the industry standard for fermenting
glucose into ethanol. It gives high yields of ethanol and is more robust, but lack capability of
fermenting xylose.
The seed train (T-201) consist of several batch reactors in series, where each tank is
successively larger than the former. The smallest tank is inoculated with a laboratory seed
culture. The resulting broth is then used to inoculate the next tank. After several iterations, the
broth from the largest tank is used as inoculum for fermentation, and is pumped back into the
fermentation batch tank. Corn Steep Liqour (water, protein and lactic acid) and Diammonium
Phosphate (DAP) are used as nitrogen sources, and is necessary for cell growth. The seed
train is modeled as a single batch reactor. CSL loading is assumed to be 0.5 wt% while DAP
loading is assumed to be 0.67 g/L broth. The reactions and assumed conversions are listed in
table 6.5.
Table 6.5: Seed train reactions and assumed conversions.
Reaction Conversion [%]
Glucose 2 Ethanol + 2 CO2 90.0
Glucose + 0.147 Lactic Acid + 0.018 DAP 6 Z. mobilis + 2.4 H2O 4.0
3 Xylose 5 Ethanol + 5 CO2 80.0
Glucose + 0.122 Lactic Acid + 0.015 DAP 5 Z. mobilis + 2 H2O 4.0
After mixing of the inoculum into the hydrolysed slurry, fermentation is initiated. Additional
nutritional agents are charged to keep CSL loading at 0.25 wt% and DAP loading at 0.33 g/L
broth. Reactions and assumed conversion are listed in table 6.6. Loss reactions, mainly
formation of lactic acid from sugars are not included in the reaction set. There is no explicit
modeling of inhibitory effects from furans and acetic acid. The assumed conversions are
based on actual fermentation experiments, where inhibitors are present, which means that the
effects are implicit.
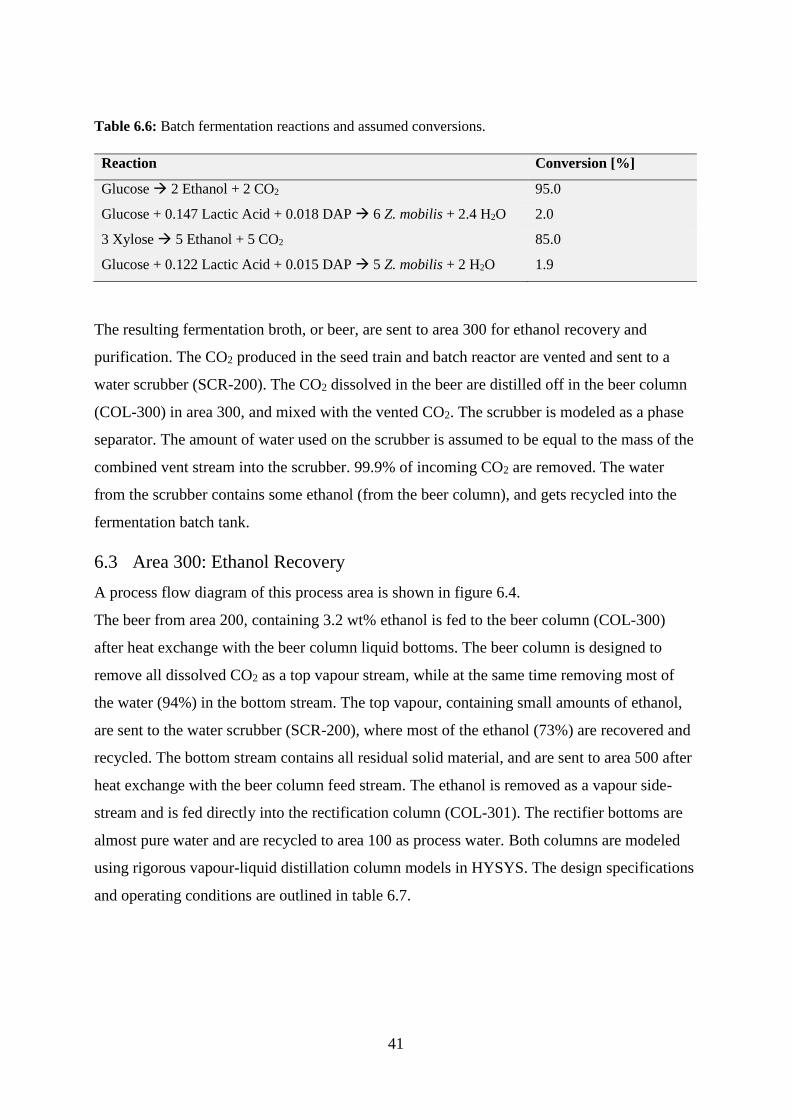
41
Table 6.6: Batch fermentation reactions and assumed conversions.
Reaction Conversion [%]
Glucose 2 Ethanol + 2 CO2 95.0
Glucose + 0.147 Lactic Acid + 0.018 DAP 6 Z. mobilis + 2.4 H2O 2.0
3 Xylose 5 Ethanol + 5 CO2 85.0
Glucose + 0.122 Lactic Acid + 0.015 DAP 5 Z. mobilis + 2 H2O 1.9
The resulting fermentation broth, or beer, are sent to area 300 for ethanol recovery and
purification. The CO2 produced in the seed train and batch reactor are vented and sent to a
water scrubber (SCR-200). The CO2 dissolved in the beer are distilled off in the beer column
(COL-300) in area 300, and mixed with the vented CO2. The scrubber is modeled as a phase
separator. The amount of water used on the scrubber is assumed to be equal to the mass of the
combined vent stream into the scrubber. 99.9% of incoming CO2 are removed. The water
from the scrubber contains some ethanol (from the beer column), and gets recycled into the
fermentation batch tank.
6.3 Area 300: Ethanol Recovery
A process flow diagram of this process area is shown in figure 6.4.
The beer from area 200, containing 3.2 wt% ethanol is fed to the beer column (COL-300)
after heat exchange with the beer column liquid bottoms. The beer column is designed to
remove all dissolved CO2 as a top vapour stream, while at the same time removing most of
the water (94%) in the bottom stream. The top vapour, containing small amounts of ethanol,
are sent to the water scrubber (SCR-200), where most of the ethanol (73%) are recovered and
recycled. The bottom stream contains all residual solid material, and are sent to area 500 after
heat exchange with the beer column feed stream. The ethanol is removed as a vapour side-
stream and is fed directly into the rectification column (COL-301). The rectifier bottoms are
almost pure water and are recycled to area 100 as process water. Both columns are modeled
using rigorous vapour-liquid distillation column models in HYSYS. The design specifications
and operating conditions are outlined in table 6.7.
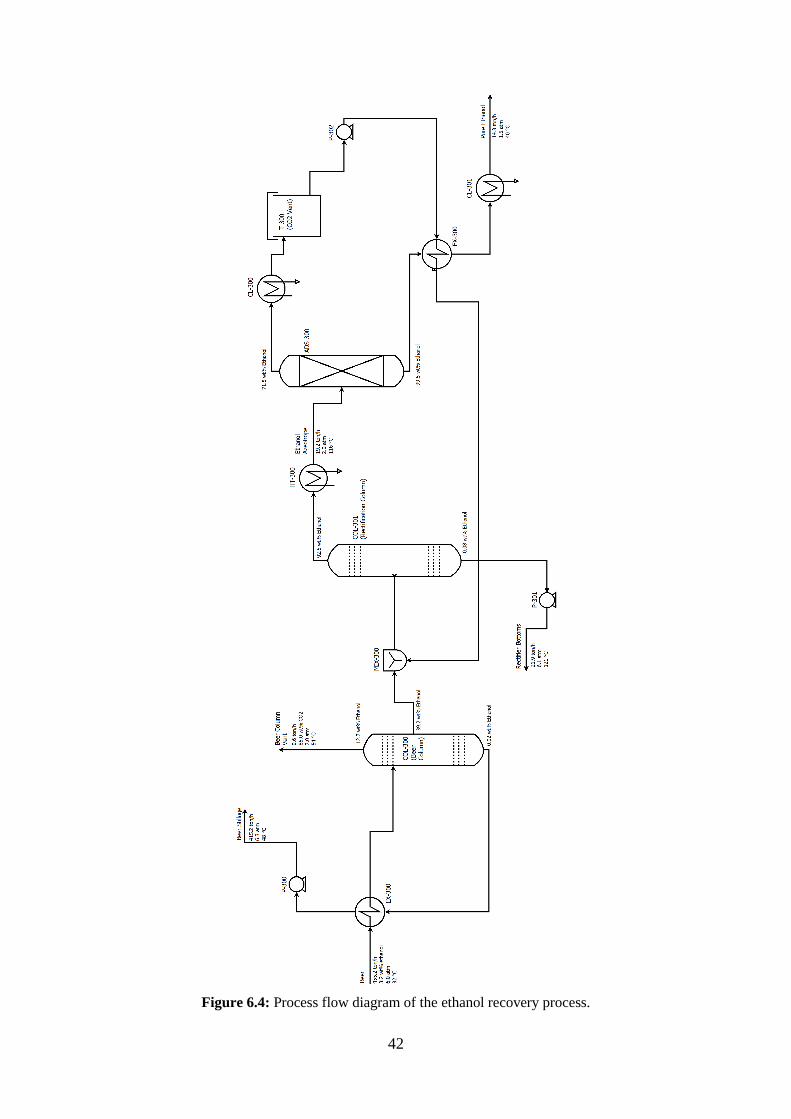
42
Figure 6.4: Process flow diagram of the ethanol recovery process.
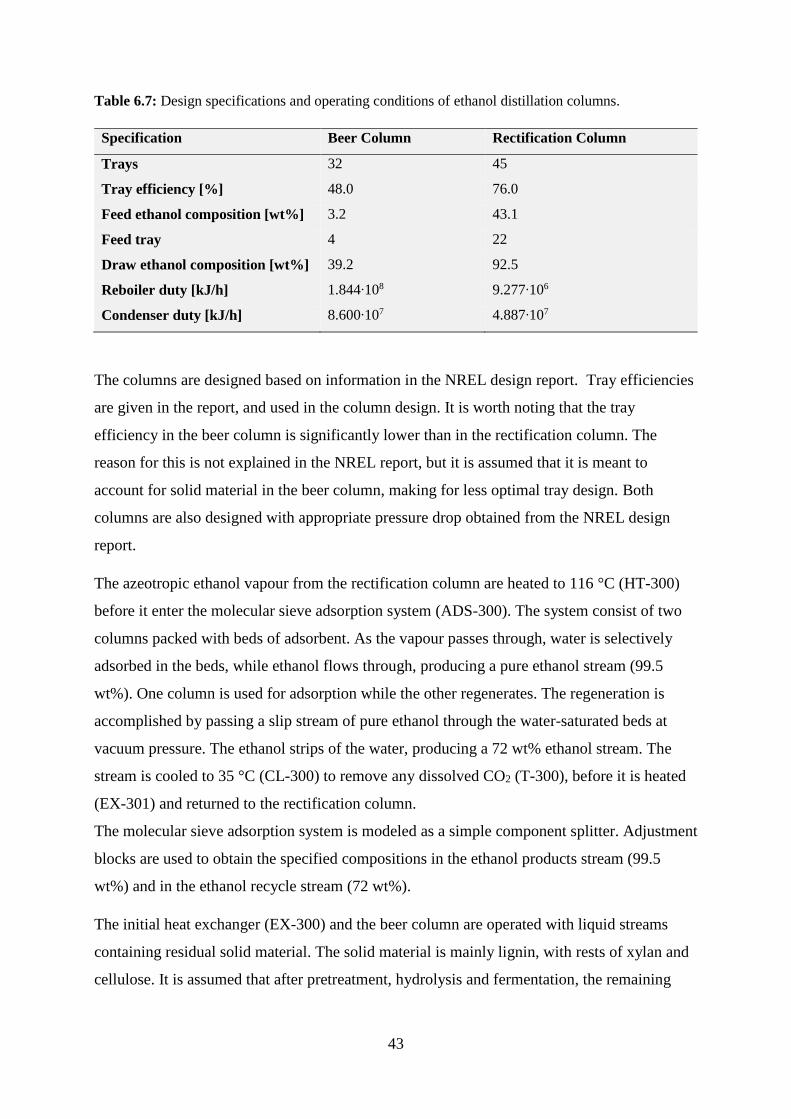
43
Table 6.7: Design specifications and operating conditions of ethanol distillation columns.
Specification Beer Column Rectification Column
Trays 32 45
Tray efficiency [%] 48.0 76.0
Feed ethanol composition [wt%] 3.2 43.1
Feed tray 4 22
Draw ethanol composition [wt%] 39.2 92.5
Reboiler duty [kJ/h] 1.844∙108 9.277∙106
Condenser duty [kJ/h] 8.600∙107 4.887∙107
The columns are designed based on information in the NREL design report. Tray efficiencies
are given in the report, and used in the column design. It is worth noting that the tray
efficiency in the beer column is significantly lower than in the rectification column. The
reason for this is not explained in the NREL report, but it is assumed that it is meant to
account for solid material in the beer column, making for less optimal tray design. Both
columns are also designed with appropriate pressure drop obtained from the NREL design
report.
The azeotropic ethanol vapour from the rectification column are heated to 116 °C (HT-300)
before it enter the molecular sieve adsorption system (ADS-300). The system consist of two
columns packed with beds of adsorbent. As the vapour passes through, water is selectively
adsorbed in the beds, while ethanol flows through, producing a pure ethanol stream (99.5
wt%). One column is used for adsorption while the other regenerates. The regeneration is
accomplished by passing a slip stream of pure ethanol through the water-saturated beds at
vacuum pressure. The ethanol strips of the water, producing a 72 wt% ethanol stream. The
stream is cooled to 35 °C (CL-300) to remove any dissolved CO2 (T-300), before it is heated
(EX-301) and returned to the rectification column.
The molecular sieve adsorption system is modeled as a simple component splitter. Adjustment
blocks are used to obtain the specified compositions in the ethanol products stream (99.5
wt%) and in the ethanol recycle stream (72 wt%).
The initial heat exchanger (EX-300) and the beer column are operated with liquid streams
containing residual solid material. The solid material is mainly lignin, with rests of xylan and
cellulose. It is assumed that after pretreatment, hydrolysis and fermentation, the remaining
44
solid is highly porous. In addition, the insoluble solids content is no more than 4 wt%, and
nominal liquid flow is assumed.
6.4 Area 400: Furfural Production and Recovery
Process flow diagrams of the furfural production and recovery process are shown in figure 6.5
and 6.6 respectively.
Xylose (5.8 wt%) is pressurized to 15.6 atm and heated to 187 °C (EX-400). The pre-heated
xylose stream is mixed with a reactor recycle stream before heated to the final reactor feed
temperature of 201 °C (HT-400), just under the bubble point. The reactor feed enters the
reactive distillation column (COL-400) at the top tray.
The column is modeled as a rigorous vapour-liquid distillation column with a specified
reaction set. The reaction set includes the acid catalyzed reaction of xylose into furfural, and
glucose into levulinic acid and formic acid. The reaction kinetics are given in table 5.2. As
furfural is formed by xylose dehydration, it immediately vapourizes. As it joins the vapour
up-flow, it is no longer in contact with the reactive acidic phase, motivating the exclusion of
all furfural loss reactions.
Furfural is drawn as a 5.0 wt% vapour stream at the column top. The dilute furfural is
pressurized to 19.7 atm (COMP-400), and is heat exchanged in the column reboiler. The
energy invested in compressing the top vapour is small (~ 3%) compared to column reboiler
duty. The remaining vapour is condensed in EX-400, where the pressure is lowered to
atmospheric pressure. Further, the column bottom stream is controlled by the furfural
concentration in the column top vapour. The bottom and top stream is almost equal in this
design. The bottom is split (SPLIT-400) in a recycle stream and a wastewater stream. The
recycle ratio is set to give a column acid loading of 1.75 wt%, which is appropriate for
furfural production. Marcotullio [4] suggested the use of halide salts such as NaCl or KCl for
increased selectivity in furfural formation. As the reaction kinetics do not reflect the use of
such salts, the addition of such compounds is excluded from the simulation.
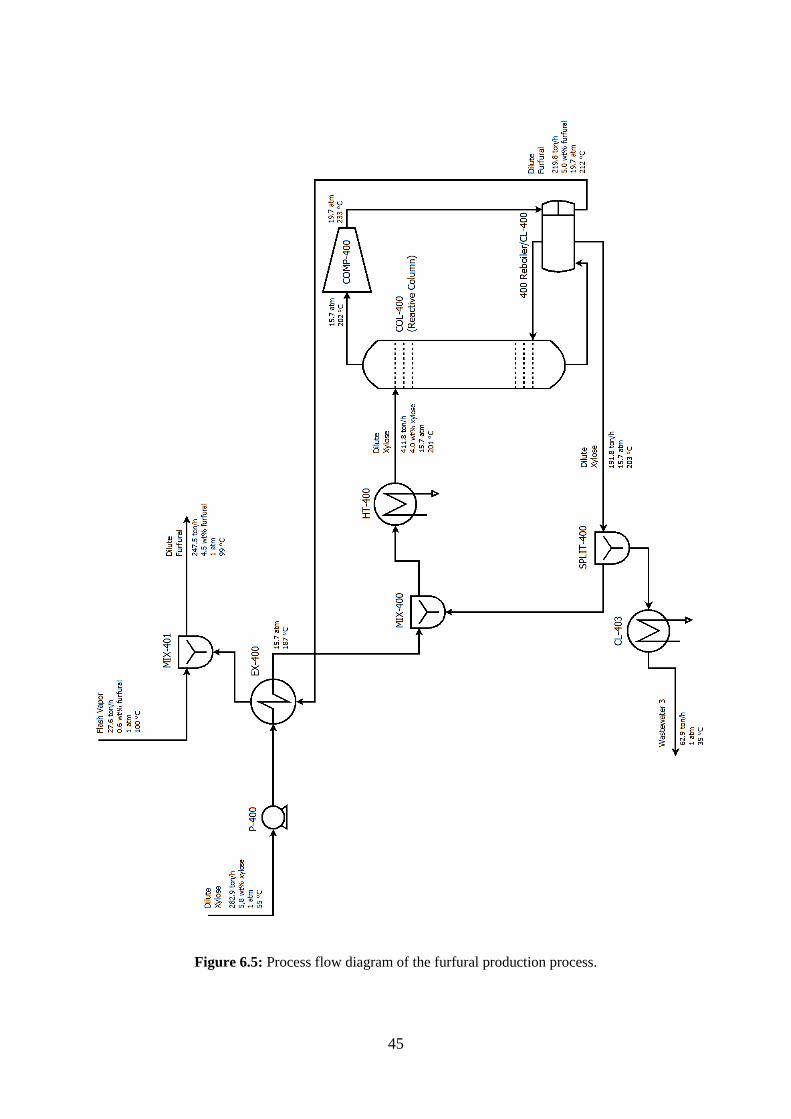
45
Figure 6.5: Process flow diagram of the furfural production process.
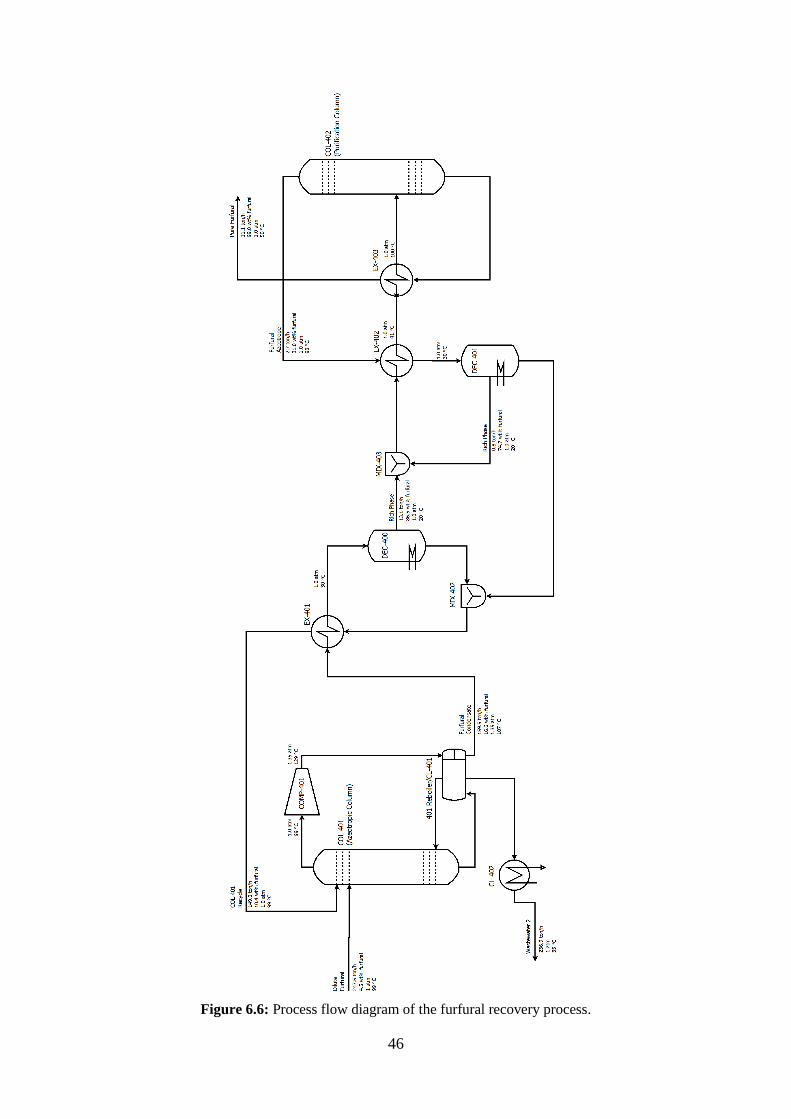
46
Figure 6.6: Process flow diagram of the furfural recovery process.
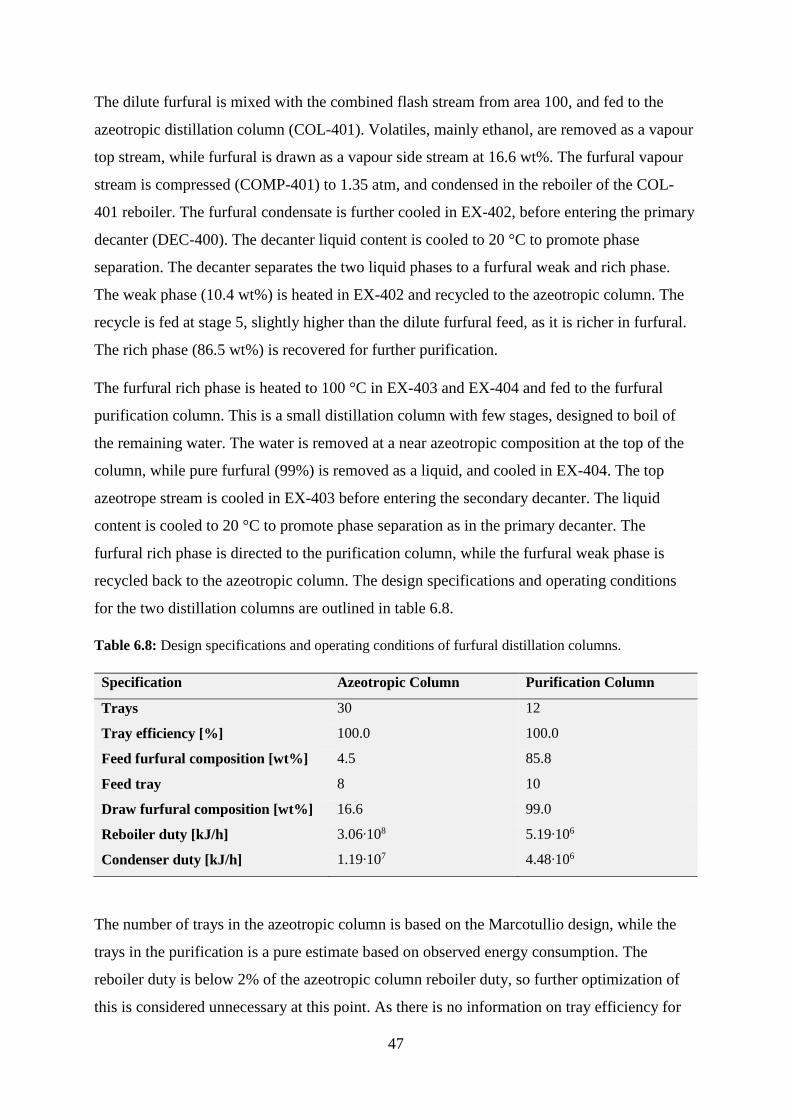
47
The dilute furfural is mixed with the combined flash stream from area 100, and fed to the
azeotropic distillation column (COL-401). Volatiles, mainly ethanol, are removed as a vapour
top stream, while furfural is drawn as a vapour side stream at 16.6 wt%. The furfural vapour
stream is compressed (COMP-401) to 1.35 atm, and condensed in the reboiler of the COL-
401 reboiler. The furfural condensate is further cooled in EX-402, before entering the primary
decanter (DEC-400). The decanter liquid content is cooled to 20 °C to promote phase
separation. The decanter separates the two liquid phases to a furfural weak and rich phase.
The weak phase (10.4 wt%) is heated in EX-402 and recycled to the azeotropic column. The
recycle is fed at stage 5, slightly higher than the dilute furfural feed, as it is richer in furfural.
The rich phase (86.5 wt%) is recovered for further purification.
The furfural rich phase is heated to 100 °C in EX-403 and EX-404 and fed to the furfural
purification column. This is a small distillation column with few stages, designed to boil of
the remaining water. The water is removed at a near azeotropic composition at the top of the
column, while pure furfural (99%) is removed as a liquid, and cooled in EX-404. The top
azeotrope stream is cooled in EX-403 before entering the secondary decanter. The liquid
content is cooled to 20 °C to promote phase separation as in the primary decanter. The
furfural rich phase is directed to the purification column, while the furfural weak phase is
recycled back to the azeotropic column. The design specifications and operating conditions
for the two distillation columns are outlined in table 6.8.
Table 6.8: Design specifications and operating conditions of furfural distillation columns.
Specification Azeotropic Column Purification Column
Trays 30 12
Tray efficiency [%] 100.0 100.0
Feed furfural composition [wt%] 4.5 85.8
Feed tray 8 10
Draw furfural composition [wt%] 16.6 99.0
Reboiler duty [kJ/h] 3.06∙108 5.19∙106
Condenser duty [kJ/h] 1.19∙107 4.48∙106
The number of trays in the azeotropic column is based on the Marcotullio design, while the
trays in the purification is a pure estimate based on observed energy consumption. The
reboiler duty is below 2% of the azeotropic column reboiler duty, so further optimization of
this is considered unnecessary at this point. As there is no information on tray efficiency for
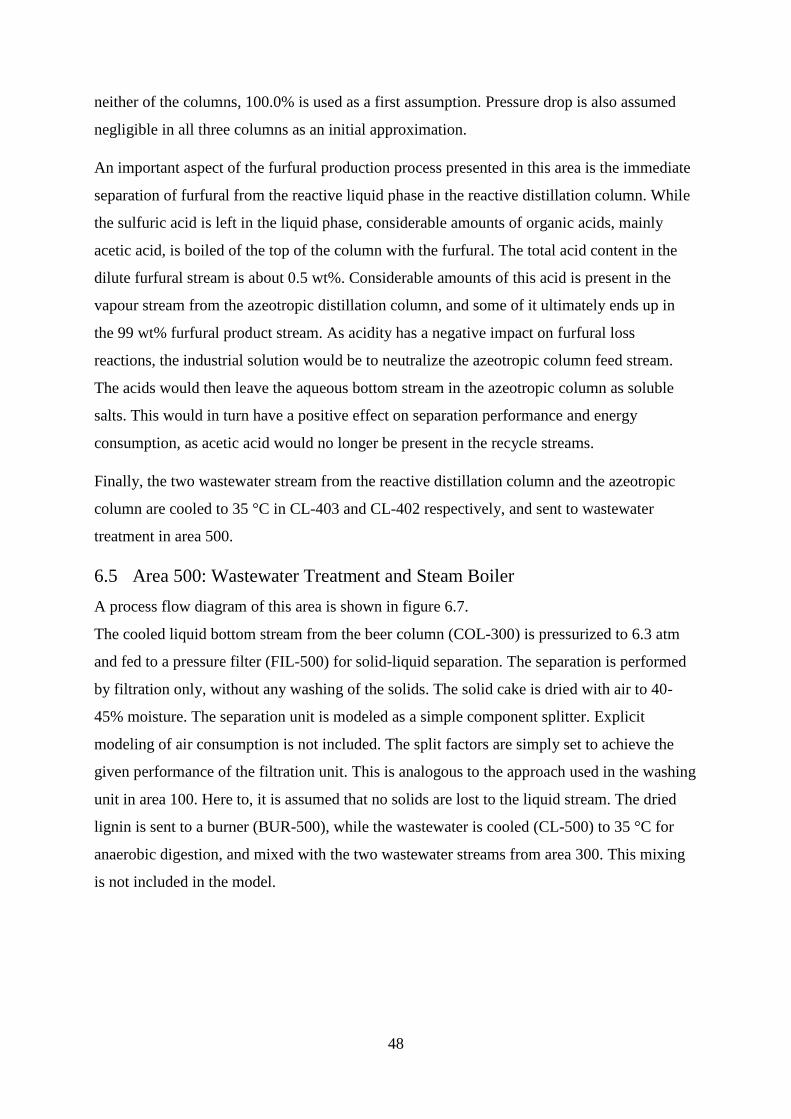
48
neither of the columns, 100.0% is used as a first assumption. Pressure drop is also assumed
negligible in all three columns as an initial approximation.
An important aspect of the furfural production process presented in this area is the immediate
separation of furfural from the reactive liquid phase in the reactive distillation column. While
the sulfuric acid is left in the liquid phase, considerable amounts of organic acids, mainly
acetic acid, is boiled of the top of the column with the furfural. The total acid content in the
dilute furfural stream is about 0.5 wt%. Considerable amounts of this acid is present in the
vapour stream from the azeotropic distillation column, and some of it ultimately ends up in
the 99 wt% furfural product stream. As acidity has a negative impact on furfural loss
reactions, the industrial solution would be to neutralize the azeotropic column feed stream.
The acids would then leave the aqueous bottom stream in the azeotropic column as soluble
salts. This would in turn have a positive effect on separation performance and energy
consumption, as acetic acid would no longer be present in the recycle streams.
Finally, the two wastewater stream from the reactive distillation column and the azeotropic
column are cooled to 35 °C in CL-403 and CL-402 respectively, and sent to wastewater
treatment in area 500.
6.5 Area 500: Wastewater Treatment and Steam Boiler
A process flow diagram of this area is shown in figure 6.7.
The cooled liquid bottom stream from the beer column (COL-300) is pressurized to 6.3 atm
and fed to a pressure filter (FIL-500) for solid-liquid separation. The separation is performed
by filtration only, without any washing of the solids. The solid cake is dried with air to 40-
45% moisture. The separation unit is modeled as a simple component splitter. Explicit
modeling of air consumption is not included. The split factors are simply set to achieve the
given performance of the filtration unit. This is analogous to the approach used in the washing
unit in area 100. Here to, it is assumed that no solids are lost to the liquid stream. The dried
lignin is sent to a burner (BUR-500), while the wastewater is cooled (CL-500) to 35 °C for
anaerobic digestion, and mixed with the two wastewater streams from area 300. This mixing
is not included in the model.
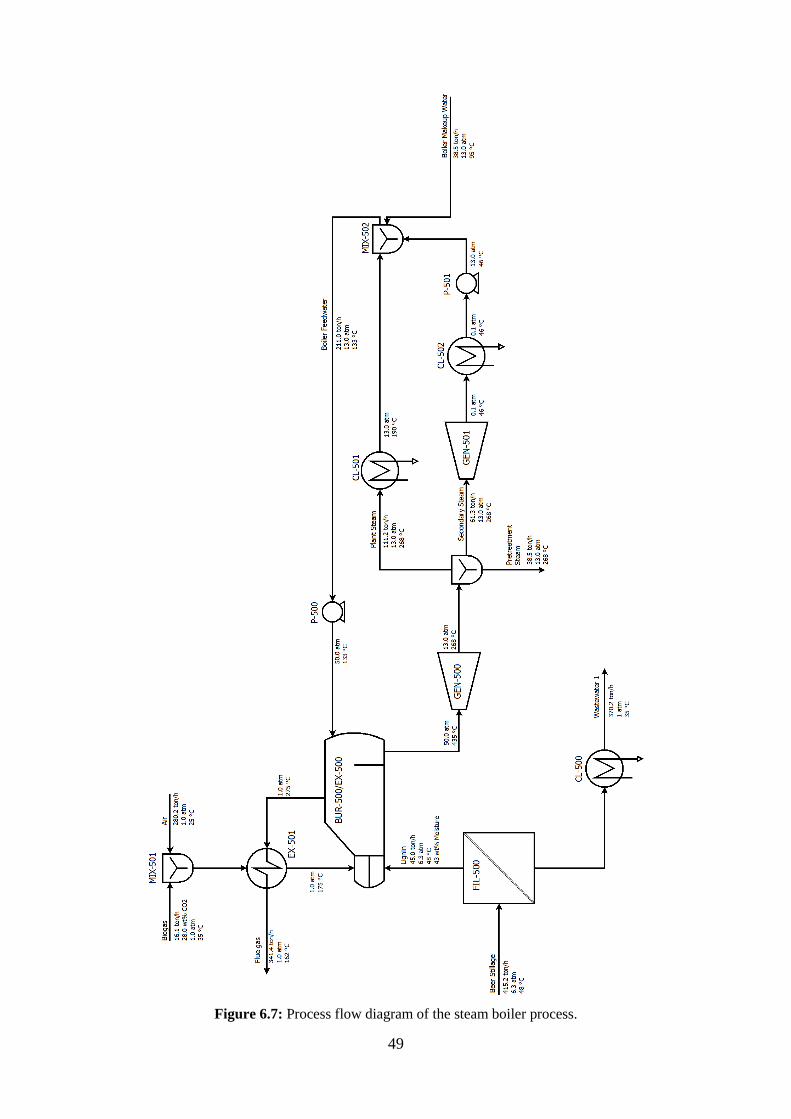
49
Figure 6.7: Process flow diagram of the steam boiler process.
50
The motivation for including treatment of wastewater is to get an estimate of the electricity
and heat that can be produced by burning lignin and methane produced by anaerobic
digestion. Therefore, a rigorous model of the actual water treatment has not been included. In
reality, wastewater treatment is a combination of anaerobic digestion, aerobic digestion,
clarification and evaporation to produce useful process water. A spreadsheet (S:Anaerobic
Digester) has been used to calculate the amount of methane and CO2 produced by anaerobic
digestion of organic material in the wastewater. The basis for the calculation is the combined
chemical oxygen demand (COD) for the organic matter present in the wastewater. COD is
defined as the oxygen needed for complete oxidation of organic material.
The methane production rate is calculated as 228 g/kg COD removed, based on design
specifications from NREL. It is assumed that 91% of the organic matter is utilized for
anaerobic digestion. CO2 is also produced at a near equimolar rate to methane, forming a 51%
methane/49% CO2 mixture on a dry molar basis.
An important aspect in anaerobic digestion is to have a reasonable concentration of organic
matter to get an efficient production of methane. The COD loading of the combined
wastewater streams for this process is in the range of 30 g/L wastewater. The loading in the
NREL wastewater treatment process is 67 g/L. 30 g/L is still sufficient for methane
production, but it is questionable if the efficiency is comparable to NREL.
The resulting methane/CO2 biogas is mixed with air, and preheated with the flue gas to about
175 °C in EX-501. It is then fed into the burner (BUR-500), where methane is burned together
with solid material from the pressure filter. The burner is modeled as a conversion reactor. All
combustible material is assumed burned with oxygen at 100.0% conversion. Excess air is used
to get an outlet temperature of 1500 C. The conversion reactor forces the use of a liquid outlet
in addition to the gas outlet. This stream mostly consist of incombustible solid ash. The two
outlet streams are combined to one stream in MIX-500, as the ash is assumed to flow with the
flue gas in a real burner. The combined flue gas is heat exchanged with high pressure steam in
a boiler (EX-500) and further cooled in EX-501. The heat transfer relative to the heat of
combustion is 84%. Choosing a lower combustion temperature would bring this closer to
80%, which is the heat transfer reported by NREL for their steam boiler.
The steam boiler is modeled as a rankine cycle consisting of the actual boiler, two steam
turbines, two steam condensers and two liquid pumps. Pre heated makeup water (95 C) is
received from area 100, and mixed with the condensed steam from the condensers. The
51
combined water is pressurized to 50.0 atm (P-500) and fed to the boiler. The boiler produces
superheated high pressure steam at 435 °C. The high pressure steam is used to drive the
primary turbine (GEN-500), which produces electricity at an assumed adiabatic efficiency of
85%. The outlet medium pressure steam is split (SPLIT-500) into three streams. Most of the
steam is used as either direct steam injection heating in area 100, or for indirect steam heating
in the plant (CL-501). The remainder is used to drive the secondary turbine (GEN-501),
which also produced electricity at an assumed adiabatic efficiency of 85%. The outlet vacuum
steam is condensed with cooling water (CL-502) and then pressurized to 13.0 atm (P-501).
The split is adjusted so that the heat of condensation of medium pressure plant steam (CL-
501) equals the heating demand, which is further discussed in chapter 7. The two generators
produces almost 30 MW electricity, which corresponds to a cycle energy efficiency of 15.6%.
The cycle is tuned towards production of high-grade medium pressure steam used for heating.
As this is considered useful energy for the plant, the combined energy efficiency exceeds
65%.

52
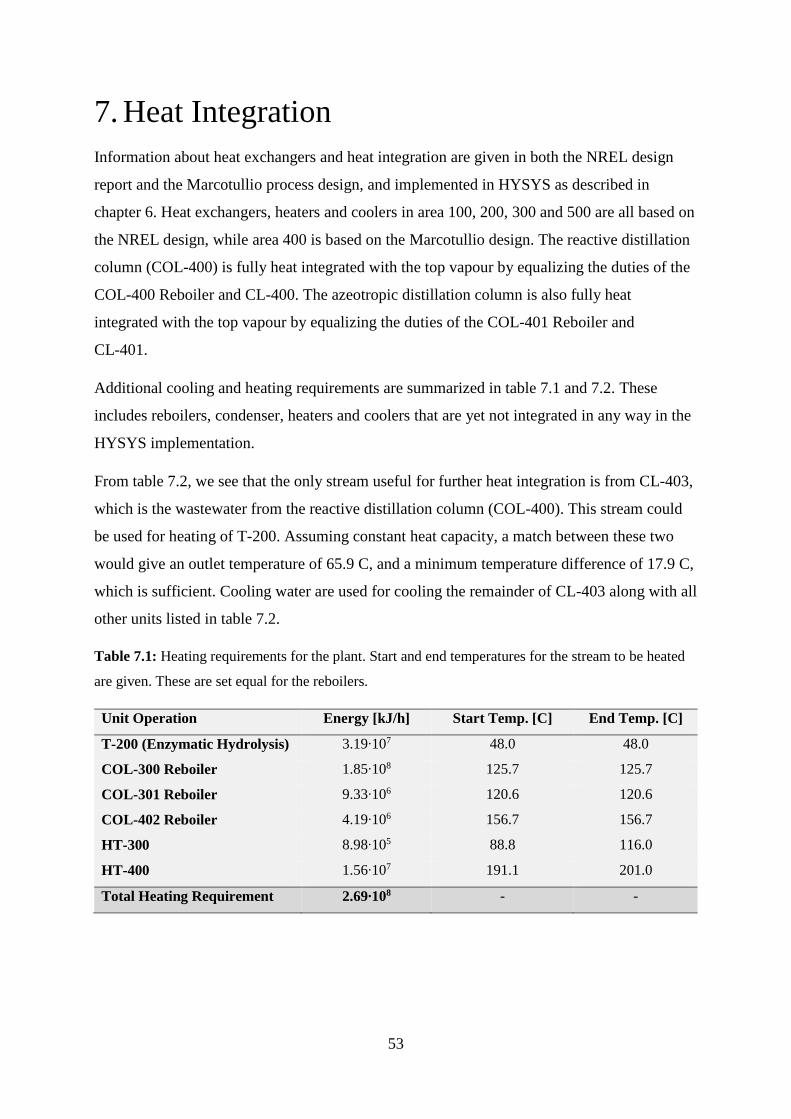
53
7. Heat Integration
Information about heat exchangers and heat integration are given in both the NREL design
report and the Marcotullio process design, and implemented in HYSYS as described in
chapter 6. Heat exchangers, heaters and coolers in area 100, 200, 300 and 500 are all based on
the NREL design, while area 400 is based on the Marcotullio design. The reactive distillation
column (COL-400) is fully heat integrated with the top vapour by equalizing the duties of the
COL-400 Reboiler and CL-400. The azeotropic distillation column is also fully heat
integrated with the top vapour by equalizing the duties of the COL-401 Reboiler and
CL-401.
Additional cooling and heating requirements are summarized in table 7.1 and 7.2. These
includes reboilers, condenser, heaters and coolers that are yet not integrated in any way in the
HYSYS implementation.
From table 7.2, we see that the only stream useful for further heat integration is from CL-403,
which is the wastewater from the reactive distillation column (COL-400). This stream could
be used for heating of T-200. Assuming constant heat capacity, a match between these two
would give an outlet temperature of 65.9 C, and a minimum temperature difference of 17.9 C,
which is sufficient. Cooling water are used for cooling the remainder of CL-403 along with all
other units listed in table 7.2.
Table 7.1: Heating requirements for the plant. Start and end temperatures for the stream to be heated
are given. These are set equal for the reboilers.
Unit Operation Energy [kJ/h] Start Temp. [C] End Temp. [C]
T-200 (Enzymatic Hydrolysis) 3.19∙107 48.0 48.0
COL-300 Reboiler 1.85∙108 125.7 125.7
COL-301 Reboiler 9.33∙106 120.6 120.6
COL-402 Reboiler 4.19∙106 156.7 156.7
HT-300 8.98∙105 88.8 116.0
HT-400 1.56∙107 191.1 201.0
Total Heating Requirement 2.69∙108 - -
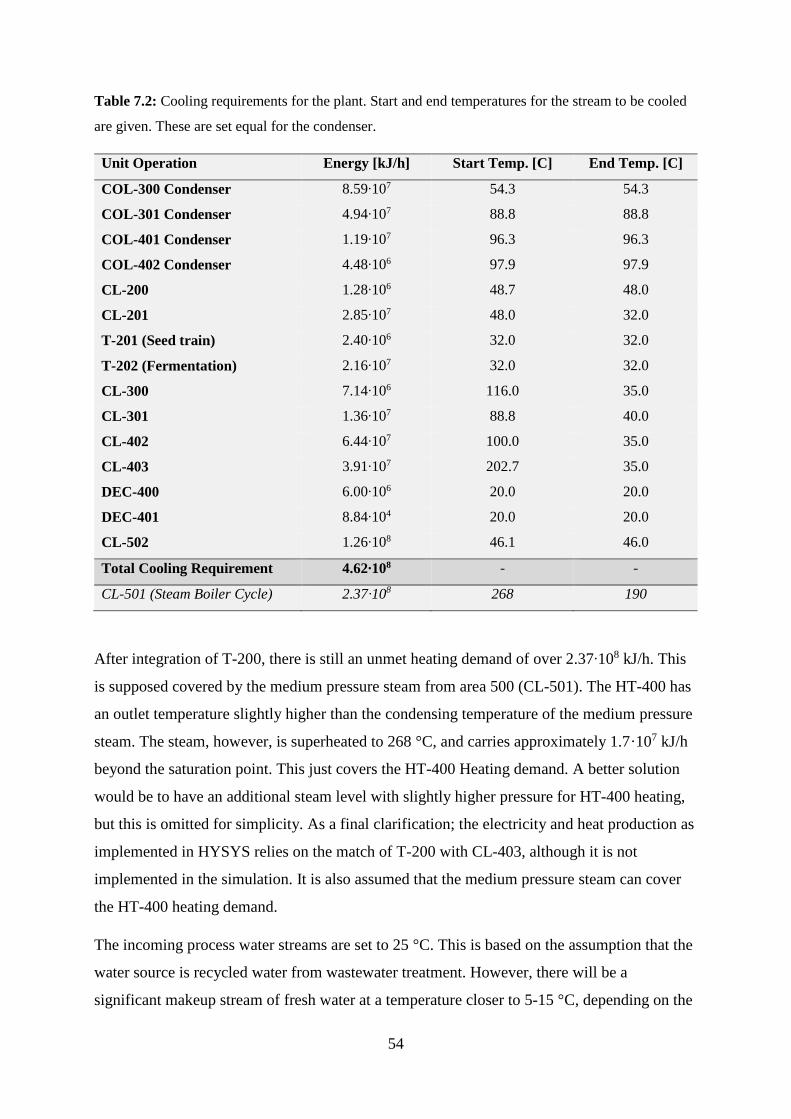
54
Table 7.2: Cooling requirements for the plant. Start and end temperatures for the stream to be cooled
are given. These are set equal for the condenser.
Unit Operation Energy [kJ/h] Start Temp. [C] End Temp. [C]
COL-300 Condenser 8.59∙107 54.3 54.3
COL-301 Condenser 4.94∙107 88.8 88.8
COL-401 Condenser 1.19∙107 96.3 96.3
COL-402 Condenser 4.48∙106 97.9 97.9
CL-200 1.28∙106 48.7 48.0
CL-201 2.85∙107 48.0 32.0
T-201 (Seed train) 2.40∙106 32.0 32.0
T-202 (Fermentation) 2.16∙107 32.0 32.0
CL-300 7.14∙106 116.0 35.0
CL-301 1.36∙107 88.8 40.0
CL-402 6.44∙107 100.0 35.0
CL-403 3.91∙107 202.7 35.0
DEC-400 6.00∙106 20.0 20.0
DEC-401 8.84∙104 20.0 20.0
CL-502 1.26∙108 46.1 46.0
Total Cooling Requirement 4.62∙108 - -
CL-501 (Steam Boiler Cycle) 2.37∙108 268 190
After integration of T-200, there is still an unmet heating demand of over 2.37∙108 kJ/h. This
is supposed covered by the medium pressure steam from area 500 (CL-501). The HT-400 has
an outlet temperature slightly higher than the condensing temperature of the medium pressure
steam. The steam, however, is superheated to 268 °C, and carries approximately 1.7·107 kJ/h
beyond the saturation point. This just covers the HT-400 Heating demand. A better solution
would be to have an additional steam level with slightly higher pressure for HT-400 heating,
but this is omitted for simplicity. As a final clarification; the electricity and heat production as
implemented in HYSYS relies on the match of T-200 with CL-403, although it is not
implemented in the simulation. It is also assumed that the medium pressure steam can cover
the HT-400 heating demand.
The incoming process water streams are set to 25 °C. This is based on the assumption that the
water source is recycled water from wastewater treatment. However, there will be a
significant makeup stream of fresh water at a temperature closer to 5-15 °C, depending on the
55
location of the plant. Initial heating of this water to 25 °C is assumed covered by the streams
mentioned in table 7.2, as the excess heat available at this temperature range is abundant.
7.1 Alternative Heat Integration
An alternative to the heat integration implemented in this design is to use medium pressure
steam produced in area 500 to heat the reactive distillation column (COL-400), and use the
top vapour from this column to heat the other column reboilers. This would eliminate the need
of compression of the column top vapour (COMP-400). However, this would require
implementation of one additional steam level in the steam boiler cycle, as the bubble point
temperature at 13.0 atm is below the reboiler temperature of the reactive column. This would
in turn decrease the electricity production from the cycle, as the pressure in the additional
steam level would be raised from 13.0 atm to about 20.0 atm. This would offset the electricity
savings of eliminating the compressor, and additional investment costs are also required. Heat
integration and energy optimization is further discussed in chapter 8.

56
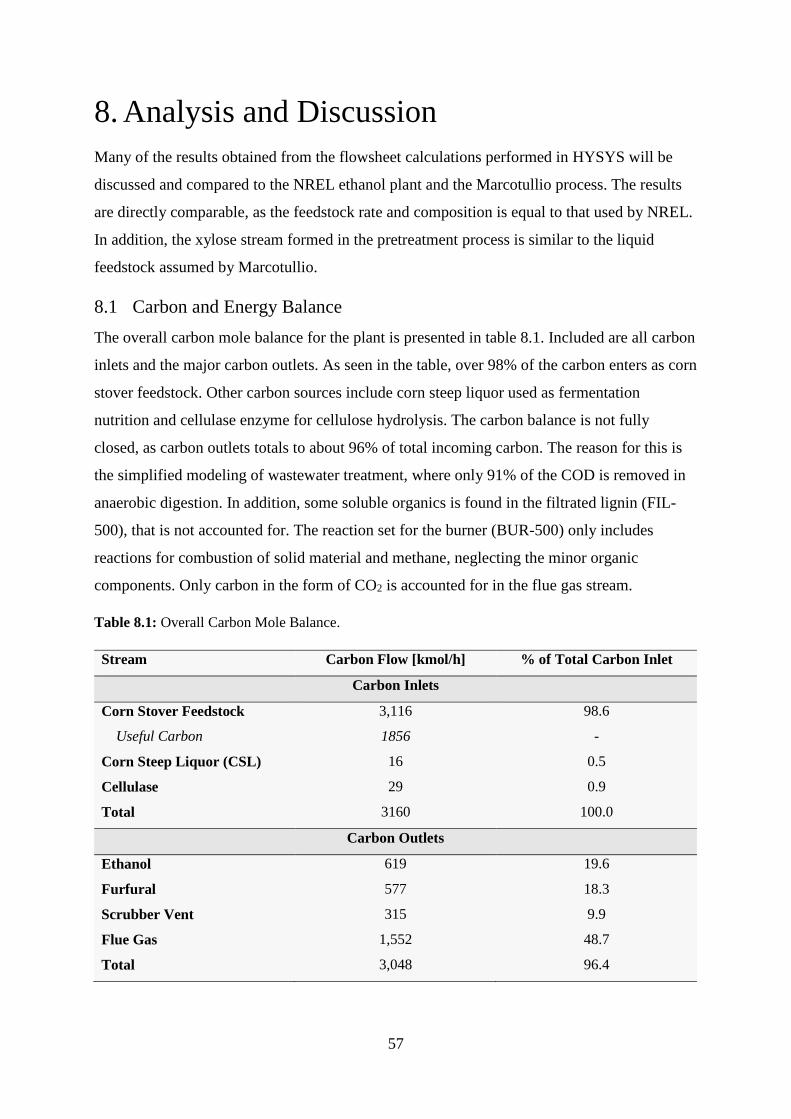
57
8. Analysis and Discussion
Many of the results obtained from the flowsheet calculations performed in HYSYS will be
discussed and compared to the NREL ethanol plant and the Marcotullio process. The results
are directly comparable, as the feedstock rate and composition is equal to that used by NREL.
In addition, the xylose stream formed in the pretreatment process is similar to the liquid
feedstock assumed by Marcotullio.
8.1 Carbon and Energy Balance
The overall carbon mole balance for the plant is presented in table 8.1. Included are all carbon
inlets and the major carbon outlets. As seen in the table, over 98% of the carbon enters as corn
stover feedstock. Other carbon sources include corn steep liquor used as fermentation
nutrition and cellulase enzyme for cellulose hydrolysis. The carbon balance is not fully
closed, as carbon outlets totals to about 96% of total incoming carbon. The reason for this is
the simplified modeling of wastewater treatment, where only 91% of the COD is removed in
anaerobic digestion. In addition, some soluble organics is found in the filtrated lignin (FIL-
500), that is not accounted for. The reaction set for the burner (BUR-500) only includes
reactions for combustion of solid material and methane, neglecting the minor organic
components. Only carbon in the form of CO2 is accounted for in the flue gas stream.
Table 8.1: Overall Carbon Mole Balance.
Stream Carbon Flow [kmol/h] % of Total Carbon Inlet
Carbon Inlets
Corn Stover Feedstock 3,116 98.6
Useful Carbon 1856 -
Corn Steep Liquor (CSL) 16 0.5
Cellulase 29 0.9
Total 3160 100.0
Carbon Outlets
Ethanol 619 19.6
Furfural 577 18.3
Scrubber Vent 315 9.9
Flue Gas 1,552 48.7
Total 3,048 96.4
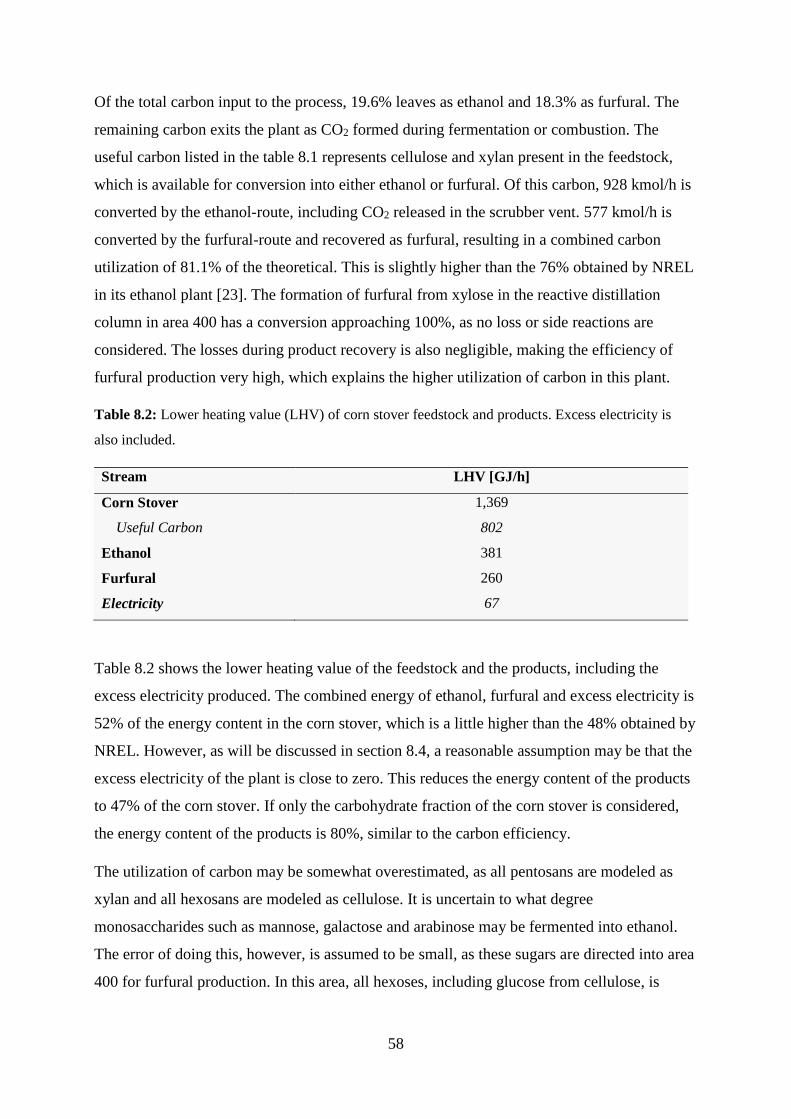
58
Of the total carbon input to the process, 19.6% leaves as ethanol and 18.3% as furfural. The
remaining carbon exits the plant as CO2 formed during fermentation or combustion. The
useful carbon listed in the table 8.1 represents cellulose and xylan present in the feedstock,
which is available for conversion into either ethanol or furfural. Of this carbon, 928 kmol/h is
converted by the ethanol-route, including CO2 released in the scrubber vent. 577 kmol/h is
converted by the furfural-route and recovered as furfural, resulting in a combined carbon
utilization of 81.1% of the theoretical. This is slightly higher than the 76% obtained by NREL
in its ethanol plant [23]. The formation of furfural from xylose in the reactive distillation
column in area 400 has a conversion approaching 100%, as no loss or side reactions are
considered. The losses during product recovery is also negligible, making the efficiency of
furfural production very high, which explains the higher utilization of carbon in this plant.
Table 8.2: Lower heating value (LHV) of corn stover feedstock and products. Excess electricity is
also included.
Stream LHV [GJ/h]
Corn Stover 1,369
Useful Carbon 802
Ethanol 381
Furfural 260
Electricity 67
Table 8.2 shows the lower heating value of the feedstock and the products, including the
excess electricity produced. The combined energy of ethanol, furfural and excess electricity is
52% of the energy content in the corn stover, which is a little higher than the 48% obtained by
NREL. However, as will be discussed in section 8.4, a reasonable assumption may be that the
excess electricity of the plant is close to zero. This reduces the energy content of the products
to 47% of the corn stover. If only the carbohydrate fraction of the corn stover is considered,
the energy content of the products is 80%, similar to the carbon efficiency.
The utilization of carbon may be somewhat overestimated, as all pentosans are modeled as
xylan and all hexosans are modeled as cellulose. It is uncertain to what degree
monosaccharides such as mannose, galactose and arabinose may be fermented into ethanol.
The error of doing this, however, is assumed to be small, as these sugars are directed into area
400 for furfural production. In this area, all hexoses, including glucose from cellulose, is
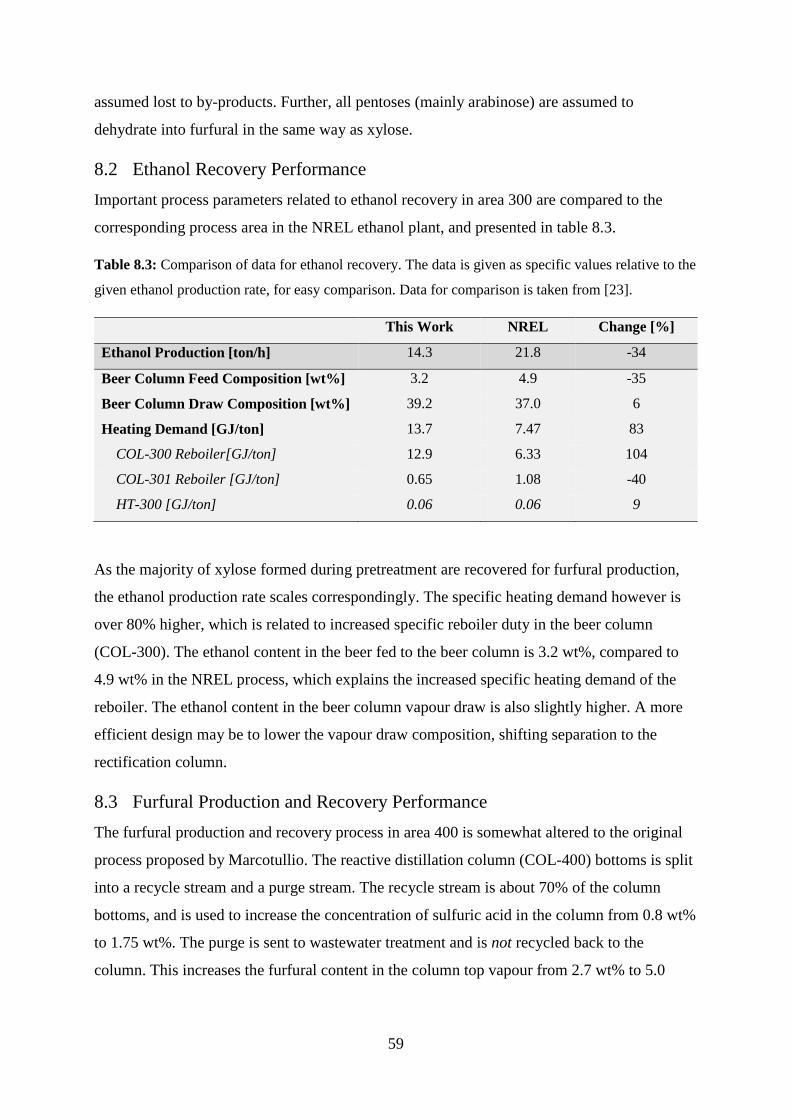
59
assumed lost to by-products. Further, all pentoses (mainly arabinose) are assumed to
dehydrate into furfural in the same way as xylose.
8.2 Ethanol Recovery Performance
Important process parameters related to ethanol recovery in area 300 are compared to the
corresponding process area in the NREL ethanol plant, and presented in table 8.3.
Table 8.3: Comparison of data for ethanol recovery. The data is given as specific values relative to the
given ethanol production rate, for easy comparison. Data for comparison is taken from [23].
This Work NREL Change [%]
Ethanol Production [ton/h] 14.3 21.8 -34
Beer Column Feed Composition [wt%] 3.2 4.9 -35
Beer Column Draw Composition [wt%] 39.2 37.0 6
Heating Demand [GJ/ton] 13.7 7.47 83
COL-300 Reboiler[GJ/ton] 12.9 6.33 104
COL-301 Reboiler [GJ/ton] 0.65 1.08 -40
HT-300 [GJ/ton] 0.06 0.06 9
As the majority of xylose formed during pretreatment are recovered for furfural production,
the ethanol production rate scales correspondingly. The specific heating demand however is
over 80% higher, which is related to increased specific reboiler duty in the beer column
(COL-300). The ethanol content in the beer fed to the beer column is 3.2 wt%, compared to
4.9 wt% in the NREL process, which explains the increased specific heating demand of the
reboiler. The ethanol content in the beer column vapour draw is also slightly higher. A more
efficient design may be to lower the vapour draw composition, shifting separation to the
rectification column.
8.3 Furfural Production and Recovery Performance
The furfural production and recovery process in area 400 is somewhat altered to the original
process proposed by Marcotullio. The reactive distillation column (COL-400) bottoms is split
into a recycle stream and a purge stream. The recycle stream is about 70% of the column
bottoms, and is used to increase the concentration of sulfuric acid in the column from 0.8 wt%
to 1.75 wt%. The purge is sent to wastewater treatment and is not recycled back to the
column. This increases the furfural content in the column top vapour from 2.7 wt% to 5.0
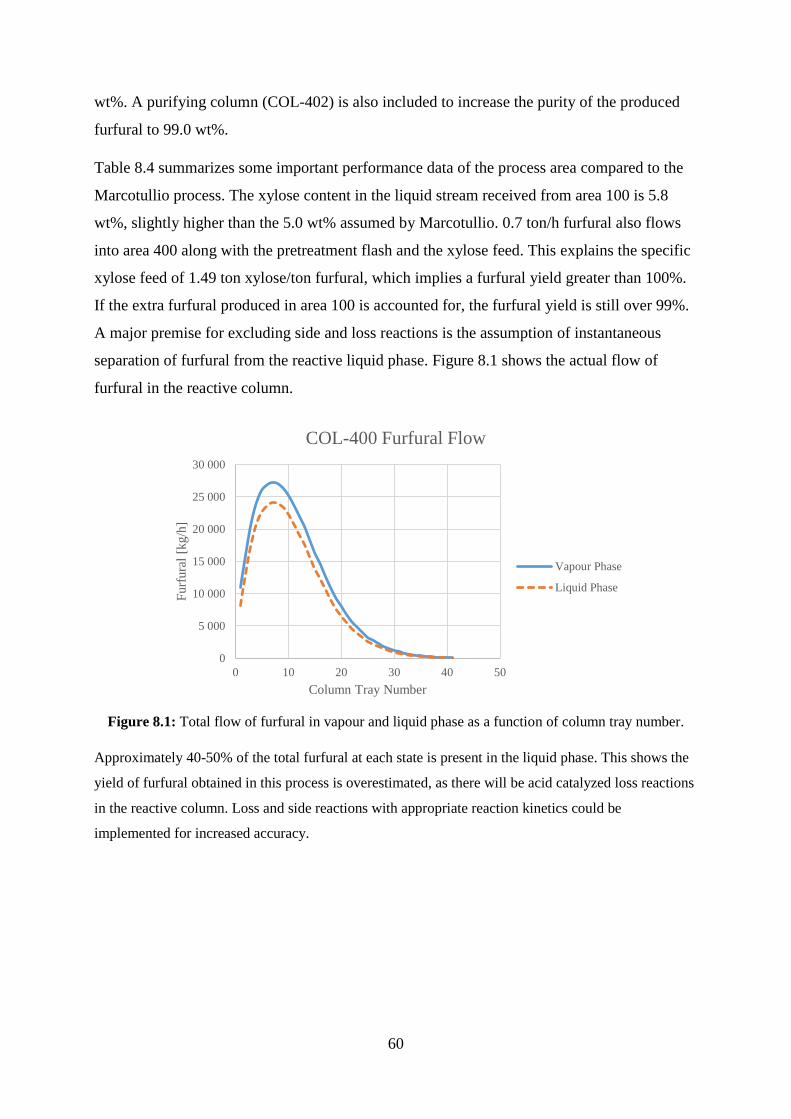
60
wt%. A purifying column (COL-402) is also included to increase the purity of the produced
furfural to 99.0 wt%.
Table 8.4 summarizes some important performance data of the process area compared to the
Marcotullio process. The xylose content in the liquid stream received from area 100 is 5.8
wt%, slightly higher than the 5.0 wt% assumed by Marcotullio. 0.7 ton/h furfural also flows
into area 400 along with the pretreatment flash and the xylose feed. This explains the specific
xylose feed of 1.49 ton xylose/ton furfural, which implies a furfural yield greater than 100%.
If the extra furfural produced in area 100 is accounted for, the furfural yield is still over 99%.
A major premise for excluding side and loss reactions is the assumption of instantaneous
separation of furfural from the reactive liquid phase. Figure 8.1 shows the actual flow of
furfural in the reactive column.
Figure 8.1: Total flow of furfural in vapour and liquid phase as a function of column tray number.
Approximately 40-50% of the total furfural at each state is present in the liquid phase. This shows the
yield of furfural obtained in this process is overestimated, as there will be acid catalyzed loss reactions
in the reactive column. Loss and side reactions with appropriate reaction kinetics could be
implemented for increased accuracy.
0
5 000
10 000
15 000
20 000
25 000
30 000
0 10 20 30 40 50
Furf
ura
l [k
g/h
]
Column Tray Number
COL-400 Furfural Flow
Vapour Phase
Liquid Phase
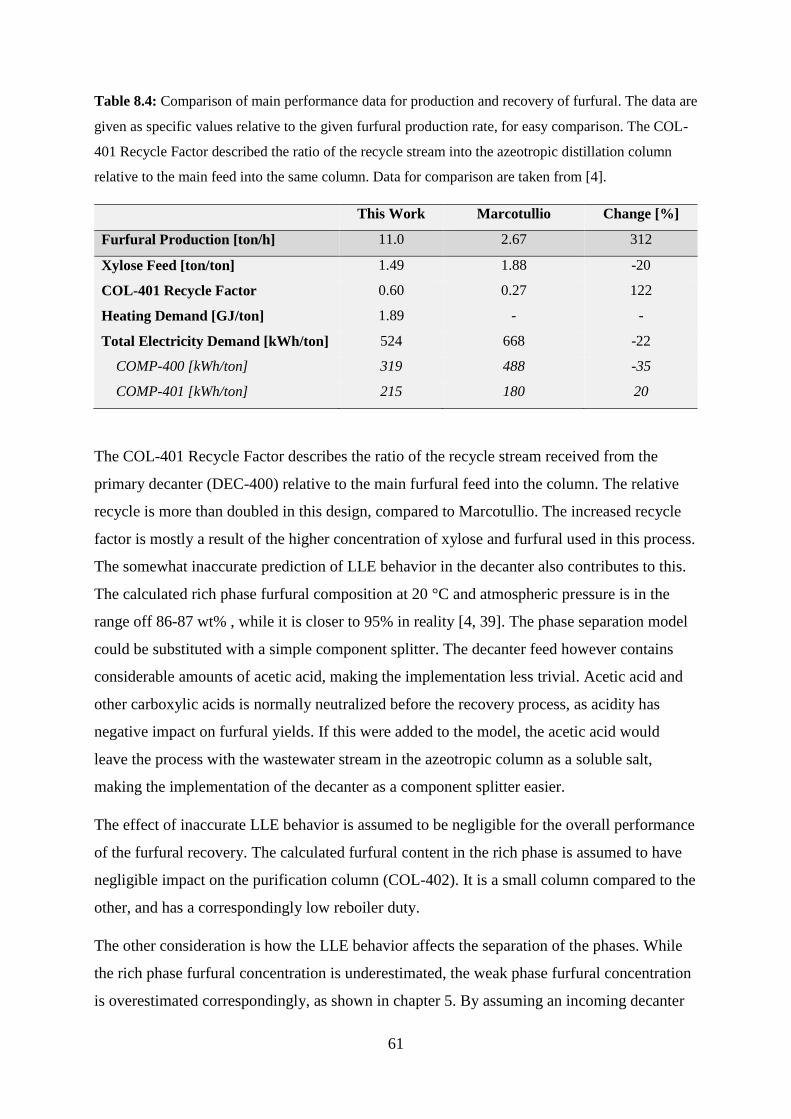
61
Table 8.4: Comparison of main performance data for production and recovery of furfural. The data are
given as specific values relative to the given furfural production rate, for easy comparison. The COL-
401 Recycle Factor described the ratio of the recycle stream into the azeotropic distillation column
relative to the main feed into the same column. Data for comparison are taken from [4].
This Work Marcotullio Change [%]
Furfural Production [ton/h] 11.0 2.67 312
Xylose Feed [ton/ton] 1.49 1.88 -20
COL-401 Recycle Factor 0.60 0.27 122
Heating Demand [GJ/ton] 1.89 - -
Total Electricity Demand [kWh/ton] 524 668 -22
COMP-400 [kWh/ton] 319 488 -35
COMP-401 [kWh/ton] 215 180 20
The COL-401 Recycle Factor describes the ratio of the recycle stream received from the
primary decanter (DEC-400) relative to the main furfural feed into the column. The relative
recycle is more than doubled in this design, compared to Marcotullio. The increased recycle
factor is mostly a result of the higher concentration of xylose and furfural used in this process.
The somewhat inaccurate prediction of LLE behavior in the decanter also contributes to this.
The calculated rich phase furfural composition at 20 °C and atmospheric pressure is in the
range off 86-87 wt% , while it is closer to 95% in reality [4, 39]. The phase separation model
could be substituted with a simple component splitter. The decanter feed however contains
considerable amounts of acetic acid, making the implementation less trivial. Acetic acid and
other carboxylic acids is normally neutralized before the recovery process, as acidity has
negative impact on furfural yields. If this were added to the model, the acetic acid would
leave the process with the wastewater stream in the azeotropic column as a soluble salt,
making the implementation of the decanter as a component splitter easier.
The effect of inaccurate LLE behavior is assumed to be negligible for the overall performance
of the furfural recovery. The calculated furfural content in the rich phase is assumed to have
negligible impact on the purification column (COL-402). It is a small column compared to the
other, and has a correspondingly low reboiler duty.
The other consideration is how the LLE behavior affects the separation of the phases. While
the rich phase furfural concentration is underestimated, the weak phase furfural concentration
is overestimated correspondingly, as shown in chapter 5. By assuming an incoming decanter
62
feed of 16.6 wt% furfural in pure water, the ratio of weak phase relative to the rich phase is
only 3.5% larger than in the real case. This shows that the inaccurate LLE behavior has little
influence on the amount of recycle to the azeotropic column, and hence its performance and
eventual sizing. The error however increases with increasing concentration of acetic acid, as it
increases the mutual solubility of water and furfural, which is indicated in figure 5.4.
The maximum composition for maintaining complete integration is found to be 16.6 wt %
furfural, which is a little higher than that used by Marcotullio. This may be explained by the
higher furfural content in the column main feed. By increasing the furfural content in the
vapour draw towards the azeotropic composition (35 wt%), the heat of condensation of the
vapour draw no longer meet the heating demand of the column reboiler, and additional heat
must be provided by steam. The reason for choosing a lower furfural concentration is that
separation of furfural from water is weighted towards the decanter, where separation occurs
spontaneously without the use of energy. The main objective of the column is therefore to
increase the furfural concentration for effective phase separation in the decanter, while using
as little energy as possible.
The total specific heating demand is calculated to 1.89 GJ/ton furfural. Marcotullio do not
report this figure, so no comparison is done. In addition to this, there is also the implicit
heating demand of the steam injection in the pretreatment area, necessary to produce the
liquid xylose feed. The pretreatment steam usage is 3.5 ton steam/ton furfural. The theoretical
energy requirement of producing steam at 13.0 atm is 2.83 GJ/ton, which corresponds to a
theoretical heating demand of 11.8 GJ/ton furfural. Steam usage in pretreatment, however, is a
prerequisite for the production of ethanol, whether the resulting xylose is used to produce
furfural or not. Because of this, the implied heating demand of the pretreatment steam is not
included in the calculated heating demand given in table 8.4.
The specific heating demand in existing furfural plants varies, but a conservative estimate is
40 GJ/h [4], assuming a steam consumption of 15 ton/ton furfural. This illustrates the
remarkable advantage of integrating furfural production with ethanol production, enabling the
use of a liquid xylose feed.
The total specific electricity demand is reduced compared with Marcotullio, due to the
changes made in the implementation of the reactive column, and the higher xylose
concentration in the feed.
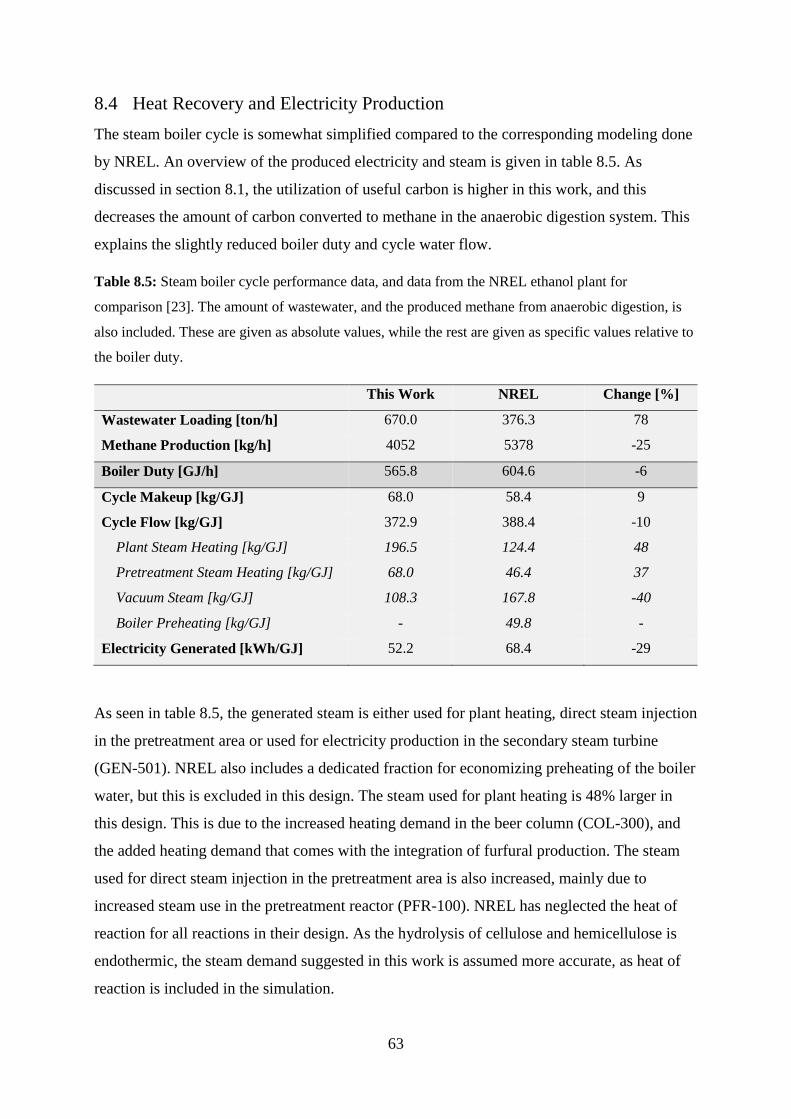
63
8.4 Heat Recovery and Electricity Production
The steam boiler cycle is somewhat simplified compared to the corresponding modeling done
by NREL. An overview of the produced electricity and steam is given in table 8.5. As
discussed in section 8.1, the utilization of useful carbon is higher in this work, and this
decreases the amount of carbon converted to methane in the anaerobic digestion system. This
explains the slightly reduced boiler duty and cycle water flow.
Table 8.5: Steam boiler cycle performance data, and data from the NREL ethanol plant for
comparison [23]. The amount of wastewater, and the produced methane from anaerobic digestion, is
also included. These are given as absolute values, while the rest are given as specific values relative to
the boiler duty.
This Work NREL Change [%]
Wastewater Loading [ton/h] 670.0 376.3 78
Methane Production [kg/h] 4052 5378 -25
Boiler Duty [GJ/h] 565.8 604.6 -6
Cycle Makeup [kg/GJ] 68.0 58.4 9
Cycle Flow [kg/GJ] 372.9 388.4 -10
Plant Steam Heating [kg/GJ] 196.5 124.4 48
Pretreatment Steam Heating [kg/GJ] 68.0 46.4 37
Vacuum Steam [kg/GJ] 108.3 167.8 -40
Boiler Preheating [kg/GJ] - 49.8 -
Electricity Generated [kWh/GJ] 52.2 68.4 -29
As seen in table 8.5, the generated steam is either used for plant heating, direct steam injection
in the pretreatment area or used for electricity production in the secondary steam turbine
(GEN-501). NREL also includes a dedicated fraction for economizing preheating of the boiler
water, but this is excluded in this design. The steam used for plant heating is 48% larger in
this design. This is due to the increased heating demand in the beer column (COL-300), and
the added heating demand that comes with the integration of furfural production. The steam
used for direct steam injection in the pretreatment area is also increased, mainly due to
increased steam use in the pretreatment reactor (PFR-100). NREL has neglected the heat of
reaction for all reactions in their design. As the hydrolysis of cellulose and hemicellulose is
endothermic, the steam demand suggested in this work is assumed more accurate, as heat of
reaction is included in the simulation.
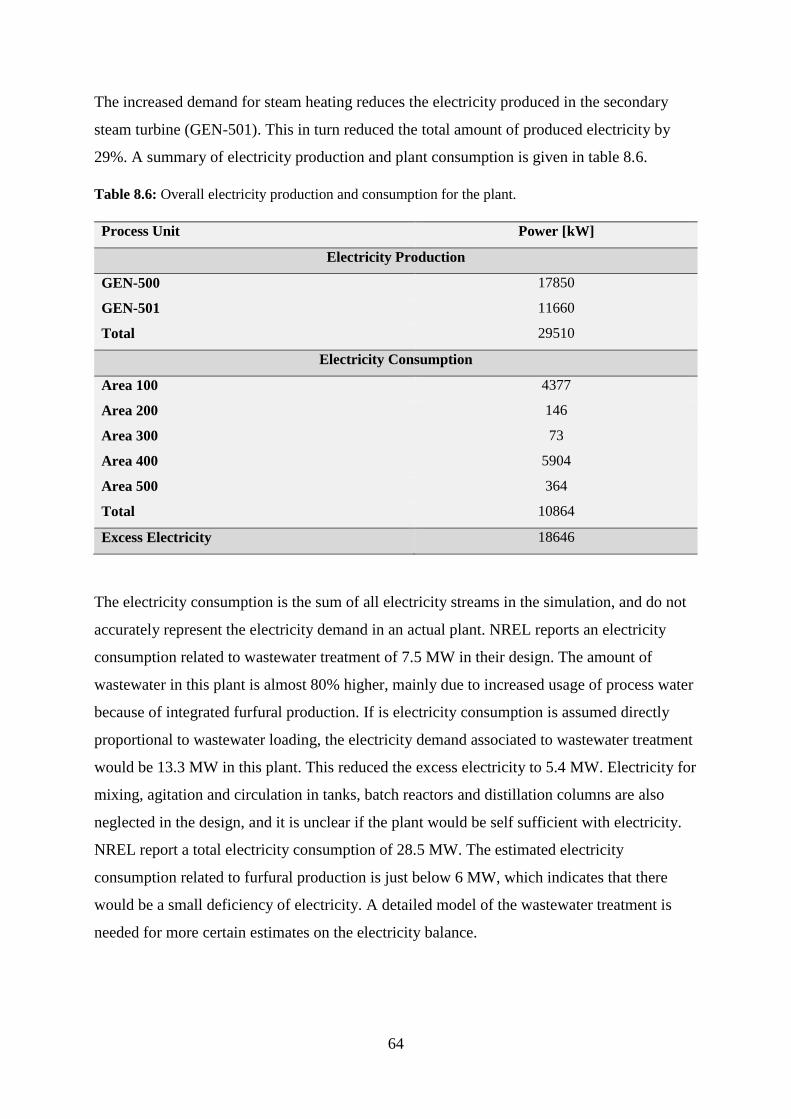
64
The increased demand for steam heating reduces the electricity produced in the secondary
steam turbine (GEN-501). This in turn reduced the total amount of produced electricity by
29%. A summary of electricity production and plant consumption is given in table 8.6.
Table 8.6: Overall electricity production and consumption for the plant.
Process Unit Power [kW]
Electricity Production
GEN-500 17850
GEN-501 11660
Total 29510
Electricity Consumption
Area 100 4377
Area 200 146
Area 300 73
Area 400 5904
Area 500 364
Total 10864
Excess Electricity 18646
The electricity consumption is the sum of all electricity streams in the simulation, and do not
accurately represent the electricity demand in an actual plant. NREL reports an electricity
consumption related to wastewater treatment of 7.5 MW in their design. The amount of
wastewater in this plant is almost 80% higher, mainly due to increased usage of process water
because of integrated furfural production. If is electricity consumption is assumed directly
proportional to wastewater loading, the electricity demand associated to wastewater treatment
would be 13.3 MW in this plant. This reduced the excess electricity to 5.4 MW. Electricity for
mixing, agitation and circulation in tanks, batch reactors and distillation columns are also
neglected in the design, and it is unclear if the plant would be self sufficient with electricity.
NREL report a total electricity consumption of 28.5 MW. The estimated electricity
consumption related to furfural production is just below 6 MW, which indicates that there
would be a small deficiency of electricity. A detailed model of the wastewater treatment is
needed for more certain estimates on the electricity balance.
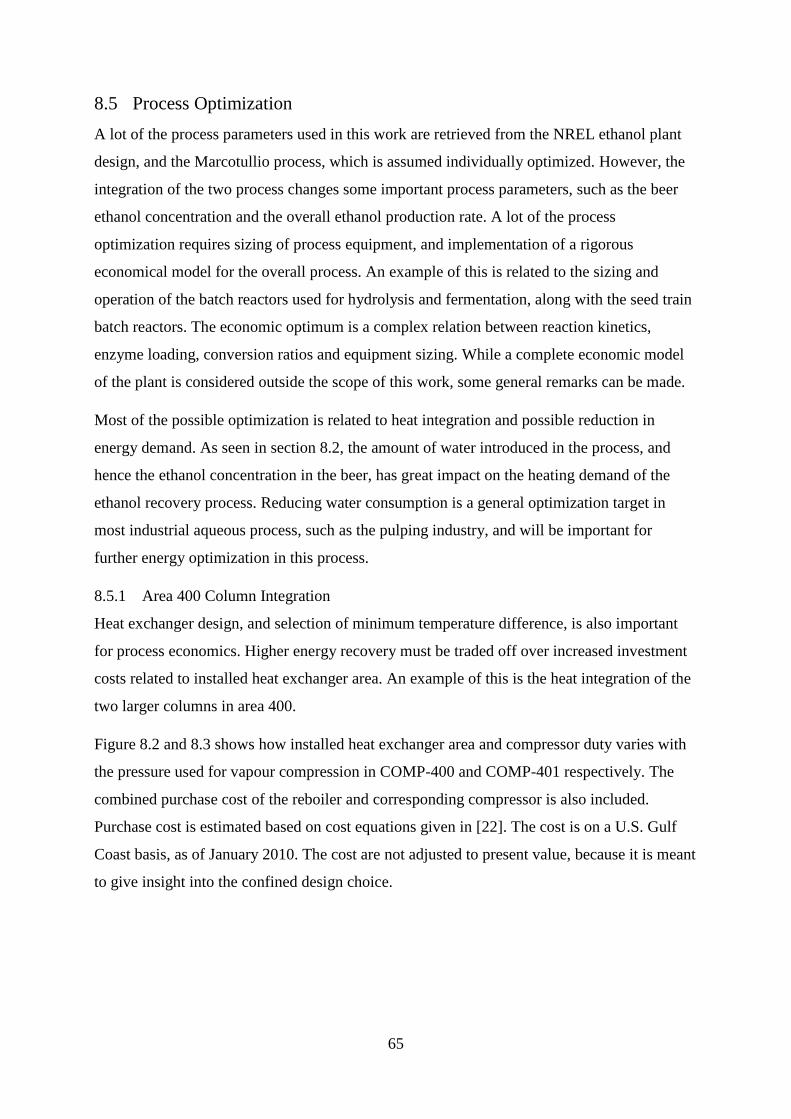
65
8.5 Process Optimization
A lot of the process parameters used in this work are retrieved from the NREL ethanol plant
design, and the Marcotullio process, which is assumed individually optimized. However, the
integration of the two process changes some important process parameters, such as the beer
ethanol concentration and the overall ethanol production rate. A lot of the process
optimization requires sizing of process equipment, and implementation of a rigorous
economical model for the overall process. An example of this is related to the sizing and
operation of the batch reactors used for hydrolysis and fermentation, along with the seed train
batch reactors. The economic optimum is a complex relation between reaction kinetics,
enzyme loading, conversion ratios and equipment sizing. While a complete economic model
of the plant is considered outside the scope of this work, some general remarks can be made.
Most of the possible optimization is related to heat integration and possible reduction in
energy demand. As seen in section 8.2, the amount of water introduced in the process, and
hence the ethanol concentration in the beer, has great impact on the heating demand of the
ethanol recovery process. Reducing water consumption is a general optimization target in
most industrial aqueous process, such as the pulping industry, and will be important for
further energy optimization in this process.
8.5.1 Area 400 Column Integration
Heat exchanger design, and selection of minimum temperature difference, is also important
for process economics. Higher energy recovery must be traded off over increased investment
costs related to installed heat exchanger area. An example of this is the heat integration of the
two larger columns in area 400.
Figure 8.2 and 8.3 shows how installed heat exchanger area and compressor duty varies with
the pressure used for vapour compression in COMP-400 and COMP-401 respectively. The
combined purchase cost of the reboiler and corresponding compressor is also included.
Purchase cost is estimated based on cost equations given in [22]. The cost is on a U.S. Gulf
Coast basis, as of January 2010. The cost are not adjusted to present value, because it is meant
to give insight into the confined design choice.
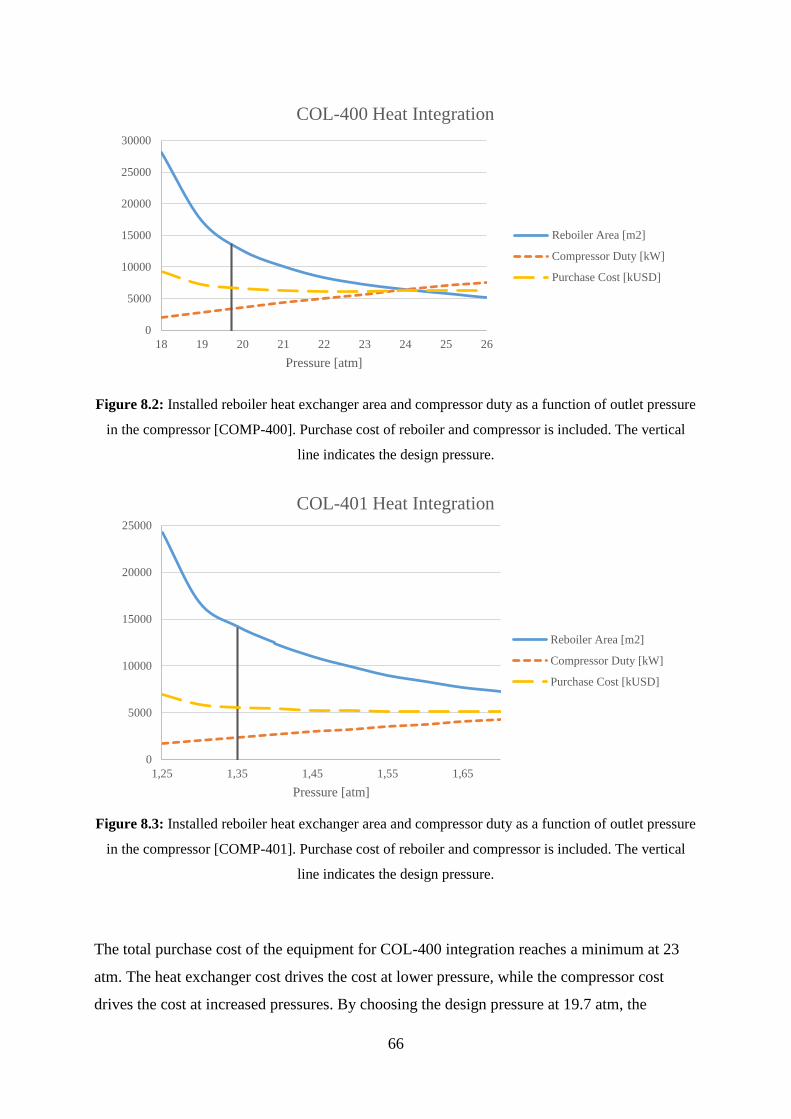
66
Figure 8.2: Installed reboiler heat exchanger area and compressor duty as a function of outlet pressure
in the compressor [COMP-400]. Purchase cost of reboiler and compressor is included. The vertical
line indicates the design pressure.
Figure 8.3: Installed reboiler heat exchanger area and compressor duty as a function of outlet pressure
in the compressor [COMP-401]. Purchase cost of reboiler and compressor is included. The vertical
line indicates the design pressure.
The total purchase cost of the equipment for COL-400 integration reaches a minimum at 23
atm. The heat exchanger cost drives the cost at lower pressure, while the compressor cost
drives the cost at increased pressures. By choosing the design pressure at 19.7 atm, the
0
5000
10000
15000
20000
25000
30000
18 19 20 21 22 23 24 25 26
Pressure [atm]
COL-400 Heat Integration
Reboiler Area [m2]
Compressor Duty [kW]
Purchase Cost [kUSD]
0
5000
10000
15000
20000
25000
1,25 1,35 1,45 1,55 1,65
Pressure [atm]
COL-401 Heat Integration
Reboiler Area [m2]
Compressor Duty [kW]
Purchase Cost [kUSD]
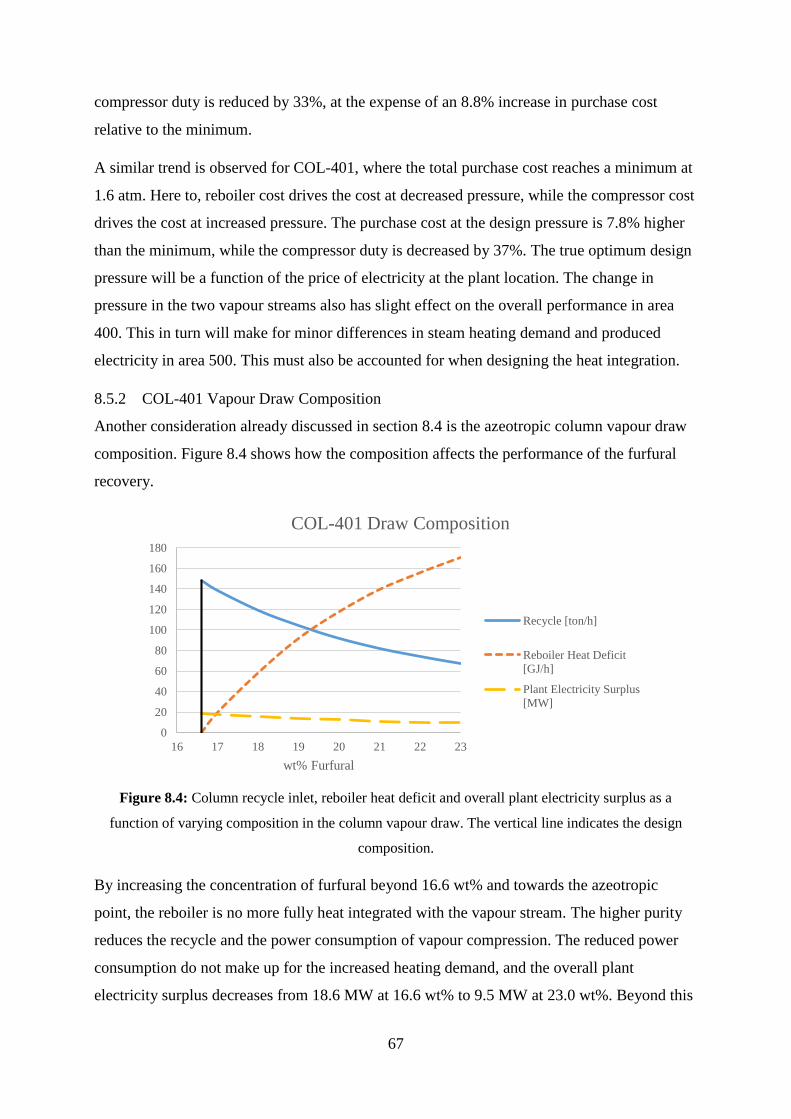
67
compressor duty is reduced by 33%, at the expense of an 8.8% increase in purchase cost
relative to the minimum.
A similar trend is observed for COL-401, where the total purchase cost reaches a minimum at
1.6 atm. Here to, reboiler cost drives the cost at decreased pressure, while the compressor cost
drives the cost at increased pressure. The purchase cost at the design pressure is 7.8% higher
than the minimum, while the compressor duty is decreased by 37%. The true optimum design
pressure will be a function of the price of electricity at the plant location. The change in
pressure in the two vapour streams also has slight effect on the overall performance in area
400. This in turn will make for minor differences in steam heating demand and produced
electricity in area 500. This must also be accounted for when designing the heat integration.
8.5.2 COL-401 Vapour Draw Composition
Another consideration already discussed in section 8.4 is the azeotropic column vapour draw
composition. Figure 8.4 shows how the composition affects the performance of the furfural
recovery.
Figure 8.4: Column recycle inlet, reboiler heat deficit and overall plant electricity surplus as a
function of varying composition in the column vapour draw. The vertical line indicates the design
composition.
By increasing the concentration of furfural beyond 16.6 wt% and towards the azeotropic
point, the reboiler is no more fully heat integrated with the vapour stream. The higher purity
reduces the recycle and the power consumption of vapour compression. The reduced power
consumption do not make up for the increased heating demand, and the overall plant
electricity surplus decreases from 18.6 MW at 16.6 wt% to 9.5 MW at 23.0 wt%. Beyond this
0
20
40
60
80
100
120
140
160
180
16 17 18 19 20 21 22 23
wt% Furfural
COL-401 Draw Composition
Recycle [ton/h]
Reboiler Heat Deficit
[GJ/h]
Plant Electricity Surplus
[MW]
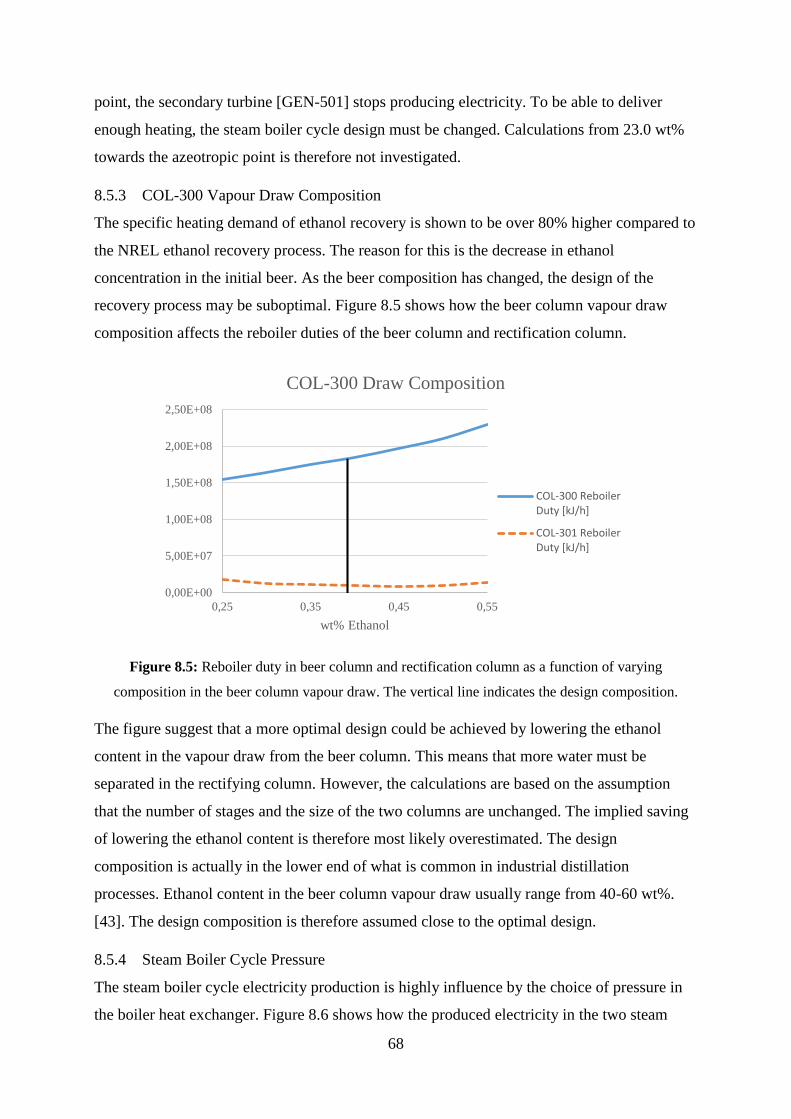
68
point, the secondary turbine [GEN-501] stops producing electricity. To be able to deliver
enough heating, the steam boiler cycle design must be changed. Calculations from 23.0 wt%
towards the azeotropic point is therefore not investigated.
8.5.3 COL-300 Vapour Draw Composition
The specific heating demand of ethanol recovery is shown to be over 80% higher compared to
the NREL ethanol recovery process. The reason for this is the decrease in ethanol
concentration in the initial beer. As the beer composition has changed, the design of the
recovery process may be suboptimal. Figure 8.5 shows how the beer column vapour draw
composition affects the reboiler duties of the beer column and rectification column.
Figure 8.5: Reboiler duty in beer column and rectification column as a function of varying
composition in the beer column vapour draw. The vertical line indicates the design composition.
The figure suggest that a more optimal design could be achieved by lowering the ethanol
content in the vapour draw from the beer column. This means that more water must be
separated in the rectifying column. However, the calculations are based on the assumption
that the number of stages and the size of the two columns are unchanged. The implied saving
of lowering the ethanol content is therefore most likely overestimated. The design
composition is actually in the lower end of what is common in industrial distillation
processes. Ethanol content in the beer column vapour draw usually range from 40-60 wt%.
[43]. The design composition is therefore assumed close to the optimal design.
8.5.4 Steam Boiler Cycle Pressure
The steam boiler cycle electricity production is highly influence by the choice of pressure in
the boiler heat exchanger. Figure 8.6 shows how the produced electricity in the two steam
0,00E+00
5,00E+07
1,00E+08
1,50E+08
2,00E+08
2,50E+08
0,25 0,35 0,45 0,55
wt% Ethanol
COL-300 Draw Composition
COL-300 ReboilerDuty [kJ/h]
COL-301 ReboilerDuty [kJ/h]
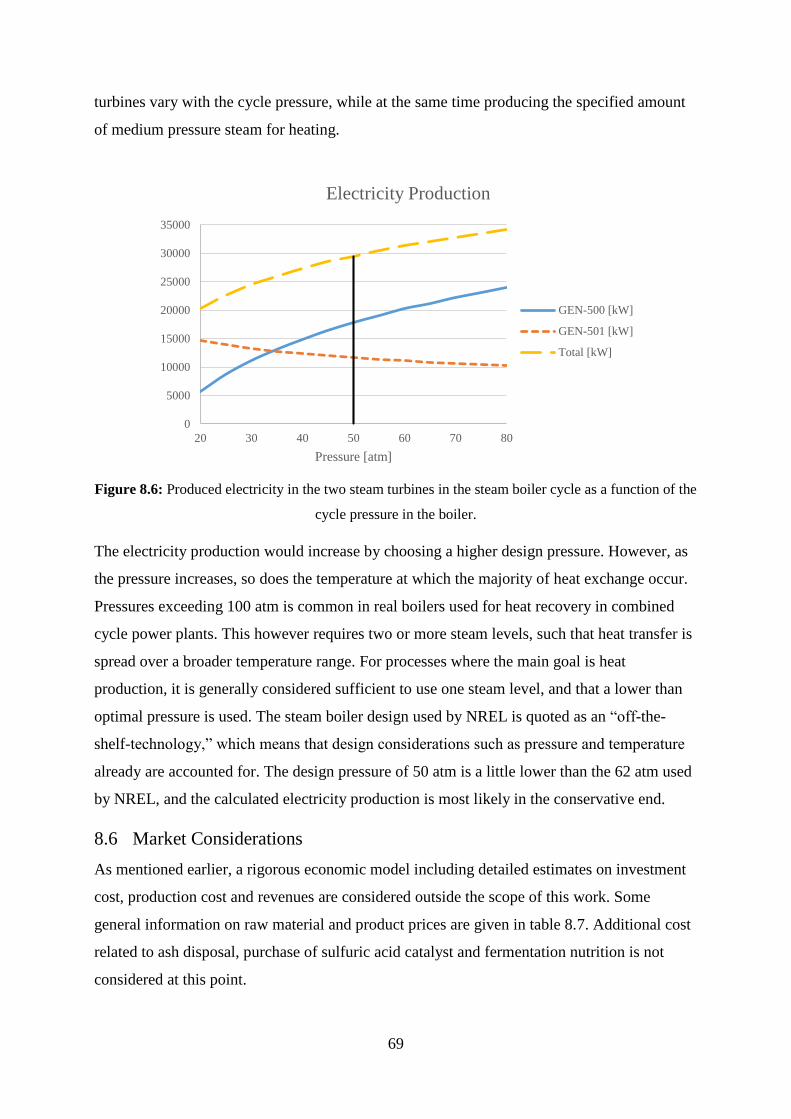
69
turbines vary with the cycle pressure, while at the same time producing the specified amount
of medium pressure steam for heating.
Figure 8.6: Produced electricity in the two steam turbines in the steam boiler cycle as a function of the
cycle pressure in the boiler.
The electricity production would increase by choosing a higher design pressure. However, as
the pressure increases, so does the temperature at which the majority of heat exchange occur.
Pressures exceeding 100 atm is common in real boilers used for heat recovery in combined
cycle power plants. This however requires two or more steam levels, such that heat transfer is
spread over a broader temperature range. For processes where the main goal is heat
production, it is generally considered sufficient to use one steam level, and that a lower than
optimal pressure is used. The steam boiler design used by NREL is quoted as an “off-the-
shelf-technology,” which means that design considerations such as pressure and temperature
already are accounted for. The design pressure of 50 atm is a little lower than the 62 atm used
by NREL, and the calculated electricity production is most likely in the conservative end.
8.6 Market Considerations
As mentioned earlier, a rigorous economic model including detailed estimates on investment
cost, production cost and revenues are considered outside the scope of this work. Some
general information on raw material and product prices are given in table 8.7. Additional cost
related to ash disposal, purchase of sulfuric acid catalyst and fermentation nutrition is not
considered at this point.
0
5000
10000
15000
20000
25000
30000
35000
20 30 40 50 60 70 80
Pressure [atm]
Electricity Production
GEN-500 [kW]
GEN-501 [kW]
Total [kW]
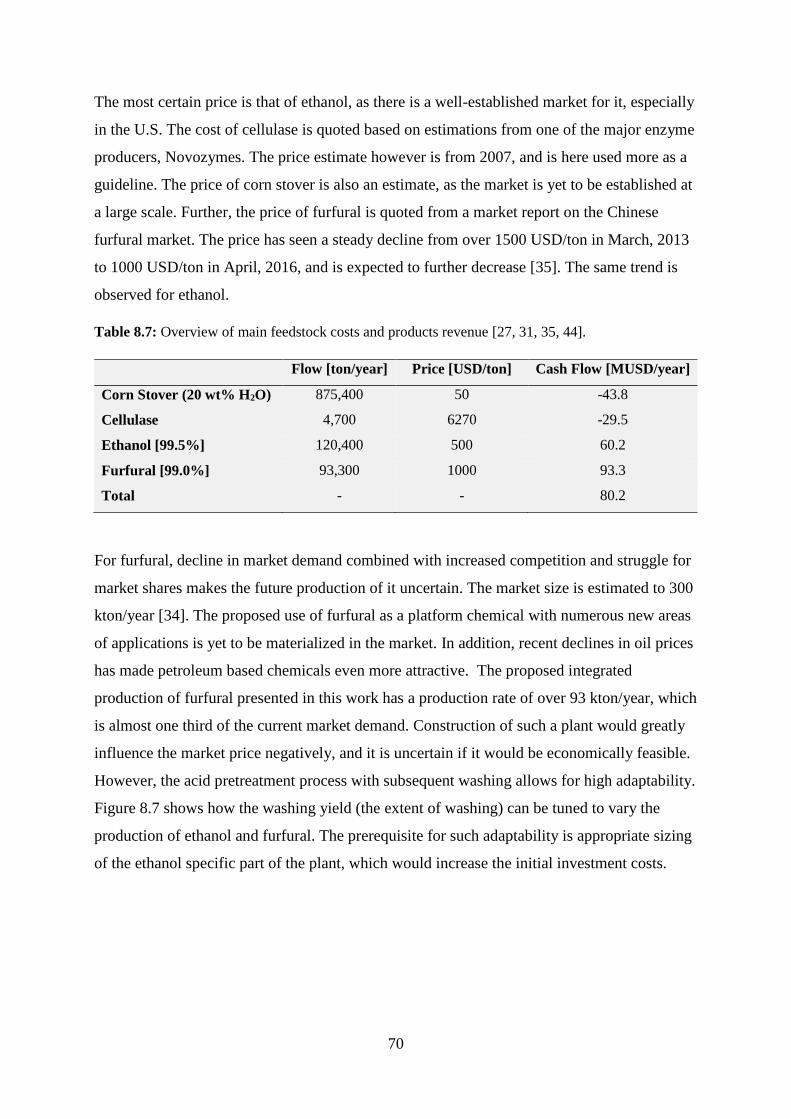
70
The most certain price is that of ethanol, as there is a well-established market for it, especially
in the U.S. The cost of cellulase is quoted based on estimations from one of the major enzyme
producers, Novozymes. The price estimate however is from 2007, and is here used more as a
guideline. The price of corn stover is also an estimate, as the market is yet to be established at
a large scale. Further, the price of furfural is quoted from a market report on the Chinese
furfural market. The price has seen a steady decline from over 1500 USD/ton in March, 2013
to 1000 USD/ton in April, 2016, and is expected to further decrease [35]. The same trend is
observed for ethanol.
Table 8.7: Overview of main feedstock costs and products revenue [27, 31, 35, 44].
Flow [ton/year] Price [USD/ton] Cash Flow [MUSD/year]
Corn Stover (20 wt% H2O) 875,400 50 -43.8
Cellulase 4,700 6270 -29.5
Ethanol [99.5%] 120,400 500 60.2
Furfural [99.0%] 93,300 1000 93.3
Total - - 80.2
For furfural, decline in market demand combined with increased competition and struggle for
market shares makes the future production of it uncertain. The market size is estimated to 300
kton/year [34]. The proposed use of furfural as a platform chemical with numerous new areas
of applications is yet to be materialized in the market. In addition, recent declines in oil prices
has made petroleum based chemicals even more attractive. The proposed integrated
production of furfural presented in this work has a production rate of over 93 kton/year, which
is almost one third of the current market demand. Construction of such a plant would greatly
influence the market price negatively, and it is uncertain if it would be economically feasible.
However, the acid pretreatment process with subsequent washing allows for high adaptability.
Figure 8.7 shows how the washing yield (the extent of washing) can be tuned to vary the
production of ethanol and furfural. The prerequisite for such adaptability is appropriate sizing
of the ethanol specific part of the plant, which would increase the initial investment costs.
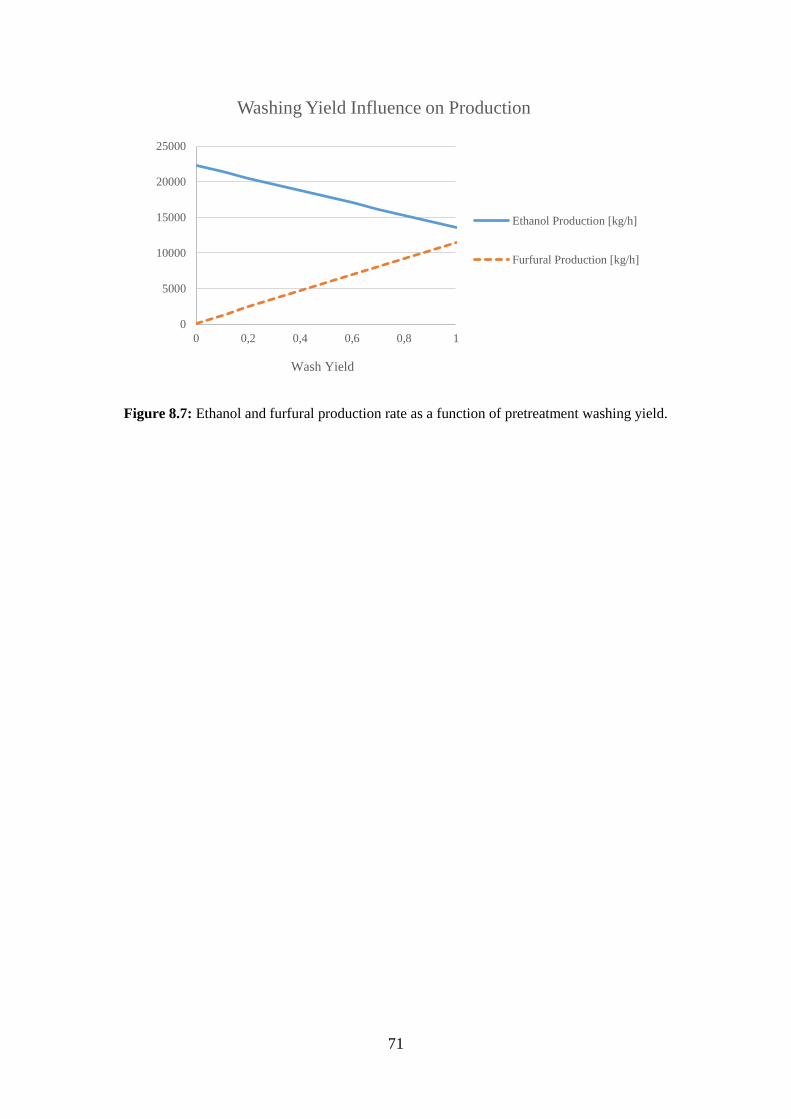
71
Figure 8.7: Ethanol and furfural production rate as a function of pretreatment washing yield.
0
5000
10000
15000
20000
25000
0 0,2 0,4 0,6 0,8 1
Wash Yield
Washing Yield Influence on Production
Ethanol Production [kg/h]
Furfural Production [kg/h]

72
73
9. Conclusion
An integrated process for production of ethanol and furfural from corn stover was
successfully implemented in HYSYS. The design was based on the NREL ethanol process
and the Marcotullio furfural process. The plant uses 875,400 ton/year of corn stover as
feedstock, and produces 120,400 ton/year 99.5 wt% ethanol and 93,300 ton/year 99.0 wt%
furfural. The combined carbon utilization of the process was found to be 81.1%, which is
slightly higher than comparable processes. This is in part explained by lossless formation of
furfural assumed in the reactive distillation. The simulation of the column shows that loss
reactions could be implemented for increased accuracy in prediction of furfural yield, and that
the obtained carbon utilization may be overestimated.
The furfural production and recovery process was slightly altered compared to the
Marcotullio process. The xylose feed concentration was increased from 5.0 to 5.8 wt%. A
purge stream in the reactive distillation recycle was also added. Specific heating demand was
found to be 1.89 GJ/ton furfural, while the specific electricity demand was reduced from 668
to 524 kWh/ton furfural.
A specific plant area was implemented to estimate energy and electricity production from
combustion of residual solid material and methane produced by anaerobic digestion of
wastewater. A steam boiler cycle was used to produce steam for direct steam injection in the
pretreatment process and medium pressure steam for plant heating. The steam turbines
generates a total of 29.5 MW of electricity, with a calculated plant excess of 18.6 MW.
Electricity consumption associated with wastewater treatment was not accounted for, and the
excess electricity is assumed to be close to zero.
The plant electricity production is 28.6% lower in the NREL ethanol process, due to reduced
performance in the ethanol recovery process. The specific reboiler heating demand in ethanol
recovery is found to be 83% higher, mainly due to a more dilute fermentation broth. Heating
associated with integrated furfural production also reduces the production of electricity.
A rigorous economic model was considered outside the scope of this work. The HYSYS
model is a good basis for further assessment of the economic viability of the process. Better
accuracy could be achieved by adding furfural loss reactions. It is also recommended to
include an additional fluid package with binary coefficients optimized for LLE behaviour.
Poor estimation of LLE behaviour is found to have negligible effect on performance, but

74
would be a prerequisite for appropriate equipment sizing. A further ambition could be the
addition of kinetic reaction sets for the enzymatic hydrolysis and fermentation. This would
enable the use of HYSYS for all equipment sizing, including continuous reactors, batch
reactors and distillation columns, and would simplify optimization with regards to equipment
sizing and investment costs.
75
References
1. Kamm, B., et al., Biorefinery Systems – An Overview, in Biorefineries-Industrial
Processes and Products. 2008, Wiley-VCH Verlag GmbH. p. 1-40.
2. US Biofuels: Climate Change and Policies. [cited 2016 2 June]; Available from:
http://www.worldwatch.org/files/pdf/Biofuels%20Issue%20Brief.pdf.
3. De Jong, W. and G. Marcotullio, Overview of biorefineries based on co-production of
furfural, existing concepts and novel developments. International journal of chemical
reactor engineering, 2010. 8(1).
4. Marcotullio, G., The chemistry and technology of furfural production in modern
lignocellulose-feedstock biorefineries. 2011: TU Delft, Delft University of
Technology.
5. Stokke, D.D., Q. Wu, and G. Han, Lignocellulosic Materials, in Introduction to Wood
and Natural Fiber Composites. 2013, John Wiley & Sons Ltd. p. 19-59.
6. Wyman, C.E., Special issue: Biotechnology for the conversion of lignocellulosics
Ethanol from lignocellulosic biomass: Technology, economics, and opportunities.
Bioresource Technology, 1994. 50(1): p. 3-15.
7. Haghighi Mood, S., et al., Lignocellulosic biomass to bioethanol, a comprehensive
review with a focus on pretreatment. Renewable and Sustainable Energy Reviews,
2013. 27: p. 77-93.
8. Rowell, R.M., Handbook of Wood Chemistry and Wood Composites. 2005: CRC
Press.
9. Vassilev, S.V., et al., An overview of the organic and inorganic phase composition of
biomass. Fuel, 2012. 94: p. 1-33.
10. Agarwal, U.P., R.R. Reiner, and S.A. Ralph, Cellulose crystallinity of woods, wood
pulps, and agricultural fibers by FT-Raman Spectroscopy. Red, 2011. 19(60.7): p.
67.9.
11. Zhao, X., L. Zhang, and D. Liu, Biomass recalcitrance. Part I: the chemical
compositions and physical structures affecting the enzymatic hydrolysis of
lignocellulose. Biofuels, Bioproducts and Biorefining, 2012. 6(4): p. 465-482.
12. Clements, L.D. and D.L. Van Dyne, The Lignocellulosic Biorefinery- A Strategy for
Returning to a Sustainable Source of Fuels and Industrial Organic Chemicals, in
Biorefineries-Industrial Processes and Products. 2008, Wiley-VCH Verlag GmbH. p.
115-128.
13. Hayes, D.J., et al., The biofine process–production of levulinic acid, furfural, and
formic acid from lignocellulosic feedstocks. Biorefineries–Industrial Processes and
Product, 2006. 1: p. 139-164.
14. Van Dyne, D.L., M.G. Blase, and L.D. Clements, A strategy for returning agriculture
and rural America to long-term full employment using biomass refineries.
Perspectives on new crops and new uses. ASHS Press, Alexandria, Va, 1999: p. 114-
123.
15. Mosier, N., et al., Features of promising technologies for pretreatment of
lignocellulosic biomass. Bioresource Technology, 2005. 96(6): p. 673-686.
16. Sun, Y. and J. Cheng, Hydrolysis of lignocellulosic materials for ethanol production:
a review. Bioresource Technology, 2002. 83(1): p. 1-11.
17. Carrasco, F. and C. Roy, Kinetic study of dilute-acid prehydrolysis of xylan-containing
biomass. Wood Science and Technology, 1992. 26(3): p. 189-208.
18. Drapcho, C.M., N.P. Nhuan, and T.H. Walker, Biofuels Engineering Process
Technology. 2008.
76
19. Saeman, J.F., Kinetics of Wood Saccharification - Hydrolysis of Cellulose and
Decomposition of Sugars in Dilute Acid at High Temperature. Industrial &
Engineering Chemistry, 1945. 37(1): p. 43-52.
20. Lavarack, B.P., G.J. Griffin, and D. Rodman, The acid hydrolysis of sugarcane
bagasse hemicellulose to produce xylose, arabinose, glucose and other products.
Biomass and Bioenergy, 2002. 23(5): p. 367-380.
21. Washing. 2005 [cited 2016 28 April]; Available from:
https://noppa.lut.fi/noppa/opintojakso/bj60a1400/materiaali/6_washing.pdf.
22. Towler, G. and R.K. Sinnott, Chemical Engineering Design - Principles, Practice and
Economics of Plant and Process Design (2nd Edition). Elsevier.
23. Humbird, D., et al., Process design and economics for biochemical conversion of
lignocellulosic biomass to ethanol: dilute-acid pretreatment and enzymatic hydrolysis
of corn stover. 2011, National Renewable Energy Laboratory (NREL), Golden, CO.
24. Montague, L., A. Slayton, and J. Lukas, A. Aden, M. Ruth, K. Ibsen, J. Jechura, K.
Neeves, J. Sheehan, and B. Wallace.
25. World Agricultural Production. [cited 2016 20 may]; Available from:
http://apps.fas.usda.gov/psdonline/circulars/production.pdf.
26. World of Corn. 2015 [cited 2016 16 May]; Available from:
http://www.worldofcorn.com/pdf/WOC%20Metric.pdf.
27. Ertl, D., Sustainable corn stover harvest. Iowa Corn Promot Board, 2013: p. 1-8.
28. Commercial-scale cellulosic ethanol plant opens. [cited 2016 4 May]; Available
from: https://www.eia.gov/todayinenergy/detail.cfm?id=17851.
29. World Fuel Ethanol Production. [cited 2016 5 May]; Available from:
http://www.ethanolrfa.org/resources/industry/statistics/#1459794955504-26451131-
8a1b.
30. Öhgren, K., et al., A comparison between simultaneous saccharification and
fermentation and separate hydrolysis and fermentation using steam-pretreated corn
stover. Process Biochemistry, 2007. 42(5): p. 834-839.
31. Ethanol Price. [cited 2016 25 May]; Available from:
http://www.tradingeconomics.com/commodity/ethanol.
32. Cai, C.M., et al., Integrated furfural production as a renewable fuel and chemical
platform from lignocellulosic biomass. Journal of Chemical Technology and
Biotechnology, 2014. 89(1): p. 2-10.
33. Zeitsch, K.J., The chemistry and technology of furfural and its many by-products. Vol.
13. 2000: Elsevier.
34. Machado, G., et al., Literature Review on Furfural Production from Lignocellulosic
Biomass. Natural Resources, 2016. 7(03): p. 115.
35. Furfural Market Comment. [cited 2016 27 May]; Available from:
http://www.cnchemicals.com/Press/86385-
CCM:%20China's%20market%20price%20of%20furfural%20bounces%20back%20in
%20April.html.
36. Peleteiro, S., et al., Furfural production using ionic liquids: A review. Bioresource
Technology, 2016. 202: p. 181-191.
37. Bhandari, N., D.G. Macdonald, and N.N. Bakhshi, Kinetic studies of corn stover
saccharification using sulphuric acid. Biotechnology and Bioengineering, 1984.
26(4): p. 320-327.
38. Chang, C., X. Ma, and P. Cen, Kinetics of Levulinic Acid Formation from Glucose
Decomposition at High Temperature1. Chinese Journal of Chemical Engineering,
2006. 14(5): p. 708-712.
39. A. Properties of furfural, in Sugar Series, J.Z. Karl, Editor. 2000, Elsevier. p. 234-239.

77
40. Furfural Properties. [cited 2016 18 May]; Available from:
http://www.furan.com/_resources/downloads/Physical_Properties_of_Furfural.pdf.
41. Speight, J.G., Lange’s handbook of chemistry. McGraw Hill Standard Handbook, New
York Table, 2005. 4: p. 4.41-4.51.
42. Garrote, G., H. Dominguez, and J. Parajo, Hydrothermal processing of lignocellulosic
materials. European Journal of Wood and Wood Products, 1999. 57(3): p. 191-202.
43. Amarasekara, A.S., Handbook of Cellulosic Ethanol. 2013, Somerset, US: Wiley-
Scrivener.
44. Zhuang, J., et al., Economic analysis of cellulase production methods for bio-ethanol.
Applied Engineering in Agriculture, 2007. 23(5): p. 679-687.

78
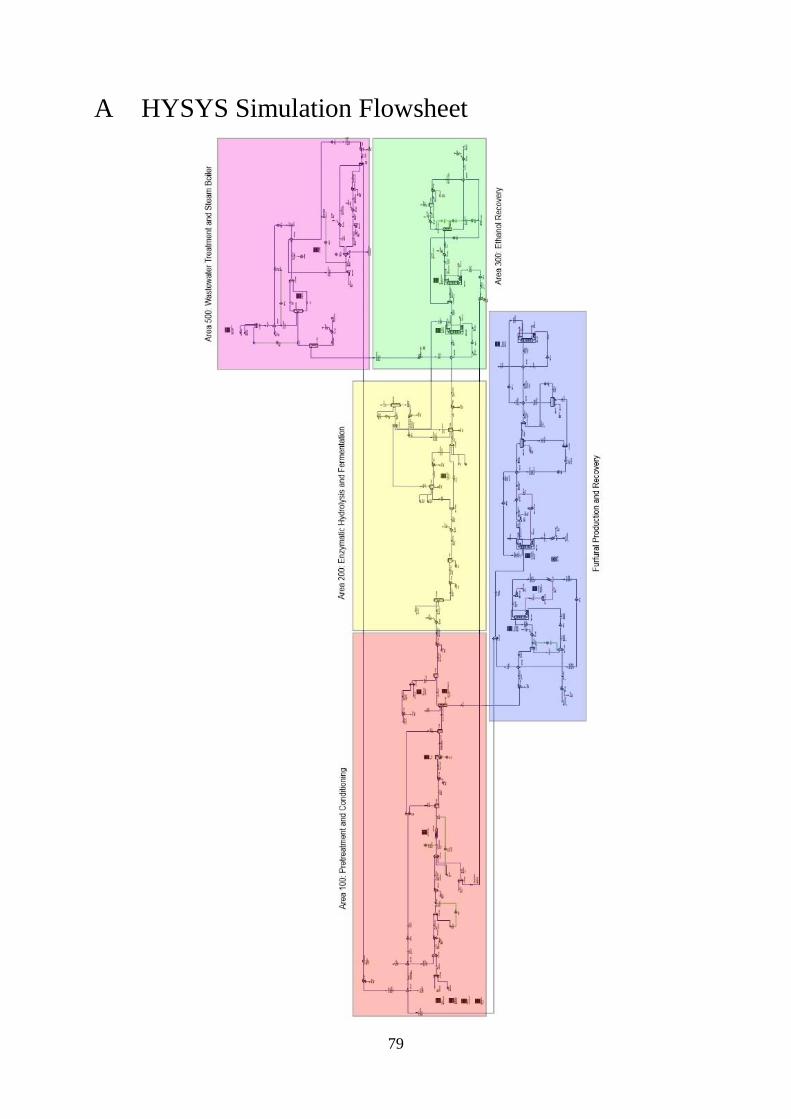
79
A HYSYS Simulation Flowsheet

80
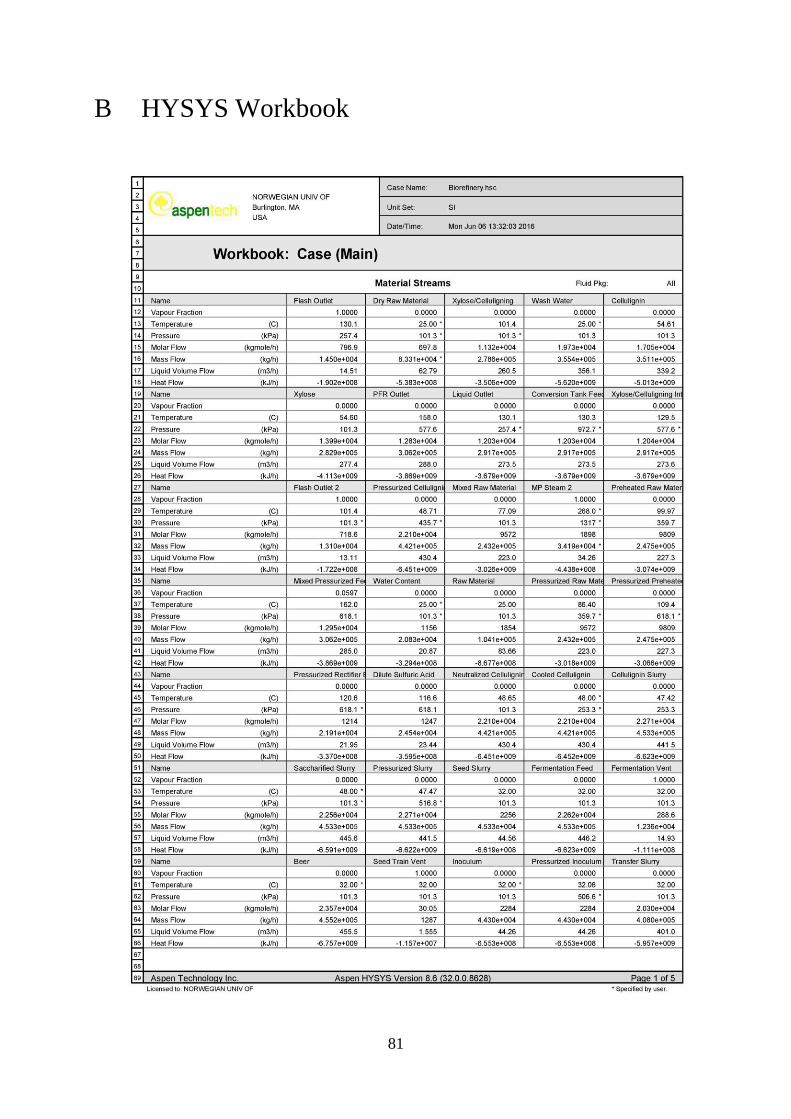
81
B HYSYS Workbook
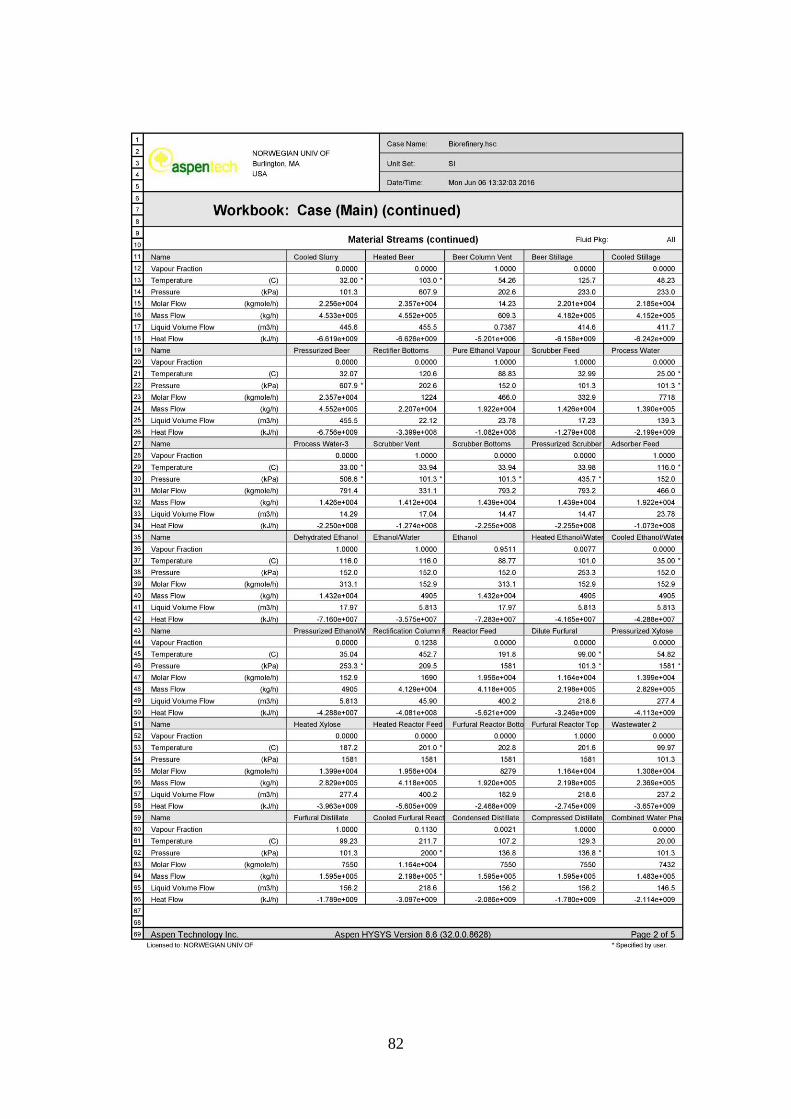
82
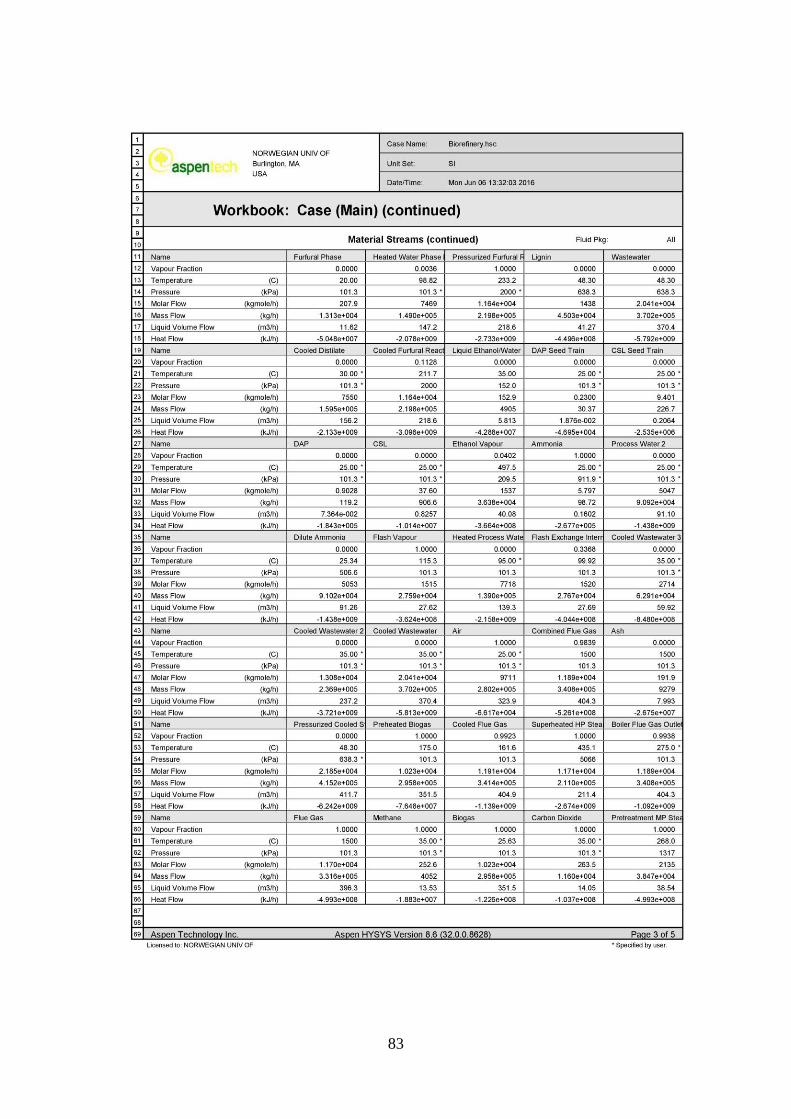
83
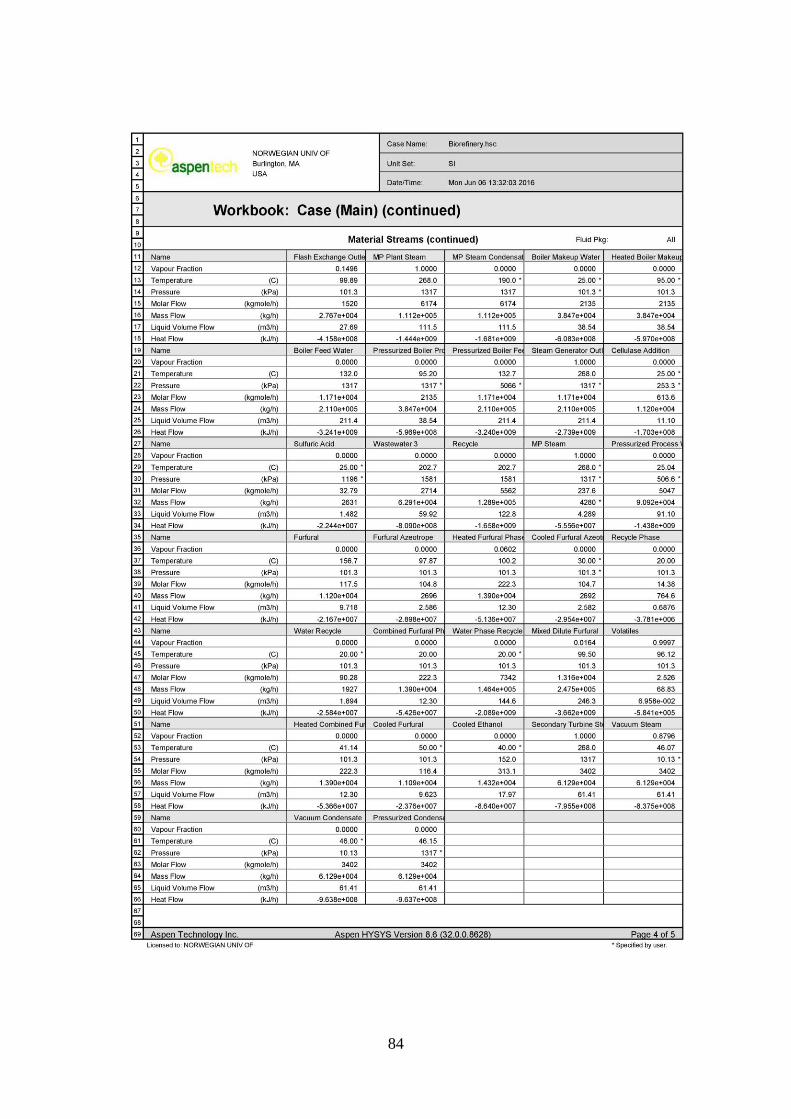
84
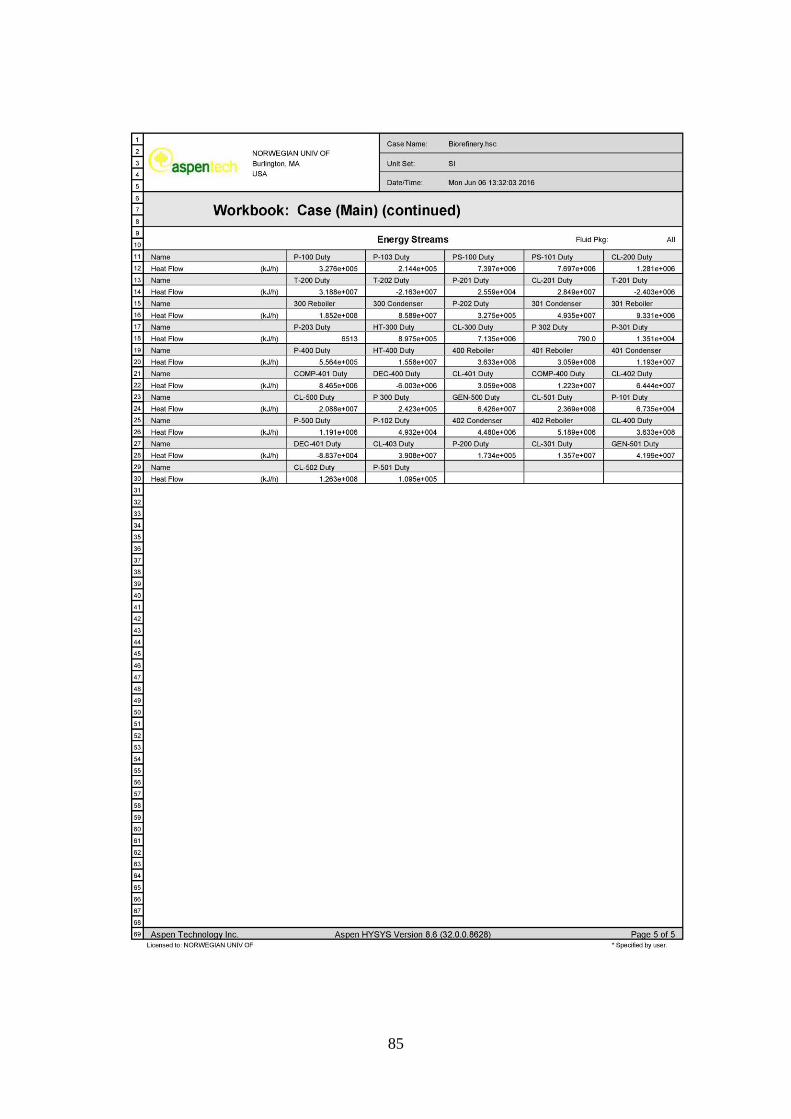
85

86
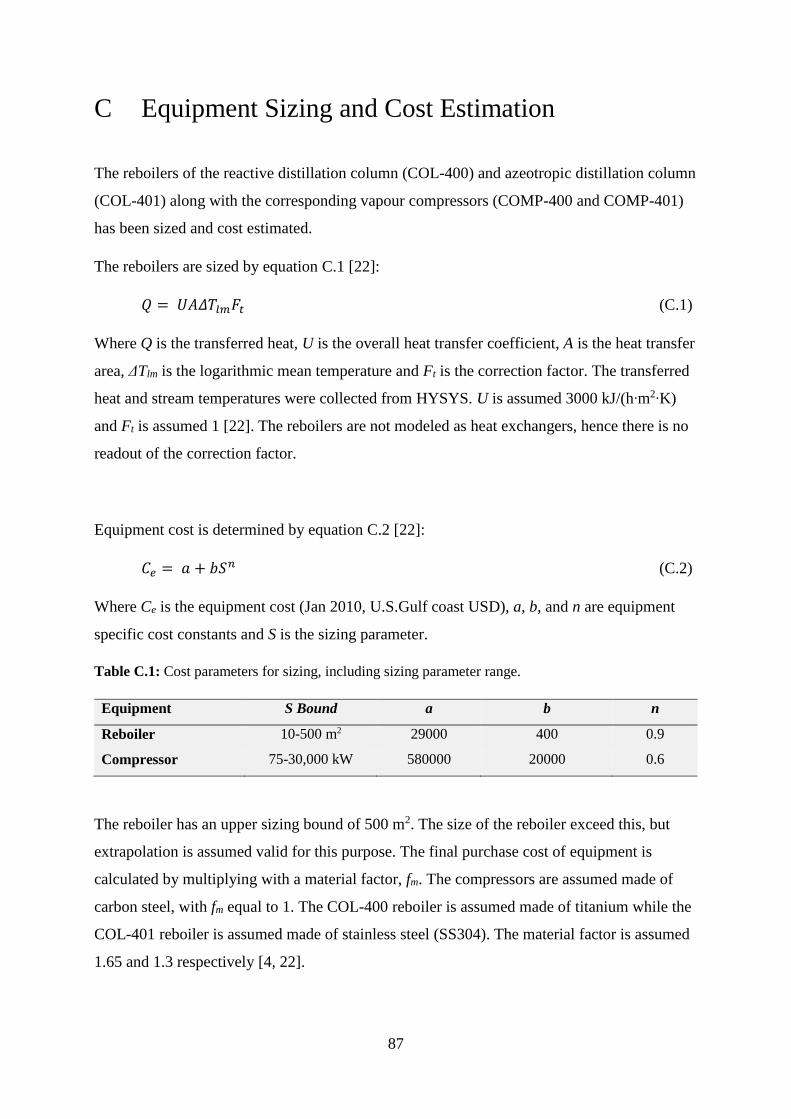
87
C Equipment Sizing and Cost Estimation
The reboilers of the reactive distillation column (COL-400) and azeotropic distillation column
(COL-401) along with the corresponding vapour compressors (COMP-400 and COMP-401)
has been sized and cost estimated.
The reboilers are sized by equation C.1 [22]:
𝑄 = 𝑈𝐴𝛥𝑇𝑙𝑚𝐹𝑡 (C.1)
Where Q is the transferred heat, U is the overall heat transfer coefficient, A is the heat transfer
area, ΔTlm is the logarithmic mean temperature and Ft is the correction factor. The transferred
heat and stream temperatures were collected from HYSYS. U is assumed 3000 kJ/(h∙m2∙K)
and Ft is assumed 1 [22]. The reboilers are not modeled as heat exchangers, hence there is no
readout of the correction factor.
Equipment cost is determined by equation C.2 [22]:
𝐶𝑒 = 𝑎 + 𝑏𝑆𝑛 (C.2)
Where Ce is the equipment cost (Jan 2010, U.S.Gulf coast USD), a, b, and n are equipment
specific cost constants and S is the sizing parameter.
Table C.1: Cost parameters for sizing, including sizing parameter range.
Equipment S Bound a b n
Reboiler 10-500 m2 29000 400 0.9
Compressor 75-30,000 kW 580000 20000 0.6
The reboiler has an upper sizing bound of 500 m2. The size of the reboiler exceed this, but
extrapolation is assumed valid for this purpose. The final purchase cost of equipment is
calculated by multiplying with a material factor, fm. The compressors are assumed made of
carbon steel, with fm equal to 1. The COL-400 reboiler is assumed made of titanium while the
COL-401 reboiler is assumed made of stainless steel (SS304). The material factor is assumed
1.65 and 1.3 respectively [4, 22].

88
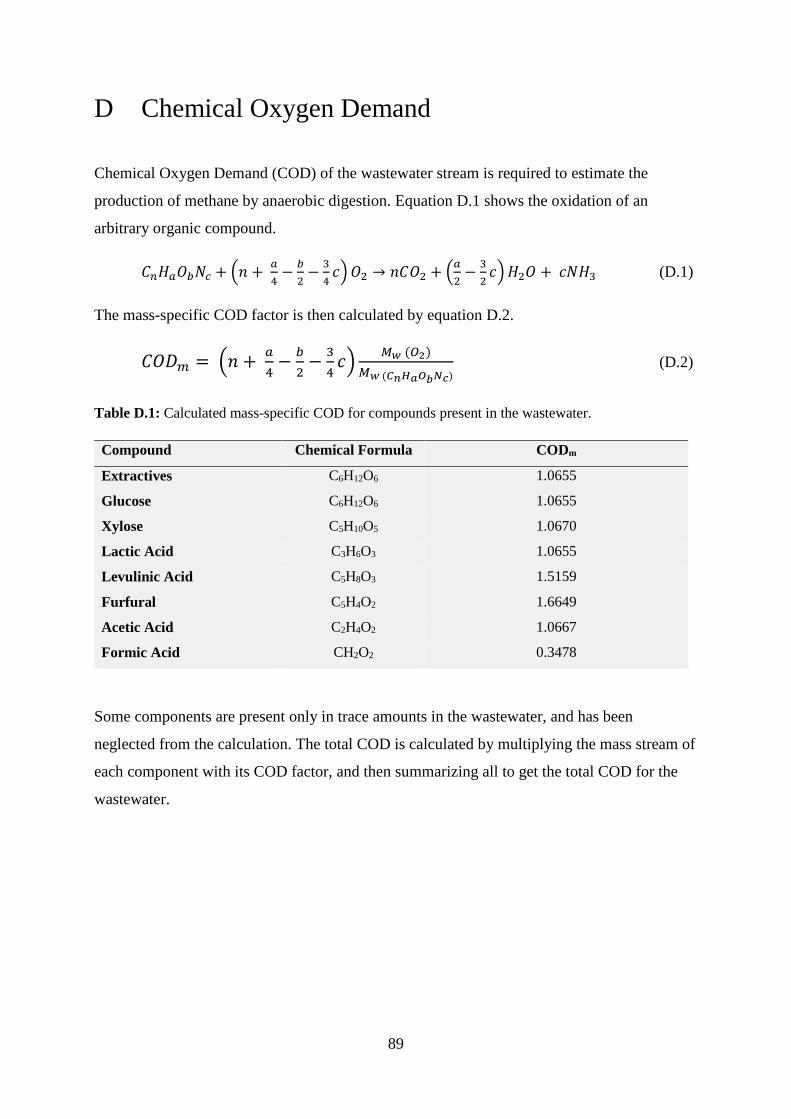
89
D Chemical Oxygen Demand
Chemical Oxygen Demand (COD) of the wastewater stream is required to estimate the
production of methane by anaerobic digestion. Equation D.1 shows the oxidation of an
arbitrary organic compound.
𝐶𝑛𝐻𝑎𝑂𝑏𝑁𝑐 + (𝑛 + 𝑎
4−
𝑏
2−
3
4𝑐) 𝑂2 → 𝑛𝐶𝑂2 + (
𝑎
2−
3
2𝑐) 𝐻2𝑂 + 𝑐𝑁𝐻3 (D.1)
The mass-specific COD factor is then calculated by equation D.2.
𝐶𝑂𝐷𝑚 = (𝑛 + 𝑎
4−
𝑏
2−
3
4𝑐)
𝑀𝑤 (𝑂2)
𝑀𝑤 (𝐶𝑛𝐻𝑎𝑂𝑏𝑁𝑐) (D.2)
Table D.1: Calculated mass-specific COD for compounds present in the wastewater.
Compound Chemical Formula CODm
Extractives C6H12O6 1.0655
Glucose C6H12O6 1.0655
Xylose C5H10O5 1.0670
Lactic Acid C3H6O3 1.0655
Levulinic Acid C5H8O3 1.5159
Furfural C5H4O2 1.6649
Acetic Acid C2H4O2 1.0667
Formic Acid CH2O2 0.3478
Some components are present only in trace amounts in the wastewater, and has been
neglected from the calculation. The total COD is calculated by multiplying the mass stream of
each component with its COD factor, and then summarizing all to get the total COD for the
wastewater.