Embed Size (px)
Citation preview

fluxicon
Copyright © 2010 Fluxicon
Process Mining Tutorial
Anne RozinatChristian W. Günther
26. April 2010
Web: http://fluxicon.comEmail: [email protected]: +31(0)62–4364201
fluxicon
Process Mining Tutorial
Problem
• IT-supported business processes are complex
• Lack of insight into what really happens
2
Manual process analysis is:- Time-consuming
- Incomplete
- Subjective
Manual process analysis:
• Time-consuming• Incomplete• Subjective
fluxicon
Process Mining Tutorial
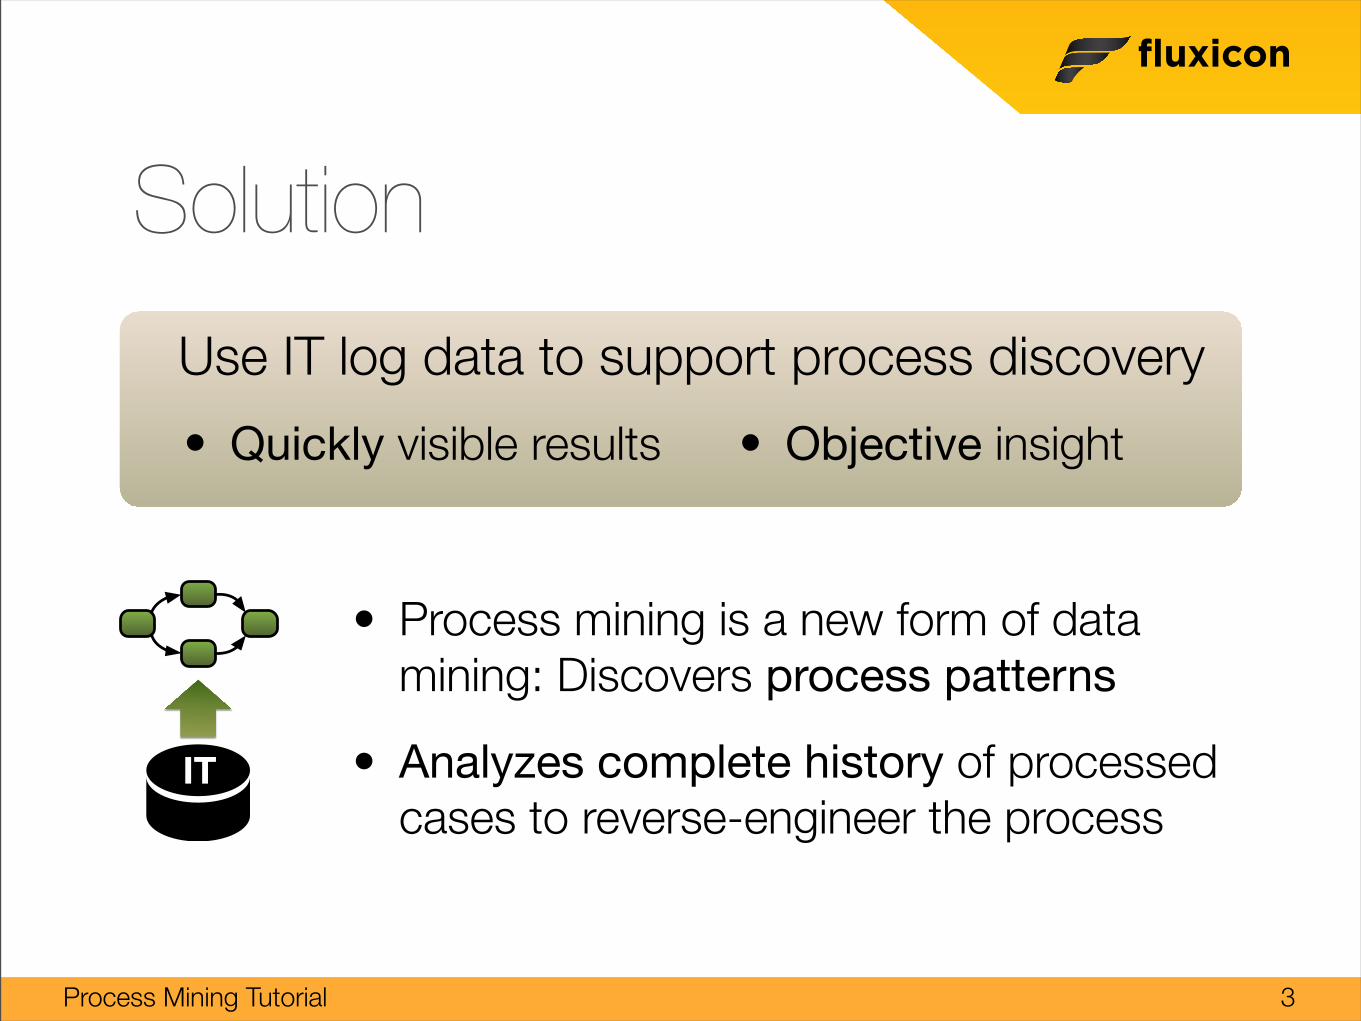
Use IT log data to support process discovery
Solution
3
• Process mining is a new form of data mining: Discovers process patterns
• Analyzes complete history of processed cases to reverse-engineer the process
IT
• Quickly visible results • Objective insight
fluxicon
Process Mining Tutorial
Fluxicon
4
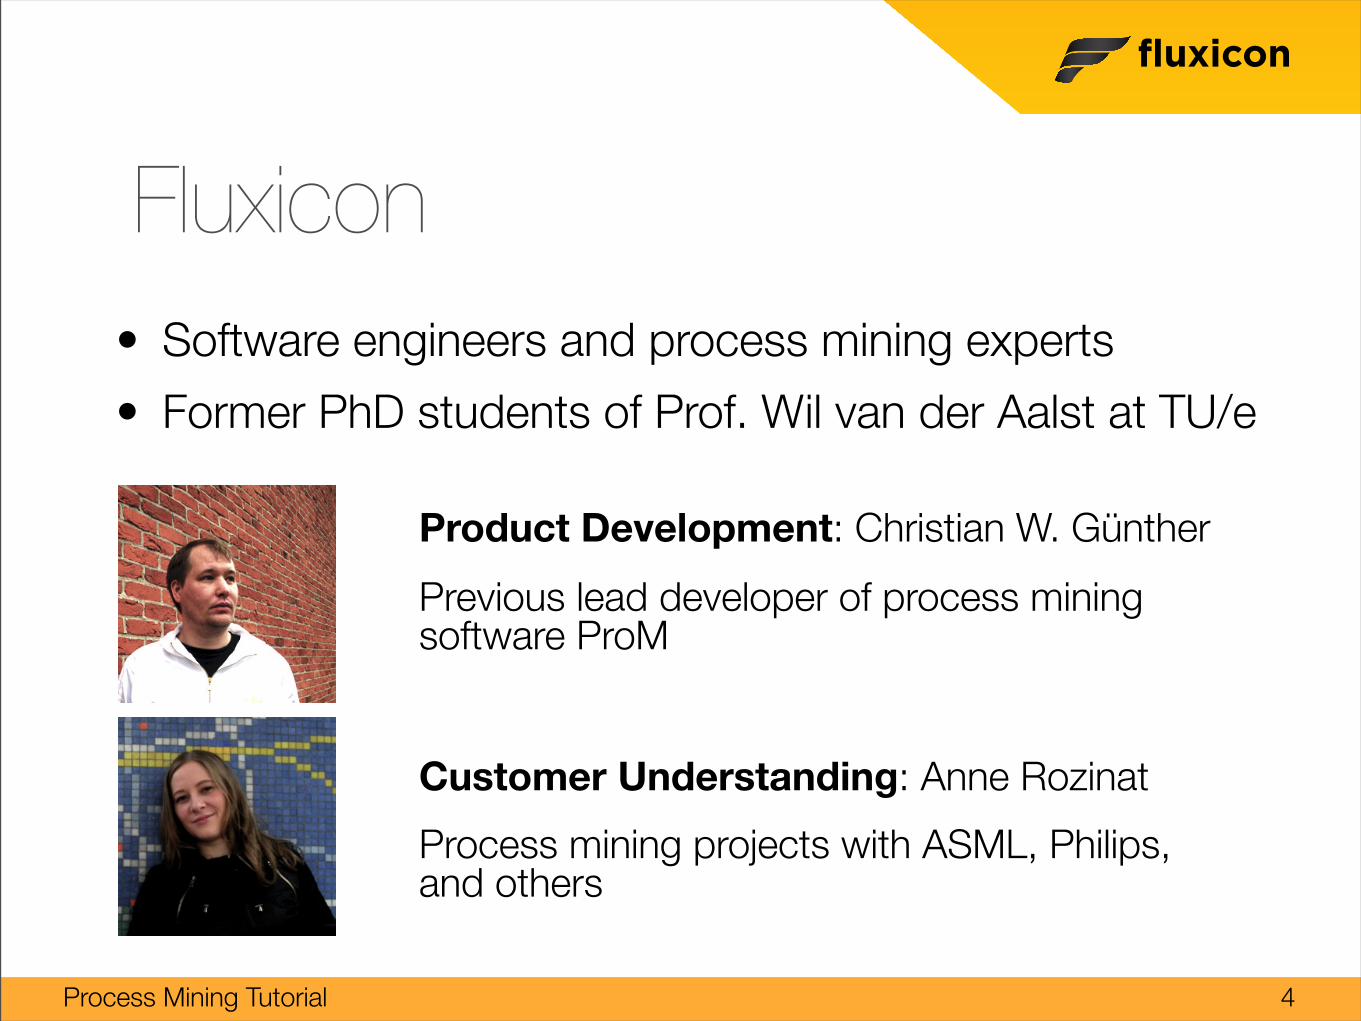
Product Development: Christian W. Günther
Previous lead developer of process mining software ProM
Customer Understanding: Anne Rozinat Process mining projects with ASML, Philips, and others
• Software engineers and process mining experts
• Former PhD students of Prof. Wil van der Aalst at TU/e
fluxicon
Process Mining Tutorial
Goals of this tutorial
• Understand phases of process mining analysis
• Be able to get started and play around with your own data
5
fluxicon
Process Mining Tutorial
Agenda
1. Introduction
2. Hands-on Tutorial• Example Scenario
• Roadmap• Process Mining Session
3. Conclusion
6
fluxicon
Process Mining Tutorial
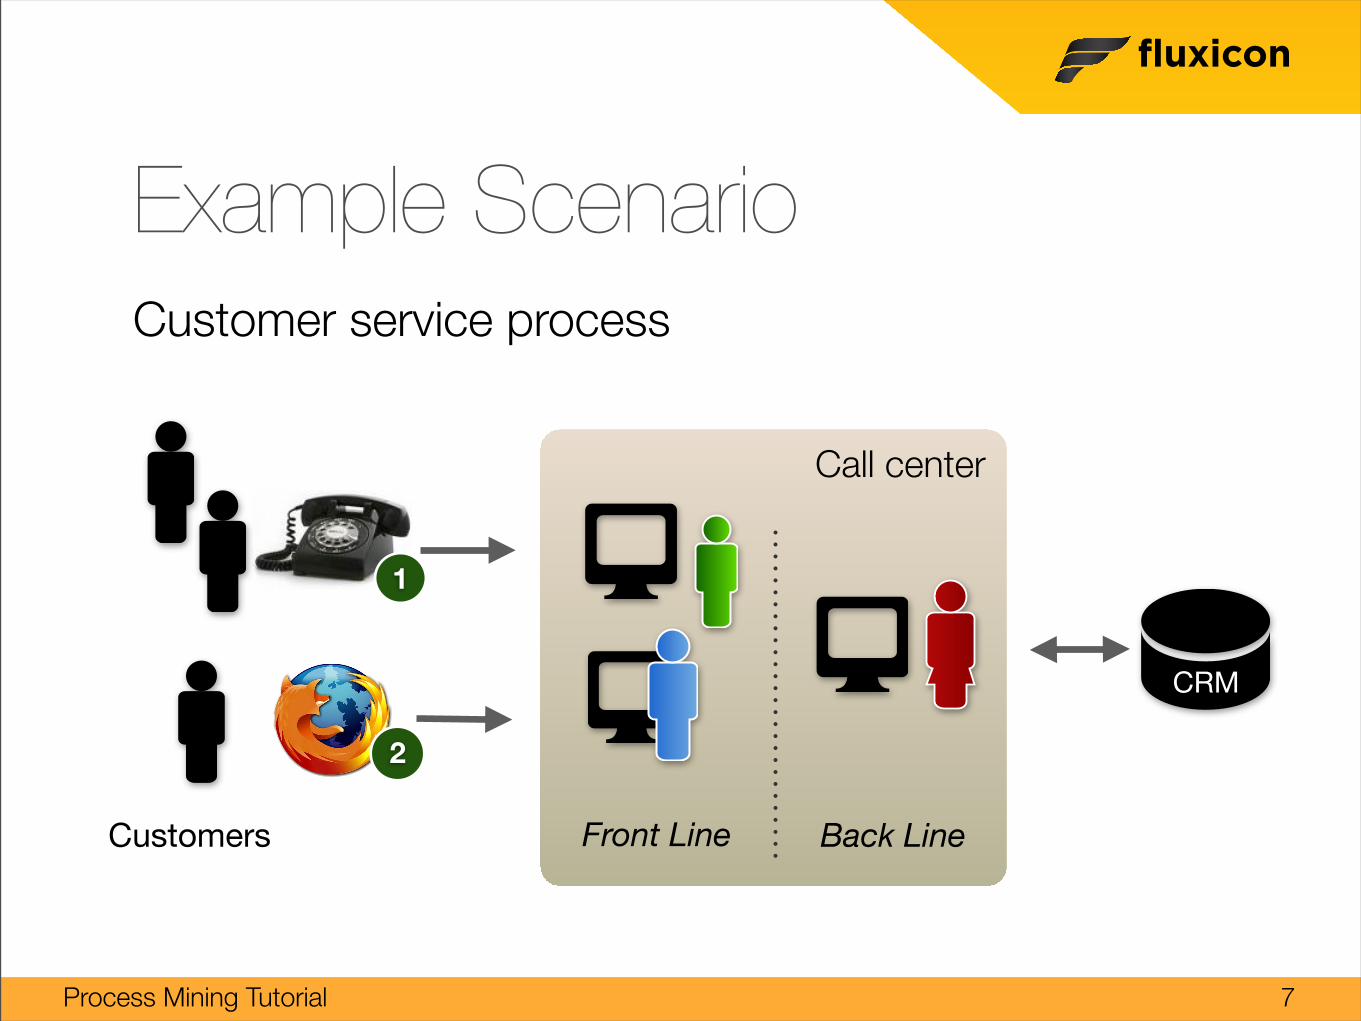
Call center
Example ScenarioCustomer service process
7
CRM
Front Line Back LineCustomers
1
2
fluxicon
Process Mining Tutorial
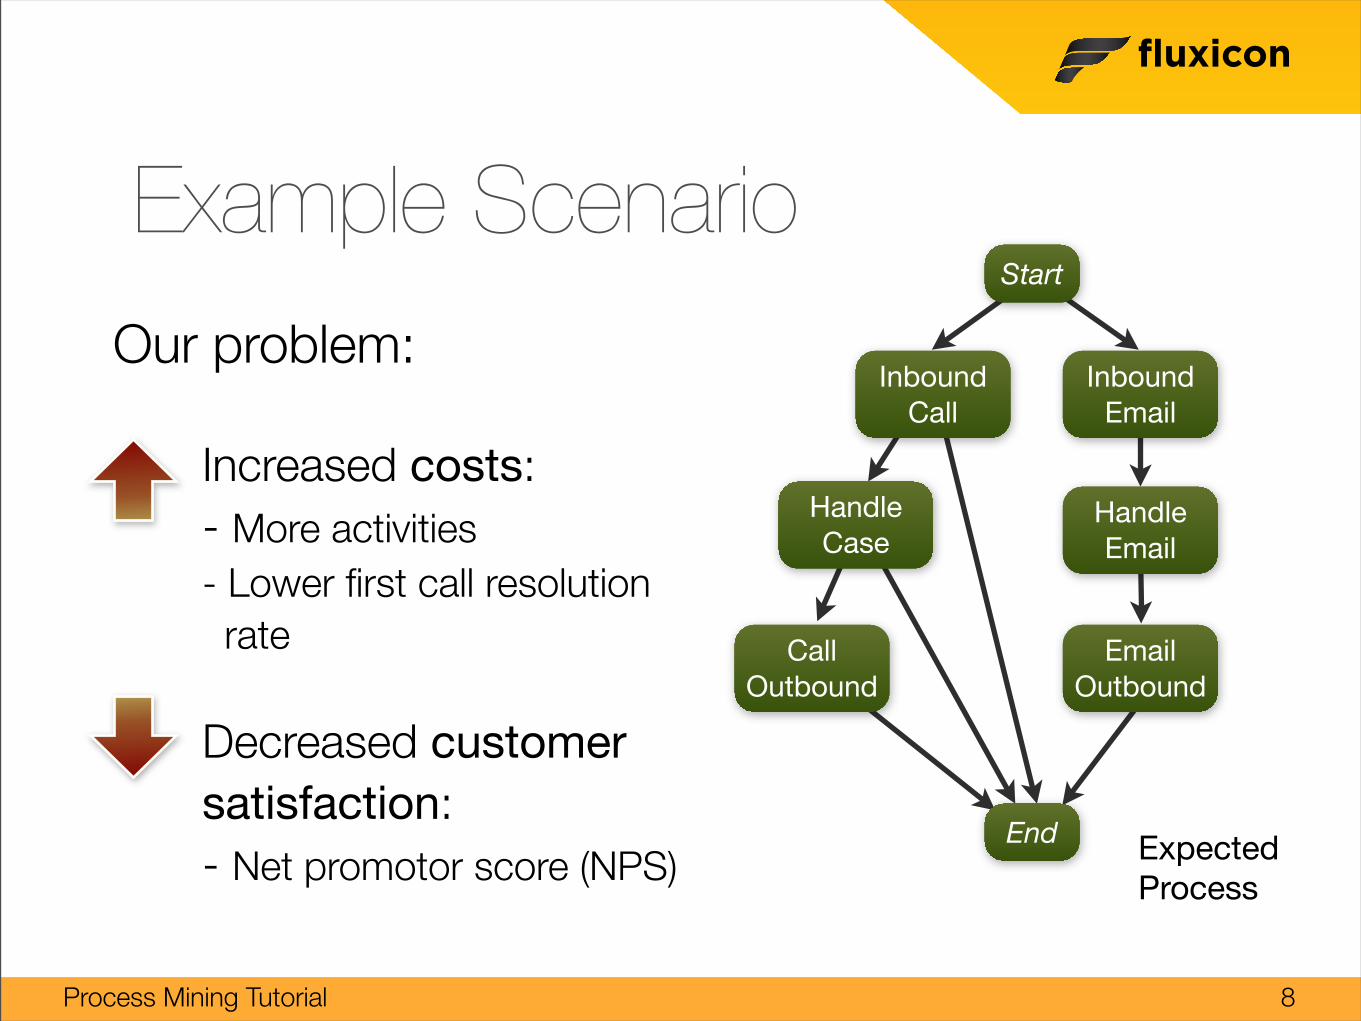
Example Scenario
Increased costs:- More activities- Lower first call resolution rate
Decreased customer satisfaction:- Net promotor score (NPS)
8
Expected Process
Our problem:Inbound
CallInbound
Handle Email
Email Outbound
Call Outbound
Handle Case
Start
End
fluxicon
Process Mining Tutorial
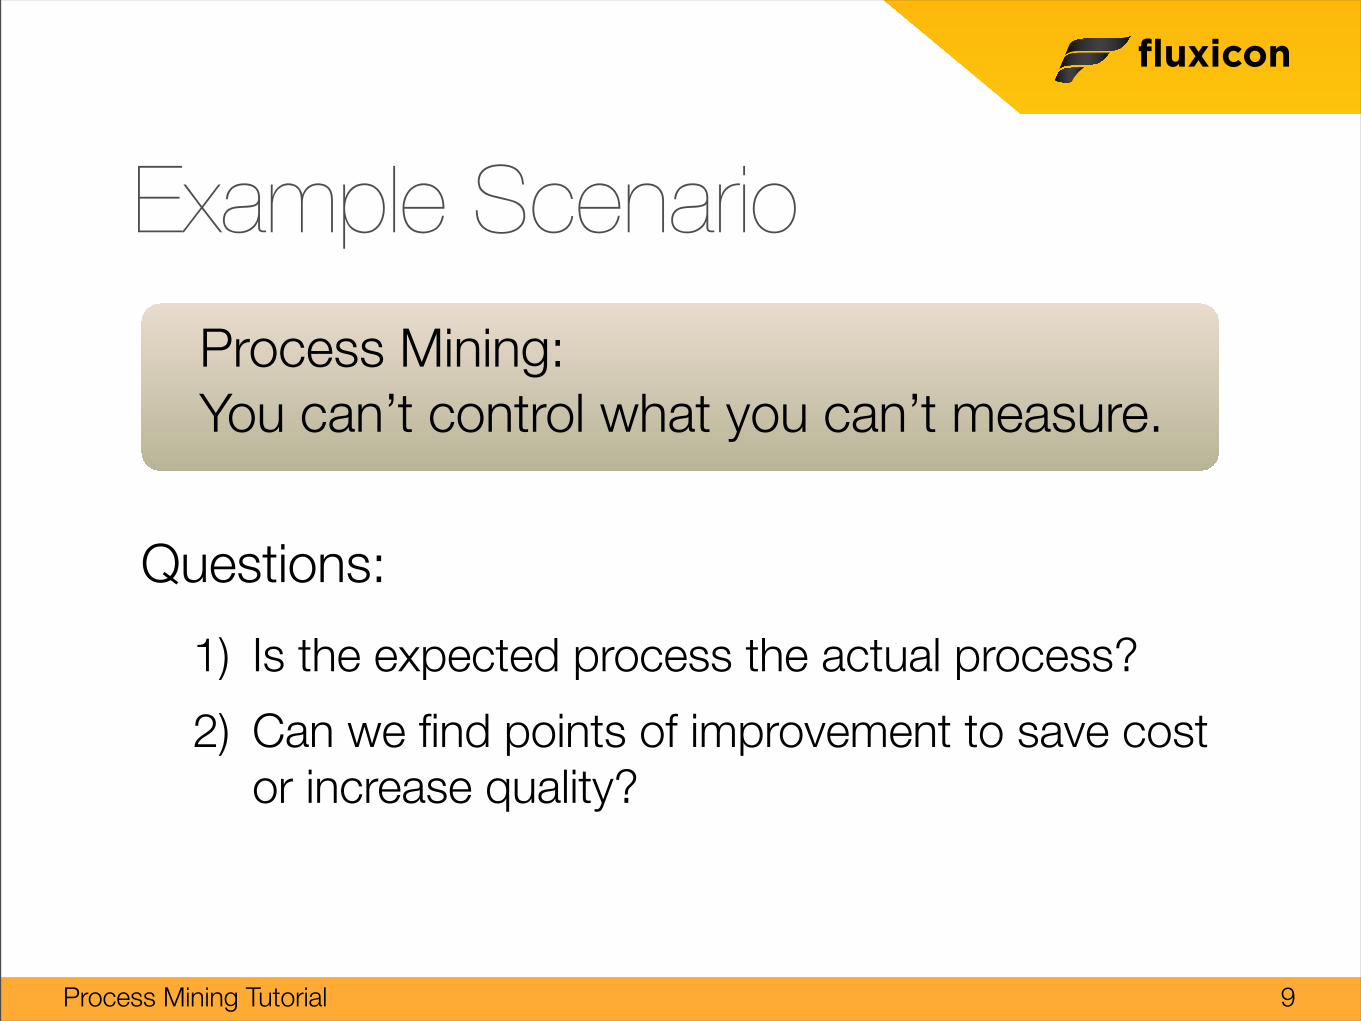
Example Scenario
Questions:
1) Is the expected process the actual process?
2) Can we find points of improvement to save cost or increase quality?
9
Process Mining: You can’t control what you can’t measure.
fluxicon
Process Mining Tutorial
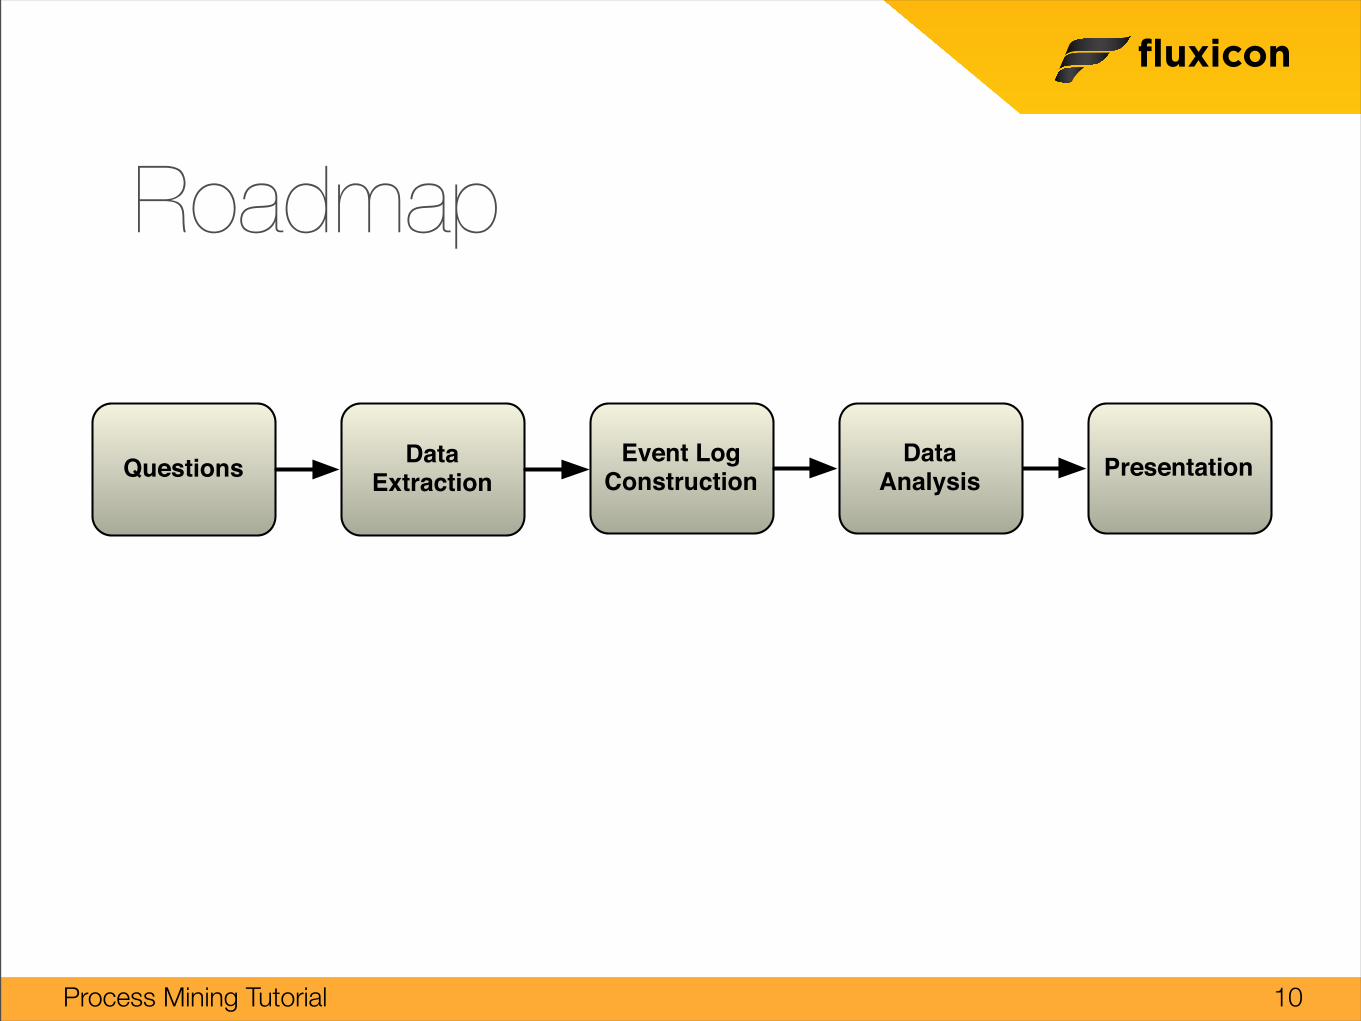
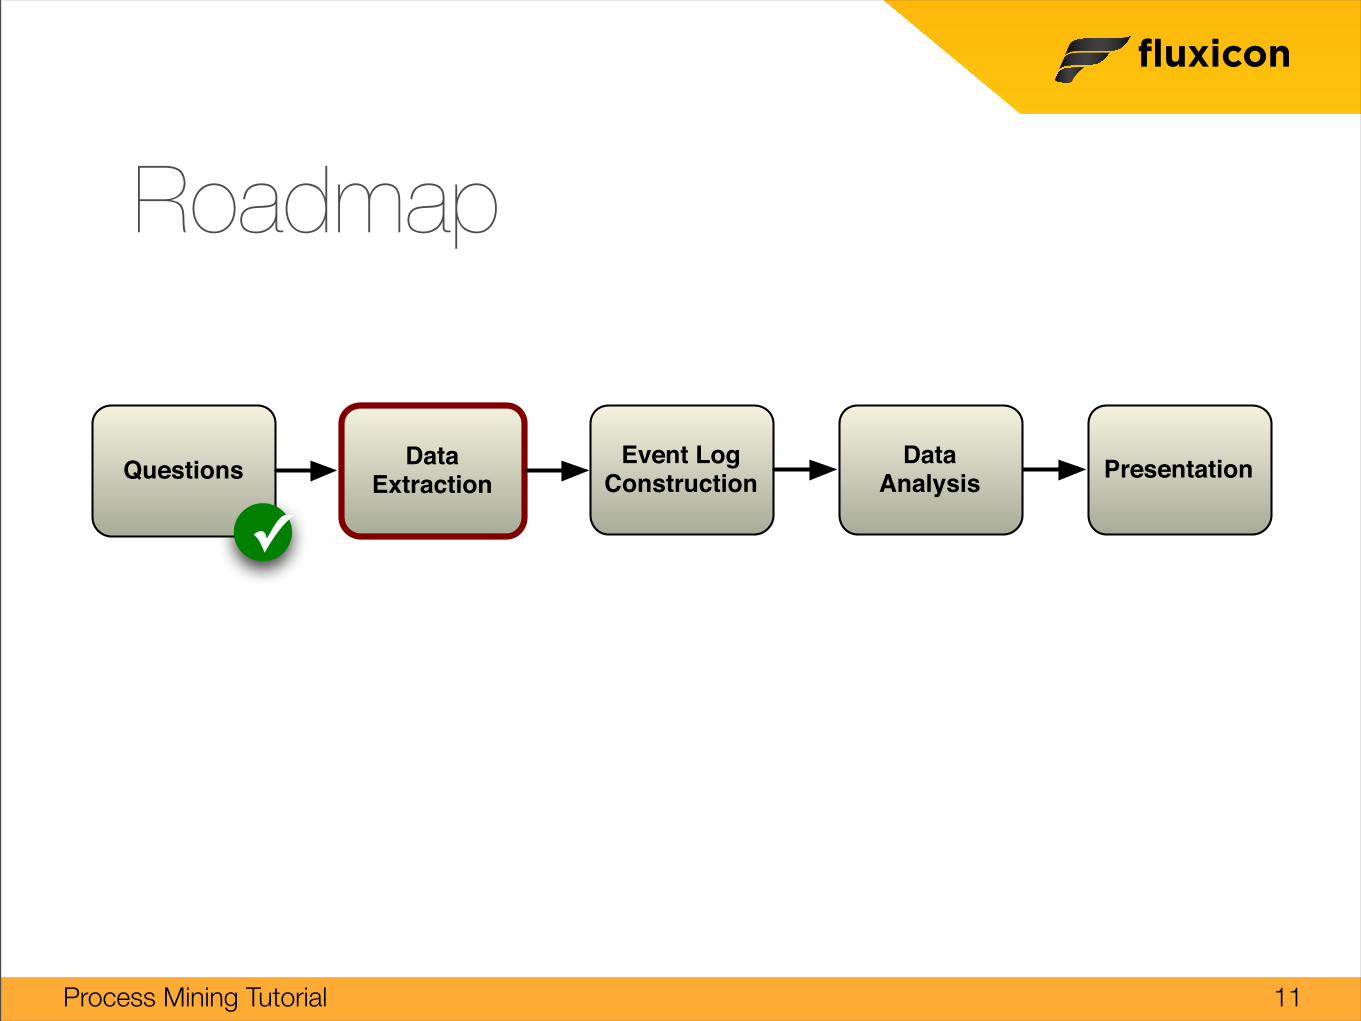
Roadmap
10
Questions Data Extraction Presentation Event Log
ConstructionData
Analysis
fluxicon
Process Mining Tutorial
Roadmap
11
Questions Data Extraction PresentationEvent Log
ConstructionData
Analysis
✓
fluxicon
Process Mining Tutorial
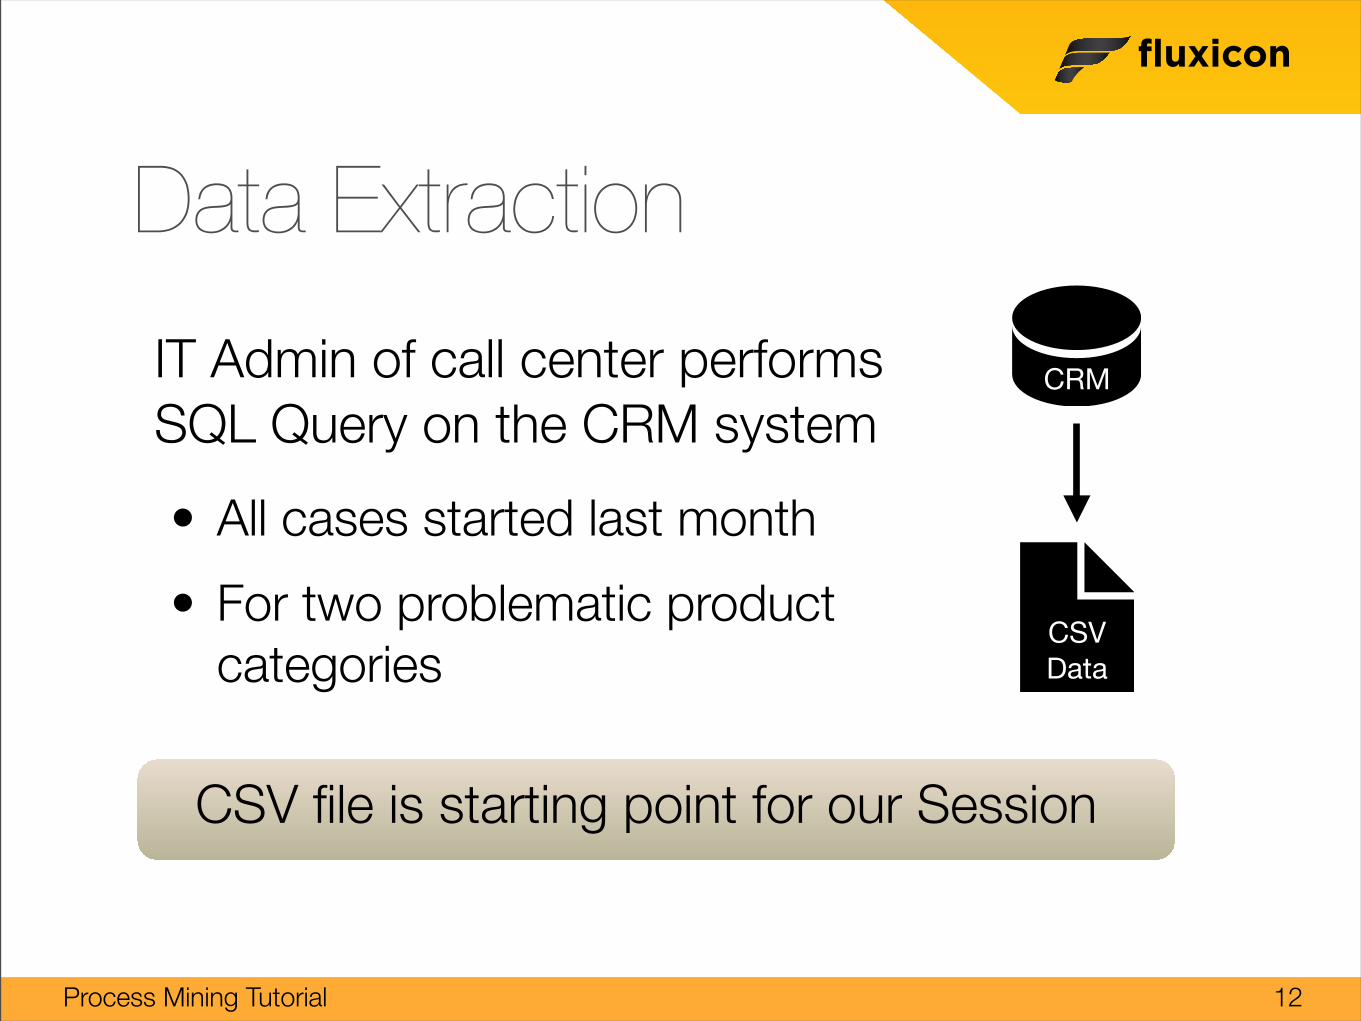
Data Extraction
IT Admin of call center performs SQL Query on the CRM system
• All cases started last month
• For two problematic product categories
12
CRM
CSVData
CSV file is starting point for our Session
fluxicon
Process Mining Tutorial
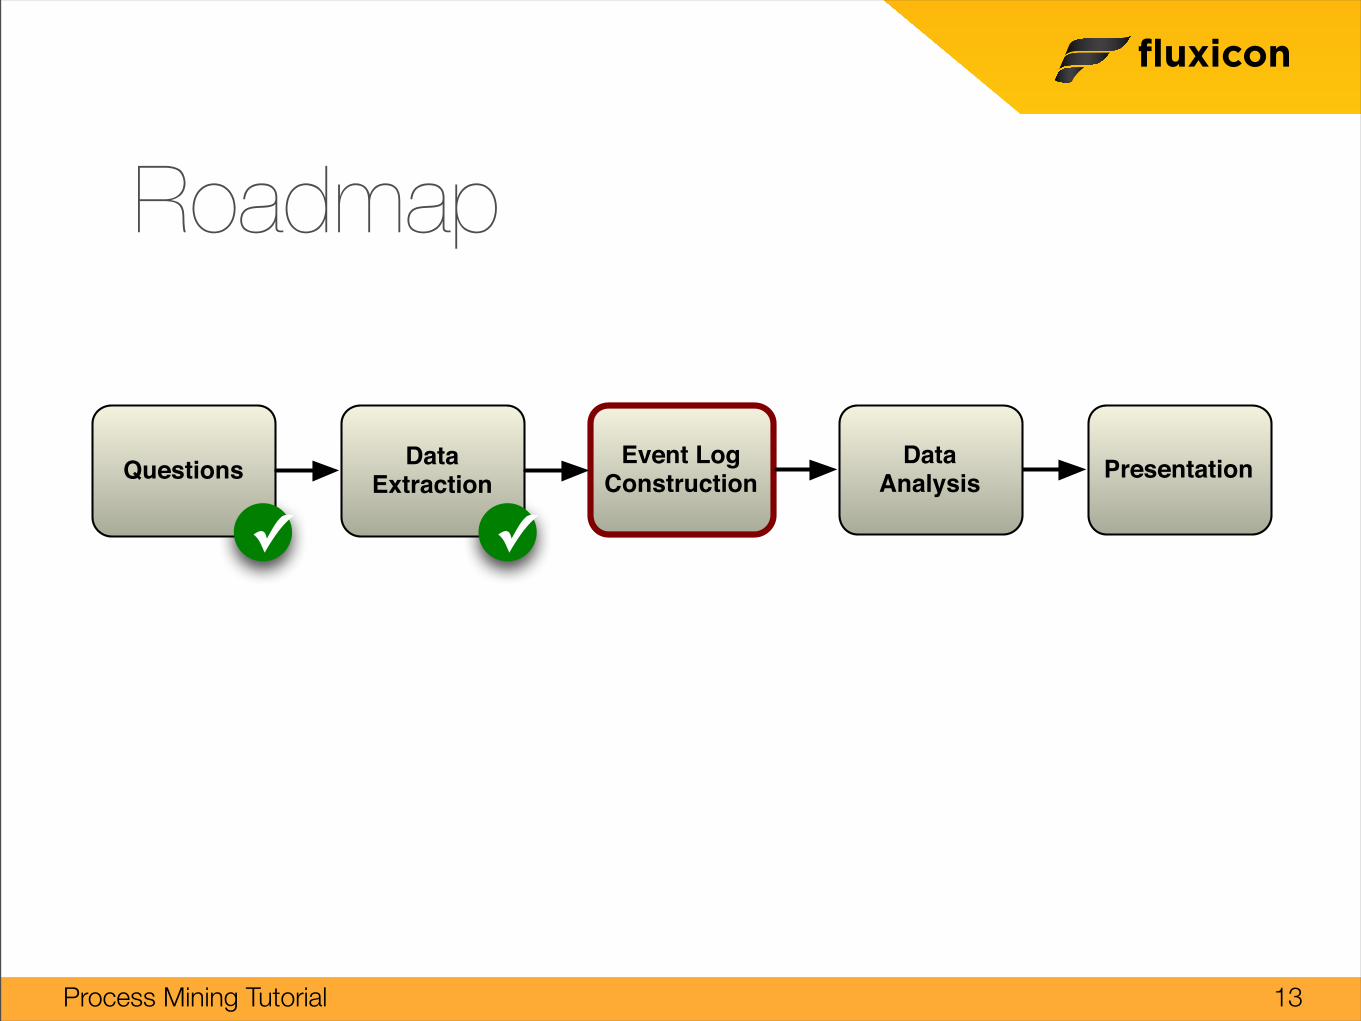
Roadmap
13
Questions Data Extraction PresentationEvent Log
ConstructionData
Analysis
✓ ✓
fluxicon
Process Mining Tutorial
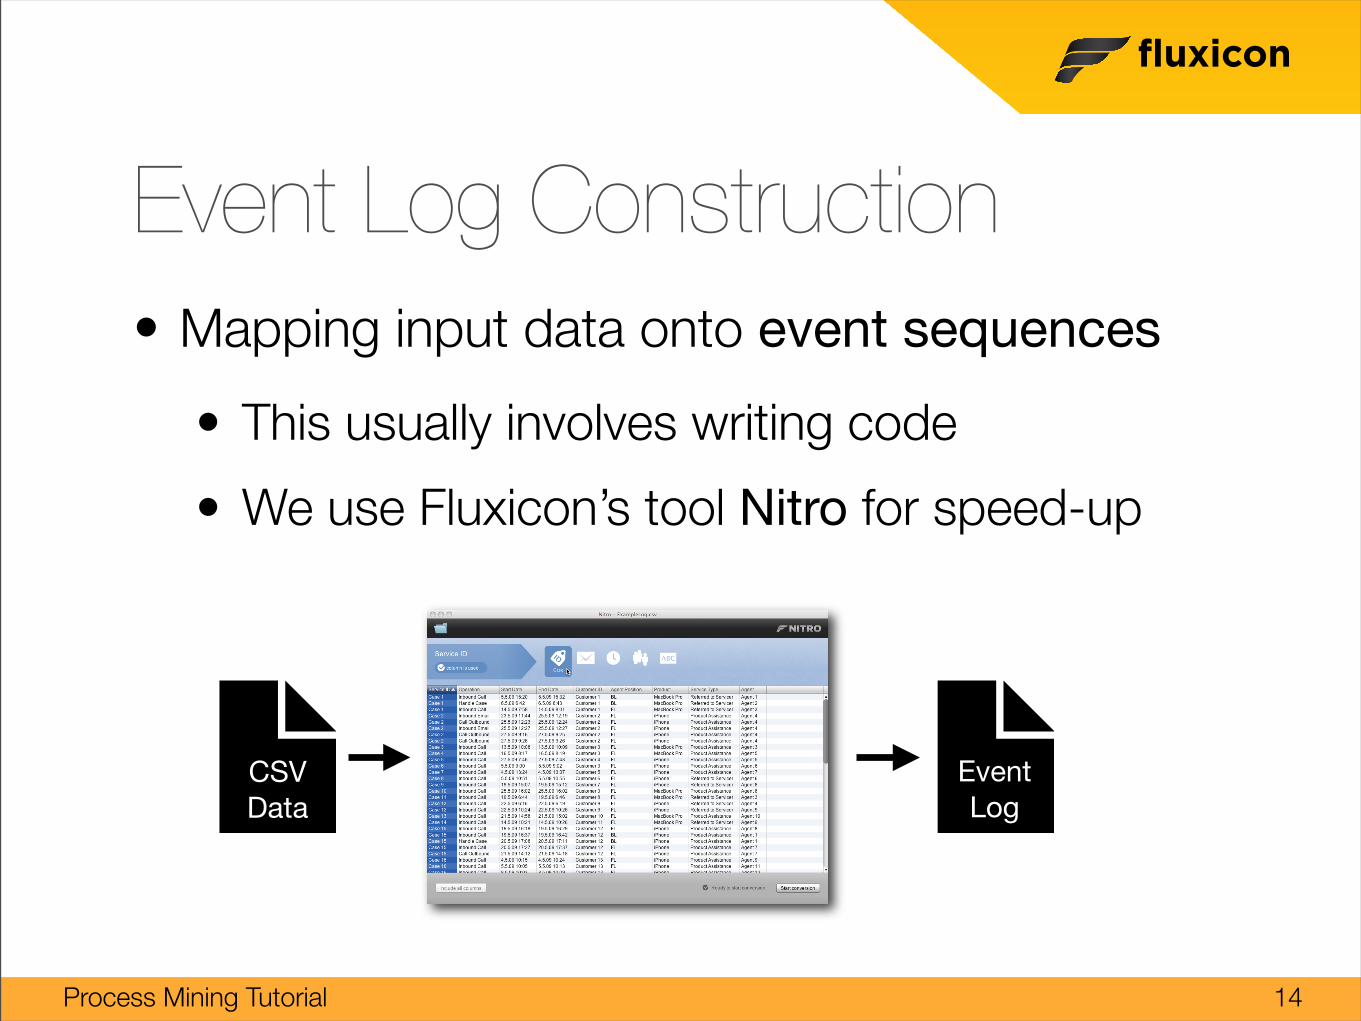
Event Log Construction • Mapping input data onto event sequences
• This usually involves writing code
• We use Fluxicon’s tool Nitro for speed-up
14
CSVData
EventLog
fluxicon
Process Mining Tutorial
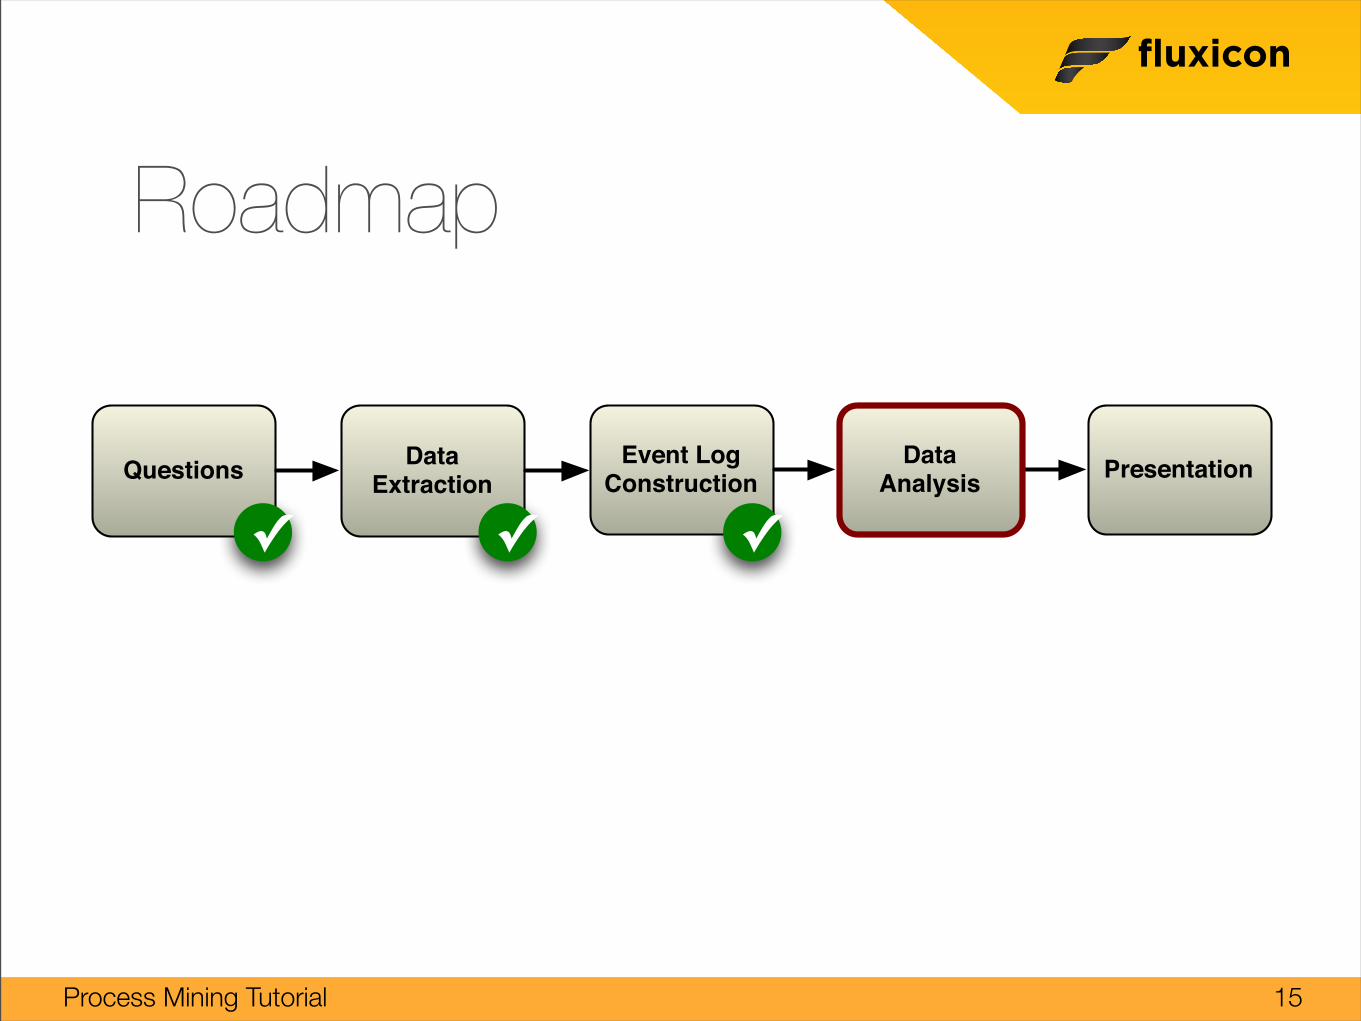
Roadmap
15
Questions Data Extraction PresentationEvent Log
ConstructionData
Analysis
✓ ✓ ✓
fluxicon
Process Mining Tutorial
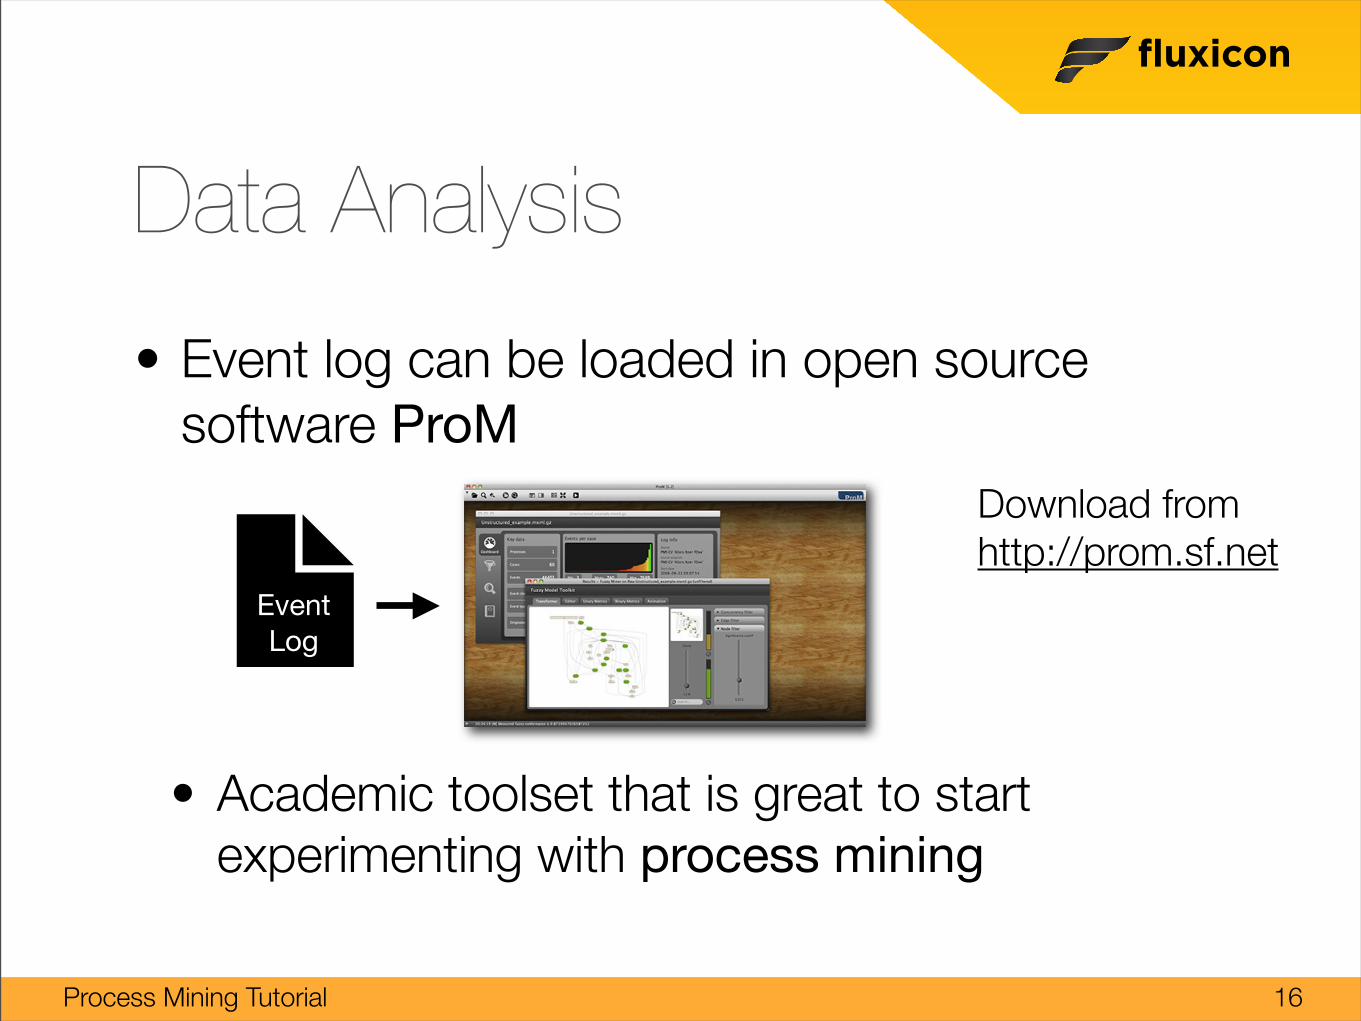
Data Analysis
• Event log can be loaded in open source software ProM
• Academic toolset that is great to start experimenting with process mining
16
Download from http://prom.sf.net
EventLog
fluxicon
Process Mining Tutorial
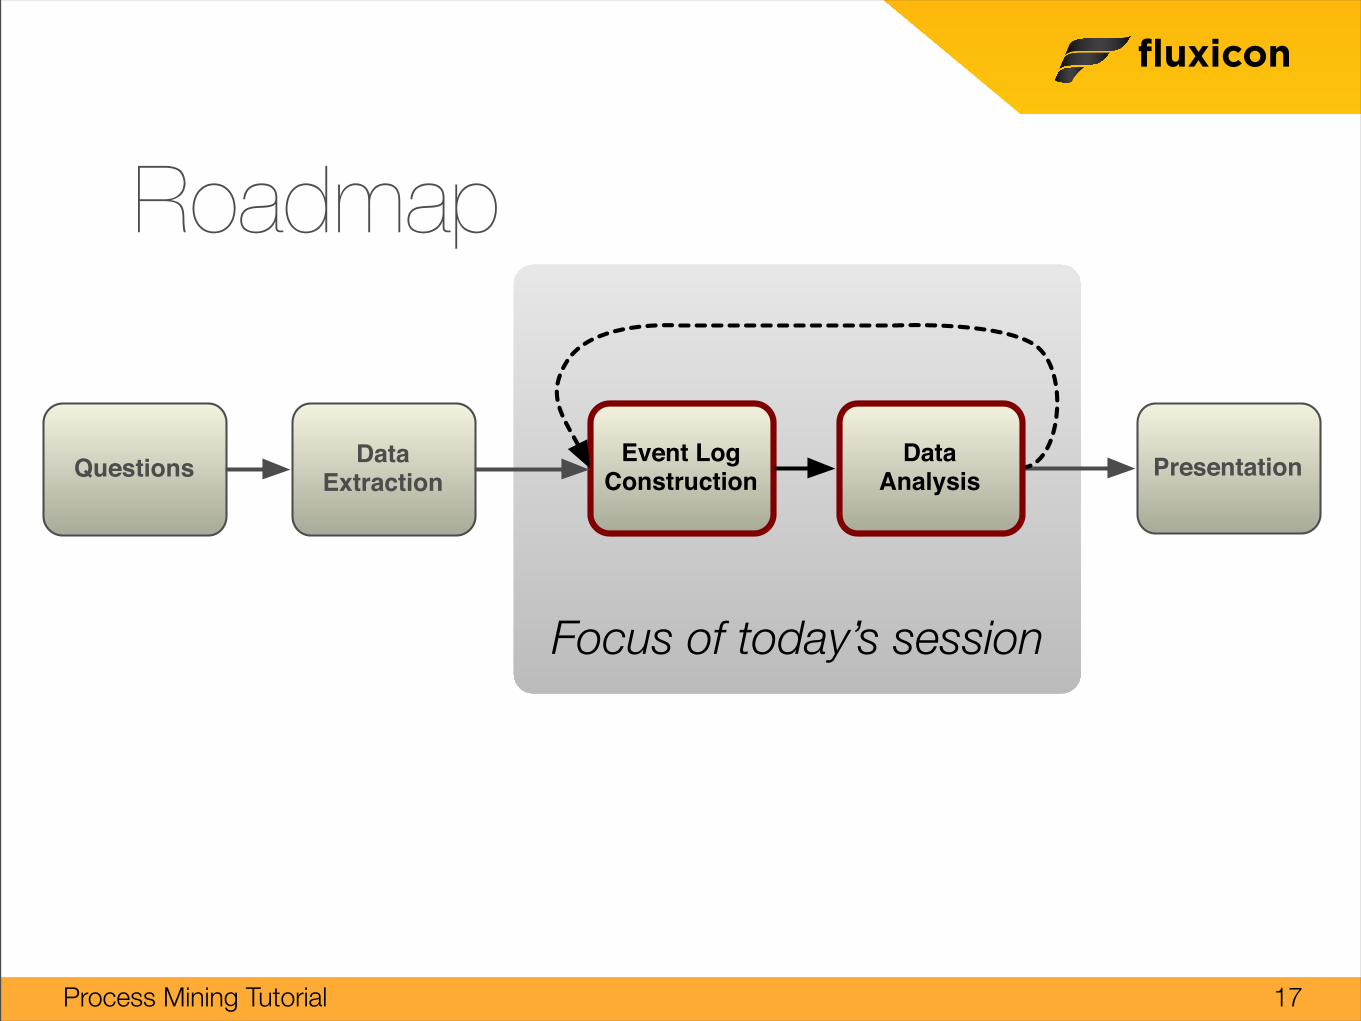
Roadmap
17
Questions Data Extraction PresentationEvent Log
ConstructionData
Analysis
Focus of today’s session
fluxicon
Process Mining Tutorial
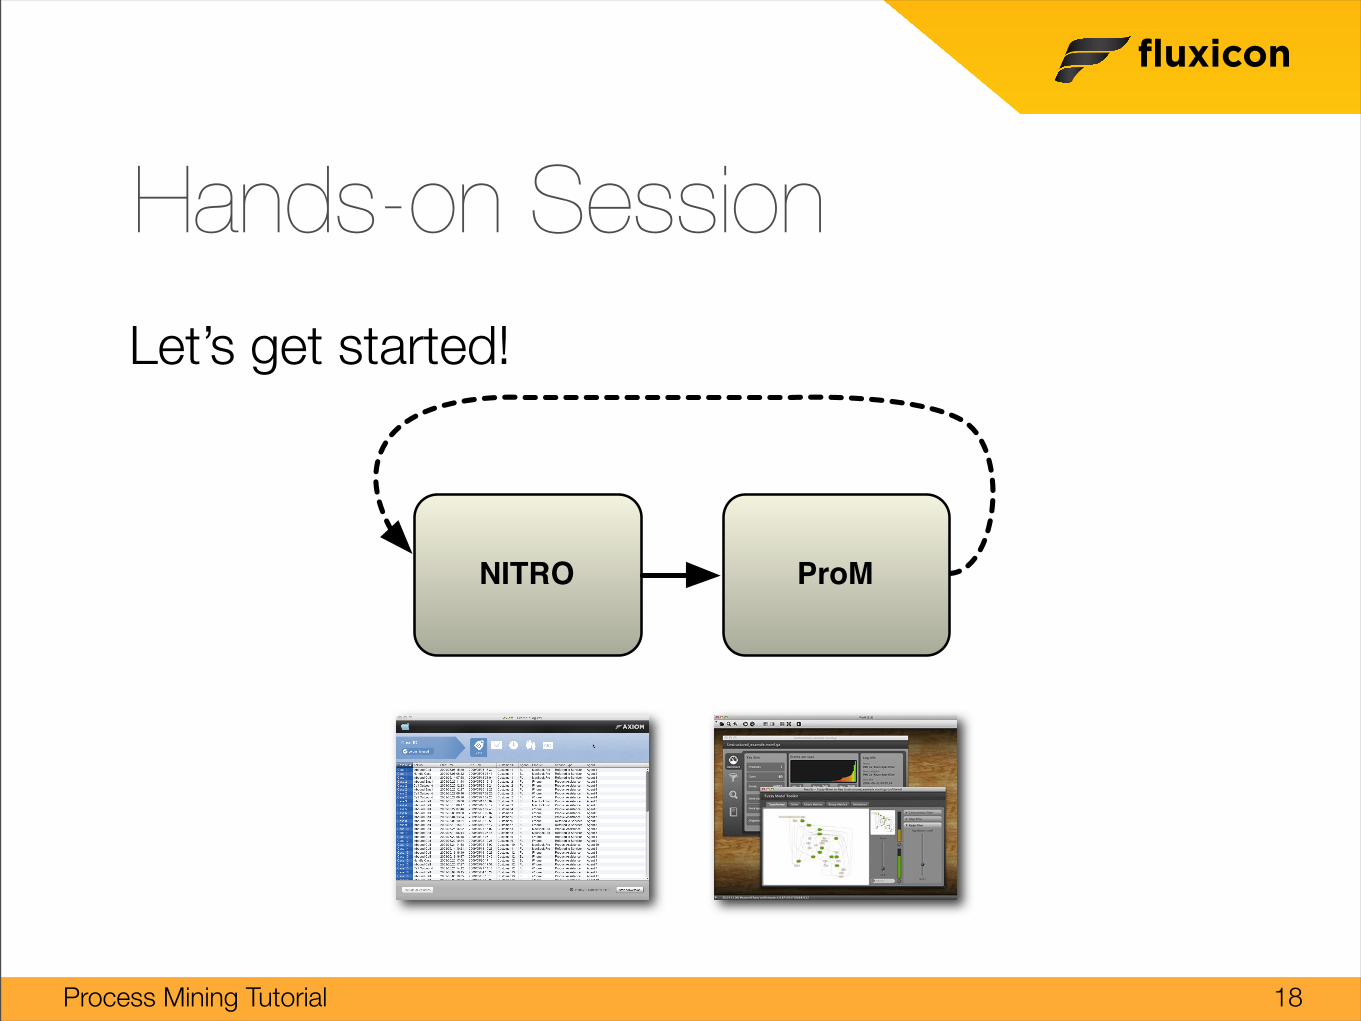
Hands-on Session Let’s get started!
18
NITRO ProM
fluxicon
Process Mining Tutorial
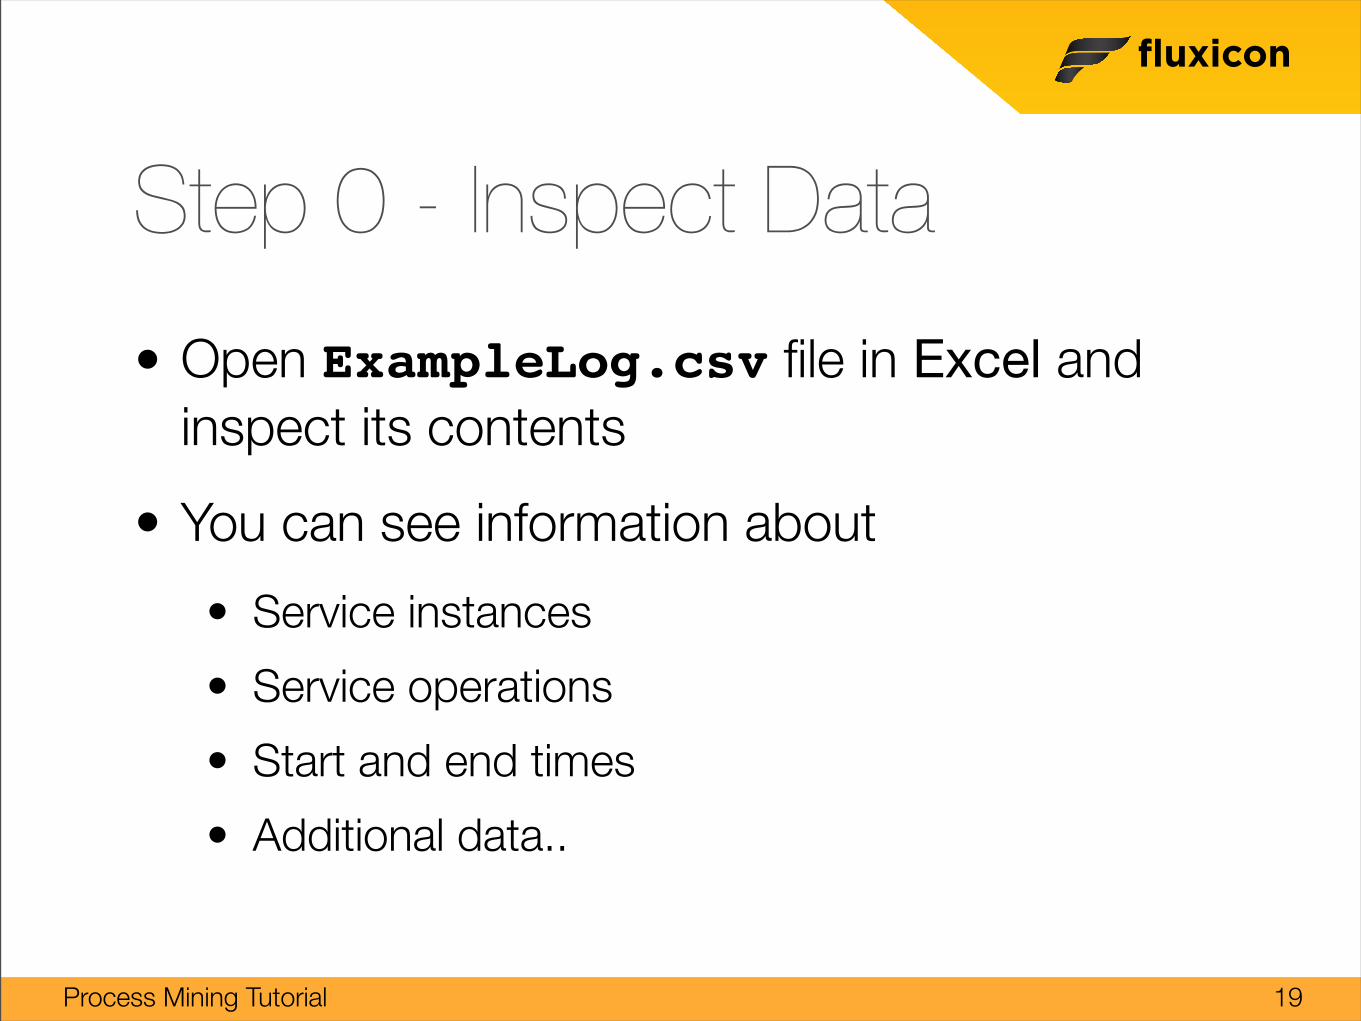
Step 0 - Inspect Data
• Open ExampleLog.csv file in Excel and inspect its contents
• You can see information about
• Service instances
• Service operations
• Start and end times
• Additional data..
19
fluxicon
Process Mining Tutorial
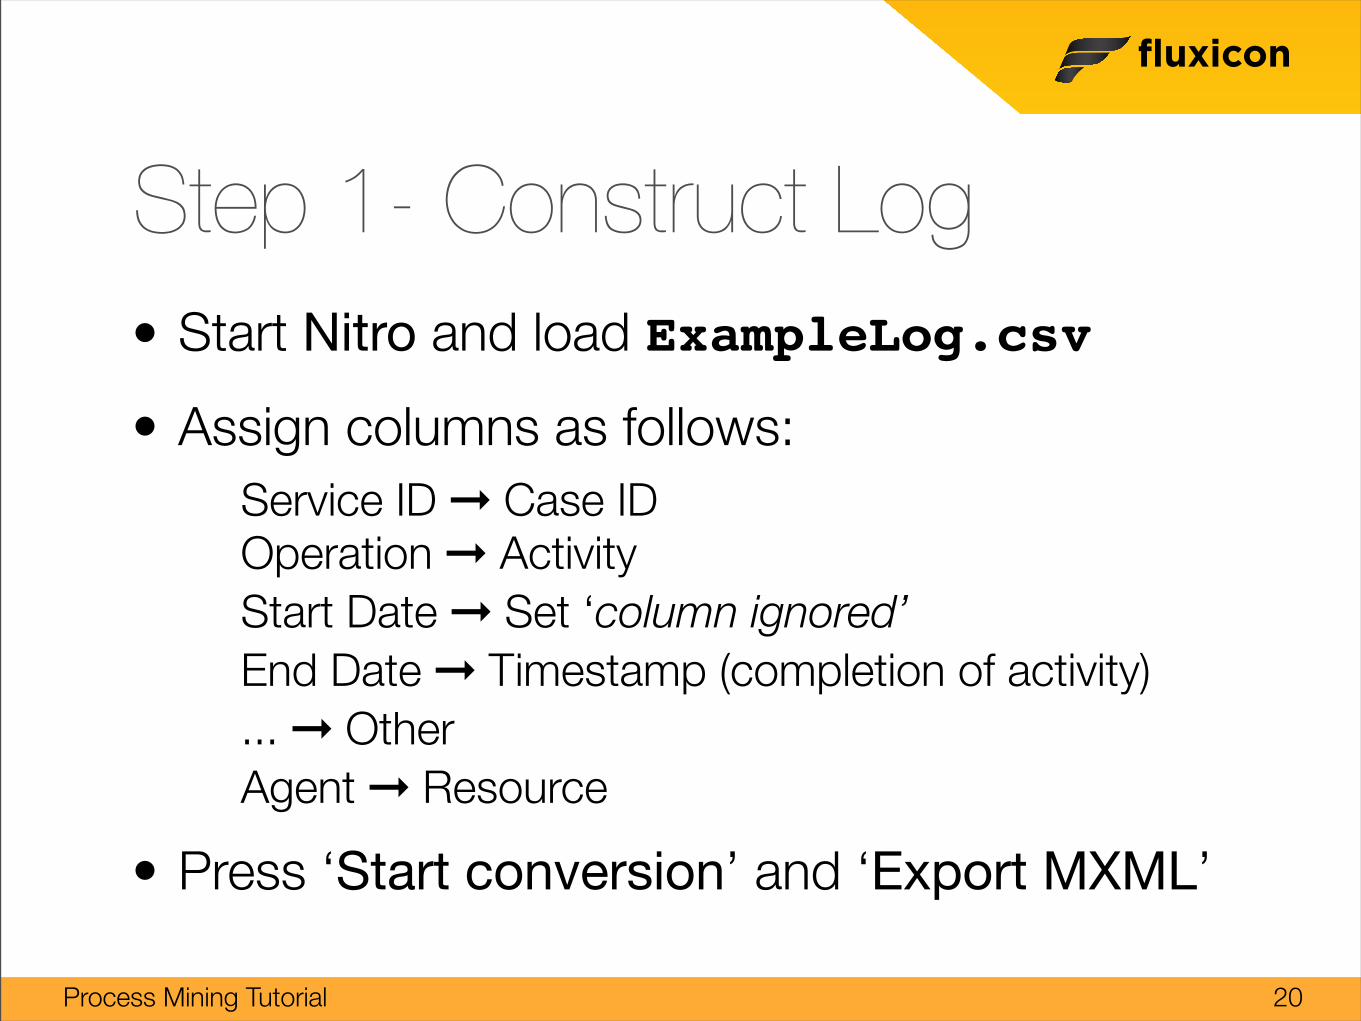
Step 1- Construct Log• Start Nitro and load ExampleLog.csv
• Assign columns as follows:Service ID ➞ Case IDOperation ➞ ActivityStart Date ➞ Set ‘column ignored’End Date ➞ Timestamp (completion of activity)... ➞ OtherAgent ➞ Resource
• Press ‘Start conversion’ and ‘Export MXML’
20
fluxicon
Process Mining Tutorial
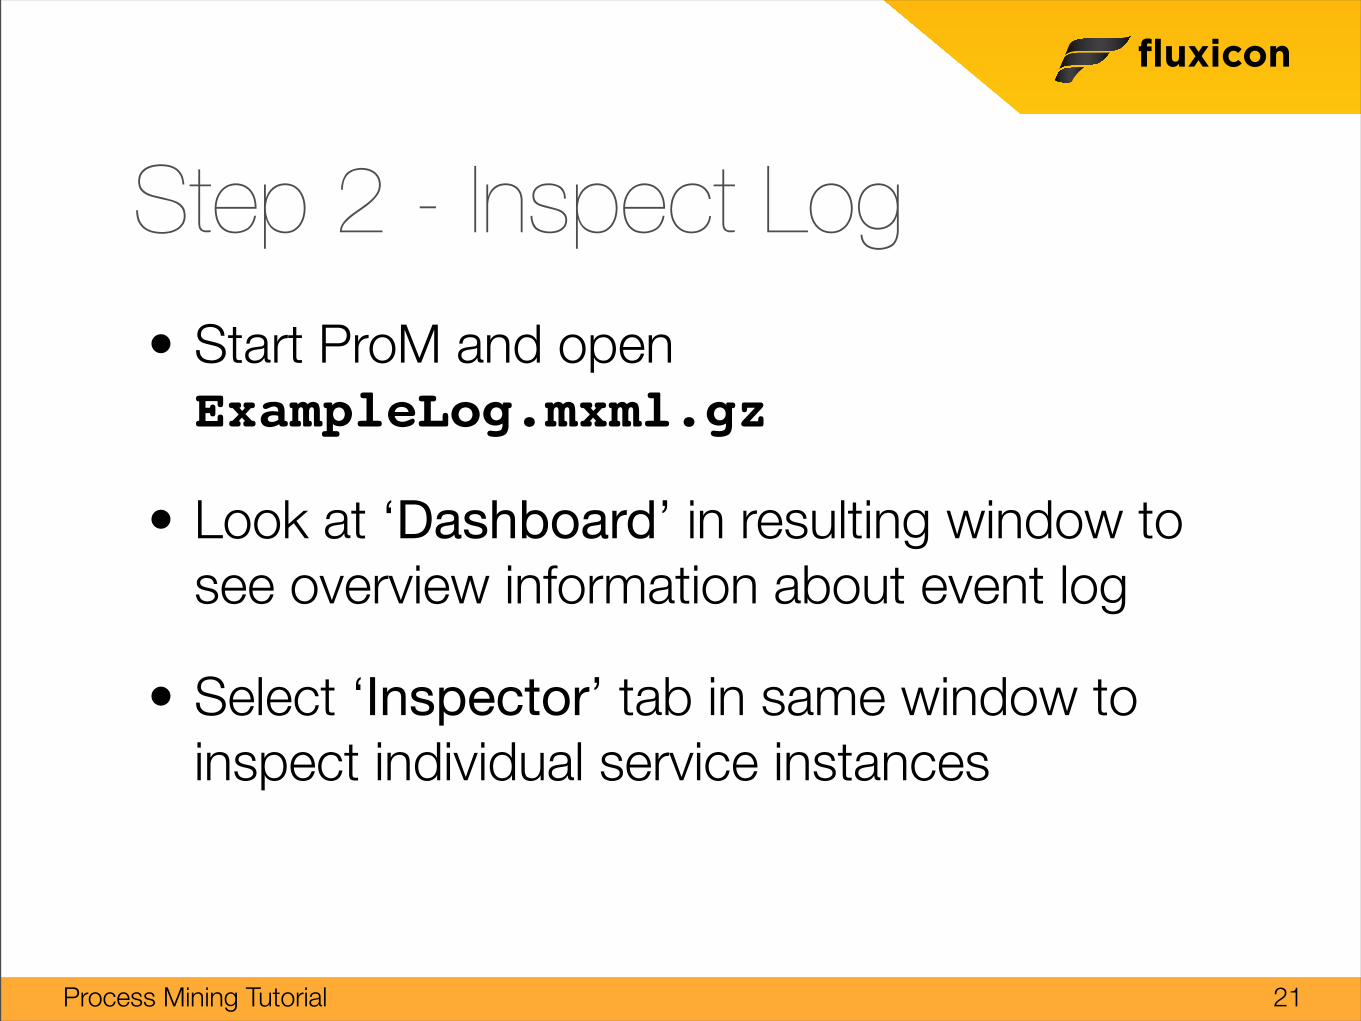
Step 2 - Inspect Log• Start ProM and open ExampleLog.mxml.gz
• Look at ‘Dashboard’ in resulting window to see overview information about event log
• Select ‘Inspector’ tab in same window to inspect individual service instances
21
fluxicon
Process Mining Tutorial
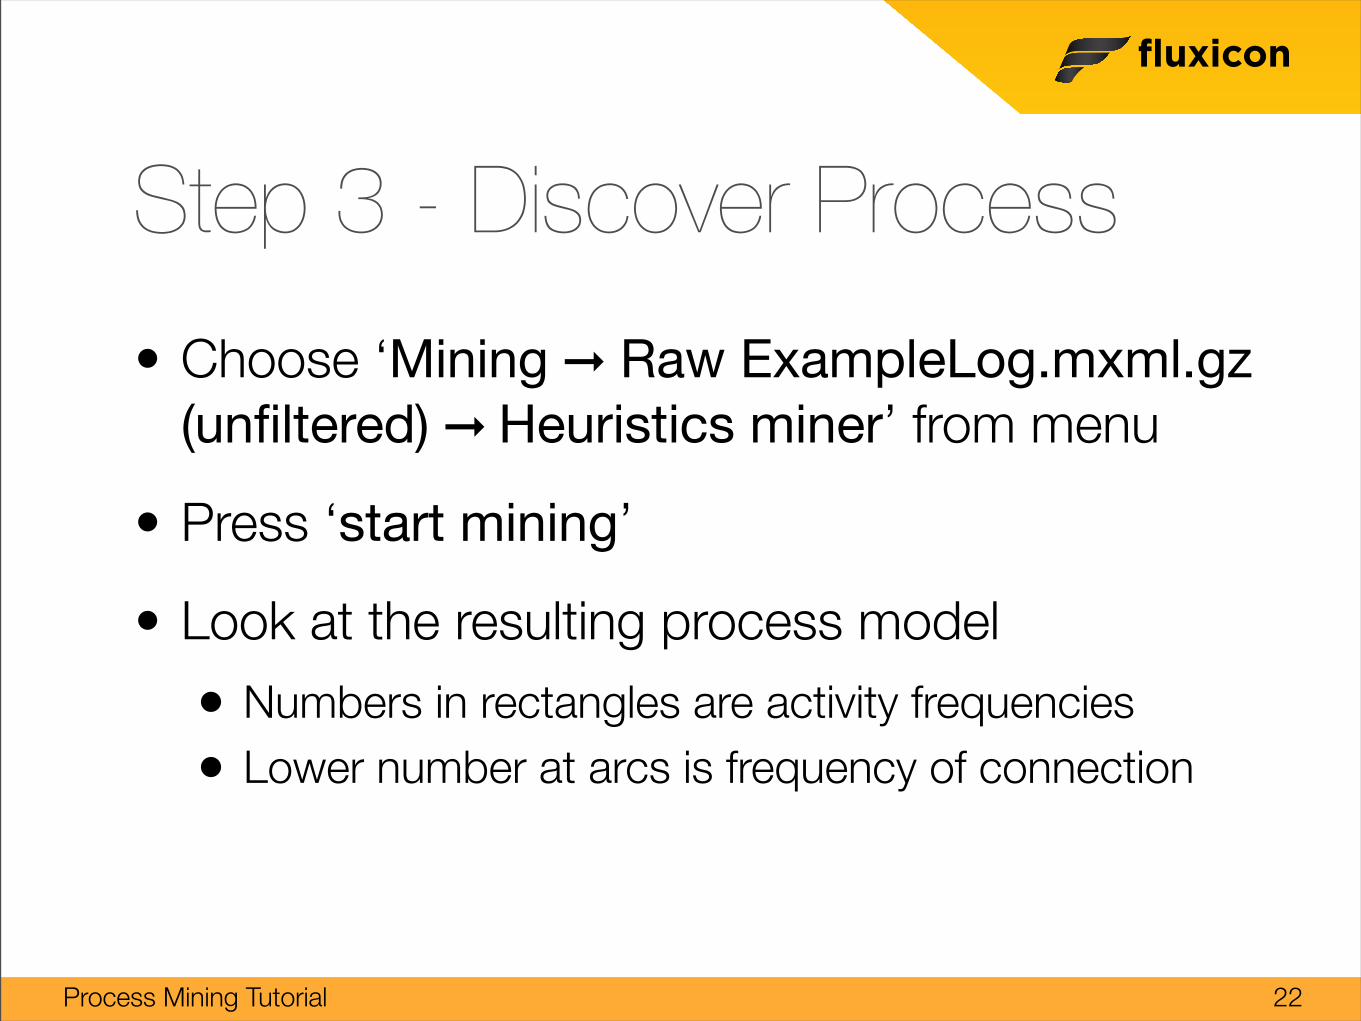
Step 3 - Discover Process
• Choose ‘Mining ➞ Raw ExampleLog.mxml.gz (unfiltered) ➞ Heuristics miner’ from menu
• Press ‘start mining’
• Look at the resulting process model
• Numbers in rectangles are activity frequencies
• Lower number at arcs is frequency of connection
22
fluxicon
Process Mining Tutorial
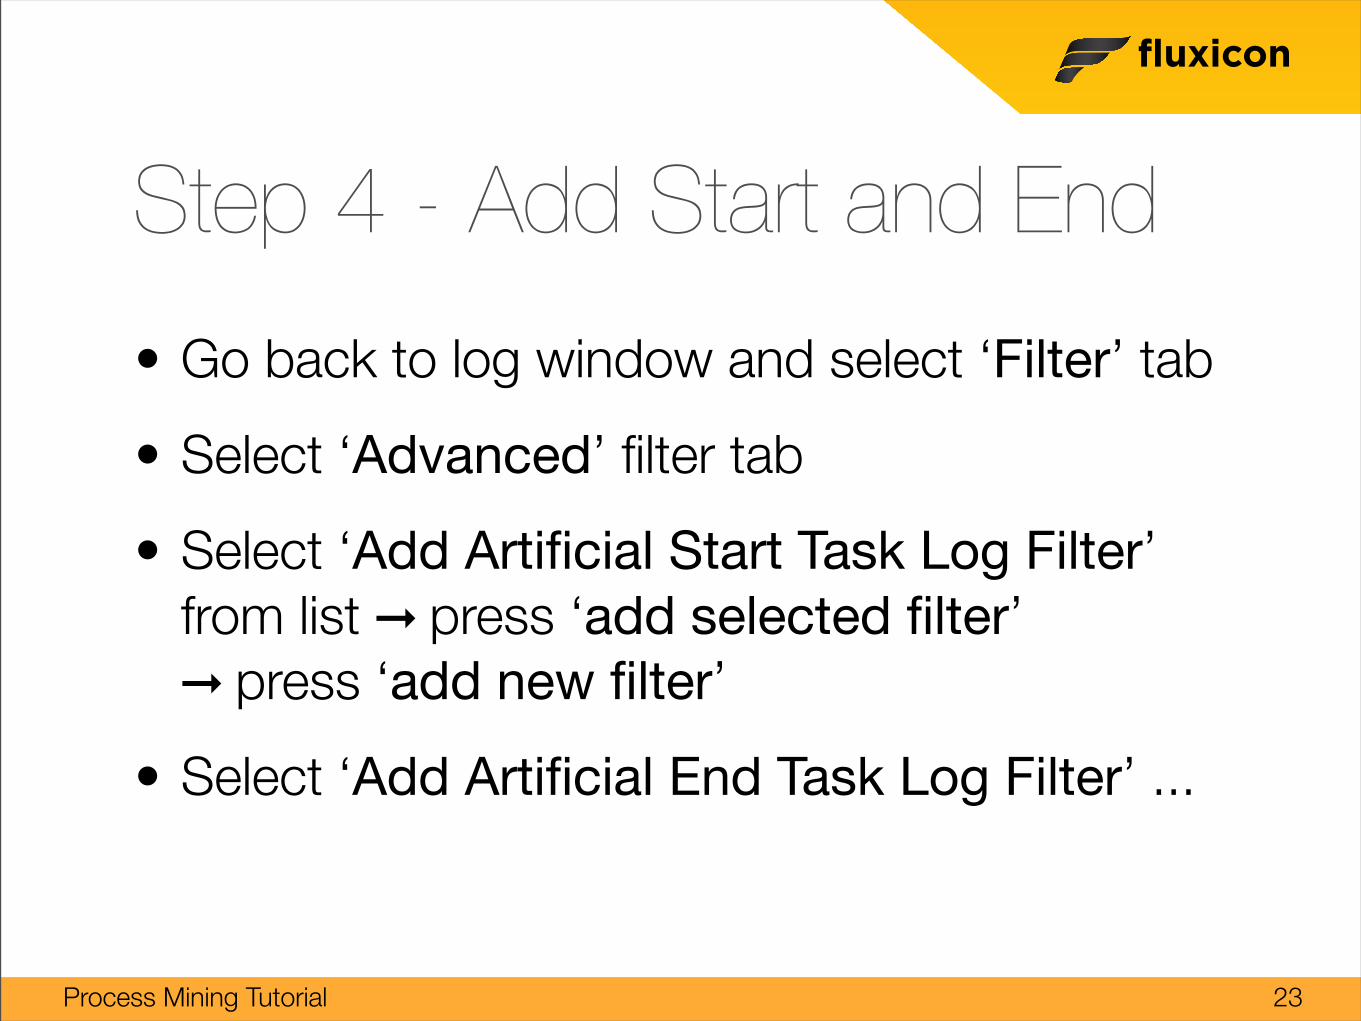
Step 4 - Add Start and End
• Go back to log window and select ‘Filter’ tab
• Select ‘Advanced’ filter tab
• Select ‘Add Artificial Start Task Log Filter’ from list ➞ press ‘add selected filter’ ➞ press ‘add new filter’
• Select ‘Add Artificial End Task Log Filter’ ...
23
fluxicon
Process Mining Tutorial
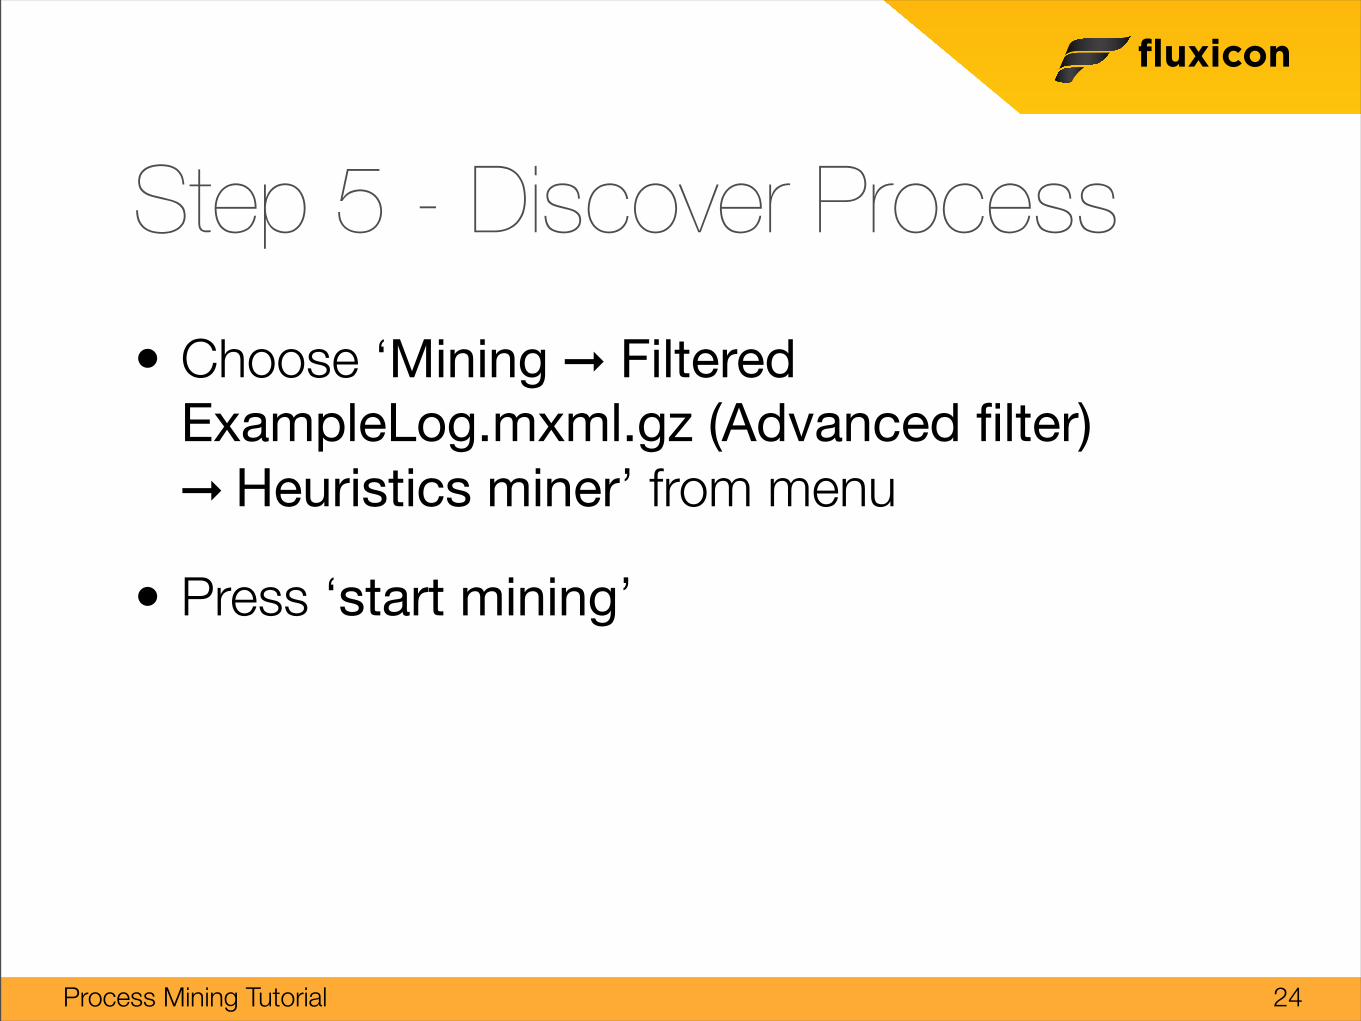
Step 5 - Discover Process
• Choose ‘Mining ➞ Filtered ExampleLog.mxml.gz (Advanced filter) ➞ Heuristics miner’ from menu
• Press ‘start mining’
24
fluxicon
Process Mining Tutorial
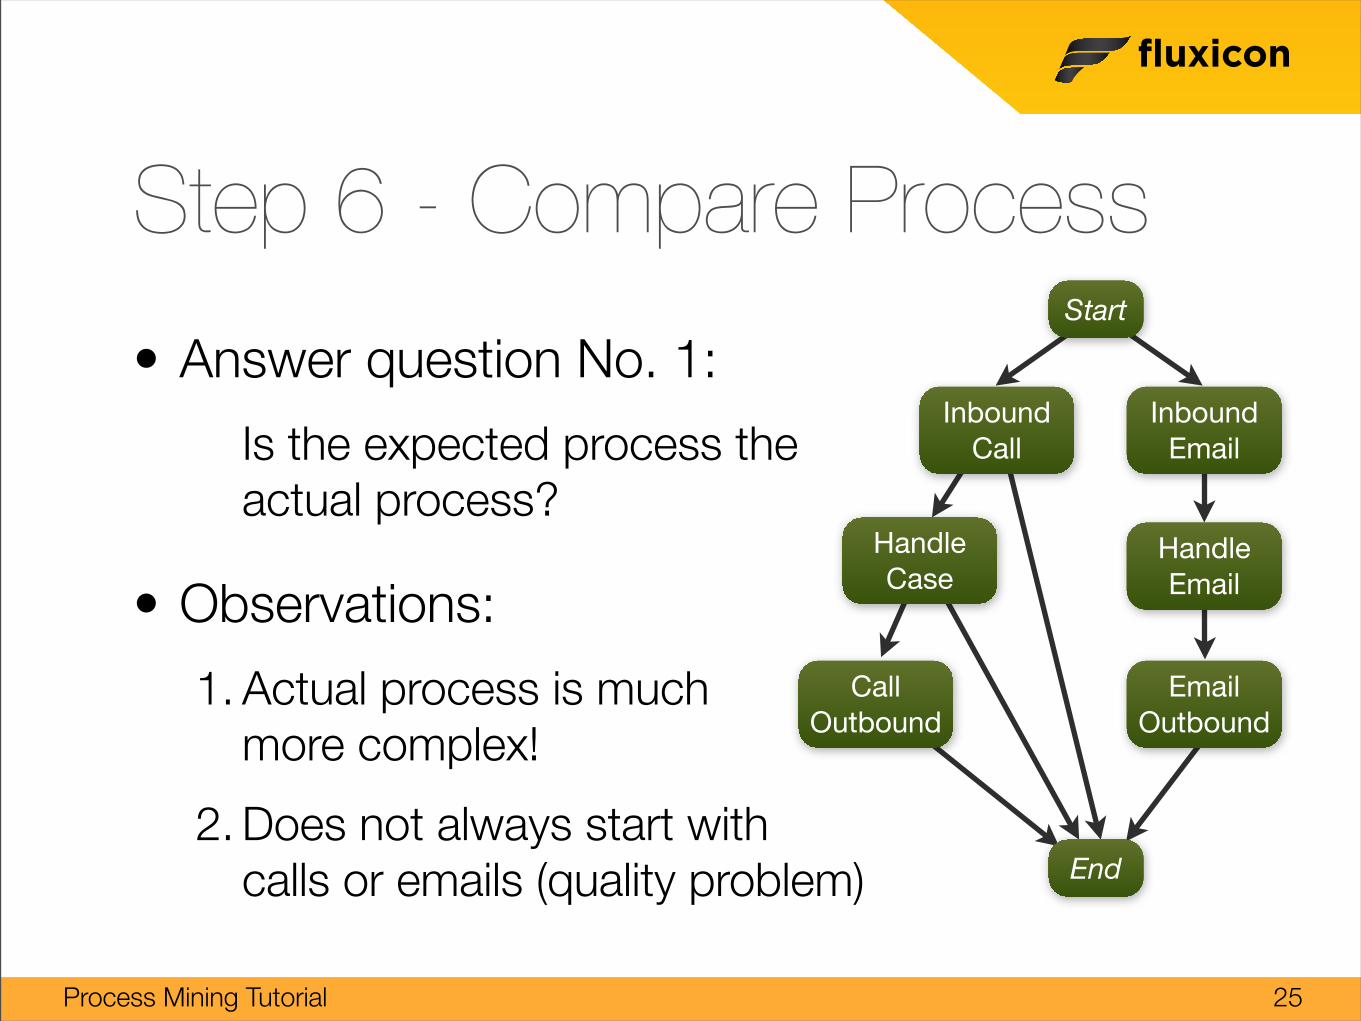
Step 6 - Compare Process
• Answer question No. 1:
Is the expected process the actual process?
• Observations:
1. Actual process is much more complex!
2. Does not always start with calls or emails (quality problem)
25
Inbound Call
Inbound Email
Handle Email
Email Outbound
Call Outbound
Handle Case
Start
End
fluxicon
Process Mining Tutorial
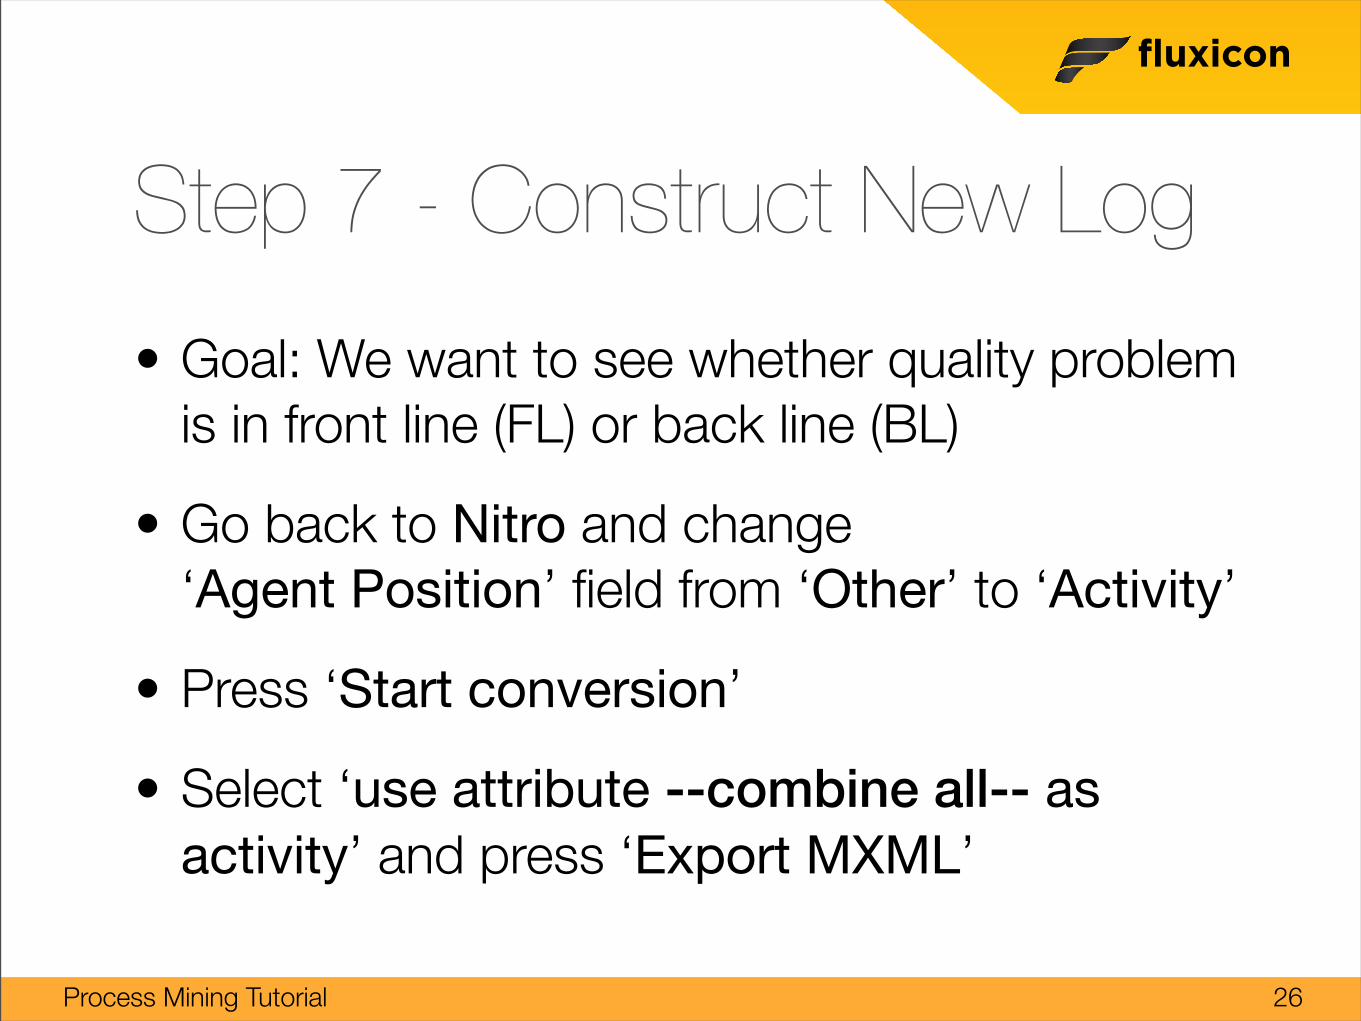
Step 7 - Construct New Log
• Goal: We want to see whether quality problem is in front line (FL) or back line (BL)
• Go back to Nitro and change ‘Agent Position’ field from ‘Other’ to ‘Activity’
• Press ‘Start conversion’
• Select ‘use attribute --combine all-- as activity’ and press ‘Export MXML’
26
fluxicon
Process Mining Tutorial
Step 8 - Inspect New Log
• Open new log in ProM
• Select ‘Filter’ tab and see how activities are distinguished between BL and FL
Observation:
In ‘Start Events’ we can see that new cases are started in the back line (should not happen)
27
fluxicon
Process Mining Tutorial
Step 9 - Drill Down
• Select ‘Inbound Call-BL’ in ‘Start events’ filter to focus on cases that start with this activity
• Go to ‘Summary’ tab in log window and scroll to bottom to look at ‘Originators’
Actionable result for question No. 2:
Give targeted training: Agents can be asked to re-use existing service instances
28
fluxicon
Process Mining Tutorial
Step 10 - Discover Process
• Go to ‘Filter’ tab in log window again, choose ‘Advanced’ filter tab• Select + add ‘Add Artificial Start Task Log Filter’• Select + add ‘Add Artificial End Task Log Filter’
• Choose ‘Mining ➞ Filtered ExampleLog.mxml.gz (Advanced filter) ➞ Fuzzy miner’ from menu
• Press ‘start mining’
29
fluxicon
Process Mining Tutorial
Step 11 - Tune Level of Detail
• Move the slider in the ‘Node filter’ tab on the right (“significance cutoff”) up and down
• Observe how the process can be simplified and detailed dynamically
• Pull the slider down to the bottom
Last step: We will now visualize how individual cases flow through process
30
fluxicon
Process Mining Tutorial
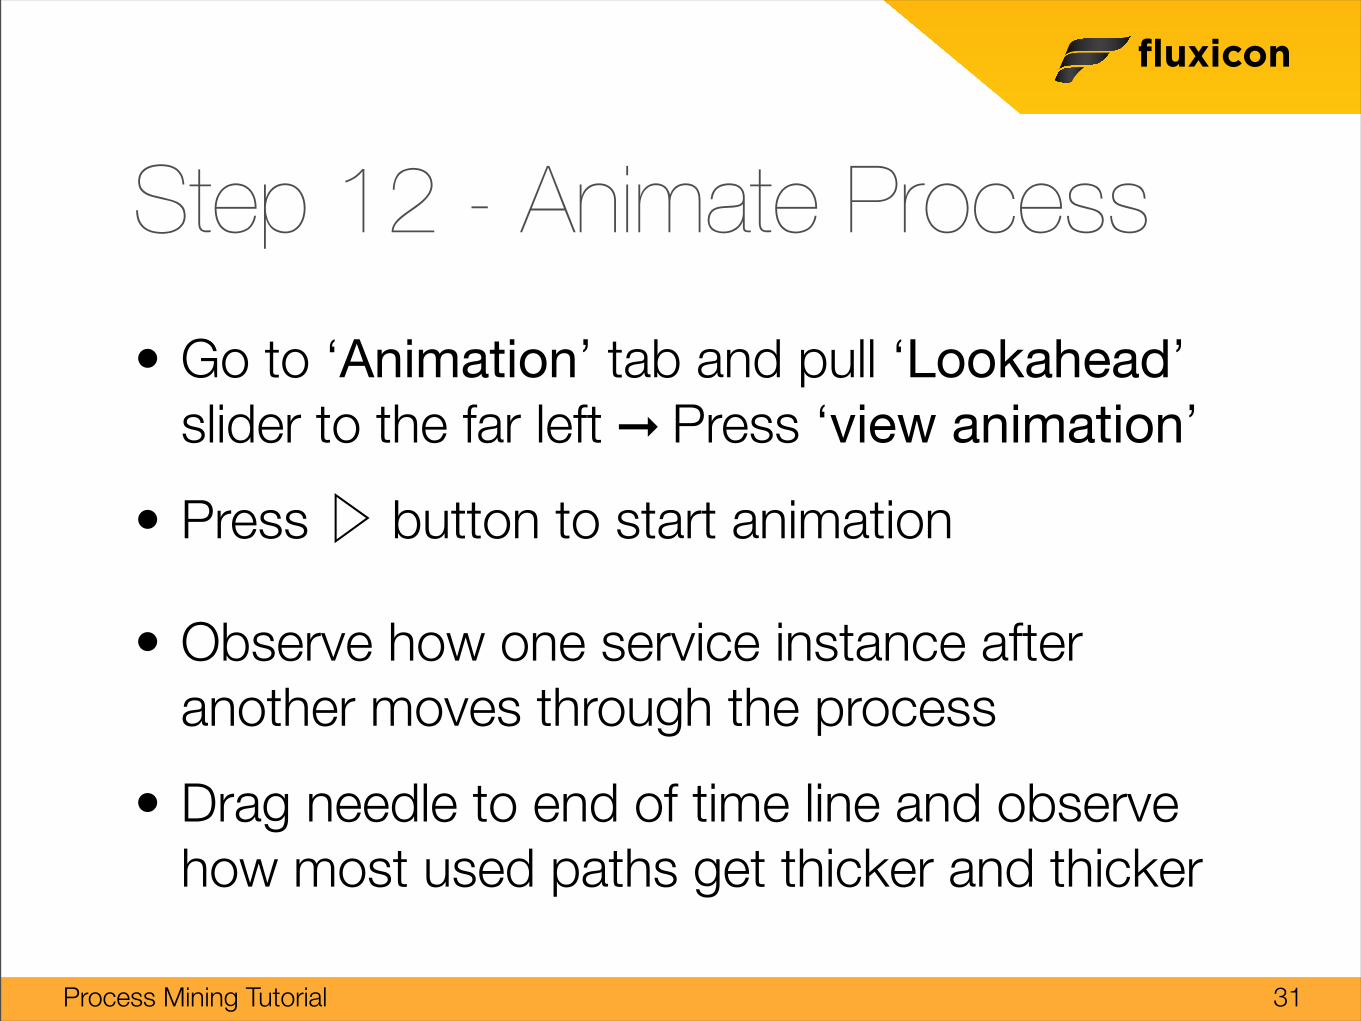
Step 12 - Animate Process
• Go to ‘Animation’ tab and pull ‘Lookahead’ slider to the far left ➞ Press ‘view animation’
• Press ▷ button to start animation
• Observe how one service instance after another moves through the process
• Drag needle to end of time line and observe how most used paths get thicker and thicker
31
fluxicon
Process Mining Tutorial
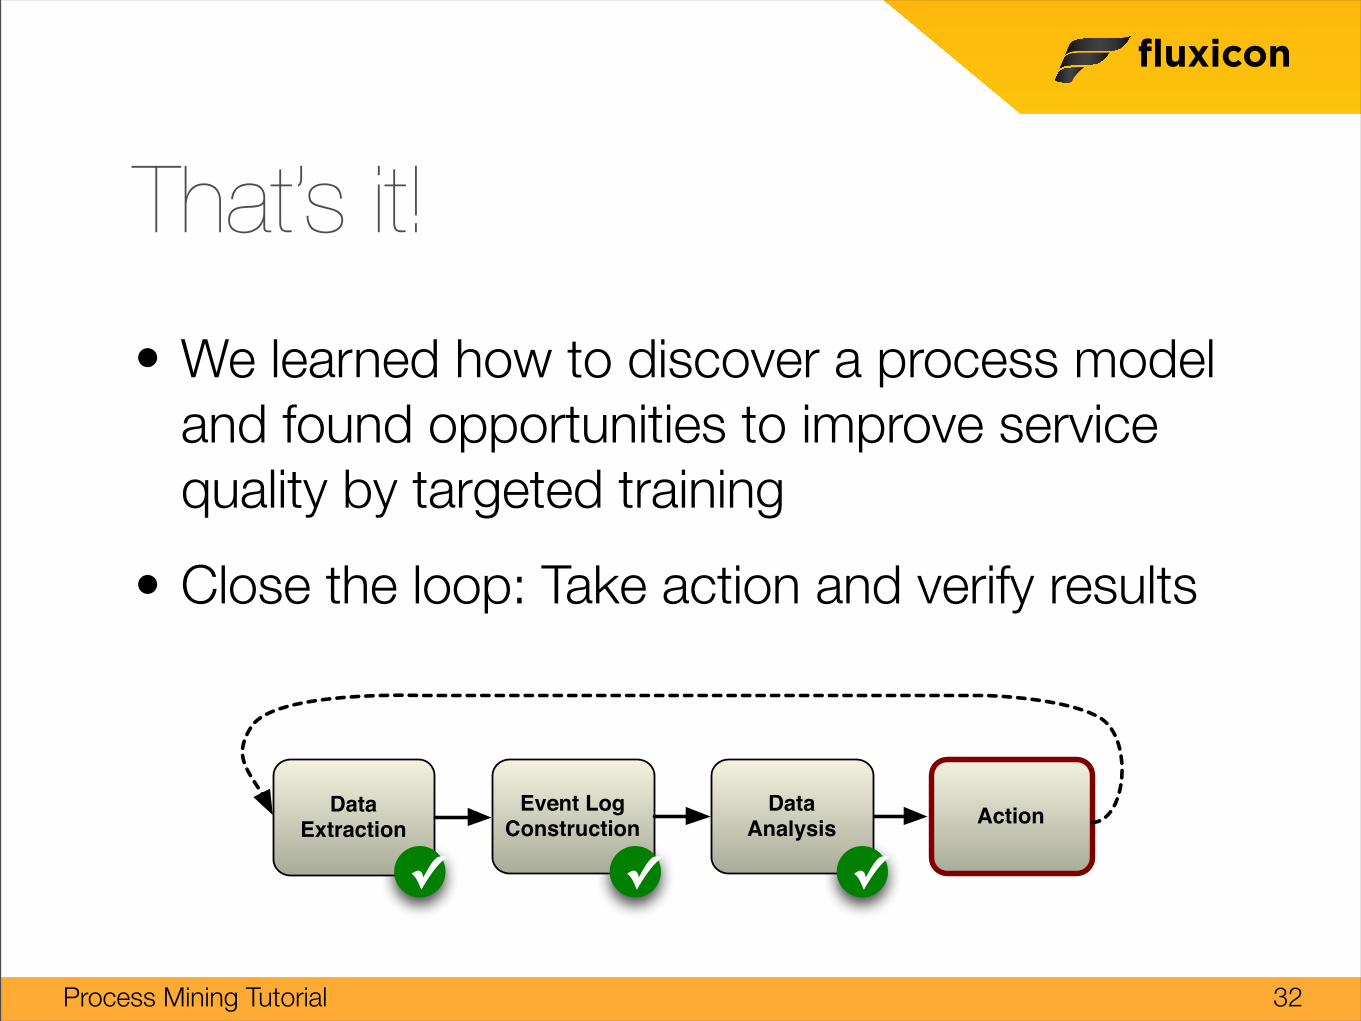
That’s it!
• We learned how to discover a process model and found opportunities to improve service quality by targeted training
• Close the loop: Take action and verify results
32
Data Extraction ActionEvent Log
ConstructionData
Analysis
✓ ✓ ✓
fluxicon
Process Mining Tutorial
Further Steps
ProM allows for much more: • Perform quantitative analysis
• Explicitly check conformance of initial model
• Perform social network analysis
• ...
We could also include additional data sources (NPS results and Servicer data)
33
fluxicon
Process Mining Tutorial
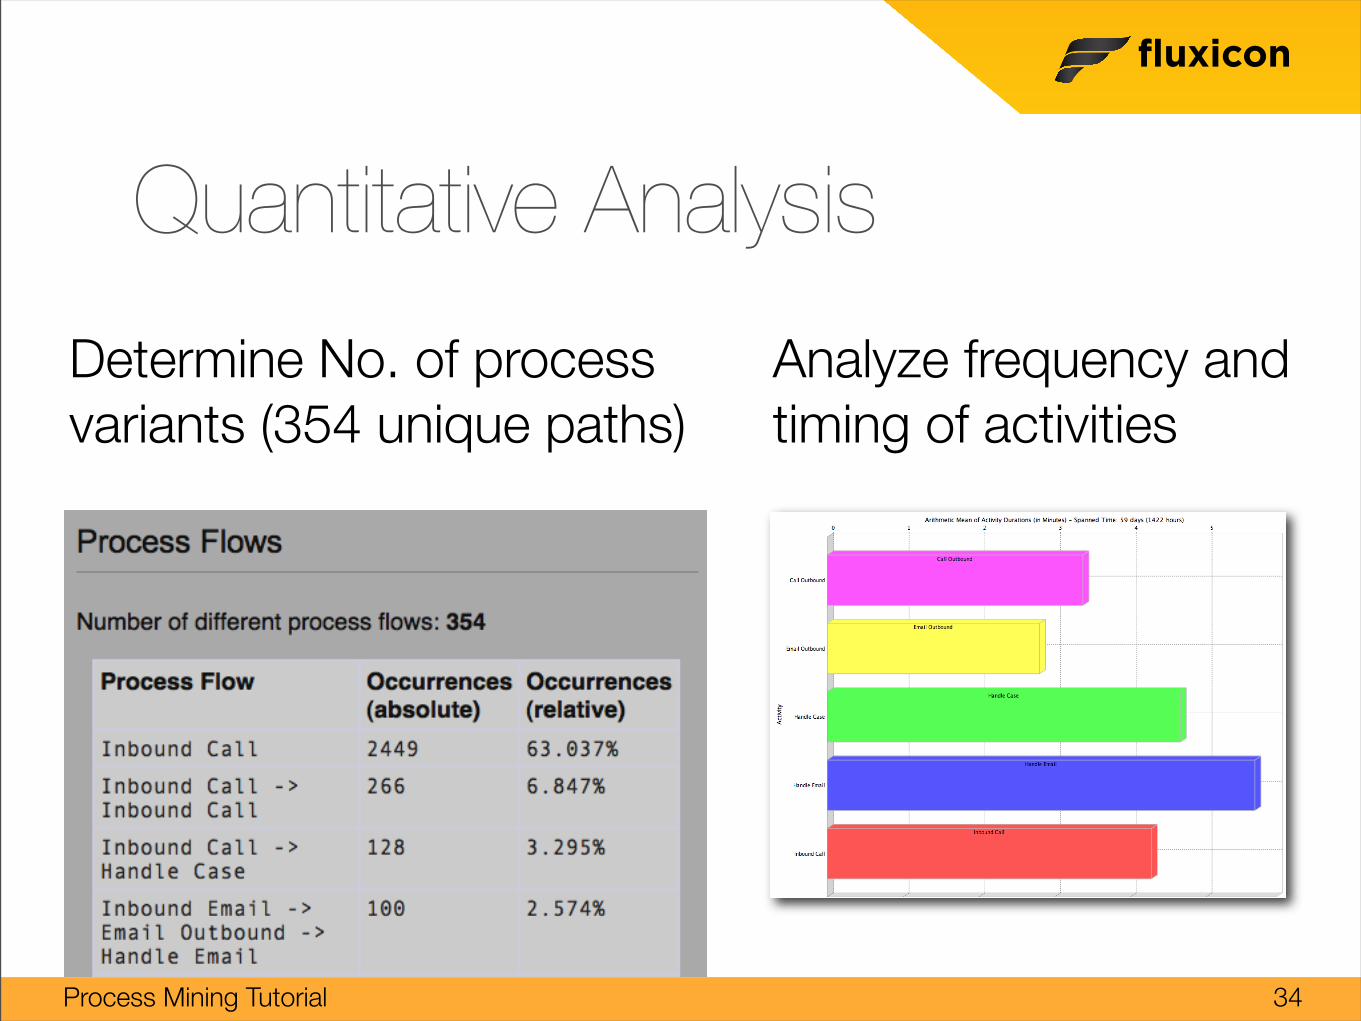
Quantitative Analysis
Determine No. of process variants (354 unique paths)
34
Analyze frequency and timing of activities
fluxicon
Process Mining Tutorial
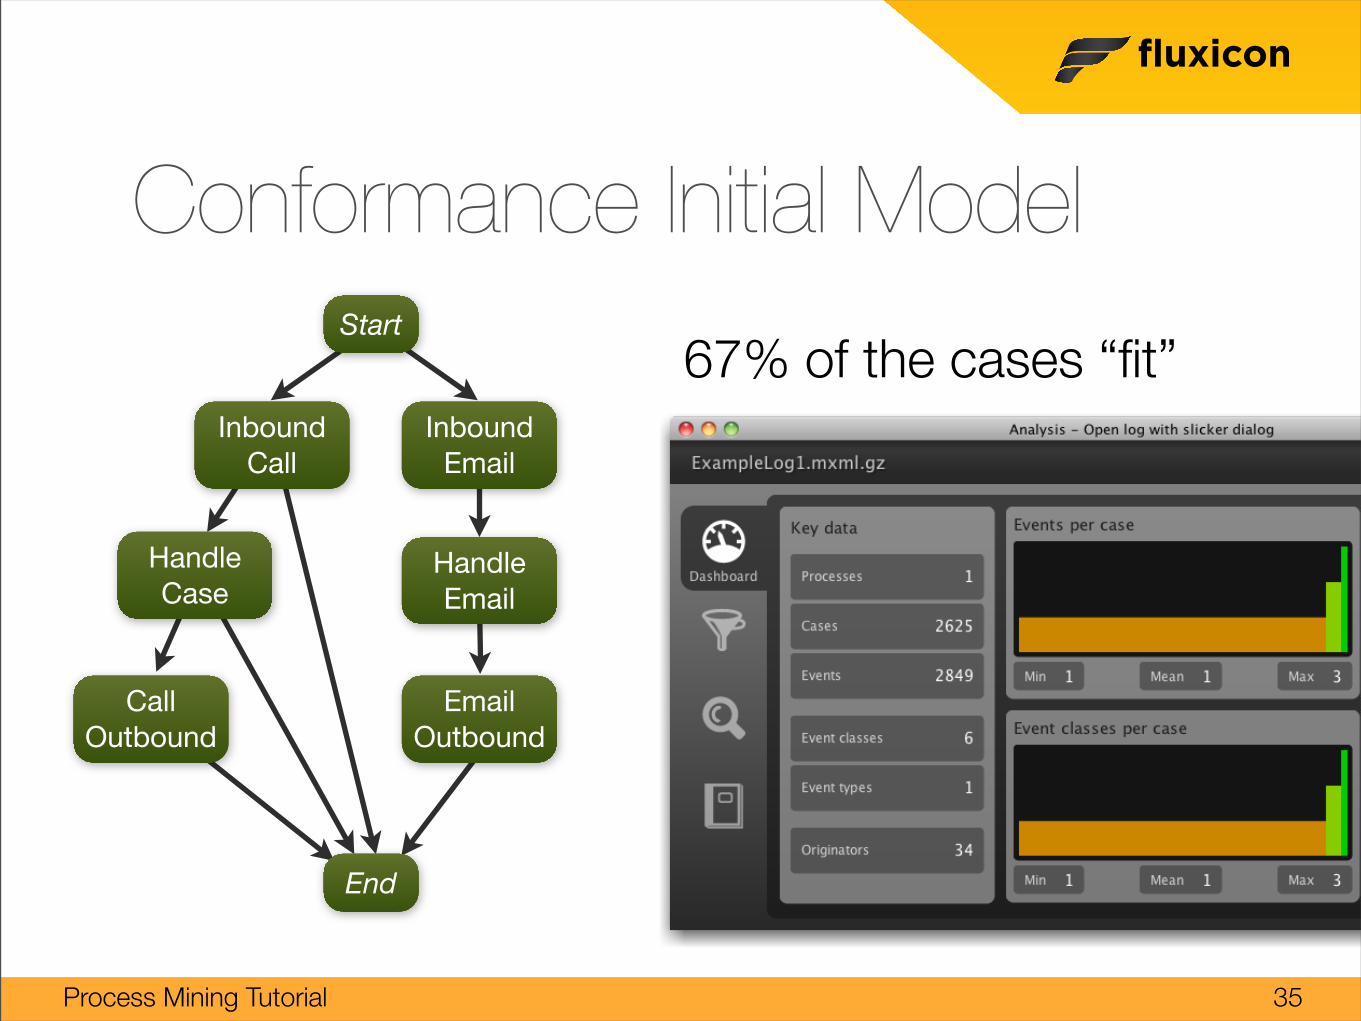
Conformance Initial Model
67% of the cases “fit”
35
Inbound Call
Inbound Email
Handle Email
Email Outbound
Call Outbound
Handle Case
Start
End
fluxicon
Process Mining Tutorial
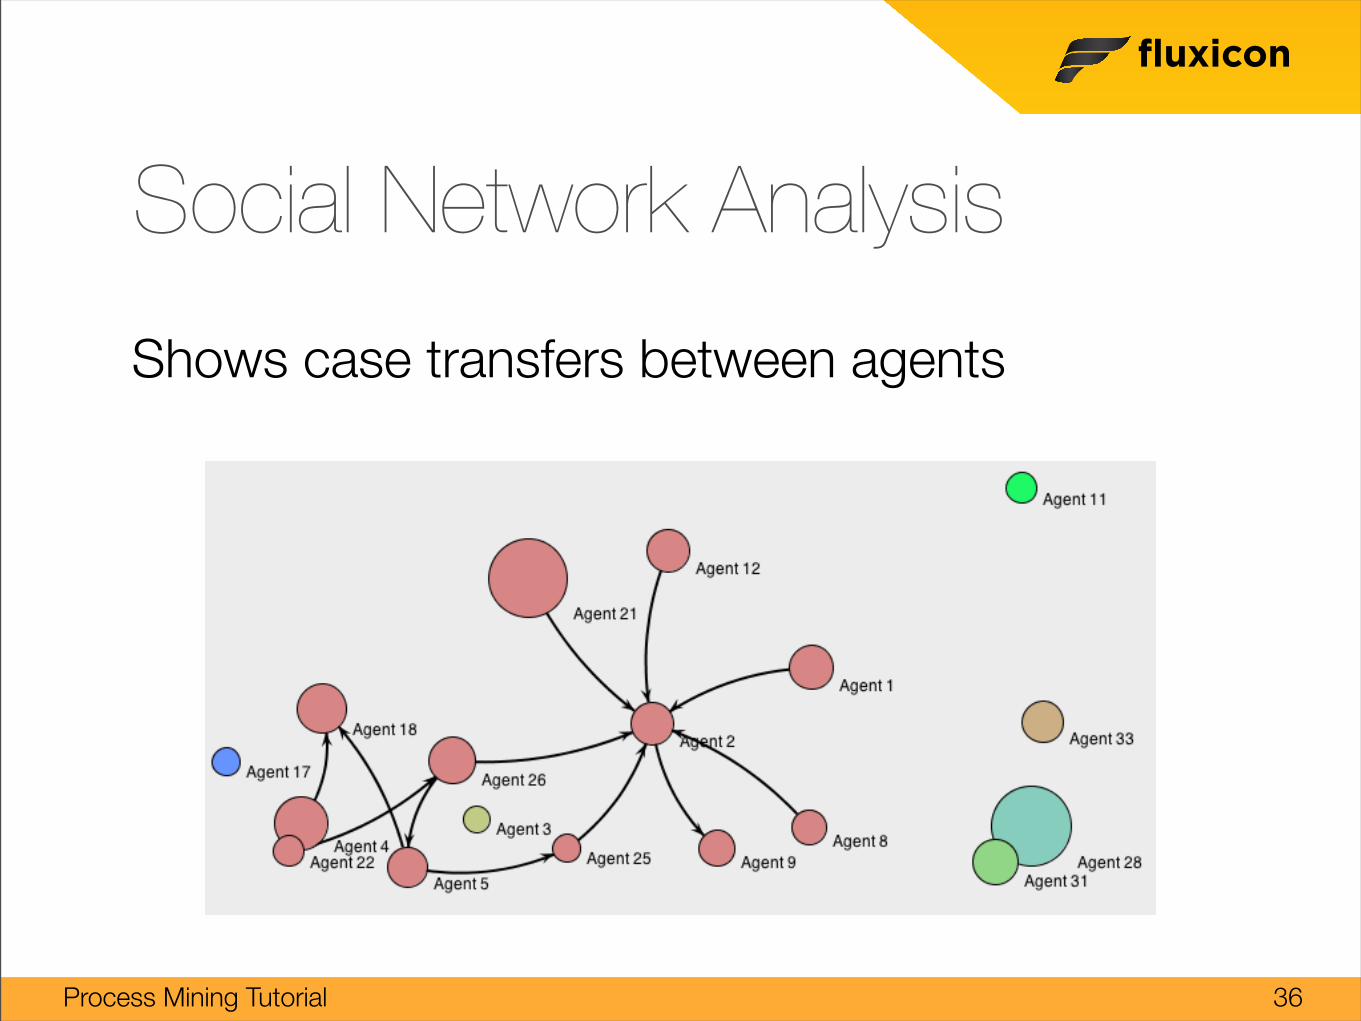
Social Network Analysis
Shows case transfers between agents
36
fluxicon
Process Mining Tutorial
Take-away Points
• Real processes are often more complex than you would expect
• There is no one “right” model
• You can take multiple views on the same data
• Process mining is an explorative, interactive activity
37
fluxicon
Process Mining Tutorial
Benefits
38
Leveraging IT log data to understand the actual process allows to:
• Promote good and avoid bad practices
• Start process discussions not from an empty sheet
• Provide evidence to support your point of view
• Reduce IT complexity by identifying the actually used process variants
fluxicon
Process Mining Tutorial
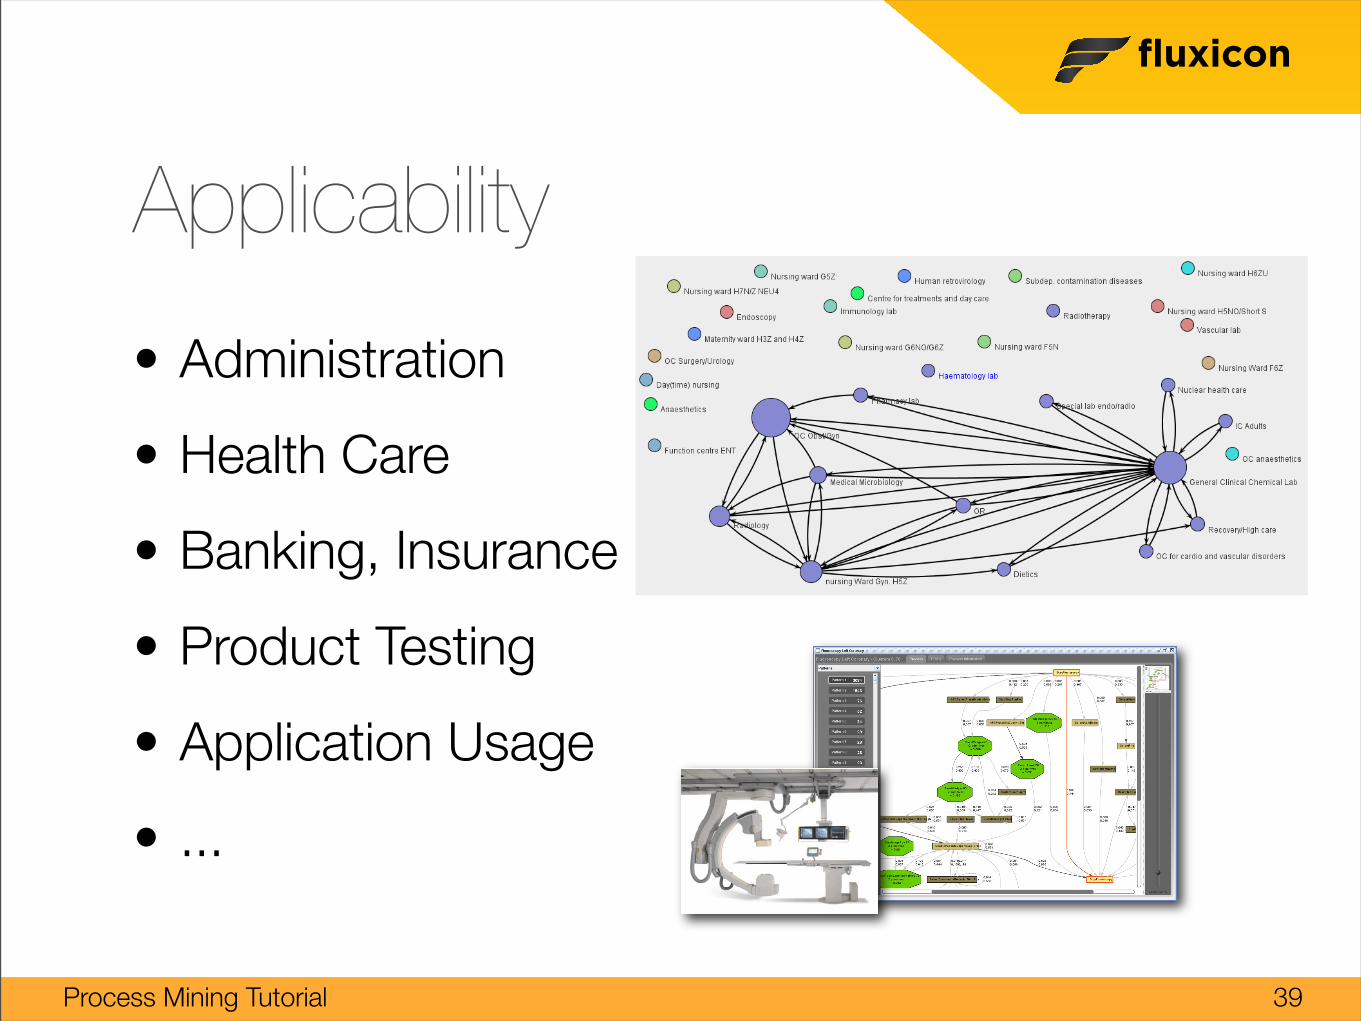
Applicability
39
434 R.S. Mans et al.
Fig. 6. Social network (handover of work metrics)
departments that interact and hand over work to each other. The mining result showsthat the general clinical chemical lab is highly involved in the process and interacts withmany departments. The outpatient clinic (OC) for gynecology and obstetrics is also of-ten involved, but is not directly connected to all other departments. For instance thereis no relationship (within this threshold) between this OC and the vascular lab. Thismeans that there is no, or not much, interaction between these two departments.
When this result was presented to the people involved in the process, they confirmedthe strong collaboration with the departments shown in Figure 6. However, they weresurprised about the rather strong collaboration with the dietics department. Neverthe-less, this can be explained by the fact that, when a patient has to go to several chemother-apy sessions, then a visit to the dietician is also often needed.
Moreover, they also noted that the many interactions between the lab and other de-partments is misleading as all the examinations are requested by gynecological on-cology and not by the lab. This can be explained by the many lab tests and resultinginteractions between the lab and other departments.
Performance Perspective. Process mining provides several performance analysis tech-niques. Among these, the dotted chart is a method suitable for case handling processeswhich are flexible and knowledge intensive business processes and focus not on therouting of work or the activities but on the case (e.g. careflows). In this paper, weuse the dotted chart to show overall events and performance information of the log.Figure 7 shows the dotted chart. In the chart, events are displayed as dots, and the timeis measured along the horizontal axis of the chart. The vertical axis represents case IDsand events are colored according to their task IDs. It supports several time options suchas actual, relative, logical, etc. In the diagram, we use relative time which shows the
• Administration
• Health Care
• Banking, Insurance
• Product Testing
• Application Usage
• ...

fluxicon
Process Mining Tutorial
Contact
• Today’s session will be made available online
• Watch our weblog http://fluxicon.com/blog Follow us on Twitter @fluxiconlabs
We’d love to hear from you!
40
Email: [email protected]: +31(0)62–436–4201