Embed Size (px)
Citation preview
Process Control Factors for Continuous Microbial Perchlorate Reduction
in the Presence of Zero-Valent Iron
by
Robert Daniel Arthur
A thesis submitted to the Graduate Faculty of
Auburn University
in partial fulfillment of the
requirements for the Degree of
Masters of Science
Auburn, Alabama
August 6, 2011
Keywords: Perchlorate, zero-valent iron, flow through reactor, perchlorate reducing
bacteria
Copyright 2011 by Robert Daniel Arthur
Approved by
Ahjeong Son, Chair, Assistant Professor of Civil Engineering
Mark O. Barnett, Malcolm Pirnie Professor of Civil Engineering
Prabhakar Clement, Arthur H. Feagin Chair Professor of Civil Engineering
ii
Abstract
Water is a staple of civilization, and in the event of drinking water contamination
the use of the contaminant’s source should be discontinued. Alternatively, a
technology that can remove the contaminant from the water must be developed.
Perchlorate (ClO4-) is a byproduct of munitions, and pyrotechnics, and has been
detected in water sources throughout the United States. It is unlikely that the use of
perchlorate will be discontinued as it is linked to the integrity of national security.
Due to the toxicity to human health, the United States Environmental Protection
Agency (US EPA) announced in February 2011 that perchlorate will be federally
regulated. It is expected that the maximum contaminant level (MCL) could be 1 ppb
(µg/L). Therefore, it is necessary to develop a safe and inexpensive technology that
is capable of completely removing the contaminant. Technologies for the perchlorate
removal include: ion exchange, activated carbon adsorption, chemical reduction, and
microbial reduction. Several studies demonstrated that zero-valent iron (ZVI) can be
used as an electron donor for the microbial perchlorate reduction process. The core
of our research approach is on the use of ZVI and mixed microbial culture.
Process control parameters influencing microbial perchlorate reduction by a flow-
through ZVI column reactor were investigated in order to optimize perchlorate
removal in water. Mixed perchlorate reducers were obtained from a wastewater
treatment plant (aerobic activated sludge and anaerobic digester) and inoculated into
iii
the reactor without further acclimation. Examined parameters include; hydraulic
retention time (HRT), pH, nutrient requirement, and both chemical and microbial
kinetics.
The minimum HRT required for our system that can completely reduce 10 mg/L of
perchlorate was 8 hours. Perchlorate removal was reduced by 60% without pH
control. As pH was determined to be an important parameter for microbial
perchlorate reduction, a viable alternative of pH buffer is also discussed. Unlike
other systems that used laboratory cultured microorganisms, our system needed no
additional nutrients for the complete reduction of 10 mg/L of perchlorate in water.
This is likely due to the plethora of nutrients available within activated sludge based
seed cultures. The perchlorate reduction reaction follows the first order kinetics, with
an average rate constant (K) of 0.761 hr-1
. The microbial growth in the column
follows the Monod growth kinetics. The average maximum growth rate (µmax) and
the average half saturation constant (Ks) were determined to be 0.55 hr-1
and 15.4
mg/L, respectively. Also, a numerical model using Monod kinetics, transport, and
attachment and detachment was used to verify the experimental result pertaining to
the microbial growth kinetics in the ZVI supported perchlorate reducing column
system.

iv
Acknowledgements
The Arthur would like to thank everyone who took part in this project. Special
thanks to Dr. Ahjeong Son, my advisor, for her continued support and advice
throughout the duration of the project. Thanks to my committee Dr. Prabhakar
Clement and Dr. Mark Barnett for their support throughout my time at Auburn. I
would also like to thank Jagadish Torlapati for his assistance with kinetic modeling.
Special thanks to the faculty and staff of the Department of Civil Engineering at
Auburn University for their support throughout my time here. Thanks to my
coworkers for the assistance and advice. Special thanks for my friends and family for
their support throughout. Also thanks to Lauren, my fiancée for her continued
support and patience. Above all I would like to give honor and credit to my Savior,
Jesus Christ. Without the saving grace and ability with which I have been blessed
this would not be possible.
v
Table of Contents
Abstract ......................................................................................................................... ii
Acknowledgements ...................................................................................................... iv
List of Figures ............................................................................................................ viii
List of Tables ............................................................................................................... ix
List of Equations ........................................................................................................... x
List of Abbreviations ................................................................................................... xi
Chapter 1: Introduction ................................................................................................. 1
1.1. Introduction ............................................................................................................ 1
1.2. Contamination ........................................................................................................ 1
1.3. Health Hazards and Regulation ............................................................................. 3
1.4. Treatment Options ................................................................................................. 6
1.4.1. Activated Carbon ......................................................................................... 6
1.4.2. Ion Exchange ............................................................................................... 7
1.4.3. Chemical Treatment .................................................................................... 8
1.4.4. Microbial Reduction .................................................................................... 9
Chapter 2: Material and Methods ............................................................................... 15

vi
2.1. Microorganisms and flow-through column system ............................................. 15
2.2. Hydraulic Retention Time.................................................................................... 16
2.3. pH effect............................................................................................................... 18
2.4. Alternate pH buffer .............................................................................................. 18
2.5. Required Nutrients ............................................................................................... 19
2.7. Kinetics ................................................................................................................ 19
2.7.1. Perchlorate Reduction Rate ....................................................................... 19
2.7.2. Microbial Growth Kinetics Experiment .................................................... 20
2.7.3. Numerical Modeling .................................................................................. 20
2.8. Analytical Analysis .............................................................................................. 21
Chapter 3: Results and Discussion .............................................................................. 22
3.1. Hydraulic Retention Time.................................................................................... 22
3.2. pH effect............................................................................................................... 25
3.3. Alternate Buffer ................................................................................................... 27
3.4. Nutrient Requirement........................................................................................... 30
3.5. Kinetics ................................................................................................................ 33
3.5.1. Perchlorate Reduction Rate in Column Reactor ........................................ 35
3.5.2. Microbial Growth Kinetics (Column) ....................................................... 39
Chapter 4: Conclusions .............................................................................................. 45
Chapter 5: Future Work .............................................................................................. 48

vii
References ................................................................................................................... 49
Appendix ..................................................................................................................... 54
viii
List of Figures
Figure 1: Perchlorate Reduction Pathway. A schematic illustrating the perchlorate
reduction pathway. ......................................................................................10
Figure 2: Experimental Setup. (a) A schematic of the experimental setup. (b) A
picture of the experimental setup ................................................................17
Figure 3: Hydraulic Retention Time. Perchlorate reductions in the ZVI-supported
microbial column reactor under various HRTs ..........................................23
Figure 4: pH effect on perchlorate reduction. Perchlorate reduction in the ZVI-
supported microbial column reactor with and without pH buffer ...............26
Figure 5: Alternate pH Buffer. A TE pH buffer was tested to the system in order to
determine its ability to maintain a neutral pH. ..........................................29
Figure 6: Required Nutrients. Effect of macro-nutrients and trace elements on the
perchlorate reduction ...................................................................................32
Figure 7: Chemical Reduction Rate.The perchlorate reduction rate vs. the log mean
concentration. .............................................................................................37
Figure 8: Microbial Kinetics (column) Figure 6 plots the inverse of the average
growth rate (μ) for our system with the inverse of the substrate
concentration (perchlorate)..........................................................................40
Figure 9: Monod Growth Curve. The experimental data is represented by the solid
points, and the model results (line). ............................................................44
ix
List of Tables
Table 1: State Regulations. Table 1 shows the perchlorate regulations put in place
by a number of states. ....................................................................................5
Table 2: Effect of zero-valent iron on reduction rate. As the amount of ZVI
increased as did the reaction rate. Until some “saturation point” was
reached. ......................................................................................................38
Table 3: Theoretical yield calculation. Table 4 holds the input parameters for the
yield calculation. .........................................................................................41
Table 4: Model parameters. The values for each parameter used in the model
simulation. .................................................................................................43
x
List of Equations
Equation 1: Anaerobic iron corrosion
Equation 2: Monod kinetic expressions
Equation 3: Contois kinetic expression
Equation 4: Moser kinetic expression
Equation 5: Tessier kinetic expression
Equation 6: Chemical reduction rate
Equation 7: Perchlorate removal rate
Equation 8: Log mean concentration
Equation 9: Monod kinetic equation
Equation 10: Liner Monod kinetic equation
Equation 11: Fate and Transport of perchlorate
Equation 12: Mobile biomass model expression
Equation 13: Immobile biomass model expression
Equation 14: Perchlorate half reaction
Equation 15: Energy required for respiration
Equation 16: Energy required converting to pyruvate
Equation 17: Intermediate equation in yield calculation [A]
Equation 18: Microbial Yield coefficient equation [Y]
xi
List of Abbreviations
EPA: Environmental Protection Agency
MCL: Maximum Contaminant Level
RfD: Reference Dose
CDHS: California Department of Health Services
USDA: United States Department of Agriculture
NIS: Sodium Iodine Symporter
Ppb: Parts per billion (µg/L)
NAS: National Academy of Sciences
CDC: Center for Disease Control
GAC: Granular Activated Carbon
CTAC: Cetyltrimethylammonium Chloride
HMX: High Melting Explosive
RDX: Cyclotrimethylene Trinitramine
IX: Ion Exchange
Ppm: Parts per million (mg/L)
PRB: Perchlorate Reducing Bacteria
EBCT: Empty Bed Contact Time
WWTP: Wastewater Treatment Plant
ZVI: Zero-Valent Iron
HRT: Hydraulic Retention Time
TE: Tris-EDTA Buffer
AGW: Artificial Groundwater
max: Average Maximum Growth Rate
sK : Average Half Saturation Rate Constant
V: Velocity
D: Hydrodynamic Dispersion Coefficient
katt: Biomass Attachment Factor
kdet: Biomass Detachment Factor
1
Chapter 1: Introduction
1.1. Introduction
The United States Environmental Protection Agency (US EPA) announced in 2011
that the policy for perchlorate will be changed, and that they are currently working
towards federal regulation. The new regulation is expected to be as low as 1 µg/L
[1]. The previous reference doses (RfD), were determined based on the potential
adverse effect on human health and were 24.5 µg/L (2005, [2]) and 15 µg/L (2008,
[3]). As compared to the previous reference doses, the new regulation level of nearly
1 µg/L will pose a significant undertaking on the perchlorate regulation and
mitigation in near future [1, 4]. Perchlorate is an oxidized form of chlorine. Due to its
high solubility and mobility in water (217x103 mg/L); it tends to be very difficult to
remove from ground water [5]. Perchlorate in our drinking water primarily came
from: munitions, and pyrotechnics. Other uses of perchlorate include: matches,
refinement of aluminum, the manufacturing of rubber, it can also be found in the
inflator of a vehicles airbag [6-8].
1.2. Contamination
Perchlorate contaminated groundwater flumes tend to originate or at least traverse
areas where rocket fuels or other contaminant sources are either prepared or stored.
The EPA states, at the two plants that manufacture ammonium perchlorate, which is
2
the major form perchlorate is used in, that the majority of the wells surrounding the
plants contain some concentration of perchlorate [9]. Although production of
ammonium perchlorate has declined by 76% since production peaked in the mid
1980’s, contaminations still occur for multiple reasons: (1) because of the physical
characteristics of perchlorate; the density of perchlorate is 1.95 g/cm3
and the
solubility ranges from 2,010-220 mg/L, which allows high concentrations of
perchlorate to dissolve into groundwater and settle, and (2) the limited life of the
compound; the perchlorate containing solid rocket fuel must be exchanged routinely
and disposed of [6]. In 2007 scientist reported finding small amounts of naturally
occurring perchlorate in America’s southwest deserts, but there is only one known
substantial natural perchlorate deposit, northern Chile’s Atacama Desert [10]. This
natural deposit lies in the desert’s large nitrate deposit which is imported into this
country as feedstock for fertilizer. This has caused many to suspect fertilizers as the
prime culprit for perchlorate contamination. The EPA funded many studies to
determine if fertilizers were contaminated with perchlorate. The finding was that
fertilizers were not the main contributors to the nation’s perchlorate laden ground
water [11]. The majority of the samples contain no perchlorate while a few contained
trace amounts of perchlorate. Some even hypothesized the perchlorate could be
contributed to the use of oils used to keep the fertilizer dry ,as well as the brine used
to control acidity during manufacturing and transport [7]. Based on this data as well
as many more reports, it can be concluded that the perchlorate contamination of our
drinking water is an anthropogenic problem. In a study performed by a host of
interstate agencies it was reported that in 153 public water systems across 36 states
3
perchlorate was detected [12]. This range of contaminations is much more wide
spread than thought previous to the late 1990’s. In 1997 the California Department of
Health Services (CDHS) developed a method to detect concentrations of perchlorate
as low 4 parts per billion (µg/L). Soon after this technology was created many sites
thought to be free of contamination were now proven to be contaminated. The
contamination of perchlorate is thought to be widespread now ranging from coast to
coast in 36 states. According to the United States Department of Agriculture (USDA)
perchlorate can be found in other items such as food, and others state it can
accumulate in human milk increasing the risk of health effects in infants [13-17].
Dasgupta reports that in a study done in 2005 that perchlorate was present in all 36
human milk samples analyzed [14]. In a later study done at the University of Texas
at Arlington by Dasgupta et.al, 15 lactating women were chosen and breast milk
samples were taken. From the 15 sample sets only 13 were usable and out of these 13
samples all contained some levels of perchlorate and 70% were above safe levels for
infants [13]. With such a widespread contamination and with a large percentage of
the population being affected, we must look at the health effects perchlorate ingestion
causes.
1.3. Health Hazards and Regulation
In many studies it has been proven that the ingestion of perchlorate inhibits the
thyroid gland’s, a very important part in the development of fetus and young
children’s brains, ability to take up iodine into the Sodium Iodide Symporter (NIS)
which is a key compound of brain development [7, 18]. Another study describes how
4
this inhibition takes place. Iodide passage through the NIS is severely inhibited by
perchlorate because of the NIS’s increased affinity towards perchlorate. As a result
the production of thyroid hormones decrease, this can cause hypothyroidism in adults
and severe birth defects and abnormal growth and development in infants and fetuses
[2]. There is an ongoing debate on these health effects that perchlorate
contaminations may have, but since it is thought to adversely affect such an important
system in the development of young children, even unborn ones, it must be taken
seriously. To measure the effect low levels of perchlorate has on humans, the EPA
reviewed a study completed by Greer where a group of healthy men and women
ingested variable concentrations of perchlorate and the effects were analyzed. This
report states that no adverse effects were noted until greater than 7 μg/kg-day was
ingested [18]. This level was then reduced by a factor of safety of 10 for pregnant
women and their fetuses. Using this data as well as data relating perchlorate
concentration in food, the EPA initially implemented a safe drinking water threshold
of 24.5 μg/L (ppb) [2, 19]. Deborah Swackamer the EPA’s Science Advisory Board
disagreed with this level, stating “The administration has just asked us for
recommendations on how to strengthen the use of science, and here we are
confronted by a case of the agency moving forward when not all of the science is in
yet”. She also stated that using the EPA’s own calculations and threshold, infants
will receive 2-5 times the National Academy of Sciences reference dose (RfD) of 0.7
μg/kg-day [19]. Other studies have been done, including one by the Center for
Disease Control (CDC) which states that the reference dose levels should be even an
order of magnitude lower [19, 20]. As many as 7 states have set their own
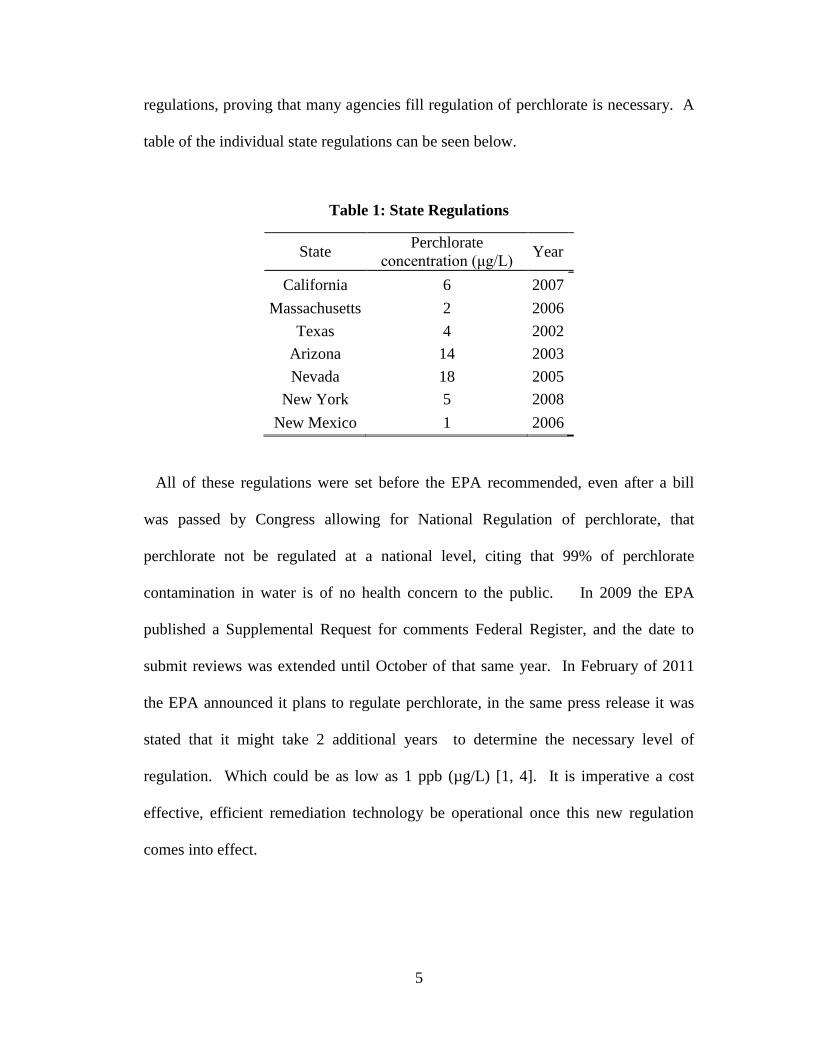
5
regulations, proving that many agencies fill regulation of perchlorate is necessary. A
table of the individual state regulations can be seen below.
Table 1: State Regulations
State Perchlorate
concentration (μg/L) Year
California 6 2007
Massachusetts 2 2006
Texas 4 2002
Arizona 14 2003
Nevada 18 2005
New York 5 2008
New Mexico 1 2006
All of these regulations were set before the EPA recommended, even after a bill
was passed by Congress allowing for National Regulation of perchlorate, that
perchlorate not be regulated at a national level, citing that 99% of perchlorate
contamination in water is of no health concern to the public. In 2009 the EPA
published a Supplemental Request for comments Federal Register, and the date to
submit reviews was extended until October of that same year. In February of 2011
the EPA announced it plans to regulate perchlorate, in the same press release it was
stated that it might take 2 additional years to determine the necessary level of
regulation. Which could be as low as 1 ppb (µg/L) [1, 4]. It is imperative a cost
effective, efficient remediation technology be operational once this new regulation
comes into effect.
6
1.4. Treatment Options
Perchlorate’s molecular structure, a single chlorine atom surrounded by four oxygen
atoms, is very stable therefore common reducing agents are not able to efficiently
reduce perchlorate to chloride in a timely manner. Therefore, much research has been
done in the field of perchlorate remediation, and multiple technologies do exist.
Many of the technologies are young, and not enough data is available in order to
make an educated decision on which might be the best practice. Two different types
of treatment exist in water treatment: Removal and Destruction and each have their
advantages and disadvantages. With such stringent regulation forthcoming from the
EPA an economical, yet effective treatment option for perchlorate laden water must
be determined.
1.4.1. Activated Carbon
Activated Carbon has been used in water treatment for years, and research has been
done to test its viability as a perchlorate removal technology. Granular Activated
Carbon (GAC) is carbon heated to above 500°C in the absence of oxygen; which
causes multiple fractures to the surface of the granule, which increases the surface
area for particles to adsorb to. This increased surface area allows for more substrate
to come in contact to and adsorb to said surface. Based on reports from Parette,
virgin GAC is not an effective perchlorate removal technology [21]. The efficiency
of this technology though is greatly increased when the GAC is tailored to remove
perchlorate. In 2005 Chen and Cannon loaded an ammonium surfactant onto AC and
witnessed efficiency 30 times greater than that of just AC alone. Therefore it was
7
reported that loading AC with cationic surfactants is an effective method of treating
perchlorate laden water [21]. In experiments performed by Parette and Cannon where
cetyltrimethylammonium chloride (CTAC) was loaded and not only the efficiency of
removing perchlorate was analyzed, but also efficiency of removing nitro-organics
such as HMX and RDX a different conclusion was reached. Altering the surface
charges of the GAC proved to affect adsorption of HMX and RDX adversely. The
breakthrough bed volumes decreased from 300,000 BV to 7800 BV [21]. It was
concluded that using GAC tailored with CTAC should be used as “pre-treatment” and
should always be followed with a virgin GAC treatment process [22]. Although this
process would treat perchlorate as well as other water contaminants, because it is
simply a removal technique the contaminants are only being concentrated onto the
surface of the carbon. Increasing the amount of beds needed to be used in an
effective system only magnifies this problem of proper and safe disposal of heavily
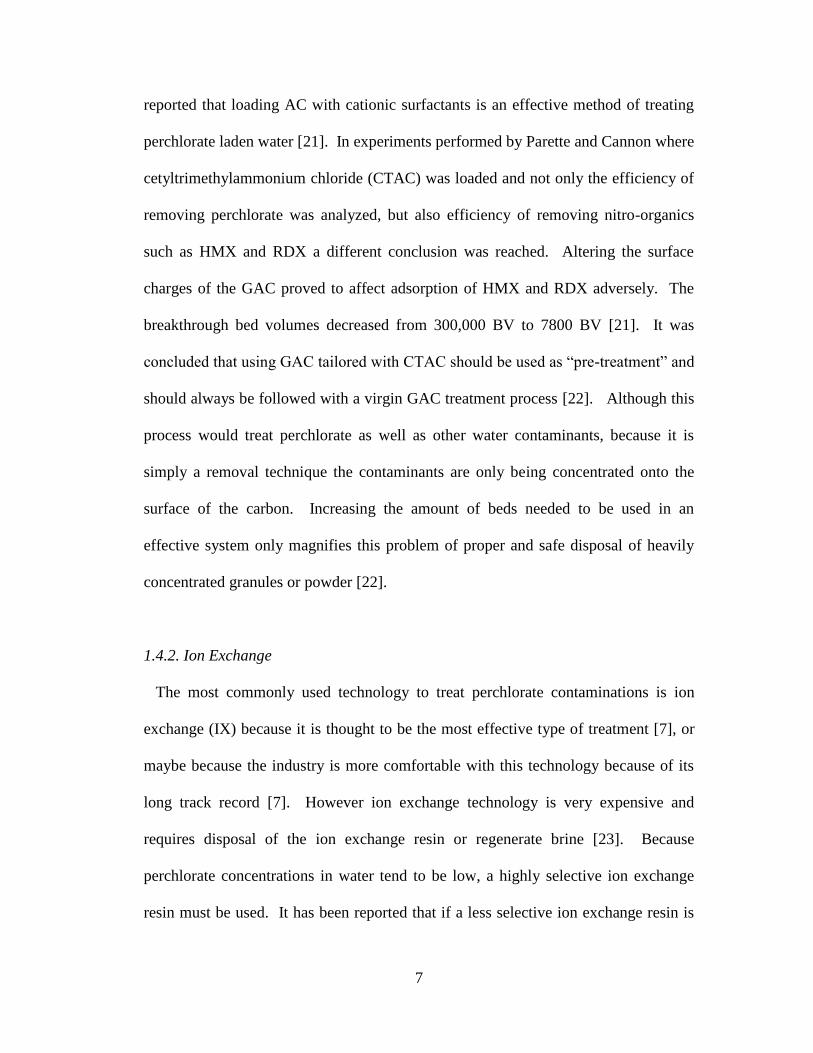
concentrated granules or powder [22].
1.4.2. Ion Exchange
The most commonly used technology to treat perchlorate contaminations is ion
exchange (IX) because it is thought to be the most effective type of treatment [7], or
maybe because the industry is more comfortable with this technology because of its
long track record [7]. However ion exchange technology is very expensive and
requires disposal of the ion exchange resin or regenerate brine [23]. Because
perchlorate concentrations in water tend to be low, a highly selective ion exchange
resin must be used. It has been reported that if a less selective ion exchange resin is
8
used in perchlorate remediation 99.9% of the resin could be wasted. Even once these
selective resins are used, regeneration becomes more difficult because of the
selectivity. Gu and Gilbert developed an ion exchange system that treated the
perchlorate with low HRT and also required small amounts of water to regenerate the
resin [24]. In other studies they determined that the solution used to regenerate the
resin could be used to completely reduce the concentrated perchlorate to chloride.
This reduction would only take place at high temperatures and pressures. This
phenomenon is useful when treating groundwater containing only perchlorate, which
is not very probable [23, 25]. Therefore the highly concentrated brine still needs to be
disposed of. This is not only environmentally unsafe, permits and fees go along with
dumping hazardous materials. Most of the time regenerate solution is cycled thru a
settling basin in order to reduce the amount of waste that needs to be disposed of.
Although ion exchange is a very promising technology, because it is a removal
technology it is still not the final solution, some concentrated medium must be
disposed of, costing money and also a threat to leach and contaminate other sites [7].
Other removal treatment options such as membrane filtration and reverse osmosis are
too expensive to be feasible.
1.4.3. Chemical Treatment
As mentioned previously, perchlorate is difficult to reduce chemically because of
such a high energy barrier. Two methods to overcome this high activation energy are
high pressures or temperatures, or both. To create an environment suitable for
chemical reduction is costly and not normally accepted in wastewater treatment
9
practices. Increasing the temperature also increases the rate at which microorganisms
grow, which increases the amount of microorganisms that need to be treated. Much
research has been done in finding suitable catalysts which can overcome this energy
barrier. Reduction of perchlorate was witnessed at reaction rates similar to those of
other treatment processes, the reaction occurred at very high pressures. Others have
also found catalysts that will reduce perchlorate, but due to the complexity of the
system and the expense of the conditions needed, state that full scale utilization is
improbable. Others use waste products from water treatment facilities to reduce
perchlorate, although reduction rates were high, so were initial perchlorate
concentrations. At 250 mg/L this concentration is much higher than found in
contaminated water [5, 7, 26]. Some have been able to achieve complete reduction in
conditions that are likely to be present in wastewater treatment; the major limiting
factor is kinetics. One of these technologies is the reduction of perchlorate using
zero-valent iron. Interestingly iron acts as a reducing agent and catalyst all at the
same time. The kinetics of this reduction were too slow for practical purposes. Due
to the slow reaction times, as well as environments not readily available during
normal wastewater practices chemical reduction of perchlorate is not a viable option.
1.4.4. Microbial Reduction
Much research has been performed in the field of microbial reduction of
perchlorate, and many have stated that this technology is the most promising
technology for perchlorate reduction [6, 27]. A large list has been compiled of
microorganisms capable of reducing perchlorate and two things each of these have in
10
common is they all contain two enzymes which allow them to reduce perchlorate to
the non toxic chloride. These two enzymes responsible for this reduction are
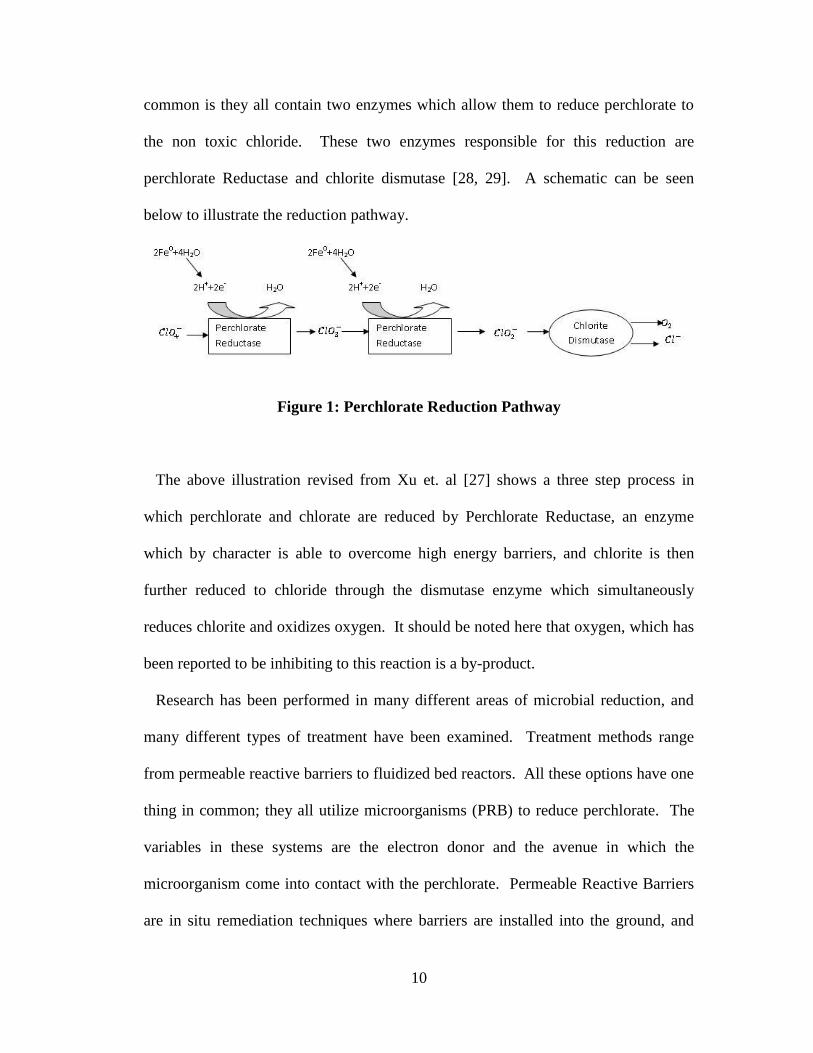
perchlorate Reductase and chlorite dismutase [28, 29]. A schematic can be seen
below to illustrate the reduction pathway.
Figure 1: Perchlorate Reduction Pathway
The above illustration revised from Xu et. al [27] shows a three step process in
which perchlorate and chlorate are reduced by Perchlorate Reductase, an enzyme
which by character is able to overcome high energy barriers, and chlorite is then
further reduced to chloride through the dismutase enzyme which simultaneously
reduces chlorite and oxidizes oxygen. It should be noted here that oxygen, which has
been reported to be inhibiting to this reaction is a by-product.
Research has been performed in many different areas of microbial reduction, and
many different types of treatment have been examined. Treatment methods range
from permeable reactive barriers to fluidized bed reactors. All these options have one
thing in common; they all utilize microorganisms (PRB) to reduce perchlorate. The
variables in these systems are the electron donor and the avenue in which the
microorganism come into contact with the perchlorate. Permeable Reactive Barriers
are in situ remediation techniques where barriers are installed into the ground, and
11
contaminated groundwater flows thru the barrier becoming less contaminated as it
passes thru the barrier. The majorities of the other treatment methods are pump and
treat techniques where the contaminated water is pumped to the surface and treated.
These technologies include fixed bed reactors, and fluidized bed reactors. These
reactors are packed with some consortium of microorganisms, whether pure or mixed
cultures, and the contaminated water is pumped thru the system along with a nutrient
solution containing vital elements necessary for perchlorate reduction. Although not
much research has been done on this medium solution, one study cites many of the
perchlorate reducing bacteria cannot grow without a “trace metal solution” which
contains: Molybdenum, and Selenium [27]. The microorganisms used in the
reduction of perchlorate are cited by many to be ubiquitous in throughout the
environment. It was once believed that all chlorate respiring bacteria were also
capable of reducing perchlorate, although the reverse is true, it has now been proven
that there is one set of CRB that cannot reduce perchlorate [30]. Although many
perchlorate reducing bacteria PRB exist; some exhibit different characteristics; some
are purely heterotrophic while other are autotrophs. Some show growth only on
acetate, while others will only grow on hydrogen, and still others can survive in
multiple environments [6, 7, 27]. Wastewater processes are home to many
microorganisms, and many PRB are able to live in these environments, and in
systems tailored for these microorganisms they are able to thrive in the presence of
other microorganisms. The use of these “mixed cultures” tends to be a less labor
intensive process, allowing the microorganisms found in WWTP to be directly used
in a reactor tailored for PRB, where pure cultures require some sort of laboratory
12
procedure to institute growth of a pure culture in the reactor. In order to tailor a
reactor for reduction of perchlorate using PRBs the microbial kinetics need be
understood. Nerenberg et al. isolated Dechloromonas sp. PC1 from a hydrogen-fed
autotrophic reactor, and conducted batch experiments in order to understand the
kinetics of this PRB. Using 1 liter bottles with 200 mL of growth medium, PC1, and
the headspace was filled with either a 95/5 hydrogen, carbon dioxide mixture of a
pure hydrogen gas. Using the results analyzed by a Dionex AS-16 column and by
using Monod substrate-utilization and biomass accumulation equations per Rittman
and McCarty were able to determine the reaction kinetics [31]. Others have studied
another strain, Perchlorate Respiring isolate KJ with acetate as the electron donor.
Mixed and pure cultures were both used in column experiments. It was determined
that the pure culture KJ could reduce perchlorate when fed acetate at influent
concentrations of ~25 mg/L to below the detection limit of the system. This occurred
when empty bed contact times ranged from 2-65 minutes. The column containing
mixed cultures also reduced perchlorate to below detection limits, but at slower flow
rates, and minimum EBCT of 31 minutes compared to 2.1 minutes for the pure
culture [32]. Others though reports mixed cultures have the ability to reduce
perchlorate at higher rates than pure cultures. The ability to use a cohort of
microorganisms directly from a WWTP is very beneficial to the viability of this
technology.
The choice of electron donor is also one that should be addressed, acetate a
common electron donor for perchlorate reducing bacteria is expensive, and the
addition of organic materials during water treatment process is hardly accepted.
13
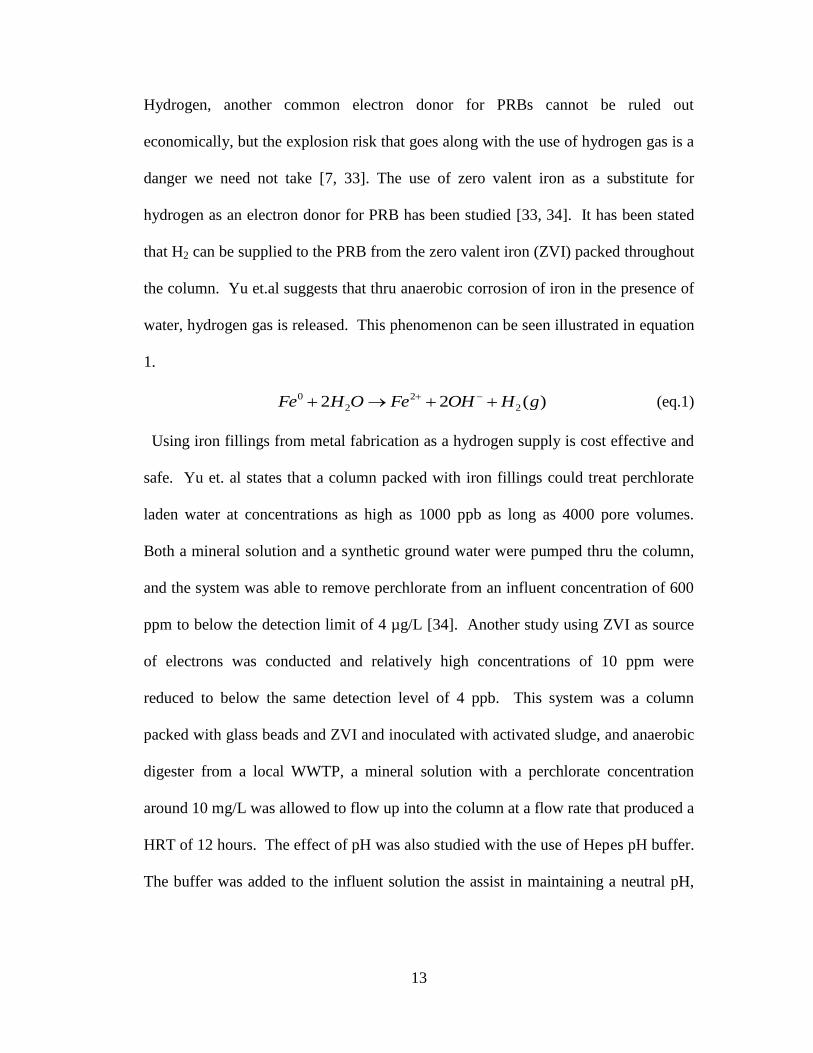
Hydrogen, another common electron donor for PRBs cannot be ruled out
economically, but the explosion risk that goes along with the use of hydrogen gas is a
danger we need not take [7, 33]. The use of zero valent iron as a substitute for
hydrogen as an electron donor for PRB has been studied [33, 34]. It has been stated
that H2 can be supplied to the PRB from the zero valent iron (ZVI) packed throughout
the column. Yu et.al suggests that thru anaerobic corrosion of iron in the presence of
water, hydrogen gas is released. This phenomenon can be seen illustrated in equation
1.
)(22 2
2
2
0 gHOHFeOHFe (eq.1)
Using iron fillings from metal fabrication as a hydrogen supply is cost effective and
safe. Yu et. al states that a column packed with iron fillings could treat perchlorate
laden water at concentrations as high as 1000 ppb as long as 4000 pore volumes.
Both a mineral solution and a synthetic ground water were pumped thru the column,
and the system was able to remove perchlorate from an influent concentration of 600
ppm to below the detection limit of 4 µg/L [34]. Another study using ZVI as source
of electrons was conducted and relatively high concentrations of 10 ppm were
reduced to below the same detection level of 4 ppb. This system was a column
packed with glass beads and ZVI and inoculated with activated sludge, and anaerobic
digester from a local WWTP, a mineral solution with a perchlorate concentration
around 10 mg/L was allowed to flow up into the column at a flow rate that produced a
HRT of 12 hours. The effect of pH was also studied with the use of Hepes pH buffer.
The buffer was added to the influent solution the assist in maintaining a neutral pH,
14
and after sometime the pH buffer was no longer added and the system was able still to
treat the perchlorate laden water [33].
In our study we investigate four process controls: 1) hydraulic retention time
(HRT), 2) pH, 3) nutrient requirement, and 4) kinetics for both perchlorate reduction
and microbial growth. Particularly we will attempt to normalize kinetic parameters
within a complex microbial population. Using this information as well as information
from our previous studies [33, 35], a viable technology to treat perchlorate
contaminated water to below regulated levels should be developed.
15
Chapter 2: Material and Methods
2.1. Microorganisms and flow-through column system
Mixed microbial communities were obtained from wastewater treatment processes
and were used to inoculate the column. This sludge was collected from two separate
facilities: anaerobic digester from the South Columbus Wastewater Treatment
Facility (Columbus, GA) and activated sludge from the H.C. Morgan Pollution Center
(Auburn, AL). The total suspended solids of each sample was measured and
determined to be 15,945 mg/L for the anaerobic digester and 3,154 mg/L for the
activated sludge. A medium solution was prepared with: NaHCO3 (0.476 mM),
MgSO4×7H2O (0.001 mM), NH4H2PO4 (0.08 mM) and a trace metal solution of
NiCl4×6H2O and NaSeO3×5H2O at concentrations of 0.04 mg/L each. It was then
spiked with sodium perchlorate (NaClO4-) at a concentration of around 10 mg/L
which is within the range of known perchlorate contamination levels [9]. Since our
previous study has shown that the reduction could take place at lower concentrations,
the test concentration used in this study was chosen to further demonstrate our
system’s ability to completely reduce perchlorate at high concentrations [33, 36].
HEPES buffer in both acid (C8H18N2O4S) and base (C8H17N2O4NaS) forms were
added (70 mM and 38 mM, respectively) to maintain pH of 7.3 against the pH
increase during anaerobic iron corrosion. The chemicals used in this research were
obtained from VWR international (Bridgeport, NJ). A glass column (5 cm x 30 cm)
16
with Teflon®
end caps (Ace Glass, Vineland, NJ) was filled in layers with 20 mL of
glass beads, 17 g of Iron fillings (Fisher Scientific, Pittsburgh, PA), and then (2% v/v)
a mixture of sand (Durham Geo, Stone Mountain, GA) and seed microbial culture
were added. A control column was constructed in the same manner and was not
inoculated with microorganisms. The column had a porosity and a pore volume of
0.27 and 160 mL, respectively. The column was purged with nitrogen during the
packing process, between each layer, and also for five minutes after the column was
packed to remove any oxygen from the column’s pore volume. After this nitrogen
purging, the column was subjected to the acclimation for perchlorate. During this
acclimation, perchlorate spiked growth medium was pumped into the column for
seven days to ensure at least ten pore volumes passed through before samples were
collected. A schematic and picture of the described experimental setup can be seen in
Figure 2.
2.2. Hydraulic Retention Time
Various HRTs (12, 8, 6 hours) were chosen and tested in order to determine the
optimum HRT. Samples were collected every day for ten days for each HRT. The
flow rate was subsequently increased after ten days to establish a new HRT. When
the concentration of perchlorate exceeded the EPA’s reference dose (RfD) of 15µg/L,
the HRT was increased until complete perchlorate reduction was again resumed. The
breakthrough HRT was revisited to ensure the correct HRT was concluded.
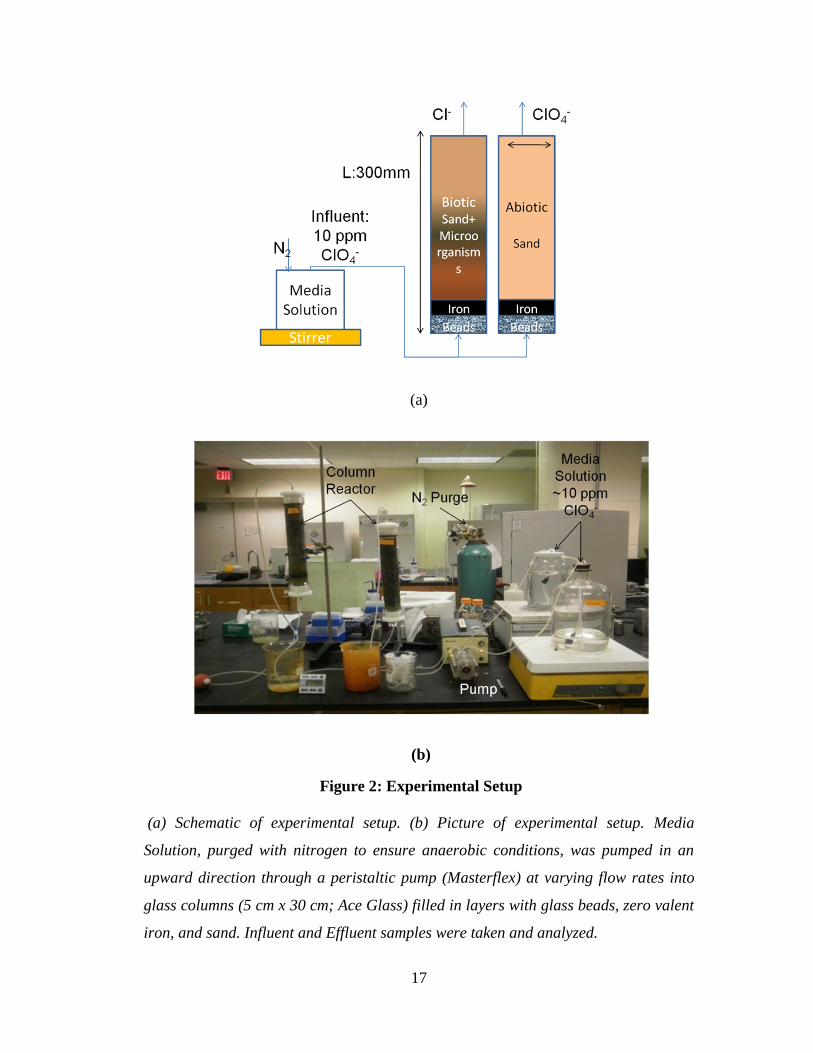
17
(a)
(b)
Figure 2: Experimental Setup
(a) Schematic of experimental setup. (b) Picture of experimental setup. Media
Solution, purged with nitrogen to ensure anaerobic conditions, was pumped in an
upward direction through a peristaltic pump (Masterflex) at varying flow rates into
glass columns (5 cm x 30 cm; Ace Glass) filled in layers with glass beads, zero valent
iron, and sand. Influent and Effluent samples were taken and analyzed.
18
2.3. pH effect
The flow was setup such that the column was subjected to an 8 hour HRT which
was concluded to be the optimum HRT for this system. The reactor was subjected to
ten days of influent media solution spiked to 10 mg/L of perchlorate and the pH was
regulated using the same HEPEs buffer (EMD Millipore, MP Biomedical) solution
(pH=7.3). After ten days the influent was switched an identical solution without pH
buffer. The influent and effluent pH, as well as the perchlorate concentrations, was
measured for twenty days. After this twenty day period, the HRT was increased to 12
hours, and the influent was switched to a solution with regulated pH. After the same
ten day period, the influent was again switched out to an identical, but unbuffered
solution and the same parameters were analyzed (influent and effluent pH and
perchlorate concentration).
2.4. Alternate pH buffer
A single column was packed as aforementioned, and it was allowed to equilibrate.
The system was subjected to the optimum HRT of 8 hours. The influent solution was
spiked with 10 mg/L perchlorate, and was buffered with a Tris-EDTA (TE) buffer
(EMD Millipore). Effluent samples were collected daily, and the pH and perchlorate
concentrations were analyzed to determine whether this TE buffer is able to regulate
the system’s pH in a manner that allows for complete reduction of perchlorate.
19
2.5. Required Nutrients
A single column was packed as previously described and was subjected to an
optimum HRT of 8 hours. In order to investigate and identify the required nutrients
for continuous microbial perchlorate reduction, the influent solution was alternated
between: a full growth media solution (see section 2.1), a solution containing only
nutrients (NaHCO3 (0.476 mM), MgSO4×7H2O (0.001 mM), NH4H2PO4 (0.08 mM)),
a trace metal solution (0.04 mg/L of NiCl4×6H2O and NaSeO3×5H2O) as well as an
artificial groundwater (AGW) solution containing only 48 ppm CaCO3 to simulate
that found in natural groundwater [32]. The effluent perchlorate concentration was
measured and plotted in order to determine the necessary nutrients and trace metals, if
any, are required for complete microbial perchlorate reduction.
2.7. Kinetics
2.7.1. Perchlorate Reduction Rate
A single column was packed as previously described, and it was allowed to run for
a ten day start up period. The column was subjected to different influent perchlorate
concentrations: 0.1, 1, 10, 20, and 100 (mg/L). The influent solution contained the
same growth nutrients, trace metal solution, and pH buffer as described above.
Effluent samples were collected after two pore volumes had passed through the
columns. The column’s ZVI was replaced after all five prescribed influent
concentrations were examined. A total of four different volumes of iron were
examined: 0.5, 1, 2, and 4 % of the total reactor volume. The results were studied
20
using an approach described by Logan, and the degradation rate (R) was plotted
against the perchlorate concentration [37].
2.7.2. Microbial Growth Kinetics Experiment
A column was packed as mentioned above. This column was subjected to an
influent perchlorate concentration above the limit of complete reduction in order to
accurately determine the necessary microbial growth kinetics previously described.
In order to determine the microbial kinetics the system must be subjected to varying
hydraulic residence times; these HRTs were: 4, 6, 8, 10, and 12 (hours). Samples
were collected after 2 pore volumes had been allowed to pass through the system, and
effluent perchlorate concentrations were measured. A plot of HRT (1/µ) versus the
inverse of the effluent substrate concentration (1/S) was generated and Excel’s linear
regression employed to create a trend line. This trend line was used to determine the
maximum growth rate (µmax) and the half saturation substrate concentration (Ks).
2.7.3. Numerical Modeling
A numerical model was constructed within Visual Basic for Microsoft Excel using
Monod equations to describe the microbial growth kinetics of the perchlorate
reducing bacteria in the column system. In this study, we used the operator split
strategy to solve the equations (16-18) numerically. Operator split strategy is one of
the numerical strategies used in solving multi-species reactive transport problems
[38]. The kinetic parameters (Ks and µmax) obtained from the growth kinetic
21
experiment as well as the theoretical yield coefficients (Y) that were calculated for
both autotrophic and heterotrophic bacteria were used as the inputs for the model.
2.8. Analytical Analysis
The samples were collected in a 15 mL vial, and then they were filtered using 0.45
µl filters. They were stored in the refrigerator for no more than 28 days as described
in EPA method 314.0. A Dionex (Sunnyvale, CA) DX-120 Ion Chromatograph with
a 4mm IonPac AS-16 column and an AG-16 guard column was used to analyze for
perchlorate. Analysis of the samples was based on the EPA’s suggested method for
analyzing perchlorate in drinking water (EPA Method 314.0). A Thermo Scientific
Orion 3Star pH meter was used to determine each sample’s pH.
22
Chapter 3: Results and Discussion
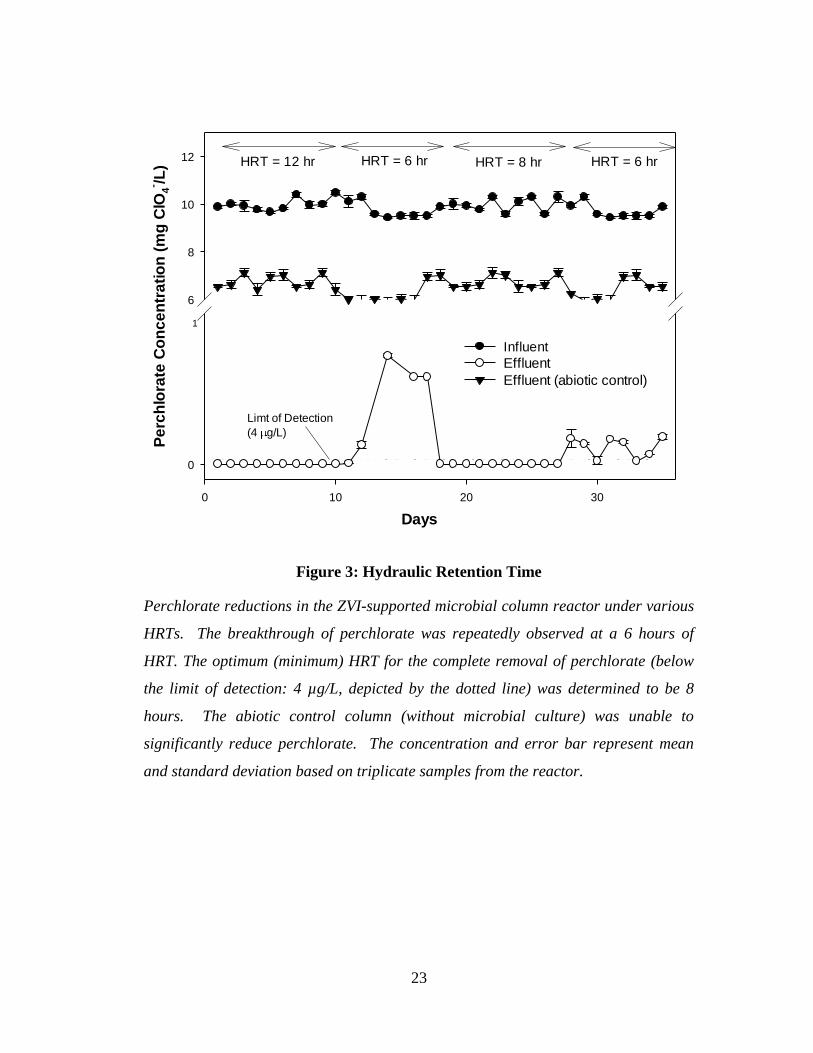
3.1. Hydraulic Retention Time
In order to optimize process controls factors for continuous microbial perchlorate
reduction, an optimum hydraulic retention time needs to be examined. With an
optimized (minimum HRT we can ensure that the proper flow rate is used during
experiments. This will also allow us to calculate the chemical reaction rate. Various
HRTs (12, 8, 6 hours) were applied to our column in order to determine the optimum
HRT, and the result is presented in Figure 3. The optimum HRT was determined to
be 8 hours because of the repeated breakthrough of perchlorate at a 6 hour HRT. It
should also be noted that the Abiotic control column was only able to achieve 35%
reduction of perchlorate. The results from the abiotic reactor illustrate that iron itself
cannot efficiently reduce perchlorate, and furthermore, that perchlorate does not
significantly adsorb to column materials. It can be concluded that abiotic perchlorate
reduction in a flow through reactor is not an efficient remediation method. These
results can be found below in Figure 3.
After the initial start up period the flow rate was set at 12 hours based on previous
studies performed by our group [36] The breakthrough is concluded to be 6 hours
because of the repeated breakthrough of perchlorate above the EPA’s RfD and
suspected MCL of 15 µg/L and 1 µg/L respectively [1, 7].
23
Figure 3: Hydraulic Retention Time
Perchlorate reductions in the ZVI-supported microbial column reactor under various
HRTs. The breakthrough of perchlorate was repeatedly observed at a 6 hours of
HRT. The optimum (minimum) HRT for the complete removal of perchlorate (below
the limit of detection: 4 µg/L, depicted by the dotted line) was determined to be 8
hours. The abiotic control column (without microbial culture) was unable to
significantly reduce perchlorate. The concentration and error bar represent mean
and standard deviation based on triplicate samples from the reactor.
Days
0 10 20 30
Pe
rch
lora
te C
on
ce
ntr
ati
on
(m
g C
lO4
- /L)
0
6
8
10
12
Influent
Effluent
Effluent (abiotic control)
HRT = 12 hr HRT = 6 hr HRT = 8 hr HRT = 6 hr
1
Limt of Detection
(4 g/L)
24
To determine if the values of perchlorate concentration were indeed above 15 ppb a
one tailed t-test was performed. A p value was computed to be 0.008; because this
value is less than 0.05 we can conclude that at 6 hours our column can no longer
reduce perchlorate below the EPA’s reference dose. After the initial sustained
breakthrough the HRT was adjusted to 8 hours, and complete reduction resumed.
The 6 hour HRT was revisited to ensure the sustained breakthrough indeed does take
place, and once again perchlorate broke through the Rfd. This reoccurrence as well
as the results from the statistical analysis allows one to conclude that the optimum
HRT is 8 hours.
An 8 hour HRT in our system (300 mm x 50 mm) describes a water velocity of 0.2
feet per day, which is within the range of common groundwater velocities [39] . The
average perchlorate concentration in the first 6 hour HRT trial was 560 µg/L
compared to the second trial average of 160 µg/L. This can be attributed to the
microorganism’s ability to adjust to the environment and therefore become more
efficient for the perchlorate respiration. The 35 % reduction of perchlorate by the
abiotic reactor can be attributed to both adsorption to the iron fillings as well as
reduction, a phenomenon discussed in the literature [40]. The pH in this system was
maintained to 7.2-7.5 using a HEPEs buffer solution. To ensure the iron corrosion
process did not raise the pH to a level that would hinder reduction as discussed in the
literature [29, 41] . From the figure above as well as the results from the t-test (P=
0.008<0.05) we conclude that the optimum hydraulic retention time for our system
and systems similar to ours is 8 hours.
25
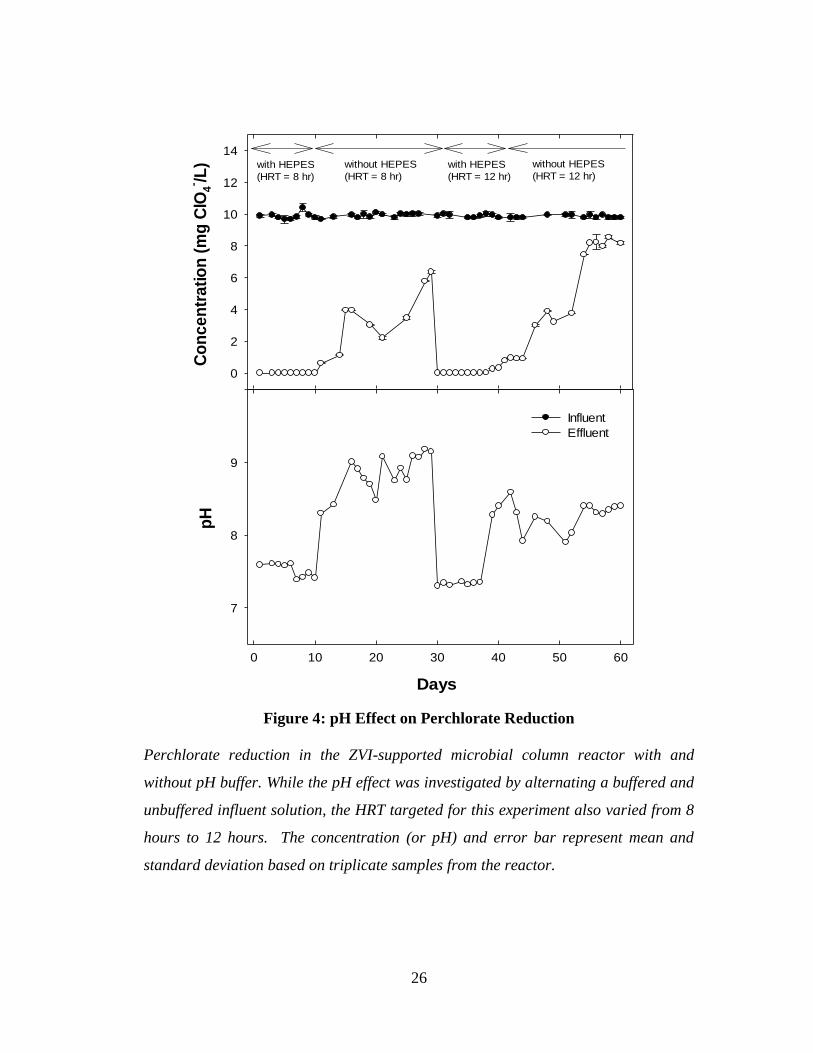
3.2. pH effect
The effect that pH had on the reactor was studied to determine the necessity of pH
control within the system. This was investigated by alternating influent solutions
with and without controlled pH (7.3). Okeke et.al states that the two major enzymes
involved in the reduction pathway are perchlorate reductase and chlorite dismutase,
and that perchlorate reductase has an optimum pH range of 7.0-8.0 [29]. Due to this
optimum range, it is possible that perchlorate reduction could be inhibited when no
pH buffer is used in our system, because of the hydroxide ions released during the
iron corrosion process.
From Figure 4 it can be concluded that when the pH raises above 8.0 the microbial
ability to reduce perchlorate becomes inhibited in the reactor. When two separate
HRTs are examined we notice that reduction did not completely cease, but only
slowed down when the pH rose above the optimum range. We can then conclude that
the longer residence time enables the system to further reduce perchlorate though not
completely. The first cycle of unbuffered solution resulted in higher influent pH
readings than the second, but both were as high as expected, and higher than the
prescribed “optimum” range. Although not shown in the figure, one point to note is
the influent pH. The influent pH was not always above the optimum range, but
because the effluent lacks the buffering capacity it always is. This can be attributed
to the iron corrosion process, a schematic of can be seen in the previous pages [34].
26
Figure 4: pH Effect on Perchlorate Reduction
Perchlorate reduction in the ZVI-supported microbial column reactor with and
without pH buffer. While the pH effect was investigated by alternating a buffered and
unbuffered influent solution, the HRT targeted for this experiment also varied from 8
hours to 12 hours. The concentration (or pH) and error bar represent mean and
standard deviation based on triplicate samples from the reactor.
Co
nc
en
tra
tio
n (
mg
ClO
4
- /L)
0
2
4
6
8
10
12
14
Influent
Effluent
Days
0 10 20 30 40 50 60
pH
7
8
9
10
with HEPES
(HRT = 8 hr)
without HEPES
(HRT = 8 hr)
with HEPES
(HRT = 12 hr)
without HEPES
(HRT = 12 hr)
27
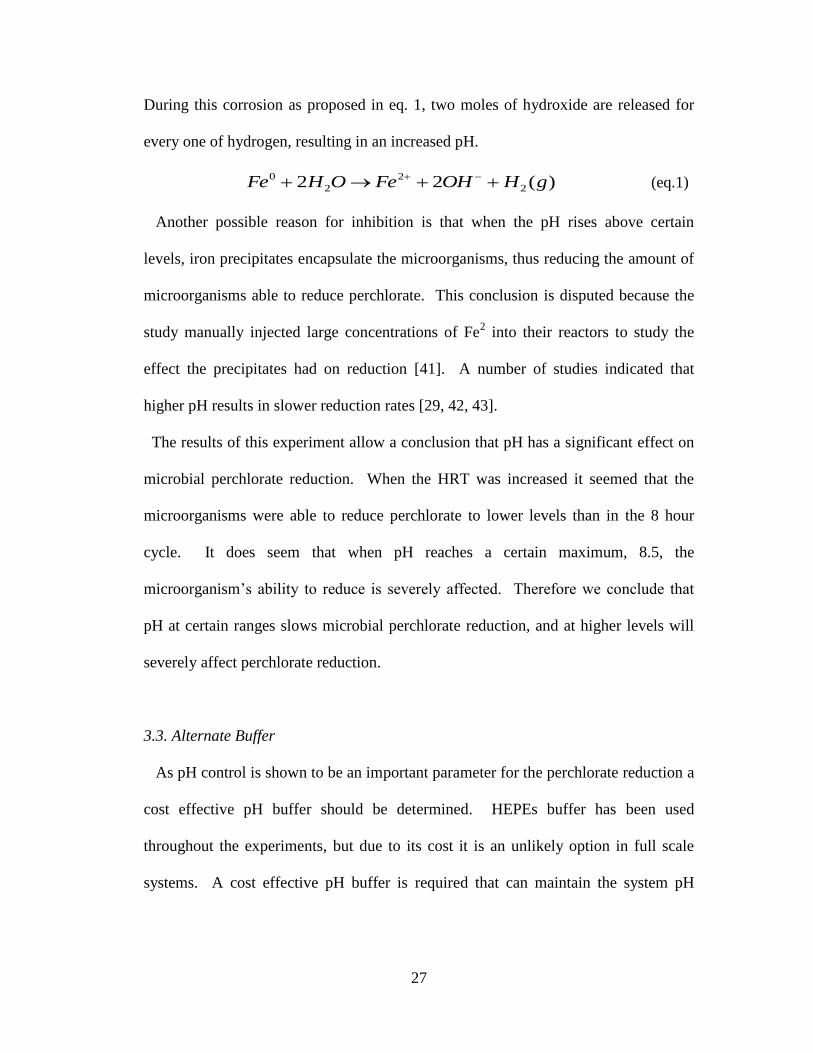
During this corrosion as proposed in eq. 1, two moles of hydroxide are released for
every one of hydrogen, resulting in an increased pH.
)(22 2
2
2
0 gHOHFeOHFe (eq.1)
Another possible reason for inhibition is that when the pH rises above certain
levels, iron precipitates encapsulate the microorganisms, thus reducing the amount of
microorganisms able to reduce perchlorate. This conclusion is disputed because the
study manually injected large concentrations of Fe2 into their reactors to study the
effect the precipitates had on reduction [41]. A number of studies indicated that
higher pH results in slower reduction rates [29, 42, 43].
The results of this experiment allow a conclusion that pH has a significant effect on
microbial perchlorate reduction. When the HRT was increased it seemed that the
microorganisms were able to reduce perchlorate to lower levels than in the 8 hour
cycle. It does seem that when pH reaches a certain maximum, 8.5, the
microorganism’s ability to reduce is severely affected. Therefore we conclude that
pH at certain ranges slows microbial perchlorate reduction, and at higher levels will
severely affect perchlorate reduction.
3.3. Alternate Buffer
As pH control is shown to be an important parameter for the perchlorate reduction a
cost effective pH buffer should be determined. HEPEs buffer has been used
throughout the experiments, but due to its cost it is an unlikely option in full scale
systems. A cost effective pH buffer is required that can maintain the system pH
28
within the optimum range mentioned earlier. The three major pH buffers considered
were: (1) carbonate, (2) phosphate, and (3) a Tris-EDTA (TE) buffer.
Carbonate Buffer systems cannot buffer pH within the optimum range of our
system, and phosphate buffers tend to inhibit iron corrosion, which is an important
supply of electrons in our system. Therefore it was determined that the buffering
ability of the TE buffer should be analyzed.
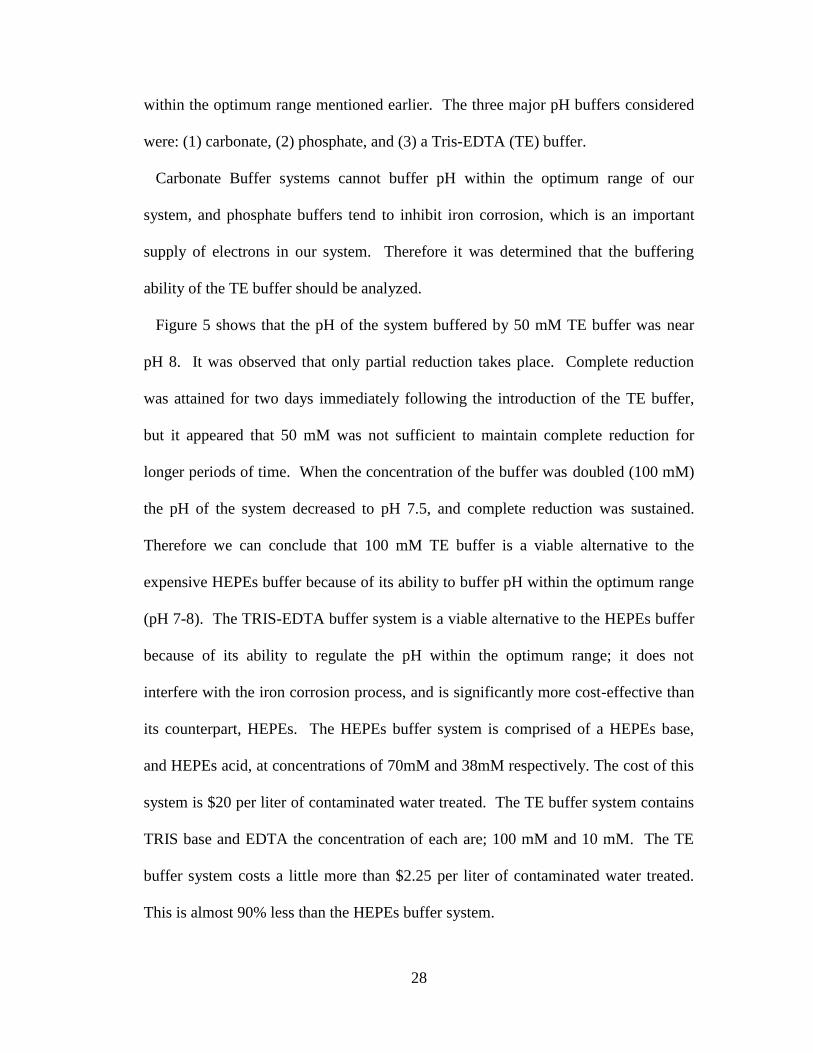
Figure 5 shows that the pH of the system buffered by 50 mM TE buffer was near
pH 8. It was observed that only partial reduction takes place. Complete reduction
was attained for two days immediately following the introduction of the TE buffer,
but it appeared that 50 mM was not sufficient to maintain complete reduction for
longer periods of time. When the concentration of the buffer was doubled (100 mM)
the pH of the system decreased to pH 7.5, and complete reduction was sustained.
Therefore we can conclude that 100 mM TE buffer is a viable alternative to the
expensive HEPEs buffer because of its ability to buffer pH within the optimum range
(pH 7-8). The TRIS-EDTA buffer system is a viable alternative to the HEPEs buffer
because of its ability to regulate the pH within the optimum range; it does not
interfere with the iron corrosion process, and is significantly more cost-effective than
its counterpart, HEPEs. The HEPEs buffer system is comprised of a HEPEs base,
and HEPEs acid, at concentrations of 70mM and 38mM respectively. The cost of this
system is $20 per liter of contaminated water treated. The TE buffer system contains
TRIS base and EDTA the concentration of each are; 100 mM and 10 mM. The TE
buffer system costs a little more than $2.25 per liter of contaminated water treated.
This is almost 90% less than the HEPEs buffer system.
29
Figure 5: Alternate pH Buffer
A TE pH buffer was tested to the system in order to determine its ability to maintain a
neutral pH. When a 50 mM TE solution was used, the pH rose above the prescribed
range for PRBs, but when the concentration was increased to 100 mM the system
remained within the optimum range for reduction. Perchlorate reduction was
sensitively affected by the pH changes.
Co
nc
en
tra
tio
n (
mg
ClO
4
- /L)
0
2
4
6
8
10
12
14
16
InfluentEffluent
Days
0 5 10 15 20 25 30
pH
7
8
9
10
HEPEs (100 mM) No Buffer TE (50 mM) TE (100 mM)
30
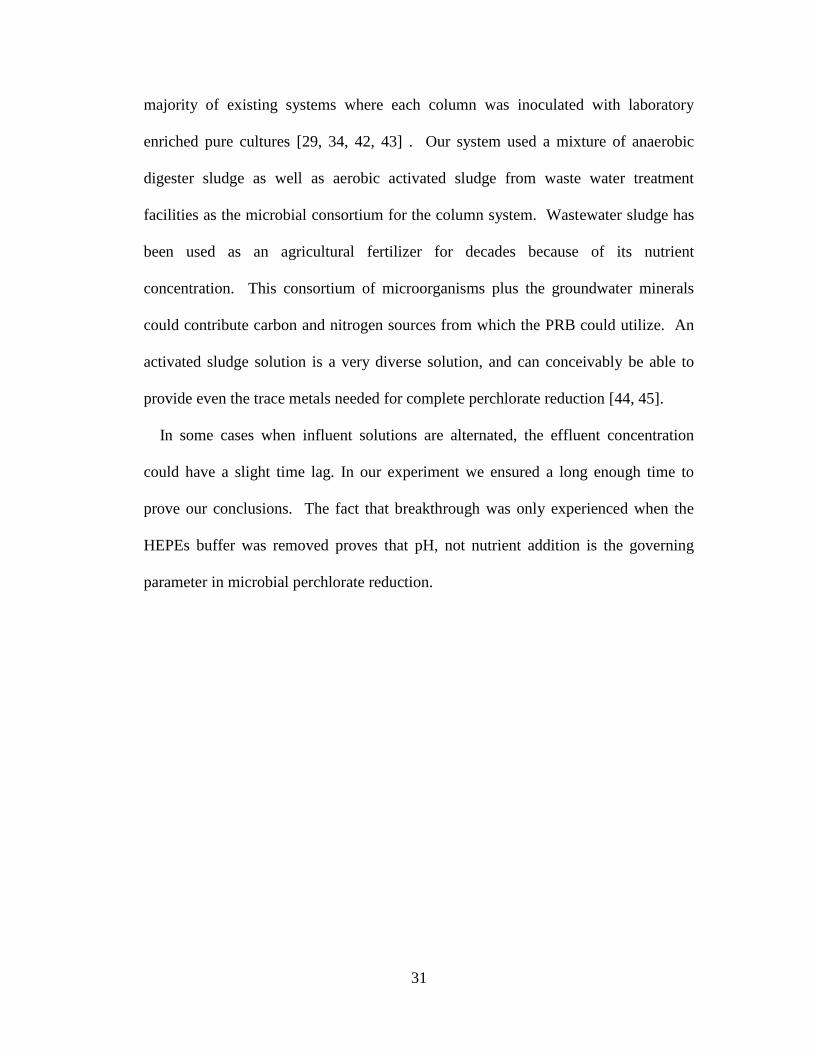
3.4. Nutrient Requirement
In order to examine the requirement of nutrients (macro-nutrients and trace metals)
as indicated in the literature [27, 31, 34, 42], a variety of influent solutions were
tested and presented in Figure 4. The first phase of this experiment used an influent
containing additional nutrients, trace metals, and pH buffer. Complete reduction was
achieved as expected. The next phase the influent solution contained only additional
nutrients, but no trace metals. As a number of studies indicated the need for the trace
metal solution, particularly Ni and Se, it was hypothesized that only partial reduction
would occur. However complete reduction was achieved in the second phase and it is
likely that trace metals in the column was derived from the activated sludge that was
used as the seed culture [44]. The third influent solution which contained no macro-
nutrients only trace metals; enabled the complete reduction, because of the nutrients
available in the wastewater sludge. The buffered AGW solution (no nutrient or trace
metals) assisted in concluding that complete perchlorate reduction can be
accomplished without the addition of nutrients or trace metals, when a wastewater
sludge is used to inoculate the reactor. This is because as we previously discussed,
the amount of nutrients and trace metals in the sludge itself. The last phase was an
unbuffered AGW; breakthrough was expected because of the importance of optimum
pH, which we have already discussed.
In order for the enzymes to completely reduce perchlorate to chloride, it is
necessary for a carbon source as well as a nitrogen source to be made available and
utilized for the synthesis of microbial cells. The energy sources for microbial activity
were derived from the biomass consortium in our system. In comparison to the
31
majority of existing systems where each column was inoculated with laboratory
enriched pure cultures [29, 34, 42, 43] . Our system used a mixture of anaerobic
digester sludge as well as aerobic activated sludge from waste water treatment
facilities as the microbial consortium for the column system. Wastewater sludge has
been used as an agricultural fertilizer for decades because of its nutrient
concentration. This consortium of microorganisms plus the groundwater minerals
could contribute carbon and nitrogen sources from which the PRB could utilize. An
activated sludge solution is a very diverse solution, and can conceivably be able to
provide even the trace metals needed for complete perchlorate reduction [44, 45].
In some cases when influent solutions are alternated, the effluent concentration
could have a slight time lag. In our experiment we ensured a long enough time to
prove our conclusions. The fact that breakthrough was only experienced when the
HEPEs buffer was removed proves that pH, not nutrient addition is the governing
parameter in microbial perchlorate reduction.
32
Figure 6: Required Nutrients
Effect of macro-nutrients and trace elements on the perchlorate reduction. All
required media, macro-nutrient only, trace elements only, no nutrient and pH buffer
only, and no nutrient and no pH were applied for perchlorate reduction in the ZVI
supported microbial column reactor. The system was able to completely reduce
perchlorate without the addition of any nutrients as long as the pH was buffered to
neutral (7-8).
Days
0 10 20 30 40 50
Co
nc
en
tra
tio
n (
mg
ClO
4
- /L)
0
2
4
6
8
10
12
14
Influent
Effluent
All media All excepttrace metals
All exceptmacro-nutrients
No mediaonly pH buffer
No mediano pH buffer
33
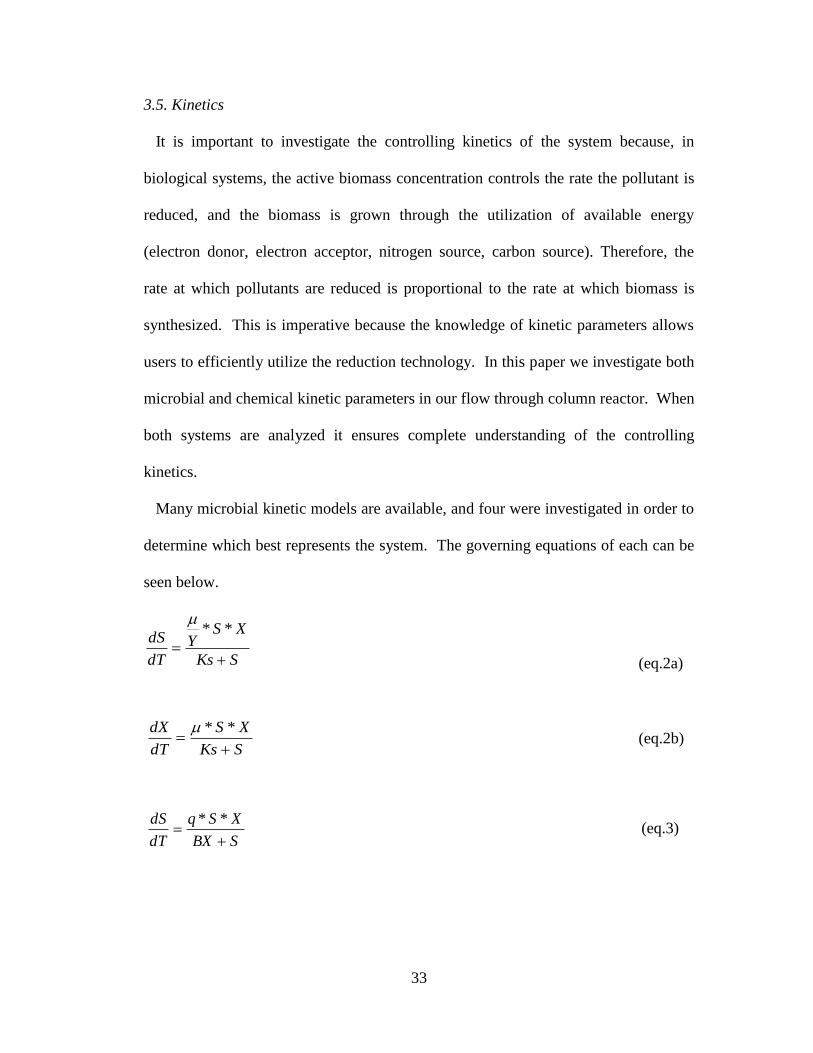
3.5. Kinetics
It is important to investigate the controlling kinetics of the system because, in
biological systems, the active biomass concentration controls the rate the pollutant is
reduced, and the biomass is grown through the utilization of available energy
(electron donor, electron acceptor, nitrogen source, carbon source). Therefore, the
rate at which pollutants are reduced is proportional to the rate at which biomass is
synthesized. This is imperative because the knowledge of kinetic parameters allows
users to efficiently utilize the reduction technology. In this paper we investigate both
microbial and chemical kinetic parameters in our flow through column reactor. When
both systems are analyzed it ensures complete understanding of the controlling
kinetics.
Many microbial kinetic models are available, and four were investigated in order to
determine which best represents the system. The governing equations of each can be
seen below.
SKs
XSY
dT
dS
**
(eq.2a)
(eq.2b)
(eq.3)
SKs
XS
dT
dX
**
SBX
XSq
dT
dS
**
34
SK
XSq
dT
dS ** (eq.4)
(eq.5)
Where;
µ (eq.2; Monod): growth rate (T-1
)
Y: yield coefficient (M-biomass/M-perchlorate)
S: substrate concentration (mg/L) * In this research S: perchlorate concentration
X: Biomass concentration, VSS (mg/L)
Ks: Half saturation constant (mg/L)
B (eq.3; Contois): fitting parameter
q (eq.5; Tessier): substrate utilization rate (M-perchlorate/M-biomass/T)
γ (eq.4; Moser): fitting parameter
Much debate exists between these models, and the only valid arguments between
them is goodness of fit, mathematical utility, and acceptance [46, 47]. The Monod
kinetic model was developed for single bacterial cultures feeding on single organic
substrates. Therefore, when modeling mixed/heterogeneous cultures questions arise
to whether the model can accurately predict the growth and reduction of substrate.
Much research has been done on this debate and the general consensus is that Monod
kinetics can accurately depict mixed systems. Hence, one must realize that the
kinetic parameters deduced are not necessarily parameters for one single
microorganism, but an average for the complete system [46]. Other kinetic models
such as Contois and Moser are more complex versions of the original Monod model.
The addition of the “ill defined” coefficients only add skepticism to the models
XeqdT
dS KS )1( /
35
results [47]. Due to the fact that the Monod model is widely used and accepted as an
accurate model for perchlorate reducing system, and also because of the accurate fit
to our results, Monod expressions were used to formulate the kinetic parameters.
From these kinetic parameters, as well as the other process controls investigated
throughout this report, an efficient flow through reactor can be developed.
3.5.1. Perchlorate Reduction Rate in Column Reactor
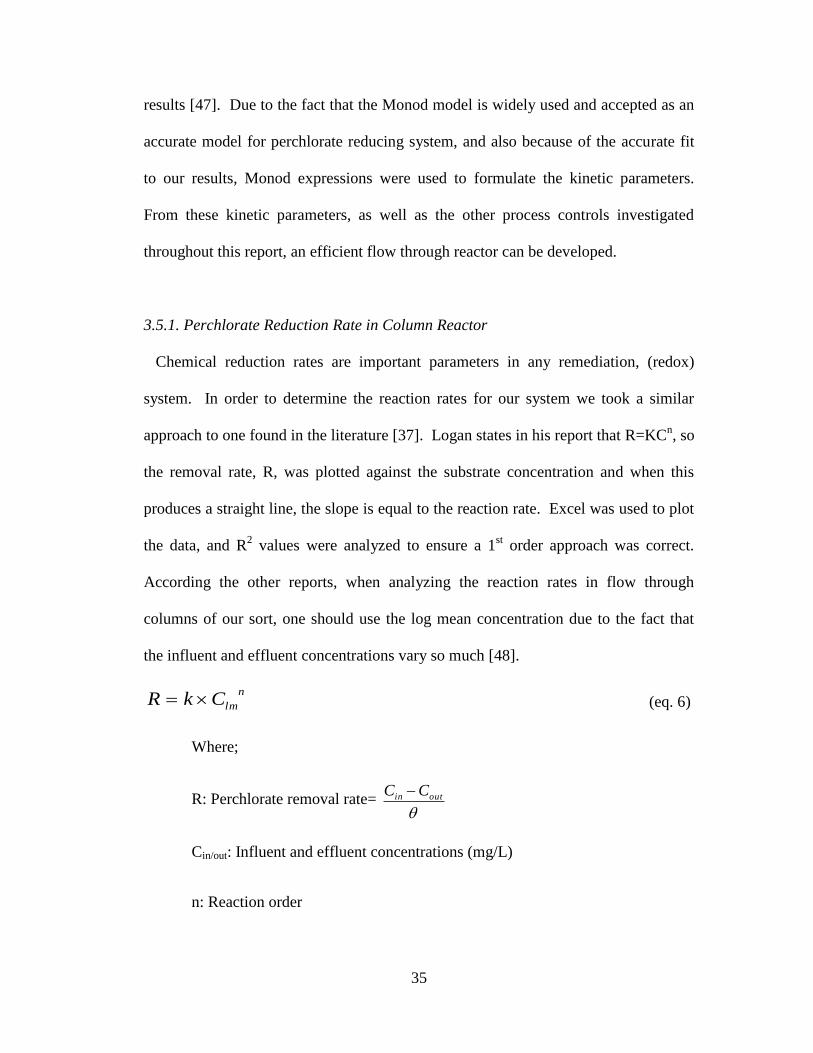
Chemical reduction rates are important parameters in any remediation, (redox)
system. In order to determine the reaction rates for our system we took a similar
approach to one found in the literature [37]. Logan states in his report that R=KCn, so
the removal rate, R, was plotted against the substrate concentration and when this
produces a straight line, the slope is equal to the reaction rate. Excel was used to plot
the data, and R2 values were analyzed to ensure a 1
st order approach was correct.
According the other reports, when analyzing the reaction rates in flow through
columns of our sort, one should use the log mean concentration due to the fact that
the influent and effluent concentrations vary so much [48].
n
lmCkR (eq. 6)
Where;
R: Perchlorate removal rate=
outin CC
Cin/out: Influent and effluent concentrations (mg/L)
n: Reaction order
36
θ: Hydraulic residence time (hr)
k: 1st order reaction rate (hr
-1)
Clm: log mean coefficient=
out
in
outin
lm
C
C
CCC
ln
(eq.7)
These above equations were used in the approach to determine the chemical
degradation rate. In our experiment we changed the influent flow rate, taking
samples after at least 2 pore volumes passed. The influent and effluent concentrations
as well as an HRT of 8 hours were used to create Figure 7.
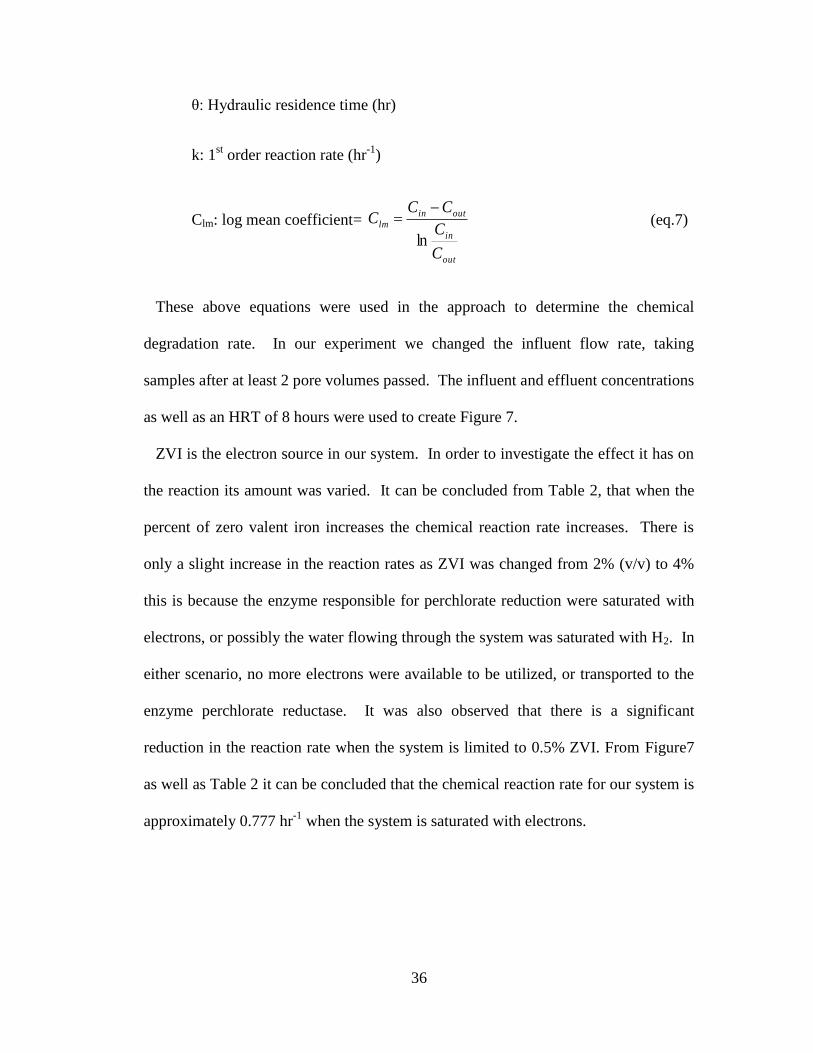
ZVI is the electron source in our system. In order to investigate the effect it has on
the reaction its amount was varied. It can be concluded from Table 2, that when the
percent of zero valent iron increases the chemical reaction rate increases. There is
only a slight increase in the reaction rates as ZVI was changed from 2% (v/v) to 4%
this is because the enzyme responsible for perchlorate reduction were saturated with
electrons, or possibly the water flowing through the system was saturated with H2. In
either scenario, no more electrons were available to be utilized, or transported to the
enzyme perchlorate reductase. It was also observed that there is a significant
reduction in the reaction rate when the system is limited to 0.5% ZVI. From Figure7
as well as Table 2 it can be concluded that the chemical reaction rate for our system is
approximately 0.777 hr-1
when the system is saturated with electrons.
37
Figure 7: Chemical Reduction Rate
The perchlorate reduction rate increases slightly as the concentration of the electron
donor increases. The increase in the rate decreases as more iron is introduced; this
is because the microorganisms are saturated with the electron donor. The reduction
rate was calculated using 1st order kinetics and linear regression.
Perchlorate Concentration (mg ClO4
-/L)
0.01 0.1 1 10 100
Re
du
cti
on
Ra
te (
mg
/L-h
r)
0.01
0.1
1
10
100
38
Table 2: Effect of zero-valent iron on reduction rate
In the table it can be seen that when the percent of ZVI increases (increase in H2) the
chemical reduction rate increases. The rate at which the reaction rate increases is
decreased as the percent of ZVI reaches four, because of the H2 saturation.
Zero Valent Iron (% v/v)
K (hr-1
)
4% 0.777
2% 0.761
1% 0.735
0.50% 0.68
39
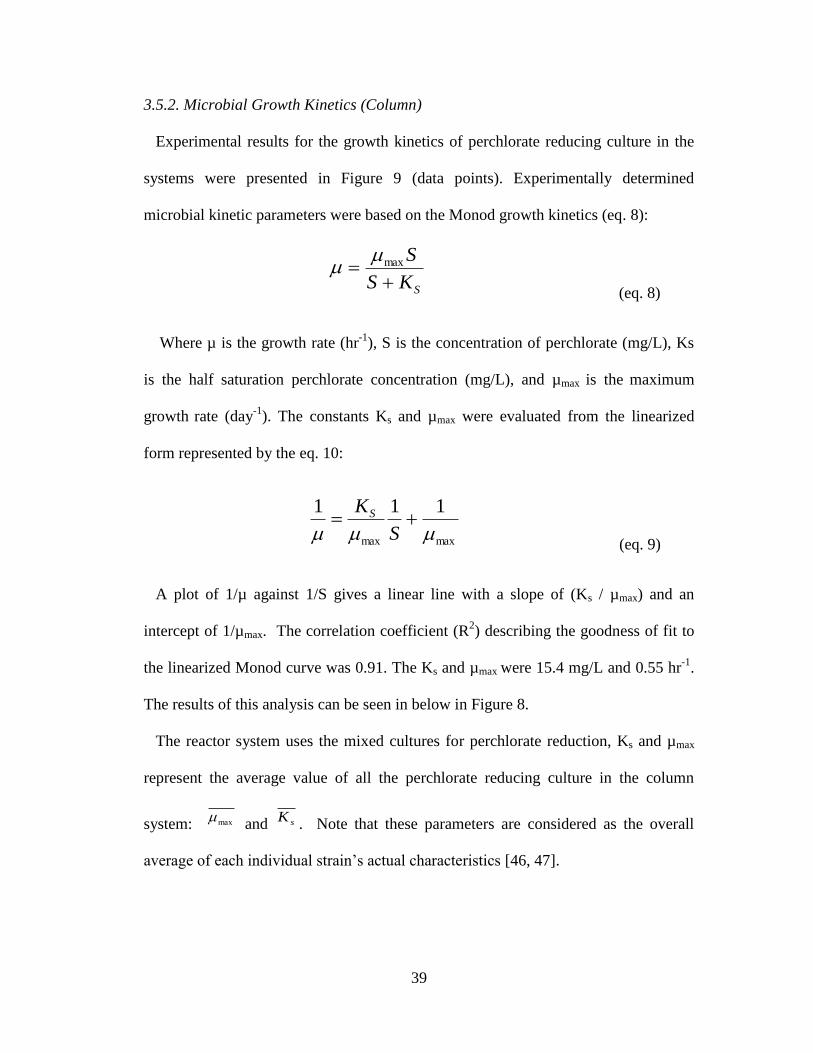
3.5.2. Microbial Growth Kinetics (Column)
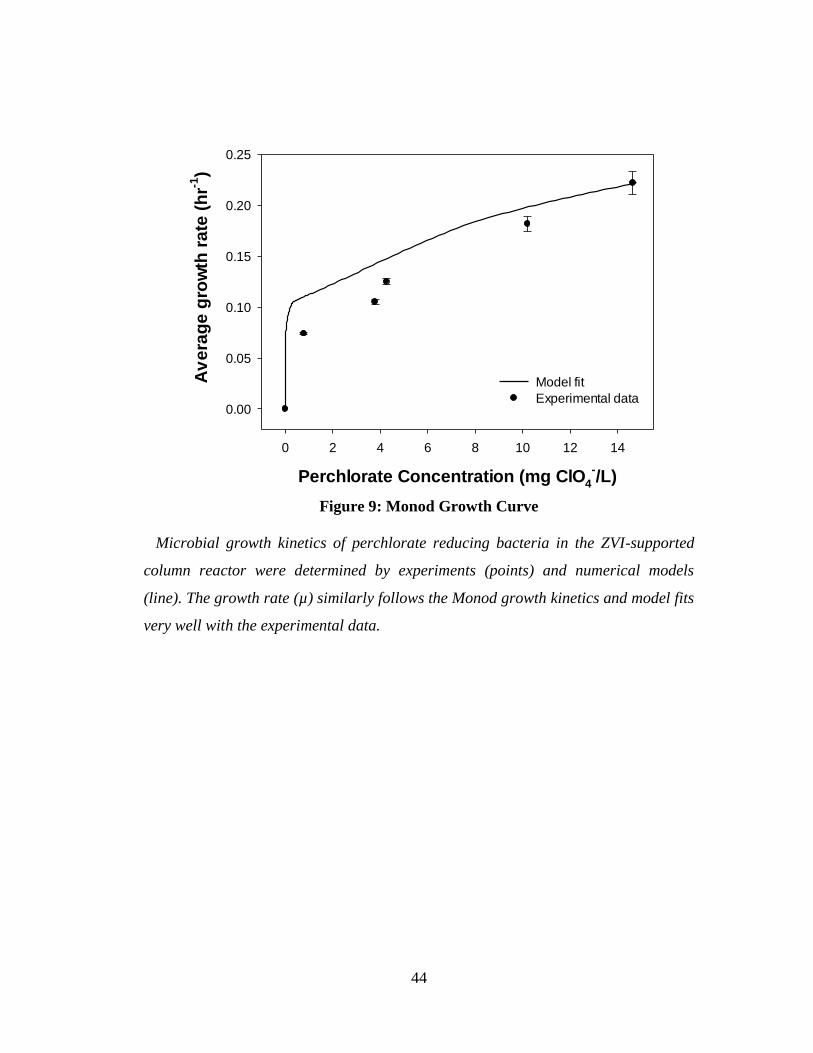
Experimental results for the growth kinetics of perchlorate reducing culture in the
systems were presented in Figure 9 (data points). Experimentally determined
microbial kinetic parameters were based on the Monod growth kinetics (eq. 8):
SKS
S
max
(eq. 8)
Where µ is the growth rate (hr-1
), S is the concentration of perchlorate (mg/L), Ks
is the half saturation perchlorate concentration (mg/L), and µmax is the maximum
growth rate (day-1
). The constants Ks and µmax were evaluated from the linearized
form represented by the eq. 10:
maxmax
111
S
KS
(eq. 9)
A plot of 1/µ against 1/S gives a linear line with a slope of (Ks / µmax) and an
intercept of 1/µmax. The correlation coefficient (R2) describing the goodness of fit to
the linearized Monod curve was 0.91. The Ks and µmax were 15.4 mg/L and 0.55 hr-1
.
The results of this analysis can be seen in below in Figure 8.
The reactor system uses the mixed cultures for perchlorate reduction, Ks and µmax
represent the average value of all the perchlorate reducing culture in the column
system: max and sK
. Note that these parameters are considered as the overall
average of each individual strain’s actual characteristics [46, 47].
40
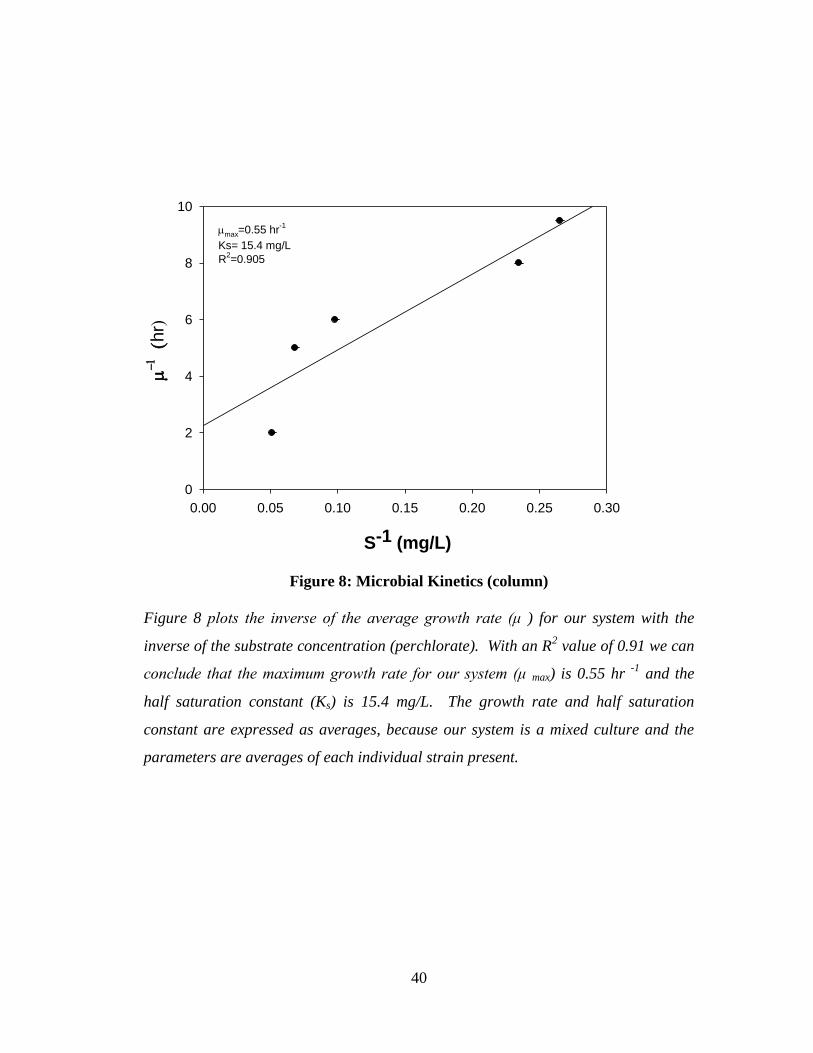
S-1 (mg/L)
0.00 0.05 0.10 0.15 0.20 0.25 0.30
h
r
0
2
4
6
8
10
max=0.55 hr-1
Ks= 15.4 mg/L
R2=0.905
Figure 8: Microbial Kinetics (column)
Figure 8 plots the inverse of the average growth rate (μ ) for our system with the
inverse of the substrate concentration (perchlorate). With an R2 value of 0.91 we can
conclude that the maximum growth rate for our system (μ max) is 0.55 hr -1
and the
half saturation constant (Ks) is 15.4 mg/L. The growth rate and half saturation
constant are expressed as averages, because our system is a mixed culture and the
parameters are averages of each individual strain present.
41
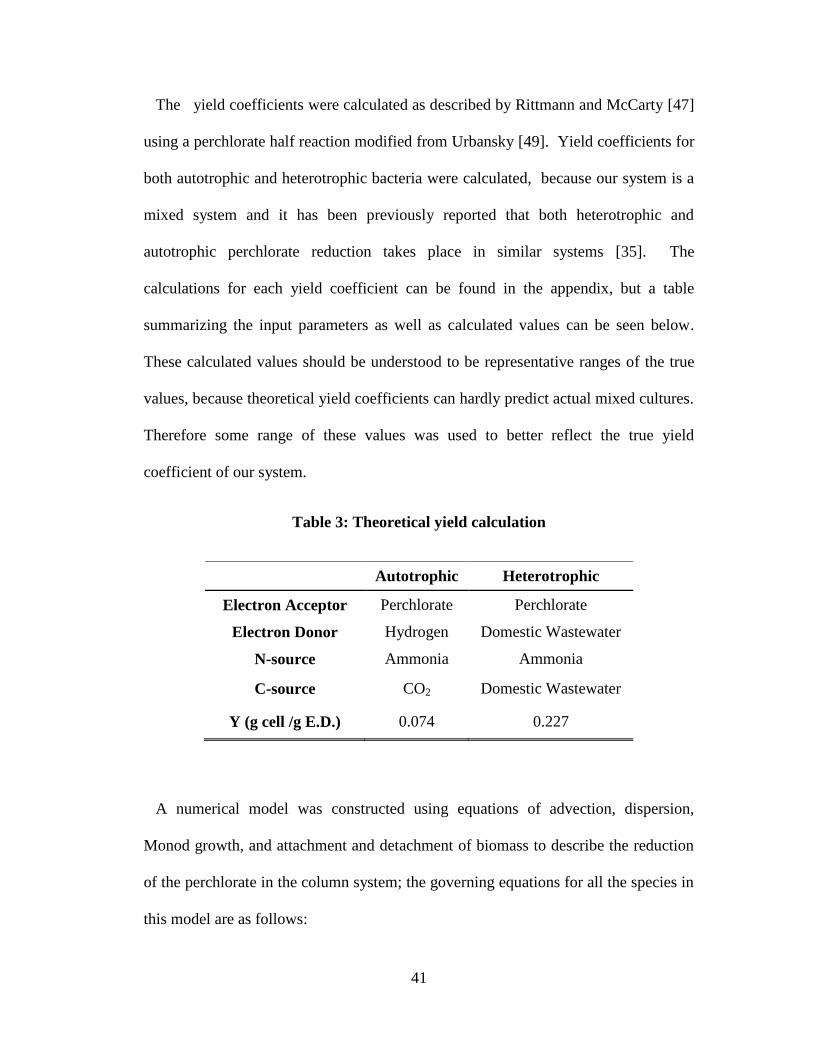
The yield coefficients were calculated as described by Rittmann and McCarty [47]
using a perchlorate half reaction modified from Urbansky [49]. Yield coefficients for
both autotrophic and heterotrophic bacteria were calculated, because our system is a
mixed system and it has been previously reported that both heterotrophic and
autotrophic perchlorate reduction takes place in similar systems [35]. The
calculations for each yield coefficient can be found in the appendix, but a table
summarizing the input parameters as well as calculated values can be seen below.
These calculated values should be understood to be representative ranges of the true
values, because theoretical yield coefficients can hardly predict actual mixed cultures.
Therefore some range of these values was used to better reflect the true yield
coefficient of our system.
Table 3: Theoretical yield calculation
A numerical model was constructed using equations of advection, dispersion,
Monod growth, and attachment and detachment of biomass to describe the reduction
of the perchlorate in the column system; the governing equations for all the species in
this model are as follows:
Autotrophic Heterotrophic
Electron Acceptor Perchlorate Perchlorate
Electron Donor Hydrogen Domestic Wastewater
N-source Ammonia Ammonia
C-source CO2 Domestic Wastewater
Y (g cell /g E.D.) 0.074 0.227
42
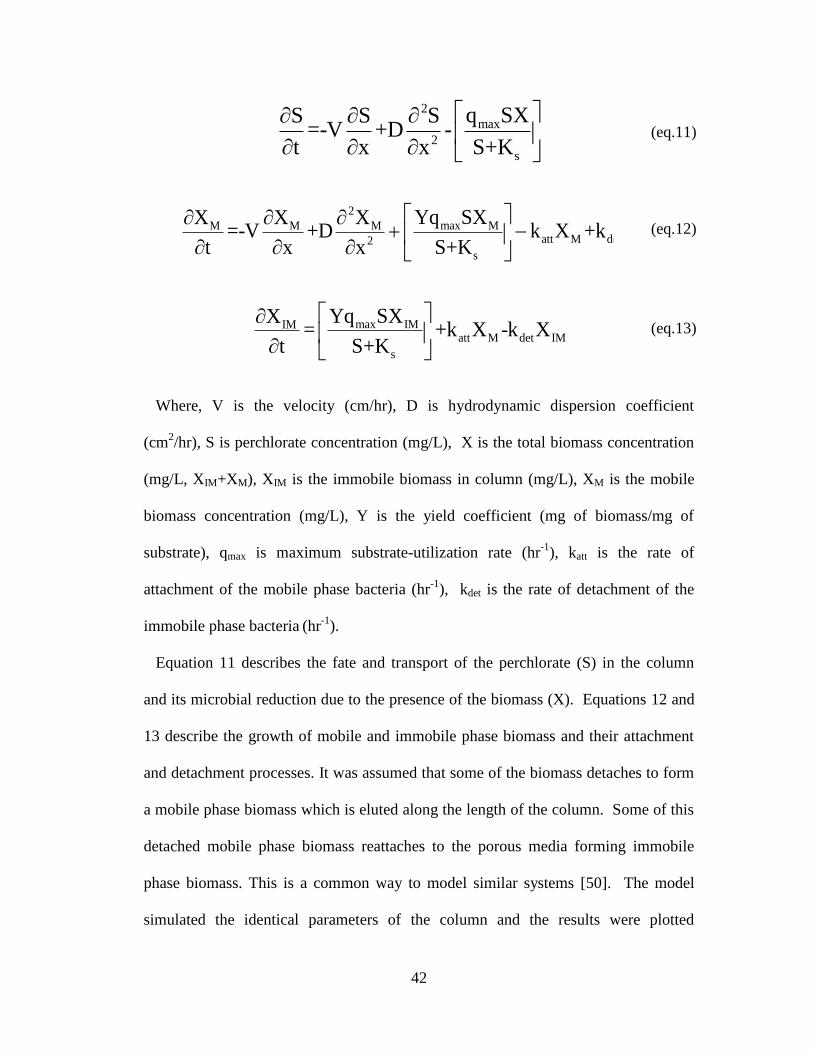
2
max
2
s
q SXS S S=-V +D -
t x x S+K
2
max MM M Matt M det IM2
s
Yq SXX X X=-V +D k X +k X
t x x S+K
max IMIMatt M det IM
s
Yq SXX= +k X -k X
t S+K
Where, V is the velocity (cm/hr), D is hydrodynamic dispersion coefficient
(cm2/hr), S is perchlorate concentration (mg/L), X is the total biomass concentration
(mg/L, XIM+XM), XIM is the immobile biomass in column (mg/L), XM is the mobile
biomass concentration (mg/L), Y is the yield coefficient (mg of biomass/mg of
substrate), qmax is maximum substrate-utilization rate (hr-1
), katt is the rate of
attachment of the mobile phase bacteria (hr-1
), kdet is the rate of detachment of the
immobile phase bacteria (hr-1
).
Equation 11 describes the fate and transport of the perchlorate (S) in the column
and its microbial reduction due to the presence of the biomass (X). Equations 12 and
13 describe the growth of mobile and immobile phase biomass and their attachment
and detachment processes. It was assumed that some of the biomass detaches to form
a mobile phase biomass which is eluted along the length of the column. Some of this
detached mobile phase biomass reattaches to the porous media forming immobile
phase biomass. This is a common way to model similar systems [50]. The model
simulated the identical parameters of the column and the results were plotted
(eq.11)
(eq.13)
(eq.12)
43
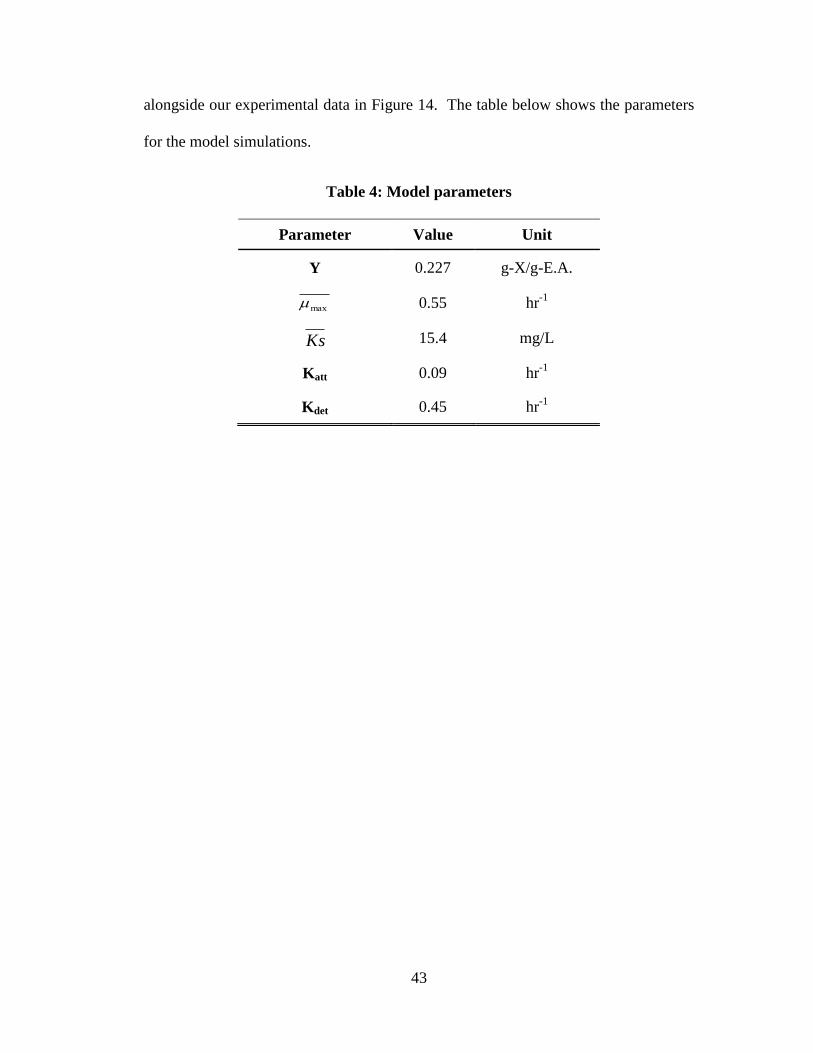
alongside our experimental data in Figure 14. The table below shows the parameters
for the model simulations.
Table 4: Model parameters
Parameter Value Unit
Y 0.227 g-X/g-E.A.
max 0.55 hr-1
Ks 15.4 mg/L
Katt 0.09 hr-1
Kdet 0.45 hr-1
44
Microbial growth kinetics of perchlorate reducing bacteria in the ZVI-supported
column reactor were determined by experiments (points) and numerical models
(line). The growth rate (µ) similarly follows the Monod growth kinetics and model fits
very well with the experimental data.
Perchlorate Concentration (mg ClO4
-/L)
0 2 4 6 8 10 12 14
Av
era
ge
gro
wth
ra
te (
hr-1
)
0.00
0.05
0.10
0.15
0.20
0.25
Model fit
Experimental data
Figure 9: Monod Growth Curve
45
Chapter 4: Conclusions
In this study it has been concluded once again that unacclimated mixed microbial
consortium feeding on H2 from zero valent iron corrosion can completely reduce
perchlorate in a continuous flow through column. Four process controls parameters
are: 1) HRT, 2) pH 3) required nutrients, 4) kinetics. The parameters were analyzed in
order to optimize a technology to safely and efficiently treat perchlorate laden water
to levels below the forthcoming federal regulation of 1 µg/L. The optimum HRT was
determined to be 8 hours for our flow through reactor, and it was determined that the
hydroxide released during the essential iron corrosion causes the pH to rise above the
enzyme’s “optimum” range for perchlorate reduction. Both HEPEs and TE pH
buffers proved to be viable to control the pH of the reactor within this “optimum”
range (7.0-8.0). This research proved that additional nutrients might not be necessary
when wastewater sludge is used to inoculate the reactor, because of the plethora of
nutrients available within the sludge itself. Kinetics, both chemical and microbial, of
this mixed microbial system were analyzed. The chemical degradation rate was
concluded to be 0.777 hr-1
in a system saturated with H2. It was also proven that the
amount of ZVI has an effect on the degradation rate until some saturation limit is
reached. While trying to determine if the microbial growth kinetics of a similar batch
system could be compared to that of the flow through reactor it was determined that
when H2 concentration is low and dissolved oxygen is allowed to accumulate within
46
the reactors the reaction rate is severely inhibited. The microbial growth kinetics of
the flow through reactor were studied and values for both the maximum growth rate
as well as the half saturation constant were estimated to be 0.55 hr-1
and 15.4 mg/L,
respectively. A novel concept presented in this research is that these values are
simple averages of the entire system, not actual values for specific strains of PRBs.
These values as well as others discussed throughout this paper should be treated as
average values within some reasonable range for each system. We were also able to
recreate our data using a mathematical model with simple Monod expressions. Using
these process control factors as well as important parameters described elsewhere a
safe and effective treatment option can now be implemented.
To summarize the conclusion:
(1) The minimum HRT for our system to completely reduce 10 mg/L of perchlorate is
8 hours.
(2) The pH in iron supported microbial perchlorate reducing systems is a governing
process control and should be controlled to at neutral pH value.
(3) Additional nutrients are not needed when wastewater sludge is used to inoculate
the system.
(4) Both perchlorate reduction kinetics and microbial growth kinetics were elucidated
for the perchlorate reducing column system.
(5) The numerical model successfully simulated microbial growth kinetics within a
continuous flow-through microbial column system.

47
These conclusions can be further used to optimize full scale perchlorate remediation
systems, as well as assist in the understanding of other microbial remediation
technologies which might follow similar kinetic characteristics.
48
Chapter 5: Future Work
Much progress has been made in the field of microbial reduction of perchlorate in
the presence of zero-valent iron, but more studies are needed. The major process
controls have been analyzed, and it has been determined that hydrogen gas from iron
corrosion can be utilized. However a more in depth analysis of the active microbial
communities could be extremely beneficial. As well as a more in depth study of the
controlling kinetics in order to elucidate the system. A long term investigation into
the use of microorganisms from WWTP including the options available to introduce
additional sludge when needed would be an interesting research opportunity. Also a
detailed pilot scale investigation with an in-depth cost analysis would be of great
benefit to the viability of this technology.
49
References
[1] C. Houge, Changing course on perchlorate, in: Chemical and Engineering News,
2011.
[2] N.R. Council, Health implications of perchlorate ingestion, Washington D.C.,
2005.
[3] Interim drinking water health advisory for perchlorate, in, Environmental
Protection Agency, 2008.
[4] Drinking water: regulatory determination on perchlorate, in: E.P. Agency (Ed.),
Washington D.C., 2011, pp. 7762-7767.
[5] K.D. Hurley, J.R. Shapley, Efficient heterogeneous catalytic reduction of
perchlorate in water, Environmental Science and Technology, 41 (2007) 2044-2049.
[6] W.E. Motzer, Perchlorate: problems, detection, and solutions, Environmental
Forensics, 2 (2001) 301-311.
[7] R. Srinivasan, G.A. Sorial, Treatment of perchlorate in drinking water: a critical
review, Seperation and Purification Technologies, 69 (2009) 7-21.
[8] C.W. Trumpolt, M. Crain, G.D. Cullison, S.J.P. Flanagan, L. Siegel, S. Lathrop,
Perchlorate: sources, uses, and occurrences in the environment, Remediation Journal,
16 (2005) 65-89.
[9] EPA, Known perchlorate releases in the U.S., in, 2005, at
http://epa.gov/fedfac/documents/perchlorate_links.htm#occurrences.
[10] B. Rao, T.A. Anderson, G.J. Orris, K.A. Rainwater, S. Rajagopalan, R.M.
Sandvig, B.R. Scanlon, D.A. Stonestrom, M.A. Walvoord, W.A. Jackson,
Widespread natural perchlorate in unsaturated zones of the southwest united states,
Environmental Science & Technology, 41 (2007) 4522-4528.
[11] E.T. Urbansky, T.W. Collette, W.P. Robarge, Survey of fertilizers and related
materials for perchlorate in, Environmental Protection Agency, Cincinnati, 2001.
50
[12] Interstate Technology and Regulatory Council, Perchlorate: overview of issues,
status, and remdial options, in, Interstate Technology and Regulatory Team,
Washington DC, 2005. http://itrcweb.org.
[13] P.K. Dasgupta, A.B. Kirk, J.V. Dyke, S. Ohira, Intake of iodine and perchlorate
and excretion in human milk, Environmental Science and Technology, 42 (2008)
8115-8121.
[14] A.B. Kirk, K. Martinelango, K. Tian, A. Dutta, E.E. Smith, P.K. Dasgupta,
Perchlorate and iodide in dairy and breast milk, Environmental Science and
Technology, 39 (2005).
[15] A.B. Kirk, E.E. Smith, K. Tian, T.A. Anderson, P.K. Dasgupta, Perchlorate in
milk, Environmental Engineering Science, 37 (2003).
[16] C.W. Murraya, S.K. Egana, H. Kima, N. Berua , P.M. Bolger, US food and drug
administration's total diet study: dietary intake of perchlorate and iodine, Journal of
Exposure Science and Environmental Epidemiology, 18 (2008) 571-580.
[17] E.N. Pearce, A.M. Leung, B.C. Blount, H.R. Bazrafshan, X. He, S. Pino, L.
Valentin-Blasini, L.E. Braverman, Breast milk iodine and perchlorate concentrations
in lactating boston-area women, Journal of Clinical Endocrinology & Metabolism, 92
(2007) 1673-1677.
[18] M.A. Greer, G. Goodman, R.C. Pleus, S.E. Greer, Health effects assessment for
environmental perchlorate contamination: the dose response for inhibition of
thyroidal radioiodine uptake in humans, Environmental Health Perspectives, 110
(2002) 927-937.
[19] R. Renner, EPA perchlorate decision flawed,say advisers, Environmental
Science and Technology, 43 (2009) 553-554.
[20] G.L. Ginsberg, D.B. Hattis, R.T. Zoeller, D.C. Rice, Evaluation of the U.S.
EPA/OSWER preliminary remediation goal for perchlorate in groundwater: focus on
exposure to nursing infants, Environmental Health Perspective, 115 (2006).
[21] R. Parette, F. Cannon, The removal of perchlorate from groundwater by
activated carbon tailored with cationic surfactants, Water Research, 39 (2005).
51
[22] R. Parette, Removing low ppb level perchlorate, RDX, and HMX from
groundwater with cetylrimethylammonium chloride (CTAC) pre-loaded activated
carbon Water Research, 39 (2005).
[23] B. Gu, G.M. Brown, C.-C. Chiang Treatment of perchlorate-contaminated
groundwater using highly selective, regenerable ion-exchange technology: a pilot
scale demonstration, Remediation Journal, 12 (2002).
[24] B. Gu, Y.-K. Ku, G.M. Brown, Sorption and desorption of perchlorate and U(VI)
by strong base anion exchange resin, Environmental Science and Technology, 39
(2005).
[25] B. Gu, W. Dong, G.M. Brown, D.R. Cole, Complete degradation of perchlorate
in ferric chloride and hydrochloric acid under controlled temperature and pressure,
Environmental Science and Technology, 37 (2003).
[26] K.C. Markis, D. Sarkar, R. Datta, Aluminum-based drinking-water treatment
residuals:a novel sorbent for perchlorate removal, Environmental Pollution, 140
(2006).
[27] J. Xu, Y. Song, B. Min, L. Steinberg, B.E. Logan, Microbial degradation of
perchlorate: principles and applications, Environmental Engineering Science 20
(2003) 405-422.
[28] J.D. Coates, U. Michaelidou, R.A. Bruce, S.M. O’Connor, J.N. Crespi, L.A.
Achenbach, Ubiquity and diversity of dissimilatory (per)chlorate-reducing bacteria,
Applied and Environmental Microbiology, 65 (1999) 5234-5241.
[29] B.C. Okeke, W.T. Frankenberger, Molecular analysis of a perchlorate reductase
from perchlorate-respiring bacterium Perc1ace, Microbiological Research, 158 (2003)
337-344.
[30] B.E. Logan, H.S. Zhang, P. Mulvaney, M.G. Milner, I.M. Head, R.F. Unz,
Kinetics of perchlorate- and chlorate-respiring bacteria, Applied and Environmental
Microbiology, 67 (2001) 2499-2506.
[31] R. Nerenberg, Y. Kawagoshi, B.E. Rittmann, Kinetics of a hydrogen-oxidizing,
perchlorate-reducing bacterium, Water Research, 40 (2006) 3290-3296.
[32] K. Kim, B.E. Logan, Microbial reduction of perchlorate in pure and mixed
culture packed-bed bioreactors, Water Research, 35 (2000) 3071-3076.
52
[33] A. Son, J. Lee, P.C. Chiu, B.J. Kim, D.K. Cha, Microbial reduction of
perchlorate with zero-valent iron, Water Research, 40 (2005) 2027-2032.
[34] X. Yu, C. Amrhein, M.A. Deshusses, Perchlorate reduction by autotrophic
bacteria attached to zerovalent iron in a flow-through reactor, Environmental
Engineering Science, 41 (2007) 990-997.
[35] A. Son, C.J. Schmidt, H. Shin, D.K. Cha, Microbial community analysis of
perchlorate-reducing cultures growing on zero-valent iron, Journal of Hazardous
Materials, 185 (2010) 669-676.
[36] A. Son, Microbial reduction of perchlorate with elemental Iron, in: PhD
dissertation, Department of Civil Engineering, University of Delaware, 2005.
[37] B.E. Logan, Analysis of overall perchlorate removal rates on packed bed
bioreactors, Journal of Environmental Engineering, 127 (2001) 469-471.
[38] T.P. Clement, B.S. Hooker, R.S. Skeen, Numerical modeling of biologically
reactive transport near nutrient injection well, Journal of Environmental Engineering-
ASCE, 122 (1996) 833-839.
[39] C.W. Fetter, Applied hydrogeology, fourth ed., Prentice Hall, 2001.
[40] Z. Xiong, D. Zhao, G. Pan, Rapid and complete destruction of perchlorate in
water and ion-exchange brine using stabilized zero-valent iron nanoparticles, Water
Research, 41 (2007) 3497-3505.
[41] J.D. Shrout, A.G.B. Williams, M.M. Scherer, G.F. Parkin, Inhibition of bacterial
perchlorate reduction by zero valent iron, Biodegradation, 16 (2005) 23-32.
[42] C. Wang, L. Lippincott, X. Meng, Kinetics of biological perchlorate reduction
and pH effect, Journal of Hazardous Materials, 153 (2008) 663-669.
[43] D. Wua, P. Hea, X. Xu, M. Zhoua, Z. Zhanga, Z. Houda, The effect of various
reaction parameters on bioremediation of perchlorate-contaminated water, Journal of
Hazardous Materials, 150 (2008) 419-423.
[44] N.R. Council, Use of reclaimed water and sludge in food crop production, EPA,
Washington D.C., 1996.
[45] G. Tchobanaglous, Wastewater engineering: treatment,disposal, and reuse,
McGraw Hill New York, 1991.
53
[46] C.P.L. Grady, G.T. Daigger, H.C. Lim, Biological wastewater treatment, second
ed., 1999.
[47] B.E. Rittmann, P.L. McCarty, Environmental biotechnology: principles and
applications, McGraw-Hill, Boston, 2001.
[48] J.T. Cookson, Removal of submicron particles in packed beds, Environmental
Science and Technology, 4 (1970) 128-134.
[49] E.T. Urbansky, Perchlorate in the environment, Klewer Academic, New York.
[50] B. Peyton, R. Skeen, B. Hooker, R. Lundman, A. Cunningham, Evaluation of
bacterial detachment rates in porous media, Applied Biochemistry and
Biotechnology, 51-52 (1995) 785-797.
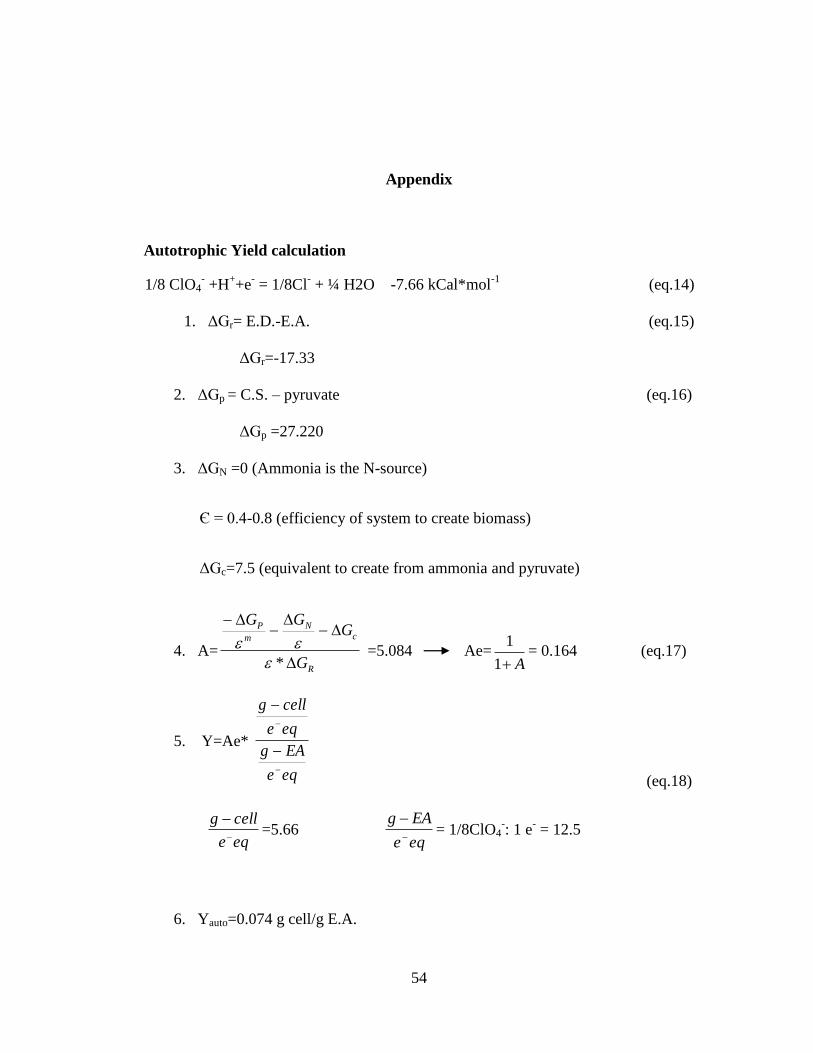
54
Appendix
Autotrophic Yield calculation
1/8 ClO4- +H
++e
- = 1/8Cl
- + ¼ H2O -7.66 kCal*mol
-1 (eq.14)
1. ΔGr= E.D.-E.A. (eq.15)
ΔGr=-17.33
2. ΔGp = C.S. – pyruvate (eq.16)
ΔGp =27.220
3. ΔGN =0 (Ammonia is the N-source)
Є = 0.4-0.8 (efficiency of system to create biomass)
ΔGc=7.5 (equivalent to create from ammonia and pyruvate)
4. A=R
cN
m
P
G
GGG
*
=5.084 Ae=
A1
1= 0.164 (eq.17)
5. Y=Ae*
eqe
EAg
eqe
cellg
(eq.18)
eqe
cellg
=5.66
eqe
EAg
= 1/8ClO4
-: 1 e
- = 12.5
6. Yauto=0.074 g cell/g E.A.
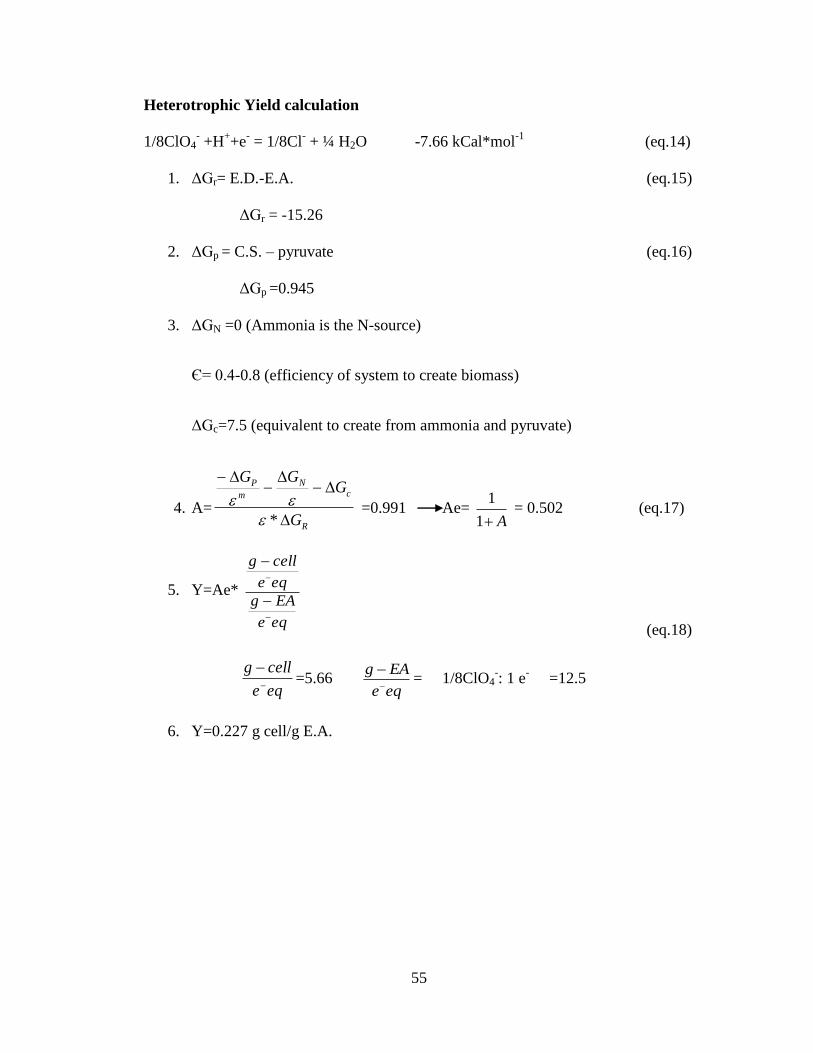
55
Heterotrophic Yield calculation
1/8ClO4- +H
++e
- = 1/8Cl
- + ¼ H2O -7.66 kCal*mol
-1 (eq.14)
1. ΔGr= E.D.-E.A. (eq.15)
ΔGr = -15.26
2. ΔGp = C.S. – pyruvate (eq.16)
ΔGp =0.945
3. ΔGN =0 (Ammonia is the N-source)
Є= 0.4-0.8 (efficiency of system to create biomass)
ΔGc=7.5 (equivalent to create from ammonia and pyruvate)
4. A=R
cN
m
P
G
GGG
*
=0.991 Ae=
A1
1 = 0.502 (eq.17)
5. Y=Ae*
eqe
EAg
eqe
cellg
(eq.18)
eqe
cellg
=5.66
eqe
EAg
= 1/8ClO4
-: 1 e
- =12.5
6. Y=0.227 g cell/g E.A.