Embed Size (px)
Citation preview

©2006 Fisher-Rosemount Systems, Inc.Slide 4 - 1
Process Control Process Characterization
Process Process CharacterizationCharacterization

©2006 Fisher-Rosemount Systems, Inc.Slide 4 - 2
Process Control Process Characterization
Plant Process FlowPlant Process FlowPlant Process FlowA plant may be thought of as being made up of a series of processes. A good understanding of these processes is required to design a control system for the plant.In an existing installation, the plant operators can be a valuable source of information.Existing controls and measurements are identified on the piping and instrumentation (P&ID)diagram for the area.
Plant Feed
De-Ethanizer1.00F
.88FDe-Propanizer
De-Iso-Butanizer
.12FEthan
.20FPropane
.22Fi-Butane
De-Butanizer
.30Fn-Butane
.16FNatural Gasoline

©2006 Fisher-Rosemount Systems, Inc.Slide 4 - 3
Process Control Process Characterization
De-isobutanizer Process DetailDeDe--isobutanizer Process Detailisobutanizer Process Detail
Distillate Receiver
DIB
52% Plant Feed 1.00F
.42F
0.58F
iC4
nC4

©2006 Fisher-Rosemount Systems, Inc.Slide 4 - 4
Process Control Process Characterization
Process DefinitionProcess DefinitionProcess DefinitionA process is an arbitrary equipment configuration which acts on inputs to produce outputs.
Process
Manipulated
Disturbance
Other
Controlled
Constraint
Other

©2006 Fisher-Rosemount Systems, Inc.Slide 4 - 5
Process Control Process Characterization
Process TerminologyProcess TerminologyProcess TerminologyThe following terms will be used in referencing process inputs and outputs.– Controlled - process output which is to be maintained
at a desired value by adjustment of a process input.
– Setpoint – The value at which the controlled parameter is to be maintained.
– Manipulated - process input which is adjusted to maintain the controlled output at setpoint.
– Disturbance - a process input (other than the manipulated parameter) which effects the controlled parameter.
– Constraint - process output which must be maintain within an operating range

©2006 Fisher-Rosemount Systems, Inc.Slide 4 - 6
Process Control Process Characterization
Process Example – Flow in PipeProcess Example Process Example –– Flow in PipeFlow in Pipe
Flow Process
Valve Position (Manipulated)
Upstream Pressure (Load Disturbance)
Flow (Controlled)
Downstream Pressure
FT

©2006 Fisher-Rosemount Systems, Inc.Slide 4 - 7
Process Control Process Characterization
Flow Process – Response to Input Change Flow Process Flow Process –– Response to Input Change Response to Input Change
Flow
Valve Position
Upstream Pressure

©2006 Fisher-Rosemount Systems, Inc.Slide 4 - 8
Process Control Process Characterization
Lime Mud Filter Process
Inlet Density(Disturbance)
Pump Speed (Manipulated)
Inlet Temperature(Other)
Flow to Washer(Controlled)
Vat Level(Constraint)
Outlet Density(Other)
Process Example - Lime Mud FilterProcess Example Process Example -- Lime Mud FilterLime Mud Filter
DTSC
LT
FT

©2006 Fisher-Rosemount Systems, Inc.Slide 4 - 9
Process Control Process Characterization
Pump Speed
Inlet Density
Vat Level
Flow to Vat
Lime Filter – Response to Input ChangeLime Filter Lime Filter –– Response to Input ChangeResponse to Input Change

©2006 Fisher-Rosemount Systems, Inc.Slide 4 - 10
Process Control Process Characterization
Characterizing Process Gain and Dynamic ResponseCharacterizing Process Gain and Dynamic Characterizing Process Gain and Dynamic ResponseResponse
The dynamic response and gain of a process may be described in terms of how a process output response to a step change in a process input
All other process inputs should be maintained at a constant value during this test i.e. so they have no impact of the output of interest.
In an operating plant, it may be necessary to repeat the step test to get consistent results since not all inputs to the process can be maintained constant and often process noise is present

©2006 Fisher-Rosemount Systems, Inc.Slide 4 - 11
Process Control Process Characterization
Time
O1
O2
I1
I2
Process Gain = O2 - O1
I2 - I1
T1
Input
Output
Pure Gain Process Pure Gain Process Pure Gain Process When the process output tracks the process input except for a change in signal amplitude, the process is known as a pure gain.
The change in signal amplitude is determined by the process gain.
For a step change in process input, the process gain is defined as the change in the process output divided by the change in process input
Note: Output and Input in % of scale

©2006 Fisher-Rosemount Systems, Inc.Slide 4 - 12
Process Control Process Characterization
Example – Pure Gain ProcessExample Example –– Pure Gain ProcessPure Gain Process
From Load Control
To Fuel “Valve”
To Air “Valve”
An example of a pure gain process is the jack shaft used in some boiler combustion control systems.
Gain is determine by the length of the lever arms attached to the jack shaft.

©2006 Fisher-Rosemount Systems, Inc.Slide 4 - 13
Process Control Process Characterization
Pure Delay ProcessPure Delay ProcessPure Delay ProcessWhen the process output tracks the process input except for a delay in the output signal, the process is know as a pure delay process.
For a step change in the process input, process deadtime is defined as the time from the input changing until the first affect of the change is seen in the process output.
Time
O1
O2
I1
I2
Gain = O2 - O1
I2 - I1
T1 T2
Input
Output
Dead Time = T2 - T1
Note: Output and Input in % of scale

©2006 Fisher-Rosemount Systems, Inc.Slide 4 - 14
Process Control Process Characterization
Example – Pure Delay ProcessExample Example –– Pure Delay ProcessPure Delay Process
Belt
Example of pure delay processes are a conveyor belt and a pipeline.
Delay is the result of transport time and will vary with the speed of the belt or the flow rate through the pipe.
DT 32
SC 12 FY
12
Pipeline

©2006 Fisher-Rosemount Systems, Inc.Slide 4 - 15
Process Control Process Characterization
Scanner for Paper Properties Final Product
Paper Machine ExamplePaper Machine ExamplePaper Machine Example

©2006 Fisher-Rosemount Systems, Inc.Slide 4 - 16
Process Control Process Characterization
AT
Basis Weight
Basis Weight Valve
Example - Paper Machine Basis WeightExample Example -- Paper Machine Basis WeightPaper Machine Basis Weight
Long transport delay
©2006 Fisher-Rosemount Systems, Inc.Slide 4 - 17
Process Control Process Characterization
Time
O1
O2
I1
I2
Gain = O2 - O1
I2 - I1
T2
Time Constant ( Τ ) = T3 - T2
Input
Output63.2% (O2 - O1)
T3
Pure Lag (First Order ) Process Pure Lag (First Order ) Process When the rate at which the process output changes is proportional to the difference between the current output and the final values associated with the current input, the process is know as pure lag (or first order) process.
For a step change in process input, the time required for the output to reach 63% of its final change in value is know as the process time constant.
Note: Output and Input in % of scale
©2006 Fisher-Rosemount Systems, Inc.Slide 4 - 18
Process Control Process Characterization
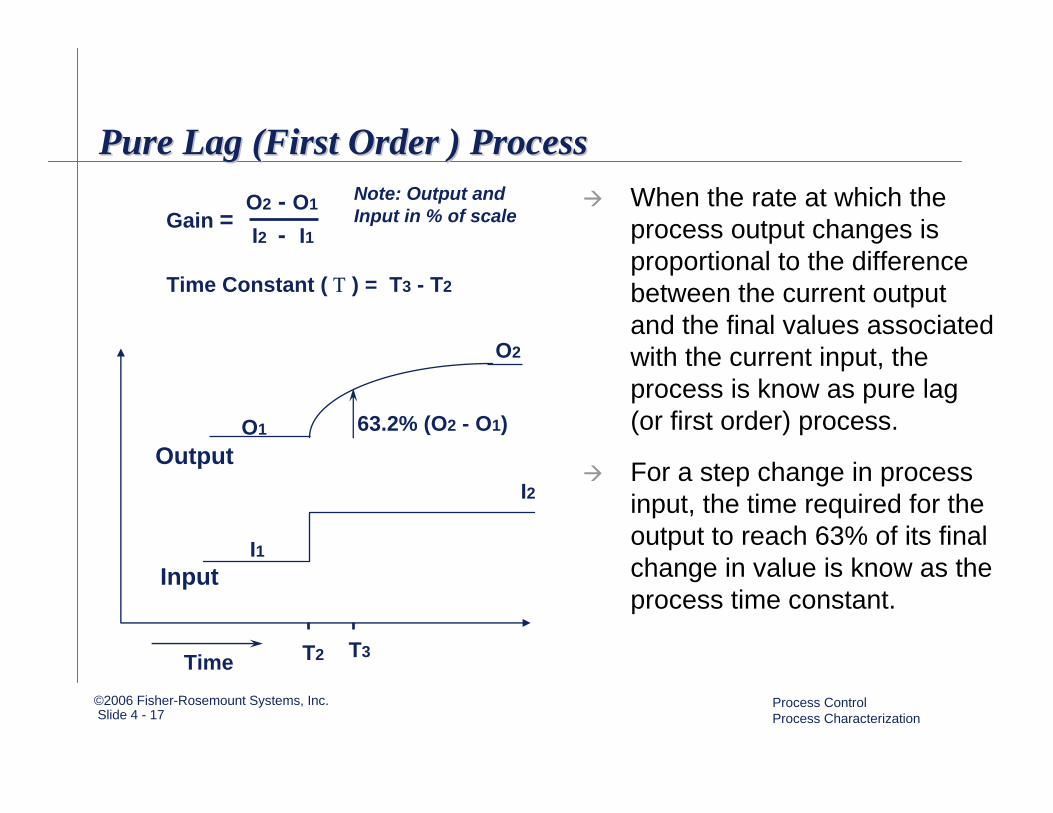
Example – Pure Lag ProcessExample Example –– Pure Lag ProcessPure Lag ProcessAn example of a pure lag process is a tank with outlet flow determined by tank level and the outlet flow restriction caused by the orifice.The level will settle at a value which results in an outlet flow that matches the inlet flow.
Orifice
LT 33

©2006 Fisher-Rosemount Systems, Inc.Slide 4 - 19
Process Control Process CharacterizationTime
O1
O2
I1
I2
T1 T2
Input
Output63.2% (O2 - O1)
T3
Gain = O2 - O1
I2 - I1
Time Constant ( Τ ) = T3 - T2
Dead Time = T2 - T1
First Order Plus Deadtime ProcessFirst Order Plus Deadtime ProcessMost process in industry may be approximated as first order plus deadtime processes.
A first order plus deadtime process exhibits the combined characteristics of the lag and delay process.
Note: Output and Input in % of scale

©2006 Fisher-Rosemount Systems, Inc.Slide 4 - 20
Process Control Process Characterization
An example of a first order plus deadtime process is a steam heater.
The process lag is caused by the heating process
The process deadtime is caused by transport delay
Example Example -- First Order Plus Deadtime ProcessFirst Order Plus Deadtime Process
TT 12
Feed
Steam

©2006 Fisher-Rosemount Systems, Inc.Slide 4 - 21
Process Control Process Characterization
Addressing Higher Order SystemsAddressing Higher Order SystemsAddressing Higher Order SystemsThe dynamic response of a process is the results of many components working together e.g. I/P, Valve actuator, heat or fluid/gas transport, etc.
The net process response of these higher order systems can be approximated as first order plus deadtime.
LT 33
3th order system made up of 3 non-interacting lags

©2006 Fisher-Rosemount Systems, Inc.Slide 4 - 22
Process Control Process Characterization
Higher Order Systems (Cont)Higher Order Systems (Cont)Higher Order Systems (Cont)100
00 10 20 30 40 50
Number of Lags …. 1 Lag Time (Sec) ………..10
100
00 10 20 30 40 50
Number of Lags …. 2 Lag Time (Sec) ………..10
100
00 10 20 30 40 50
Number of Lags …. 3 Lag Time (Sec) ………..10

©2006 Fisher-Rosemount Systems, Inc.Slide 4 - 23
Process Control Process Characterization
Integrating (NonIntegrating (Non--SelfSelf--Regulating) ProcessRegulating) ProcessWhen a process output changes without bound when the process input is changed by a step, the process is know as a non-self-regulating process.
The rate of change (slope) of the process output is proportional to the change in the process input and is known as the integrating gain.
Time
O1O2
I1
I2
T1 T2
Input
Output
T3
Integrating Gain = O2 - O1
(I2 - I1 ) * (T3 – T2)
Dead Time = T2 - T1
Note: Output and Input in % of scale, Time is in seconds

©2006 Fisher-Rosemount Systems, Inc.Slide 4 - 24
Process Control Process Characterization
Example - Integrating (Non-Self Regulating) ProcessExample Example -- Integrating (NonIntegrating (Non--Self Regulating) ProcessSelf Regulating) Process
An example of a non-self-regulating process is tank level where outlet flow is established by a gear pump.
If the inlet flow does not match the outlet flow, then level will continue to change until the tank overflows or runs dry.
Gear Pump
LT 33

©2006 Fisher-Rosemount Systems, Inc.Slide 4 - 25
Process Control Process Characterization
Time
O1
I1
I2
Input
Output
Inverse Response ProcessInverse Response ProcessInverse Response ProcessFor a few processes, the initial change in the process output to a step change in a process input will be in the opposite direction of the final output change.
Processes exhibiting this characteristic are said to have an inverse response.

©2006 Fisher-Rosemount Systems, Inc.Slide 4 - 26
Process Control Process Characterization
Example – Process with Inverse ResponseExample Example –– Process with Inverse ResponseProcess with Inverse Response
The level of a vertical thermosiphon reboiler in a distillation column may exhibit an inverse response to a rapid increase in heat input.
The size or direction of the change in heat input may determine if an inverse response is obtained.
LT 32
Heating Fluid

©2006 Fisher-Rosemount Systems, Inc.Slide 4 - 27
Process Control Process Characterization
Process Input Process Output
A B
C D
A + C B + D
Linear /Non-Linear ResponseLinear /NonLinear /Non--Linear ResponseLinear ResponseIf the process output response depends on the amplitude of the process input then it is said to be non-linear. Thus, a process is said to be linear if it meets the following condition:
Saturation of the final control element (valve fully open or closed) is one cause of process Non-linearity.

©2006 Fisher-Rosemount Systems, Inc.Slide 4 - 28
Process Control Process Characterization
Process Non-linearityProcess NonProcess Non--linearitylinearityMost processes may be approximated as linear over a small operating range. However, over a wide range of operation, processes may exhibit some non-linearity.
A common cause of non-linearity is a change in process gain – reflecting the installed characteristics of the final control element i.e. valve acting with the other equipment making up the process, as illustrated in this example.
7000
6000
5000
4000
3000
2000
0
Gas
Flo
w (S
CFH
)
0 20 40 60 80 100
Valve Position (%)
Dryer #1

©2006 Fisher-Rosemount Systems, Inc.Slide 4 - 29
Process Control Process Characterization
Typical Control LoopTypical Control LoopTypical Control Loop

©2006 Fisher-Rosemount Systems, Inc.Slide 4 - 30
Process Control Process Characterization
Simulated Process for Workshop ExercisesSimulated Process for Workshop ExercisesSimulated Process for Workshop Exercises

©2006 Fisher-Rosemount Systems, Inc.Slide 4 - 31
Process Control Process Characterization
Process Identification WorkshopProcess Identification WorkshopProcess Identification WorkshopThis workshop you will perform the following:
Step 1. From Control Studio, open EXAMPLE_A module and go to on-line operation. Determine the process gain, deadtime and lag by making a step change; e.g., 40=>50 in the SP parameter of the AO block and observeresponse on trend. To change the SP parameter, the MODE parameter must be set to Auto. Repeat this test to see if you get the same results
Question: Based on your observation, how would you classify this process?
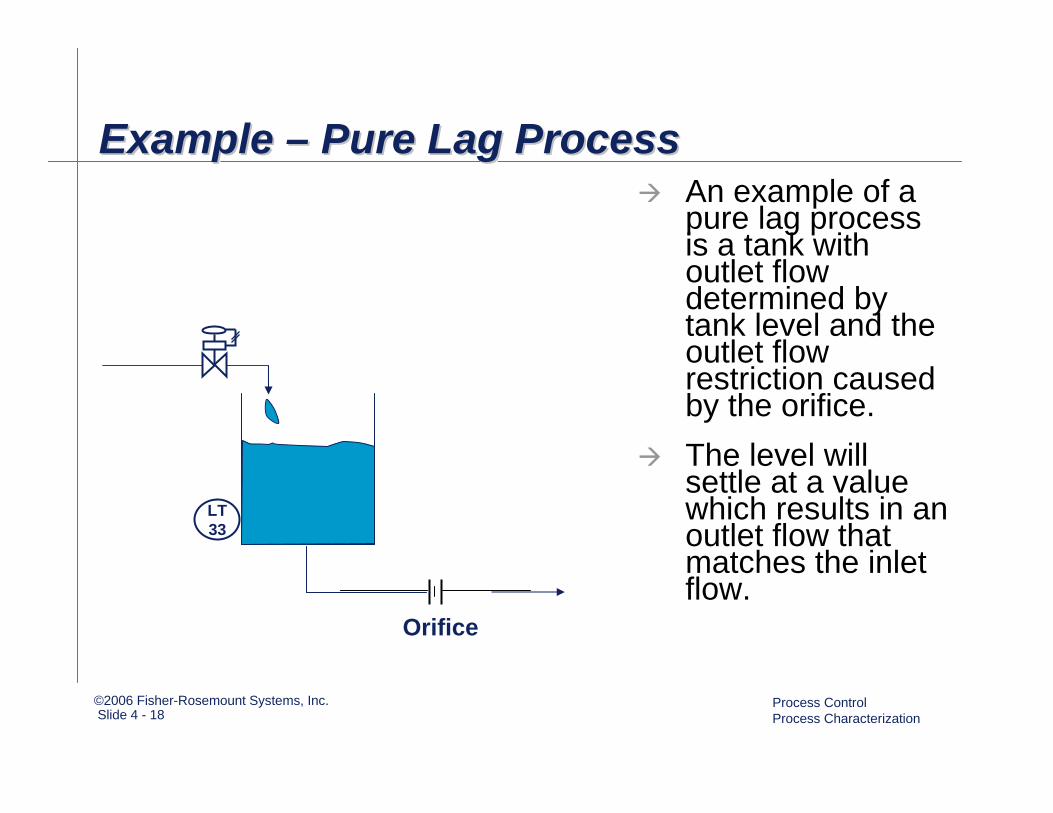
Step 2. Open EXAMPLE_B module and go to on-line operation. Make a step change in the SP of the AO block and observe the process response
Question: Based on your observation, how would you classify this process?
Step 3. Open EXAMPLE_C module and go to on-line operation. With the disturbance set to 40, adjust the valve to 50 and record you observation. Once the process output (LEVEL_MEAS) is above 60%, change the AO Setpoint to 40 and observe the process output. Change the process disturbance from a value of 40 and observe the process response.
Question: Based on your observations, how would you classify this process?

©2006 Fisher-Rosemount Systems, Inc.Slide 4 - 32
Process Control Process Characterization
EXAMPLE_AEXAMPLE_AEXAMPLE_A
©2006 Fisher-Rosemount Systems, Inc.Slide 4 - 33
Process Control Process Characterization
EXAMPLE_BEXAMPLE_BEXAMPLE_B

©2006 Fisher-Rosemount Systems, Inc.Slide 4 - 34
Process Control Process Characterization
EXAMPLE_CEXAMPLE_CEXAMPLE_C