Embed Size (px)
Citation preview

1 The analyst draws the two red slit-tears in the video frame
2 Timeline is updated to show what happensunder each tear for every frame in the video
3 The current frame being shown is indicatedby the red slit
1
11
2 3
1 The analyst draws the two red slit-tears in the video frame
2 Timeline is updated to show what happensunder each tear for every frame in the video
3 The current frame being shown is indicatedby the red slit
1
11
2 3
Figure 1. The timeline visualization shows cars as they pass through the intersection. The direction of the sloped
streaks in the timeline indicates the direction the cars passed through the first slit-tear, while the second slit-
tear shows us exactly which car created that streak.
Uncovering Activity and Patterns in Video using Slit-Tear Visualizations
Anthony Tang1, Joel Lanir2, Saul Greenberg3 and Sidney Fels1
1Human Communication Technologies Lab2Department of Computer Science
University of British Columbiahct.ece.ubc.ca
{tonyt@ece, yoel@cs, ssfels@ece}.ubc.ca
3Department of Computer ScienceUniversity of Calgary
grouplab.cpsc.ucalgary.ca
ABSTRACTIn prior work, we introduced a visualization technique for analyzing fixed position video streams called slit-tear visualizations. This technique supports exploratory data analysis by interactively generating views about the video stream that can provide insight into the spatial/temporal relationships of the entities contained within. These insights are necessarily grounded in context of the specific video being analyzed, and in this paper, we provide a general typology of the kinds of slit-tears an analyst may use. Further, we discuss the kinds of analytic primitives that often signal relevant events given these slit-tear types. The work is relevant to human-centered computing because the technique provides the most insight in the presence of human interpretation.
Categories and Subject DescriptorsH.5.1 [Multimedia Information Systems]: Video. H.5.2 [User Interfaces]: Graphical user interfaces, User-centered design.
General TermsAlgorithms, Design, Human Factors
Keywordsvideo analysis, exploratory data analysis, information visualization, video history
1. INTRODUCTIONA common first step in analyzing data is to explore the data [9]. This step involves examining the data in a raw or semi-raw form, iteratively forming and testing provisional hypotheses with the data. Often, this human-driven exploration process necessitates tools that generate useful and meaningful views of the data that can provide insight. To support this exploration process for video-based data, we designed a visualization technique called slit-tears, which allows users to easily generate and view composite timelines of video data based on a simple pixel-space interpretation of video frames [10]. In this paper,
we expand this earlier work by showing how the technique can provide insight into the underlying data set in a variety of applications.
Many video feeds are shot with still cameras (i.e. cameras that are fixed). Examples include surveillance cameras, traffic cameras and monitoring cameras. In an HCI context, where researchers study people’s interactions with technology and one another, fixed cameras are often used to capture these exchanges for later review (e.g. [5][8]). Figure 1 illustrates the slit-tear visualization technique, which allows an analyst to rapidly review and explore this fixed-camera video data. An analyst begins by specifying a set of pixel paths on a frame in the video. These pixels are vertically realigned, and then the contents of those pixels are replicated for each frame in the video. The resulting timeline can be scrubbed, playing back the video (as with most non-linear video editors), allowing the analyst to view and understand what has happened under that tear over the video.
The timeline view generated from the slit-tear can provide insight that might otherwise be hidden in the data. Yet, the insight provided by this timeline is abstract, and needs to be interpreted by a human analyst that understands the source video and knows the placement of the tears. Thus, the slit-tear technique only provides views of the video data—the interpretation of that view remains up to the human. In a sense, this technique focuses a human analyst’s attention on a finite set of pixels in the scene (rather than on all of the video data), thereby computationally augmenting the human faculty for interpreting visual data.

In this paper, we reflect on our own use of the slit-tear technique for exploratory data analysis, articulating a typology of slit-tear types, and a set of analytic primitives that arise in the slit-tear timeline. This typology and the analytic primitives provide analysts with a way of thinking about how slit-tears can be used in analyzing their own video data. We illustrate this typology and analytic primitives using a set of three different types of video data: an overhead view of tabletop collaboration, a fixed view of users making use of a whiteboard, and an oblique view of a mall parking lot.
While this tool is inherently interesting, we see it as an example of tools that can help analysts by providing novel insight into underlying data. It does so by focusing the analyst’s attention to particular areas of interest with a simple interface. More generally, we believe that to support the data exploration process, tools need to be designed with an understanding of the types of hypotheses people will have about the underlying data, and to support the rapid exploration and testing of these hypotheses. The data exploration process is ultimately human-driven, and tools to support this process need to be designed from ground up to support analysts.
2. RELATED WORKThe core problem facing a video analyst is that the video data is three dimensional: objects and images in the scene are presented in two-dimensional space, yet the sequential video frames add the extra third dimension (e.g. [3], [4]). The problem is that the computer screen (or user’s view into the viewing space) is ultimately two-dimensional. Researchers have primarily addressed this problem with two approaches: using computers to do the analysis, or transforming the video data space into two dimensions so that humans can easily interpret it without traversing the entire video.
Computationally-based approaches are algorithmically based, and deterministic. Examples include drawing “representative frames” from video data to represent the video [12], or shot/scene detection algorithms that are able to detect scene changes in a video (e.g. [1], [6]). Similarly, simple computer vision systems can detect changes in regions, and automatically notate those changes in a timeline. The strength of these approaches is that there is an objective ground truth; thus, the algorithms can be evaluated on their “correctness” in detecting various phenomena, and thereby iteratively improved. The primary drawback of these types of approaches is that the algorithms do not typically allow the user to perform much customization. Our intent here is to support exploration of video, and these automated techniques in general do not allow the user to flexibly investigate and test all the hypotheses about the video data that may arise.
Transforming the data into a readable two-dimensional view is typically supported in non-linear video editors as a timeline. The timeline scrubber can be used to play back the video frames at arbitrary speed, and the time dimension is represented in a separate track from the video altogether.
Some work has considered how to realize the video-cube interpretation of video data, and to facilitate interaction with the video cube [3]. In some work (e.g. [4]), planar cuts are allowed; in other work, these cuts can be other geometric shapes (such as waves and ripples in [1]). While this body of work has been
artistically compelling, it can still be challenging to navigate three dimension cubes in the context of a two-dimensional screen; furthermore, it is difficult to assess the utility of these techniques for real video analysis.
The slit-tear technique originated from video slicing, which is a variant of the slit-scanning technique found in traditional photography. In video-slicing [7], a vertical scan-line of the video is appended to a timeline. The timeline can be used to scrub through the original video, and the scan-line can be similarly moved to see changes in the timeline. This transformation of the video data produces views of data that immediately make salient patterns of movement and entities in the video that would otherwise be difficult to spot. It is upon this approach that the slit-tear visualization technique was built.
3. SLIT-TEAR VISUALIZATION TECHNIQUEThe slit-tears technique builds on the basic video slicing approach by allowing the scan-line to be arbitrarily shaped and positioned. These arbitrarily-shaped scan-lines are called slit-tears. Users can generate an arbitrary number of these slit-tears, which may be straight lines, curves, a scribble, or even a few pixels. The video pixels under these tears are then replicated for each frame of the video, and placed on a timeline. As we illustrated in prior work [10], depending on how these tears are placed, they can accentuate motion and small changes, show directional movement, and also allow users to make predictions about related events in the video.
The prototypes allow multiple slits created on the same video, compositing the visualizations in the same timeline. Creation of the tears themselves is straightforward, and akin to the use of most bitmap editing utilities. The technique can also be applied to live video.
4. USING SLIT TEARS FOR EXPLORATORY VISUAL ANALYSISSlit-tears is a powerful visualization technique that can reveal events or patterns of activity that may otherwise be difficult to see, or require close study of video data. In this section, we first describe three classes of slit-tears which are used to detect different types of events. We then describe several basic analytic primitives associated with each tear type. The relationship between these slit-tear types and analytic primitives is illustrated in Figure 2.
Lasting incident
Eclipse incidentMonitoring tears
Bent path
Straight pathPath tears
Recurring incident
Transient incident
Absence of changeIntrusion tearsVisual exampleAnalytic primitiveSlit-tear type
Lasting incident
Eclipse incidentMonitoring tears
Bent path
Straight pathPath tears
Recurring incident
Transient incident
Absence of changeIntrusion tearsVisual exampleAnalytic primitiveSlit-tear type
Figure 2. The three types of slit-tears are associated with different analytic primitives, which are often indicative of an
interesting event.
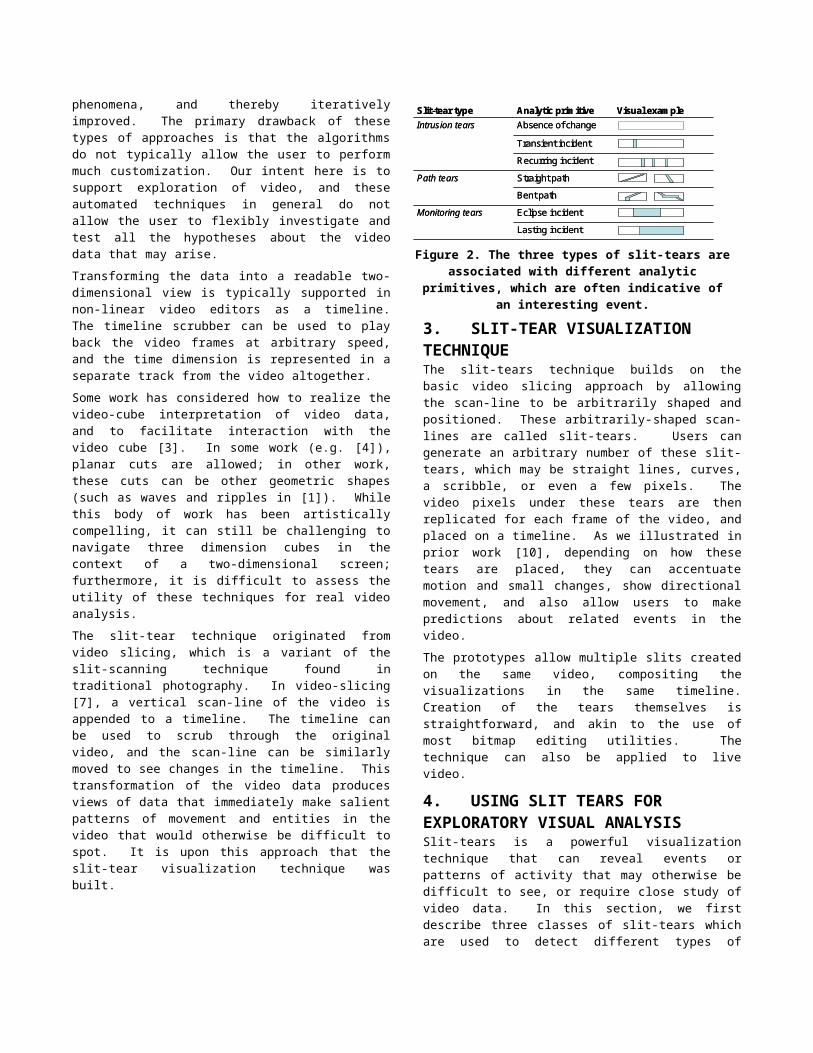
4.1 Slit-tear TypologyWe describe three classes of slit-tears which can be used for different types of analysis. These are examples of the different types of explorations an analyst might engage in with slit tears.
Intrusion tears are slit-tears that are used to detect entities whose motion paths are incident against the slit-tear: they are drawn in such a way to detect when entities pass through the tear. In this sense, they are useful for capturing temporally brief incidents, and drawing attention to them by virtue of an interruption in the timeline. They are also useful for counting recurring events that pass through the tear.
Path tears are slit-tears that follow entity motion paths: these slit-tears are useful for understanding the movement of entities on commonly traveled paths. They are useful for studying and comparing the motion of entities traveling along the same path, and can be used to infer intent, direction, and speed.
Monitoring tears are slit-tears that are used to detect changes in state (on the basis of colour). They are similar to intrusion tears, but whereas intrusion tears detect brief events, monitoring tears are typically used more for studying long-term changes in the tear.
A given slit-tear may play several different roles at once: the classification of a slit-tear into one of these three types is dependent on the particular objects under study. For instance, the slit-tear illustrated in Figure 11 behaves as a monitor-tear for vehicles, but as an intrusion tear for pedestrians. Nevertheless, the same patterns seem to appear across many video domains.
4.2 Analytic PrimitivesAnalytic primitives are simple color or spatial patterns that may be indicative of interesting events in the video scene. The primitives appear in the timeline visualization with one of three different types of slit-tears described in section 4.1. We call these patterns “primitives” because they have a standard basic interpretation, and have found that they are the common result of well-placed slit-tears in the video scene. Even so, they are meaningless without context and human interpretation. As stated at the outset: although the visualization can provide insight (by providing a view of time in the scene), the colour patterns are meaningless without an understanding of the underlying video scene and the location of the slit tears.
Three types of analytic primitives are common with intrusion type of slit-tear: absence of change, transient incident, and recurring incident. Absence of change merely indicates that nothing crossed the intrusion tear. Transient incident refers to intrusions that are brief, and often one-time. Recurring incident typically indicates that the intrusion tear separates two areas that objects commonly move between.
For path tears, the straight path occurs when an entity passes along the path tear. The slope of this tear indicates the speed at which the entity was traveling (steeper slopes indicate that the entity was traveling more rapidly), while the direction of the tear indicates which direction the entity passed along the tear. Bent paths indicate that either an entity entered partway through the tear (i.e. that the tear does not fully capture the entity’s path), or that that the entity paused partway through the tear.
Monitoring tears have two main types of primitives: an eclipse incident simply refers to something happening in the tear that
changes for a time, and then goes back to its original state. A lasting incident is similar, except that the changes seem more permanent. In general, monitoring tears do not necessarily accord to any regular pattern; instead, the timeline produced by these tears often appear as splotches—generally, interpreting them can only be done within the context of the video itself.
5. EXAMPLE VIDEO DOMAINSIn this section, we consider three different video domains to illustrate how the primitives described earlier provide insight to the analysis. We show how the same core analytic primitives appear, but that they carry different meanings in each of these contexts. We focus on three specific domains here because they each have unique characteristics.
Tabletop: The camera is placed directly above the tabletop surface where collaborators are working on an information analysis task. The camera here is able to capture collaborators interactions with data items placed on the tabletop, their interactions with one another, as well as provide an understanding of how tabletop space is partitioned and managed. This video scene is drawn from a study about collaborative information analysis [5], and shows collaborators working with cards containing data charts. Their task is to answer questions about the underlying data, and each question is non-trivial (i.e. often requiring the examination of several different data cards to answer correctly). Each collaborator has a complete set of data cards, but in many cases, one or more of the collaborators is unfamiliar with the type of chart on the card.
Whiteboard: A camera positioned in front of a whiteboard is able to capture passersby, onlookers and collaborators. Here, we are interested in human entities, and their relationships with the whiteboard and with one another. In this video scene, we capture casual passersby, as well as individuals who stop and study the whiteboard content. We also study the interactions of two collaborators as they work on a planning exercise with each other.
Parking Lot: A camera is positioned on the top floor of a building, and pointed obliquely toward two different parking lots. This position affords the opportunity to study driver and pedestrian behaviour in an enclosed space. This scene captures two parking lot areas: one of a strip mall, and one of a grocery store attached to a different strip mall. The scene was shot around noon on a weekday, and the parking lot was moderately busy.
In each of the following figures, the top rectangle is the timeline generated from the slit-tear. The red lines in the timeline index a frame, which is shown immediately below the timeline. The slit tear is visible in these frames as red strokes.
5.1 Tabletop Collaboration: Exploring Work PracticesIn these examples, the slit-tears placed in the scene allow us to test our assumptions about territoriality—or how space is shared amongst collaborators in a collaborative tabletop scenario. We are also able to clearly differentiate between different collaborators in their use of the tabletop space during the task.
Territoriality: Many researchers have suggested that when collaborators work around tabletops, they manage and divide up the tabletop space as a resource (e.g. [8], [5]). A cursory

examination of the frame in Figure 3 suggests that space is not always divided evenly among collaborators. Even so, the intrusion tear in Figure 3, showing the absence of change, suggests that these boundaries are reasonably maintained during collaboration. The brief intrusion in the tear—a transient incident—actually indexes to a moment where one collaborator was teaching the other how to interpret the chart.

Figure 4. A participant moves a data card from the storage territory into his personal working territory, works with it for a while, and then replaces it in the storage territory.
Figure 5. Two monitoring tears allow us to see that the collaborator on the right uses the tabletop space very differently from the collaborator along the bottom of the table.
Figure 3. This intrusion tear shows that personal territories are well-maintained, and rarely encroached upon. In fact, the only time it is breached is when one collaborator (on the right), helps the collaborator on the bottom of the scene.

Figure 4 further illustrates how a participant makes use of a storage territory. A non-linear intrusion tear allows us to see when a participant moves media from the storage territory into his personal, working territory.
Working style: Figure 5 shows that similarly placed monitoring tears in front of each collaborator produces vastly different timeline visualizations. These different visualizations really emphasize how differently the two individuals worked on the tasks. While one individual made use of copious amounts of tabletop space throughout the entire task, the other individual held all of his cards in his hands, never making use of the tabletop.
5.2 Around the Whiteboard: Making Transient Behaviour SalientIn some cases, we may be interested in monitoring artifacts deployed in the real world, such as a common whiteboard. In these examples, we show how using path tears, we can differentiate between people passing in front of the whiteboard, and those who spend more time understanding and interacting with the whiteboard. These path tears also provide insight when we study particular case of a collaborating pair—we can see when they are working closely, when they trade sides, and when they leave. Finally, in this case, we can place a monitor tear, and see when collaborators are engaging in face-to-face dialogue where they are making eye contact.
Transient interaction: We are often interested in those that are merely passing in front of a large digital display, as we may be interested in whether these passersby are actively studying the display (in this case a whiteboard), or simply passing by. Figure 6 shows how a path tear can make the transience of a passerby salient. The straight paths indicate that passersby merely walked by the display without glancing at its contents. In contrast, the bent paths show when individuals stop and study the whiteboard. The direction of the slope also indicates the direction that the passersby were going, which may be interesting in cases where traffic is asymmetric.
Whiteboard collaboration: A monitoring tear across the scene shows different patterns of interaction in front of the
whiteboard. Figure 7 shows that the collaborators, for the most part, interact with their “side” of the whiteboard, only occasionally reaching to the other side. It also shows the moment where the collaborators switch sides, and then one leaves.
Eye-contact: A monitoring tear between the heads of the collaborators can give the analyst a rough idea of when the collaborators are engaged in eye-contact. Figure 8 shows colour patterns for the collaborators’ heads. When we see skin-tones pointing toward the middle of the timeline visualization, this is suggestive that the collaborators are making eye contact with one another. While this particular tear may not be generalizable to all other contexts, the slit-tear mechanism allows us to see transient behaviour that might otherwise be difficult to detect.
5.3 Parking Lot: Studying Patterns of Pedestrian and Vehicular TrafficParking lots are fundamentally different from the prior two video domains because the moving entities inside parking lots have fairly regular patterns/paths: both pedestrians and vehicles move predictably along the aisle, turning into empty spots, etc. With such a predictable pattern of vehicle movement, it is easy to spot irregularities as well as compare different regions of the scene. For instance, we can discover which aisle cars move the most quickly, which areas the most build-up of traffic occurs, as well as monitoring and discovering cars as they arrive and leave.
Busiest lanes: Figure 9 shows how we can set up a long intrusion tear, allowing us to see the recurring incidents of cars passing through the tears. Such a timeline allows us to count the number of cars that pass through the various tears, thereby allowing us to see which lanes are the busiest based on the number of cars that passes through.
Detecting parking cars: Path or monitor tears allow us to see when cars are simply “cruising the lane”, and when they are parking (Figure 10). Placing a path tear on the lane itself, straight paths represent cars that pass right through the entire lane. In contrast, the bent paths represent cars either parking, or coming out of their parking spot. Similarly, the monitor path along the top of the parked cars allows us to immediately see
Figure 6. This path tear on the whiteboard is capable of differentiating between when a user passes by the whiteboard, and when he stops and reads/modifies its contents.

when a parking spot has been vacated or taken (by virtue of colour change).

Figure 8. This slit-tear allows us to see when the collaborators make eye contact by virtue of showing us when they are facing each other. We can tell because the bottom side of the top path becomes skin coloured when the man on the left looks at his
collaborator, and the top side of the bottom path becomes skin coloured when the man on the right does so.
Figure 7. This monitor tear shows us, by virtue of the pattern of colours, that the two collaborators essentially stay on “their side” of the whiteboard, and only switch sides toward the end of their interaction.

Figure 11 shows how we can use monitor tears on a single parking spot, showing how both cars and pedestrians will often use these breaks in the lanes to take a shortcut. This is especially common for pedestrians, as they seem to have a preference for walking through empty parking spots rather than weave their way carefully between parked cars. Further, it is possible to use these monitor tears to understand how long it takes before a parking spot is taken (one would expect closer parking spots to not last as long), and when a car leaves altogether.
5.4 SummaryThese three domains of study demonstrate that while the analytic primitives remain the same, what they mean must be interpreted within the context of the source video. Even though the resulting primitive may appear to be the same in two different scenes, they can mean completely different things. The slit-tear visualization technique is therefore just an
exploratory technique that helps an analyst better understand his/her source data.
6. DISCUSSIONThe core contribution of this paper is the typology of slit-tears and the notion of analytic primitives. Together, these concepts provide analysts with a way of thinking about analyzing fixed-view video, and ideas about what to look for in the timeline visualization, since the primitives are often indicative of something interesting. What should be clear, however, is that the typology of slit-tears is highly dependent on an understanding of the underlying video scene—an interpretation that only a human can provide. Thus the technique is, by nature, suited for exploratory analysis, where the analyst is free to discover things of interest about the video via trial-and-error.
The prototype systems we have developed to this point implement all the core features we have discussed, but are rudimentary in nature. Performance is not optimized and can be improved; however, prototype performance is sufficient to
Figure 10. This path tear produces many bent paths, which reflect the cars that are driving out from their parking spots, or driving into the parking spot. The straight path artifacts represent cars that simply drive right through the lane without
finding a parking spot.
Figure 9. This intrusion tear shows us that the lane that is second from the bottom deals with the most vehicular and pedestrian traffic. We also see that a big blue tractor truck moves in and stops for a long period of time before moving
onward.

generate timeline views of tears fairly rapidly and allow exploration. With enough memory, these timeline views can be generated even more quickly.
We have also considered several other possibilities for the slit-tear technique. For instance, it would be useful to use multiple, time-synchronized videos with slit-tears. Not only could the tears from the different videos be composited into the same timeline (thereby supporting analysis across views), one could then easily understand events from different perspectives. Along these lines, we have also tried using slit-tears for real-time analysis (i.e. for intrusion detection and monitoring tears) of video, which has proved to be useful since it focuses the attention of the viewer. Finally, we believe slit-tears may also be usefully applied to arbitrary data types beyond the stationary video data that we have presented to this point. For instance, it may be useful to include a slit-tear visualization technique to an MRI viewer, where the time dimension is replaced by the different slice images.
7. CONCLUSIONSWe view slit-tears as a powerful tool for exploring video data, though more importantly, we see the technique as an example of how exploratory data analysis tools can be designed. First, we view the exploratory data analysis process to be primarily human-driven, and so such tools need to be designed to facilitate rapid testing of provisional hypotheses. Slit-tears provides this capability by immediately generating the timeline visualization as the tears are drawn. Second, such tools need to be capable of providing insight into the underlying data without an onerous amount of interaction. We believe slit-tears provides this insight by transposing the time dimension with the horizontal dimension, providing the analyst with an understanding of what happens to a set of pixels over time in a static visualization.
The purpose of this paper was to show how slit-tears can be used in a variety of domains to explore and understand the video. We have articulated a set of analytic primitives, and a typology of slit-tear types, providing video analysts with a way of thinking about video and how it can be analyzed. We showed how these slit-tear types and analytic primitives can carry vastly different meanings depending on the video context, and illustrated their use in three different video domains. Ultimately, we see it as a tool that can be applied by analysts to many different kinds of videos to generate insight that might otherwise be hidden.
8. VIDEO/SOFTWARE AVAILABILITYAn accompanying video figure that illustrates this highly dynamic and interactive system is available from http://grouplab.cpsc.ucalgary.ca/ [11]. We also make the prototype systems available for other researchers to explore the technique at http://grouplab.cpsc.ucalgary.ca/cookbook/.
9. REFERENCES[1] Cassinelli, A. and Ishikawa, M. 2005. Khronos projector. In
ACM SIGGRAPH 2005 Emerging Technologies, 10.
[2] Chung, M. G., Lee, J., Kim, H., Song, S. M.-H., and Kim, W. M. 1999. Automatic segmentation based on spatio-temporal features. Journal of Korea Telecom, 4 (1), 4--14.
[3] Elliot, E. 1993. Watch, grab, arrange, see: Thinking with motion images via streams and collages. MS Thesis in Visual Studies, January, MIT.
[4] Fels S., Lee, E. and Mase, K. 2000. Techniques for interactive video cubism. Proc ACM Multimedia, 368--370.
[5] Isenberg, P., Tang, A., and Carpendale, S. 2008. An exploratory study of visual information analysis. In Proc CHI 2008, 1217-1226.
[6] Ngo, C. W., Pong, T. C., and Chin, R. T. 1999. Detection of gradual transitions through temporal slice analysis. Proc IEEE CVPR, 36--41.
[7] Nunes, M., Greenberg, S., Carpendale, S. and Gutwin, C. 2007. What did I miss? Visualizing the past through video traces. In Proc ECSCW'07, 1-20.
[8] Scott, S. D., Carpendale, M. S. T., and Inkpen, K. M. 2004. Territoriality in collaborative tabletop workspaces. In Proc CSCW 2004, 294-303.
[9] Spence, R. 1999. A framework for navigation. Intl J of Human-Computer Studies, 51 (5), 919-945.
[10] Tang, A., Greenberg, S., and Fels, S. 2008. Exploring video streams using slit-tear visualizations. In Proc AVI 2008, 191-198.
[11] Tang, A., Greenberg, S. and Fels, S. 2008. Exploring video streams using slit-tear visualizations: the video. Research report 2008-897-10, Department of Computer Science, University of Calgary, Calgary, Alberta, Canada.
[12] Yeung, M. M., and Yeo, B-L. 1997. Video visualization for compact presentation and fast browsing of pictorial content.
Figure 11. This monitor tear allows us to detect when a parked car leaves, and when a new car parks and takes the spot. It would be possible to use this technique to understand which parking spots are most popular, and which get the most usage.

IEEE Transactions on Circuits and Systems for Video Technology. 7 (5), 771--785, IEEE.


![[XLS] · Web viewEdited by Hinz, Richard and other 363.5/NEN Expanding housing finance to the underserved in South Asia: market review Nenova, Tatiana](https://img.pdfslide.us/doc/110x75/5b040c127f8b9a3c378d1e17/xls-viewedited-by-hinz-richard-and-other-3635nen-expanding-housing-finance.jpg)