Embed Size (px)
Citation preview
JS
C S
&M
A A
naly
sis
Bra
nch
Probabilistic Risk Assessment (PRA):
Analytical Process for Recognizing Design
and Operational Risks
Prepared by
Roger L. Boyer, MS, CREChief, Risk & Reliability Analysis Branch
NASA Johnson Space Center
Safety & Mission Assurance (S&MA)
Prepared for
Texas A&M University at Galveston
March 28, 2017
1
https://ntrs.nasa.gov/search.jsp?R=20170002570 2018-06-13T16:51:26+00:00Z
JS
C S
&M
A A
naly
sis
Bra
nch
Pop Quiz:
Using different views in analysis
2
JS
C S
&M
A A
naly
sis
Bra
nch
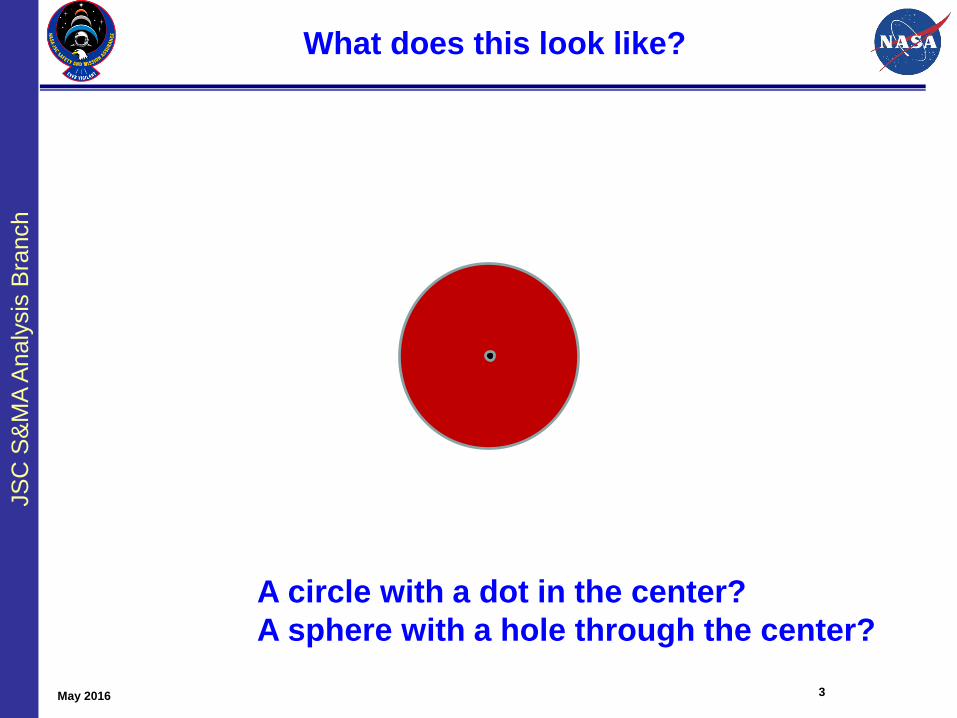
What does this look like?
A circle with a dot in the center?
A sphere with a hole through the center?
May 2016 3
JS
C S
&M
A A
naly
sis
Bra
nch
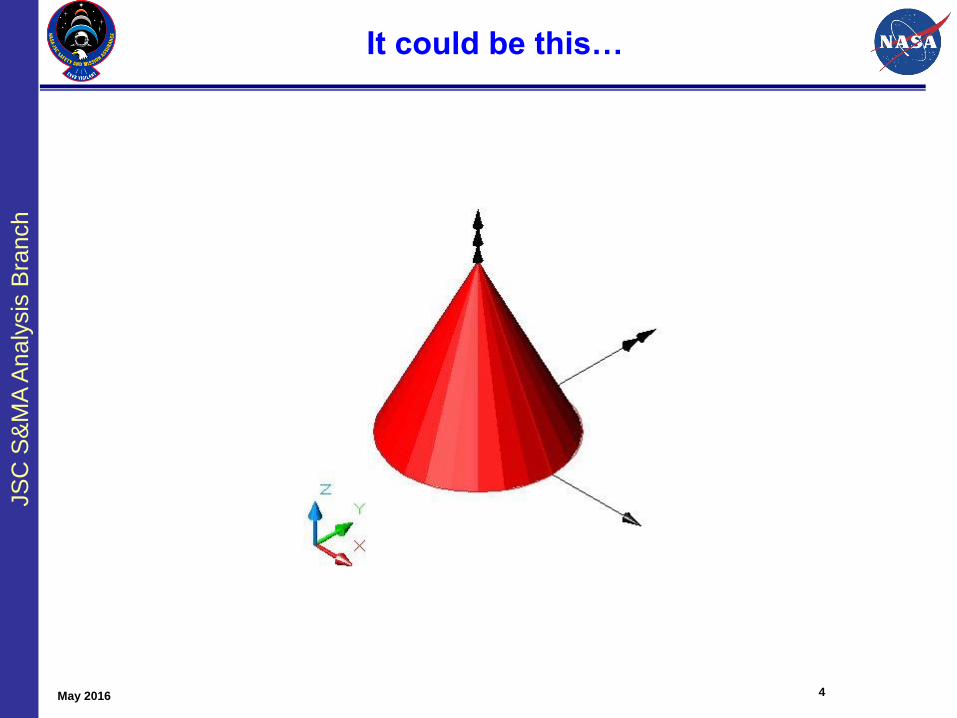
It could be this…
May 2016 4
JS
C S
&M
A A
naly
sis
Bra
nch
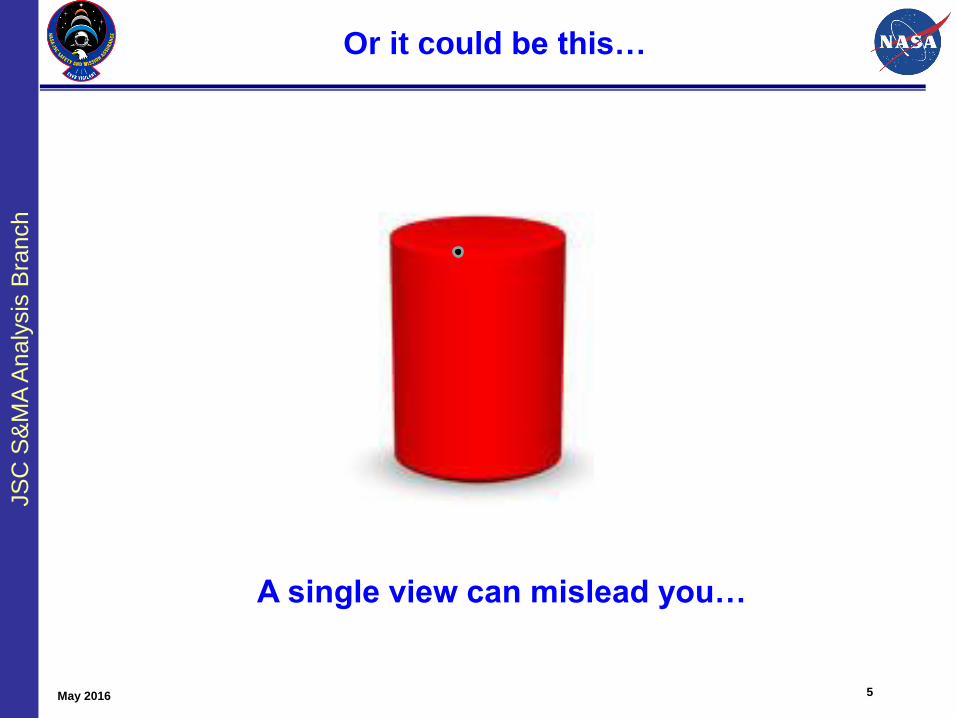
Or it could be this…
May 2016 5
A single view can mislead you…
JS
C S
&M
A A
naly
sis
Bra
nch
Probabilistic Risk Assessment (PRA)
is a tool to help you assess the risk by
looking at systems and operations in a
different view both quantitatively and
qualitatively.
Given our available budget and time,
we must be smart and efficient in how
and what we do. That’s where PRA
can make a difference.
Conclusion
6
JS
C S
&M
A A
naly
sis
Bra
nch
Questions?
May 2016 7
JS
C S
&M
A A
naly
sis
Bra
nch
Introduction
• Probabilistic Risk Assessment (PRA) is one of the tools
in NASA’s Safety & Mission Assurance (S&MA) toolbox.
It provides both depth and width in evaluating systems,
vehicles, vessels, facilities, and missions.
• NASA continues to get budgets with high expectations
from the public. S&MA must continue to do its job with
less, thus we have to be smarter and more efficient.
• PRA has been used successfully in several industries,
such as commercial nuclear power, aerospace,
transportation, chemical, and medical.
• BSEE has hired NASA’s Johnson Space Center (JSC) to
use its PRA experience to develop a PRA procedures
guide for the Oil & Gas industry and to develop several
example applications.
May 2016 8
JS
C S
&M
A A
naly
sis
Bra
nch
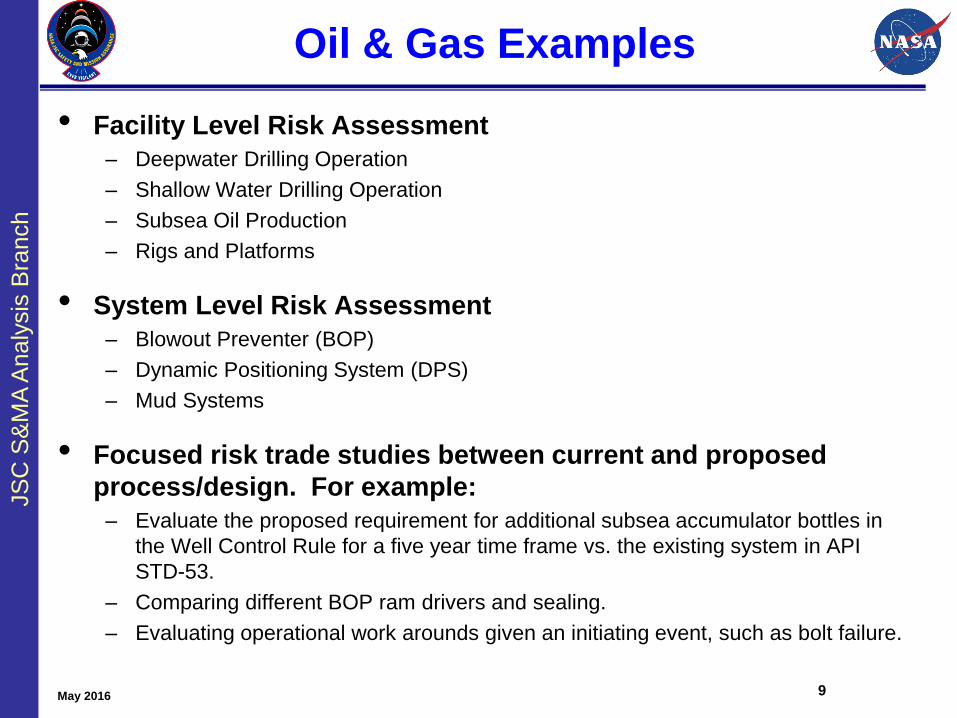
Oil & Gas Examples
• Facility Level Risk Assessment
– Deepwater Drilling Operation
– Shallow Water Drilling Operation
– Subsea Oil Production
– Rigs and Platforms
• System Level Risk Assessment
– Blowout Preventer (BOP)
– Dynamic Positioning System (DPS)
– Mud Systems
• Focused risk trade studies between current and proposed
process/design. For example:
– Evaluate the proposed requirement for additional subsea accumulator bottles in
the Well Control Rule for a five year time frame vs. the existing system in API
STD-53.
– Comparing different BOP ram drivers and sealing.
– Evaluating operational work arounds given an initiating event, such as bolt failure.
May 2016 9
JS
C S
&M
A A
naly
sis
Bra
nch
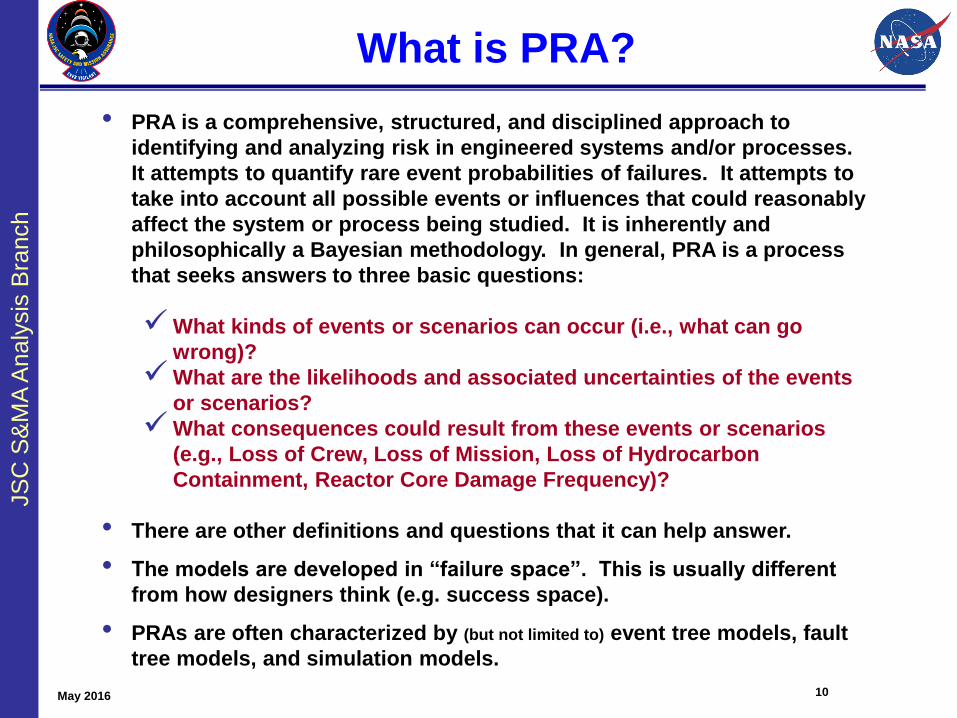
What is PRA?
• PRA is a comprehensive, structured, and disciplined approach to
identifying and analyzing risk in engineered systems and/or processes.
It attempts to quantify rare event probabilities of failures. It attempts to
take into account all possible events or influences that could reasonably
affect the system or process being studied. It is inherently and
philosophically a Bayesian methodology. In general, PRA is a process
that seeks answers to three basic questions:
What kinds of events or scenarios can occur (i.e., what can go
wrong)?
What are the likelihoods and associated uncertainties of the events
or scenarios?
What consequences could result from these events or scenarios
(e.g., Loss of Crew, Loss of Mission, Loss of Hydrocarbon
Containment, Reactor Core Damage Frequency)?
• There are other definitions and questions that it can help answer.
• The models are developed in “failure space”. This is usually different
from how designers think (e.g. success space).
• PRAs are often characterized by (but not limited to) event tree models, fault
tree models, and simulation models.
May 2016 10
JS
C S
&M
A A
naly
sis
Bra
nch
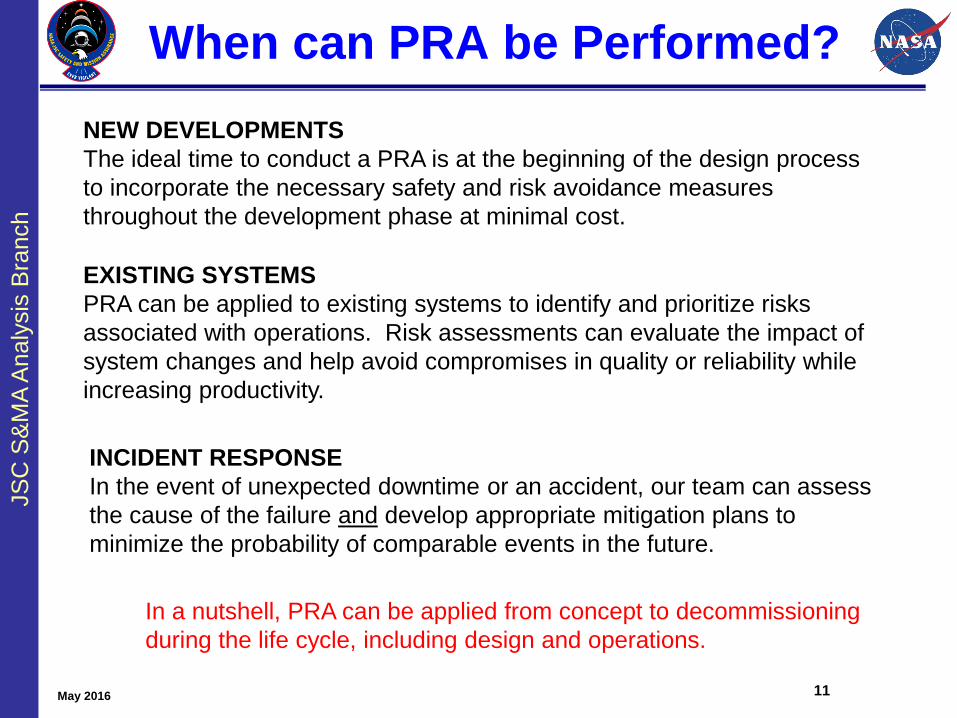
When can PRA be Performed?
May 2016 11
NEW DEVELOPMENTS
The ideal time to conduct a PRA is at the beginning of the design process
to incorporate the necessary safety and risk avoidance measures
throughout the development phase at minimal cost.
INCIDENT RESPONSE
In the event of unexpected downtime or an accident, our team can assess
the cause of the failure and develop appropriate mitigation plans to
minimize the probability of comparable events in the future.
EXISTING SYSTEMS
PRA can be applied to existing systems to identify and prioritize risks
associated with operations. Risk assessments can evaluate the impact of
system changes and help avoid compromises in quality or reliability while
increasing productivity.
In a nutshell, PRA can be applied from concept to decommissioning
during the life cycle, including design and operations.
JS
C S
&M
A A
naly
sis
Bra
nch
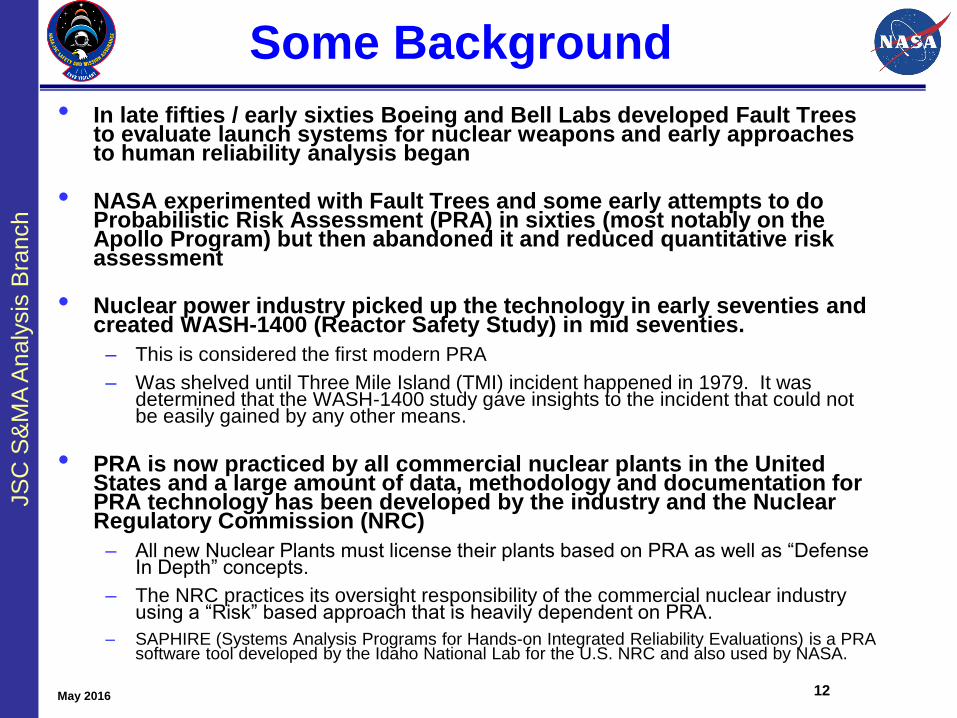
Some Background
• In late fifties / early sixties Boeing and Bell Labs developed Fault Trees to evaluate launch systems for nuclear weapons and early approaches to human reliability analysis began
• NASA experimented with Fault Trees and some early attempts to do Probabilistic Risk Assessment (PRA) in sixties (most notably on the Apollo Program) but then abandoned it and reduced quantitative risk assessment
• Nuclear power industry picked up the technology in early seventies and created WASH-1400 (Reactor Safety Study) in mid seventies.
– This is considered the first modern PRA
– Was shelved until Three Mile Island (TMI) incident happened in 1979. It was determined that the WASH-1400 study gave insights to the incident that could not be easily gained by any other means.
• PRA is now practiced by all commercial nuclear plants in the United States and a large amount of data, methodology and documentation for PRA technology has been developed by the industry and the Nuclear Regulatory Commission (NRC)
– All new Nuclear Plants must license their plants based on PRA as well as “Defense In Depth” concepts.
– The NRC practices its oversight responsibility of the commercial nuclear industry using a “Risk” based approach that is heavily dependent on PRA.
– SAPHIRE (Systems Analysis Programs for Hands-on Integrated Reliability Evaluations) is a PRA software tool developed by the Idaho National Lab for the U.S. NRC and also used by NASA.
May 2016 12
JS
C S
&M
A A
naly
sis
Bra
nch
PRA Overview
May 2016 13
JS
C S
&M
A A
naly
sis
Bra
nch
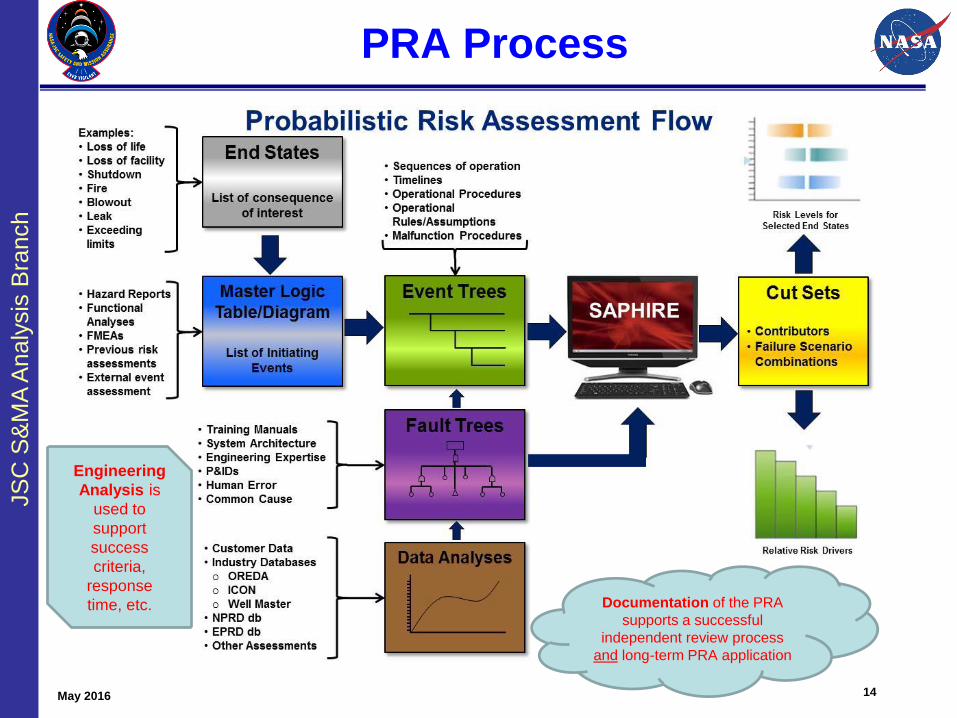
PRA Process
May 2016 14
Documentation of the PRA
supports a successful
independent review process
and long-term PRA application
Engineering
Analysis is
used to
support
success
criteria,
response
time, etc.
JS
C S
&M
A A
naly
sis
Bra
nch
The PRA Team
• A PRA system analysis team includes both system domain
experts and PRA analysts. The key to success is multi-way
communication between the PRA analysts, domain experts,
and management.
• A majority of PRA analysts have engineering degrees with
operations and/or design backgrounds in order to understand
how systems work and fail. This is essential in developing the
failure logic of the vehicle or facility.
• Good data analysts understand how to take the available data
to generate probabilities and their associated uncertainty for
the basic events that the modelers can use or need.
• Building or developing a PRA involves:
– understanding its purpose and the appropriate modeling techniques,
– designing how it will serve that purpose,
– populating it with the desired failure logic and probabilities, and
– trouble shooting it (nothing works the first time)May 2016 15
JS
C S
&M
A A
naly
sis
Bra
nch
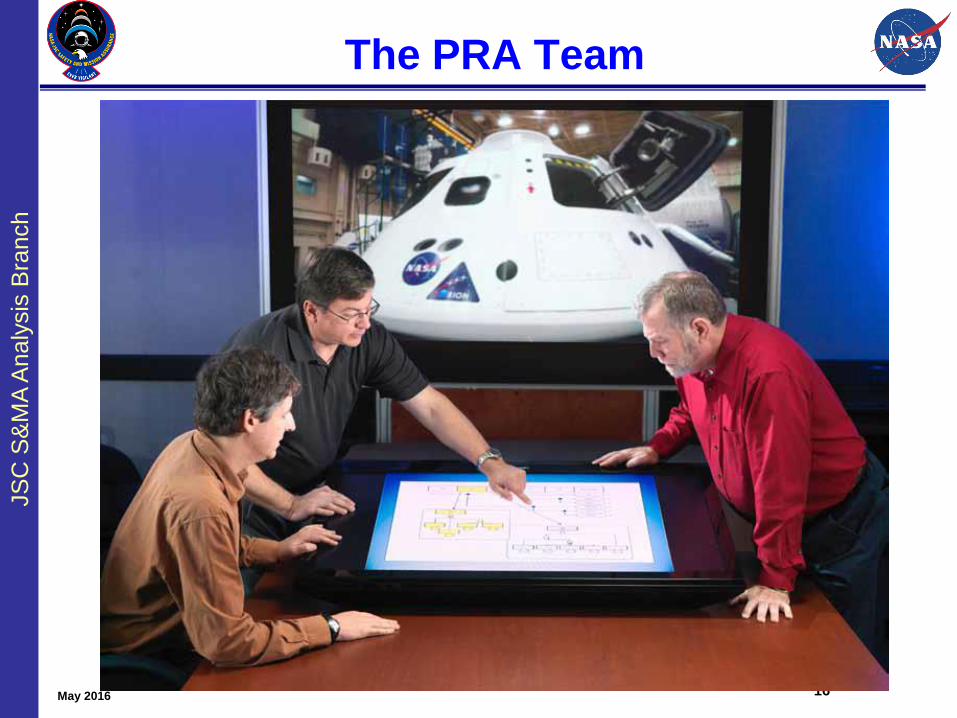
The PRA Team
May 2016 16
JS
C S
&M
A A
naly
sis
Bra
nch
17
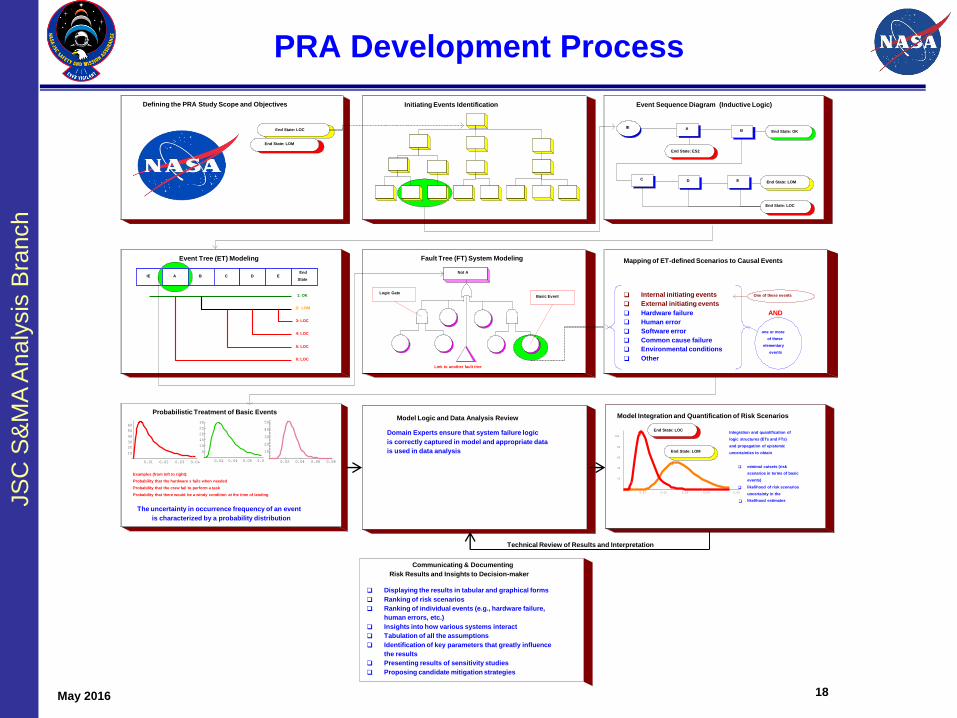
PRA Development Process
May 2016
JS
C S
&M
A A
naly
sis
Bra
nch
18
PRA Development Process
Fault Tree (FT) System ModelingEvent Tree (ET) Modeling
IE B C D EEnd
State
1: OK
2: LOM
3: LOC
4: LOC
5: LOC
6: LOC
A
Initiating Events Identification
Not A
Link to another fault tree
Basic EventLogic Gate
End State: ES2
End State: LOC
End State: LOM
Defining the PRA Study Scope and Objectives
Mapping of ET-defined Scenarios to Causal Events
q Internal initiating events
q External initiating events
q Hardware failure
q Human error
q Software error
q Common cause failure
q Environmental conditions
q Other
one or more
of these
elementary
events
One of these events
AND
Event Sequence Diagram (Inductive Logic)
IEEnd State: OK
End State: LOM
End State: ES2
End State: LOC
AB
C D E
0.01 0.02 0.03 0.04
10
20
30
40
50
60
0.02 0.04 0.06 0.08
5
10
15
20
25
30
0.02 0.04 0.06 0.08
10
20
30
40
50
Probabilistic Treatment of Basic Events
The uncertainty in occurrence frequency of an event
is characterized by a probability distribution
Examples (from left to right):
Probability that the hardware x fails when needed
Probability that the crew fail to perform a task
Probability that there would be a windy condition at the time of landing
Communicating & Documenting
Risk Results and Insights to Decision-maker
q Displaying the results in tabular and graphical forms
q Ranking of risk scenarios
q Ranking of individual events (e.g., hardware failure,
human errors, etc.)
q Insights into how various systems interact
q Tabulation of all the assumptions
q Identification of key parameters that greatly influence
the results
q Presenting results of sensitivity studies
q Proposing candidate mitigation strategies
Technical Review of Results and Interpretation
Model Integration and Quantification of Risk Scenarios
Integration and quantification of
logic structures (ETs and FTs)
and propagation of epistemic
uncertainties to obtain
q minimal cutsets (risk
scenarios in terms of basic
events)
q likelihood of risk scenarios
q
uncertainty in the
likelihood estimates
0.01 0.02 0.03 0.04 0.05
20
40
60
80
100
End State: LOM
End State: LOCDomain Experts ensure that system failure logic
is correctly captured in model and appropriate data
is used in data analysis
Model Logic and Data Analysis Review
May 2016
JS
C S
&M
A A
naly
sis
Bra
nch
19
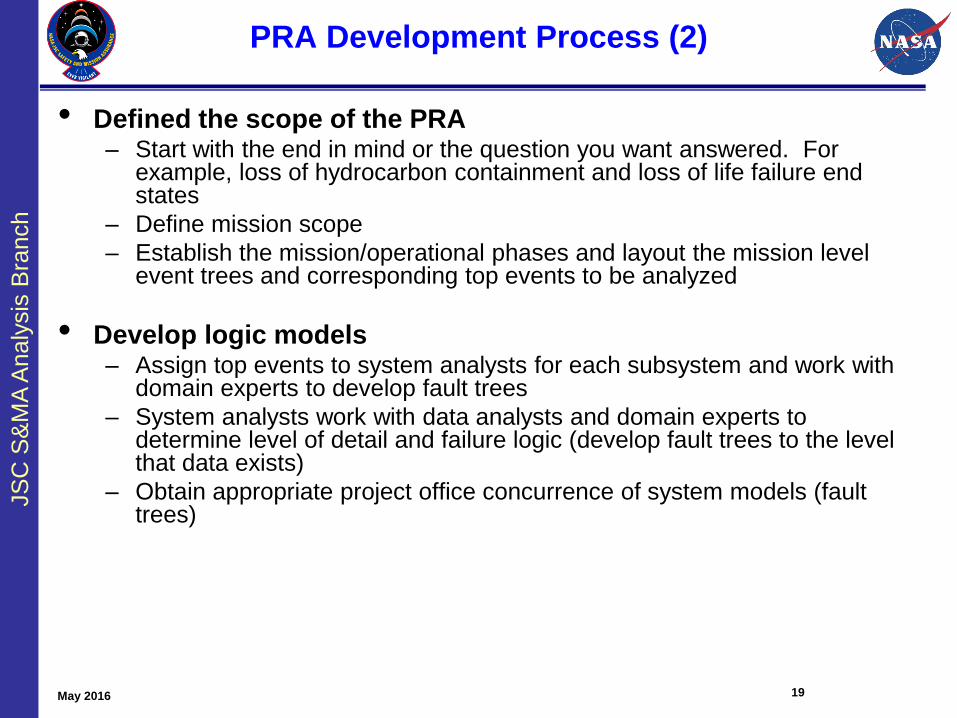
PRA Development Process (2)
• Defined the scope of the PRA– Start with the end in mind or the question you want answered. For
example, loss of hydrocarbon containment and loss of life failure end states
– Define mission scope
– Establish the mission/operational phases and layout the mission level event trees and corresponding top events to be analyzed
• Develop logic models– Assign top events to system analysts for each subsystem and work with
domain experts to develop fault trees
– System analysts work with data analysts and domain experts to determine level of detail and failure logic (develop fault trees to the level that data exists)
– Obtain appropriate project office concurrence of system models (fault trees)
May 2016
JS
C S
&M
A A
naly
sis
Bra
nch
20
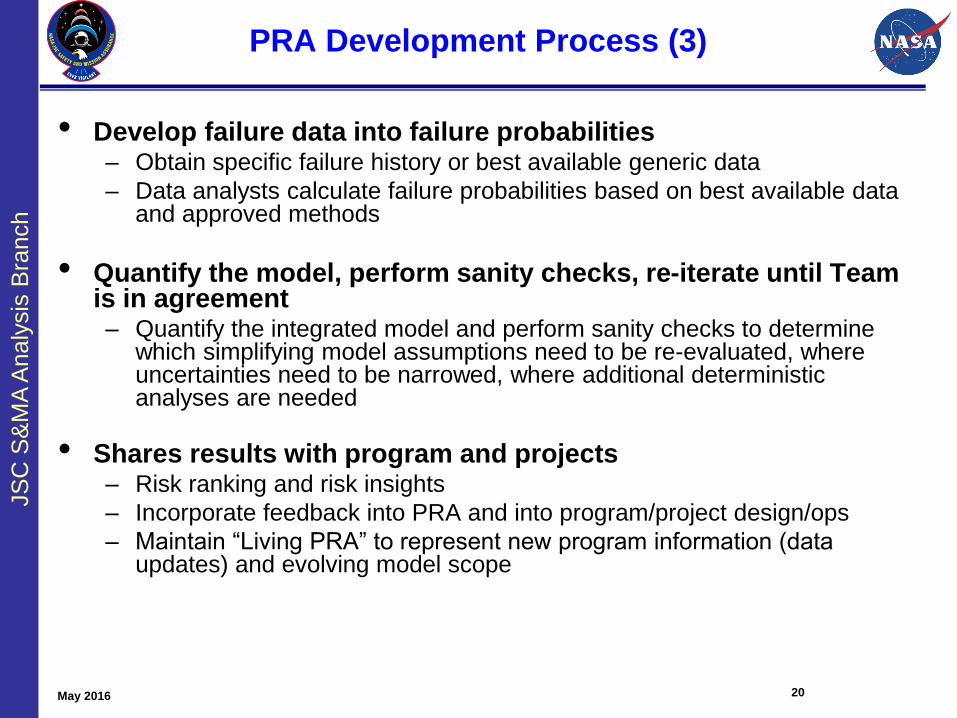
PRA Development Process (3)
• Develop failure data into failure probabilities– Obtain specific failure history or best available generic data
– Data analysts calculate failure probabilities based on best available data and approved methods
• Quantify the model, perform sanity checks, re-iterate until Team is in agreement– Quantify the integrated model and perform sanity checks to determine
which simplifying model assumptions need to be re-evaluated, where uncertainties need to be narrowed, where additional deterministic analyses are needed
• Shares results with program and projects– Risk ranking and risk insights
– Incorporate feedback into PRA and into program/project design/ops
– Maintain “Living PRA” to represent new program information (data updates) and evolving model scope
May 2016
JS
C S
&M
A A
naly
sis
Bra
nch
21
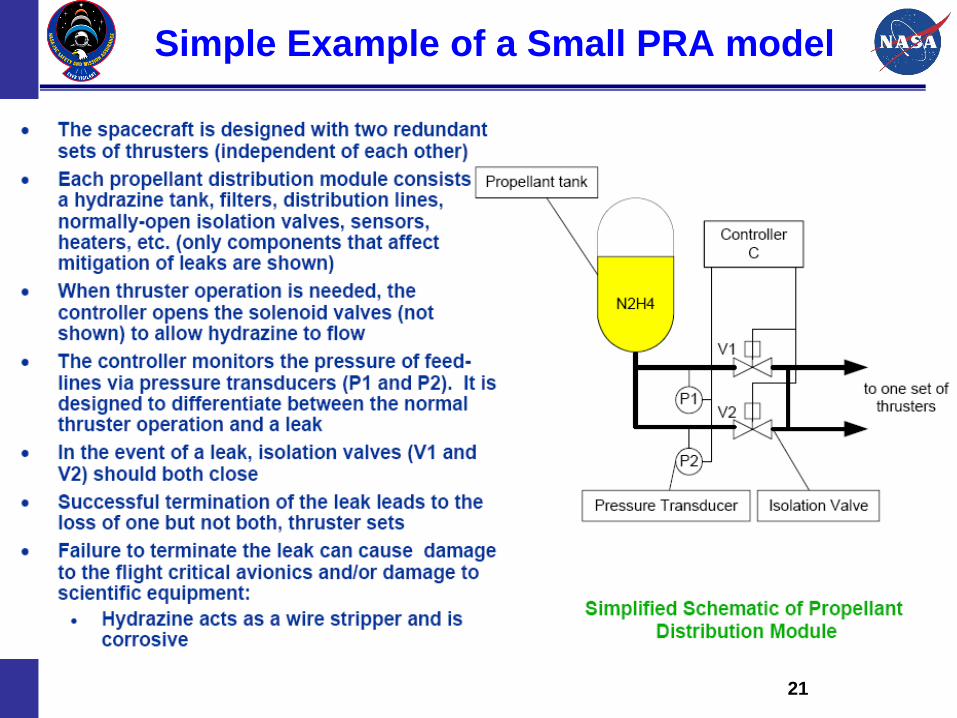
Simple Example of a Small PRA model
JS
C S
&M
A A
naly
sis
Bra
nch
22
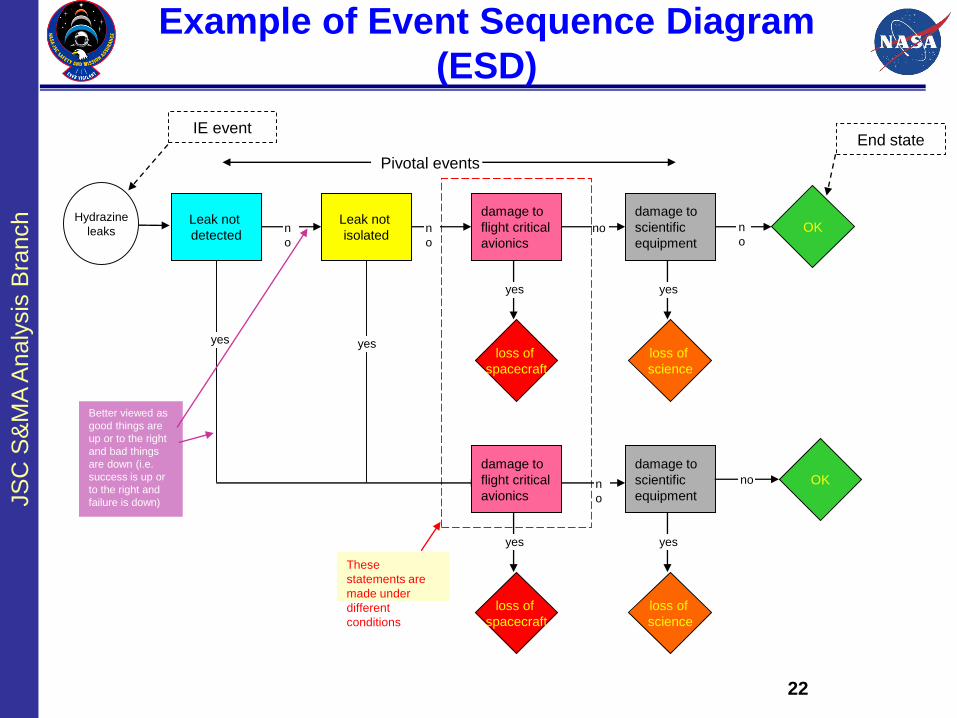
Example of Event Sequence Diagram
(ESD)
Hydrazine
leaksLeak not
detected
Leak not
isolated
damage to
flight critical
avionics
damage to
scientific
equipment
n
o
n
o
no n
o
yes yes
damage to
flight critical
avionics
loss of
spacecraft
loss of
science
OK
yes
loss of
spacecraft
n
o
damage to
scientific
equipment
yes
loss of
science
no OK
yesyes
These
statements are
made under
different
conditions
IE event
Better viewed as
good things are
up or to the right
and bad things
are down (i.e.
success is up or
to the right and
failure is down)
Pivotal events
End state
JS
C S
&M
A A
naly
sis
Bra
nch
23
The ESD Translated Into an Event Tree
Hydrazine
leaksLeak not
detected
Leak not
isolated
damage to
flight critical
avionics
damage to
scientific
equipment
loss of
spacecraft
loss of
science
OK
Hydrazine leaks Leak not detected Leak not isolateddamage to flight
critical avionics
damage to
scientific
equipment
End state
OK
Loss of science
Loss of spacecraft
OK
OK
Loss of science
Loss of spacecraft
Loss of science
Loss of spacecraft
Better viewed as
good things are up
and bad things are
down, i.e. success
up and failure down
End
states
1
2
3
4
5
6
7
8
9
JS
C S
&M
A A
naly
sis
Bra
nch
24
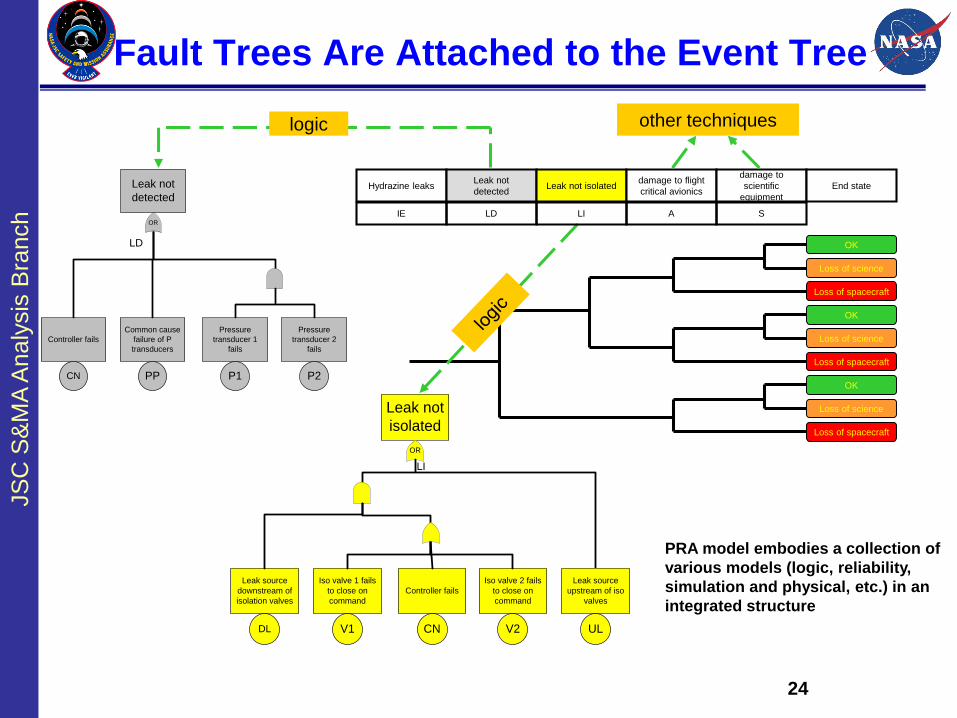
Fault Trees Are Attached to the Event Tree
PRA model embodies a collection of
various models (logic, reliability,
simulation and physical, etc.) in an
integrated structure
Hydrazine leaksLeak not
detectedLeak not isolated
damage to flight
critical avionics
damage to
scientific
equipment
End state
OK
Loss of science
Loss of spacecraft
OK
OK
Loss of science
Loss of spacecraft
Loss of science
Loss of spacecraft
Controller fails
CN
Common cause
failure of P
transducers
PP
Pressure
transducer 1
fails
P1
Pressure
transducer 2
fails
P2
Leak not
detected
OR
Leak not
isolated
OR
Leak source
downstream of
isolation valves
DL
Iso valve 1 fails
to close on
command
V1
Controller fails
CN
Iso valve 2 fails
to close on
command
V2
Leak source
upstream of iso
valves
UL
logic other techniques
LD LI A SIE
LD
LI
JS
C S
&M
A A
naly
sis
Bra
nch
25
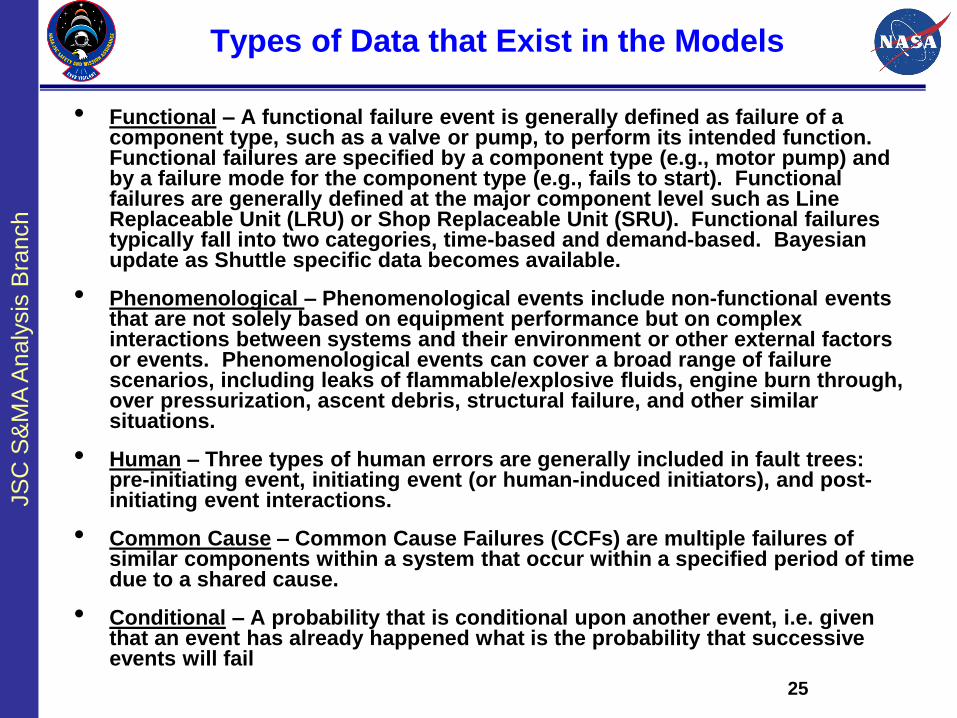
Types of Data that Exist in the Models
• Functional – A functional failure event is generally defined as failure of a component type, such as a valve or pump, to perform its intended function. Functional failures are specified by a component type (e.g., motor pump) and by a failure mode for the component type (e.g., fails to start). Functional failures are generally defined at the major component level such as Line Replaceable Unit (LRU) or Shop Replaceable Unit (SRU). Functional failures typically fall into two categories, time-based and demand-based. Bayesian update as Shuttle specific data becomes available.
• Phenomenological – Phenomenological events include non-functional events that are not solely based on equipment performance but on complex interactions between systems and their environment or other external factors or events. Phenomenological events can cover a broad range of failure scenarios, including leaks of flammable/explosive fluids, engine burn through, over pressurization, ascent debris, structural failure, and other similar situations.
• Human – Three types of human errors are generally included in fault trees: pre-initiating event, initiating event (or human-induced initiators), and post-initiating event interactions.
• Common Cause – Common Cause Failures (CCFs) are multiple failures of similar components within a system that occur within a specified period of time due to a shared cause.
• Conditional – A probability that is conditional upon another event, i.e. given that an event has already happened what is the probability that successive events will fail
JS
C S
&M
A A
naly
sis
Bra
nch
26
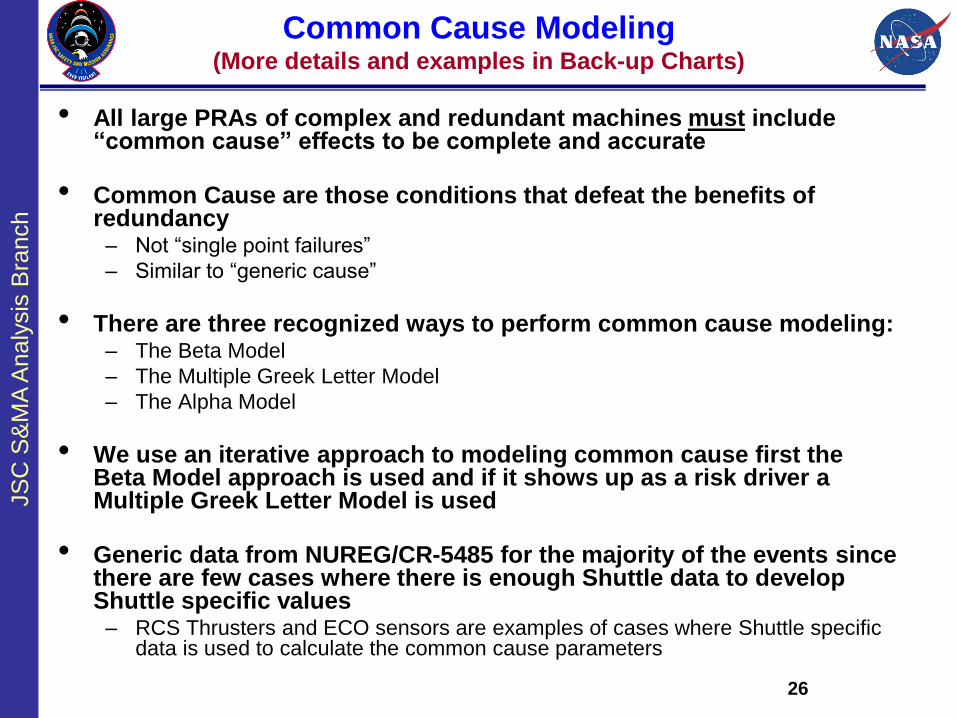
Common Cause Modeling(More details and examples in Back-up Charts)
• All large PRAs of complex and redundant machines must include “common cause” effects to be complete and accurate
• Common Cause are those conditions that defeat the benefits of redundancy
– Not “single point failures”
– Similar to “generic cause”
• There are three recognized ways to perform common cause modeling:– The Beta Model
– The Multiple Greek Letter Model
– The Alpha Model
• We use an iterative approach to modeling common cause first the Beta Model approach is used and if it shows up as a risk driver a Multiple Greek Letter Model is used
• Generic data from NUREG/CR-5485 for the majority of the events since there are few cases where there is enough Shuttle data to develop Shuttle specific values
– RCS Thrusters and ECO sensors are examples of cases where Shuttle specific data is used to calculate the common cause parameters
JS
C S
&M
A A
naly
sis
Bra
nch
Unknown and Underappreciated Risks
• Risk model completeness has long been recognized as a
challenge for simulated methods of risk analysis such as PRA as
traditionally practiced.
• These methods are generally effective at identifying system
failures that result from combinations of component failures that
propagate through the system due to the functional dependencies of
the system that are represented in the risk model.
• However, they are typically ineffective at identifying system failures
that result from unknown or underappreciated (UU) risks,
frequently involving complex intra- and inter-system interactions that
may have little to do with the intentionally engineered functional
relationships of the system.
May 2016 27
JS
C S
&M
A A
naly
sis
Bra
nch
Unknown and Underappreciated Risks (Cont’d)
• Earlier in 2009, the NASA Advisory Council noted the following set of
contributory factors:
– Inadequate definitions prior to agency budget decision and to external
commitments
– optimistic cost estimates/estimating errors
– inability to execute initial schedule baseline
– Inadequate risk assessments
– higher technical complexity of projects than anticipated
– changes in scope (design/content)
– Inadequate assessment of impacts of schedule changes on cost
– annual funding instability
– eroding in-housetechnicalexpertise
– poor tracking of contractor requirements against plans
– Reserve position adequacy
– lack of probabilistic estimating
– “go as you can afford” approach
– lack of formal document for recording key technical, schedule, and programmatic
assumptions.
May 2016 28
JS
C S
&M
A A
naly
sis
Bra
nch
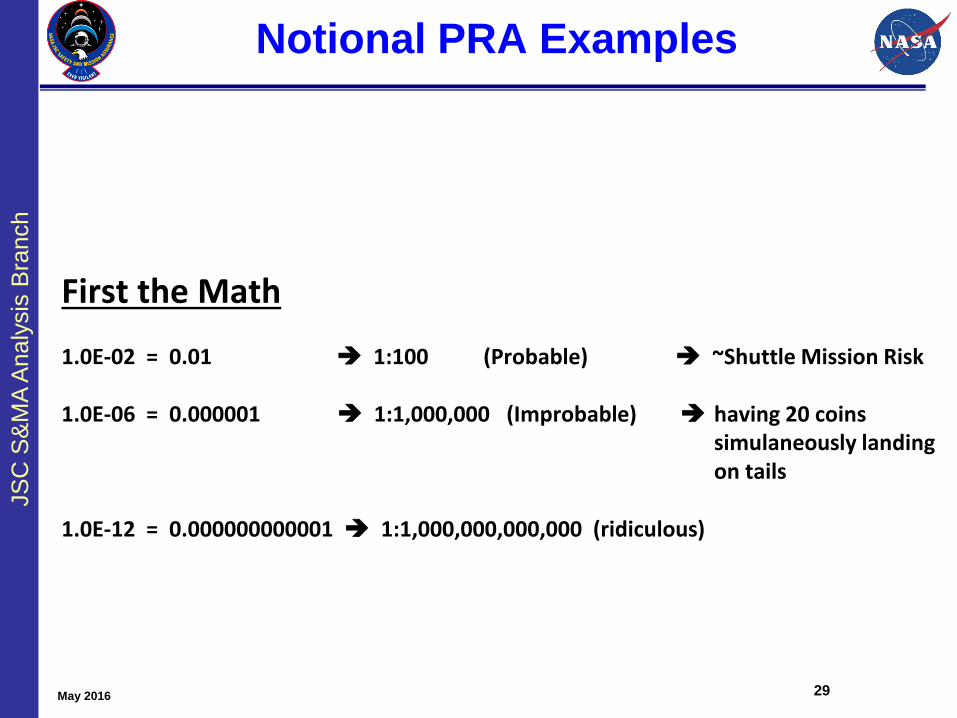
Notional PRA Examples
May 2016 29
First the Math
1.0E-02 = 0.01 1:100 (Probable) ~Shuttle Mission Risk
1.0E-06 = 0.000001 1:1,000,000 (Improbable) having 20 coins simulaneously landing on tails
1.0E-12 = 0.000000000001 1:1,000,000,000,000 (ridiculous)
JS
C S
&M
A A
naly
sis
Bra
nch
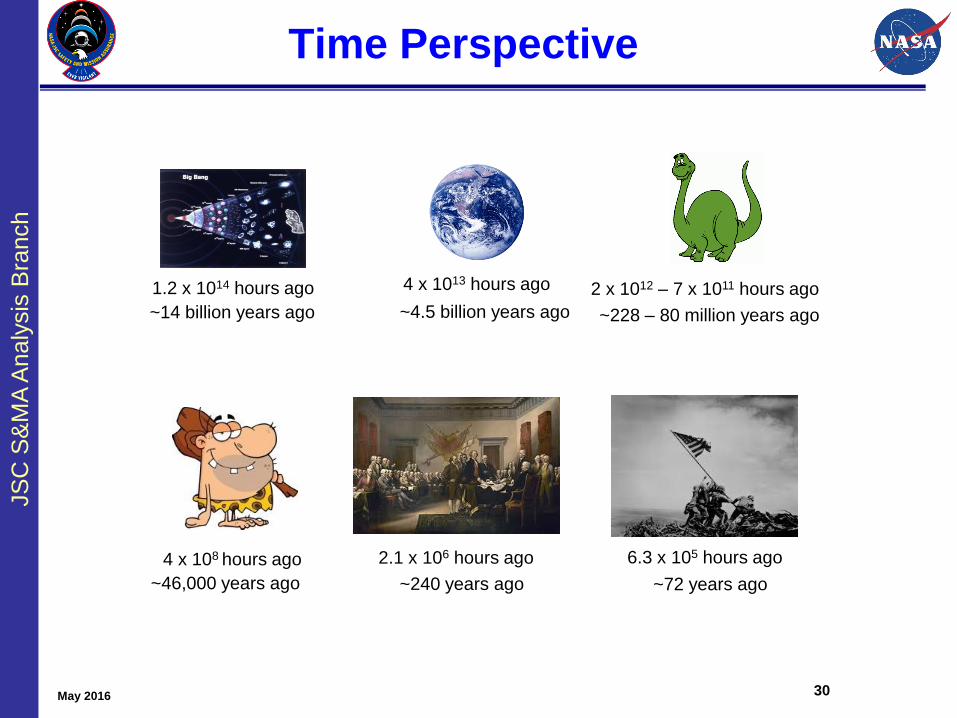
Time Perspective
May 2016
4 x 10¹³ hours ago 2 x 10¹² – 7 x 10¹¹ hours ago
6.3 x 10⁵ hours ago2.1 x 106 hours ago4 x 108 hours ago
~4.5 billion years ago ~228 – 80 million years ago
~46,000 years ago ~240 years ago ~72 years ago
1.2 x 10¹⁴ hours ago
~14 billion years ago
30
JS
C S
&M
A A
naly
sis
Bra
nch
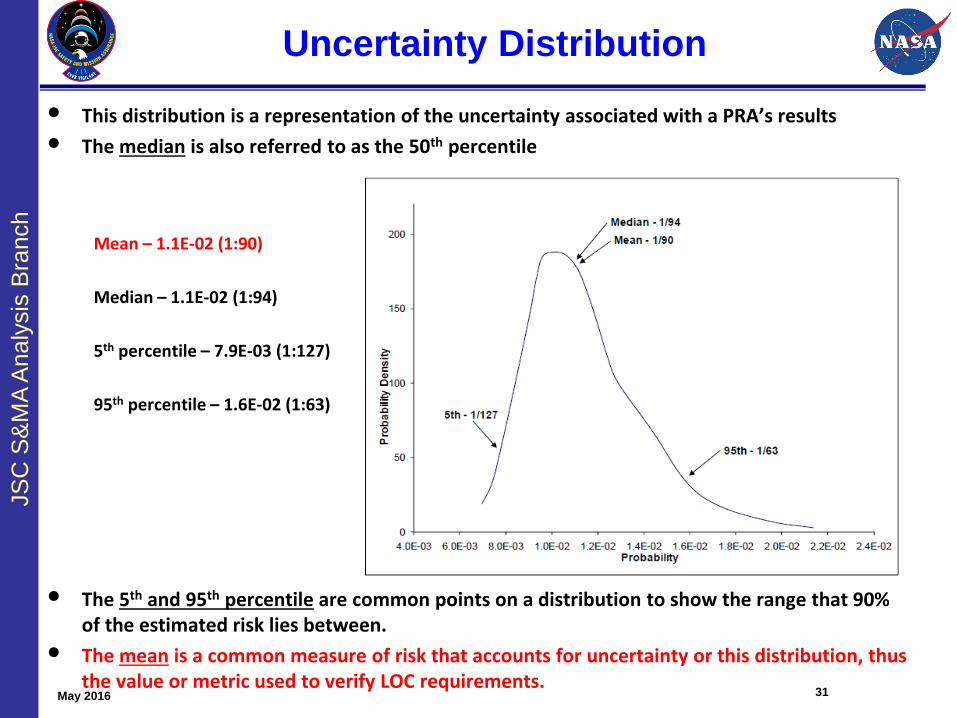
Uncertainty Distribution
May 2016 31
• This distribution is a representation of the uncertainty associated with a PRA’s results
• The median is also referred to as the 50th percentile
Mean – 1.1E-02 (1:90)
Median – 1.1E-02 (1:94)
5th percentile – 7.9E-03 (1:127)
95th percentile – 1.6E-02 (1:63)
• The 5th and 95th percentile are common points on a distribution to show the range that 90% of the estimated risk lies between.
• The mean is a common measure of risk that accounts for uncertainty or this distribution, thus the value or metric used to verify LOC requirements.
JS
C S
&M
A A
naly
sis
Bra
nch
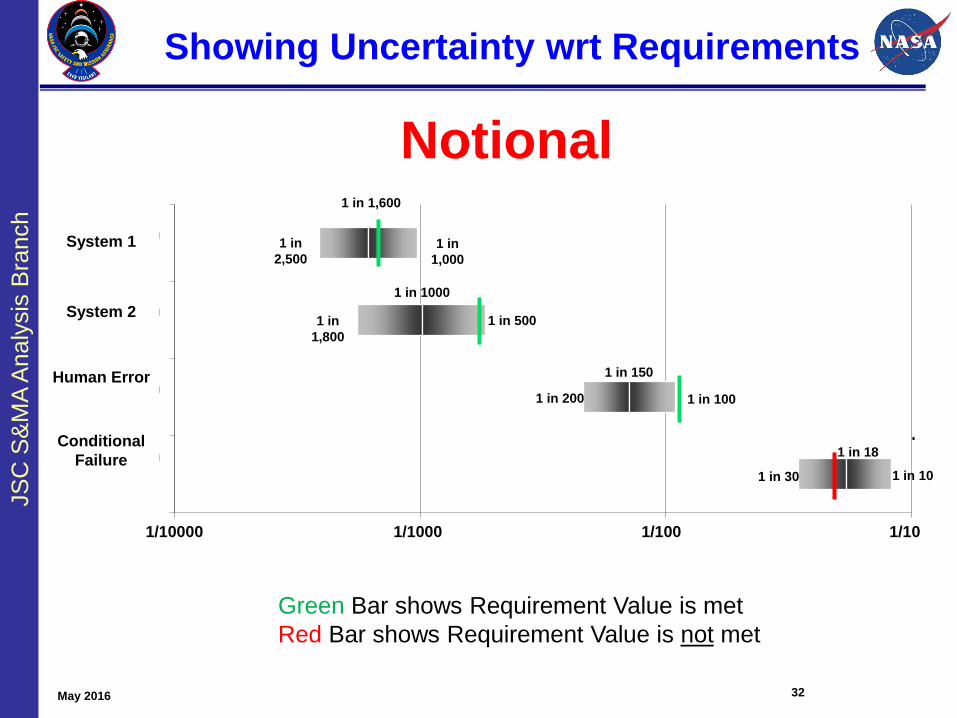
Showing Uncertainty wrt Requirements
1/10000 1/1000 1/100 1/10
MPCV ProgramLOC
SLS ProgramLOC
SLS ProgramLOM
MPCV ProgramAbort LOC
(Conditional)
1 in 1,600
1 in 1000
1 in 150
1 in 18
1 in
1,000
1 in
2,500
1 in 5001 in
1,800
1 in 1001 in 200
1 in 101 in 30
Green Bar shows Requirement Value is met
Red Bar shows Requirement Value is not met
32May 2016
System 1
System 2
Human Error
Conditional
Failure
Notional
JS
C S
&M
A A
naly
sis
Bra
nch
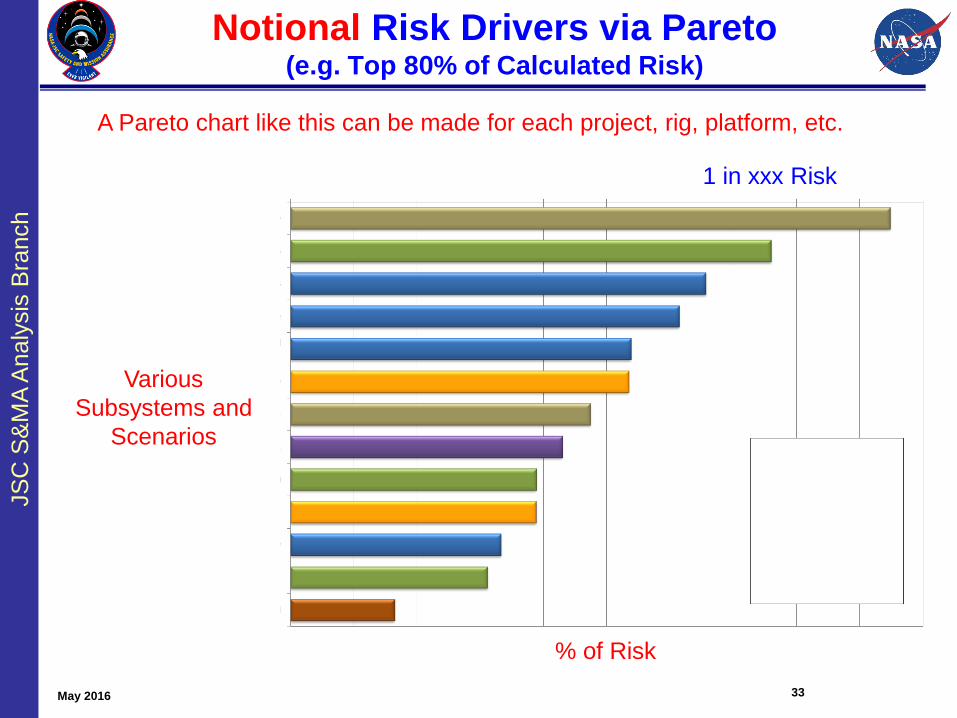
Notional Risk Drivers via Pareto(e.g. Top 80% of Calculated Risk)
33
% of Risk
May 2016
A Pareto chart like this can be made for each project, rig, platform, etc.
1 in xxx Risk
Various
Subsystems and
Scenarios
JS
C S
&M
A A
naly
sis
Bra
nch
• There is much more to know about PRA than what you’ve seen
today. This presentation was to give you insight in order to ask
the right questions when you are trying to decide:o whether you need a PRA or not,
o is it being performed properly and by qualified analysts,
o is it answering the question(s) you need answered.
• PRA (with the help of deterministic analyses) identifies and ranks
the risk contributors, the FMEA analysts and Reliability Engineers
can help solve the problem by focusing on the top risk drivers.
In Closing
May 2016 34
JS
C S
&M
A A
naly
sis
Bra
nch
Backup Charts
May 2016 35
JS
C S
&M
A A
naly
sis
Bra
nch
36
Acronyms and Definitions
1. Cut set: Those combinations of items that can cause a failure of the type that you are interested in. A “minimum cutset” is the minimum combination of items necessary to cause the failure of interest.
2. End State: The consequence of interest that is defined for what your model is supposed to calculate (sometimes will be referred to as a Top event or Figure of merit depending on model type).
3. Top event (Top): The top event in a fault tree or a pivotal event in an event tree. If an event tree uses a linked fault tree to calculate a pivotal event then the pivotal event name and Fault tree “Top” name need to be identical.
4. MLD: Master Logic Diagram. Used to identify all possible initiators.5. Event Tree: A logic tool that is used to model inductive logic and quantify models using
Boolean logic. Can be linked to other event trees and can use fault trees linked to it.6. Fault Tree: A logic tool that is used to build deductive models of equipment or processes
and is quantified with Boolean Logic. Can be linked to Event Trees for a linked fault tree model. Built from top down and quantified from bottom up.
7. PRA: Probabilistic Risk Assessment: A technique used for evaluating rare events for complex systems or processes. Attempts to account for all possible events that can cause the “end state”, “Top event”, “Figure of Merit”. Uses fault trees, event trees and other methods to “infer” the probability of events of interest. Better definition later.
8. Rare Event: An event that has a small probability of happening. From a data point of view, it will have never been seen in practice or seen only rarely. It will not have enough data to be statistically significant. From the “rare event approximation point of view it is a probability that is 0.1 or less.
May 2016
JS
C S
&M
A A
naly
sis
Bra
nch
37
Acronyms and Definitions(continued)
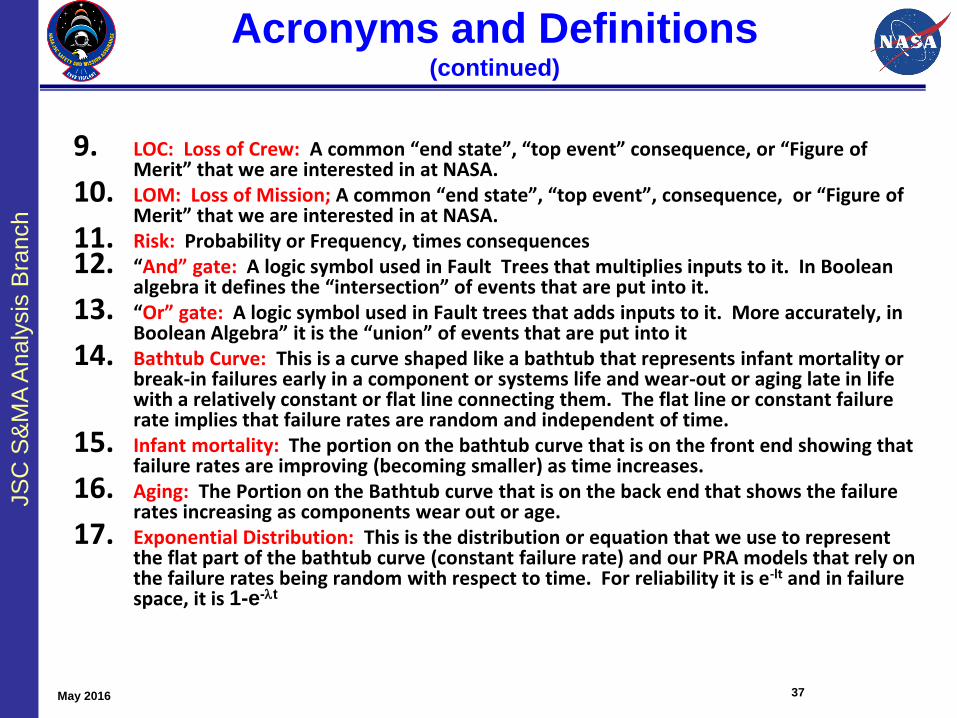
9. LOC: Loss of Crew: A common “end state”, “top event” consequence, or “Figure of Merit” that we are interested in at NASA.
10. LOM: Loss of Mission; A common “end state”, “top event”, consequence, or “Figure of Merit” that we are interested in at NASA.
11. Risk: Probability or Frequency, times consequences12. “And” gate: A logic symbol used in Fault Trees that multiplies inputs to it. In Boolean
algebra it defines the “intersection” of events that are put into it.13. “Or” gate: A logic symbol used in Fault trees that adds inputs to it. More accurately, in
Boolean Algebra” it is the “union” of events that are put into it14. Bathtub Curve: This is a curve shaped like a bathtub that represents infant mortality or
break-in failures early in a component or systems life and wear-out or aging late in life with a relatively constant or flat line connecting them. The flat line or constant failure rate implies that failure rates are random and independent of time.
15. Infant mortality: The portion on the bathtub curve that is on the front end showing that failure rates are improving (becoming smaller) as time increases.
16. Aging: The Portion on the Bathtub curve that is on the back end that shows the failure rates increasing as components wear out or age.
17. Exponential Distribution: This is the distribution or equation that we use to represent the flat part of the bathtub curve (constant failure rate) and our PRA models that rely on the failure rates being random with respect to time. For reliability it is e-lt and in failure space, it is 1-e-lt
May 2016
JS
C S
&M
A A
naly
sis
Bra
nch
38
Acronyms and Definitions(continued)
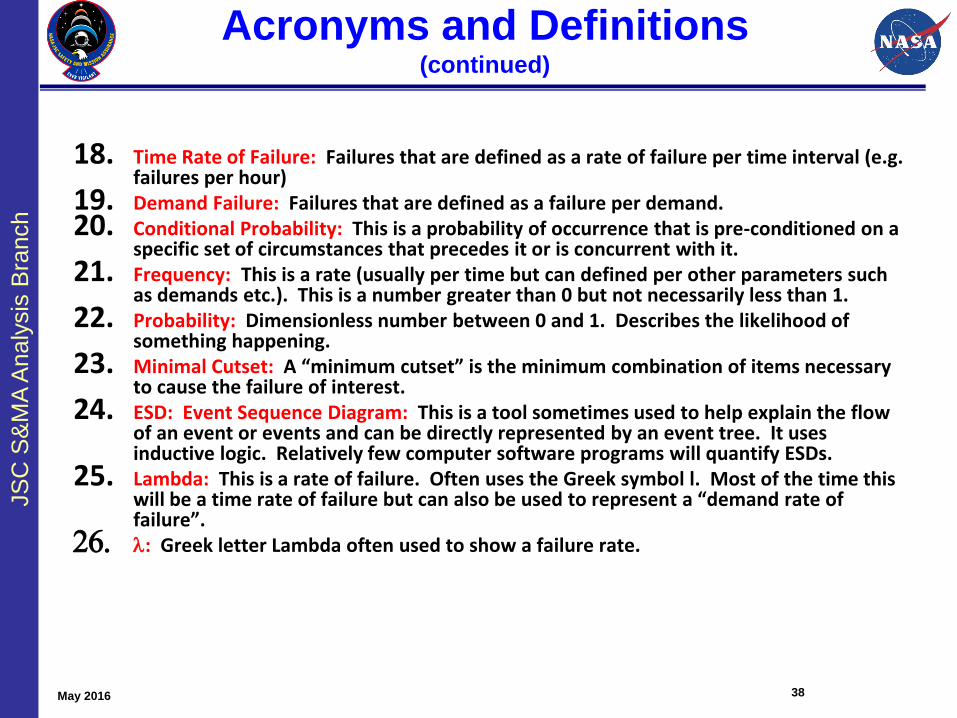
18. Time Rate of Failure: Failures that are defined as a rate of failure per time interval (e.g. failures per hour)
19. Demand Failure: Failures that are defined as a failure per demand.20. Conditional Probability: This is a probability of occurrence that is pre-conditioned on a
specific set of circumstances that precedes it or is concurrent with it.21. Frequency: This is a rate (usually per time but can defined per other parameters such
as demands etc.). This is a number greater than 0 but not necessarily less than 1.22. Probability: Dimensionless number between 0 and 1. Describes the likelihood of
something happening.23. Minimal Cutset: A “minimum cutset” is the minimum combination of items necessary
to cause the failure of interest.24. ESD: Event Sequence Diagram: This is a tool sometimes used to help explain the flow
of an event or events and can be directly represented by an event tree. It uses inductive logic. Relatively few computer software programs will quantify ESDs.
25. Lambda: This is a rate of failure. Often uses the Greek symbol l. Most of the time this will be a time rate of failure but can also be used to represent a “demand rate of failure”.
26. l: Greek letter Lambda often used to show a failure rate.
May 2016
JS
C S
&M
A A
naly
sis
Bra
nch
39
Acronyms and Definitions(continued)
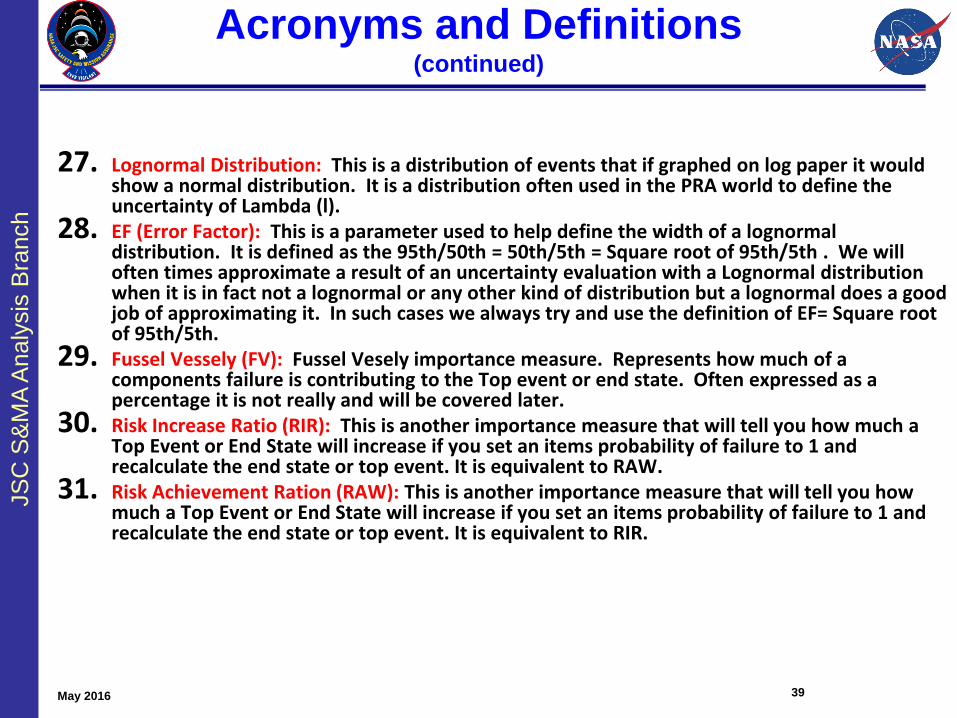
27. Lognormal Distribution: This is a distribution of events that if graphed on log paper it would show a normal distribution. It is a distribution often used in the PRA world to define the uncertainty of Lambda (l).
28. EF (Error Factor): This is a parameter used to help define the width of a lognormal distribution. It is defined as the 95th/50th = 50th/5th = Square root of 95th/5th . We will often times approximate a result of an uncertainty evaluation with a Lognormal distribution when it is in fact not a lognormal or any other kind of distribution but a lognormal does a good job of approximating it. In such cases we always try and use the definition of EF= Square root of 95th/5th.
29. Fussel Vessely (FV): Fussel Vesely importance measure. Represents how much of a components failure is contributing to the Top event or end state. Often expressed as a percentage it is not really and will be covered later.
30. Risk Increase Ratio (RIR): This is another importance measure that will tell you how much a Top Event or End State will increase if you set an items probability of failure to 1 and recalculate the end state or top event. It is equivalent to RAW.
31. Risk Achievement Ration (RAW): This is another importance measure that will tell you how much a Top Event or End State will increase if you set an items probability of failure to 1 and recalculate the end state or top event. It is equivalent to RIR.
May 2016
JS
C S
&M
A A
naly
sis
Bra
nch
40
Acronyms and Definitions(continued)
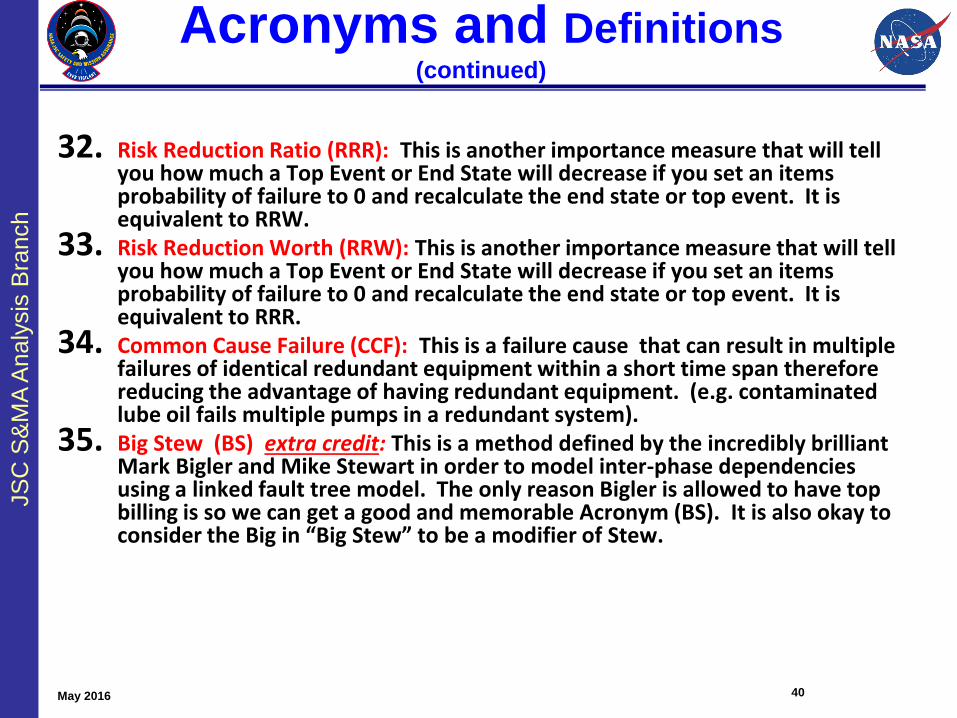
32. Risk Reduction Ratio (RRR): This is another importance measure that will tell you how much a Top Event or End State will decrease if you set an items probability of failure to 0 and recalculate the end state or top event. It is equivalent to RRW.
33. Risk Reduction Worth (RRW): This is another importance measure that will tell you how much a Top Event or End State will decrease if you set an items probability of failure to 0 and recalculate the end state or top event. It is equivalent to RRR.
34. Common Cause Failure (CCF): This is a failure cause that can result in multiple failures of identical redundant equipment within a short time span therefore reducing the advantage of having redundant equipment. (e.g. contaminated lube oil fails multiple pumps in a redundant system).
35. Big Stew (BS) extra credit: This is a method defined by the incredibly brilliant Mark Bigler and Mike Stewart in order to model inter-phase dependencies using a linked fault tree model. The only reason Bigler is allowed to have top billing is so we can get a good and memorable Acronym (BS). It is also okay to consider the Big in “Big Stew” to be a modifier of Stew.
May 2016
JS
C S
&M
A A
naly
sis
Bra
nch
41
Common Cause
JS
C S
&M
A A
naly
sis
Bra
nch
42
Common Cause
• Definition Of Common Cause Failure (CCF)
• Some basics
• Types Of CCF Models
• Examples of common cause
• Deriving common cause parameter values from data
• Examples of Beta’s calculated from real data (NASA
and Nuclear)
• Conclusions
JS
C S
&M
A A
naly
sis
Bra
nch
43
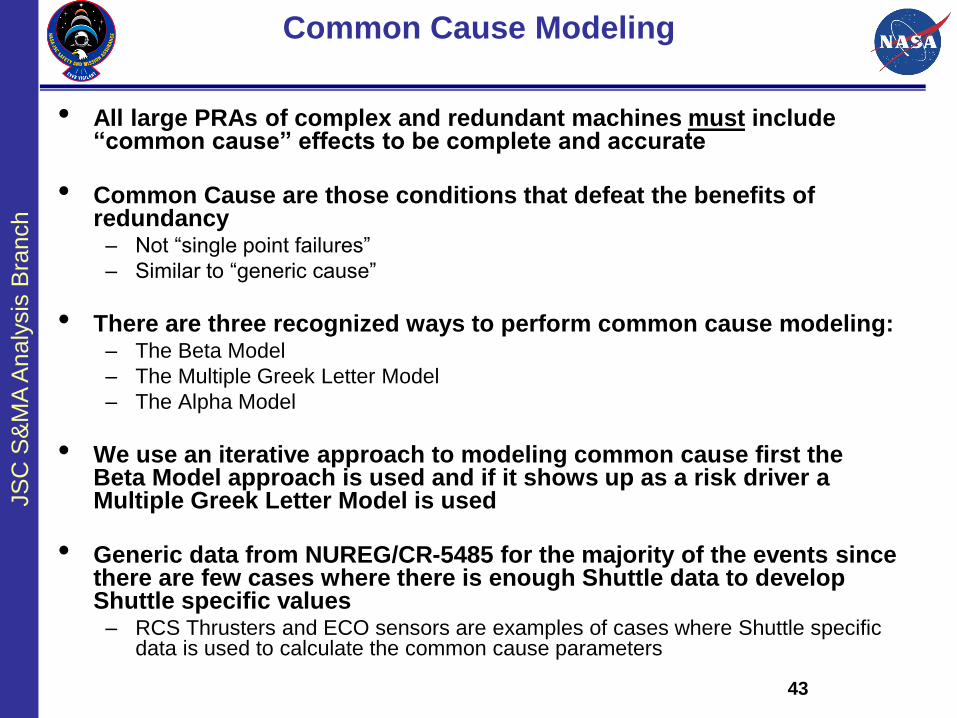
Common Cause Modeling
• All large PRAs of complex and redundant machines must include “common cause” effects to be complete and accurate
• Common Cause are those conditions that defeat the benefits of redundancy
– Not “single point failures”
– Similar to “generic cause”
• There are three recognized ways to perform common cause modeling:– The Beta Model
– The Multiple Greek Letter Model
– The Alpha Model
• We use an iterative approach to modeling common cause first the Beta Model approach is used and if it shows up as a risk driver a Multiple Greek Letter Model is used
• Generic data from NUREG/CR-5485 for the majority of the events since there are few cases where there is enough Shuttle data to develop Shuttle specific values
– RCS Thrusters and ECO sensors are examples of cases where Shuttle specific data is used to calculate the common cause parameters
JS
C S
&M
A A
naly
sis
Bra
nch
44
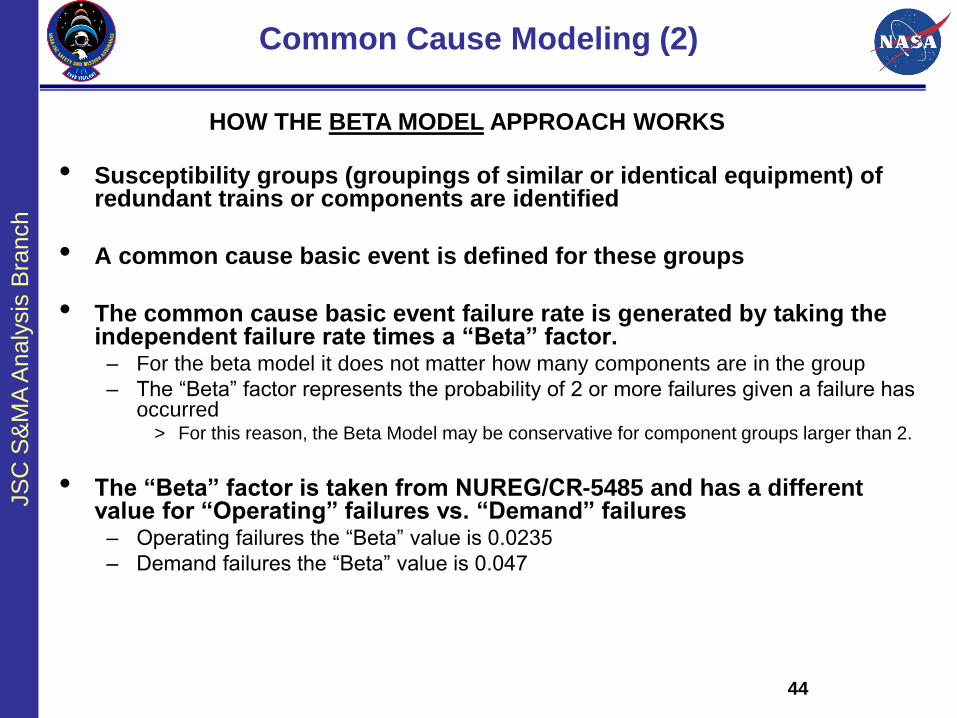
Common Cause Modeling (2)
• Susceptibility groups (groupings of similar or identical equipment) of redundant trains or components are identified
• A common cause basic event is defined for these groups
• The common cause basic event failure rate is generated by taking the independent failure rate times a “Beta” factor.
– For the beta model it does not matter how many components are in the group
– The “Beta” factor represents the probability of 2 or more failures given a failure has occurred
> For this reason, the Beta Model may be conservative for component groups larger than 2.
• The “Beta” factor is taken from NUREG/CR-5485 and has a different value for “Operating” failures vs. “Demand” failures
– Operating failures the “Beta” value is 0.0235
– Demand failures the “Beta” value is 0.047
HOW THE BETA MODEL APPROACH WORKS
JS
C S
&M
A A
naly
sis
Bra
nch
45
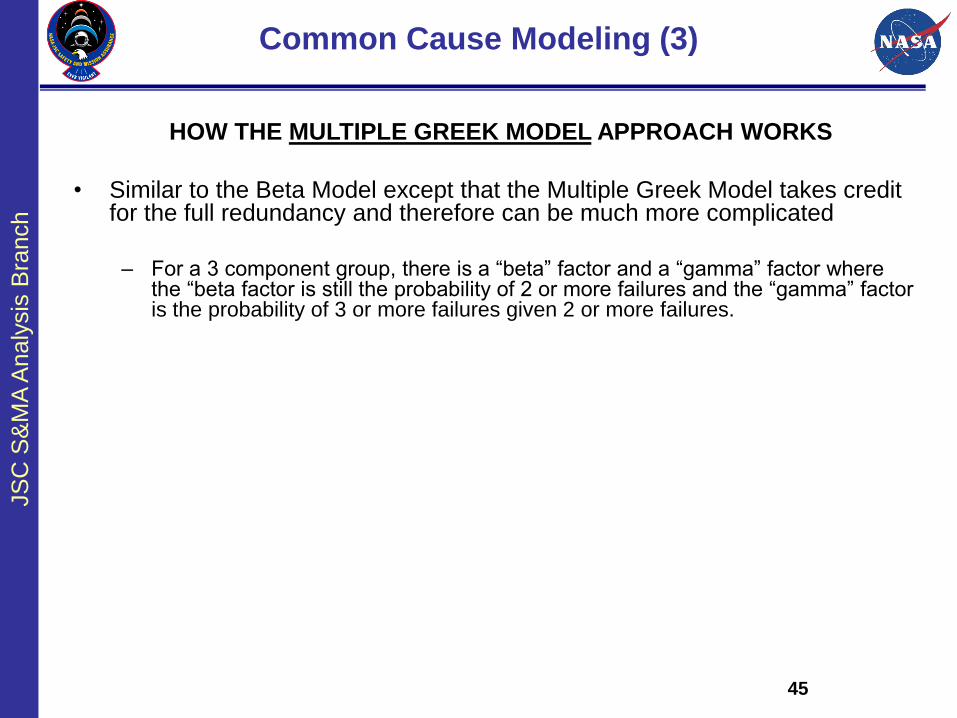
Common Cause Modeling (3)
HOW THE MULTIPLE GREEK MODEL APPROACH WORKS
• Similar to the Beta Model except that the Multiple Greek Model takes credit for the full redundancy and therefore can be much more complicated
– For a 3 component group, there is a “beta” factor and a “gamma” factor where the “beta factor is still the probability of 2 or more failures and the “gamma” factor is the probability of 3 or more failures given 2 or more failures.
JS
C S
&M
A A
naly
sis
Bra
nch
46
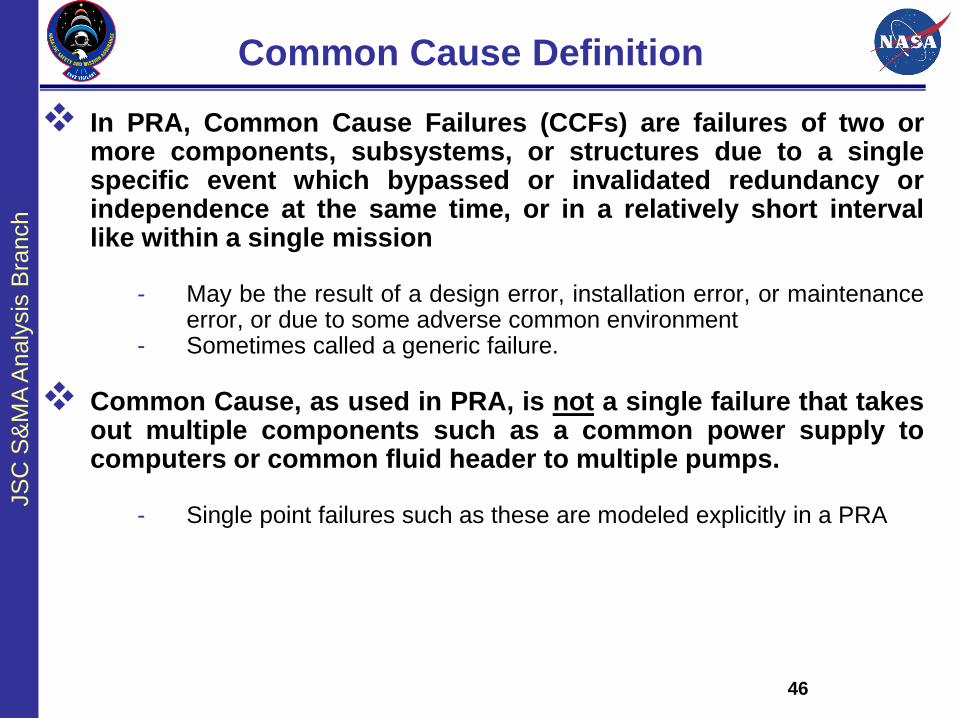
Common Cause Definition
In PRA, Common Cause Failures (CCFs) are failures of two ormore components, subsystems, or structures due to a singlespecific event which bypassed or invalidated redundancy orindependence at the same time, or in a relatively short intervallike within a single mission
- May be the result of a design error, installation error, or maintenanceerror, or due to some adverse common environment
- Sometimes called a generic failure.
Common Cause, as used in PRA, is not a single failure that takesout multiple components such as a common power supply tocomputers or common fluid header to multiple pumps.
- Single point failures such as these are modeled explicitly in a PRA
JS
C S
&M
A A
naly
sis
Bra
nch
47
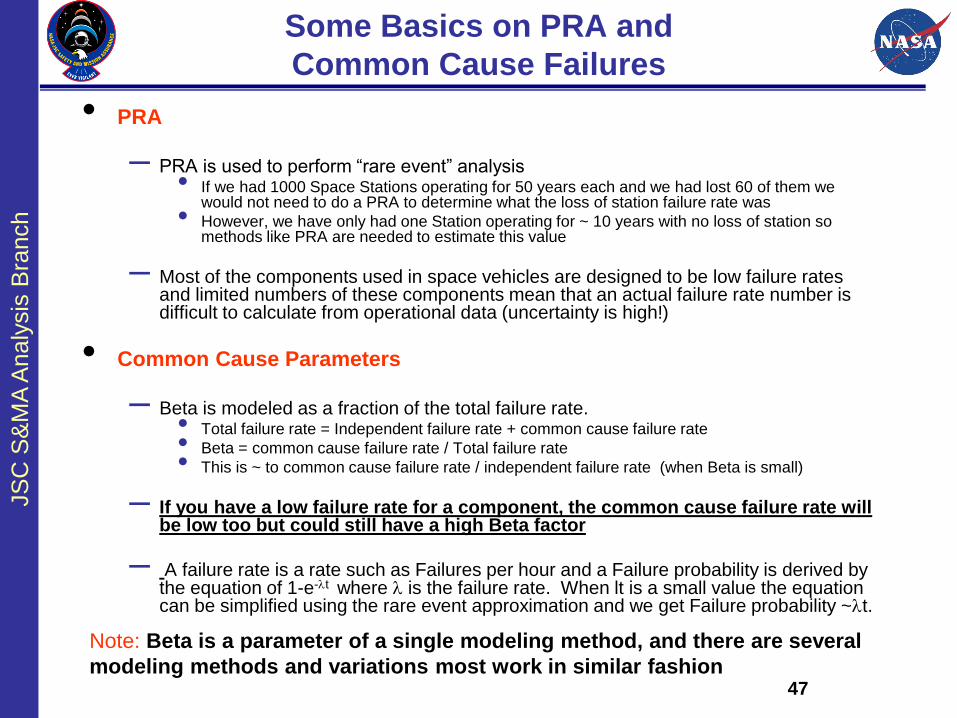
Some Basics on PRA and
Common Cause Failures
• PRA
– PRA is used to perform “rare event” analysis• If we had 1000 Space Stations operating for 50 years each and we had lost 60 of them we
would not need to do a PRA to determine what the loss of station failure rate was
• However, we have only had one Station operating for ~ 10 years with no loss of station so methods like PRA are needed to estimate this value
– Most of the components used in space vehicles are designed to be low failure rates and limited numbers of these components mean that an actual failure rate number is difficult to calculate from operational data (uncertainty is high!)
• Common Cause Parameters
– Beta is modeled as a fraction of the total failure rate.• Total failure rate = Independent failure rate + common cause failure rate
• Beta = common cause failure rate / Total failure rate
• This is ~ to common cause failure rate / independent failure rate (when Beta is small)
– If you have a low failure rate for a component, the common cause failure rate will be low too but could still have a high Beta factor
– A failure rate is a rate such as Failures per hour and a Failure probability is derived by the equation of 1-e-lt where l is the failure rate. When lt is a small value the equation can be simplified using the rare event approximation and we get Failure probability ~lt.
Note: Beta is a parameter of a single modeling method, and there are several
modeling methods and variations most work in similar fashion
JS
C S
&M
A A
naly
sis
Bra
nch
48
Types Of Common Cause Models
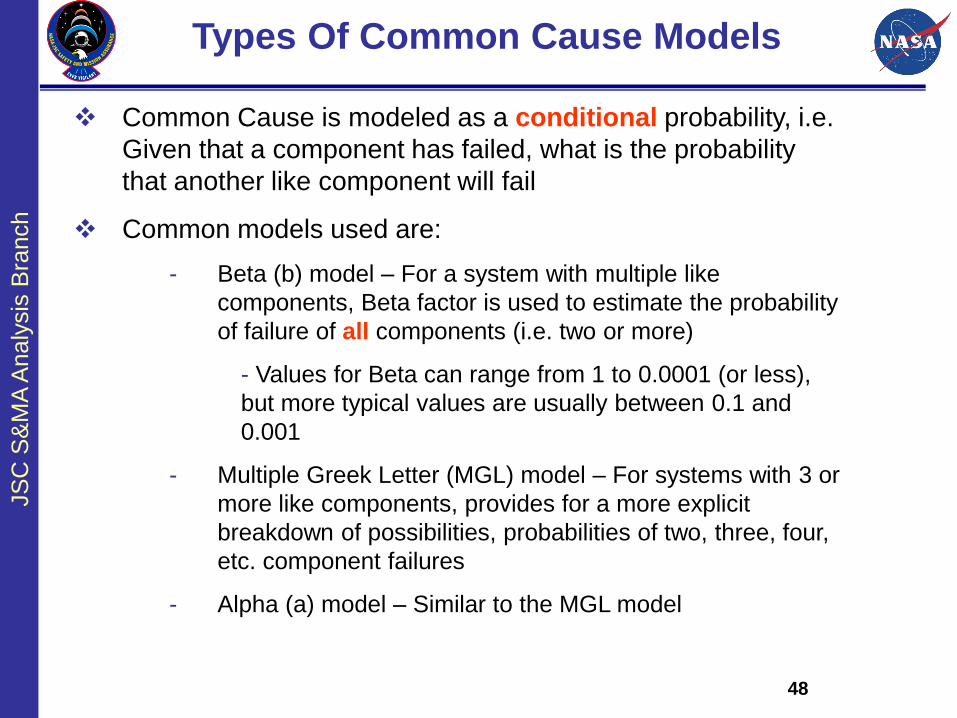
Common Cause is modeled as a conditional probability, i.e.
Given that a component has failed, what is the probability
that another like component will fail
Common models used are:
- Beta (b) model – For a system with multiple like
components, Beta factor is used to estimate the probability
of failure of all components (i.e. two or more)
- Values for Beta can range from 1 to 0.0001 (or less),
but more typical values are usually between 0.1 and
0.001
- Multiple Greek Letter (MGL) model – For systems with 3 or
more like components, provides for a more explicit
breakdown of possibilities, probabilities of two, three, four,
etc. component failures
- Alpha (a) model – Similar to the MGL model
JS
C S
&M
A A
naly
sis
Bra
nch
49
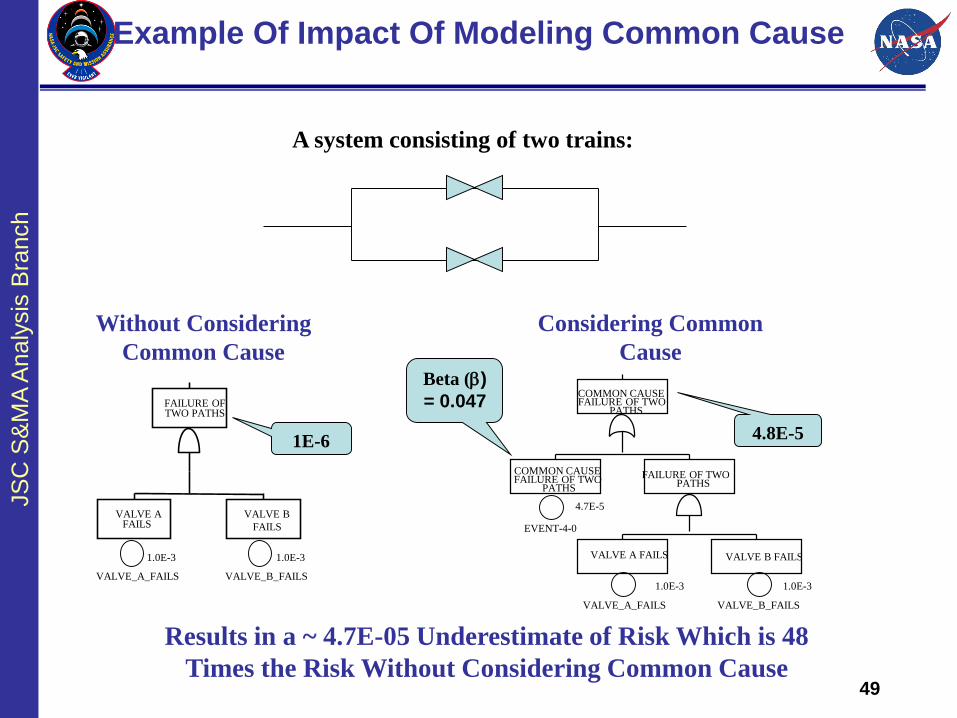
Example Of Impact Of Modeling Common Cause
A system consisting of two trains:
1.0E-3
VALVE_A_FAILS
1.0E-3
VALVE_B_FAILS
FAILURE OFTWO PATHS
VALVE AFAILS
VALVE B
FAILS
1E-6
4.7E-5
EVENT-4-0
1.0E-3
VALVE_A_FAILS
1.0E-3
VALVE_B_FAILS
COMMON CAUSEFAILURE OF TWO
PATHS
FAILURE OF TWOPATHS
VALVE B FAILSVALVE A FAILS
COMMON CAUSEFAILURE OF TWO
PATHS
4.8E-5
Without Considering
Common Cause
Considering Common
Cause
Results in a ~ 4.7E-05 Underestimate of Risk Which is 48
Times the Risk Without Considering Common Cause
Beta (b)
= 0.047
JS
C S
&M
A A
naly
sis
Bra
nch
50
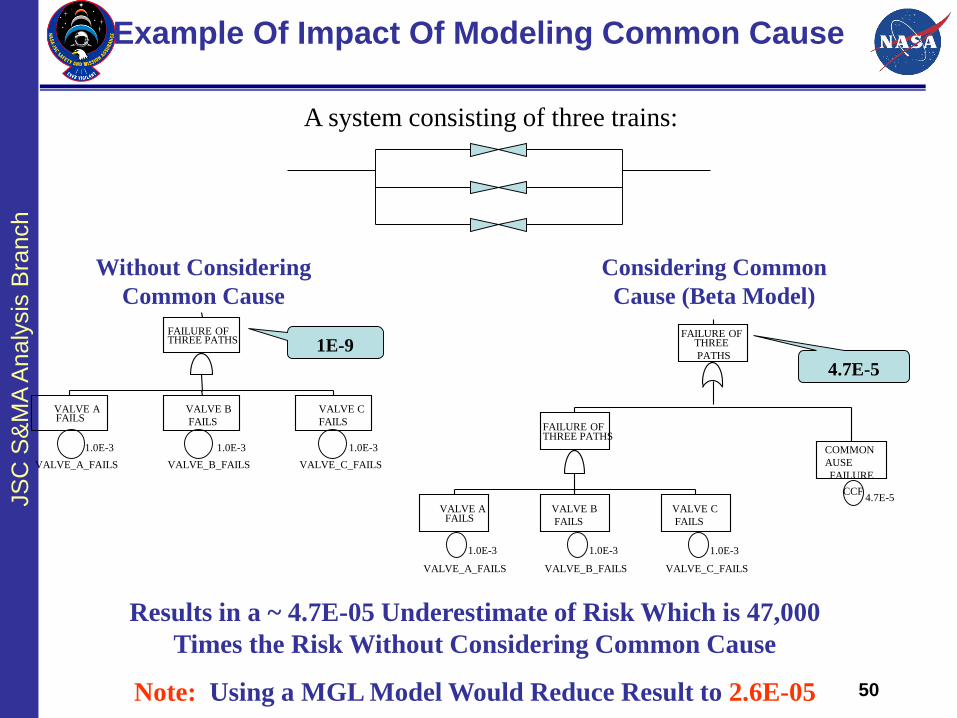
1E-9
A system consisting of three trains:
1.0E-3
VALVE_C_FAILS
1.0E-3
VALVE_A_FAILS
1.0E-3
VALVE_B_FAILS
FAILURE OFTHREE PATHS
VALVE AFAILS
VALVE B
FAILS
VALVE C
FAILS
Example Of Impact Of Modeling Common Cause
Without Considering
Common Cause
4.7E-5CCF
1.0E-3
VALVE_C_FAILS
1.0E-3
VALVE_A_FAILS
1.0E-3
VALVE_B_FAILS
FAILURE OFTHREE PATHS
VALVE AFAILS
VALVE B
FAILS
VALVE C
FAILS
COMMON
AUSE
FAILURE
FAILURE OFTHREE
PATHS
4.7E-5
Considering Common
Cause (Beta Model)
Results in a ~ 4.7E-05 Underestimate of Risk Which is 47,000
Times the Risk Without Considering Common Cause
Note: Using a MGL Model Would Reduce Result to 2.6E-05
JS
C S
&M
A A
naly
sis
Bra
nch
When Should You Do a PRA?
• As early in the design process as you can in order to
affect the design and corresponding risk with
minimal cost impact (i.e. to support Risk Informed
Design (RID))
• When the risk of losing the project is greater than
the company can live with either due to loss of life or
for environmental or economic reasons
• To support Risk-Informed Decision Making (RIDM)
throughout a project’s life cycle from “formulation to
implementation” or “concept to decommissioning”
May 2016 51
JS
C S
&M
A A
naly
sis
Bra
nch
How much does a PRA cost?
• As you can also ask, “How much will it cost to not
do a PRA?”
• The cost of a PRA is a function of the level of detail
desired as well as the size/complexity of the item
being assessed and the mission life cycle
– You should only model to the level of detail that you have data
and no further. You may identify that significant risk exists at a
sublevel, then your PRA is telling you that you need to study that
level further. It may not be a PRA, but a reliability assessment at
that time.
– Modeling a drilling rig is on a different scale than just the Blowout
Preventer (BOP). However, understanding the need for a BOP
can be important in its design and operation.
May 2016 52
JS
C S
&M
A A
naly
sis
Bra
nch
Absolute vs Relative Risk?
• You may have heard, “Don’t believe the absolute risk estimate,
just the relative ranking”.
• Each event in a PRA is assessed to having a probability of
failure (since the PRA is performed in “failure space”).
– these failures are combined via the failure logic which is used to
determine how they are combined and the resulting scenarios.
– the failure probabilities of each event are used to establish the
probability of each scenario thus ranks the scenarios as well as being
added to produce the overall risk.
– If different approaches and methods are used (which sometimes are
needed in full scope PRAs), then the absolutes can be challenged and
so may their rankings. This is where experienced PRA analysts earn
their pay to help minimize the difference.
• As a result, some decision makers or risk takers want to know
the overall risk, while others want to know how to reduce it by
working on the top risk drivers first.
May 2016 53