Embed Size (px)
Citation preview
Probabilistic Methods forTargeted Advertising
Max Chickering
Microsoft Research
Outline
• Targeted Mailing
To whom should you send a solicitation?
• Targeted Advertising on the Web
How should you display banner ads to maximize click-through?
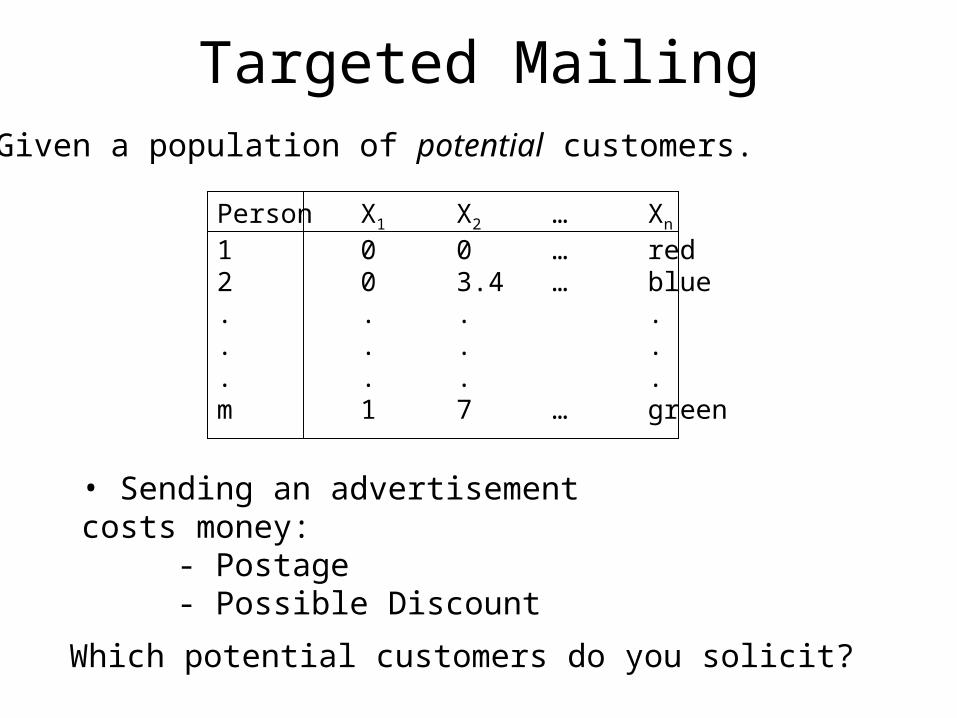
Targeted Mailing• Given a population of potential customers.
Person X1 X2 … Xn
1 0 0 … red2 0 3.4 … blue. . . .. . . .. . . .m 1 7 … green
• Sending an advertisement costs money:
- Postage- Possible Discount
Which potential customers do you solicit?
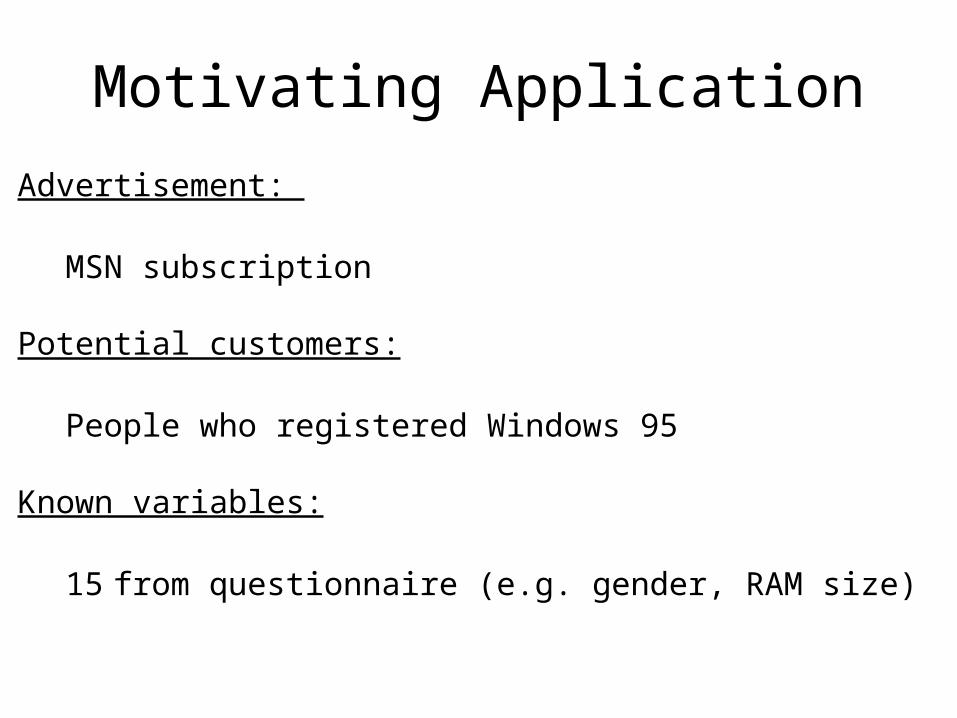
Motivating Application
Advertisement:
MSN subscription
Potential customers:
People who registered Windows 95
Known variables:
15 from questionnaire (e.g. gender, RAM size)
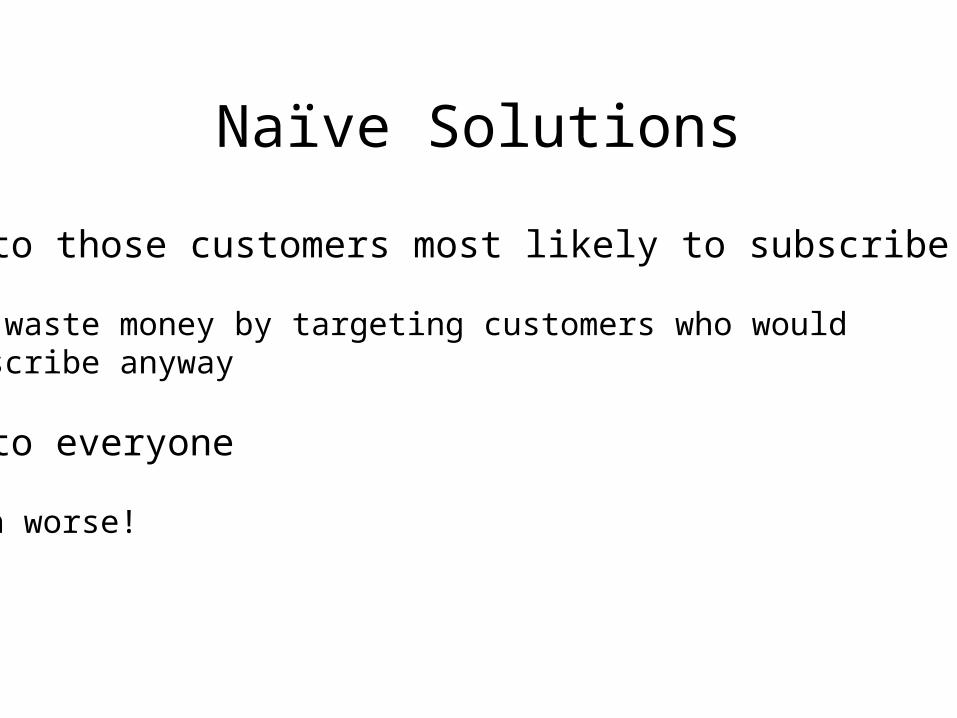
Naïve Solutions
• Mail to those customers most likely to subscribe to MSN
Can waste money by targeting customers who wouldsubscribe anyway
• Mail to everyone
Even worse!
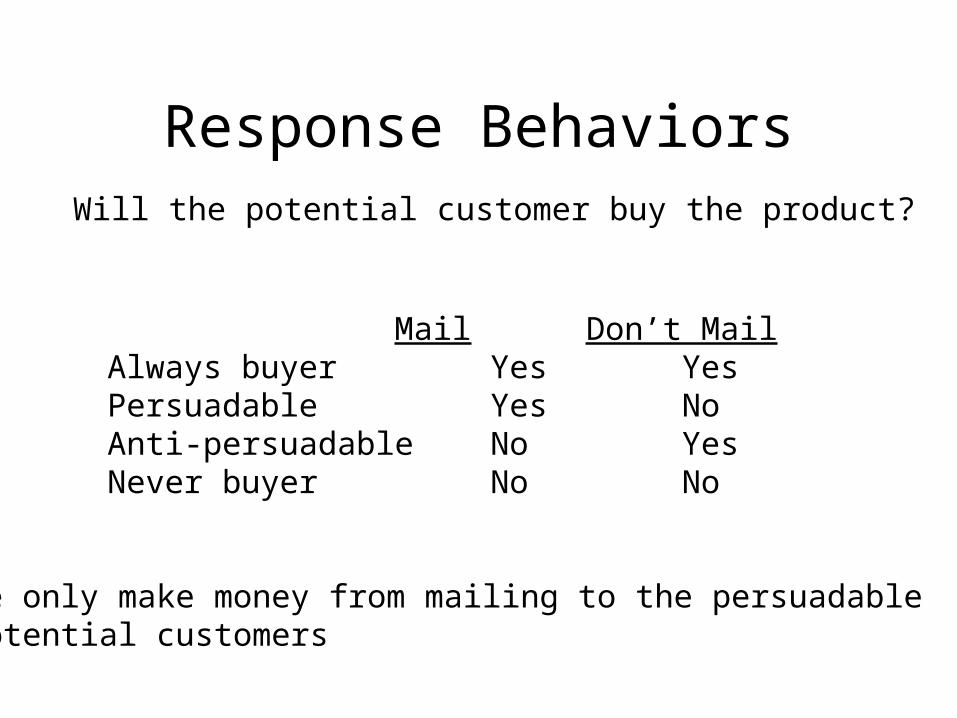
Response Behaviors
Mail Don’t Mail Always buyer Yes YesPersuadable Yes NoAnti-persuadable No YesNever buyer No No
Will the potential customer buy the product?
We only make money from mailing to the persuadablepotential customers
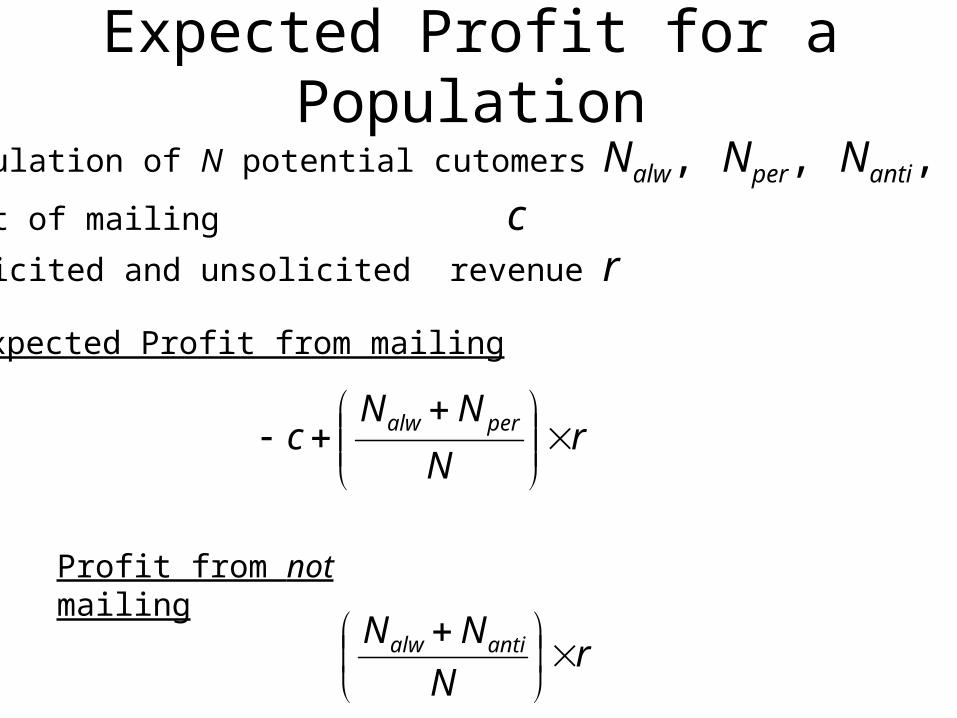
Expected Profit for a Population
Population of N potential cutomers Nalw, Nper, Nanti, Nnev
Cost of mailing cSolicited and unsolicited revenue r
Expected Profit from mailing
rN
NNc peralw
rN
NN antialw
Profit from not mailing
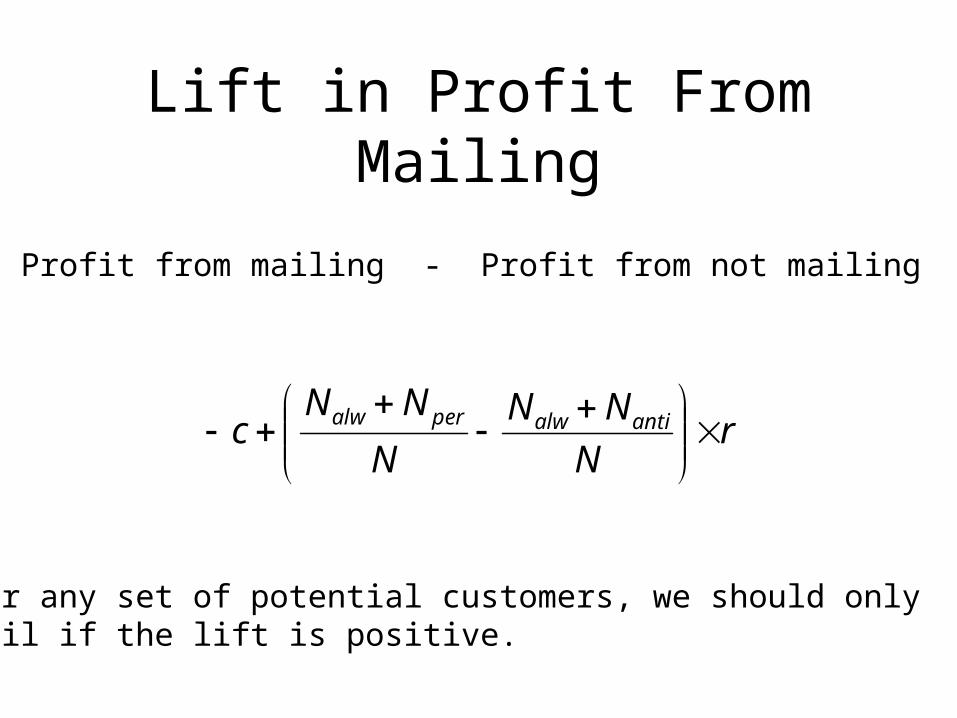
Lift in Profit From Mailing
Profit from mailing - Profit from not mailing
rN
NN
N
NNc antialwperalw
For any set of potential customers, we should onlymail if the lift is positive.
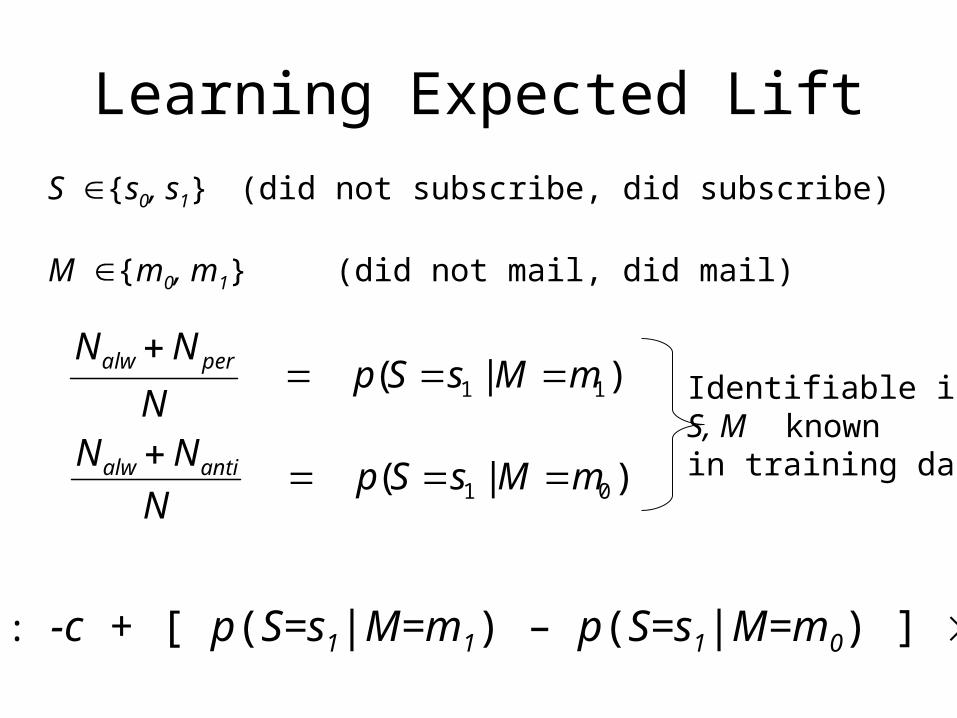
Learning Expected Lift
S {s0, s1} (did not subscribe, did subscribe)
M {m0, m1} (did not mail, did mail)
)|( 11 mMsSpN
NN peralw
)|( 01 mMsSpN
NN antialw
Identifiable ifS, M known in training data
Lift : -c + [ p(S=s1|M=m1) – p(S=s1|M=m0) ] r
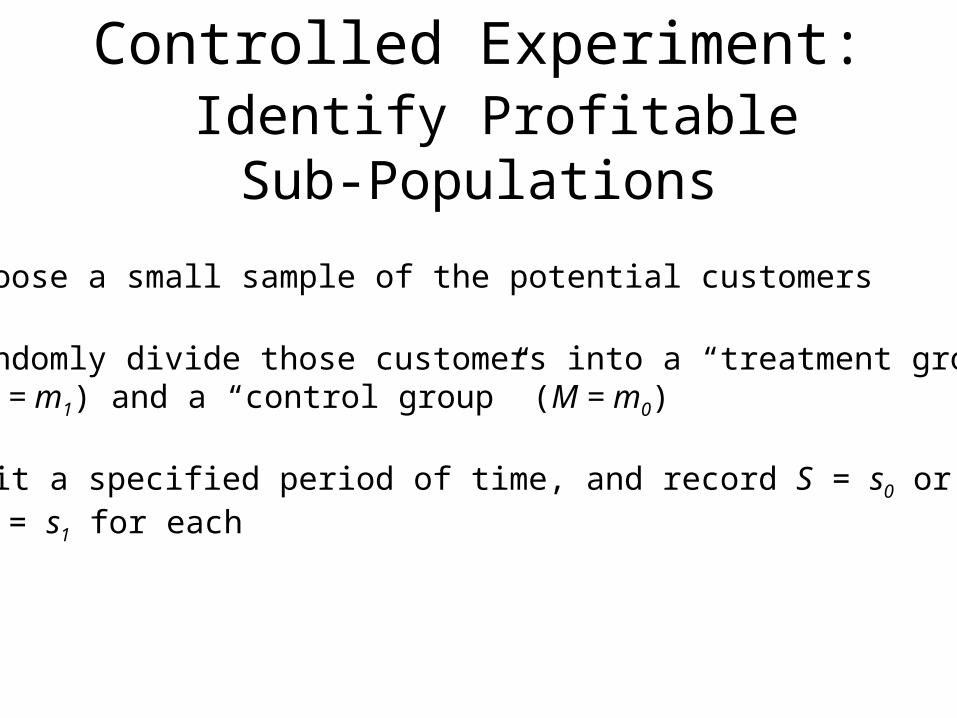
Controlled Experiment: Identify Profitable Sub-Populations
1. Choose a small sample of the potential customers
2. Randomly divide those customers into a “treatment group” (M = m1) and a “control group” (M = m0)
3. Wait a specified period of time, and record S = s0 or S = s1 for each
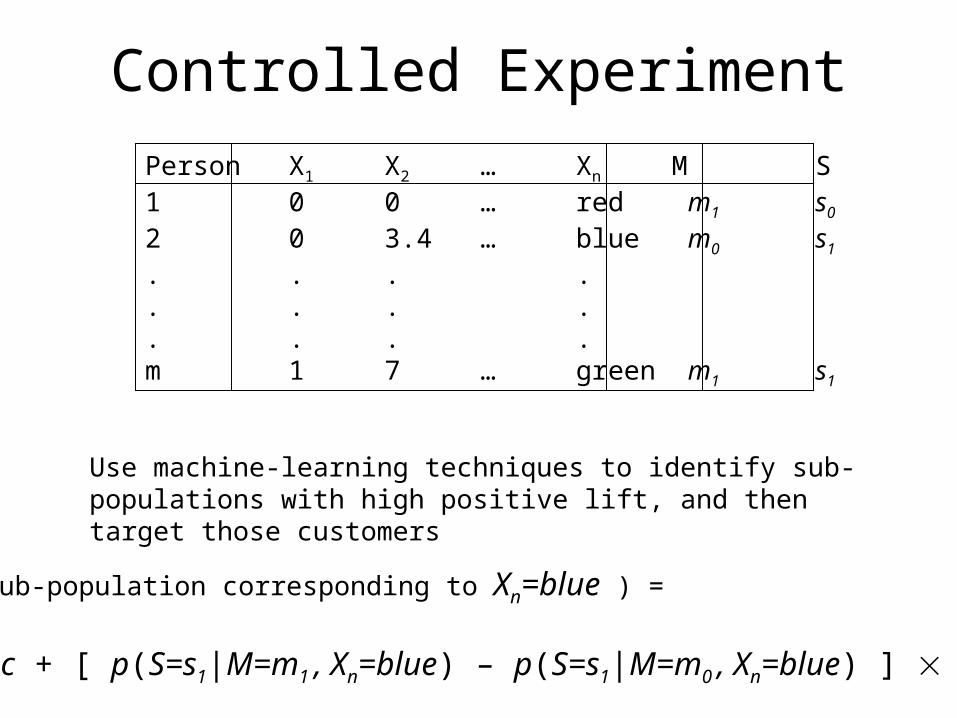
Controlled Experiment
Person X1 X2 … Xn M S1 0 0 … red m1 s0
2 0 3.4 … blue m0 s1
. . . .
. . . .
. . . .m 1 7 … green m1 s1
Use machine-learning techniques to identify sub-populations with high positive lift, and then target those customers
Lift ( Sub-population corresponding to Xn=blue ) =
-c + [ p(S=s1|M=m1 , Xn=blue) – p(S=s1|M=m0 , Xn=blue) ] r
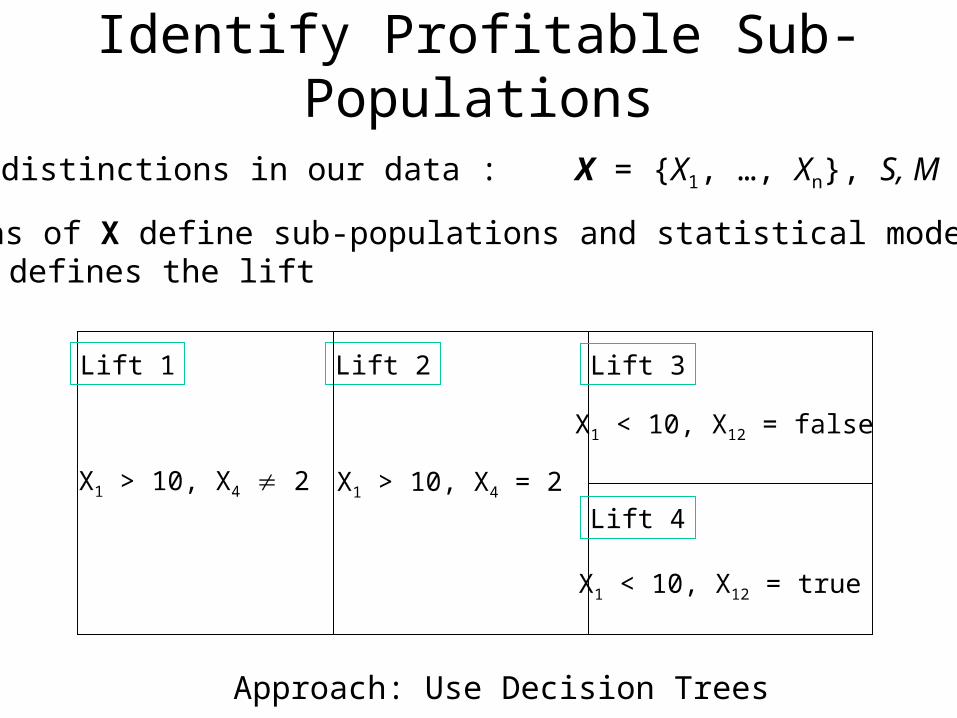
Identify Profitable Sub-Populations
Partitions of X define sub-populations and statistical model for p(S|M,X) defines the lift
Approach: Use Decision Trees
Known distinctions in our data : X = {X1, …, Xn}, S, M
X1 > 10, X4 = 2
X1 < 10, X12 = false
X1 < 10, X12 = true
Lift 2 Lift 3
Lift 4
X1 > 10, X4 2
Lift 1
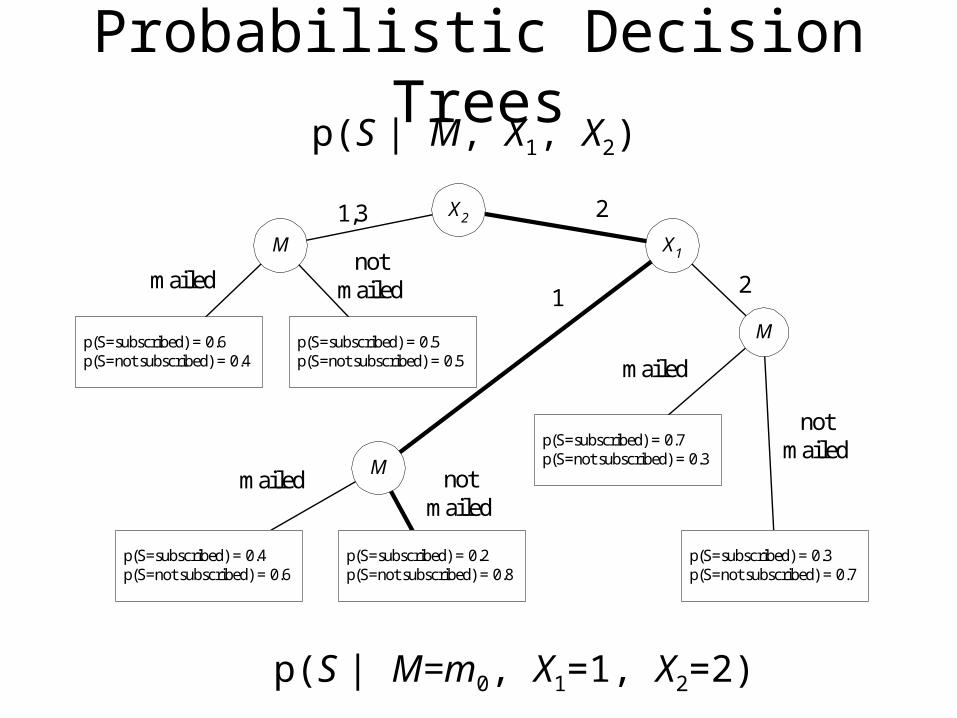
Probabilistic Decision Trees
p(S | M=m0, X1=1, X2=2)
X2
M X1
M
Mp(S=subscribed) = 0.6p(S=not subscribed) = 0.4
21,3
mailednot
mailed 12
p(S=subscribed) = 0.5p(S=not subscribed) = 0.5
p(S=subscribed) = 0.4p(S=not subscribed) = 0.6
p(S=subscribed) = 0.2p(S=not subscribed) = 0.8
mailed notmailed
mailed
notmailedp(S=subscribed) = 0.7
p(S=not subscribed) = 0.3
p(S=subscribed) = 0.3p(S=not subscribed) = 0.7
p(S | M, X1, X2)
X2
M X1
M
Mp(S=subscribed) = 0.6p(S=not subscribed) = 0.4
21,3
mailednot
mailed 1 2
p(S=subscribed) = 0.5p(S=not subscribed) = 0.5
p(S=subscribed) = 0.4p(S=not subscribed) = 0.6
p(S=subscribed) = 0.2p(S=not subscribed) = 0.8
mailed notmailed
mailed
notmailed
p(S=subscribed) = 0.7p(S=not subscribed) = 0.3
p(S=subscribed) = 0.3p(S=not subscribed) = 0.7
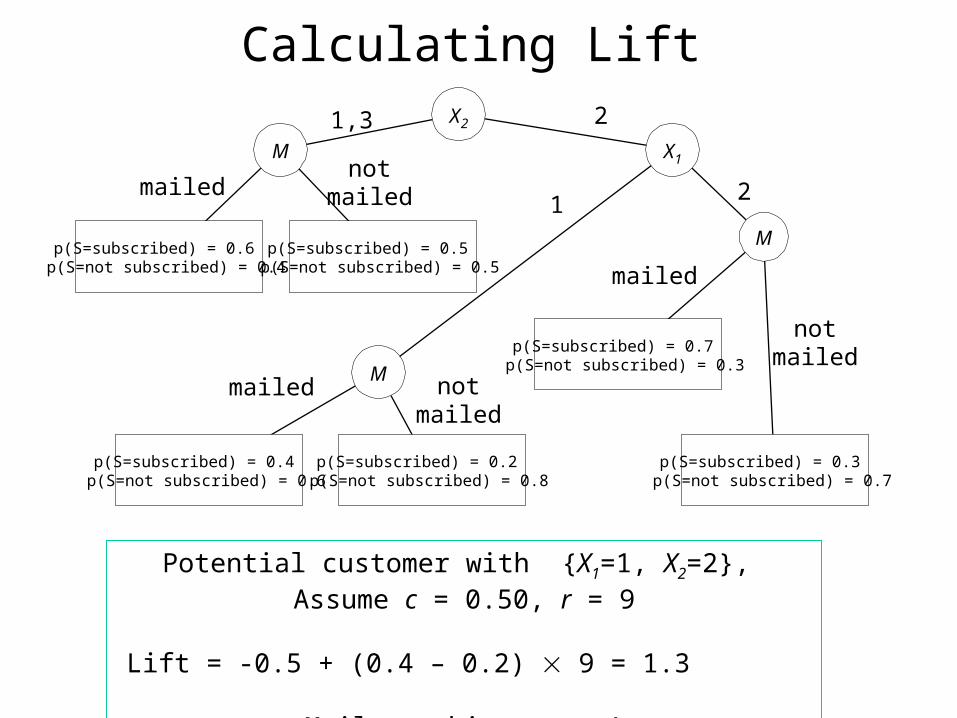
Calculating Lift
Potential customer with {X1=1, X2=2}, Assume c = 0.50, r = 9
Lift = -0.5 + (0.4 – 0.2) 9 = 1.3
Mail to this person!
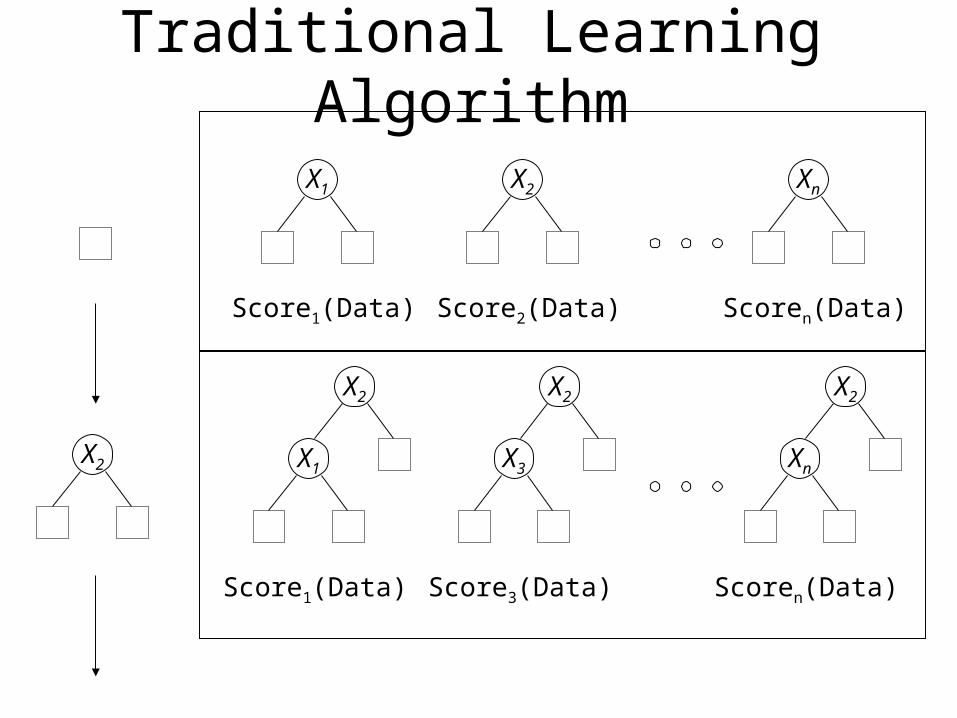
Traditional Learning Algorithm
X1
Score1(Data)
X2
Score2(Data)
Xn
Scoren(Data)
X2
X2
X1
Score1(Data)
X2
X3
Score3(Data)
X2
Xn
Scoren(Data)

Lift-Aware Learning Algorithm
Traditional Learning Algorithm
Identify a tree that represents p(S|M,X) well
Lift-Aware
Would like the tree to be good at modeling the difference:
p(S=s1|M=m1,X=x) - p(S=s1|M=m0,X=x)
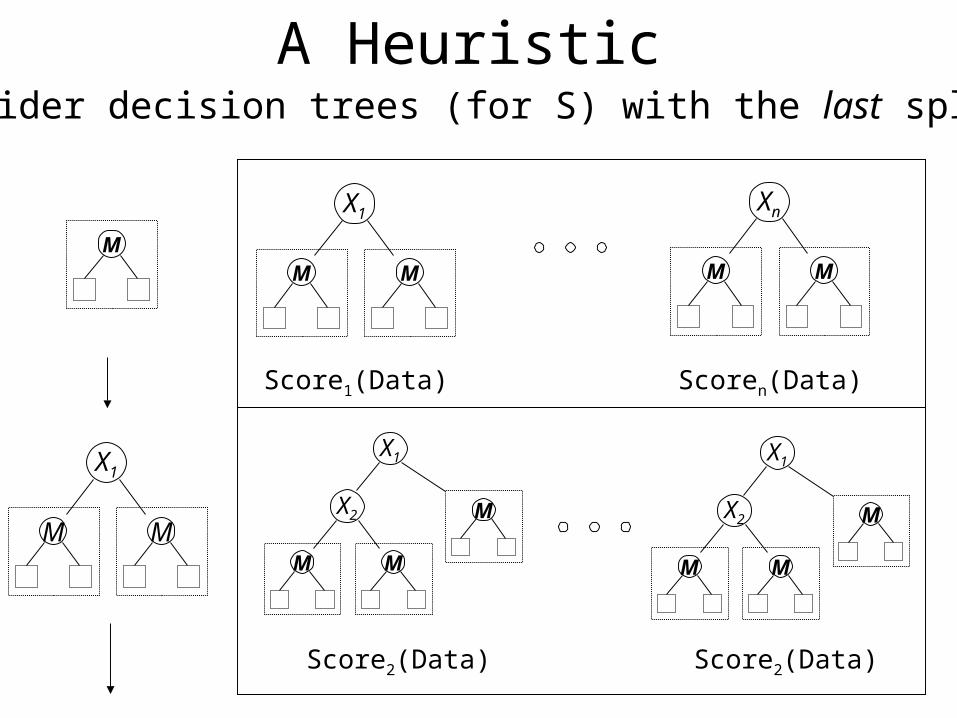
A HeuristicOnly consider decision trees (for S) with the last split on M
M
X1
M M
X1
M M
Score1(Data)
Xn
M M
Scoren(Data)
X1
M
Score2(Data)
X2
M M
X1
M
Score2(Data)
X2
M M
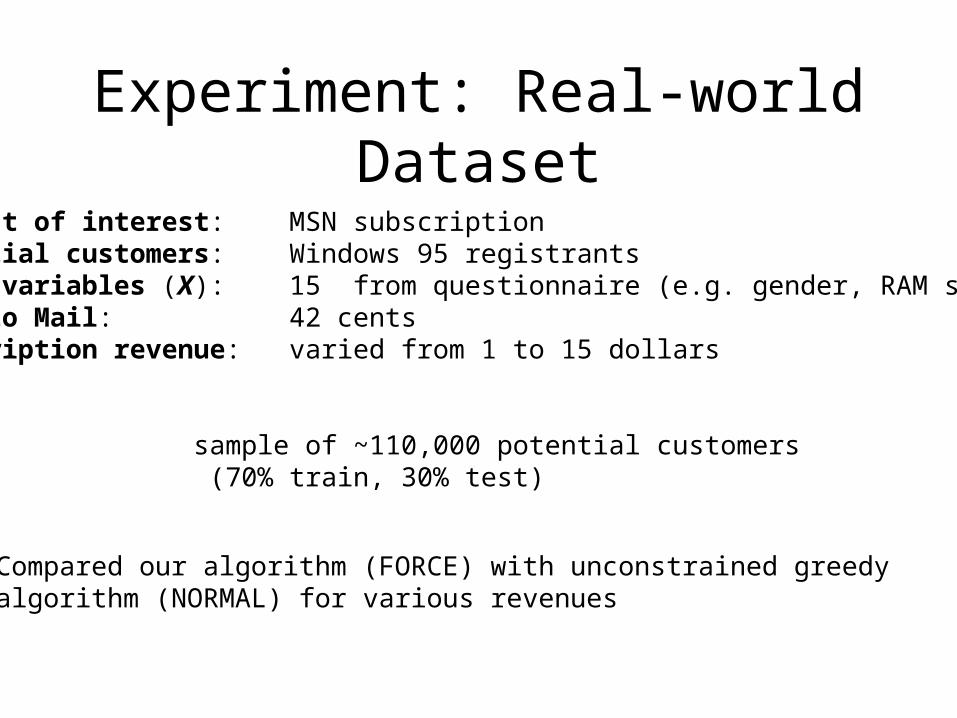
Experiment: Real-world Dataset
Product of interest: MSN subscriptionPotential customers: Windows 95 registrantsKnown variables (X): 15 from questionnaire (e.g. gender, RAM size) Cost to Mail: 42 centsSubscription revenue: varied from 1 to 15 dollars
Data: sample of ~110,000 potential customers (70% train, 30% test)
Compared our algorithm (FORCE) with unconstrained greedyalgorithm (NORMAL) for various revenues
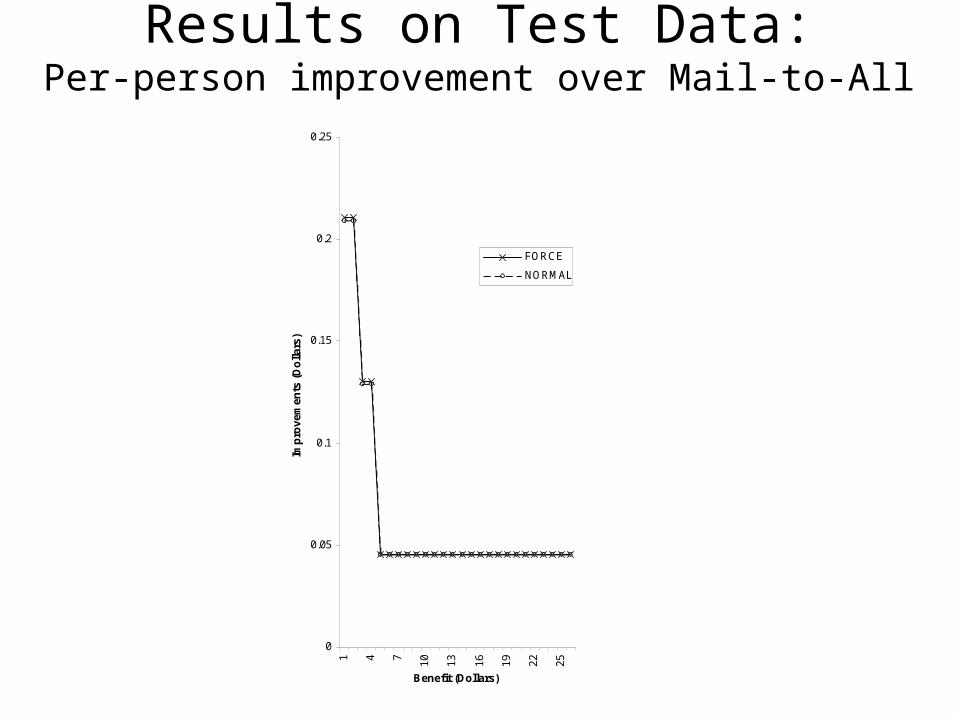
Results on Test Data:Per-person improvement over Mail-to-All
0
0.05
0.1
0.15
0.2
0.25
1 4 7 10 13 16 19 22 25
Benefit (Dollars)
Imp
rove
men
ts (
Do
llars
)
FORCE
NORMAL
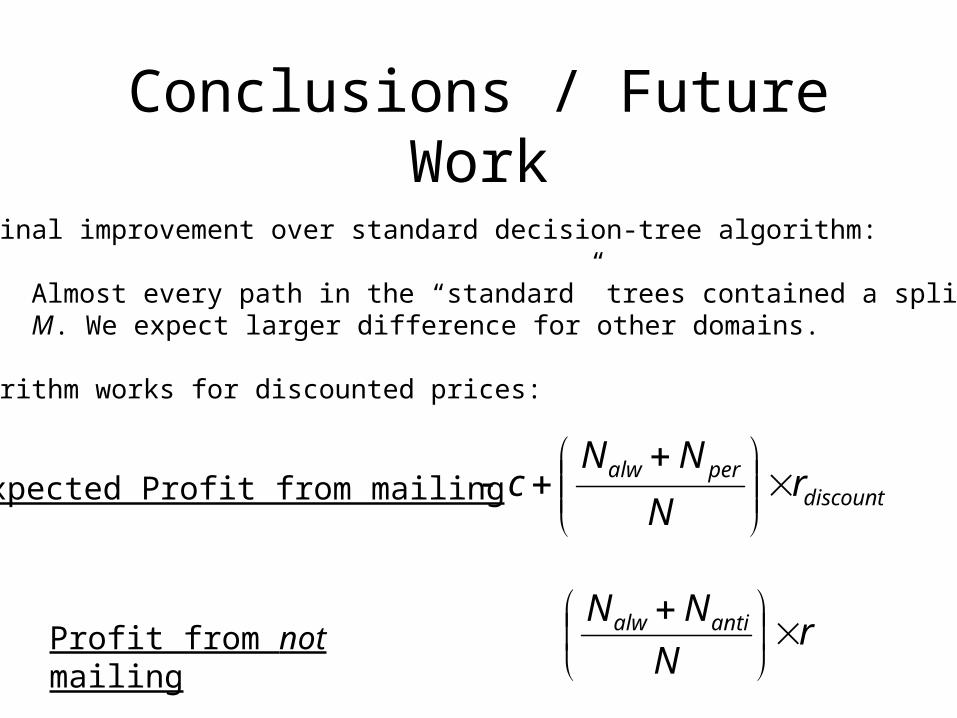
Conclusions / Future Work
Marginal improvement over standard decision-tree algorithm:
Almost every path in the “standard” trees contained a split onM. We expect larger difference for other domains.
Algorithm works for discounted prices:
Expected Profit from mailing discountperalw r
N
NNc
rN
NN antialw
Profit from not mailing
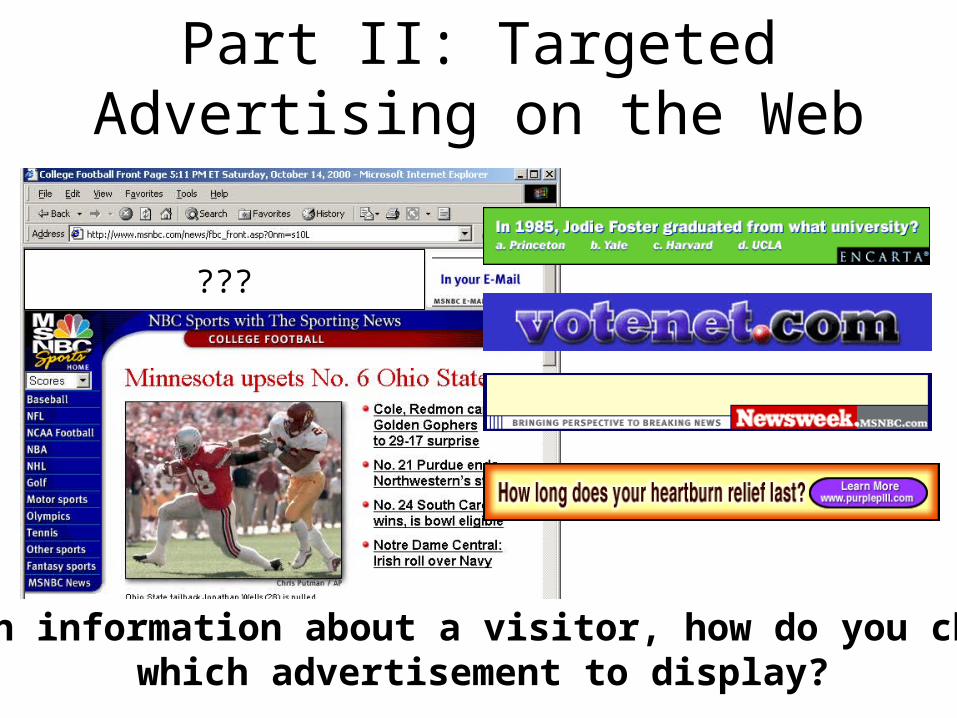
Part II: Targeted Advertising on the Web
Given information about a visitor, how do you choosewhich advertisement to display?
???
Goals of Targeted Advertising
Maximize $$$
• Maximize Clicks
• Brand Presence
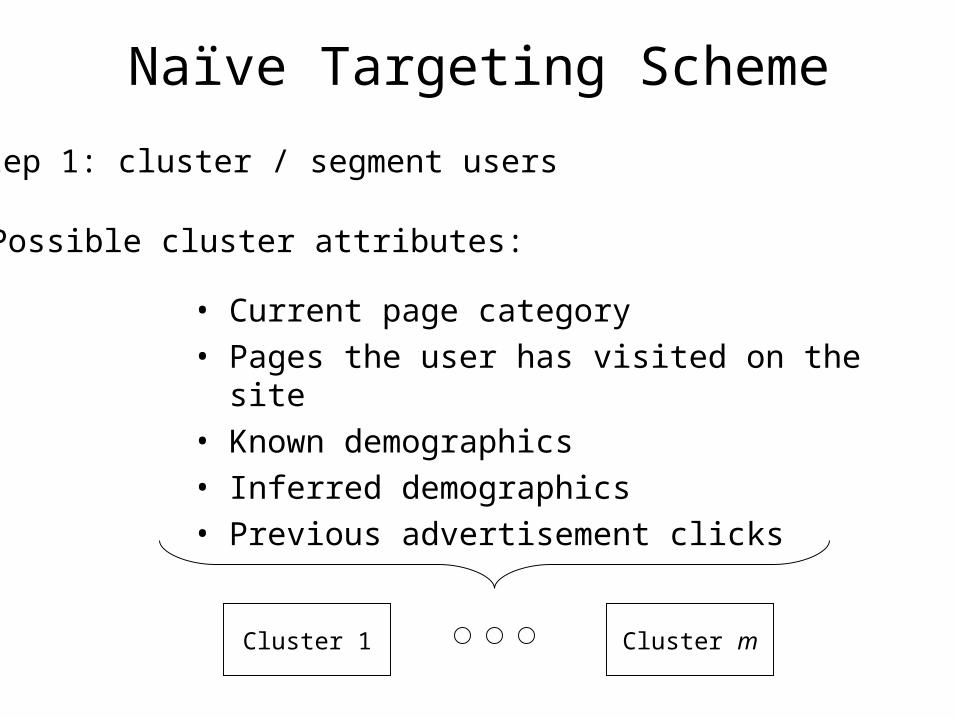
Naïve Targeting Scheme
Possible cluster attributes:
• Current page category
• Pages the user has visited on the site
• Known demographics
• Inferred demographics
• Previous advertisement clicks
Cluster 1 Cluster m
Step 1: cluster / segment users
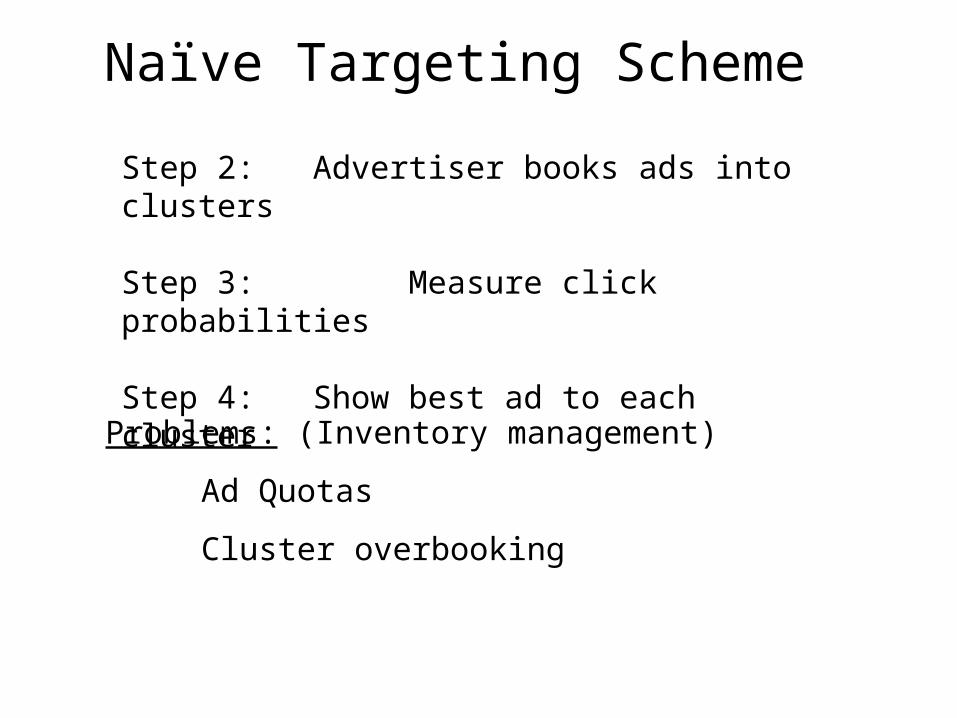
Naïve Targeting Scheme
Step 2: Advertiser books ads into clusters
Step 3: Measure click probabilities
Step 4: Show best ad to each cluster
Problems: (Inventory management)
Ad Quotas
Cluster overbooking
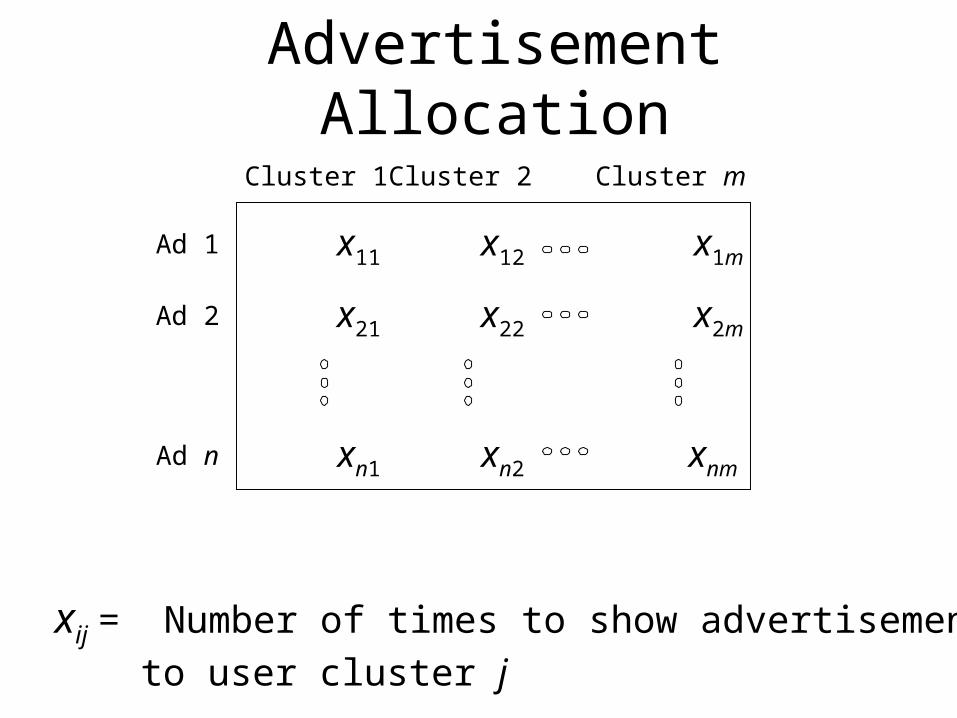
Advertisement Allocation
Cluster 1 Cluster m
Ad 1
Ad 2
Ad n
x11
x21
xn1
x1m
x2m
xnm
Cluster 2
x12
x22
xn2
xij = Number of times to show advertisement i
to user cluster j
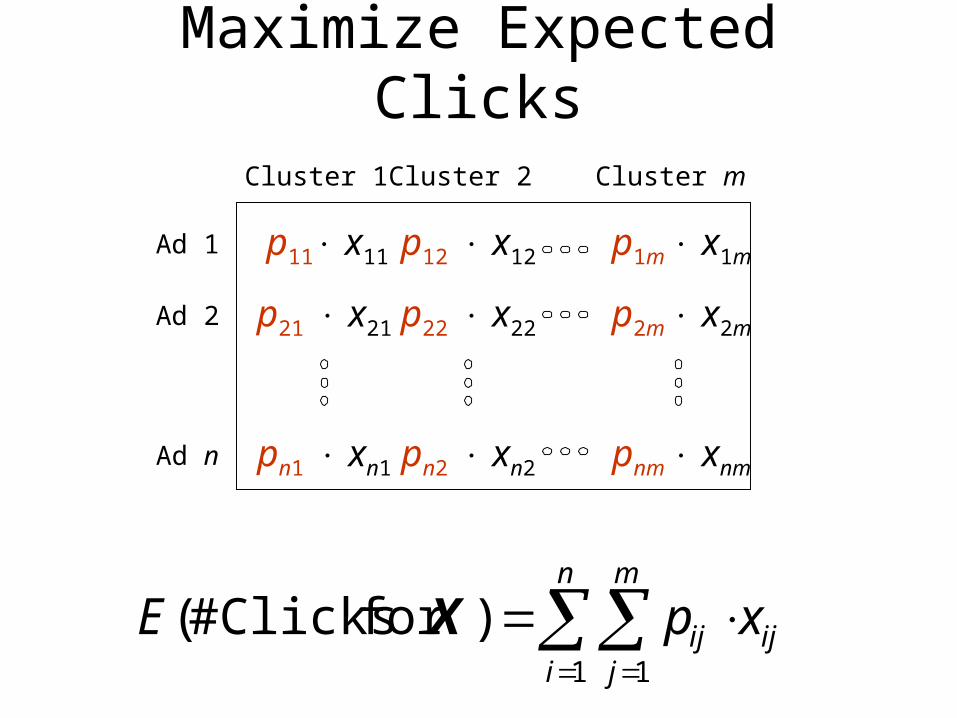
Maximize Expected Clicks
Cluster 1 Cluster m
Ad 1
Ad 2
Ad n
p11 x11
p21 x21
pn1 xn1
p1m x1m
p2m x2m
pnm xnm
Cluster 2
p12 x12
p22 x22
pn2 xn2
n
i
m
jijij xpE
1 1
)for Clicks#( X
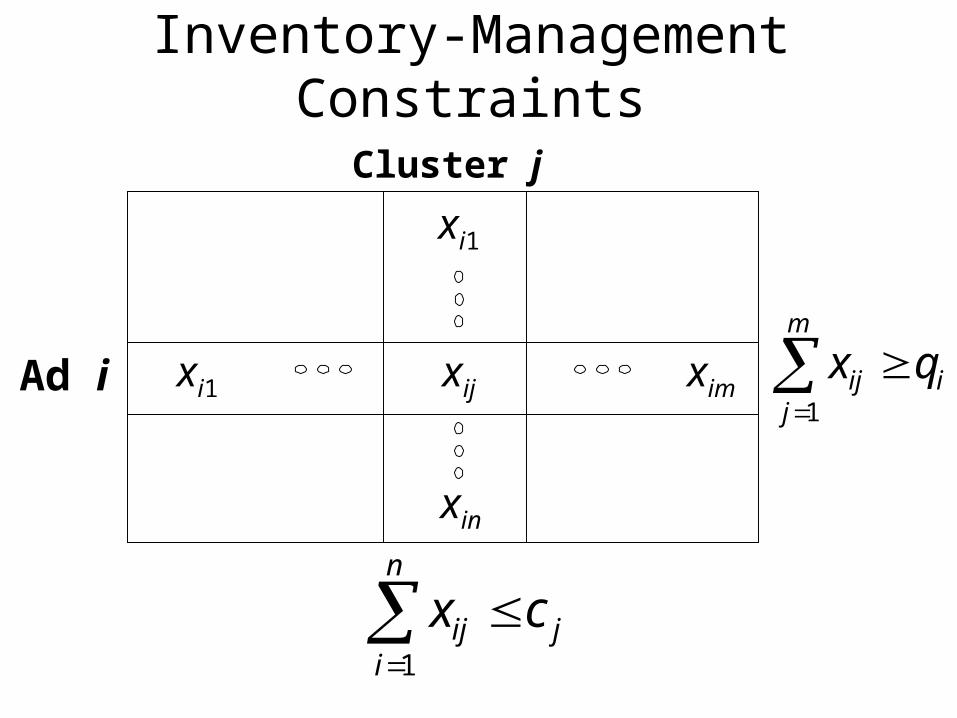
Inventory-Management Constraints
Ad i xi1 xim
Cluster j
xij
xi1
xin
m
jiij qx
1
n
ijij cx
1
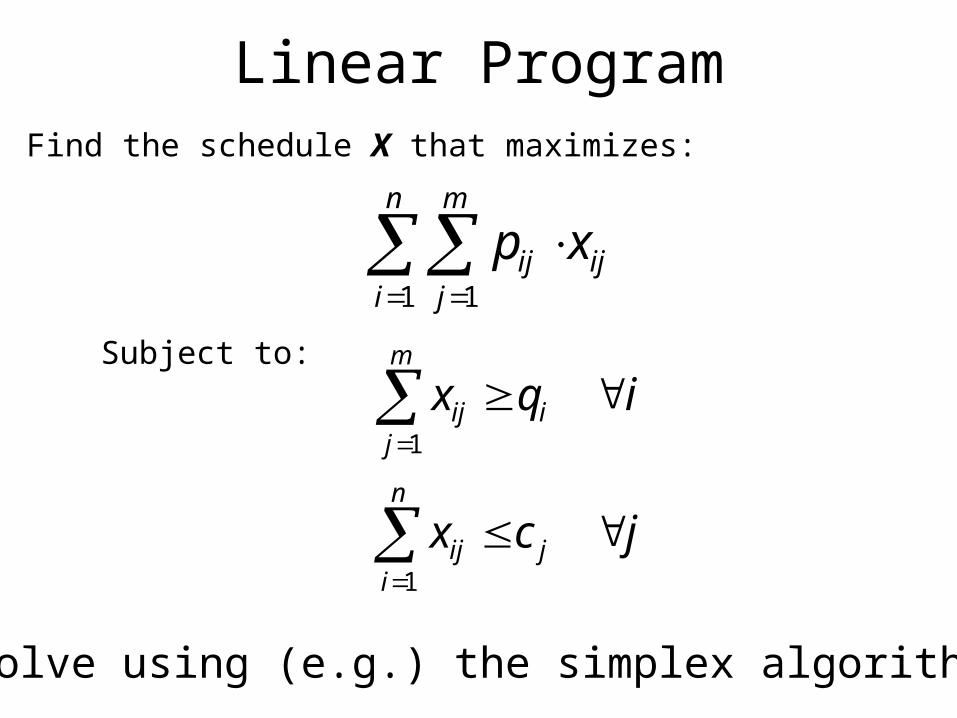
Linear ProgramFind the schedule X that maximizes:
Subject to:
n
i
m
jijij xp
1 1
iqxm
jiij
1
jcxn
ijij
1
Solve using (e.g.) the simplex algorithm
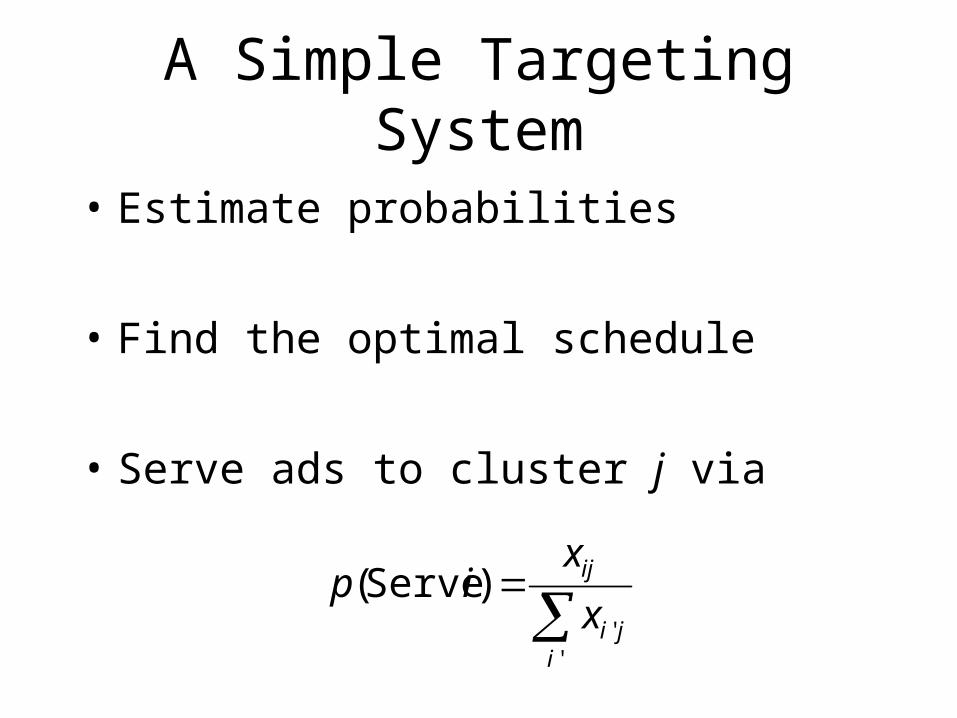
A Simple Targeting System
• Estimate probabilities
• Find the optimal schedule
• Serve ads to cluster j via
''
) Serve(
iji
ij
x
xip
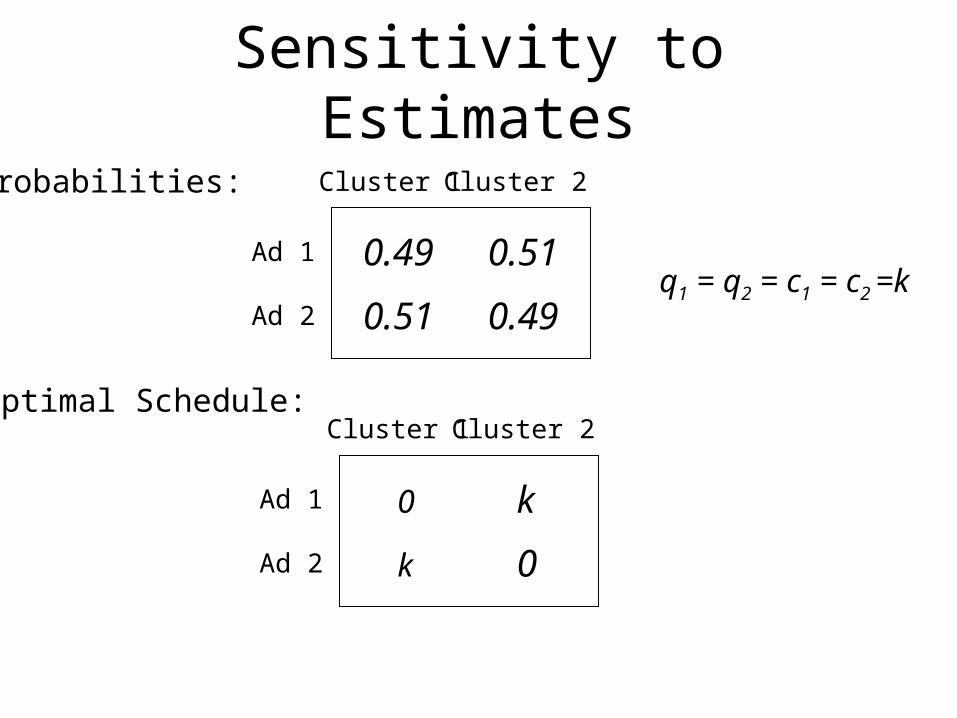
Sensitivity to Estimates
Cluster 1
Ad 1
Ad 2
0.49
0.51
Cluster 2
0.51
0.49q1 = q2 = c1 = c2 =k
Cluster 1
Ad 1
Ad 2
0
k
Cluster 2
k
0
Probabilities:
Optimal Schedule:
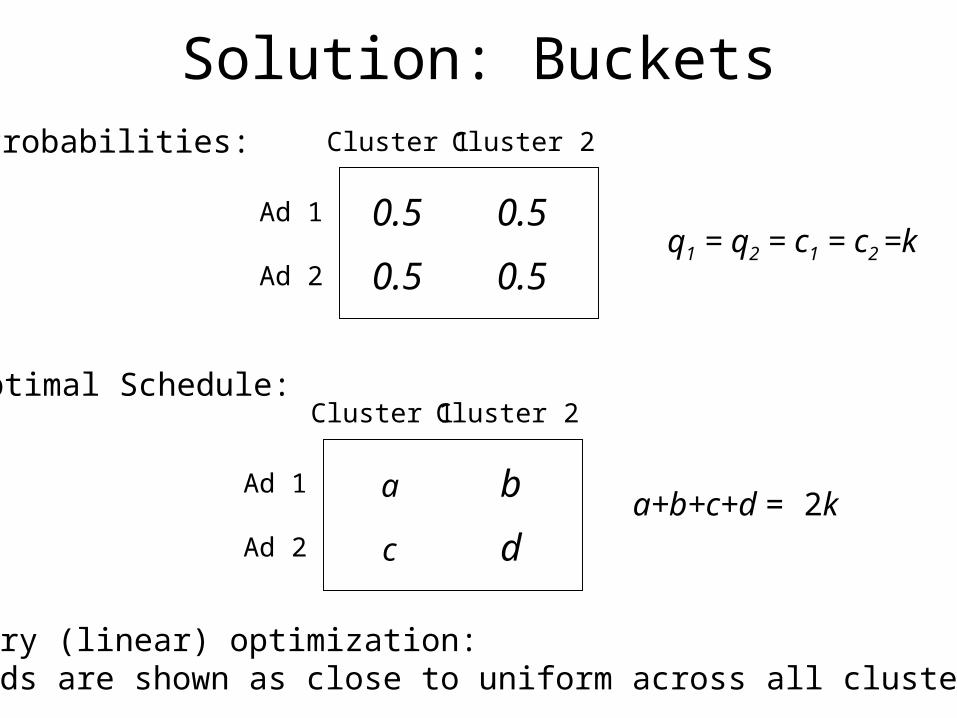
Solution: BucketsCluster 1
Ad 1
Ad 2
0.5
0.5
Cluster 2
0.5
0.5q1 = q2 = c1 = c2 =k
Cluster 1
Ad 1
Ad 2
a
c
Cluster 2
b
d
Probabilities:
Optimal Schedule:
a+b+c+d = 2k
Secondary (linear) optimization: Ads are shown as close to uniform across all clusters
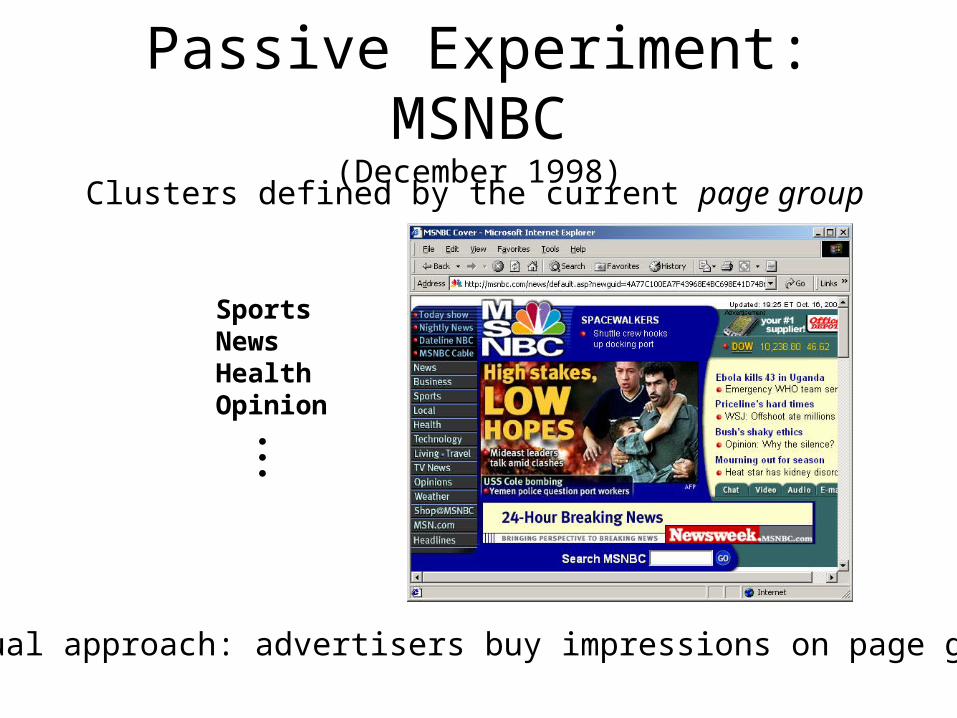
Passive Experiment: MSNBC(December 1998)
SportsNewsHealthOpinion
Clusters defined by the current page group
Manual approach: advertisers buy impressions on page groups
~20 clusters~500 advertisements~1.6 million impressions / day
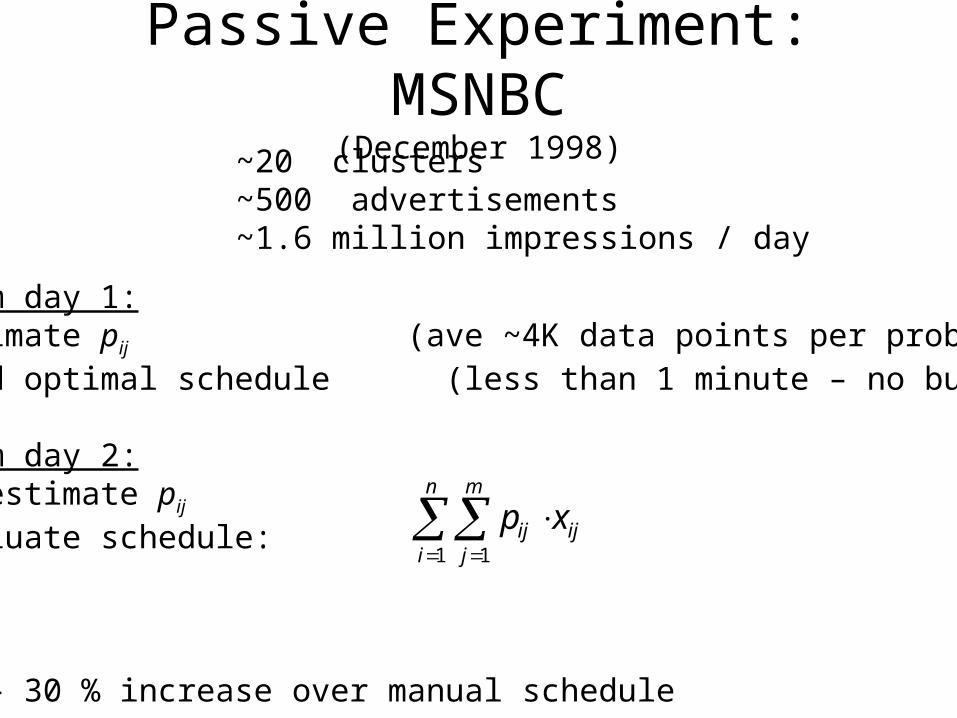
Passive Experiment: MSNBC(December 1998)
Data from day 1:Estimate pij (ave ~4K data points per probability)Find optimal schedule (less than 1 minute – no buckets)
Data from day 2:Re-estimate pij
Evaluate schedule:
Result:
20 – 30 % increase over manual schedule
n
i
m
jijij xp
1 1
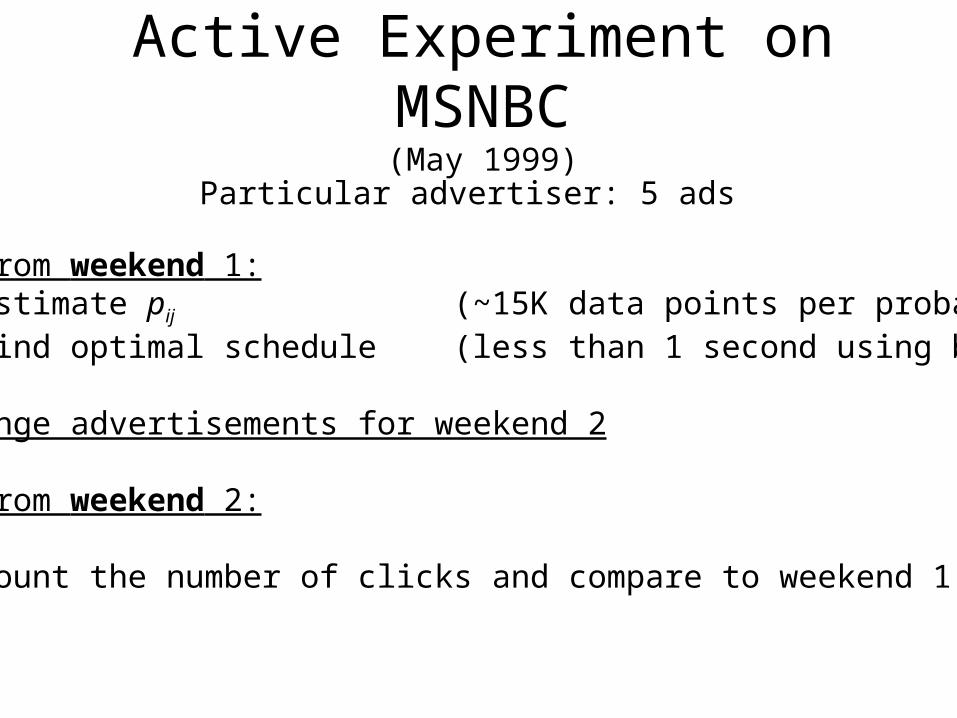
Particular advertiser: 5 ads
Data from weekend 1:Estimate pij (~15K data points per probability)Find optimal schedule (less than 1 second using buckets)
Rearrange advertisements for weekend 2
Data from weekend 2:
Count the number of clicks and compare to weekend 1
Active Experiment on MSNBC(May 1999)
0
advertiser control
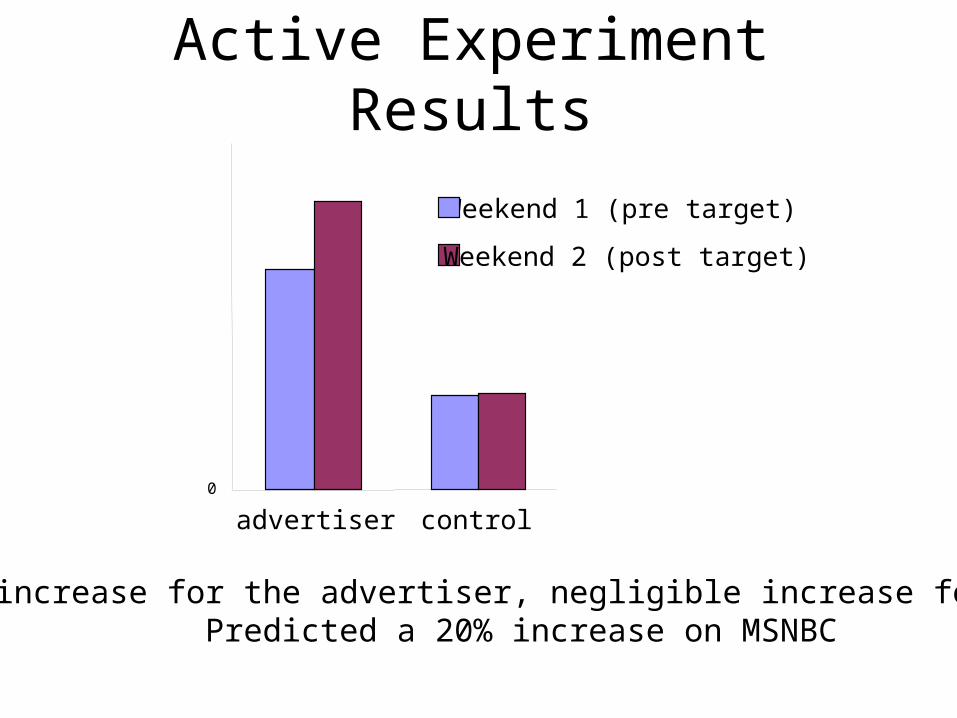
Weekend 1 (pre target)
Weekend 2 (post target)
30% increase for the advertiser, negligible increase for othersPredicted a 20% increase on MSNBC
Active Experiment Results
Extensions
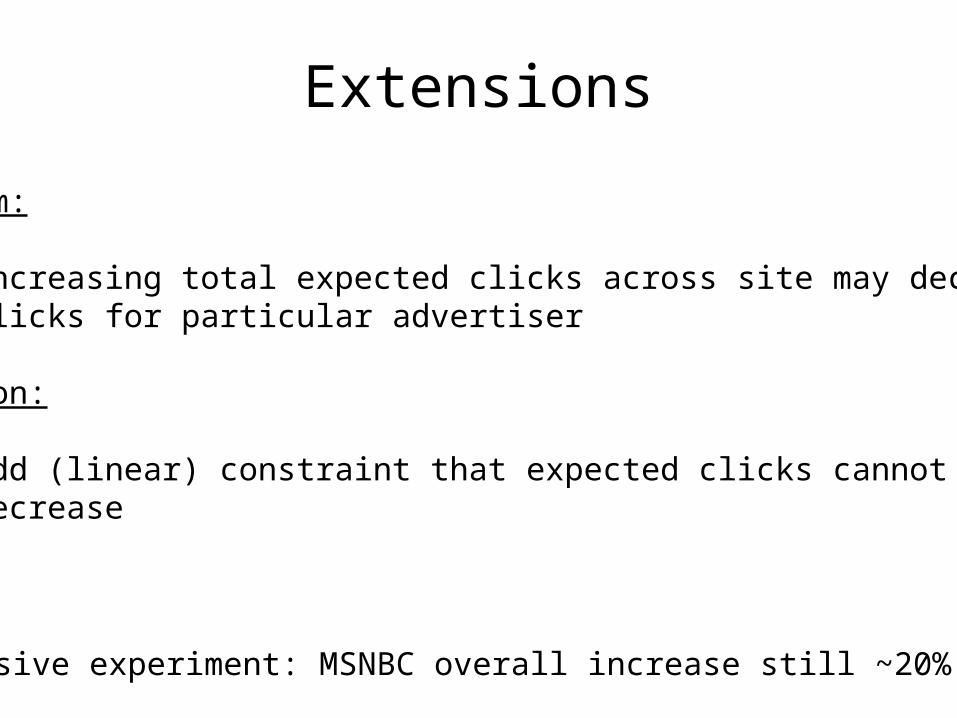
Problem:
Increasing total expected clicks across site may decrease clicks for particular advertiser
Solution:
Add (linear) constraint that expected clicks cannotdecrease
Passive experiment: MSNBC overall increase still ~20%
Extensions
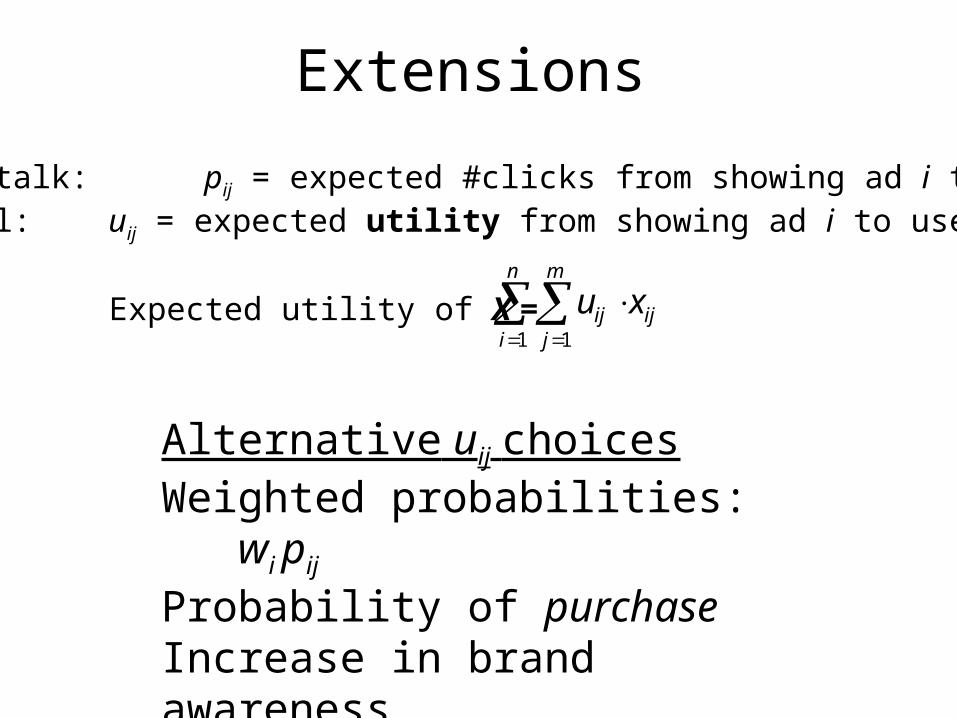
Focus of talk: pij = expected #clicks from showing ad i to user jIn general: uij = expected utility from showing ad i to user j
Expected utility of X =
n
i
m
jijij xu
1 1
Alternative uij choicesWeighted probabilities: wi pij
Probability of purchaseIncrease in brand awarenessExpected revenue

My Home Page
http://research.microsoft.com/~dmax/

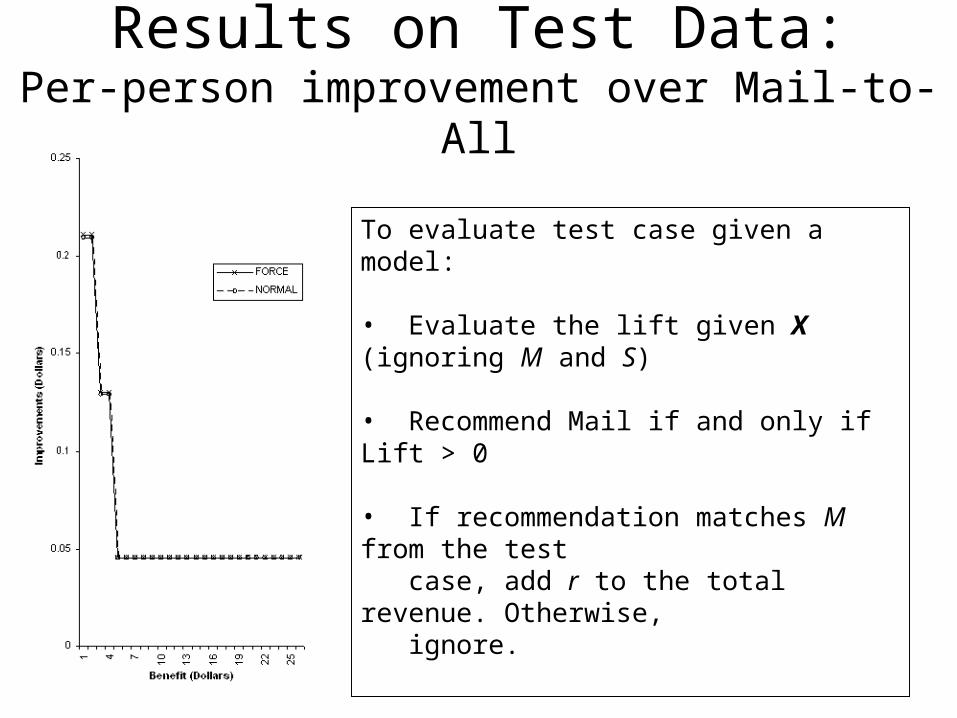
Results on Test Data:Per-person improvement over Mail-to-All
To evaluate test case given a model:
• Evaluate the lift given X (ignoring M and S)
• Recommend Mail if and only if Lift > 0
• If recommendation matches M from the test case, add r to the total revenue. Otherwise, ignore.