Embed Size (px)
Citation preview
Journal of Constructional Steel Research 64 (2008) 156–166www.elsevier.com/locate/jcsr
Probabilistic fatigue analysis of shop and field treated tubular truss bridges
Scott Walbridgea,∗, Alain Nussbaumerb
a Department of Civil and Environmental Engineering, University of Waterloo, 200 University Avenue West, Waterloo, Ontario, Canada, N2L 3G1b Swiss Federal Institute of Technology (EPFL), Steel Structures Laboratory (ICOM), Building GC B3 - Office 505, Station 18, Lausanne, CH – 1015, Switzerland
Received 2 January 2007; accepted 8 June 2007
Abstract
This article examines the extent to which post-weld treatment by needle peening can improve the fatigue performance of tubular truss bridges.To do this, the various potential crack sites on several variants of a typical bridge are analyzed using a probabilistic, fracture mechanics-basedmodel. Systems reliability theory is then used to determine the reliability of the entire untreated or treated bridge. The results of this work showthat: considering phase effects may result in large reductions in the design stress ranges for these structures, a significant increase in the treatmentbenefit can be achieved if the treatment is applied after the dead load stresses are introduced, and weld root cracking does not appear to be thecritical failure mode for these structures, so long as a strategy of partial treatment is employed.c© 2007 Elsevier Ltd. All rights reserved.
Keywords: Tubular truss bridges; Fatigue; Post-weld treatment; Needle peening; Probabilistic fracture mechanics
1. Introduction
Bridges consisting of steel tubes welded together to formtruss girders have seen increasing popularity in recent years[1–3]. This trend can be explained by the aesthetic merit ofthese structures and by recent improvements in the cuttingand fabrication techniques for tubular structures [4]. Recentresearch has been conducted to improve our understandingof the fatigue behaviour of tubular bridge joints in view ofthe significant differences in loading, scale, and geometry thatexist between these joints and the more widely studied tubularjoints common to offshore applications [4]. With this improvedunderstanding, the search can now begin for ways of improvingthe fatigue performance of tubular bridge joints, in view of thesignificant negative impact that this performance is known tohave on the economic viability of these structures.
Two ways of improving the fatigue performance of tubulartruss bridges have been considered in recent studies: replacingthe directly welded joints with cast steel nodes [5,6], andimproving the performance of the fatigue-critical weldsby post-weld treatment. In order to investigate the latterpossibility, large-scale tests have been carried out, which
∗ Corresponding author. Tel.: +1 519 888 4567x38066; fax: +1 519 888 4349.E-mail address: [email protected] (S. Walbridge).
0143-974X/$ - see front matter c© 2007 Elsevier Ltd. All rights reserved.doi:10.1016/j.jcsr.2007.06.001
have demonstrated the potential of post-weld treatment byneedle peening for this purpose [4]. Although encouraging,several concerns with the use of residual stress-based treatmentmethods such as needle, hammer, and ultrasonic peening, havelimited the extent to which such findings can be translatedinto practical guidelines. Firstly, concerns exist about thereliability of these methods, in particular under realistic,variable amplitude loading conditions [7]. Secondly, in thelarge-scale tests reported in [4], it was seen that the benefitof concentrated treatment of the critical crack site, althoughsubstantial, was eventually limited by cracking at a less critical,untreated location. In view of these concerns, an analyticalstudy was subsequently initiated to examine the treatment oftubular truss bridges using a probabilistic approach that wouldconsider the actual variable amplitude loading conditions, aswell as the influences of the various potential crack sites or hot-spots (untreated or treated) on the overall fatigue reliability ofthe entire structure [8,9].
Herein, the model developed for this analytical studyis briefly described. A tubular truss bridge with typicaldimensions and loading conditions is then presented. Byanalyzing several variants of this bridge using the developedprobabilistic model, it was thought that the potential benefitof post-weld treatment for improving tubular bridge fatigueperformance could be precisely quantified. Typical results of

S. Walbridge, A. Nussbaumer / Journal of Constructional Steel Research 64 (2008) 156–166 157
Fig. 1. Tubular K -joint and weld toe models.
the analytical study are then presented and used to determinethe treatment benefit for the investigated structure. In addition,a number of related issues are discussed herein including: theeffect of considering or ignoring phase effects in the code-based fatigue design of tubular truss bridges, the effect of thetreatment timing on the treatment benefit (i.e. before or afterthe introduction of the dead load stresses), and the possibilitythat post-weld treatment of the fatigue-critical weld toe willsimply result in a shift of the eventual crack location to theuntreatable weld root. Based on this discussion, a number ofareas are highlighted where further study is needed.
The work presented herein focuses on the post-weldtreatment by needle peening of tubular truss bridges comprisedof CHS members joined by welded, gapped single K -joints (seeFig. 1). However, it is believed that the employed models aresuitable for the fatigue analysis of tubular structures treatedusing any of the above-mentioned residual stress-based post-weld treatment methods.
2. Probabilistic model overview
2.1. Modelling single potential crack sites
The probabilistic model employed in the analyticalstudy presented herein is based on a previously developeddeterministic linear elastic fracture mechanics (LEFM)model [10], modified for the analysis of gapped single circularhollow section (CHS) K -joints (see Fig. 1). The modifiedmodel employs a number of design aids developed by othersto determine the applied stress intensity factor (SIF) rangesat different crack depths for weld toe cracks at the variouspotential crack sites or hot-spots on such joints.
The limit state function, G(z), employed in the probabilisticmodel is founded on the Paris–Erdogan crack growth law,modified to consider crack closure effects and a threshold SIFrange, 1Kth, and integrated over the crack depth range, a0 toac. Specifically:
G(z) = Nc − N =
∫ ac
a0
da
C ·(1K m
eff − 1K mth
) − N (1)
In this expression, N is the actual number of stress cyclesand Nc is the number of cycles to failure. In order toconduct analyses under variable amplitude loading conditions,
Table 1Statistical variables used in probabilistic analysis
Variable µx σx Dist. Units
a0 0.2 0.045 LN mm(a/c)0 0.5 0.16 LN –VARtraffic 1.0 0.15 N –VARdead 1.0 0.10 N –VARDOB 1.0 0.08 N –VARSCF 1.0 0.04 LN –VARMk 1.0 0.05 LN –VARLw 1.0 0.10 N –VARθw 1.0 0.10 N –VARweld 1.0 0.25 N –VARpwt 0.5 0.10 N –LN(C) −28.80 0.55 N LN((mm/cycle) · (N/mm−3/2)m)
1Kth 100.0 15.0 LN MPa√
mmac 0.5 · T – Det. mmfy 355 – Det. MPam 3.0 – Det. –
an equivalent block loading approach is employed (see, forexample: [11]). This approach was found to be superior to usingan equivalent constant amplitude stress range, in particular forthe analysis of the treated crack sites, as discussed in [8].
In Eq. (1) the effective SIF range, 1Keff, is taken as:
1Keff = MAX(Kapp,max − Kop, 0
)− MAX
(Kapp,min − Kop, 0
)(2)
where Kapp,max and Kapp,min are the maximum and minimumSIFs due to the applied load and Kop is the applied SIF at whichthe crack tip opens upon loading. Specifically:
Kop = −(Kres + Kpl
)(3)
where Kres is the SIF due to the residual stresses along thecrack path and Kpl is the crack closure SIF. The uncertaintiesin the input parameters discussed above are considered bytreating these parameters as statistical variables (see Table 1).Of particular interest in this study, the uncertainties in theresidual stress distributions due to the welding and treatmentprocesses, σweld(b) and σpwt(b), are considered using twovariables, VARweld and VARpwt (see Fig. 2), which are assignedattributes based on measurements reported in [10,12,13]. Usingthese variables, the assumed residual stress distribution due to
158 S. Walbridge, A. Nussbaumer / Journal of Constructional Steel Research 64 (2008) 156–166
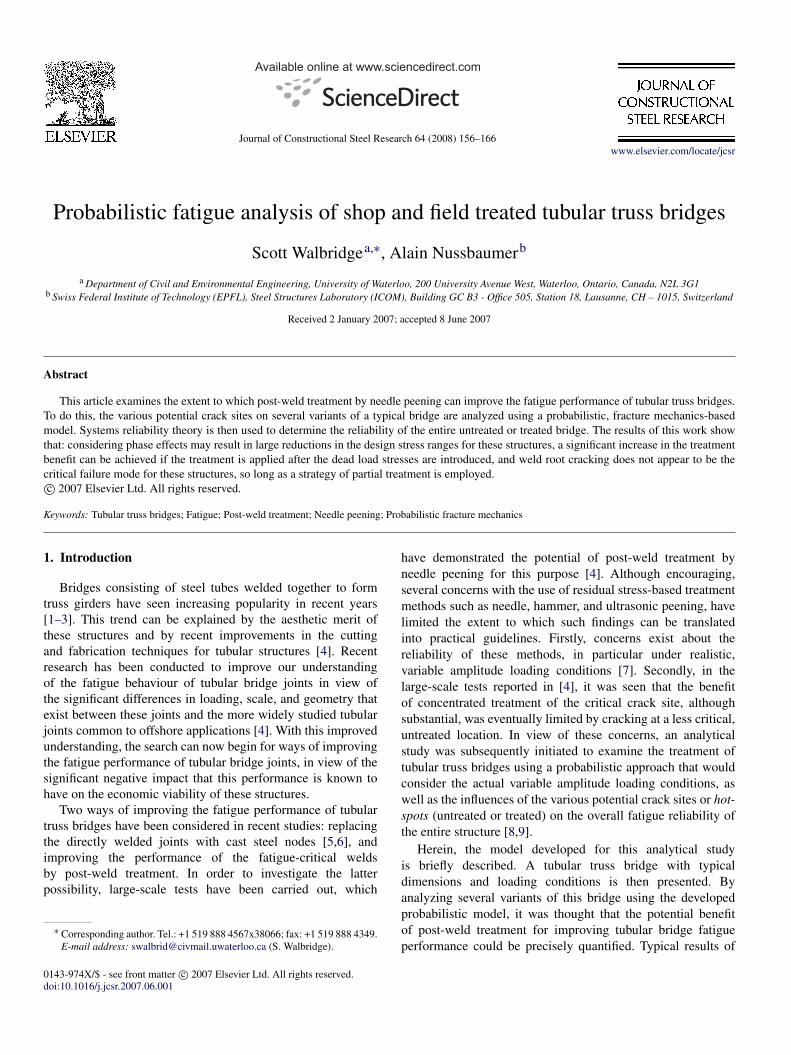
Fig. 2. Residual stresses due to welding (left) and post-weld treatment (right).
the welding process is:
σweld (b) = fy ·
(0.62 + 2.33 · (b/T ) − 24.13 · (b/T )2
+ 42.49 · (b/T )3− 21.09 · (b/T )4
)· VARweld
(4)
where b is the depth below the surface, T is the wall thicknessof the cracked member (t or T in Fig. 1), and fy is the yieldstrength. This is essentially the empirical expression proposedin [12], shifted to represent an average of the measured data,rather than an upper bound, for the case of VARweld = 1.0 [8,9]. The assumed post-weld treatment stress distribution is:
σpwt (b) = − fy ·(VARpwt
)if b ≤ 0.1 · dp
= fy ·((
b/dp)· (5/6) −
(1/12 + VARpwt
))if b > 0.1 · dp (5)
where dp is the imprint diameter of the peening tool (1.5 mmfor needle peening). Kres is calculated for each crack depthincrement using the approach proposed by [14].
To solve Eq. (2), Kapp is determined using the followingexpression from [15]:
Kapp = (Mkm · Ym · (1 − DOB) + Mkb · Yb · DOB)
· σhs,app ·√
π · a (6)
where σhs,app is the applied hot-spot stress, Mkm , Mkb,Ym , and Yb are the magnification and correction fac-tors for the bending (σb) and membrane (σm) stresscases, and DOB is the degree of bending (=σb/(σb +
σm), see Fig. 1). Mkm , Mkb, Ym , Yb, and DOB aredetermined using closed-form equations from [15–17].σhs,app can be calculated for a given peak in the stress history,given the mean applied hot-spot stress level and the hot-spotstress range. The former is determined by adding the hot-spotstress due to the dead load and the mean hot-spot stress dueto the traffic load. The latter is simply taken as the hot-spotstress range due to the traffic load. The uncertainty in the deadload hot-spot stress is considered by multiplying this stress bythe statistical variable VARdead. Uncertainty in the traffic load-ing is considered through the statistical variable VARtraffic, bywhich the hot-spot stress due to the traffic load is multiplied.
The VARtraffic variable takes into account uncertainties in thetrue truck weight distribution, as well as the true traffic volume.Further information regarding the loading model and statisticalparameters can be found in [8].
In order to solve the limit state function in Eq. (1), MonteCarlo Simulation [18] is employed, with a crude importancesampling scheme used to reduce the number of trials necessary.Several studies conducted to validate the model described aboveare presented in [8,9].
2.2. Modelling structures with multiple potential crack sites
In order to determine the probabilities of failure of structurescomprised of tubular K -joints with multiple potential cracksites, lower and upper bound series system reliability modelsare employed. Specifically, it is first assumed that each K -jointin the structure can be modelled as a series system with 16elements, corresponding with each of the hot-spots identifiedin Fig. 1 (note: Hot-spots 2L , 4L , 2R, and 4R each occurtwice.). The lower bound model assumes that the failure eventsassociated with the individual hot-spots are fully independent.The probability of failure of the joint can thus be written asfollows [18]:
p f,joint = 1 −(1 − p f,1L
)·(1 − p f,11L
)· · · · ·
(1 − p f,4R
)(7)
where p f,joint is the probability of joint failure; p f,1L is theprobability of failure of Site 1L , etc. (recall that the reliabilityindex, β = −Φ−1(p f )). The upper bound reliability modelassumes full correlation of the failure events associated witheach potential crack site, and takes the following form [18]:
p f,joint = MAX(
p f,1L , p f,11L , . . . , p f,4R)
(8)
To determine the probabilities of failure of structures withmultiple joints, a similar approach is employed. Note thatthe lower and upper bound reliability models provide upperand lower bound predictions of the probability of failurerespectively (since β increases as p f decreases).
3. Description of investigated bridge structure
Using the probabilistic approach described above, studieswere carried out on a typical, full-scale steel–concrete

S. Walbridge, A. Nussbaumer / Journal of Constructional Steel Research 64 (2008) 156–166 159
Fig. 3. Investigated bridge geometry and Bridge I member sizes.
composite tubular truss bridge under realistic, variableamplitude loading conditions. The geometry of the studiedbridge structure is presented in Fig. 3. A variant of this bridge(Bridge I) was first designed to meet the static strength andserviceability requirements of the Swiss Design Codes (SIA2003) [19]. These codes follow in general the principles of theEurocode for structures (Eurocode 2002) [20].
The resulting member sizes are presented in Fig. 3. Forthis design, the slab was assumed to be 300 mm thick overeach truss, thinning to 250 mm at the edges and centre of thedeck. Reinforcement ratios of 1% and 1.5% were assumed atthe mid-span and over the supports respectively. A modulus ofelasticity ratio (Esteel/Econcrete) of 10 was assumed. The slabwas assumed to be cracked over the supports, meaning that onlythe reinforcement was assumed to contribute to the top chordstiffness in these areas.
A second bridge variant (Bridge V) was then designed for fa-tigue, based on a deterministic, code-based fatigue verificationalso carried out in accordance with the requirements of [19],including the following assumptions: a planned service life of70 years, a 40 tonne legal truck weight limit, and PrincipalRoad traffic, i.e. a traffic volume of 5 × 10⁵ trucks/dir./year(bidirectional traffic was assumed).
The design truck used in the (SIA 2003) [19] fatigueverification consists of two 270 kN axle loads spaced 1.2 mapart. The verification consists of evaluating the followingrelationship:
1σE2 ≤1σc,t
γMf(9)
where 1σE2 is the equivalent design hot-spot stress range at2 × 106 cycles, calculated as follows:
1σE2 = λ1 · 1σ (Qfat) (10)
where 1σ(Qfat) can be taken as the hot-spot stress range, 1σhs,at the location of interest due to a single passage of the designtruck and λ1 is a damage equivalence factor (λ1 = 1.42 fora 40 m bridge span on a Principal Road). In Eq. (9), 1σc,t isthe fatigue strength corresponding with 2 × 10⁶ applied stresscycles. According to [4], 1σc,20 = 86 MPa should be used for
the hot-spot stress-based design of tubular bridge joints, witha reference wall thickness of 20 mm. The following size effectcorrection factor is used:
1σc,t
1σc,20=
(20
T or t
)0.25
(11)
In Eq. (9), γMf takes on a value between 1.0 and 1.35depending on the ease with which fatigue damage may bedetected/repaired and the consequence of fatigue failure. Foreach joint along the bottom chord of the interior span, thedeterministic verification was carried out for each of the hot-spots in Fig. 1. Under a given set of loads, the stress, σhs,at a given hot-spot can be determined using the followingexpression:
σhs = σax br · SCFax br + σax ch · SCFax ch
+ σi pb1 br · SCFi pb1 br + σi pb2 br · SCFi pb2 br
+ σi pb ch · SCFi pb ch (12)
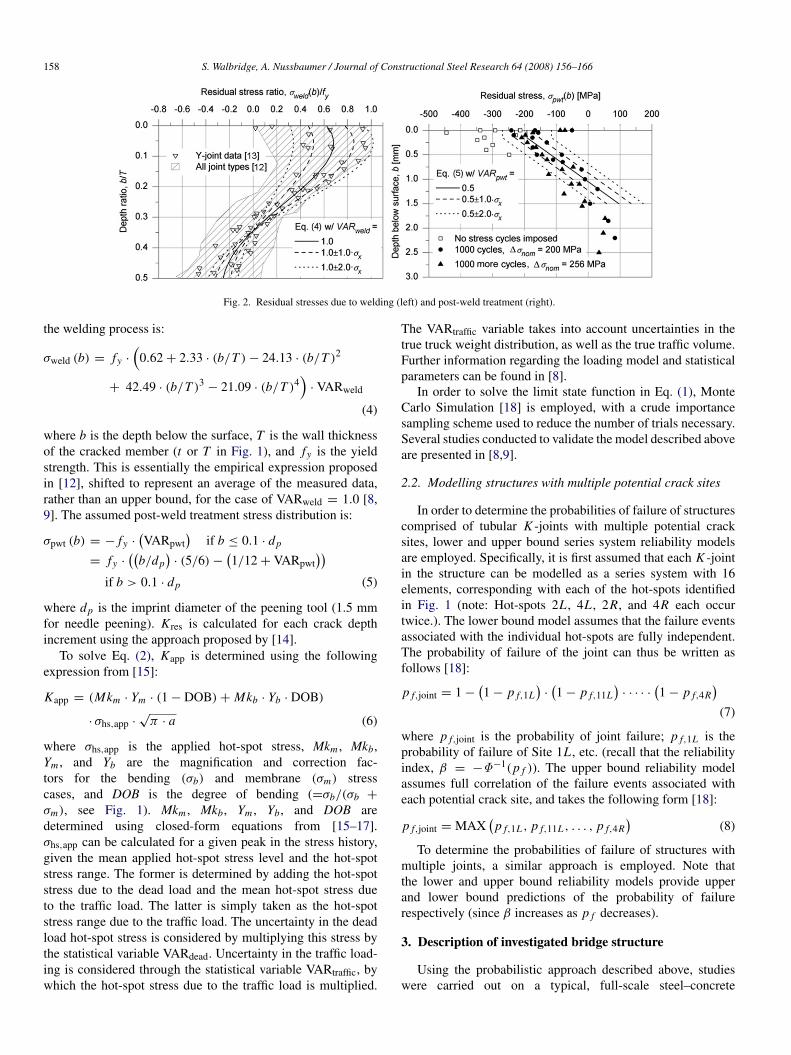
where σax br is the nominal member stress due to the balancedaxial brace load case; and SCFax br is the corresponding stressconcentration factor, etc. The five load cases implicated in Eq.(12) are shown in Fig. 4(a). The associated nominal memberstresses can be determined by structural analysis. In the currentstudy, the SCFs in Eq. (12) were determined using tables forCHS K -joints from [4]. To determine the nominal memberstresses, a simplified structural analysis was carried out whereinno interaction or load sharing between the two trusses wasconsidered (i.e. each truss carries one lane of traffic).
At each hot-spot location, the equivalent design hot-spotstress range, 1σE2, was first calculated by taking the nominalmember stress ranges for each of the five load cases in Fig. 4(a),multiplying them by the appropriate SCFs, and then summingthe results to get the total hot-spot stress range, 1σ(Qfat) [21].In employing this approach, phase effects were conservativelyignored, i.e. it was effectively assumed that the stress peaksfor each load case correspond with the same truck positionalong the bridge length. This assumption is examined in greaterdetail in Section 5.1. The result of the code-based fatigue designwas a significant increase in the steel weight for Bridge V in
160 S. Walbridge, A. Nussbaumer / Journal of Constructional Steel Research 64 (2008) 156–166
Fig. 4. (a) K -joint structural model and nominal joint load cases. (b) Traffic model.
Table 2Member sizes for five variants of investigated bridge
Bridge: I II III IV VDescription: Designed for static strength Intermediate designs Designed for fatigue
Bottom chord 1 457 × 50a 457 × 50 457 × 60 508 × 70 559 × 802 457 × 30 457 × 36 457 × 60 508 × 70 559 × 803 457 × 20 457 × 36 457 × 60 508 × 70 559 × 80
Braces 1 273 × 25 273 × 25 273 × 30 323.9 × 35 355.6 × 402 273 × 16 273 × 16 273 × 20 323.9 × 25 355.6 × 303 273 × 10 273 × 10 273 × 16 323.9 × 20 355.6 × 25
Top chord 1 406.4 × 40 457 × 50 457 × 60 508 × 70 559 × 802 406.4 × 20 457 × 36 457 × 60 508 × 70 559 × 80
Steel weight kN/mb 8.8 10.9 15.4 19.7 24.3%c 11.1 13.4 17.9 21.8 25.7
a All tube dimensions in mm.b One truss, including 20% of Bridge I steel weight as allowance for supporting structural elements.c % of total weight = (total steel weight/total bridge weight) · 100%.
comparison with that of Bridge I. Three intermediate variants(Bridges II–IV) were then conceived with varying degrees ofunder-design for fatigue. The member sizes and steel weightsfor each bridge variant are summarized in Table 2.
4. Probabilistic analysis of investigated bridge variants
4.1. Analysis of untreated and shop treatment cases
With the resulting five bridge variants it was thought that thepotential benefit of treatment could be precisely determined.In order to do this, 72 bottom chord hot-spots on half of theinterior span of one truss on each bridge variant were analyzedusing the probabilistic model. A traffic model based on weighscale measurements taken on the main highway between Bernand Zurich [22], modified to consider the new 40 tonne Swisslegal truck weight limit, was used for the analysis of all fivevariants (see Fig. 4(b)). In applying this model, the indicatedtruck weights were multiplied by a deterministic dynamic factorof 1.3.
Initially, each potential crack site was analyzed twice—untreated and treated. To determine the residual stress distri-bution, σres(b), the parameter PWT was introduced, such that:
σres (b) = MIN(σpwt (b) , σweld (b)
)if PWT = 1
= σweld (b) if PWT = 0 (13)
The stress due to the dead load was then considered in thecalculation of Kapp (see Eq. (6)). This approach effectivelyassumes that all of the residual stresses are imposed prior tothe application of the dead load, as would normally be the caseif the treatment were applied in the shop.
A typical result of the analysis described above is presentedin Fig. 5 for Bridge III. In this figure, envelopes of fatiguereliability, β, versus time are plotted for the untreated andthe treated bridge. An important finding presented in [8] wasthat the same treatment benefit could be obtained using eitherof the two treatment strategies (TS3 or TS4) shown in thisfigure, when a needle peening treatment of normal intensityand uniformity (denoted tb2s treatment in [8]) was employed.The envelopes in this figure consider the unknown level ofcorrelation between the fatigue reliabilities of the variouspotential crack sites in the bridge according to Eqs. (7) and (8).As can be seen in this figure, the effect of the treatment is asignificant increase in β throughout the planned service life forthis bridge variant.
In Fig. 6, curves are presented comparing the fatigue lives,in terms of the number of trucks, Tr , for each of the untreated(NT) and treated (tb2s) bridge variants as a function of thesteel weight. In this figure, the curves for the treated bridgevariants were again found to be identical for both for treatmentstrategies: TS3 and TS4. Separate graphs are presented to

S. Walbridge, A. Nussbaumer / Journal of Constructional Steel Research 64 (2008) 156–166 161
Fig. 5. Fatigue reliability versus time envelopes for Bridge III.
Fig. 6. Fatigue life versus steel weight curves for the investigated bridge.
distinguish the reliability versus steel weight curves obtainedusing the lower and upper bound series system reliabilitymodels. The fatigue lives in Fig. 6 correspond with the timeat which β drops below a target reliability index, βtarget, of3.74. [20] suggests a βtarget range for the fatigue limit stateof (1.16 ≤ βtarget ≤ 3.74) for a planned service life of70 years, again depending essentially on the ease with whichfatigue damage can be detected/repaired and the consequenceof fatigue failure. This range is used herein to facilitatequantitative comparisons. For example, given an untreatedbridge with a planned service life of 70 years, the fatigue lifeof a treated bridge of equal weight can be estimated usingcurves such as those in Fig. 6. For the investigated bridge,this was found to result in a fatigue life improvement rangingfrom 250% to 320%, for βtarget = 3.74, depending on whichseries system reliability model is used [8]. For βtarget = 1.16,the corresponding fatigue life improvement was found to rangefrom 120% to 930%.
4.2. Analysis of field treatment case (treatment after introduc-tion of the dead load stresses)
In studying the fatigue life improvements due to post-weldtreatment for the various individual hot-spots in each of thefive bridge variants, a strong correlation was observed betweenthe mean applied hot-spot stress level and the calculated treat-ment benefit. This relationship can be seen in the mean design
hot-spot stress, σmean, versus fatigue life improvement, %imp,data plotted in Fig. 7(a) for βtarget = 3.74. The mean hot-spotstress in this figure is taken as the hot-spot stress due to thedead load plus the average of the maximum and minimum hot-spot stresses due to a single passage of the (SIA 2003) designtruck [19].
In Fig. 7(a), data is presented for the hot-spots with finiteuntreated and treated fatigue lives only (Tr < ∼2 × 10⁹
trucks) on all five bridge variants. In this figure, results for threedifferent treatment intensities are compared, where treatmentintensity is characterized by the mean of the statistical variableVARpwt. Examining these results, it can be observed that as themean hot-spot stress increases, the fatigue life improvement,%imp, decreases. This parameter increases, however, with anincrease in the treatment intensity. Based on the data presentedin Fig. 7(a), it can be concluded that for normal intensitytreatment (µ(VARpwt) = 0.50), a fatigue life improvement,%imp, of at least 100% is always achieved, as long as σmeanis less than ∼90 MPa. A fatigue life improvement, %imp, ofat least 10% is always achieved, as long as σmean is less than∼150 MPa. In Fig. 7(b), σmean is non-dimensionalized by thetreatment intensity. The resulting narrow band of data forms thebasis of a crude empirical model for predicting the treatmentbenefit presented in [8].
The strong influence of the mean stress on the treatmentbenefit observed in Fig. 7(a) and (b) led to the suggestion that

162 S. Walbridge, A. Nussbaumer / Journal of Constructional Steel Research 64 (2008) 156–166
Fig. 7. (a) Fatigue life improvement versus mean stress. (b) Fatigue life improvement versus non-dimensionalized mean stress.
the merits of field treatment be examined. Field treatment, itwas thought, could significantly reduce the detrimental effectsof high tensile stresses introduced by the dead loads. In [8],a model was proposed for the analysis of potential crack siteswherein the treatment is applied after the introduction of thedead load. The basic assumption of this model is that since thepost-weld treatment (i.e. needle peening) works primarily byplastically deforming a thin layer at the surface of the treateddetail, it can be assumed that the treatment will essentiallynegate the tensile dead load stresses over the treatmentdepth. For the current study, the actual modelling of thisphenomenon had to be done indirectly, because the dead loadstress distribution is never calculated in applying the analyticalmodel presented in Section 2 (rather the corresponding SIF isdetermined directly using Eq. (6)).
A very simple approach for circumventing this problem isto assume that the SIF due to the dead load is zero until thecrack grows to the depth at which the residual stress due topost-weld treatment crosses the neutral axis. Once the crackgrows to this depth, the dead load SIF could simply be turnedon. This would result in a crack growth rate slightly higher thanthe growth rate due to the actual distribution of the combinedwelding, treatment, and dead load stresses. Since most of thefatigue life occurs at the smaller crack depths, such a modelshould still model fairly well the case of treatment after deadload application.
In [8], a slightly modified version of this approach wasemployed wherein at the point when the crack depth reachesthe depth at which the dead load SIF is to be turned on, theSIF due to the dead load is calculated. Following this, uponactivation of the dead load SIF, an additional uniform stressblock is introduced with a depth equal to the crack depth atthe transition point and a magnitude such that it results in anSIF at the transition crack depth equal but opposite to that ofthe dead load. It was expected that this model would give moreaccurate results than the simpler model described above. In fact,a comparative study found the difference in the results obtainedusing these two models to be negligible.
In Fig. 8, sample SIF distributions due to the residual stressesand dead load are shown for untreated, shop treated, and fieldtreated potential crack sites. VARweld = 1.0 and VARpwt = 0.5are assumed, and the case of a tensile dead load hot-spot stressand a wall thickness of T = 20 mm is modelled.
A possible shortcoming of the adopted model, is thatit assumes linear elastic material behaviour regardless ofthe stress level. In reality, cases can be envisioned wherecombinations of tensile welding and dead load stresses willresult in yielding near the surface of the weld toe. It is expectedthat the effect of ignoring this possibility should be smallhowever, since in this case:– if the crack site is untreated, then the effective SIF range will
typically be equal to the applied SIF range (i.e. the crack willbe open for the entire cycle regardless of the mean stresslevel), and
– if the crack site is treated, then this tensile stress will benegated anyways by the post-weld treatment applied afterthe dead load stresses are introduced.
The use of the adopted, simplified model was thought neces-sary to facilitate timely execution of the large numbers of cal-culations required for the probabilistic analysis of entire tubularbridges. Further study may be warranted, however, to determinethe implications (if any) of the adopted linear elastic model.
In order to study the influence of the treatment timing, thehot-spots on all five bridge variants were reanalyzed with theSIFs due to the dead load and treatment stresses superimposedso as to model the second case in Fig. 8 of field treatment. InFig. 9, the results for this study are plotted for two treatmentstrategies: NT (not treated) and TS4 (Sites 1L , 11L , 1R, and11R treated only—see Fig. 5). In this figure, ‘tb2s’ and ‘tb2f’refer to normal intensity/uniformity shop and field treatmentrespectively.
Based on the results presented in Fig. 9, it can be concludedthat the treatment benefit is significantly greater when thetreatment is applied after the introduction of the dead loadstresses. It should be noted that the relative lack of data for thecase of βtarget = 1.16 is due to the calculation of infinite fatiguelives (Tr < ∼2 × 10⁹ trucks) for relatively light bridge variantswhen this target index is assumed. The observed improvementin the ability of post-weld treatment methods to increase fatiguelife when applied in the field suggests that an interesting domainof application for these methods might be in the rehabilitationor fatigue life extension of existing steel bridges (tubular orconventional).
In Fig. 10, the same data is presented using curves of thereliability index at the planned service life of 70 years versussteel weight. Using curves such as these, the potential savings

S. Walbridge, A. Nussbaumer / Journal of Constructional Steel Research 64 (2008) 156–166 163
(a) Untreated. (b) Shop treated.
(c) Field treated. (d) Kdead + Kres comparison (three cases).
Fig. 8. SIFs due to the dead load and residual stresses for three treatment cases.
Fig. 9. Fatigue life versus steel weight curves for shop and field treatment (TS4).
in steel weight due to post-weld treatment can be determinedfor any given target index at 70 years [8]. Again, looking at this
figure, the additional benefit of field treatment (as opposed toshop treatment) is apparent.

164 S. Walbridge, A. Nussbaumer / Journal of Constructional Steel Research 64 (2008) 156–166
Fig. 10. Fatigue reliability versus steel weight curves for a 70 year plannedservice life (TS4).
5. Consideration of phase effects and weld root cracking
5.1. Phase effects
In the deterministic code-based fatigue verification de-scribed in Section 3, phase effects were ignored. In reality, thehot-spot stress peaks due to the five load cases in Fig. 4(a) willgenerally not be in-phase. Considering phase effects, i.e. by firstcalculating the hot-spot stress, σhs, for each truck position us-ing Eq. (12) and then determining the stress range using theresulting hot-spot stress influence line, was seen to improve thesituation significantly, as seen in Fig. 11. In this figure resultsare presented of the deterministic fatigue verification for BridgeIII considering phase effects (assuming γMf = 1.35) for eachhot-spot on each joint along the bottom chord of the interiorspan. An envelope of the results for the worst hot-spot on eachjoint brace member, obtained without considering phase effects,is included for comparison purposes. The design ratio, DR or{DR}PE, in Fig. 11 is calculated as follows:
DR =resistance
solicitation=
1σc,t
1σE2 · γM For
{DR}PE =
{1σc,t
1σE2 · γM F
}PE
(14)
where {}PE indicates that phase effects are considered. Usingthis figure, it can be deduced that Bridge III could be madeto pass the deterministic verification if phase effects areconsidered and a lower value for γMf is permitted, such as 1.0. Ifthe use of the higher γMf value is deemed necessary, then BridgeIII almost passes the verification if phase effects are considered,but fails by a considerable margin if they’re ignored.
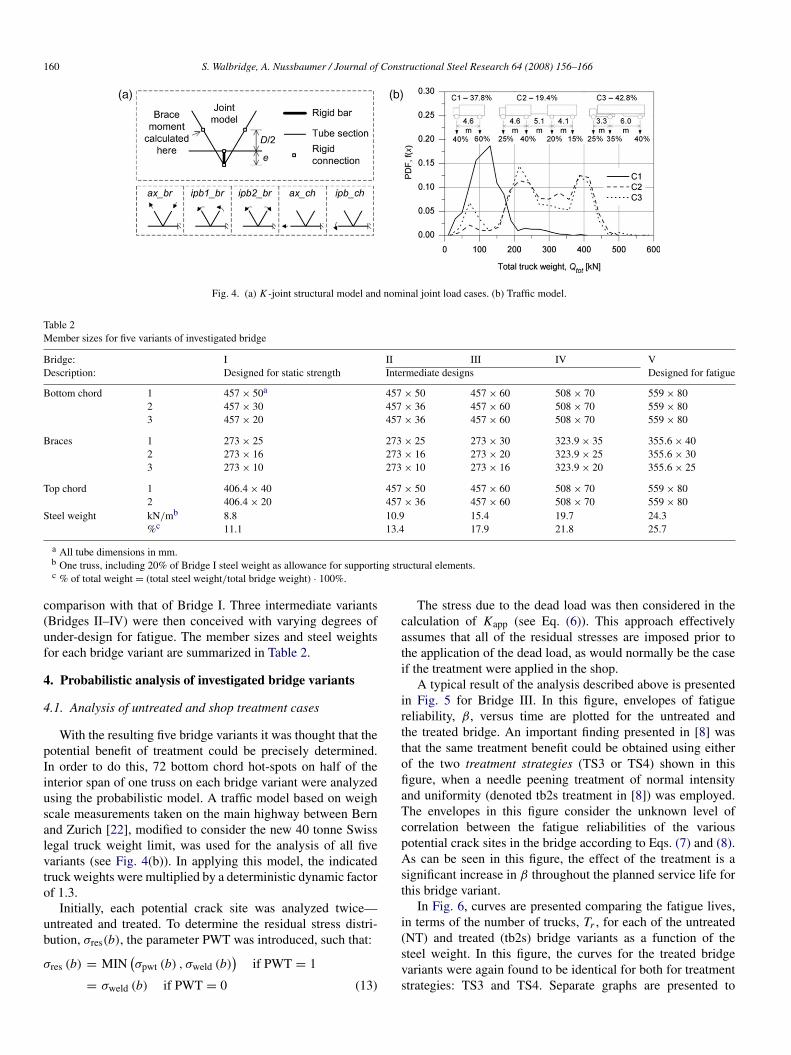
The results of the probabilistic calculations presented inSection 4 for single sites on the untreated bridge variants can beused to perform a verification of sorts of the deterministic, code-based design, as shown in Fig. 12(a). In this figure, the designratio considering phase effects, {DR}PE, and assuming a lowlevel of redundancy and limited possibility for inspection/repair(γMf = 1.35) is plotted verses the calculated fatigue lifefor the corresponding target reliability index, βtarget = 3.74.Looking at this figure, it can be concluded that according
Fig. 11. Deterministic design ratios ignoring and considering phase effects.
to the probabilistic model, the code-based design gives saferesults for single potential crack sites, even when phase effectsare considered. In other words, there are virtually no caseswhere the code-based design deems a potential crack site tobe adequate, while the probabilistic model shows it is not.Fig. 12(b) presents data for the case of γMf = 1.0/βtarget =
1.16, which follows a similar trend.A number of the sites in Fig. 12(a) and (b) are seen to
perform much better than would be expected simply by lookingat the deterministic design ratio. The main reason for this isthat the code-based verification does not consider the effects ofcompressive dead load stresses at the various potential cracksites. These stresses have a positive effect on the fatigue livesof these sites similar to that of the post-weld treatment stresses.This verification is also conservative in that the failure criterionfor the probabilistic analysis is crack growth to a critical depthof ac = 0.5 · (T or t). In fact, tubular structures are known topossess a significant reserve capacity beyond crack growth tothis depth. According to [23], for example, the time to total jointfailure is on average 1.49 times as long as the time to throughthickness cracking. In addition, a constant, but conservativeDOB has been assumed for all of the load cases in Fig. 4(a).
One potentially unconservative assumption made by theprobabilistic model is that the crack tip loading mode isessentially the same for all of the load cases in Fig. 4(a) (i.e.primarily opening or Mode I loading). It is thought that the errordue to this assumption should be small, although further studyof the effect of the true crack tip loading modes is recommendedif phase effects are to be routinely considered in the code-baseddesign. It was found in [24], for example, that out-of-phaseloading can lead to a reduction in the fatigue lives of weldeddetails subjected to pure normal and shear stress cycles thatare completely out-of-phase. The various potential crack sitesin tubular joints (in particular the critical sites on the jointsaddle) are thought to experience primarily Mode I loading,however, suggesting that the consideration of phase effectsshould be less erroneous for these structures. Furthermore, mostof the total fatigue life for these structures is spent in the crackpropagation phase, where the implications of phase effects areless clear. The results presented herein do show, however, thepotential of considering phase effects in the design of tubulartruss bridges. Provided it can be confirmed to be safe, this
S. Walbridge, A. Nussbaumer / Journal of Constructional Steel Research 64 (2008) 156–166 165
Fig. 12. (a) Fatigue life versus design ratio (infrequent inspection/high failure consequence). (b) Fatigue life versus design ratio (frequent inspection/low failureconsequence).
design approach could lead to steel weight savings for thesestructures even greater than those that can be achieved by post-weld treatment [8].
5.2. Weld root cracking
One potential concern with the use of post-weld treatmentmethods to improve fatigue performance is the increasedpossibility, with treatment, that the eventual failure of the jointwill result from fatigue cracking at the weld root. Cracking atthis location is generally considered to be much less desirable,as there is no economical possibility in this case for earlydetection using non-destructive methods. No suitable designtools currently exist for verifying the fatigue strengths of theweld roots in tubular bridge joints. One possible approach foroffshore joints is discussed in [25]. This reference provides aset of equations for a factor, RSCF, which relates the maximumSCF at the weld root to that at the weld toe, i.e.:
RSCF =SCFroot,max
SCFtoe,max(15)
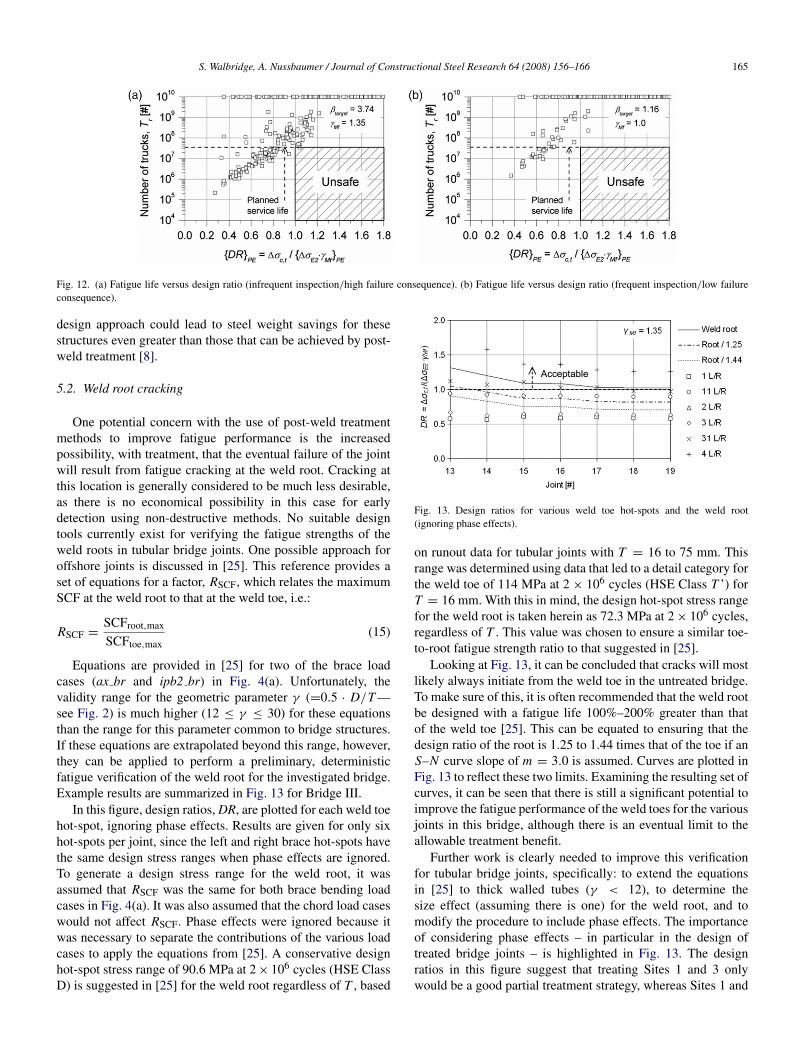
Equations are provided in [25] for two of the brace loadcases (ax br and ipb2 br) in Fig. 4(a). Unfortunately, thevalidity range for the geometric parameter γ (=0.5 · D/T —see Fig. 2) is much higher (12 ≤ γ ≤ 30) for these equationsthan the range for this parameter common to bridge structures.If these equations are extrapolated beyond this range, however,they can be applied to perform a preliminary, deterministicfatigue verification of the weld root for the investigated bridge.Example results are summarized in Fig. 13 for Bridge III.
In this figure, design ratios, DR, are plotted for each weld toehot-spot, ignoring phase effects. Results are given for only sixhot-spots per joint, since the left and right brace hot-spots havethe same design stress ranges when phase effects are ignored.To generate a design stress range for the weld root, it wasassumed that RSCF was the same for both brace bending loadcases in Fig. 4(a). It was also assumed that the chord load caseswould not affect RSCF. Phase effects were ignored because itwas necessary to separate the contributions of the various loadcases to apply the equations from [25]. A conservative designhot-spot stress range of 90.6 MPa at 2 × 10⁶ cycles (HSE ClassD) is suggested in [25] for the weld root regardless of T , based
Fig. 13. Design ratios for various weld toe hot-spots and the weld root(ignoring phase effects).
on runout data for tubular joints with T = 16 to 75 mm. Thisrange was determined using data that led to a detail category forthe weld toe of 114 MPa at 2 × 10⁶ cycles (HSE Class T ’) forT = 16 mm. With this in mind, the design hot-spot stress rangefor the weld root is taken herein as 72.3 MPa at 2 × 10⁶ cycles,regardless of T . This value was chosen to ensure a similar toe-to-root fatigue strength ratio to that suggested in [25].
Looking at Fig. 13, it can be concluded that cracks will mostlikely always initiate from the weld toe in the untreated bridge.To make sure of this, it is often recommended that the weld rootbe designed with a fatigue life 100%–200% greater than thatof the weld toe [25]. This can be equated to ensuring that thedesign ratio of the root is 1.25 to 1.44 times that of the toe if anS–N curve slope of m = 3.0 is assumed. Curves are plotted inFig. 13 to reflect these two limits. Examining the resulting set ofcurves, it can be seen that there is still a significant potential toimprove the fatigue performance of the weld toes for the variousjoints in this bridge, although there is an eventual limit to theallowable treatment benefit.
Further work is clearly needed to improve this verificationfor tubular bridge joints, specifically: to extend the equationsin [25] to thick walled tubes (γ < 12), to determine thesize effect (assuming there is one) for the weld root, and tomodify the procedure to include phase effects. The importanceof considering phase effects – in particular in the design oftreated bridge joints – is highlighted in Fig. 13. The designratios in this figure suggest that treating Sites 1 and 3 onlywould be a good partial treatment strategy, whereas Sites 1 and
166 S. Walbridge, A. Nussbaumer / Journal of Constructional Steel Research 64 (2008) 156–166
11 are always found to be the most critical when phase effectsare considered (see Fig. 11).
6. Conclusions
The probabilistic analysis results presented herein demon-strate that the use of residual stress-based post-weld treatmentmethods such as needle peening can result in significant bene-fits for tubular truss bridges. Specifically, it is shown that post-weld treatment by normal intensity/uniformity needle peeningin the shop can result in a 120% to 930% increase in fatigue life,depending on whether a lower or an upper bound series systemreliability model is used, as well as on the selected target relia-bility index.
In examining the analytical results for the various potentialcrack sites in the five studied bridge variants, the mean appliedstress level is seen to strongly influence the treatment benefitfor the various potential crack sites in a typical tubular trussbridge. On this basis, the possibility of post-weld treatmentin the field (i.e. after the dead load stresses are introduced)is suggested. In comparing the benefits of shop versus fieldtreatment, it is observed that residual stress-based post-weldtreatment methods can be much more effective if the latterapproach is employed. This finding suggests that an interestingdomain of application for these methods might be in therehabilitation or fatigue life extension of existing steel bridges.
The results of the probabilistic analysis presented hereinare also used to examine the implications of ignoring orconsidering phase effects in the design of tubular truss bridges.This examination shows that the potential benefit of consideringphase effects is significant. Further work is needed, however,to confirm that the assumption of Mode 1 crack loadingfor all nominal load cases will not lead to unsafe designs.Finally, a preliminary, deterministic verification of the weldroot is presented. Although this verification shows that partialtreatment of these bridge joints will likely not cause the criticalcrack location to shift to the weld root, further work is needed todevelop parametric equations for the RSCF factor that are moresuitable for tubular bridge applications. In addition, there wouldbe considerable value in modifying the weld root verificationprocedure so that phase effects can be considered.
Acknowledgements
The work presented herein was supported by the SwissFederal Highway Administration (OFROU Project No.AGB2002/011) and the Swiss National Research Foundation(SNF Grant 200020-101521).
References
[1] Virlogeux M, Bouchon E, Berthellemy J, Resplendino J. The antrenastubular arch bridge. Structural Engineering International 1997;97(2):1-7-109.
[2] Dauner H-G, Decorges G, Oribasi A, Wery D. The Lully Viaduct, acomposite bridge with steel tube truss. Journal of Constructional SteelResearch 1998;46(1–3). Paper No. 55.
[3] Manterola ArmisenJ, Gil Gines M-A, Martınez CutillasA. Bridge overthe Llobregat river (Barcelona, Spain) and bridge over the Escudo river(Cantabria, Spain). In: Jaurrieta MA, Alonso A, Chica JA, editors. Tubularstructures X, 2003. Madrid: A.A. Balkema; 2003.
[4] Schumacher A, Nussbaumer A. Experimental study on the fatiguebehaviour of welded tubular K -joints for bridges. Engineering Structures2006;28(5):745–55.
[5] Veselcic M, Herion S, Puthli R. Cast steel in tubular bridges—newapplications and technologies. In: Jaurrieta MA, Alonso A, Chica JA,editors. Tubular structures X, 2003. Madrid: A.A. Balkema; 2003.
[6] Haldimann-Sturm S, Nussbaumer A. Determination of allowable defectsin cast steel nodes for tubular bridge applications. International Journal ofFatigue [in press].
[7] Manteghi S, Maddox SJ. Methods for fatigue life improvement of weldedjoints in medium and high strength steels. International Institute ofWelding Doc. XIII-2006-04. 2004.
[8] Walbridge S. A probabilistic study of fatigue in post-weld treated tubularbridge structures. EPFL thesis no. 3330. Lausanne, http://icom.epfl.ch;2005.
[9] Walbridge S, Nussbaumer A. A probabilistic model for determining theeffect of post-weld treatment on the fatigue performance of tubular bridgejoints. International Journal of Fatigue 2007;29:516–32.
[10] Bremen U. Amelioration du comportement a la fatigue d’assemblagessoudes: etude et modelisation de l’effet de contraintes residuelles. EPFLthesis no. 787. Lausanne; 1989.
[11] Stephens RI, Fatemi A, Stephens RR, Fuchs HO. Metal fatigue inengineering. 2nd ed. New York: John Wiley & Sons; 2001.
[12] Stacey A, Barthelemy J-Y, Leggatt RH, Ainsworth RA. Incorporationof residual stresses into the SINTAP defect assessment procedure.Engineering Fracture Mechanics 2000;67:573–611.
[13] Porter Goff RFD, Free JA, Tsiagbe WZ. Experimental determination ofresidual stresses in welded tubular T-joints. Fatigue of Offshore Structures1988;285–95.
[14] Albrecht P, Yamada K. Rapid calculation of stress intensity factors.Journal of Structural Engineering 1977;103(ST2):377–89.
[15] Bowness D, Lee MMK. Weld toe magnification factors for semi-ellipticalcracks in T-butt joints. Health and safety executive offshore technologyreport OTO 199 014. UK; 1999.
[16] Newman JC, Raju IS. An empirical stress-intensity factor equation for thesurface crack. Engineering Fracture Mechanics 1981;15(1–2):185–92.
[17] Connolly MP, Hellier AK, Dover WD, Sutomo J. A parametric studyof the ratio of bending to membrane stress in tubular Y- and T-joints.International Journal of Fatigue 1990;1:3–11.
[18] Melchers RE. Structural reliability analysis and prediction. 2nd ed.Chichester: John Wiley & Sons; 1999.
[19] SIA 260/261/263—Basis for structural design/actions on structures/steelstructures. Zurich: Swiss Society of Engineers and Architects; 2003.
[20] EN1990—Basis of structural design. Brussels: European Committee forStandardization; 2002.
[21] Zhao XL, Herion S, Packer JA, et al. Guide no. 8—Design guide forcircular and rectangular hollow section joints under fatigue loading.Cologne: CIDECT; 2001.
[22] Kunz P, Hirt MA. Grundlagen und Annahmen fur den Nachweis derErmudungsfestigkeit in den Tragwerksnormen des SIA. Zurich: SwissSociety of Engineers and Architects Doc. D 076; 1991.
[23] van Wingerde AM, van Delft DRV, Wardenier J, Packer JA. Scale effectson the fatigue behaviour of tubular structures. International Institute ofWelding WRC Proceedings; 1997.
[24] Sonsino CM. Multiaxial fatigue of welded joints under in-phase and out-of-phase local strains and stresses. International Journal of Fatigue 1995;17(1):55–70.
[25] Fatigue life implications for design and inspection for single sided weldsat tubular joints. Health and Safety Executive offshore technology reportOTO 99/022. UK; 1999.