Embed Size (px)
Citation preview

Test Results for the Fatigue Design/Rating of Thru Truss Hangers Robert A. P. Sweeney, PhD, D. Eng., P. Eng., Eng.
Former Chief of Structures, Canadian National/Illinois Central
Modjeski & Masters
4675 Doherty
Montreal, Qc H4B 2B2
Canada
Tel/Fax: 514-483-4935

ABSTRACT This paper deals with the design and evaluation of hangers on through trusses for fatigue, and discusses the results of recent field test of hangers at CN.
The paper also includes a review of recent corrections to the methodology of handling
tension members in Chapter 15 (1).
It is demonstrated that the current AREMA provisions for calculated allowable stress
ranges for hangers are reasonable from a statistical perspective (95th percentile).
Impact for design covers a rare occurrence that might occur only several times during the
design life of a structure (4). Test results will be reported that show that the design
formula for impact may be reduced to 40% of the calculate value used to design hangers
for maximum load, again within reasonable statistically certainty (95th percentile).
It will be shown that further reductions in stress may be found through testing of
individual hangers.
An example of a hanger fatigue failure is discussed, together with an example of a
potential pin plate failure.

INTRODUCTION
Hangers have been a problem for many years, and in most through trusses their
connections are the most failure prone members of the main truss system, excluding
members failed through accidental impacts caused by collisions. It is difficult to predict
the stress distribution at hanger connections; hence it is even more difficult to predict
their useful fatigue life.
AREMA Chapter 15 (1) is going through a major change in concept with regard to
tension members that requires a thorough re-think of long standing assumptions.
Early analysis methods, using plane truss analysis, ignored the very real stresses induced
by in and out-of-plane bending. Friction in pinned joints and plate rigidity in riveted
joints caused this together with in and out-of-plane forces and/or loads.
There are many papers covering and evaluating this with very important work done at the
University of Illinois in the 1940’s and 1950’s and summarized by AREA at the time (2).
In the early days of hanger design, with design loads that exceeded actual loads by a large
margin, the differences for design purposes were covered by ignoring the secondary
stresses (See current Article 15.1.3.15).
At some time, it became evident as a result of failures that this was not sufficient and the
allowable design stresses were reduced to 70.7% of the normal allowable tension. This is
equivalent to allowing for a 41.4% increase in stress due to bending effects.
Michalos’s paper (3) published by AREA in 1957 gave a hand calculation method for
obtaining the out-of-plane stresses, and any number of plane frame analysis methods
would get the in-plane bending stresses assuming full joint fixity.
If these methods were strictly followed it should work for the failure case of Ultimate
failure with the appropriate safety factors of either Normal or Maximum Rating.
For failure due to fatigue that occurs at much lower stresses and is controlled by stress
range as opposed to maximum stress, the problem is to predict when failure is a potential
concern. Few railroads have the luxury of being able to restrict the weight of rolling
stock to ensure that fatigue of these members will never be an issue (so-called Fatigue
Rating), and the Manual does not recommend such a limitation.
The objective is to predict the when, given the load, and not how much load. Given the
normal or maximum rating (depending on the line usage and importance and future
capital spending plans), the objective is to determine when there is significant risk of
failure caused by fatigue.
Over time the methodology has evolved and prediction are getting much better.

But first a review of general tension member behavior at the ultimate is necessary.
GENERAL TENSION MEMBER BEHAVIOR
Since its inception, the AREA Recommended Practice and subsequently the AREMA
Recommended Practice has based the limit on tension members as a function of the yield
stress and the net area. Concern for yielding and distortion were paramount. At one time
there was an additional limit that the allowable used could not be greater than half the
ultimate tensile limit (0.5 Fu). Over the years this was dropped.
When the margin between the yield stress and the ultimate tensile strength was large this
was an acceptable procedure. With today’s modern high strength steels that are now
accepted in Chapter 15, the margin between the yield and ultimate tensile strengths is not
large, and additionally, the current AREMA Guidelines (2003) in Chapter 15 are
misleading as to the appropriate failure modes.
The proper criteria is to apply the gross area to the limiting yield stress and the net area to
the ultimate tensile stress both with an appropriate margin of safety or error, and of
course use the lower of these.
Letter ballots are being evaluated to hopefully include in the 2004 edition of the Manual
the following:

Proposed Manual Revisions
For members subject to tension, the stress shall not exceed:
0.55Fy on the Gross area, and not the net area, and
0.5 Fu on the net area except for pin connected members where the allowable is 0.45Fy at
the location of the pinhole.
Net area is calculated with the s2/4g reduction (Article 15.1.5.8) and may be further
reduced to account for shear lag (Article 15.1.6.5).
Tension in floor beam hangers, including bending based on the net section is limited to
14,000 psi (0.707 x 19,800 psi) for riveted end connections and 19,800 psi (0.55 x 36,000
psi) for high strength bolted connections. This is also under review.
In beams, the limit for tension in the extreme fibers based on the net section is 0.55 Fy.
Fatigue criteria
For fatigue, the appropriate section to use depends on the connector. For high strength
bolted connections and welded connections it is the gross section, and for riveted
connections, eyebars and pin plates it is the net section.

These differences are based on the history of how the test results were reported and
sorting out which is correct remains a task for the future. At low stress ranges typical of
railroad bridge loadings and at small crack sizes, the behavior is probably best described
with reference to the gross section. But, at large crack sizes where the piece is about to
fail in a brittle manner, the net section probably applies.
Typical Hanger Connections
If one considers a hanger which typically is connected by two plates, one on the outside
and one on the inside (track-side) of the hanger, how is the fact that the full section is not
engaged to be applied to fatigue?
Not a problem with net section calculations, but what about gross section calculations?
Where will the failure occur?
The complication is the fact of shear lag in tensile connections where the entire
connection is not directly connected. This concept is really only meant to apply to the net
section calculation at ultimate (working stress at allowable limit) and has no real meaning
with regard to failures at lower stress ranges under a fatigue regime. It has become
practice to use the shear lag factors for fatigue calculations where the appropriate section
is the net section.

When the appropriate section is the gross section, the correct answer is somewhere
between the gross section reduced by a calculation similar to the shear lag reduction and
simply using the parts actually connected. The first has no basis in test results and the
second is conservative.
Due to a complete lack of test results, AREMA Chapter 15 will be recommending the
later for gross section calculations on high-strength bolted hanger connections, although
this is unlikely to appear before the 2005 Edition.
Actual fatigue evaluation calculations follow the procedures outlined in Chapter 15, part
7.3.4.2. Note that special stress ranges for Fracture Critical members will be eliminated
in the 2004 edition of the AREMA Manual.
CN TESTING
At CN, a testing program aimed at determining the parameters to aid in this remaining
life calculation of many members were investigated by full scale field testing after a rash
of near failures that were prevented by the Company’s inspection program and perhaps a
lot of luck.
With regard to hangers, the conclusions of these studies were:

• In and out of plane bending effects on hangers were safely covered, except for
one point, by the 1.42 times the axial stress criterion or reducing the allowable to
0.707. Clearly an analysis of the actual bending effects, either analytically or by
field measurement, would allow for a more precise estimate of stress ranges. The
current reduction giving actual stress limits is equivalent to a 0.707 reduction
(1/1.42) and is based on A36 material, but such low yield material is rarely used
in current designs. This criteria needs to be reviewed. See Figure 1.
• Although in many instances, the measured stress ranges and stresses in field tests
are less than those predicted, it was found that to be safely covered (95th
percentile) it was not prudent to reduce the calculate stresses unless proper field
testing confirmed such a reduction actually occurred. Clearly, the probability that
lower stresses would be measured than those calculated is high but never
guaranteed. Hence, the Manual recommends that the alpha factor
(measured/calculated maximum stress) be taken as 1.0 unless field measurements
confirm otherwise.
• Impacts based on the design formulae in the AREMA manual are expected to
occur 3 to 4 times at most in the life of most structures. A study of the impact test
results indicated a probability of occurrence of no more than 1% (4).
• Studies at CN, which has the largest data base of test results for typical fatigue
stress ranges ever reported, indicate that using 40% of the AREMA Calculated

Impact formula would safely cover (95th percentile) the effect of this parameter on
the actual stress ranges in hangers on Class 1 good track with good wheel control.
• On a floor beam spacing of 22 feet, and Truss spacing of 18 feet, this would result
in a mean impact for fatigue calculations of 0.4 x 44.6 % = 17.6%, where 44.6%
is the AREMA calculated impact for that loaded length and truss spacing. Again,
actual field measurement of the impact has a good chance of showing a lower
value, but cannot be relied upon for an individual structure without a field test.
See Figure 2.
Using the above information to predict useful remaining fatigue lives of hangers gives a
better estimate of the first indication of when there should be concern. Depending on the
economic and capital plan of the railroad concerned, it is possible to refine these
calculations considerably by field-testing to get a more precise and generally a longer
remaining calculated fatigue life since both these parameters a likely to be less severe
than the assumptions recommended above.
Test for actual alpha factor (Figure 1).
This requires a static test with the applied load located at the maximum and minimum
points on the influence line. A slow crawl test with a heavy vehicle(s) loading the full
influence line and ensuring minimum dynamics effects is often used due to time

constraints. Figure 1 plots the actual vs. calculated maximum stresses based on net
section for riveted and pinned connections.
Alpha Hanger Data
0
2000
4000
6000
8000
10000
12000
14000
16000
18000
20000
0 2000 4000 6000 8000 10000 12000
Simple Truss Theory psi
Test
Dat
a
Data Simple TheoryA + 1.65 Sigma (1.62)1.33 * Theory (1.22)1.42 * theory (1.14)
Figure 1
Test for actual stress ranges.
This would require typical trains run at the most probably speed used at the location and
are not reported here, although such tests were carried out.

Test for typical average impacts (Figure 2).
Impact Truss Hangers over 10 mph
0
5
10
15
20
25
30
35
40
45
50
0 5 10 15 20 25 30 35 40 45 50
Theory Impact
Mea
sure
d Im
pact
Test DataTheoryAvg + 1.65 Sigma (0.374)
Figure 2
This can be done with a test rain run at various speeds to get impact data. Figure 2 shows
the critical data from tests on 13 hangers. The 95th percentile is at 37.4%. The
committee rounded this to 40%. All of theses tests were conducted with good track
conditions and good wheel conditions typical of top quality Class 1 railroad track and
wheel control.

Other More Refined Techniques
With calculations based on strain measurements and actual as opposed to assumed impact
percentages, it is possible to further refine the calculations using fracture mechanics
analysis.
When this is all done, it is still possible, if it make economic sense, to make use of
acoustic emission testing to verify crack movement and of course good inspection is
critical in dealing with these members.
It is this writer’s belief that more than visual inspection is required and recommends
magnetic particle inspection of suspect hanger connections.
FATIGUE : EXAMPLE OF HANGER FAILURE
The truss shown in figure 3 is typical of many riveted trusses with hangers connected to
the top chord and end post by plates on the track-side and water-side only.
Several years prior to the failure, based on fatigue life calculation done internally at CN,
this truss and several others were put on a watch list requiring detailed inspection, but the
watch was put on the bottom connection to the floor beam and not on the top connection
to the top chord and end post.

Figure 3 Overall view hangers
Strains were measured in the temporary replacement hangers after failure, and using
projection, the strains were estimated at the rivets where the section failed and a rough
after the fact fatigue analysis was made indicating failure had been imminent. The strains
were converted to stresses at the failure location using the net section area reduced by the
standard shear lag calculation, and compared to the limits for reamed rivet holes shown in

Figure 15-9-4 of Chapter 15 of the AREMA Manual that is the appropriate fatigue curve
for the resulting root-mean-cube stress range.
Figure 4 Failure Surface in Field
Figure 4 shows the rupture of the piece in the structure after it was re-connected with a
temporary bolted connection. Slow fatigue crack growth in the outstanding leg of the
angle starting in the rivet hole in that leg that turns and grows along the inside leg of the
angle to the rivet hole connecting the batten plate. At this point rapid failure occurred.
There were also fatigue cracks in the other outstanding legs as seen in Figure 5.

Figure 5 Matching Failure Surface in Lab
Figure 5 show the matching piece in the lab. The top photo shows the piece upside down
from what it would have been in the field. The bottom photo shows the piece with the
outstanding angle legs on the table.

The failure stared with a fatigue crack that initiated at the outside hole in the outstanding
leg of the waterside angle. This crack progressed slowly until it popped through the rivet
hole connecting the angle to the batten plate at which time the rapid rupture occurred.
Note the slow crack growth on the piece on the left in the bottom photo as opposed to the
tearing on the right hand piece.
Figure 6 Fatigue to brittle fracture and tearing
On the left side in the top photo of figure 6 the failure surface is a lot smoother,
indicating fatigue crack growth, than the right side where tearing is evident.
As a result of this failure, which caused considerable damage to the floor system stringer
connections and the opposite floor beam to hanger connection, a special inspection was
arranged for all similar trusses on the line. All had been designed by the same firm and
installed within a few years of each other.

Cracks were found in most of these trusses similar to the one shown in figure 7, bottom
photo. The top photo shows the connection. The bottom photo shows a close up of the
Figure 7 Cracking before failure Typical

waterside gusset connection. Note how the crack that is just above the yellow line is just
entering under the rivet connecting the outstanding angles to the batten plate. When the
crack pops out the other side of the rivet hole, the piece will fail in a spectacular manner.
There were instances on other trusses where the cracks initiated on the inside as opposed
to the outside.
A retrofit program was arranged which consisted of adding an additional plate bolted on
the inside and outside of the top connection similar to what is shown in figure 8.
Figure 8 Temporary Repair
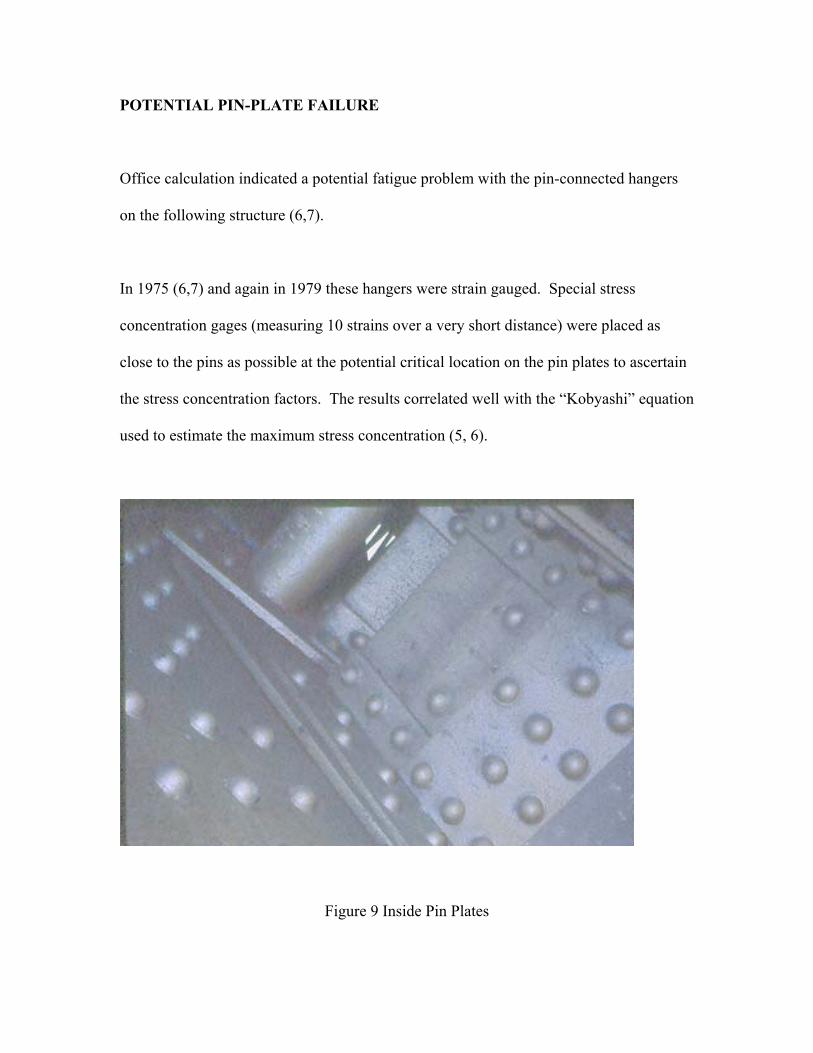
POTENTIAL PIN-PLATE FAILURE
Office calculation indicated a potential fatigue problem with the pin-connected hangers
on the following structure (6,7).
In 1975 (6,7) and again in 1979 these hangers were strain gauged. Special stress
concentration gages (measuring 10 strains over a very short distance) were placed as
close to the pins as possible at the potential critical location on the pin plates to ascertain
the stress concentration factors. The results correlated well with the “Kobyashi” equation
used to estimate the maximum stress concentration (5, 6).
Figure 9 Inside Pin Plates

Calculations based on these strain gage measurements predicted potential failure by 1984.
The joints were retrofitted by 1982.
Figure 10 Pin Plate after 75 years

Figure 10 and 11 show a hanger pin plate from a companion span that was knocked down
and destroyed by a barge in 1976 (6,7).
Figure 11 Close up Forging marks or cracks? If the pin plate in figure 11is viewed as a clock, cracking would be expected first at
between 2 and 3 o’clock positions or the 9 to 10 o’clock positions. There was sufficient
concern as to whether these were forging marks or cracks, and if forging marks could
they lead to serious cracks.
The precise location of potential cracking in the pin plates is highly influenced by friction
around the pin.

Given that the structure was intended to remain in service for many years to come, it was
decided to re-place the pin plates at the four remaining critical sub-hangers with a high-
strength bolted retrofitted connection. Figure 12 shows the retrofitted hanger
connection.
Figure 12 Bolted Retrofit Connection
CONCLUSIONS The paper outlines that for fatigue evaluation:
1 Calculated static stresses must be assumed to be as calculated unless field full
scale load tests on the member being evaluated show lower values,
2 Impacts may be assumed to be 40% of the AREMA Calculated values for Class 1
mainline track and wheel control unless similar tests on the actual member being
evaluated show lower values, and

3 For both parameters, the possibilities of measuring values that are lower are high
making testing a worthwhile exercise.
The change in philosophy on how to deal with tension members is outlined emphasizing
that gross section is appropriate for yield calculations and net section is appropriate for
ultimate tensile strength calculations while pointing out some inconsistencies due to the
way past test results have been reported.
Finally an example of a hanger riveted connection fatigue failure is illustrated, and a
potential pin connection failure is also shown.
ACKNOWLEDGEMENT
The writer acknowledges the staff at CN who assisted him in his 37 years with the CN-IC
System together with Modjeski & Masters Inc. for their continued support and
encouragement.

REFERENCES
1 American Railway Engineering and Maintenance of Way Association Manual of
Recommended Practice, Chapter 15, 2003, AREMA, Landover, MA
2 Committee on Iron and Steel Structures, Stress Distribution in Bridge Frames –
Floorbeam Hangers, Proceedings AREA Vol. 51, 1950, pp. 470-503
3 James Michalos and J.M. Louw, Vol. 58, pages 1 - 51, AREA Proceedings 1957
4 Byers, William G., “Impact from Railway Loading on Steel Girder Spans”, ASCE
J. of Structural Division, Vol. 96, No, ST^, June 1970, pp 1093 – 1103
5 Fisher, J.W., “Fatigue and Fracture in Steel Bridges – Case Studies” J. Wiley
1984, particularly page 32.
6 Sweeney, R.A.P., “Load Spectrum for Fraser River Bridge at New
Westminster, B.C.”, Proceedings A.R.E.A., Volume 77, Bulletin 658,
June-July 1976, A.R.E.A., Washington, D.C.
7 Fisher, J.W., Daniels, J.H., “An Investigation of the Estimated Damage in
Members of the 380 ft. Main Span, Fraser River Bridge”, Proceedings A.R.E.A.,
Volume 77, Bulletin 658, June-July 1976, A.R.E.A., Washington, D.C.