Embed Size (px)
Citation preview
Private Sector Assessment: Philippines
Despite the leading role of the private sector in the Philippine economy, its potential remains significantly underutilized. This translates into fewer jobs for the fast-growing population than there can be. Fast-growing and so far successfully evolving industries such as the business process outsourcing industry are unlikely to absorb surplus labor and drive productivity-based economic growth. Private sector development is not benefiting from the abundance of capital in the economy: significant savings are either “locked” in the banking system or are exported. Within the private sector there is insufficient synergy between the small and medium-sized enterprises (SMEs), as suppliers of inputs, and the large firms, as clients for the inputs of SMEs. Drawing on nationwide consultations with the private sector, this publication identifies inefficient state processes and inadequate business environment as the major reasons for such insufficient synergy. It proposes measures to address the inefficiency of state processes. It also provides suggestions on how ADB could support private sector development through its public and private sector operations.
About the Asian Development Bank
ADB’s vision is an Asia and Pacific region free of poverty. Its mission is to help its developing member countries reduce poverty and improve the quality of life of their people. Despite the region’s many successes, it remains home to two-thirds of the world’s poor: 1.8 billion people who live on less than $2 a day, with 903 million struggling on less than $1.25 a day. ADB is committed to reducing poverty through inclusive economic growth, environmentally sustainable growth, and regional integration.
Based in Manila, ADB is owned by 67 members, including 48 from the region. Its main instruments for helping its developing member countries are policy dialogue, loans, equity investments, guarantees, grants, and technical assistance.
Printed on recycled paper
Private Sector AssessmentPhilippinesCayetano W. Paderanga, Jr.
Printed in the Philippines
Asian Development Bank6 ADB Avenue, Mandaluyong City1550 Metro Manila, Philippineswww.adb.orgISBN 978-92-9092-354-1Publication Stock No. RPT113102
Private Sector Assessment Philippines
Cayetano W. Paderanga, Jr.
This note was prepared in September 2009–June 2010 by Cayetano W. Paderanga, Jr., consultant, under the supervision of Aziz Haydarov, country economist, and the overall leadership of Neeraj Jain, country director of the Philippines Country Office, Southeast Asia Department, Asian Development Bank (ADB). The author wishes to thank reviewers from ADB, whose feedback on earlier drafts helped improve the paper. The author also would like to thank Ms. Kristine Canales for the efficient research assistance provided for the preparation of the paper and Mr. Brian See for back office support.
© 2011 Asian Development Bank
All rights reserved. Published in 2011.Printed in the Philippines
ISBN 978-92-9092-354-1Publication Stock No. RPT113102
Cataloging-In-Publication Data
Paderanga, Cayetano, Jr.
Private sector assessment: Philippines.Mandaluyong City, Philippines: Asian Development Bank, 2011.
1. Private sector. 2. Philippines. I. Asian Development Bank.
The views expressed in this publication are those of the authors and do not necessarily reflect the views and policies of the Asian Development Bank (ADB), its Board of Governors, or the governments they represent.
ADB does not guarantee the accuracy of the data included in this publication and accepts no responsibility for any consequence of their use.
By making any designation of or reference to a particular territory or geographic area, or by using the term “country” in this document, ADB does not intend to make any judgments as to the legal or other status of any territory or area.
ADB encourages printing or copying information exclusively for personal and noncommercial use with proper acknowledgment of ADB. Users are restricted from reselling, redistributing, or creating derivative works for commercial purposes without the express, written consent of ADB.
Note:In this report, “$” refers to US dollars.
Asian Development Bank6 ADB Avenue, Mandaluyong City1550 Metro Manila, PhilippinesTel +63 2 632 4444Fax +63 2 636 2444www.adb.org
For orders, please contact:Department of External RelationsFax +63 2 636 [email protected]
iii
Contents
Tables, Figures, and Boxes iv
Abbreviations vi
Introduction 1
The Private Sector in the Macroeconomic Environment 3Macroeconomic overview 3Profile of the private sector 8
Systemic Impediments to Private Sector Development 13Inefficient government processes 14
Selected Sectors 27Physical infrastructure 27Finance sector 30Social sectors 32Small and medium-sized enterprises 35
Selected Themes 38Public–private partnerships: What to do? 38Business process outsourcing industry development in the past 5 years: Opportunity or trap? 42Labor migration and remittances 44
Proposed ADB Private Sector Development Strategy 47Summary of findings 47Review of country and ADB strategic framework for private sector development 50ADB and the Philippines’ private sector development 50Proposed strategy for ADB’s private sector development support under the next country partnership strategy 52
Private Sector Assessment Report: Main Issues and Recommendations 58Main principles 58Main recommendations 59
Bibliography 62Links 65Interviewed persons 65
Appendix A BOT Projects Funded by the Private Sector 66B Projects Financed by ADB Loans 68C Projects Funded by ADB Grants 74D Projects Granted with Technical Assistance by ADB 75
iv
Tables, Figures, and Boxes
Tables1 World Bank Ease of Doing Business Rankings 62 Estimated Revenue Losses for 2010 from Revenue-Related Laws 73 Net Foreign Direct Investment, 2008 114 Firm Size Distribution in German Manufacturing Industries, 1986 145a Surveyed Firms Admitting to Giving Gifts for Services 175b Comparison of Ranking in the Worldwide Corruptions Perception across Some
Southeast Asian Countries 186 Poverty Incidence and Number of Establishments per 1,000 Persons 207 Ocean Freight Rates 218 Comparison of Ranking in Quality of Port Infrastructure 229 Market Capitalization and Number of Listed Companies 2410 Daily Minimum Wage in Selected Asian Countries, December 2009 2611 Indicators for Infrastructure in the Philippines, 2009–2010 2712 Length of Roads by Classification 2813 Coverage of Water Services, 2006 2914 Telecommunications Coverage, 2007 3015 Resources of the Philippine Financial System, Selected Years 3116 Comparative Data on Status of Education 3217 Public–Private Partnership Projects and Total Investment in the Philippines, 1990–2008 3918 College Degree Graduates, 2007 4319 A. T. Kearney’s Global Services Location Index and Ranking, 2005 versus 2009 44
Figures1 Savings–Investment Gap 32 Consumer Price Index-Deflated Consolidated Public Sector Surplus/(Deficit), 2005–2010 43 Components of National Savings 54 Overall Budget Surplus/(Deficit) as Percentage of GDP 75 Distribution of Establishments by Firm Size and Employment, 2008 86a Sectoral Distribution of Establishments, 2000 versus 2008 96b Sectoral Distribution of Large Companies, 2000 versus 2008 107 Geographic Dispersion of Establishments, 2008 108 Annual Change in Total Stock Market Capitalization 119 Philippines’ Net Foreign Direct Investments, 2000–2009 1210 Private Sector Participation Progress in the Philippines 1211 Philippines’ Most Problematic Factors for Doing Business 1812 Foreign Travel in Association of Southeast Asian Nations by Air, 2008 2313 Issuance Volume of Local Currency (LCY) Bond Market 3114 Agricultural Land as Share of Land Area and Agriculture Value Added as Share of GDP 3415 Distribution of Small and Medium-Sized Enterprises by Sector 3516 Registered Small and Medium-Sized Enterprises 3617 Breakdown of Indian Public–Private Partnerships, January 2010 4018 Global Business Process Outsourcing Market Share 4219 Business Process Outsourcing Revenues and Direct Employment 43
20 Estimated Migrants Sent by Country (of Origin) 4521 Overseas Filipino Workers by Skills Category, 2008 46
Boxes1 Executive Order 839 (Oil Price Control in Luzon): Government Readiness to
Impose Nonmarket Interventions 162 Proof of Rice Import Fraud 173 Substitute Bill on Security of Tenure 264 Maynilad Water Services: Need for Improving Corporate Governance 395 Manila Metro Rail Transit System: Inefficient Subsidy? 406 A Successful Public–Private Partnership in the Philippines: North Luzon Expressway Project 417 Manila Water Company: A Model of Concessions/Privatizations 41
Tables, Figures, and Boxes v

vi
Abbreviations
ARC – agrarian reform communityARMM – Autonomous Region of Muslim MindanaoASEAN – Association of Southeast Asian NationsBIR – Bureau of Internal RevenueBOT – build–operate–transferBPO – business process outsourcingCARP – Comprehensive Agrarian Reform ProgramDOST – Department of Science and TechnologyDOTC – Department of Transportation and CommunicationsFDI – foreign direct investmentGDP – gross domestic productILO – International Labour OrganizationIRA – internal revenue allotmentISTIV – industrious, systematic, time-conscious, innovative, and value for workIT – information technologyLGU – local government unitMNTC – Manila North Tollways CorporationMRTC – Metro Rail Transit CorporationMWSS – Metropolitan Waterworks and Sewerage SystemNCR – National Capital RegionNSO – National Statistics OfficeOFW – overseas Filipino workerPPP – public–private partnershipPSA – private sector assessmentPSOD – Private Sector Operations Department (ADB)R&D – research and developmentSEC – Securities and Exchange CommissionSMEs – small and medium-sized enterprisesTRO – temporary restraining orderUDD-ZAD – Urban Development Department-Zoning Administration Division

1
Introduction
Several external and internal changes have profoundly affected Philippine private sector development in recent years. The country’s
internal environment has changed: there has been significant economic growth, fiscal space has improved, a range of regulatory and institutional reforms have been undertaken, new public–private partnerships (PPPs) have been realized, the business process outsourcing (BPO) industry is emerging as a key component of services-led gross domestic product (GDP) growth, and there have been losses left by natural disasters such as typhoons Ondoy and Pepeng. Externally, the rapidly expanding Association of Southeast Asian Nations (ASEAN) region, fast-growing regional economic powers such as the People’s Republic of China (PRC) and India, recent food and oil price shocks, and global economic slowdown have altered the climate for private investments in the Philippines.
Amid all these, the Philippines has been enjoying a higher average growth rate in the last several years, especially from 2004 to 2007, until the global finan-cial crisis. Still, the country has been able to weather the crisis in a relatively better shape than some of its immediate neighbors. It has been able to provide higher growth in income per person, raise its savings rate, and remove the uncertainty about whether it will have the foreign currency to pay for its exter-nal obligations, thereby lowering the sovereign risk premium coming from credit risk.
However, this heartening picture conceals weak-nesses that need to be dealt with if the country is to attain sustainable growth toward takeoff. One of the main reasons the Philippines has been less affected is that it has not depended on the tradi-tional sources of economic growth to achieve its current status. More specifically, it has not utilized the investment or export sector to attain this higher growth level, depending more on the strength of remittances from overseas workers. As a by-product of this good fortune, its vulnerability to the current
global crisis has come only through the impairment of its exports. The loss in output is mainly in manu-facturing industries making export products such as semi-conductors and wire harnesses. Because investment growth has been low, it cannot further adversely affect the economy by declining. The relative weakness of the private sector in the growth process, manifested by its feeble contribution to the country’s progress, may partly be traced to its lack of internal dynamism. Particularly absent is a robust menu of manufactured products that would indi-cate competitiveness of its industry sector at world standards. The absence of a healthy, competitive industry sector suggests the inability of the private sector to respond to the opening of the economy and its entry into global markets. It also hints at some weakness in the public–private partnership, the robustness of which characterizes strong indus-trial economies.
The absence of the other traditional source of economic growth, investment, has added to this insulation from global disturbances. The country’s investment and export levels have been particularly low in comparison to its neighbors and similarly situated economies, and especially in comparison to the level needed for takeoff in a traditional growth scenario along the lines of Rostow (1953) and the levels exhibited by the Asian tigers.
Adding to the puzzle is the fact that the Philippines has an explicit policy featuring a private sector and market-driven economy. Given this, the concerns translate into an inquiry as to why the private sector has not recently developed much more than it actually has. It is important that the bottlenecks should be identified and removed, the missing complementary structures produced, and the needed programs and policies formulated.
These developments and the preparation of ADB’s new country partnership strategy for 2010–2016, which will be aligned with the Philippines’ next

2 Private Sector Assessment: Philippines
midterm develop ment plan and ADB’s Strategy 2020,1 call for a new private sector assessment (PSA). As ADB’s 2005–2007 country strategy and program specifically focused on investment climate improve-ment support, the new strategy will focus on private sector development.
The primary objective of this report is to conduct a new forward-looking and innovative PSA. In taking stock of private sector development status, the assessment will use regional comparisons and study selected successful and unsuccessful related cases in
1 A product of wide and extensive consultations with ADB’s 67 member countries which sets the institution’s goals in fulfilling its vision (an Asia and Pacific region free of poverty) by 2020. Its three critical strategic agendas are inclusive growth, environmentally sustainable growth, and regional integration. Strategy 2020 aims to promote private sector development, good governance, gender equity, knowledge solutions, and partnerships.
both the Philippines and its regional competitors. After taking stock, the PSA will provide im plementable, concrete, and/or innovative recommendations whose implementation would foster private investment.
Analysis of the private sector for the PSA requires review of publications and legal acts, analysis of statistical data, and conduct of personal interviews and focus group discussions with stakeholders in Manila and selected regions, including private sector representatives, government officials, civil society, academia, donor agencies, and relevant ADB staff.

3
The Private Sector in the Macroeconomic Environment
The previous PSA report (ADB 2005) found that private firms generated 95% of GDP and employed more than 90% of the workforce in
the country, and this remains the case. Probably as a result of the global financial crisis, the number of registered private enterprises operating declined from 825,000 in 2001 to 761,409 in 2008. In terms of company size the proportions remain essentially the same, although microenterprises seem to have gained marginally at the expense of large firms and the SME (small and medium-sized enterprises) sector.2 This probably reflects the residual nature of a significant portion of microenterprises. Stress on larger enterprises results in their contraction to smaller sizes and significant layoffs. In the absence of alternative employment, the redundant workers become microentrepreneurs by necessity. Small surveys and anecdotal evidence (e.g., testimony by the Federation of Free Workers at a Department of Labor and Employment/International Labour Organization conference) indicate that this micro-
2 In 2001, the shares of microenterprises, SMEs, and large enterprises were 91.0%, 8.5%, and 0.5%, respectively. Compare this with the figures in 2008: 91.60%, 8.10%, and 0.39%, respectively.
entrepreneurial income roughly equals the income from part-time employment, meaning reduced income compared to the previous (full-time) employment and showing the make-do nature of this residual activity.
Macroeconomic overview
National savings have been increasing steeply since 1998, at the same time that investment (gross domestic capital formation) has been going down. Gross domestic capital formation has been growing minimally, and at some points even negatively. In general, its growth rate has been on a decline. As a result of both developments, a significant positive ,savings–investment gap has emerged, emphasizing the failure of investment to take advantage of avail-able funds. If the Philippines has ample investible funds, (Figure 1) why has investment deteriorated? Where did the excess savings go?
Figure 1 Savings–Investment Gap
-400,000
-200,000
0
200,000
400,000
600,000
-20
-15
-10
-5
0
5
10
15
20
25
30
1980 1983 1986 1989 1992 1995 1998 2001 2004 2007 Mill
ion
Pes
os
% o
f GD
P
Savings–Investment (right axis)% of GDP (left axis)
GDP = gross domestic product.Source: National Statistical Coordination Board.

4 Private Sector Assessment: Philippines
One reason is offered by an examination of the result-ing macroeconomic balances. Part of the large positive balances in national savings and current accounts go to finance the government deficit (Figure 2). Unfortunately, the presence of government securi-ties may be contributing to the investment vehicles available to the finance sector. This channel and the presence of overseas placements provide an outlet when the domestic investment environment is not so hospit able: an outcome to be welcomed from the point of view of domestic investors but to be lamented from the develop mental view.
A large part of the answer to the latter question is found in the rather rapid growth of gross inter-national reserves. The savings have ended up largely in foreign-denominated investments lodged in the various investment funds (mostly handled by banks and insurance companies) that appear in the gross international reserves. A significant portion of excess savings is lodged in increased govern ment domestic debt: the available savings have funded a large part of the deficit. Thus the answer to the puzzle may indicate either or both of two things: uncertainty about the value of domestic- denominated investments and lack of investment vehicles to absorb the increased savings. With the
decline of market expectations of currency depre-ciation, the dominant explanation may turn out to be an inhospitable investment climate and the revealed poor state of the private sector in the Philippines. Compounding the situation and partly as a result of the above, banks may be reluctant to lend to businesses except conglomerates or related group companies.
This rather benign development regarding national savings can be largely traced to the significant growth of remittances by overseas Filipino workers (OFWs). OFW remittance inflow is a major factor to the increase in savings. Figure 3 indicates that the biggest change in the national savings picture is the very substantial increase in net factor income from abroad. Paderanga and Canales (2009) report that regression results point to the significance of OFW remittances as a robust explanatory variable in the determination of current account surplus, gross international reserves, savings, and the savings–investment gap. However, the same study also points to some adverse macro-economic effects that may be disadvantageous to domestic production. Among the more important of these is the perceived strengthening of the peso rela-tive to most other currencies, especially the US dollar, and the potential high reservation wage3 of Filipino
3 Average net monthly income for engineers in the Philippines is $1,827, compared with $4,710 in the United States (average income) and $3,832 in the United Kingdom (median income). (All figures are at purchasing power parity.)
Figure 2 Consumer Price Index-Deflated Consolidated Public Sector Surplus/(Deficit) 2005–2010
Source: Data from Department of Finance and National Statistics Office (NSO).
-160
-140
-120
-100
-80
-60
-40
-20
0
20
2005
2006 2007 2008
2009
2010
Billi
on
Pes
os

The Private Sector in the Macroeconomic Environment 5
workers as a result of the possibility of more remuner-ative employment abroad. The strengthening of the peso reduces the price competitiveness of domestic output, making it more difficult to export and render-ing internal products more vulnerable to imported alternatives.
These twin dangers impose a heavy burden on domestic production that complicates the signifi-cant microeconomic disincentives treated in this study. The possibility of highly remunerative exter-nal employment coupled with relatively high food
prices4 raises labor costs further, putting domestic production at a disadvantage, which is indicative of some rigidity in the labor market as real wages seem to rise despite rising unemployment. Both these developments may have had such a pro-found adverse effect that the private sector has been unable to overcome it. Besides these macro-economic disadvantages, internal conditions may be further weakening the private sector.
The concurrent increased savings and at best stagnant investment rates are a perverse picture that invites analysis to delve into the root causes and action to
4 Food prices in developing countries are high, at 40%–60% of the consumer’s basket, compared with those of developed countries at 14%–30%.
Figure 3 Components of National Savings (current prices)
0
400
800
1,200
1,600
2,000
2,400
1995
1996
1997
1998
1999
2000
2001
2002
2003
2004
2005
2006
2007
2008
Net current transfers from abroad
Net factor income from abroad
Gross domestic savings
Billi
on
Pes
os
Source: National Statistical Coordination Board.
remedy the situation. This present assessment looks into what internal impediments may be aggravat-ing the external disadvantages imposed by, among other things, the perverse macroeconomic effects of OFW remittances.
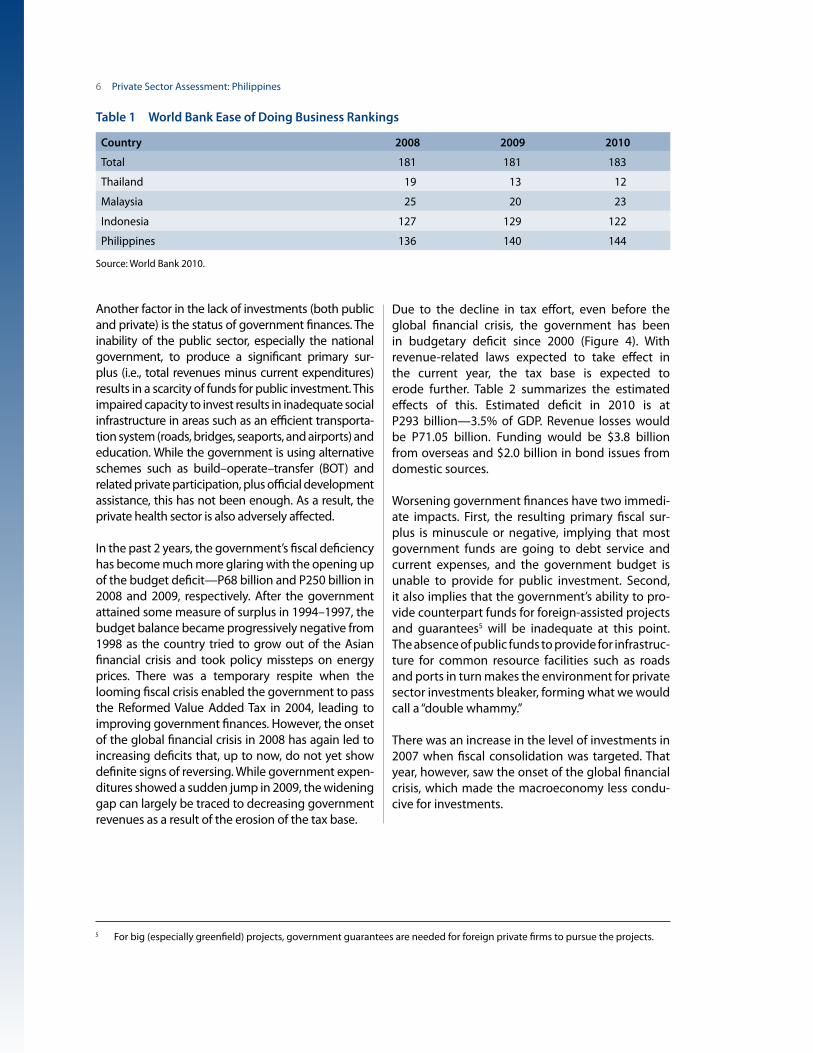
A clue to the weaknesses of the private sector in the Philippines is provided by several international studies that rate countries in terms of ease of doing business. For example, the competitiveness reports on the Philippines relative to other countries pro-vide a glimpse as to why investment growth has remained zero (if not negative) for the country. In 2010, the Philippines ranked 144 out of 183 coun-tries studied by the World Bank due to the degree of regulation on start-ups, contract enforcement, and the difficulty of closing a business. Whereas, neigh-boring countries improved their rankings from 2008 to 2010, the Philippines consistently slid (Table 1).
Meanwhile, the 2009–2010 Global Competitiveness Report of the World Economic Forum (2009) ranks the Philippines 117 out of 133 countries in the index burden of customs procedures—worse than in 2008–2009 (105) and 2007–2008 (98).
6 Private Sector Assessment: Philippines
Another factor in the lack of investments (both public and private) is the status of government finances. The inability of the public sector, especially the national government, to produce a significant primary sur-plus (i.e., total revenues minus current expenditures) results in a scarcity of funds for public investment. This impaired capacity to invest results in inadequate social infrastructure in areas such as an efficient transporta-tion system (roads, bridges, seaports, and airports) and education. While the government is using alternative schemes such as build–operate–transfer (BOT) and related private participation, plus official development assistance, this has not been enough. As a result, the private health sector is also adversely affected.
In the past 2 years, the government’s fiscal deficiency has become much more glaring with the opening up of the budget deficit—P68 billion and P250 billion in 2008 and 2009, respectively. After the government attained some measure of surplus in 1994–1997, the budget balance became progressively negative from 1998 as the country tried to grow out of the Asian financial crisis and took policy missteps on energy prices. There was a temporary respite when the looming fiscal crisis enabled the government to pass the Reformed Value Added Tax in 2004, leading to improving government finances. However, the onset of the global financial crisis in 2008 has again led to increasing deficits that, up to now, do not yet show definite signs of reversing. While government expen-ditures showed a sudden jump in 2009, the widening gap can largely be traced to decreasing government revenues as a result of the erosion of the tax base.
Table 1 World Bank Ease of Doing Business Rankings
Source: World Bank 2010.
Country 2008 2009 2010
Total 181 181 183
Thailand 19 13 12
Malaysia 25 20 23
Indonesia 127 129 122
Philippines 136 140 144
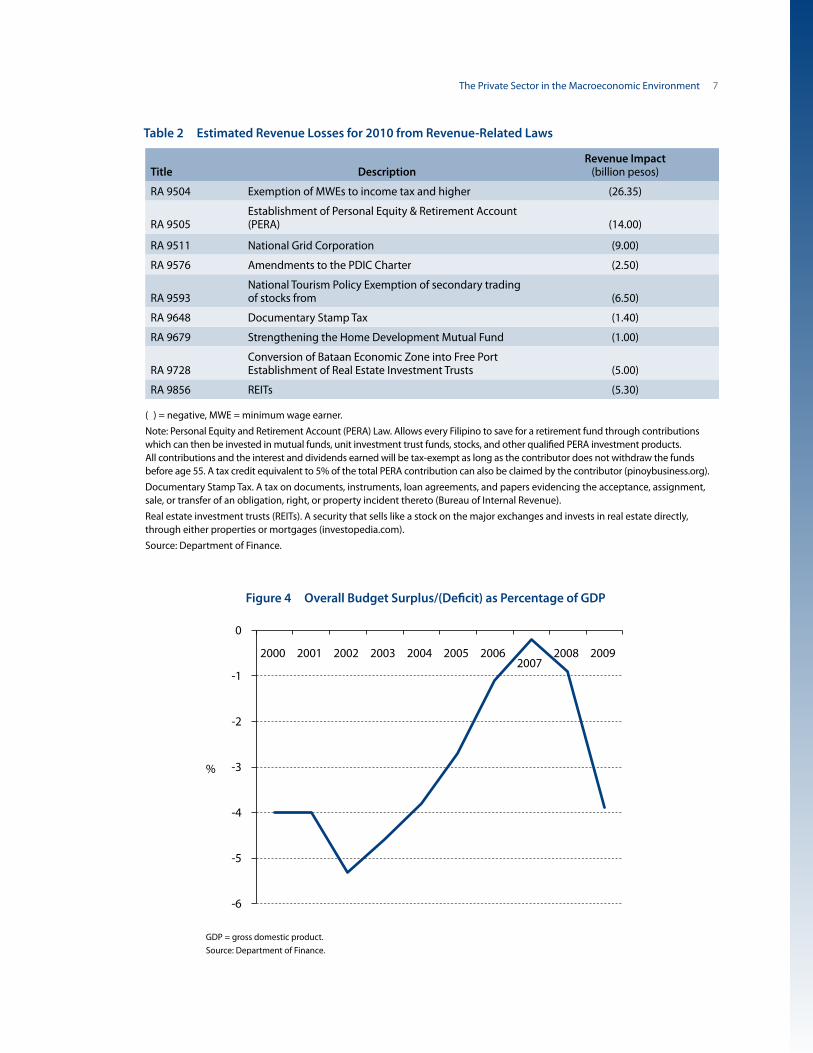
Due to the decline in tax effort, even before the global financial crisis, the government has been in budgetary deficit since 2000 (Figure 4). With revenue-related laws expected to take effect in the current year, the tax base is expected to erode further. Table 2 summarizes the estimated effects of this. Estimated deficit in 2010 is at P293 billion—3.5% of GDP. Revenue losses would be P71.05 billion. Funding would be $3.8 billion from overseas and $2.0 billion in bond issues from domestic sources.
Worsening government finances have two immedi-ate impacts. First, the resulting primary fiscal sur-plus is minuscule or negative, implying that most government funds are going to debt service and current expenses, and the government budget is unable to provide for public investment. Second, it also implies that the government’s ability to pro-vide counterpart funds for foreign-assisted projects and guarantees5 will be inadequate at this point. The absence of public funds to provide for infrastruc-ture for common resource facilities such as roads and ports in turn makes the environment for private sector investments bleaker, forming what we would call a “double whammy.”
There was an increase in the level of investments in 2007 when fiscal consolidation was targeted. That year, however, saw the onset of the global financial crisis, which made the macroeconomy less condu-cive for investments.
5 For big (especially greenfield) projects, government guarantees are needed for foreign private firms to pursue the projects.
The Private Sector in the Macroeconomic Environment 7
Title DescriptionRevenue Impact
(billion pesos)
RA 9504 Exemption of MWEs to income tax and higher (26.35)
RA 9505Establishment of Personal Equity & Retirement Account (PERA) (14.00)
RA 9511 National Grid Corporation (9.00)
RA 9576 Amendments to the PDIC Charter (2.50)
RA 9593National Tourism Policy Exemption of secondary trading of stocks from (6.50)
RA 9648 Documentary Stamp Tax (1.40)
RA 9679 Strengthening the Home Development Mutual Fund (1.00)
RA 9728Conversion of Bataan Economic Zone into Free Port Establishment of Real Estate Investment Trusts (5.00)
RA 9856 REITs (5.30)
( ) = negative, MWE = minimum wage earner.Note: Personal Equity and Retirement Account (PERA) Law. Allows every Filipino to save for a retirement fund through contributions which can then be invested in mutual funds, unit investment trust funds, stocks, and other qualified PERA investment products. All contributions and the interest and dividends earned will be tax-exempt as long as the contributor does not withdraw the funds before age 55. A tax credit equivalent to 5% of the total PERA contribution can also be claimed by the contributor (pinoybusiness.org).Documentary Stamp Tax. A tax on documents, instruments, loan agreements, and papers evidencing the acceptance, assignment, sale, or transfer of an obligation, right, or property incident thereto (Bureau of Internal Revenue).Real estate investment trusts (REITs). A security that sells like a stock on the major exchanges and invests in real estate directly, through either properties or mortgages (investopedia.com).Source: Department of Finance.
Table 2 Estimated Revenue Losses for 2010 from Revenue-Related Laws
Figure 4 Overall Budget Surplus/(Deficit) as Percentage of GDP
-6
-5
-4
-3
-2
-1
0
%
2000 2001 2002 2003 2004 2005 20062007
2008 2009
GDP = gross domestic product.Source: Department of Finance.
8 Private Sector Assessment: Philippines
Profile of the private sector
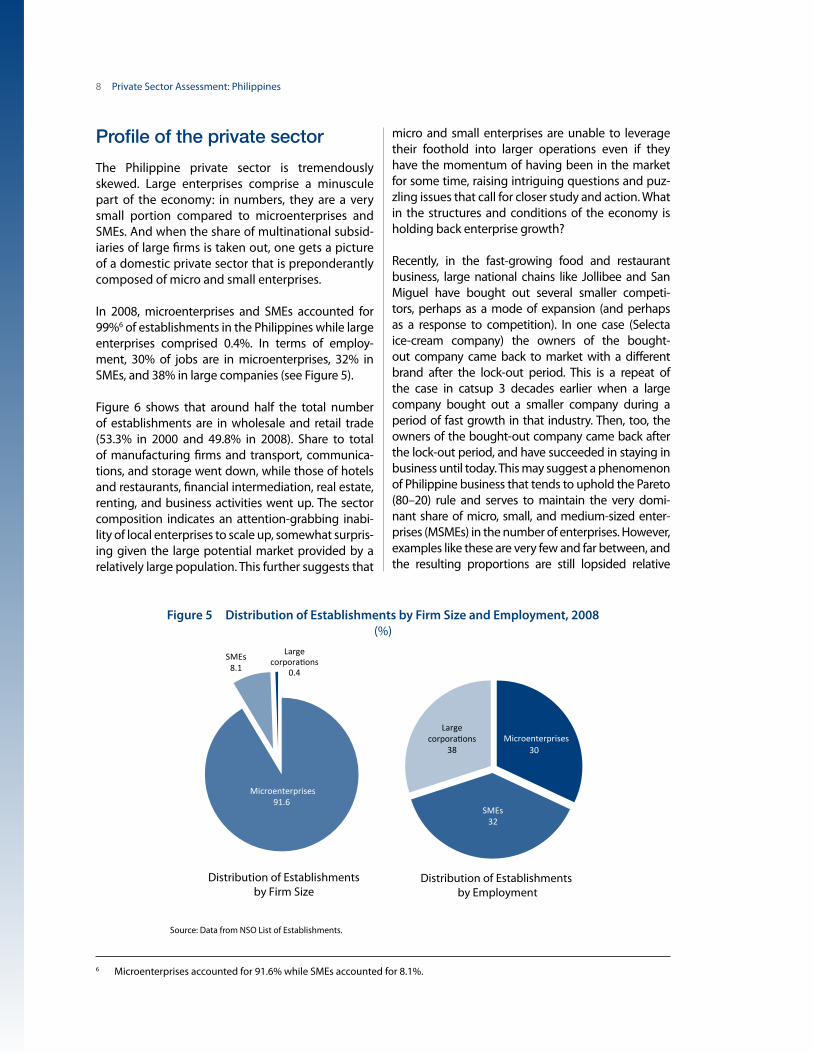
The Philippine private sector is tremendously skewed. Large enterprises comprise a minuscule part of the economy: in numbers, they are a very small portion compared to microenterprises and SMEs. And when the share of multinational subsid-iaries of large firms is taken out, one gets a picture of a domestic private sector that is preponderantly composed of micro and small enterprises.
In 2008, microenterprises and SMEs accounted for 99%6 of establishments in the Philippines while large enterprises comprised 0.4%. In terms of employ-ment, 30% of jobs are in microenterprises, 32% in SMEs, and 38% in large companies (see Figure 5).
Figure 6 shows that around half the total number of establishments are in wholesale and retail trade (53.3% in 2000 and 49.8% in 2008). Share to total of manufacturing firms and transport, communica-tions, and storage went down, while those of hotels and restaurants, financial intermediation, real estate, renting, and business activities went up. The sector composition indicates an attention-grabbing inabi-lity of local enterprises to scale up, somewhat surpris-ing given the large potential market provided by a relatively large population. This further suggests that
6 Microenterprises accounted for 91.6% while SMEs accounted for 8.1%.
Distribution of Establishmentsby Firm Size
Distribution of Establishments by Employment
Microenterprises91.6
SMEs8.1
Large corporations
0.4
30Microenterprises
SMEs32
Large corporations
38
Figure 5 Distribution of Establishments by Firm Size and Employment, 2008(%)
Source: Data from NSO List of Establishments.
micro and small enterprises are unable to leverage their foothold into larger operations even if they have the momentum of having been in the market for some time, raising intriguing questions and puz-zling issues that call for closer study and action. What in the structures and conditions of the economy is holding back enterprise growth?
Recently, in the fast-growing food and restaurant business, large national chains like Jollibee and San Miguel have bought out several smaller competi-tors, perhaps as a mode of expansion (and perhaps as a response to competition). In one case (Selecta ice-cream company) the owners of the bought-out company came back to market with a different brand after the lock-out period. This is a repeat of the case in catsup 3 decades earlier when a large company bought out a smaller company during a period of fast growth in that industry. Then, too, the owners of the bought-out company came back after the lock-out period, and have succeeded in staying in business until today. This may suggest a phenomenon of Philippine business that tends to uphold the Pareto (80–20) rule and serves to maintain the very domi-nant share of micro, small, and medium-sized enter-prises (MSMEs) in the number of enterprises. However, examples like these are very few and far between, and the resulting proportions are still lopsided relative

The Private Sector in the Macroeconomic Environment 9
Figure 6a Sectoral Distribution of Establishments, 2000 versus 2008
0 20 40 60
Agriculture, Hunting, and Forestry
Fishing
Mining and Quarrying
Manufacturing
Electricity, Gas, and Water
Construction
Wholesale and Retail Trade
Hotels and Restaurants
Transport, Storage, and Communications
Financial Intermediation
Real Estate, Renting, and Business Activities
Education
Health and Social Work
Other Community, Social, and Personal Service
2008
2000
%
Source: Data from NSO List of Establishments.
to countries with conducive business climates. The question raised above is still very relevant, and the answers could prove pivotal to Philippine economic development.
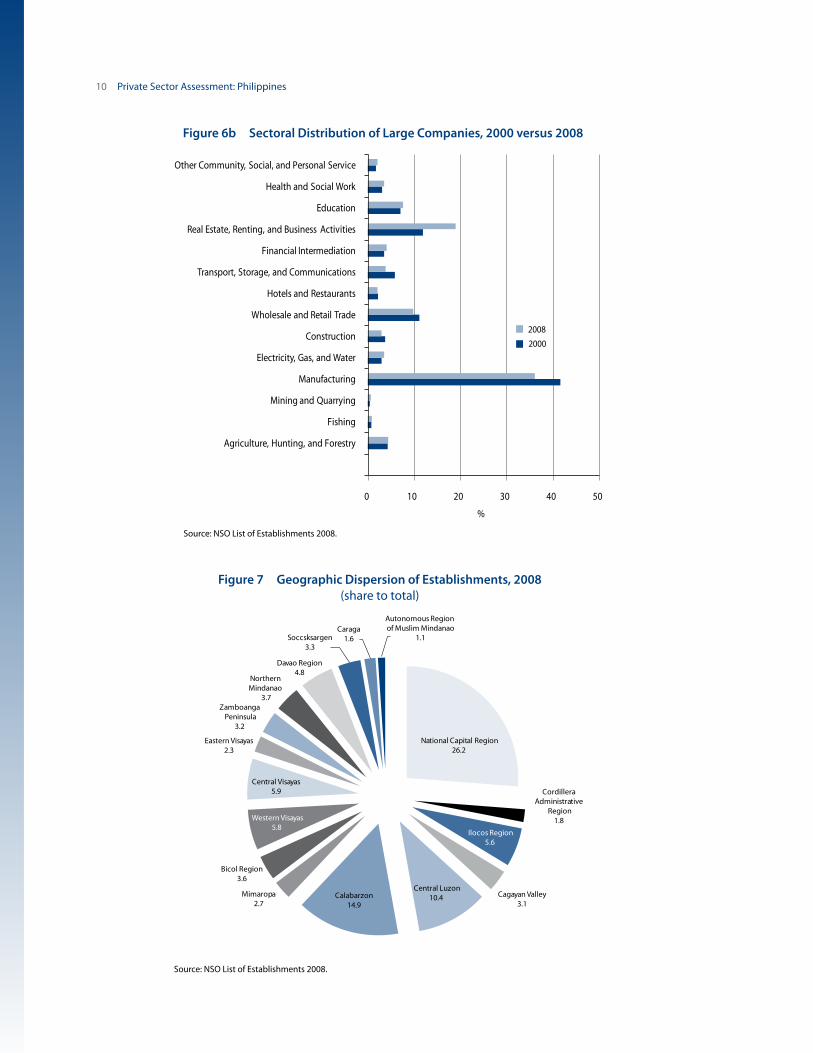
A comparison of the distribution of all firms to that of large firms indicates that almost all large firms are found in the manufacturing sector (Figures 6a and 6b). Unfortunately, that same examination also reveals that the share of manufacturing has declined from 2000 to 2008. This is particularly pronounced in the decline of manufacturing’s share of larger indus-try: its share appears to have gone to the real estate, renting, and business activities sector. What this may indicate is the further hollowing out of the manu-facturing sector due to its revealed lack of interna-tional competitiveness in a globalizing world and the increasing share of services (especially real estate) due to the presence of strong effective demand pro-vided by OFW remittances. The increase in share of real estate, renting, and business activities could also be particularly due to the boom in BPO in the coun-try, currently classified under business activities.
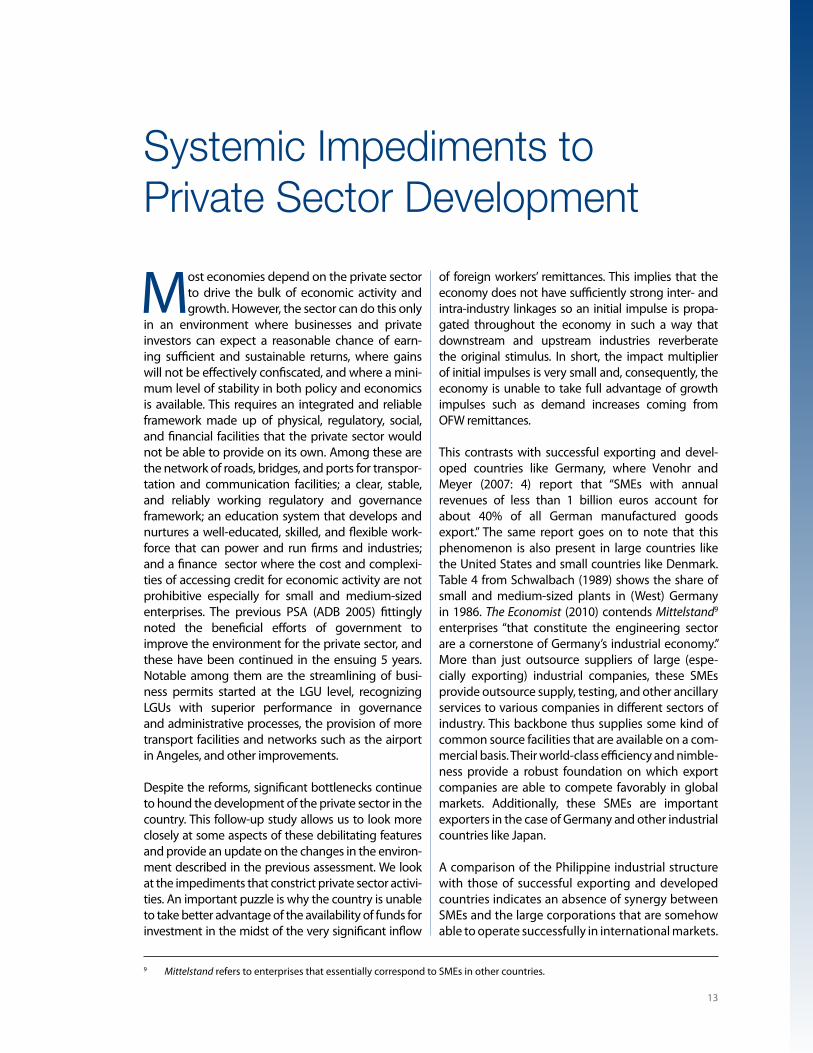
By geographic distribution (Figure 7), most establish-ments are located in the National Capital Region (NCR) (26.2%), followed by Calabarzon (14.9%) and Central Luzon (10.4%).7 Similarly, employment share is highest in the same regions: NCR (40.7%), Calabarzon (16.1%), and Central Luzon and Central Visayas (7.7%). This partly reflects the share of the NCR, Central Luzon, and Calabarzon regions in population and higher effective demand. It may also reflect the preponderant share of multinational firms in larger enterprises devoted to exports and imports of large items like cars and other durable equipment.
Why small enterprises remain small and why large companies are mainly concentrated in certain areas may partly reflect the status of fund availability in the country. Of the two channels for directing funds from sources to users, the financial markets appear particularly out of reach for MSMEs. SMEs’ stock market capitalization was 0.03% of the total on average between January 2006 and 2010, with financials dominating in stock market capitalization. Obstacles to MSMEs’ access to the other channel,
7 These three regions together comprise 51.5%. Luzon accounts for 68% of total establishments, Mindanao for 18%, and Visayas for 14%.
10 Private Sector Assessment: Philippines
Figure 6b Sectoral Distribution of Large Companies, 2000 versus 2008
0 10 20 30 40 50
Agriculture, Hunting, and Forestry
Fishing
Mining and Quarrying
Manufacturing
Electricity, Gas, and Water
Construction
Wholesale and Retail Trade
Hotels and Restaurants
Transport, Storage, and Communications
Financial Intermediation
Real Estate, Renting, and Business Activities
Education
Health and Social Work
Other Community, Social, and Personal Service
%
2008
2000
Source: NSO List of Establishments 2008.
Figure 7 Geographic Dispersion of Establishments, 2008(share to total)
National Capital Region26.2
Cordillera Administrative
Region1.8
Ilocos Region5.6
Cagayan Valley3.1
Central Luzon10.4 Calabarzon
14.9
Mimaropa2.7
Bicol Region3.6
Western Visayas5.8
Central Visayas5.9
Eastern Visayas2.3
Zamboanga Peninsula
3.2
Northern Mindanao
3.7
Davao Region4.8
Soccsksargen3.3
Caraga1.6
Autonomous Region of Muslim Mindanao
1.1
Source: NSO List of Establishments 2008.

The Private Sector in the Macroeconomic Environment 11
financial intermediaries like banks, are more fully discussed in the section on access to credit.
Still, the fortunes of SMEs reflected the fate of the overall capital markets (Figure 8). During the global financial crisis, SMEs in the stock market were hit just as hard. From the start of 2006 to the second half of 2007, SMEs had capitalization of almost P500 million at best. In August–October 2007 capitalization was P12 billion–P17 billion, after which it went down to low single digits in 2009, then back to 2006 levels in the second half of 2009. Largely, this shows the impact of the global crisis on the value of stocks, as portfolio investments flowed
out and market uncertainty increased interest rates, leading to reduced stock prices.
Foreign direct investment (FDI) inflow significantly declined by 51.89% from 2007 to 2008 (Figure 9). The table also shows how the Philippines was dwarfed in terms of per capita FDI ($16) and FDI as share of GDP (0.90%, Table 3). This can be explained by the perceived “behind-the-border barriers”8 to investment in the country (Wallace 2010). Based on a survey of chief executives of multi- national companies operating in the Philippines, the most critical barriers cited are contract sanc-tity violations, Supreme Court decisions against
8 Defined as those “aspects of domestic investment climate that deter both domestic and foreign investment” where investment climate is characterized by “location-specific factors that shape the opportunities and incentives for firms to invest productively, create jobs and expand” (2010).
Figure 8 Annual Change in Total Stock Market Capitalization
-60
-40
-20
0
20
40
60
2006
:01
2006
:04
2006
:07
2006
:10
2007
:01
2007
:04
2007
:07
2007
:10
2008
:01
2008
:04
2008
:07
2008
:10
2009
:01
2009
:04
2009
:07
2009
:10
2010
:01
Oct 2007
Dec 2008
Dec 2009
%
Source: Bangko Sentral ng Pilipinas.
FDI = foreign direct investment, GDP = gross domestic product.Source: Bangko Sentral ng Pilipinas, UNCTAD.
Country2008 FDI ($ million)
Growth from 2007 (%)
Per capita FDI ($) FDI as % of GDP
Indonesia 9,498 37.09 42 1.55
Philippines 1,403 -51.89 16 0.90
Thailand 9,835 -12.44 148 3.70
Viet Nam 9,579 42.97 111 8.86
Table 3 Net Foreign Direct Investment, 2008

12 Private Sector Assessment: Philippines
business, regulatory interpret ation, interference by local government officials, local government unit (LGU) taxes and fees, and corruption. The next section discusses some of these in more detail.
Finance and Banking
Finance and Banking
Micro-Informal Sector
Micro-Informal Sector
Micro-Informal Sector
InfrastructureInfrastructure
Privatization
Infrastructure
Privatization
Privatization
Fixed Capital
Fixed Capital
Fixed CapitalFinance and Banking
GDP
GDP
GDP
SMEs
SMEs
FDI
FDI
Philippines 1995Philippines 2000
FDI
10
5
0
10
5
0
SMEs
10
5
0
Philippines 2005
Figure 10 Private Sector Participation Progress in the Philippines
FDI = foreign direct investment; GDP = gross domestic product; SME = small and medium-sized enterprise.Source: Operations Evaluation Department staff compilation; ADB (2007a).
Figure 10 maps out the progress in private sector par-ticipation in the country: the spider chart shows the change in private sector development again st eight criteria that have been given a score on a scale of 0–10.
Figure 9 Philippines’ Net Foreign Direct Investments, 2000–2009
-200
-100
0
100
200
300
400
500
600
700
800
0
500
1000
1500
2000
2500
3000
2000 2001 2002 2003 2004 2005 2006 2007 2008 2009
%
Level
Growth
$ M
illio
n (
Cu
rren
t)
Source: Bangko Sentral ng Pilipinas.
13
Systemic Impediments to Private Sector Development
Most economies depend on the private sector to drive the bulk of economic activity and growth. However, the sector can do this only
in an environ ment where businesses and private investors can expect a reasonable chance of earn-ing sufficient and sustainable returns, where gains will not be effectively confiscated, and where a mini-mum level of stability in both policy and economics is available. This requires an integrated and reliable framework made up of physical, regulatory, social, and financial facilities that the private sector would not be able to provide on its own. Among these are the network of roads, bridges, and ports for transpor-tation and communication facilities; a clear, stable, and reliably working regulatory and governance framework; an education system that develops and nurtures a well-educated, skilled, and flexible work-force that can power and run firms and industries; and a finance sector where the cost and complexi-ties of accessing credit for economic activity are not prohibitive especially for small and medium-sized enter prises. The previous PSA (ADB 2005) fittingly noted the beneficial efforts of government to improve the environment for the private sector, and these have been continued in the ensuing 5 years. Notable among them are the streamlining of busi-ness permits started at the LGU level, recognizing LGUs with superior performance in governance and administrative processes, the provision of more transport facilities and networks such as the airport in Angeles, and other improvements.
Despite the reforms, significant bottlenecks conti nue to hound the development of the private sector in the country. This follow-up study allows us to look more closely at some aspects of these debilitating features and provide an update on the changes in the environ-ment described in the previous assessment. We look at the impediments that constrict private sector activi-ties. An important puzzle is why the country is unable to take better advantage of the availability of funds for investment in the midst of the very significant inflow
of foreign workers’ remittances. This implies that the economy does not have sufficiently strong inter- and intra-industry linkages so an initial impulse is propa-gated throughout the economy in such a way that downstream and upstream industries reverberate the original stimulus. In short, the impact multiplier of initial impulses is very small and, consequently, the economy is unable to take full advantage of growth impulses such as demand increases coming from OFW remittances.
This contrasts with successful exporting and devel-oped countries like Germany, where Venohr and Meyer (2007: 4) report that “SMEs with annual revenues of less than 1 billion euros account for about 40% of all German manufactured goods export.” The same report goes on to note that this pheno menon is also present in large countries like the United States and small countries like Denmark. Table 4 from Schwalbach (1989) shows the share of small and medium-sized plants in (West) Germany in 1986. The Economist (2010) contends Mittelstand9 enterprises “that constitute the engineer ing sector are a cornerstone of Germany’s industrial economy.” More than just outsource suppliers of large (espe-cially exporting) industrial companies, these SMEs provide outsource supply, testing, and other ancillary services to various companies in different sectors of industry. This backbone thus supplies some kind of common source facilities that are available on a com-mercial basis. Their world-class efficiency and nimble-ness provide a robust foundation on which export companies are able to compete favorably in global markets. Additionally, these SMEs are important exporters in the case of Germany and other industrial countries like Japan.
A comparison of the Philippine industrial structure with those of successful exporting and developed countries indicates an absence of synergy between SMEs and the large corporations that are somehow able to operate successfully in international markets.
9 Mittelstand refers to enterprises that essentially correspond to SMEs in other countries.

14 Private Sector Assessment: Philippines
Our investigation and interviews with key informants point to weak infrastructure support, lack of institu-tional development, including the absence of the rule of law, and the high cost of doing business due to, among other things, red tape, corruption, and ineffi-cient administrative, judicial, and legislative processes. This has led to fragmented size distribution of enter-prises where micro and small enterprises are unable to leverage initial success into growth and gradua-tion into (high) medium-sized and large enterprises. These debilitating circumstances are much more toxic on smaller companies, as they have fewer resources to absorb the additional costs imposed even by the mildest-looking red tape, not to mention corrupt practices. Thus weak SMEs are unable to provide synergies that would be helpful to large enterprises. As a result, the whole productive structure of the country suffers. The impediments to MSMEs thus ultimately spell the failure of even large firms in the economy and are a major contributor to the country’s inability to compete in international product markets. We contend that if we successfully solve the problems for SMEs we will also solve the problems of large firms through the “policy externalities” that will ensue.
Systemic impediments to private sector develop-ment cited in the previous PSA (ADB 2005) in clude
Table 4 Firm Size Distribution in German Manufacturing Industries, 1986
Source: Statistisches Bundesamt, Fachserie 4, Reihe 4.2.1 in Schwalbach 1989.
Employment Size Classes
Small Firms Medium-Sized Firms Large Firms Total
20–49 50–99 100–199 200–499 500–999 1,000 & more
Number of Firms 15,312 8,120 4,888 3,287 1,051 860 33,499
Share of total number of firms (%) 45.7 24.2 14.6 9.8 3.1 2.6 100.0(cumulative share) (45.7) (69.9) (84.5) (94.3) (97.4) (100.0)
Share of total employment (%) 7.2 8.2 9.8 14.5 10.4 49.9 100.0(cumulative share)
Share of total sales (%) 5.3 6.4 8.6 13.6 10 56.1 100.0(cumulative share) (5.3) (11.7) (20.3) (33.9) (43.9) (100.0)
the absence of a rule-based business environment,10 poor physical infrastructure, and a weak finance sector. The business environment has not changed much since then. In this PSA, the focus is on processes and how they magnify the impact of the aforementioned weaknesses. At the national level, two key impedi-ments to development of the private sector have been mentioned: inefficient government processes, and a potentially contentious investment environment.
Inefficient government processes
The top reason for the inefficiency in government processes is the centralization of the bureaucracy. Everything emanates from the center, the NCR. There are too many levels of authority—national, provin-cial, municipal, and barangay. A transaction has to go through these levels, and sometimes conflicts of interest arise. With such red tape coupled with the degree of regulation for business start-ups, the cost of doing business is exorbitantly high. This holds true not only for entry costs, but also for exit costs.11 The World Bank (2008a) states that on average it takes 52 days and 18 procedures to start a business in the Philippines. Because of this, there is an incen-tive for the use of fixers to speed up transactions.
10 Takes in weak framework for competition, systemic corruption, inadequate dispute resolution mechanisms, weak creditor and property rights, and government obstruction of markets.
11 The World Bank (2009a) places the Philippines among nations where it is most difficult to close a business. The recovery rate for an insolvent firm is 4.4 cents on the dollar for claimants (creditors, tax authorities, and employees). The country is also among nations with least efficient bankruptcy rules: it takes 5.7 years and costs 38% of the estate.
Systemic Impediments to Private Sector Development 15
And because exit costs are not negligible, investors think twice before even initiating the investment process. With the inefficiency in processes and lack of accountability in the current structure of the bureaucracy, governance issues constantly place the Philippines among the least favored hosts for investment.
Absence of rule of law In the interviews and focus group discussions con-ducted for this study, there is a unanimous impression that there is no “sense of rule of law”12 in the country. The problems may be broadly classified into highly dis-cretionary and arbitrary executive decisions; slow and weak judiciary system; and ineffective rule making.
Highly discretionary and arbitrary executive decisionsRules can be enforced selectively and unpredictably, and be subject to preferences and sensitivities of those currently in decision-making positions. One indication of this is the flip-flopping and instability of policies. There is an apparent readiness to impose nonmarket interventions and, as a result, government actions are highly unpredictable. Executive decisions seem hos-tage to signs of outward resistance and public outcry, and respond arbitrarily to pressure. There is a view that some decisions are difficult to rationalize on sustain-able and consistency grounds. Examples cited include issues like changes in taxation without adequate prior consultation. There is a feeling that government uses its powers without consultation to solve fiscal prob-lems. One example is the Bureau of Internal Revenue Operation Kandado:13 this program is viewed with much apprehension by business people we inter-viewed, as it is seen more as a disincentive than a mechanism for compliance, especially since it has been implemented in the midst of the global financial crisis. Firms are threatened with closure.
Another problem for firms, particularly MSMEs, is sudden changes in standards after they have started working to meet ISO standards which are hard to comply with in the first place.14 Sudden changes
12 The extent to which agents have confidence in and abide by the rules of society, including the quality of contract enforcement, property rights, the police, the courts, and the likelihood of crime and violence (World Bank 2009b).
13 This is a recent program of the Bureau of Internal Revenue where closure of an establishment is immediately effected without giving the owners due process or a chance to explain their side.
14 Respondents complained that agencies sometimes suddenly changed these required standards without adequate consultation with the sector concerned.
in requirements without warning and training can be very disruptive as there is limited time to adjust. These and other issues of govern ment process raise the cost of doing business considerably. In the case of the Kandado program, for example, the susceptibil-ity to sudden closure without due warning increases the chances that businesses will be forced to fork over funds just to avoid disruptions. The additional decline in bargaining power is both unnerving and costly. The sudden changes in standards have sometimes raised the cost of fulfilling requirements that are needed for business, such as ISO certifi cation, beyond the means of firms, especially SMEs. A not uncommon response has been to relegate the business to the non-ISO spheres, which severely limits their ability to expand and participate in the world market.
Finally, recent prominent instances such as the case of Terminal 3 at Ninoy Aquino International Airport have raised doubts that policies and government commitments can reliably be maintained from one administration to another.
Weak judiciaryThe weak judiciary system worsens the unpredict-ability of government policies and decisions. This extends from the slow processes and sometimes incomprehensible decision-making in the courts to uneven application of laws at the prosecutorial level and the rampant unequal access among those with different levels of income and power. Because of this, the courts have become less reliable as an avenue of redress for what may be deemed arbitrary and unfair decisions. Ultimately, there is no effective enforce-ment of laws and no protection of property rights. On the other hand, the long delays in court processes have often translated into effective appropriation of assets. For example, under a high interest rate regime, the inability to foreclose on collateral can amount to an effective loss of the present value of the collateral. Some of the foreclosure proceedings have taken as long as 15 or more years. If the effective interest rate is in the neighborhood of 15%–20%, this amounts to a loss of the amount lent. Adding the cost of litigation
16 Private Sector Assessment: Philippines
effectively leads to a realized loss on the credit trans-action even if the creditor is able to foreclose in the end. The resulting increase in interest rates (to incor-porate the high probability of loss) because of the lengthy court process serves effectively to block potentially beneficial projects from the economy.
Right of way delays, partly from lengthy “tempo-rary restraining orders,” have led to an inability to complete critical transportation networks, result-ing in a much lower rate of return than intended in project feasibility studies. Aside from the indirect effect on the private sector because of the absence of adequate physical infrastructure, this phenom-enon has bedeviled private sector projects directly. The concerns over rights of way extend from the judicial to the executive, as political concerns can sometimes make implementing agencies reluctant to move. This has been a big problem, as the lack of rule of law leads into other governance issues affecting the quality of institutions.
Congress and rule makingSome players feel they can influence the rules of the game. Manifestations mentioned include under-bidding in government projects with the implicit
expectation of cost escalation adjustments, unequal access and timing in procuring bidding documents, and perceived advantage given to original propo-nents by unsolicited proposals.15 Corollary to this is the feeling of many if not most businesses, espe-cially the MSMEs, that they are at the receiving end of this unequal bargain. The issuance of Executive Order 839 to control the oil price in Luzon demon-strates how the rules of the game may be changed without proper consultation (See Box 1).
Graft and corruptionGraft and corruption are one manifestation of the poor quality of institutions. Red tape and endemic petty corruption abound when good behavior is ignored and bad behavior is not penal-ized. Interviews and focus group discussions often brought up this troubling part of business opera-tions. What makes the absence of rule of law more detrimental is the unpredictability of red tape and corruption. It is difficult to make allowances for this added cost because the obstacle could come from several directions. It has become natural to fork over considerations just to get some normal government process completed. Table 5a presents the results of a World Bank/ADB survey on gifts for
15 Given the complexity of infrastructure projects, especially those under BOT-type arrangements, an unsolicited proposal gives the original proponent the time needed for studying the project (in some cases 1 or 2 years or even more) while the Swiss challenge given to third parties is much shorter. This effectively narrows the field to very few alternative providers or even just the original proponent.
Box 1 Executive Order 839 (Oil Price Control in Luzon): Government Readiness to Impose Nonmarket Interventions
In October 2009, the administration issued Executive Order 839, which imposed price controls on oil in Luzon in response to recent calamities there, parti cularly the Ondoy typhoon. This was preemptively issued even while was no widespread clamor for price controls and the order covered an area far in excess of the typhoon’s impact. However, there was extensive comment that the government appeared unprepared for the calamity and even standby arrangements seemed inadequate. Local business groups and foreign chambers of commerce argued against the controls, pointing to possible market distortions, shortages, creation of a black market, and misalloca-tion of this subsidy to unintended socioeconomic groups—leading to profit losses and disincentive for investments. With the market intervention on oil, prices cannot fulfill their usual function of rationing available supply among consumers. Some form of alternative rationing is needed, which is likely to put much of the burden, opportunity cost of time, on middle-class drivers. Parallel to this, the inability of prices to fulfill the rationing function just leads to shortages in the customary legal market.
After an interval the order was withdrawn, but the message had already been sent: Executive Order 839 shows the government’s readiness to introduce nonmarket interventions as arbitrary responses that tend to be populist and lack appropriate consultation with other stakeholders. This unpredictability in government policies adds to uncer-tainty for businesses in their projections of revenues and costs. This raises either the reserve for contingencies built into project projections or the investment hurdle rates needed for investment in the country.
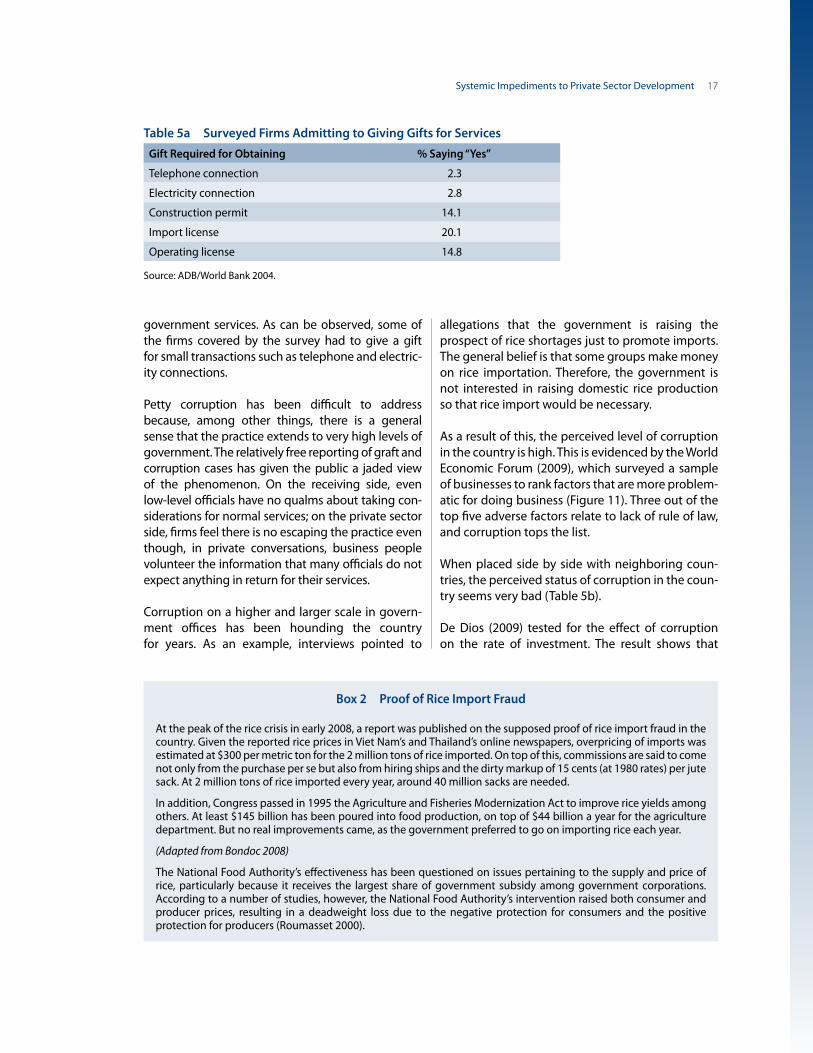
Systemic Impediments to Private Sector Development 17
government services. As can be observed, some of the firms covered by the survey had to give a gift for small transactions such as telephone and electric-ity connections.
Petty corruption has been difficult to address because, among other things, there is a general sense that the practice extends to very high levels of government. The relatively free reporting of graft and corruption cases has given the public a jaded view of the phenomenon. On the receiving side, even low-level officials have no qualms about taking con-siderations for normal services; on the private sector side, firms feel there is no escaping the practice even though, in private conversations, business people volunteer the information that many officials do not expect anything in return for their services.
Corruption on a higher and larger scale in govern-ment offices has been hounding the country for years. As an example, interviews pointed to
allegations that the government is raising the prospect of rice shortages just to promote imports. The general belief is that some groups make money on rice importation. Therefore, the government is not interested in raising domestic rice production so that rice import would be necessary.
As a result of this, the perceived level of corruption in the country is high. This is evidenced by the World Economic Forum (2009), which surveyed a sample of businesses to rank factors that are more problem-atic for doing business (Figure 11). Three out of the top five adverse factors relate to lack of rule of law, and corruption tops the list.
When placed side by side with neighboring coun-tries, the perceived status of corruption in the coun-try seems very bad (Table 5b).
De Dios (2009) tested for the effect of corruption on the rate of investment. The result shows that
Box 2 Proof of Rice Import Fraud
At the peak of the rice crisis in early 2008, a report was published on the supposed proof of rice import fraud in the country. Given the reported rice prices in Viet Nam’s and Thailand’s online newspapers, overpricing of imports was estimated at $300 per metric ton for the 2 million tons of rice imported. On top of this, commissions are said to come not only from the purchase per se but also from hiring ships and the dirty markup of 15 cents (at 1980 rates) per jute sack. At 2 million tons of rice imported every year, around 40 million sacks are needed.
In addition, Congress passed in 1995 the Agriculture and Fisheries Modernization Act to improve rice yields among others. At least $145 billion has been poured into food production, on top of $44 billion a year for the agriculture department. But no real improvements came, as the government preferred to go on importing rice each year.
(Adapted from Bondoc 2008)
The National Food Authority’s effectiveness has been questioned on issues pertaining to the supply and price of rice, particularly because it receives the largest share of government subsidy among government corporations. According to a number of studies, however, the National Food Authority’s intervention raised both consumer and producer prices, resulting in a deadweight loss due to the negative protection for consumers and the positive protection for producers (Roumasset 2000).
Table 5a Surveyed Firms Admitting to Giving Gifts for Services
Source: ADB/World Bank 2004.
Gift Required for Obtaining % Saying “Yes”
Telephone connection 2.3
Electricity connection 2.8
Construction permit 14.1
Import license 20.1
Operating license 14.8

18 Private Sector Assessment: Philippines
“the corruption index, whether current or lagged, emerges as an important variable explaining the investment rate, sometimes overshadowing more traditional explanatory variables such as real interest rates or predicted or lagged GDP.” This is supported by the result of an empirical study by Mapa and Balisacan (2004) presenting evidence on the importance of institutions. Using Philippine data from 1975 to 2000, the study found that “the quality of government institutions is positively correlated with economic growth. The estimated coefficient of 0.174 implies that an improvement in the quality of public institutions, meriting a one-point increase in the Knack and Keefer scale (0 as
worst, 10 as best), results in an estimated 17 basis points increase on the average growth rate of income per person. This result supports the critical role played by public institutions in the pursuit of higher economic growth.”
Muslim Mindanao: Peace and order situationA similar phenomenon of weak institutions is manifested in Muslim Mindanao, this time under-developed market institutions. Given the large population, the most rapidly growing in the area, one would expect the presence of many and healthy business establishments. Instead one sees a paucity
Figure 11 Philippines’ Most Problematic Factors for Doing Business
The most problematic factors for doing business
Corruption .................................................................. 24.3Ine�cient government bureaucracy ................ 20.6Inadequate supply of infrastructure .................. 15.0Policy instability ........................................................ 12.6Access to �nancing .................................................... 5.2Tax regulations ............................................................ 4.8Crime and theft .......................................................... 3.3Tax rates ........................................................................ 3.3Government instability/coups .............................. 2.8Restrictive labor regulations .................................. 2.4Poor public health ...................................................... 2.4Poor work ethic in national labor force .............. 2.0Inadequately educated workforce ...................... 0.7In�ation .......................................................................... 0.6Foreign currency regulations ................................ 0.0
% of Responses
0 5 10 15 20 25 30
Note: From a list of 15 factors, respondents were asked to select the 5 most problematic for doing business in their country/economy and to rank them between 1 (most problematic) and 5. The bars in the figure show the responses weighted according to their rankings.Source: World Economic Forum 2009.
Table 5b Comparison of Ranking in the Worldwide Corruptions Perception across Some Southeast Asian Countries
Source: Transparency International.
Country 2008 Ranking (out of 180 countries)
Korea, Republic of 40
Malaysia 47
China, People’s Republic of 72
Thailand 80
Viet Nam 121
Indonesia 126
Philippines 141
Cambodia 166
Systemic Impediments to Private Sector Development 19
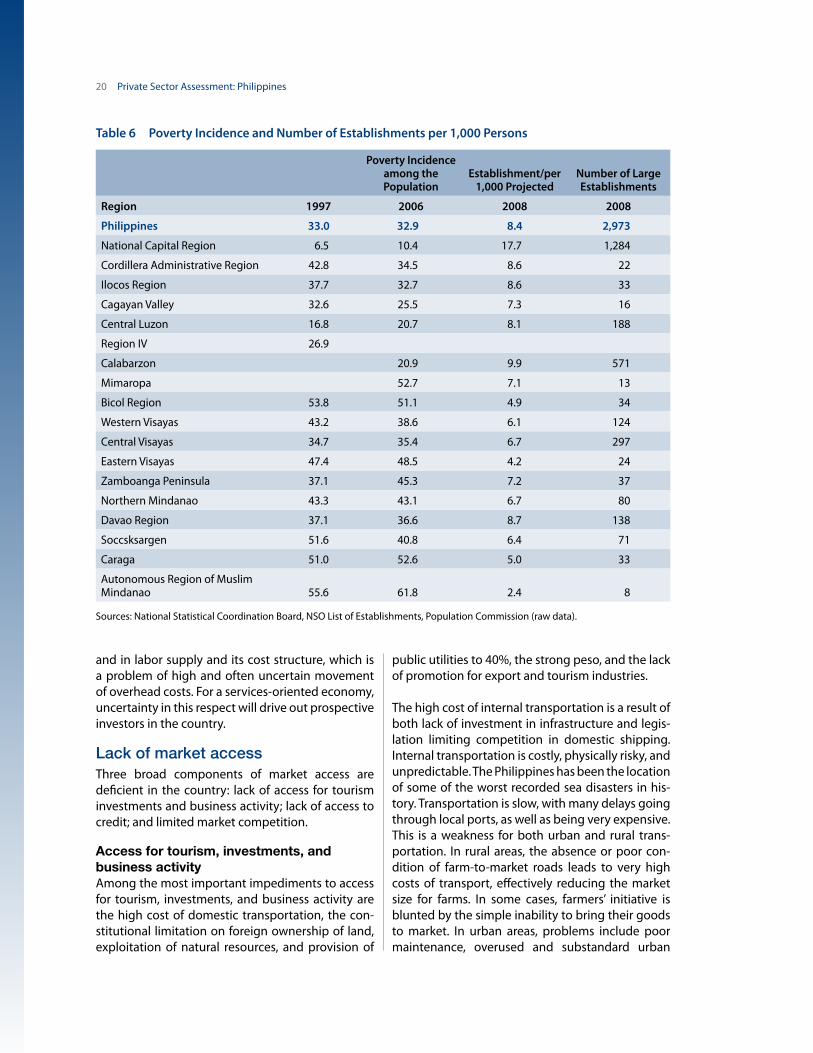
of firms and other evidence of healthy commerce. The Autonomous Region of Muslim Mindanao (ARMM) has the lowest number of businesses per 1,000 persons in the whole country. Some of this can be attributed to poverty and consequent low effective demand. But a comparison with other low-income regions such as Caraga, Soccsksargen (which has a significant Muslim population), and Bicol shows that ARMM’s low number of establish-ments is still out of line even when poverty is con-sidered. The peace and order situation is often men-tioned in interviews as a major reason. Beyond that, also mentioned is the awkward melding of Muslim social norms, such as the prohibition against explicit charging of interest rates on loans, with the more Western practices of the socioeconomic business infrastructure in the majority of the country, like the banking industry. Financing, technology, marketing networks, and similar economic resources from the more generously endowed sections of the country have a difficult time penetrating this region. The result is a significant lag in economic activity.
One potential intervention by policy makers would be to research social and economic innovations that would successfully fuse the socioeconomic infra-structure of the region to that being used in the rest of the country. This could take the form of more spe-cific and nuanced interpretation of banking laws, legal contracts, and similar institutions.
There also seems to be a much stronger expectation of collective social sharing by successful individuals and families with the rest of the village or town. A very strong enforcement mechanism of this social expectation could lead to deleterious moral hazard in business risk taking and innovation. It is in this context that the much stronger patronage political system is often interpreted. Sometimes also cited is the kidnap-for-ransom phenomenon, with quite strong community roots and support, as a means of extracting the expected social sharing from unwill-ing successful individuals and families.
Thus, despite the higher population in ARMM compared to Caraga, Mimaropa, and the Cordillera
Administrative Region, it has the least number of establishments16 in the country, and accordingly the lowest number of employed persons (Table 6). A simple Pearson’s correlation reveals a strong nega-tive correlation17 (–79%) between number of firms and poverty incidence. Furthermore, running a simple regression model18 shows that every 10,000 additional establishments will decrease poverty incidence in a region by 2.29%.
Key persons in Mindanao who were interviewed stated that the security problem19 is just a manifes-tation of a bigger problem—poverty and the lack of opportunities. Hence policy and program inter-ventions that have the ultimate effect of providing employment opportunities in that area are seen to help eradicate the problem altogether.
Weak creditor and property rightsAs mentioned in the PSA (ADB 2005), the absence of a modern insolvency law makes debt relief pro-ceedings in the country inefficient. The importance of reviewing and amending the existing century-old insolvency laws was emphasized by the global financial crisis in 2008, as it led to financial distress and even bankruptcy for some firms in the coun-try. In February 2010, 10 years after the bill was first filed, the Financial Rehabilitation and Insolvency Act was passed. The new law is aimed at providing for the liquidation of financially distressed compa-nies and individuals. It requires courts to approve or reject sole proprietorships and corporate rehabilita-tion proposals within a year, and gives firms more options on how to get out of financial trouble.
The Philippine Real Estate Investment Trust Law was also passed in January 2010 despite opposition from the Department of Finance, citing its harm on tax revenues.
Inadequate business environmentAs an investment location, the Philippines is charac-terized by uncertainty emanating not only from its rule of law that affects institutional quality but also in the structure of its inputs—infrastructure and labor. This is very apparent in the supply of power
16 ARMM had only eight large establishments in 2008.
17 Using 2006 data for both variables.
18 R-squared of 62.5%.
19 However, one must avoid overextending the kidnap-for-ransom phenomenon as a taxation mechanism to become an excuse for an unlawful act.
20 Private Sector Assessment: Philippines
and in labor supply and its cost structure, which is a problem of high and often uncertain movement of overhead costs. For a services-oriented economy, uncertainty in this respect will drive out prospective investors in the country.
Lack of market accessThree broad components of market access are deficient in the country: lack of access for tourism investments and business activity; lack of access to credit; and limited market competition.
Access for tourism, investments, and business activityAmong the most important impediments to access for tourism, investments, and business activity are the high cost of domestic transportation, the con-stitutional limitation on foreign ownership of land, exploitation of natural resources, and provision of
public utilities to 40%, the strong peso, and the lack of promotion for export and tourism industries.
The high cost of internal transportation is a result of both lack of investment in infrastructure and legis-lation limiting competition in domestic shipping. Internal transportation is costly, physically risky, and unpredictable. The Philippines has been the location of some of the worst recorded sea disasters in his-tory. Transportation is slow, with many delays going through local ports, as well as being very expensive. This is a weakness for both urban and rural trans-portation. In rural areas, the absence or poor con-dition of farm-to-market roads leads to very high costs of transport, effectively reducing the market size for farms. In some cases, farmers’ initiative is blunted by the simple inability to bring their goods to market. In urban areas, problems include poor maintenance, overused and substandard urban
Table 6 Poverty Incidence and Number of Establishments per 1,000 Persons
Sources: National Statistical Coordination Board, NSO List of Establishments, Population Commission (raw data).
Poverty Incidence among the Population
Establishment/per 1,000 Projected
Number of Large Establishments
Region 1997 2006 2008 2008
Philippines 33.0 32.9 8.4 2,973
National Capital Region 6.5 10.4 17.7 1,284
Cordillera Administrative Region 42.8 34.5 8.6 22
Ilocos Region 37.7 32.7 8.6 33
Cagayan Valley 32.6 25.5 7.3 16
Central Luzon 16.8 20.7 8.1 188
Region IV 26.9
Calabarzon 20.9 9.9 571
Mimaropa 52.7 7.1 13
Bicol Region 53.8 51.1 4.9 34
Western Visayas 43.2 38.6 6.1 124
Central Visayas 34.7 35.4 6.7 297
Eastern Visayas 47.4 48.5 4.2 24
Zamboanga Peninsula 37.1 45.3 7.2 37
Northern Mindanao 43.3 43.1 6.7 80
Davao Region 37.1 36.6 8.7 138
Soccsksargen 51.6 40.8 6.4 71
Caraga 51.0 52.6 5.0 33
Autonomous Region of Muslim Mindanao 55.6 61.8 2.4 8

Systemic Impediments to Private Sector Development 21
roads, and significant traffic problems. As a result, the value chain for Philippine production and distri-bution is unnecessarily costly. This is a big burden for local business and puts exporters at a tremendous disadvantage, particularly MSMEs. Even domestic producers located outside the largest market of Metro Manila can be at a disadvantage with respect to imports from neighboring countries. Table 7 on ocean freight costs gives an indication of the size of this disadvantage. The losses become even more significant if you add the farm-to-market losses due to poor infrastructure and poor public transport.
A persistent theme in the interviews centered on the need to repeal the Cabotage Law which limits ports of entry. The law prohibits foreign-flag vessels from picking up local cargo for delivery to another port within the Philippines. This arrangement limits competition for domestic shipping to nationals; because of the size of investment relative to local capital funds, this has led to an oligopolistic industry that has exhibited cartel-like behavior in the past. There has been no inducement for local ship opera-tors to compete in terms of freight cost and service quality given the absence of international opera-tors. Further, given the fragmentation of the market and the absence of effective competition, the status quo is not conducive to shipping companies being able to take advantage of economies of scale; nor is there a need to do so. The result is a very inefficient and costly inter-island shipping transport system.
This seems to be the biggest hindrance to encour-aging inter-island travel and cargo in the country. Since the country is archipelagic, the debilitating effect is magnified. Most adversely affected by the Cabotage Law is Mindanao and, among businesses, the MSMEs. The added cost is probably already delete rious to these businesses, but the delays caused by inefficient ports, narrow roads, and small bridges are doubly debilitating because they do not have the buffer of larger enterprises. Table 7 shows the cost of shipping from Manila to Davao and different countries.
Using an exchange rate of P50 per $1, shipping from Manila to Jakarta (1,308 nautical miles) is still cheaper at $714.80 than shipping from Manila to Davao (829 nautical miles) at $1,047.14. This challenge is somewhat remedied by the presence of roll-on/ roll-off ships which have been provided as part of the government’s Strong Republic Nautical Highway to enable land vehicles to use ships and ferries to travel to different islands of the country.
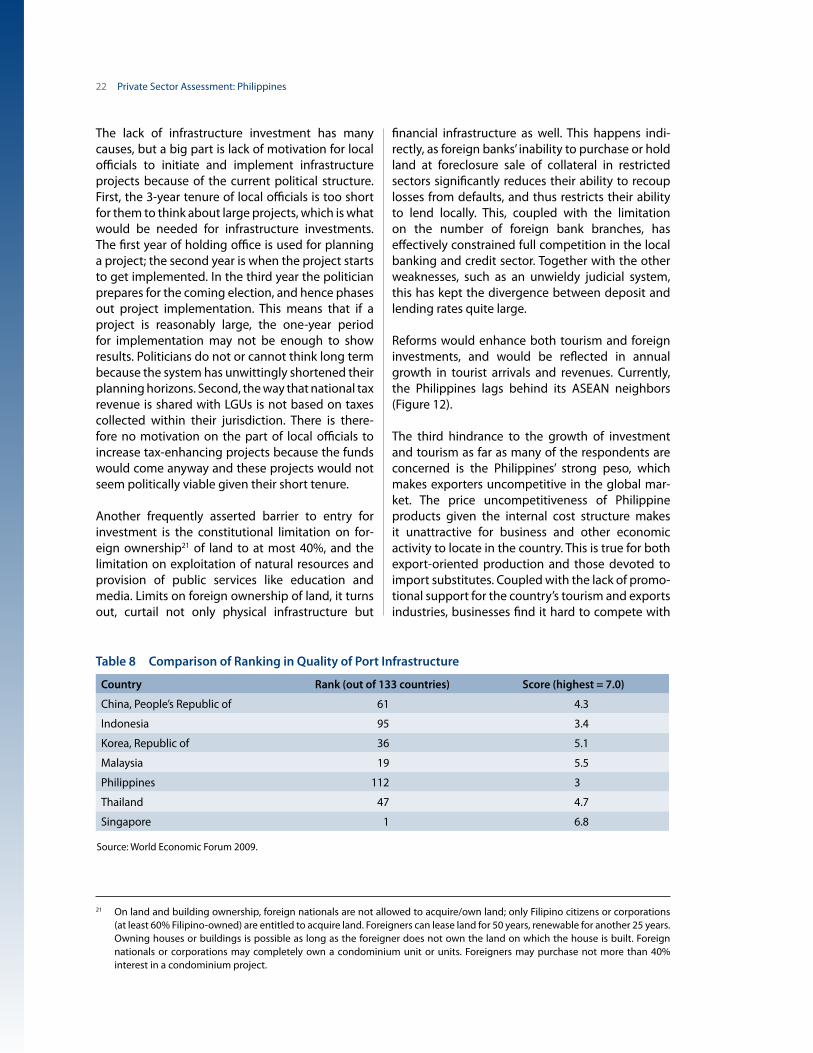
The World Bank (2007) lists port efficiency20 as a critical factor in whether countries can trade goods and services on time and at a low cost. It therefore comes as no surprise that the World Economic Forum (2009) ranks the Philippines 112 out of 133 countries in terms of port infrastructure. The comparison in Table 8 shows the country’s perfor-mance vis-à-vis other Asian countries.
20 Along with the performance of customs, trade-related infrastructure, inland transit, logistics services, and information systems.
n.m. = nautical mile.* Excludes terminal handling fee of P3,220 and documentation fee of $20.** Includes local arrastre at ports of origin and destination, wharfage, and document stamps.Sources: Commission on Audit, Philippine Shippers’ Bureau and Domestic Shipowners’ Association.
Table 7 Ocean Freight Rates
Ocean Freight RatesFreight Rates of Ocean Going Vessels
RouteDistance
(n.m.)Freight
($)* Rate/n.m.
Manila–Kaohsiung 547 300 0.55
Manila–Hong Kong, China 633 250 0.39
Manila–Singapore 1,308 350 0.27
Manila–Bangkok 1,485 600 0.40
Manila–Jakarta 1,308 650 0.41
Freight Rates of Domestic Vessels for Export Cargoes
Manila–Davao 829 1,047.14** 0.97
22 Private Sector Assessment: Philippines
The lack of infrastructure investment has many causes, but a big part is lack of motivation for local officials to initiate and implement infrastructure projects because of the current political structure. First, the 3-year tenure of local officials is too short for them to think about large projects, which is what would be needed for infrastructure investments. The first year of holding office is used for planning a project; the second year is when the project starts to get implemented. In the third year the politician prepares for the coming election, and hence phases out project implementation. This means that if a project is reasonably large, the one-year period for implementation may not be enough to show results. Politicians do not or cannot think long term because the system has unwittingly shortened their planning horizons. Second, the way that national tax revenue is shared with LGUs is not based on taxes collected within their jurisdiction. There is there-fore no motivation on the part of local officials to increase tax-enhancing projects because the funds would come anyway and these projects would not seem politically viable given their short tenure.
Another frequently asserted barrier to entry for investment is the constitutional limitation on for-eign ownership21 of land to at most 40%, and the limitation on exploitation of natural resources and provision of public services like education and media. Limits on foreign ownership of land, it turns out, curtail not only physical infrastructure but
21 On land and building ownership, foreign nationals are not allowed to acquire/own land; only Filipino citizens or corporations (at least 60% Filipino-owned) are entitled to acquire land. Foreigners can lease land for 50 years, renewable for another 25 years. Owning houses or buildings is possible as long as the foreigner does not own the land on which the house is built. Foreign nationals or corporations may completely own a condominium unit or units. Foreigners may purchase not more than 40% interest in a condominium project.
Table 8 Comparison of Ranking in Quality of Port Infrastructure
Source: World Economic Forum 2009.
Country Rank (out of 133 countries) Score (highest = 7.0)
China, People’s Republic of 61 4.3
Indonesia 95 3.4
Korea, Republic of 36 5.1
Malaysia 19 5.5
Philippines 112 3
Thailand 47 4.7
Singapore 1 6.8
financial infrastructure as well. This happens indi-rectly, as foreign banks’ inability to purchase or hold land at foreclosure sale of collateral in restricted sectors significantly reduces their ability to recoup losses from defaults, and thus restricts their ability to lend locally. This, coupled with the limitation on the number of foreign bank branches, has effectively constrained full competition in the local banking and credit sector. Together with the other weaknesses, such as an unwieldy judicial system, this has kept the divergence between deposit and lending rates quite large.
Reforms would enhance both tourism and foreign investments, and would be reflected in annual growth in tourist arrivals and revenues. Currently, the Philippines lags behind its ASEAN neighbors (Figure 12).
The third hindrance to the growth of investment and tourism as far as many of the respondents are concerned is the Philippines’ strong peso, which makes exporters uncompetitive in the global mar-ket. The price uncompetitiveness of Philippine products given the internal cost structure makes it unattractive for business and other economic activity to locate in the country. This is true for both export-oriented production and those devoted to import substitutes. Coupled with the lack of promo-tional support for the country’s tourism and exports industries, businesses find it hard to compete with
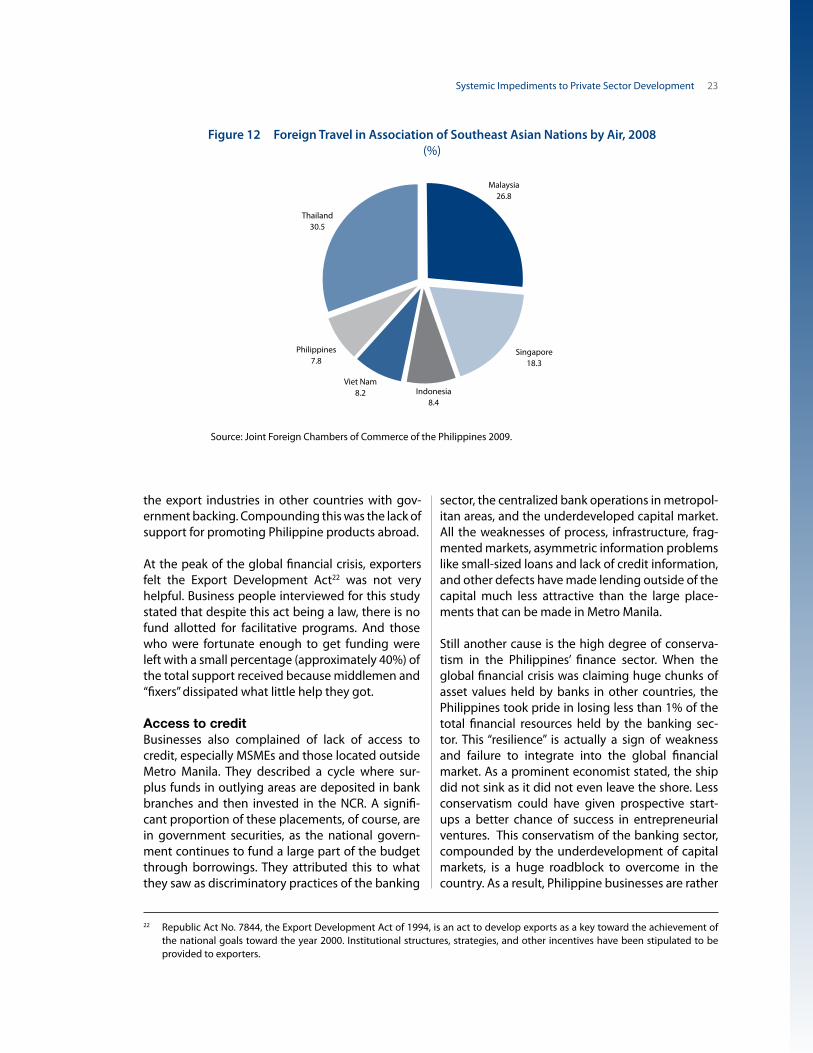
Systemic Impediments to Private Sector Development 23
the export industries in other countries with gov-ernment backing. Compounding this was the lack of support for promoting Philippine products abroad.
At the peak of the global financial crisis, exporters felt the Export Development Act22 was not very helpful. Business people interviewed for this study stated that despite this act being a law, there is no fund allotted for facilitative programs. And those who were fortunate enough to get funding were left with a small percentage (approximately 40%) of the total support received because middlemen and “fixers” dissipated what little help they got.
Access to creditBusinesses also complained of lack of access to credit, especially MSMEs and those located outside Metro Manila. They described a cycle where sur-plus funds in outlying areas are deposited in bank branches and then invested in the NCR. A signifi-cant proportion of these placements, of course, are in government securities, as the national govern-ment continues to fund a large part of the budget through borrowings. They attributed this to what they saw as discriminatory practices of the banking
22 Republic Act No. 7844, the Export Development Act of 1994, is an act to develop exports as a key toward the achievement of the national goals toward the year 2000. Institutional structures, strategies, and other incentives have been stipulated to be provided to exporters.
sector, the centralized bank operations in metropol-itan areas, and the underdeveloped capital market. All the weaknesses of process, infrastructure, frag-mented markets, asymmetric information problems like small-sized loans and lack of credit information, and other defects have made lending outside of the capital much less attractive than the large place-ments that can be made in Metro Manila.
Still another cause is the high degree of conserva-tism in the Philippines’ finance sector. When the global financial crisis was claiming huge chunks of asset values held by banks in other countries, the Philippines took pride in losing less than 1% of the total financial resources held by the banking sec-tor. This “resilience” is actually a sign of weakness and failure to integrate into the global financial market. As a prominent economist stated, the ship did not sink as it did not even leave the shore. Less conservatism could have given prospective start-ups a better chance of success in entrepreneurial ventures. This conservatism of the banking sector, compounded by the underdevelopment of capital markets, is a huge roadblock to overcome in the country. As a result, Philippine businesses are rather
Malaysia26.8
Singapore18.3
Indonesia8.4
Viet Nam8.2
Philippines7.8
Thailand30.5
Figure 12 Foreign Travel in Association of Southeast Asian Nations by Air, 2008 (%)
Source: Joint Foreign Chambers of Commerce of the Philippines 2009.
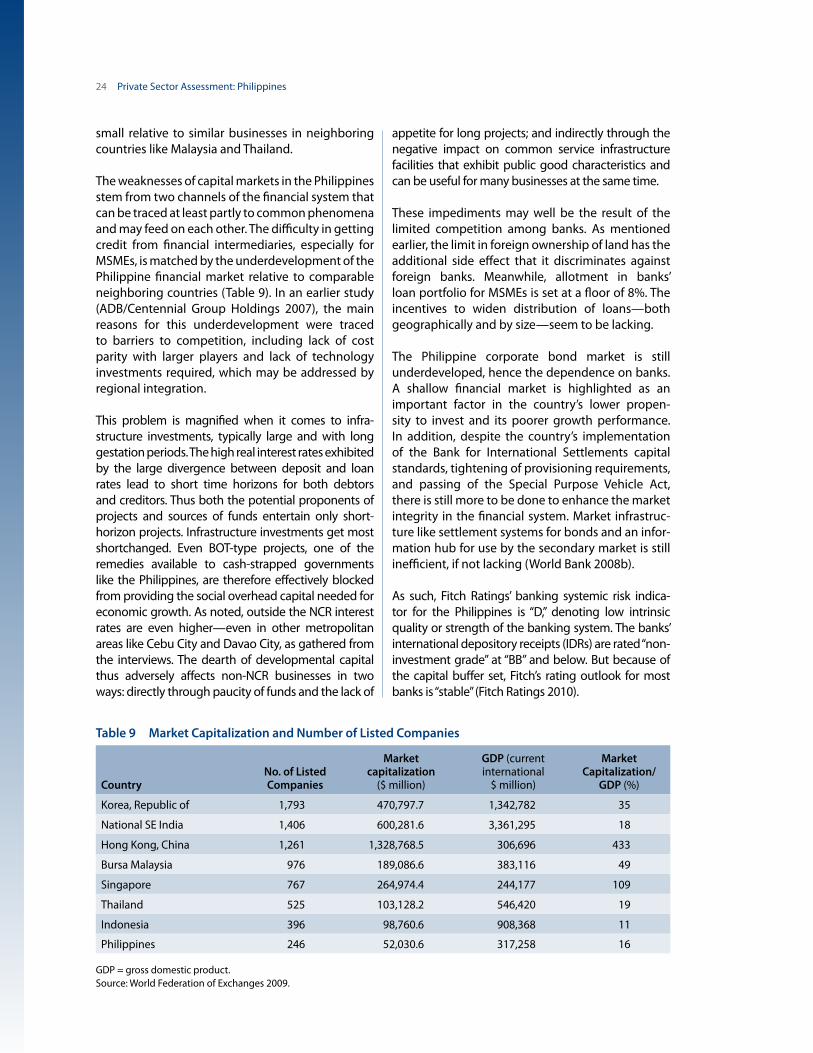
24 Private Sector Assessment: Philippines
small relative to similar businesses in neighboring countries like Malaysia and Thailand.
The weaknesses of capital markets in the Philippines stem from two channels of the financial system that can be traced at least partly to common phenomena and may feed on each other. The difficulty in getting credit from financial intermediaries, especially for MSMEs, is matched by the underdevelopment of the Philippine financial market relative to comparable neighboring countries (Table 9). In an earlier study (ADB/Centennial Group Holdings 2007), the main reasons for this underdevelopment were traced to barriers to competition, including lack of cost parity with larger players and lack of technology investments required, which may be addressed by regional integration.
This problem is magnified when it comes to infra-structure investments, typically large and with long gestation periods. The high real interest rates exhibited by the large divergence between deposit and loan rates lead to short time horizons for both debtors and creditors. Thus both the potential pro ponents of projects and sources of funds entertain only short-horizon projects. Infrastructure investments get most shortchanged. Even BOT-type projects, one of the remedies available to cash-strapped governments like the Philippines, are therefore effectively blocked from providing the social overhead capital needed for economic growth. As noted, outside the NCR interest rates are even higher—even in other metropolitan areas like Cebu City and Davao City, as gathered from the interviews. The dearth of developmental capital thus adversely affects non-NCR businesses in two ways: directly through paucity of funds and the lack of
appetite for long projects; and indirectly through the negative impact on common service infrastructure facilities that exhibit public good characteristics and can be useful for many businesses at the same time.
These impediments may well be the result of the limited competition among banks. As mentioned earlier, the limit in foreign ownership of land has the additional side effect that it discriminates against foreign banks. Meanwhile, allotment in banks’ loan portfolio for MSMEs is set at a floor of 8%. The incentives to widen distribution of loans—both geograph ically and by size—seem to be lacking.
The Philippine corporate bond market is still underdeveloped, hence the dependence on banks. A shallow financial market is highlighted as an important factor in the country’s lower propen-sity to invest and its poorer growth performance. In addition, despite the country’s implementation of the Bank for International Settlements capital standards, tightening of provisioning requirements, and passing of the Special Purpose Vehicle Act, there is still more to be done to enhance the market integrity in the financial system. Market infrastruc-ture like settlement systems for bonds and an infor-mation hub for use by the secondary market is still inefficient, if not lacking (World Bank 2008b).
As such, Fitch Ratings’ banking systemic risk indica-tor for the Philippines is “D,” denoting low intrinsic quality or strength of the banking system. The banks’ international depository receipts (IDRs) are rated “non-investment grade” at “BB” and below. But because of the capital buffer set, Fitch’s rating outlook for most banks is “stable” (Fitch Ratings 2010).
Table 9 Market Capitalization and Number of Listed Companies
CountryNo. of Listed Companies
Market capitalization
($ million)
GDP (current international
$ million)
Market Capitalization/
GDP (%)
Korea, Republic of 1,793 470,797.7 1,342,782 35
National SE India 1,406 600,281.6 3,361,295 18
Hong Kong, China 1,261 1,328,768.5 306,696 433
Bursa Malaysia 976 189,086.6 383,116 49
Singapore 767 264,974.4 244,177 109
Thailand 525 103,128.2 546,420 19
Indonesia 396 98,760.6 908,368 11
Philippines 246 52,030.6 317,258 16
GDP = gross domestic product.Source: World Federation of Exchanges 2009.

Systemic Impediments to Private Sector Development 25
Limited market competitionThe impediments discussed above have so far been felt to be causing and reinforcing each other. For example, one of the reasons for the lack of market competition is the perceived lack of rule of law. In some industries, such as ports, there is a feeling that unequal access to information, the large capital requirements, difficul-ties in entry by foreign players, and the complexities of bidding procedures combine to make the market not fully competitive—the playing field is uneven. Observers point out that prominent cases of privatiza-tion in recent years have gone to a very select set of market players, implying that other business groups have limited opportunity to participate in these exer-cises. These sectors become susceptible to cronyism and regulatory capture. In cases such as ports, cartel-like behavior has led to high prices in inter-island transport and also for industries that use this service extensively, making their costs increase. With this prevalent impression, risk taking and investments are drastically curtailed. The interviews brought up the complaint that, in this environment, it is not what you know but who you know. It is network over knowl-edge. Currently the country does not have an antitrust law, making the prevention of monopolistic practices even more difficult.
This impression is accentuated by the feeling of small businesses that they are left to fend for themselves in an essentially hostile environment. The lack of facilitation mechanisms like a business incubation feature designed to help them graduate to larger scale was mentioned. For instance, the Barangay Micro Business Enterprise Law waives national taxes but not local taxes. In addition, there is no office that handles SMEs. The Department of Trade and Industry cannot reach out to SMEs because the Small and Medium Enterprise Development Law does not specify that local government should be responsible for the enterprise development pro-gram. Currently, issuance of an executive order for creation of local/city SME councils is needed.
The means to make technology easily accessible, especially for SMEs and those located outside Manila, seems deficient. The inadequacy of the support net-
work of laboratories for research and development (R & D) adds transport costs to Manila and has the effect of increasing the cost of doing business, making entry difficult.23 Substantive skills enhancement programs seem inadequate for a global market. Consequently, even some of the big firms in the country miss the opportunity to get orders because of a lack of supply of skilled workers and the technology to match.
Uncertainty in the supply of electricity and the high cost associated with it were discussed in the previous PSA (ADB 2005). In a study by JPMorgan Chase on investment competitiveness, the Philippines (14 cents per kilowatt-hour) was noted to have overtaken Japan24 (11 cents per kilowatt-hour) in having the highest electricity cost in Asia. Some firms have reacted to this by relocating to countries with cheaper electricity, like Viet Nam. Lawmakers point out that government royalty taxes on natural gas and other indigenous sources are very high (and natural gas accounts for 30% of the fuel used to produce electricity). Newspapers report that the Philippines is the only country that collects a 60% royalty on indig-enous fuel sources (Diaz 2009).
The problem involves interplay of several factors, including lack of credibility in the country’s busi-ness and government processes that impedes the private sector from pursuing a partnership with the government to provide this kind of infrastructure, and the lack of appropriate capital instruments to match the duration of the project. For Visayas and Mindanao the power crisis is already serious, and rotating blackouts have recently been experienced. In Visayas, a power plant is currently being con-structed; in Mindanao, on the other hand, with the lowest electricity cost in the country, investors are noted to be uninterested in building a power plant.
Another consideration for service-oriented inves-tors is the structure of labor cost and the flexibil-ity attached to decisions regarding hiring and fir-ing employees. The World Bank (2010) ranked the Philippines at 115 (out of 144 countries) in ease of employing workers25—an improvement from 126 (out of 141 countries) in 2009 but still a low rank.
23 At the same time, this results in some professionals pursuing research in other countries where better facilities are provided.
24 It was only in the previous year that Japan still held the top spot.
25 Ease in employing workers includes measures for difficulty of hiring, rigidity of hours, difficulty of firing, rigidity of employment, and firing cost (weeks of salary).

26 Private Sector Assessment: Philippines
With respect to labor cost, the Philippines is among the countries in the region with the highest minimum wage level (Table 10). Pushing for a decrease in this level (if not for its repeal) is a very controversial issue, as it serves as the primary safety net for less skilled workers.
While it may be argued that the relatively high level of wages in the country can be overcome by the value proposition of services (e.g., good English communication skills, creativity, nonconfronta- tional, etc.), the labor costs are still a bit steep and the quality of labor advantages are being eroded. Another reason for investor wariness is
Table 10 Daily Minimum Wage in Selected Asian Countries, December 2009
Country
Daily Minimum Wage as of December 2009
($)
Viet Nam 1.26–1.55
Cambodia 1.49–1.66
Indonesia 1.95–3.63
China, People’s Republic of 3.66–4.14
Thailand 4.44–6.09
Malaysia 7.19–15.40
NCR, Philippines 8.09
NCR = National Capital Region.Source: Cabarles (2009).
Box 3 Substitute Bill on Security of Tenure
This bill entitles subcontracted employees to all the rights and privileges due to regular employees, including the following.
y Safe and healthy working conditions y Labor standards
� Service incentive leaves � Rest days � Overtime pay � Holiday pay � 13th-month pay � Separation pay
y Retirement benefits y Social security and welfare benefits y Self-organization, collective bargaining, and peaceful concerted activities y Security of tenure
These conditions remove employer flexibility in contracting labor for short-term projects. Most affected are the BPO firms and the export sector that most often need the ability to contract or expand their labor force with respect to the projects they are awarded. In an era of a highly globalized world, some degree of flexibility and appropriate types of safety nets have to be shaped to take advantage of the current flow of business across borders.
the relative inflexibility of the country’s labor laws. Many provisions in the Labor Code appear to be have been left behind by globalization, such as the restriction on women’s working hours, shifts of work time, and required facilities inside firm-owned buildings given a certain number of workers. Requirements of services-oriented indus-tries such as fixed-period contracts, particularly for BPO, often require flexibility in contracts for hiring and terminating to make business viable/profit-able. The pending bill on security of tenure cur-rently in Congress has caused some hesitation in investment until the provisions of the law that may actually be passed become known.

27
There really has not been much change since the previous PSA (ADB 2005) in most of the sectors considered.
Physical infrastructure
Table 11 shows the quality of infrastructure in the Philippines against 133 countries considered in the Global Competitiveness Report (World Economic Forum 2009). Except for the number of available seat kilometers, the country has been a laggard in terms of infrastructure.
A big hindrance to infrastructure development, especially in the countryside, is the conservatism of the capital markets, including banks. There is a dearth of financing for infrastructure projects beyond the few large projects undertaken by major business groups. This is especially true in local infrastructure, given the requirements of the local government code; also, funders often require national government guarantee because of the difficulty in securing loan repayment in the face of short local terms of office. As mentioned in the previous section, high interest rates and short loan terms are a big hindrance to the development and implementation of infrastructure projects. And for the countryside, the requirements for collateral are very pressing since some land-use classifications are not acceptable for banks. The most viable way to get around the lack of capital for projects is
to get guarantees from multilateral institutions like the World Bank, ADB, and Japan International Cooperation Agency.
Another constraint to the growth of hard infra-structure in the countryside is the local govern-ment’s “cherry-picking” of projects, choosing those with short gestation periods. The current political structure induces local officials to implement only projects that are financially viable in the short run. There is a need to enhance the rewards system for projects that are also socially beneficial. This area has a large potential for PPPs.
PowerThe country for a long time has been struggling with a number of challenges pertaining to energy supply and prices. Power supply is unstable and expen-sive, which indicates the need for more efforts to attain the goals of the World Energy Council toward sustain able energy (the 3As): availability of modern energy, accessibility to modern energy in terms of price, and acceptability of energy sector activities in terms of their environmental and social impacts (Viray 2008).
In terms of availability, installed capacity totaled 15,681 MW, while total dependable capacity is at 13,049 MW—83.2% of the total installed capacity. As of the 14th Electric Power Industry Reform Act (EPIRA) Implementation Status Report, covering November 2008 to April 2009, privatization of the generating
Table 11 Indicators for Infrastructure in the Philippines, 2009–2010
Indicators for Infrastructure Rank (out of 133 countries)
Quality of overall infrastructure 98
Quality of roads 104
Quality of railroad infrastructure 92
Quality of port infrastructure 112
Quality of air transport infrastructure 100
Available seat kilometers 28
Quality of electricity supply 87
Telephone lines 102
Source: World Economic Forum 2009.
Selected Sectors

28 Private Sector Assessment: Philippines
assets stands at 57.4% while operation, maintenance, and management of the high-voltage transmission assets were already transferred to the National Grid Corporation of the Philippines. As reported, in terms of proceeds the government earned a total of about $6.33 billion from the successful bids for generating and decommissioned power plants as well as the Transco concession.
With respect to the wholesale electricity spot market implementation, 18 generating companies, 8 distribu-tion utilities (DUs), and 5 registered direct suppliers directly participate in the market. The Energy Regulatory Commission has reported that it has been drafting guidelines in preparation for open access.
Accessibility of energy in terms of price has always been a problem. Factors affecting prices include costs of capital, technology for mitigating the envi-ronmental impact of energy extraction and conver-sion, provision for alleviating the social impact of energy projects, costs of technology and related equipment and services, costs of fuel like crude oil and coal, indexing of indigenous resources like geo-thermal with global coal prices, taxation, and royal-ties, and technological breakthrough for efficiency in energy production (Viray 2008). Inefficiencies in both production and distribution of energy have led to the continuous escalation of prices such that the country has now overtaken Japan as having the most expensive energy in the region.
As for acceptability, a consolidated version of Senate Bill No. 2046 and House Bill No. 4193 was signed into law on 16 December 2008 as Republic Act No. 9513, Promoting the Development, Utilization, and Com-mercialization of Renewable Energy Resources and for Other Purposes. It states that to encourage sup-pliers to contribute to the growth of renewable
energy, a renewable portfolio standard will be put in place, requiring all energy suppliers to source a portion of their energy from eligible renewable resources. Fiscal incentives are offered in proportion to the renewable energy components.
Despite these developments, more has to be done to decrease the cost of electricity significantly: this may be through examination of the cost components of electricity production and distribution, including taxes and royalties paid. Since energy is an important factor in growth, it is imperative for improvements in the sector to be introduced through legislative sup-port, pricing mechanisms for indigenous resources, technology enhancement, boosting R&D capability, and improving transparency in subsidy allocation.
Transport and inter-island travel For an archipelagic country like the Philippines, different modes and nodes of transportation are important to ensure growth is not concentrated in certain areas only. According to an assessment of the country’s road network (Table 12), infrastructure is not sufficient. Despite the coverage, more than half the roads are not in good condition. Congestion is fast becoming a problem in major urban centers like Metro Manila and Cebu City.
There is currently a total of 12 toll roads in the country: Bataan Provincial Expressway, Bulacan–Rizal–Manila–Cavite Regional Expressway, Cebu Trans-Axial Expressway, Manila–Cavite Expressway, Metro Manila Skyway, North East Luzon Expressway, North Luzon Expressway, South Luzon Expressway, Southern Tagalog Arterial Road, Subic–Clark–Tarlac Expressway, Tarlac–Nueva Ecija–Aurora Expressway, and Tarlac–Pangasinan–La Union Expressway. Clearly, extension and improvement of the road network are a feasible area for more PPPs. The BOT
Table 12 Length of Roads by Classification (km)Road Classification 1982 1985 1990 1995 2000 2005
National 23,783 26,190 26,272 26,720 30,013 28,952
Provincial 29,554 28,194 29,156 29,117 27,136 26,926
City 3,740 3,987 3,949 3,949 7,052 7,052
Municipal 12,142 12,825 12,820 12,820 15,804 15,804
Barangay 85,264 90,671 88,363 88,364 121,989 121,989
Total 154,483 161,867 160,560 160,970 201,994 200,722
Source: Javier 2008.

Selected Sectors 29
Law has been most helpful, but more has to be done to improve transparency and accountability in handling bids and project implementation, since road construction is one of the activities perceived to be most susceptible to corruption.
The railway system consists of a commuter service and a rapid transit system under the government’s Strong Republic Transit System project.26 As evi-dence of the good demand for and lack of adequate supply of rail services in Metro Manila, total Metro Rail Transit (MRT) ridership grew from 39,401,465 in 2000 to 149,585,563 in 2008.
Concerns on sufficiency of infrastructure are also voiced for ports and airports. In 2006, out of the 1,400 ports, only 25 were classified as major (Mangahas 2006). These concerns, however, may well be answered by legislative measures that increase competition in these sectors. On a positive note, the government enhanced the roll-on/roll-off system to connect Luzon and Mindanao through Visayas by launching the Nautical Highway in 2003. Inter-island transportation costs may be pushed further down if the Cabotage Law, among other things, is repealed. This, in turn, will translate to higher tourist arrivals and FDI inflow, and efficiency gains will be higher as internal trade will be easier and cheaper.
Water, sewerage, and sanitationThe structure of the water supply system in the country is fragmented. The National Water Resources Board regulates LGU-operated systems and water districts. In Metro Manila, water supply services are provided by the two concessions27 regulated by
26 Includes Philippine National Railways, Light Rail Transit Authority, and Metro Rail Transit Corporation.
27 The East Zone concessionaire is Manila Water Company, a Filipino firm owned by Ayalass [Ayala Corporation’s (?)] in joint venture with International Water formed by the US-based Bechtel Overseas and UK firm Northeast Water. The West Zone is handled by Maynilad Water Services, the Filipino firm BENPRES owned by the Lopezes in joint venture with the French firm Lyonnaise Des Eaux.
Metropolitan Waterworks and Sewerage System (MWSS). Table 13 shows that the situation in this sector calls for more efforts in expanding water ser-vices nationwide, especially in rural areas.
The country’s wastewater treatment system is an underrepresented sector, and has not stimulated significant attention from the investment sector. As yet there is no centralized sewerage in Metro Manila, which is why the Pasig River and Manila Bay are in very bad shape.
TelecommunicationsThe telecommunications industry makes an impor-tant contribution to the country’s economy, as two of the most active sectors are heavily dependent on it: the outsourcing and offshoring industry and the OFWs. Liberalization of telecommunications in 1995 was a move in the right direction, but more must be done. The Philippine Long Distance Telephone Company continues to dominate in the industry. Globe Telecommunications, Bayan Telecommunications, and Digitel share the remaining market.
The number of local exchange carrier service pro-viders went down from 77 in 2000 to 73 from 2003 to 2007, while cellular mobile telephone service providers doubled from 5 in 2000 to 10 in 2007.
Despite the need for telecommunications in the country and some degree of competition in the industry, penetration of telephone lines seems low at 4.48 persons per 100 population, while internet use stands at 6.03 persons. On the other hand, the number of cellular subscribers per 100 population is quite high at 58.88 persons, due to Filipinos’
Table 13 Coverage of Water Services, 2006Proportion of Population Using an Improved Drinking Water Source
(%)
Proportion of Population Using an Improved Sanitation Facility
(%)
Total 93 78
Urban 96 81
Rural 88 72
Source: ADB Basic Statistics 2009.

30 Private Sector Assessment: Philippines
preference for nonvoice services, particularly text messaging (Table 14).
Broadband penetration is very low at 1.1%, compared with Singapore’s 19.87% and Malaysia’s 5.15%. A big reason for this is the low personal computer pen-etration rate in the country of 7.46%, compared with Singapore’s 72.61% and Malaysia’s 23.41% (ADB 2008). Prices of such products and services are still a big hin-drance to wider usage, especially in rural areas. In addi-tion, many are still not aware of the benefits of internet connectivity, particularly for small businesses.
Finance sector
The Philippine finance sector has shown resilience in the face of the global financial crisis. This has been attributed to the strengthening of the banking sector in the wake of the Asian financial crisis a decade ago. As a result, the impact on the financial system has been relatively mild and fear was not evident during the episode. The banking sector appears well capitalized and liquid and asset quality is good (International Monetary Fund 2010). The major areas to address are in the nonbank finance sector and the finance sector’s perceived preference for financing large corporations and conglomerates (International Monetary Fund 2010) and urban areas. The nonbank segment is relatively underdeveloped and has grown unevenly. The stock exchange has few companies listed, the number has not increased significantly in recent years, and market capitalization is perceptibly below that of Thailand and Singapore. Partly as a result, Philippine companies are small relative to the rest of the immediate region and will be at a disadvantage when the ASEAN free trade area is fully completed. The credit market is just as small. Mutual fund assets are among the smallest in Asia and government
securities dominate the debt markets. The insurance market is small, with total premium just over 1% of GDP in 2008 (International Monetary Fund 2010).
The underdevelopment of development finance is a major constraint on the growth of the private sector. The dominance of the banking system over the finance sector is indicative of the presence of high risk aversion on both borrowing and lending sides (Table 15).
Even in the banking sector there is a perceived prefer-ence to lend mostly short term and to government and large conglomerates (Figure 13). Respondents often complained that funds are agglomerated by bank branches to be sent to Manila and lent to government and national corporations. As a result, there is a dearth of funds for business purposes in outlying areas and funding for local projects is also constrained. This is an indication that, among other things, the problems of risk aversion still abound, raising the effective rate of interest beyond even the expected higher returns in less developed areas outside Metro Manila.
The recommendations of the International Mone - tary Fund (2010) center mainly on increasing the ability of banking regulators to pierce the veil of bank secrecy in order to uncover financially risky activities in banking and other finance sectors (such as the stock market) and the regulators’ authority to enforce regulations to maintain prudential standards and take prompt corrective action. For the nonbank segments, the report recommends for capital markets the reduc-tion and rationalization of transaction-based taxes, reduction of the time and expense of offerings, and introduction of reforms to assist mutual fund inves-tors; for housing finance mainly the rationalization of housing finance agencies and clarification of their mandates; and for the insurance industry the strength-ening of the insurance commission and clarifi cation of
Table 14 Telecommunications Coverage, 2007 (per 100 population)
Country Telephone Lines Cellular Subscriber Internet Users
China, People’s Republic of 27.5 41.2 16.0
India 3.4 20.0 6.9
Indonesia 7.7 35.3 5.6
Malaysia 16.4 87.9 55.7
Philippines 4.5 58.9 6.0
Thailand 11.0 123.8 21.0
Source: ADB Basic Statistics 2009.
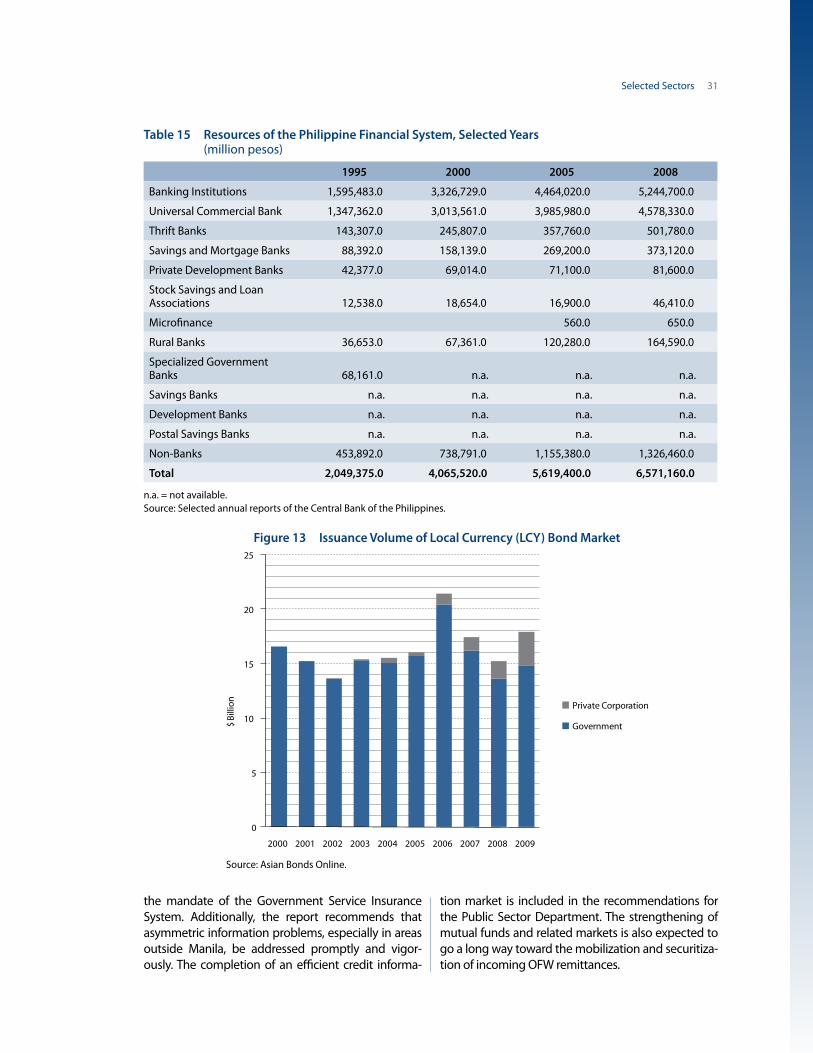
Selected Sectors 31
the mandate of the Government Service Insurance System. Additionally, the report recommends that asymmetric information problems, especially in areas outside Manila, be addressed promptly and vigor-ously. The completion of an efficient credit informa-
tion market is included in the recommendations for the Public Sector Department. The strengthening of mutual funds and related markets is also expected to go a long way toward the mobilization and securitiza-tion of incoming OFW remittances.
Table 15 Resources of the Philippine Financial System, Selected Years (million pesos)
1995 2000 2005 2008
Banking Institutions 1,595,483.0 3,326,729.0 4,464,020.0 5,244,700.0
Universal Commercial Bank 1,347,362.0 3,013,561.0 3,985,980.0 4,578,330.0
Thrift Banks 143,307.0 245,807.0 357,760.0 501,780.0
Savings and Mortgage Banks 88,392.0 158,139.0 269,200.0 373,120.0
Private Development Banks 42,377.0 69,014.0 71,100.0 81,600.0
Stock Savings and Loan Associations 12,538.0 18,654.0 16,900.0 46,410.0
Microfinance 560.0 650.0
Rural Banks 36,653.0 67,361.0 120,280.0 164,590.0
Specialized Government Banks 68,161.0 n.a. n.a. n.a.
Savings Banks n.a. n.a. n.a. n.a.
Development Banks n.a. n.a. n.a. n.a.
Postal Savings Banks n.a. n.a. n.a. n.a.
Non-Banks 453,892.0 738,791.0 1,155,380.0 1,326,460.0
Total 2,049,375.0 4,065,520.0 5,619,400.0 6,571,160.0
n.a. = not available.Source: Selected annual reports of the Central Bank of the Philippines.
Figure 13 Issuance Volume of Local Currency (LCY) Bond Market
0
5
10
15
20
25
2000 2001 2002 2003 2004 2005 2006 2007 2008 2009
$ Bi
llion
Private Corporation
Government
Source: Asian Bonds Online.
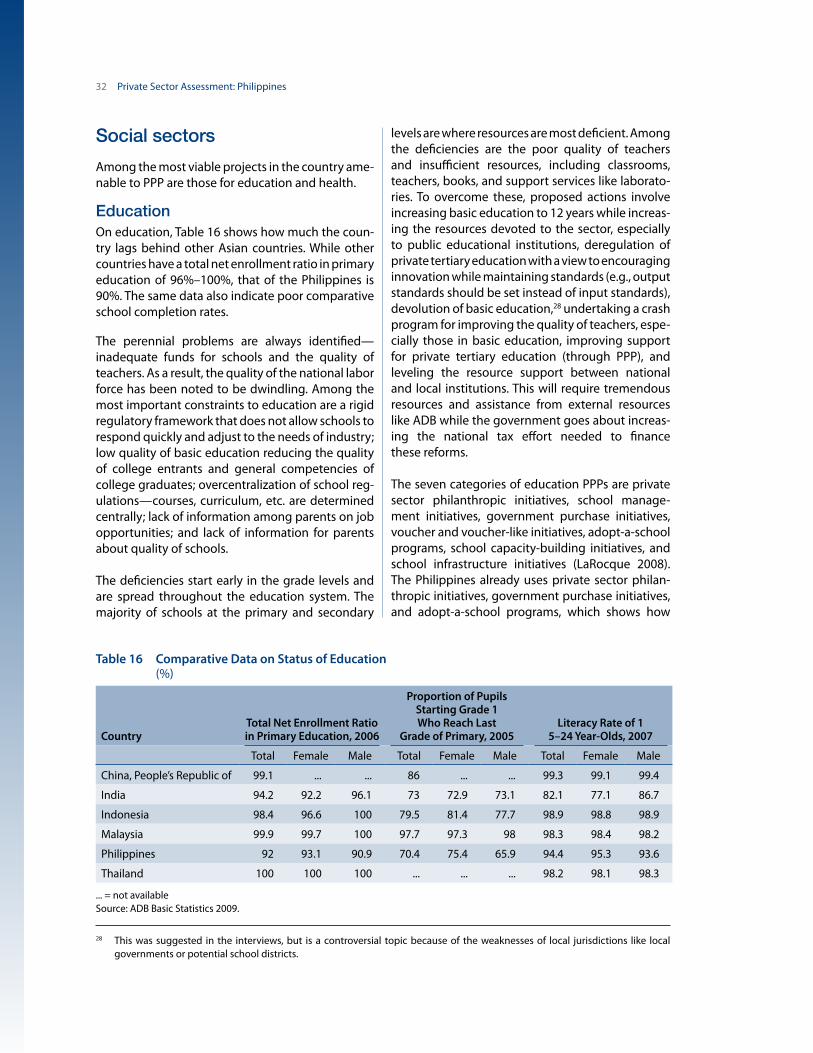
32 Private Sector Assessment: Philippines
Social sectors
Among the most viable projects in the country ame-nable to PPP are those for education and health.
EducationOn education, Table 16 shows how much the coun-try lags behind other Asian countries. While other countries have a total net enrollment ratio in primary education of 96%–100%, that of the Philippines is 90%. The same data also indicate poor comparative school completion rates.
The perennial problems are always identified—inadequate funds for schools and the quality of teachers. As a result, the quality of the national labor force has been noted to be dwindling. Among the most important constraints to education are a rigid regulatory framework that does not allow schools to respond quickly and adjust to the needs of industry; low quality of basic education reducing the quality of college entrants and general competencies of college graduates; overcentralization of school reg-ulations—courses, curriculum, etc. are determined centrally; lack of information among parents on job opportunities; and lack of information for parents about quality of schools.
The deficiencies start early in the grade levels and are spread throughout the education system. The majority of schools at the primary and secondary
levels are where resources are most deficient. Among the deficiencies are the poor quality of teachers and insufficient resources, including classrooms, teachers, books, and support services like laborato-ries. To overcome these, proposed actions involve increas ing basic education to 12 years while increas-ing the resources devoted to the sector, especially to public educational institutions, deregulation of private tertiary education with a view to encouraging innovation while maintaining standards (e.g., output standards should be set instead of input standards), devolution of basic education,28 undertaking a crash program for improving the quality of teachers, espe-cially those in basic education, improving support for private tertiary education (through PPP), and leveling the resource support between national and local institutions. This will require tremendous resources and assistance from external resources like ADB while the government goes about increas-ing the national tax effort needed to finance these reforms.
The seven categories of education PPPs are private sector philanthropic initiatives, school manage-ment initiatives, government purchase initiatives, voucher and voucher-like initiatives, adopt-a-school programs, school capacity-building initiatives, and school infrastructure initiatives (LaRocque 2008). The Philippines already uses private sector philan-thropic initiatives, government purchase initiatives, and adopt-a-school programs, which shows how
28 This was suggested in the interviews, but is a controversial topic because of the weaknesses of local jurisdictions like local governments or potential school districts.
Table 16 Comparative Data on Status of Education (%)
CountryTotal Net Enrollment Ratio in Primary Education, 2006
Proportion of Pupils Starting Grade 1 Who Reach Last
Grade of Primary, 2005Literacy Rate of 1
5–24 Year-Olds, 2007
Total Female Male Total Female Male Total Female Male
China, People’s Republic of 99.1 ... ... 86 ... ... 99.3 99.1 99.4
India 94.2 92.2 96.1 73 72.9 73.1 82.1 77.1 86.7
Indonesia 98.4 96.6 100 79.5 81.4 77.7 98.9 98.8 98.9
Malaysia 99.9 99.7 100 97.7 97.3 98 98.3 98.4 98.2
Philippines 92 93.1 90.9 70.4 75.4 65.9 94.4 95.3 93.6
Thailand 100 100 100 ... ... ... 98.2 98.1 98.3
... = not availableSource: ADB Basic Statistics 2009.
Selected Sectors 33
the private sector actively participates in building up the country’s social capital through corporate social responsibility activities. It was reported that in 2001 corporate foundations in the country donated $1,103,000 to education causes in cash and kind.
Considering the high population growth rate in the country and the need to address the lack in both hard and soft infrastructure in education (i.e., school buildings, books, teachers), PPP appears to be prom-ising as a vehicle. As stated in existing literature, education PPPs can make sustainable the financial resources devoted to basic education, supplement current capacity, motivate innovation, hire and train good teachers, reduce corruption, and heighten competition in the education sector. But, similar to the implementation of other physical infrastructure, success in education PPPs largely hinges on having the right policies and sound institutions (Patrinos, Barrera-Osorio, and Guaqueta 2009).
Health and medical tourismIn accordance with the Millennium Development Goals, the Philippines has a high pace of progress (greater than 0.9) for under-5 mortality rate, infant mortality rate, prevalence associated with malaria, death rate associated with malaria, proportion of tuberculosis cases detected under directly observed treatment short courses, and proportion of tuber-culosis cases cured under these courses; medium pace of progress (between 0.5 and 0.9) for propor-tion of births attended by skilled health personnel and prevalence associated with tuberculosis; and low pace of progress (less than 0.5) for proportion of 1-year-old children immunized against measles, maternal mortality, contraceptive prevalence rate, and death rate associated with tuberculosis.
The Department of Health has crafted a roadmap of reforms for the Philippine health sector called FOURmula ONE for Health29 for the medium term (2005–2010). It is designed to implement critical health interventions as a single package, backed by effective management infrastructure and financ-ing arrangements, by engaging the entire health sector, including public and private sectors, national
29 In general, it is aimed at achieving critical reforms with speed, precision, and effective coordination directed at improving the quality, efficiency, effectiveness, and equity of the Philippine health system in a manner that is felt and appreciated by Filipinos, especially the poor. Specifically, FOURmula One for Health strives to secure more, better, and sustained financing for health; assure the quality and affordability of health goods and services; ensure access to and availability of essential and basic health packages; and improve performance of the health system.
agencies and LGUs, external development agencies, and civil society, to get involved in the implemen-tation of health reforms. The program is directed toward achieving better health outcomes, a more responsive health system, and more equitable health care financing.
Among the rising sectors in the country is medical tourism, where citizens of highly developed coun-tries travel to less developed areas of the world to receive medical care, bypassing services offered in their own communities (Horowitz and Rosensweig 2007). Reasons for medical tourism include inexpen-sive cost of services, immediate medical attention, availability of procedures, tourism and vacations, and privacy and confidentiality. Other Asian destina-tions include the PRC; Hong Kong, China; India; Israel; Jordan; Malaysia; Singapore; Taipei,China: Thailand; United Arab Emirates (Dubai); and Viet Nam. Ortho-pedics and cardiac surgery are the best-known procedures in these destinations.
In the Philippines, top destinations for medical tour-ism include Metro Manila and Cebu. According to Medical Tourism Philippines, the most common procedures are cosmetic and plastic surgery, der-matology, weight-loss surgery, ophthalmology, and dentistry. Some of the concierge services offered are airport transfer, lodging, caregiver, city tour, nurse, and hospital ambulance pick-up. Hence, for a fraction of the cost that could have been spent for treatment in developed countries, the medical tourist gets both the procedure and recreation in tourist destinations.
The growth of the sector in destination countries has been criticized by physicians in developed countries citing risks, particularly the quality of the medical institutions and nonenforceability of pro-tection laws of home countries against malpractice and negligence.
Agriculture and land reformOne weakness of the Philippine industry sector flows from relatively high domestic wages, making its products uncompetitive, traceable to the high cost

34 Private Sector Assessment: Philippines
of food. This in turn has been attributed to an inef-ficient agriculture sector characterized by small and unproductive farm sizes, inadequate irrigation, road, and other infrastructure support, and deficient com-plementary inputs like fertilizer. An underdeveloped post-harvest network further compounds the prob-lem through wastage and losses. The Agriculture Department has estimated that post-harvest losses in transportation and processing of rice amount to more than 5%–10%. And investments in the sector have been very low. Observers have conjectured that net investment in agriculture over the past 25 years has probably been close to zero, if not negative. Consequently, food prices have been rather high relative to the rest of the region, prompting the labor sector to press for higher wages. This in turn has weakened the competitive position of the industry sector. As a result, the private sector starts with a distinct disadvantage.
One of the roots of low agricultural productivity has been the uneconomic size of farms in the country.
Unfortunately, the need to improve agricultural productivity awkwardly coincided with a push for agrarian reform which was undertaken for social, political, and economic reasons. The economic rationale for agrarian reform is anchored on motiva-tion for increased production and investment, even by small farmers. However, the implementation of agrarian reform over the years has been badly flawed, suffering from lack of resources and techni-cal support. The emphasis appears to have focused on distribu tion alone, to the neglect of making the farms and farmers viable on their own. The Department of Agrarian Reform distributed total land area of 4,119,201 hectares from 1972 to June 2009, repre senting 80% accomplishment from its working scope of 5,163,751 hectares. Contrary to expectations, farm productivity has been stag-nant and agricultural contribution to GDP has been shrinking. Figure 14 shows that despite increasing share of agricultural land30 in the country, agricultural value added as a share of GDP is decreasing, which may be indicative of inability to take advantage of
30 As mentioned in the previous PSA (ADB 2005), the country still has one of the lowest arable land ratios.
Figure 14 Agricultural Land as Share of Land Area and Agriculture Value Added as Share of GDP
10
15
20
25
30
35
25
27
29
31
33
35
37
39
41
43
1960
1963
1966
1969
1972
1975
1978
1981
1984
1987
1990
1993
1996
1999
2002
2005
2008
Agricultural Land
Value-Added of Agriculture
% o
f Lan
d A
rea
% o
f GD
P
GDP = gross domestic product.Source: World Bank.

Selected Sectors 35
economies of scale due to technological and opera-tional deficiencies in the country’s agriculture sector.
As a result, the implementation of the Comprehen-sive Agrarian Reform Program (CARP) remains a contentious issue. There are questions about how much it has uplifted the actual conditions of farm-ers. One reason given for the negligible impact on tenants’ welfare is that the size of the land did not allow economies of scale in most crops. Another major reason was the poor support that the pro-gram has received in its implementation. One issue that has arisen is the effect of the lock-up on owner-ship of land to the beneficiaries. This has resulted in the inability of the farmers to use the land as collat-eral for loans that would enable them to make bet-ter use of their land.
The World Bank (2009c) cites the following in its evaluation of CARP.
y CARP’s ex-post targeting in land distribution has been weakly pro-poor and inconsistent through time.
y Imperfect design and implementation underlie CARP’s weak pro-poor targeting.
y The Agrarian Reform Communities (ARC) strategy has proved to be an operationally valid approach to rural development interventions.
y The Department of Agrarian Reform’s institutional mandate limited the pro-poor targeting of the ARC strategy.
y ARC selection favored areas with highest agricultural potential.
y ARC interventions do not appear to reflect heterogeneity in local endowments.
y Land reform’s impact on poverty reduction is critically related to access to private land.
y CARP has fallen short of achieving a full redistribution of land rights and tenure security in redistributed lands.
Land rights have only partially been redistributed and incentives to invest in land and farm productivity improvements have been substantially weakened.
Weak property rights and overall tenure insecurity affect the functioning of land and credit markets.
Small and medium-sized enterprises
As of 2008, SMEs account for 98% of total estab-lishments and employ 32% of workers. Of the total 61,429 SMEs, 73% are in Luzon, 14% in Visayas, and 14% in Mindanao. Three out of four SMEs are service-oriented, around 20.5% are in industry, and 2.8% are in agriculture (Figure 15).
Figure 15 Distribution of Small and Medium-Sized Enterprises by Sector (%)
Source: NSO List of Establishments, 2008.
Agriculture2.8
Industry2.0
Services 76.7
AgricultureAgriculture, Hunting, and Forestry (2.2)Fishery (0.6)
IndustryManufacturing (17.4)Construction (1.5)Utilities (1.3)Mining and Quarrying (0.2)
ServicesWholesale and Retail Trade (29.2)Hotels and Restaurants (12.3)Education (9.9)Finance (8.0)Real Estate and Renting (7.1)Other Services (6.6)Transport, Storage, and Communications (3.5)
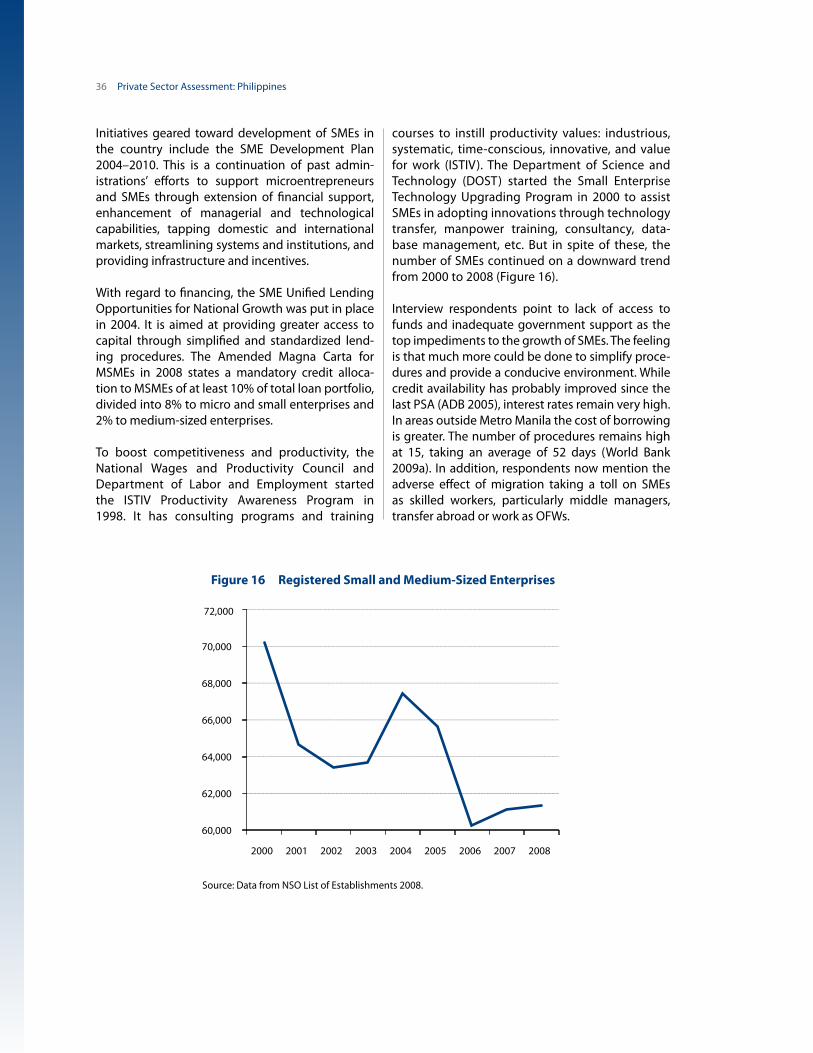
36 Private Sector Assessment: Philippines
Initiatives geared toward development of SMEs in the country include the SME Development Plan 2004–2010. This is a continuation of past admin-istrations’ efforts to support microentrepreneurs and SMEs through extension of financial support, enhancement of managerial and technological capabilities, tapping domestic and international markets, streamlining systems and institutions, and providing infrastructure and incentives.
With regard to financing, the SME Unified Lending Opportunities for National Growth was put in place in 2004. It is aimed at providing greater access to capital through simplified and standardized lend-ing procedures. The Amended Magna Carta for MSMEs in 2008 states a mandatory credit alloca-tion to MSMEs of at least 10% of total loan portfolio, divided into 8% to micro and small enterprises and 2% to medium-sized enterprises.
To boost competitiveness and productivity, the National Wages and Productivity Council and Department of Labor and Employment started the ISTIV Productivity Awareness Program in 1998. It has consulting programs and training
courses to instill productivity values: industrious, systematic, time-conscious, innovative, and value for work (ISTIV). The Department of Science and Technology (DOST) started the Small Enterprise Technology Upgrading Program in 2000 to assist SMEs in adopting innovations through technology transfer, manpower training, consultancy, data-base management, etc. But in spite of these, the number of SMEs continued on a downward trend from 2000 to 2008 (Figure 16).
Interview respondents point to lack of access to funds and inadequate government support as the top impediments to the growth of SMEs. The feeling is that much more could be done to simplify proce-dures and provide a conducive environment. While credit availability has probably improved since the last PSA (ADB 2005), interest rates remain very high. In areas outside Metro Manila the cost of borrowing is greater. The number of procedures remains high at 15, taking an average of 52 days (World Bank 2009a). In addition, respondents now mention the adverse effect of migration taking a toll on SMEs as skilled workers, particularly middle managers, transfer abroad or work as OFWs.
Figure 16 Registered Small and Medium-Sized Enterprises
60,000
62,000
64,000
66,000
68,000
70,000
72,000
2000 2001 2002 2003 2004 2005 2006 2007 2008
Source: Data from NSO List of Establishments 2008.

Selected Sectors 37
Infrastructure quality adds to the cost of doing busi-ness in the country. Inadequacies in transportation and other common facilities such as power raise costs further. Among the infrastructure mentioned is lack of widespread support in technological adap-tation and innovation. Experimental and testing stations and laboratories are not readily available to
most SMEs. The sector would benefit from a strong system of propagation of best practice and evolv-ing technological knowledge. Lengthy administra-tive processes such as customs and documentation requirements also add considerable delays and opportunities for corruption that raise costs and lessen the competitiveness of SMEs.
38
Public–private partnerships: What to do?PPP is a good vehicle toward more effective and sustainable improvement of the investment cli-mate, especially for the Philippines, as its current government revenue inflow cannot afford priority spending. PPP can pull up the country’s competi-tiveness by lifting infrastructure quality, and at the same time improve the delivery of public services. As this would increase physical capital accumula-tion, it would also enhance macroeconomic growth by increasing the rate of factor productivity growth.
A common misconception about PPP is that the private sector’s participation is only in financing the public infrastructure. Its essence lies in the public sector’s purchase of service—not the asset—from a private provider under specified terms and conditions (Grimsey and Lewis 2005). Since this involves partnership, and not contracting out of service to maximize value for money, risk31 sharing characterizes PPP.
To state the obvious, there is definitely a lack of PPPs in the Philippines. ADB’s Infrastructure Planning Frame work Report (2008) points to the lack of policy support at national level because of lack of a national urban sector development strat-egy, policy, and investment program roadmap; stringent national government approval require-ments for certain local PPP projects; and the disin-centives presented to private sector involvement in these projects, such as numerous regulations on implementation schemes, lack of a clear framework
31 Risks emanate from design, construction, opening date, traffic, legislation and force majeure, and operations. Country risks are also a concern for emerging countries.
32 Takes its roots from Administrative Order No. 105, s. 1989 creating the Coordinating Council of the Philippine Assistance Program under the Office of the President; the program was then reorganized and converted to the Coordinating Council for Private Sector Participation through Administrative Order No. 67 dated 11 May 1999. The council was reorganized and converted to the BOT Center through the issuance of Executive Order No. 144 in November 2022. Its attachment was transferred from the Office of the President to the Department of Trade and Industry for greater coordination in promoting investments in BOT/PSP projects in order to accelerate and sustain economic growth (http://www.botcenter.gov.ph/).
for these arrangements, and the failure of the judi-cial system in settling issues and debt resolution.
Among the missing infrastructure in the country that may be procured through PPPs are (but are not limited to) more roads and airports, rapid transport system (buses or railways), sanitation and waste-water treatment, solid waste management, garbage collection, education, and vocational training. So far, most of the PPPs have been in the energy and telecommunications sectors (Table 17).
In comparison with neighboring countries, PPP out-comes in the Philippines are poor and have been a disincentive for businesses, which was not expected because it was the first developing country to have a BOT center.33 Everything is available on paper but, in reality, is lacking. Processes are not transparent, not competitive, and not robustly prepared. This is apparent in the Ninoy Aquino International Airport - Terminal 3 BOT contract. In addition, an evaluation by the World Bank and PPIAF (2007) rates the coun-try’s BOT Center as having some success because of the country’s infrastructure needs, but the indepen-dent power producers (IPPs) of the 1990s left signif-icant contingent liabilities. It also states that there are few to none among the BOT Center’s functions necessary for solving government PPP failure; it is effective only in its technical assistance role. Much of this emanates from having weak governance.
From the World Bank/PPIAF report (2007), the fail-ures PPP units are designed to address are poor incentives for procurement of PPPs, lack of coordi-nation within the machinery of government, lack
Selected Themes

Selected Themes 39
of necessary skill, high transaction costs, and lack of information. To address these, a specialized PPP unit may perform some or all of five main functions.
Step 1: Set PPP policy and strategy
Step 2: Project origination
Step 3: Analysis of individual projects
Step 4: Transaction management
Step 5: Contract management, monitoring, and enforcement
Among these, steps 2 and 4 are not formally per-formed by the BOT Center. With regard to the cen-ter allowing unsolicited bids, the World Bank/PPIAF (2007) asserts the flaws associated with this process, involving unrealistic or unforced timelines, right-to-match advantage (i.e., projects are rendered unattractive to potential challengers because of
Table 17 Public–Private Partnership Projects and Total Investment in the Philippines, 1990–2008
Primary Sectors Number of Projects Total Investment ($ million)
Energy 63 19,268
Telecom 10 14,280
Transport 13 3,478
Water and sewage 5 8,071
Total 91 45,096
Source: World Bank Private Participation in Infrastructure Database.
Box 4 Maynilad Water Services: Need for Improving Corporate Governance
Maynilad Water Services (Maynilad) is the water and wastewater concessionaire in the west zone of Metro Manila, which covered 7.9 million people in 2005. It pulled out of its concession agreement in January 2006 due to bankruptcy. While Manila Water’s capital expenditure consistently (and significantly) went up, that of Maynilad’s remained generally flat. Its nonrevenue water stayed in the range of 60%–70% of production from 1997 to 2004, while Manila Water’s was down to 35% in 2005.
The biggest factor of its bankruptcy was said to be its agreement to shouldering 90% of Metropolitan Waterworks and Sewerage System’s (MWSS) debt burden. Analysts, however, point to internal factors (i.e., corporate governance, financial management, and operations management) since both concessionaires were subject to the same external environment pertaining to water privatization (i.e., political support, regulatory structure, and some unforeseen events).
Maynilad was seen to have failed in building an organizational culture that promotes a commercial, customer-driven working environment. Planning and execution orders still emanated from the higher authorities compared with Manila Water’s structure of empowered front-line employees who make decisions in the field. Accordingly, Maynilad’s records show that it spent 80% more on computers per employee. Manila Water invested on personnel training, seeing its retained MWSS staff as valuable partners in technical expertise. Related-party transactions were also seen in Maynilad’s operations, which shielded contracts from competitive bidding and resulted in overpriced costs.
limited time and high cost to prepare a comparative proposal), and lack of transparency. Furthermore, the Philippines needs to clarify the BOT Center’s objectives and functions in policy formulation and coordination, quality control, marketing PPPs, and standardization and dissemination (World Bank/PPIAF 2007).
In other cases, the problem in unsuccessful PPPs appears when the project is already operating. For Maynilad, the cause of bankruptcy was its inward-looking corporate governance, while for Metrostar Express it was the problem of inefficient and unsus-tainable level of subsidy (Boxes 4 and 5).
How may the Philippines replicate the PPP success of other countries? What are the prerequisites to success-ful PPPs? In developing successful PPPs, experience in both developed and developing countries shows the need to think out carefully the regulation and

40 Private Sector Assessment: Philippines
regulatory instruments, financing instruments, pro-ject development techniques, and external financing. Foresight and consideration of the risks involved (e.g., efficiency, fiscal, and regulatory risks) may be done by a thorough initial analysis of the industry targeted to be developed through PPP. This helps identify, as far as possible, all risks that may be encountered, and at the same time delegate the responsibilities to whoever (i.e., government, private firm, third-party financer, etc.) may be well equipped to shoulder and mitigate the risks.
The Indian PPP experience presents a good model for the Philippines (Figure 17). It emphasizes that avail-ability of funds is not the only key factor to India’s PPP success but also sustainable, efficient asset management, and capacity and awareness build-ing. As of January 2010, there had been a total of 415 PPPs developed all over India.
Some of the successful PPPs in the Philippines are the North Luzon Expressway Project and the con-cession of Manila Water Company (Boxes 6 and 7).
Box 5 Manila Metro Rail Transit System: Inefficient Subsidy?
The Manila Metro Rail Transit System or Metrostar Express (MRT-3) is a project responding to the imminent need to decongest the Epifanio De Los Santos Avenue as part of the Strong Republic Transit System. It is operated by Metro Rail Transit Corporation (MRTC) in partnership with the Department of Transportation and Communications (DOTC) under a BOT agreement. (MRTC signed an amended turnkey contract with a consortium of companies including Sumitomo Corporation/Mitsubishi Heavy Industries and EEI Corporation. CKD Dopravni Systemy was contracted as the rail vehicle supplier while ICF Kaiser Engineers and Constructors was retained to provide program management and technical oversight of services for the design, construction, management, and commissioning of the MRT-3 rail system.)
MRTC was responsible for the design, construction, equipping, testing, and commissioning of the Epifanio De Los Santos Avenue rail transit system, while the DOTC exercised technical supervision of project activities covered by the contract between the DOTC and MRTC, and inspected and checked whether the project was constructed in accordance with approved plans, specifications, standards, and costs. The DOTC also engaged a French consultancy firm, Systra, for design supervision, construction and systems installation supervision, transportation system commissioning, and assisting the DOTC to operate the Metro Rail Transit system during its first five years of operation.
MRT-3 fares are within the range P10–P15, with ridership of more than P1 billion per year. In addition to ticket sales, MRT-3 trains also generate revenue from wrap advertising which is used to pay off debts incurred by MRTC during system construction. Its total revenues amount to $39.56 million annually, which is not enough to cover its expenditures for equity rental operating and payments, maintenance rental payments, and administrative costs for the elevated railway totaling $130 million per year. Hence the government has been subsidizing MRT-3: from P4.8 billion in 1999 to P6.5 billion in 2005. Official reports in 2005 indicate that the average government subsidy has been P49.57 of fare per passenger. Meanwhile, a government study by the Development Bank of the Philippines submitted that fares should be increased from an average of P12.50 to P60.50 to remain profitable.
Figure 17 Breakdown of Indian Public–Private Partnerships, January 2010
Stage Numbers Size - Rs cr Size - $mEOI 9 6,948 1,447Under bidding 99 52,324 10,901Under construction 144 72,761 15,159Under operation 125 32,940 6,863Other 38 14,135 2,945Total 415 179,106 37,314
Stage Numbers Size - Rs cr Size - $mAirports 6 20,041 4,175Energy 31 17,790 3,706Ports 41 46,159 9,616Railways 3 1,007 210Roads 271 81,667 17,014Urban Development 53 11,154 2,324Tourism 10 1,288 268Total 415 179,106 37,314EOI = Expression of Interest. Source: http://pppindia.com
TourismUrban Development Airports
Energy
Ports
Railways
Roads

Selected Themes 41
Box 6 A Successful Public–Private Partnership in the Philippines: North Luzon Expressway Project
The North Luzon Expressway Project is a concession held by the Manila North Tollways Corporation (MNTC) for the rehabilitation, expansion, operation, and maintenance of the existing 84-kilometer road that connects Metro Manila to central Luzon. The concession was signed in June 1998 and expires in December 2030. It is a joint venture of the project sponsors: First Philippine Infrastructure Development Corporation, Philippine National Construction Corporation, Egis of France, and Leighton Asia of Australia. All were considered experienced, competent, and reputable (Egis is the world’s largest toll road operator with over 6,000 kilometers in managed toll roads).
A key success factor in this case is that the private concessionaire agreed to assume all commercial risks—that is, MNTC will assume the risks of financing, full construction, and operation and maintenance. The government will not bail out MNTC if revenues are not sufficient. To recover the investment, MNTC will collect tolls based on authorized rates and the approved adjustment formula.
In support to the capability of the project sponsors and strong project economics, a comprehensive communica-tion program was implemented for the increased toll rates (377% increase from July 2004 to February 2005) to gain public acceptance.
ADB’s completion report states: “MNTC achieved the development impact objectives outlined during appraisal by (i) catalyzing overall economic development in Central and Northern Luzon, (ii) adding road capacity to accommodate current and future traffic growth on the major routes from Metro Manila to Central and Northern Luzon, (iii) inducing private sector investment in the road transport sector, (iv) increasing employment opportu-nities at and around the tollways, and (v) generating interest from international lenders.”
Box 7 Manila Water Company: A Model of Concessions/Privatizations
Government-owned Metropolitan Waterworks and Sewerage System (MWSS) was heavily indebted and overstaffed before privatization. It was losing two-thirds of the water it was producing (nonrevenue water) due to leaks and illegal connections, and was unable to finance more investment to expand coverage and provide better services. In June 1995, the Water Crisis Act was passed by Congress to allow privatization, which divided MWSS’s operations into east and west service zones. Bids were pooled, whereby concessions were won based on the largest tariff reductions.
Manila Water Company (Manila Water) had the lowest bid for both concessions, but the privatization had a clause that each concession must have a different concessionaire. Hence in 1997 Manila Water was awarded the concession for operations in the east service zone of Metro Manila for 25 years. Maynilad Water Services (Maynilad) won the west zone concession. MWSS’s debts were passed on to the two concessions: Maynilad took 90%, while Manila Water took 10%.
By 2006, Manila Water had spent $475 million (P23 billion) on capital investments, doubled its customer base from 325,000 households in 1997 to 909,000 in 2006, doubled the volume of billed water to 992 million liters per day, dramatically decreased staff per 1,000 connections from 9.4 in 1996 to 1.8 in 2006, reduced nonrevenue water (as a percentage of production) from 58% in 1997 to 35% in 2005, increased sewerage connections from 21,769 in 1997 to 66,579 in 2006, and doubled sewage treatment capacity. The concessionaire’s key success factor is its ability to align its sustainable development initiatives with its business objectives. Quoting Manila Water President Tony Aquino, “Our long-term success is intertwined with the well-being of the communities we serve and the natural environment in which we operate. At the same time, the empowerment of our employees and the attainment of the fiduciary goals of our supporters is what gives us the energy to implement our business model aggressively.”
Other reasons noted for Manila Water’s success are its ability to address key regulatory issues by building a strong and transparent relationship with regulators, and its successful implementation of its first rebasing, which is the framework for future rebasing exercises. Due to this, there is hardly any difficulty when asking customers for needed increases in tariffs.
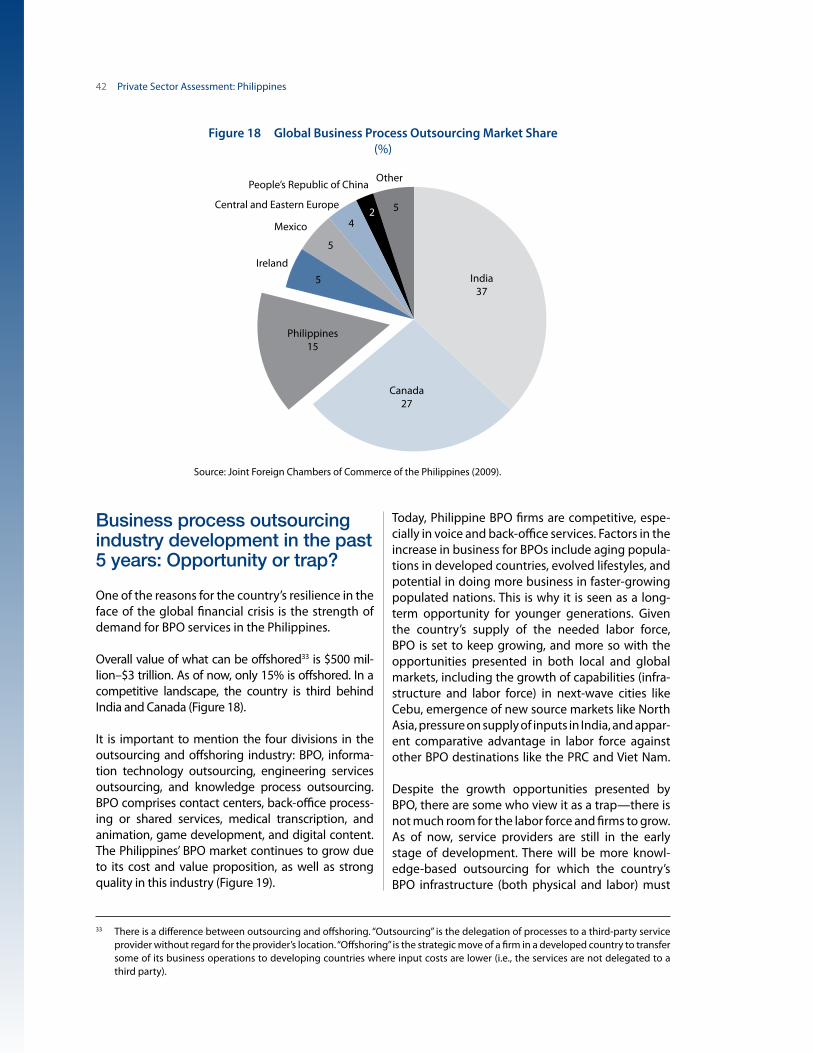
42 Private Sector Assessment: Philippines
Business process outsourcing industry development in the past 5 years: Opportunity or trap?
One of the reasons for the country’s resilience in the face of the global financial crisis is the strength of demand for BPO services in the Philippines.
Overall value of what can be offshored33 is $500 mil-lion–$3 trillion. As of now, only 15% is offshored. In a competitive landscape, the country is third behind India and Canada (Figure 18).
It is important to mention the four divisions in the outsourcing and offshoring industry: BPO, informa-tion technology outsourcing, engineering services outsourcing, and knowledge process outsourcing. BPO comprises contact centers, back-office process-ing or shared services, medical transcription, and animation, game development, and digital content. The Philippines’ BPO market continues to grow due to its cost and value proposition, as well as strong quality in this industry (Figure 19).
33 There is a difference between outsourcing and offshoring. “Outsourcing” is the delegation of processes to a third-party service provider without regard for the provider’s location. “Offshoring” is the strategic move of a firm in a developed country to transfer some of its business operations to developing countries where input costs are lower (i.e., the services are not delegated to a third party).
Today, Philippine BPO firms are competitive, espe-cially in voice and back-office services. Factors in the increase in business for BPOs include aging popula-tions in developed countries, evolved lifestyles, and potential in doing more business in faster-growing populated nations. This is why it is seen as a long-term opportunity for younger generations. Given the country’s supply of the needed labor force, BPO is set to keep growing, and more so with the opportunities presented in both local and global markets, including the growth of capabilities (infra-structure and labor force) in next-wave cities like Cebu, emergence of new source markets like North Asia, pressure on supply of inputs in India, and appar-ent comparative advantage in labor force against other BPO destinations like the PRC and Viet Nam.
Despite the growth opportunities presented by BPO, there are some who view it as a trap—there is not much room for the labor force and firms to grow. As of now, service providers are still in the early stage of development. There will be more knowl-edge-based outsourcing for which the country’s BPO infrastructure (both physical and labor) must
Figure 18 Global Business Process Outsourcing Market Share (%)
Other
India37
Canada27
Philippines 15
Ireland
Mexico
Central and Eastern Europe
People’s Republic of China
5
5
452
Source: Joint Foreign Chambers of Commerce of the Philippines (2009).

Selected Themes 43
be ready, as there will be new skills required in the future (Table 18). And since the industry is all for cost efficiency, innovations are plentiful and con-tinuing. Hence BPO growth in the country really is an opportunity today and in the long run.
To be able to ride on and sustain the growth wave, there is a need to look at the support sectors of the industry (e.g., office space and telecommuni-cations) vis-à-vis future BPO demand. Also, a big threat within the country is the continuous migra-tion34 of the labor force to greener pastures abroad.
34 This phenomenon is both a threat and an opportunity for the country, as discussed in the next section.
A.T. Kearney’s Global Services Location Index points out where the country is lacking against other countries.
Currently, specific action is needed in the following areas (Table 19).
y A national broadband network is needed to provide efficient, reliable, and robust services for BPO centers as they spread out to secondary cities in the country. The presence of two private backbones for the internet is a base that can be
Figure 19 Business Process Outsourcing Revenues and Direct Employment
4.9
Revenues($ billion)
Direct employment(FTEs)
1.5 100,500
299,168
2004 2007 2004 2007
+49% +45%
FTE = full-time equivalent.Source: Business Processing Association of the Philippines (BPA/P), McKinsey Team Analysis.
Table 18 College Degree Graduates, 2007
Number of College Degree Graduates Annual growth
Business and Accountancy 128,000
Engineering and Technology
55,752
IT-related courses 42,047
Architecture 3,100
Medical Sciences 31,400
Fine Arts/Humanities 7,660
Total Tertiary Level 454,818 3.8%
Source: Sañez 2007.

44 Private Sector Assessment: Philippines
expanded; if necessary, the public sector can step in and think of this as a pioneering project that can be money-making. ADB can provide technical assistance for standards and technical requirements as well as financing, given the very large potential of the sector.
y The Commission on Higher Education (CHED) should define standards to address the needs of BPO. At the moment, acceptance rates of applicants to the centers are at lower single-digit levels that firms then have to supplement in order to bring them up to international BPO standards. A more defined standard developed in consultation with the sector would reduce training costs for firms and lower entry for SMEs into this field. CHED should do this even as they liberalize the opening of courses and curriculum design to allow innovation and adaptability of tertiary education to changing global requirements. Accreditation schemes should be fostered for differentiation of school quality levels among the public.
y International promotion of the Philippines and its industries should be undertaken with the strong encouragement of the government, including financial and administrative support where justified by the prospects and budget. The Board of Investments (BOI) should be restructured to become more promotional rather than regulatory, and clear targets for the agency should be defined.
Table 19 A. T. Kearney’s Global Services Location Index and Ranking, 2005 versus 2009
Country2009 Rank
2005 Rank
Financial Attractiveness
2009
People Skills and
Availability 2009
Business Environment
2009
Total Score 2009
India 1 1 3.13 2.48 1.3 6.91
China, People’s Republic of 2 2 2.59 2.33 1.37 6.29
Malaysia 3 3 2.76 1.24 1.97 5.98
Thailand 4 6 3.05 1.3 1.41 5.77
Indonesia 5 13 3.23 1.47 0.99 5.69
Egypt 6 12 3.07 1.2 1.37 5.64
Philippines 7 4 3.19 1.17 1.24 5.6
Source: A. T. Kearney’s Global Services Location Index, 2005 and 2009.
y New legislation is needed to address computer crime and intellectual property— the upgrade of the Cybercrime Bill and the creation of the Department of Information and Communications Technology. At the same time, the existing Labor Code has to be revised, particularly the provisions on the time requirement based on manufacturing type, women’s participation, and legalization of flextime, staggered time, and home-based employment.
y Better representation of the information and communications technology sectors in the Senate is needed to enable the private sector to influence resource allocation in a way that it cannot do at present. In this regard, the idea of creating a Department of Information and Communications Technology should be considered.
Labor migration and remittances
The Philippines is the third35 largest source of migrants in the world, after the PRC and India (Table 20). This translates into a capability to remit an aggregately huge amount of foreign currency to the home country—particularly to relatives residing there. Remittance inflow in 2009 alone was recorded at $17.3 billion, accounting for 10.8% of GDP. This is another reason why the Philippines
35 But in terms of remittances, the Philippines is the fourth largest recipient next to India, the People’s Republic of China, and Mexico.
Selected Themes 45
has been resilient to the effects of the global finan-cial crisis, apart from the minimal exposure of the country’s finance sector.
Needless to say, the country benefits greatly from the inflow of OFW remittances. Regressions were run (Paderanga 2009b) to determine in which vari-ables the OFW remittances variable is significant. The results show that remittances inflow is a robust explanatory variable in the reversal of the current account from deficit to surplus in recent years.
OFW remittance inflow is also an important factor in the buildup of gross international reserves. It has enhanced national savings and shifted the savings–investment gap from negative to positive. However, it has had an adverse impact on the price compe-titiveness of Philippine exports by strengthening the peso.
Supply–demand side effects are already showing, where a trade-off exists as to the timing of both benefits and losses for the economy. Supply-side effects are manifested through shortages of skilled labor and mid-level managers, brain drain, and skills drain—which is, as mentioned in the preced-ing section, a serious problem for the BPO industry. Furthermore, there are real wage pressures due to migration, because it is now harder to find labor with low-, middle-, and high-level skills so wages have been bid up. This is most pronounced for middle-level professionals.
On the other hand, demand-side effects of remit-tances are seen through the development of enterprises. There is evidence that migrants use remittances to start up small businesses in retail, transport, and handicrafts. Pernia and Salas (2005) found that the share of remittances spent on invest-ments by the recipient families or others from saved remittances will depend on the investment climate in the locality. The reduction in the work effort of family members of these households appears to be matched by an increase in entrepreneurial activities: instead of looking for work, family members opt to start a business using remittances. In addition, they spend on education and household goods, which are the biggest expenditure items (Pernia 2008b).
Can labor migration be reversed in the future?Whether labor migration can be reversed depends on what the government aims to do. In particular, its agenda would have to include employment opportunities, population policies, and projects for economic growth. Development strategy and the private sector will dictate the direction of this. However, the debt overhang means it will take longer before labor migration can be mitigated; it could even be reversed, especially if the private sector can be expanded.
A reversal in labor export has happened in other countries. The Republic of Korea, Thailand, and Taipei,China had a labor export policy; but, unlike
Figure 20 Estimated Migrants Sent by Country (of Origin) (%)
People’s Republic of China17
India10
Philippines4
Others69
Source: International Organization for Migration.

46 Private Sector Assessment: Philippines
the Philippines, they also had deliberately long-range development strategy plans and structural reforms to develop the economy, recognizing that the labor export policy was merely a stopgap mea-sure. They also had deliberate population policies. In 1969, the Philippines started its population pol-icy, and in the mid-1970s it started labor migration. Thailand copied it in 1971, but it was consistent in its implementation.
The speed and sustainability of the reversal in the Philippines will depend on the type of workers deployed. Overseas workers from the Republic of Korea, Thailand, and Taipei,China were mostly con-struction workers and engineers. OFWs are enter-tainers, seamen, and domestic helpers—sea-based workers account for 30% of OFWs. Figure 21 shows the distribution of OFWs by skills category.
What policies would help quicken the reversal process?
In general, rapid and sustained economic growth in the Philippines (employment generating) would accelerate the reversal. Working conditions matter. If the country has good laboratories, its engineers and scientists will be enticed back. That is where the chal-lenge lies, as the Philippines has a woeful science and technology budget: expenditure has been 0.15% of GDP (average) in recent years. Compare this with 0.5% of GDP (average) for Southeast Asia. Singapore and Malaysia spend above this figure, and the United Nations Educational, Scientific and Cultural Organization (UNESCO) recommends 1% of GDP.
Other important policies include good governance that results in prudent fiscal spending and revenue generation.
Figure 21 Overseas Filipino Workers by Skills Category, 2008 (%)
For reclassi�cation0.1
ProfessionalWorkers
14.7
Administrative andManagerial Workers
0.4
Clerical Workers5.4
Sales Workers3.4
Agricultural Workers
3.4
ProductionWorkers
39.1
Service Workers36.5
Source: Philippine Overseas Employment Administration.

47
Summary of findings
The private sector is the main component of the Philippine economy, providing 96% of total GDP and employing 92% of the labor force. The potential to raise the level and rate of Philippine economic development by strategic interventions in this sector is therefore quite large. The Medium-Term Philippine Development Plan explicitly recognizes that the private sector (particularly investment, trade, and tourism) is “a powerful growth engine for generating jobs and creating economic activity in the country.”
Despite this stated principle, the private sector in the country does not seem to be in good health. The past 2 decades have seen a steady decline in industry’s share of GDP. While this has partly been the result of hollowing out in the face of economic liberaliza-tion and fierce competition from newly industrial-izing countries like the PRC, the narrow spectrum of the Philippine industry sector and the concentration of its exports in very few products indicate a radical uncoupling of production from domestic consump-tion. This would seem a natural result of the country’s ability to purchase its needs with the newly found for-eign currency earning power of its OFW remittances, which has provided the natural cleavage between productive potential and consumption desires. However, it also reflects the failure to translate the new additional effective demand into production for domestic needs, and ultimately implies systematic obstacles to business activity, thus obstructing pri-vate sector development.
Our study shows that there are systemic and sys-tematic bottlenecks that severely affect private sector activity, magnified in the case of MSMEs. Because MSMEs do not prosper, their inability to provide efficient and cost-effective support to large firms generates a vicious cycle that debilitates the sector; that is, vertical integration of MSMEs into the
production of large enterprises is not happening as it did in Germany and Japan.
Assessment of the private sector points to inef-ficiencies in the process of setting up and main-taining a business in the country. This deficiency magnifies the debilitating impact of traditional economic factors like investment levels and capital access to such an extent that domestic investments and exports are effectively throttled into inactivity. Rankings of investment locations have consistently placed the Philippines among the bottom choices, except for BPO locations. Issues of governance, lack of certain types of infrastructure (physical, financial, technological, etc.), and inefficient structures have been plaguing the country, resulting in prospec-tive investors’ lack of interest and confidence in its ability to maintain stability and allow investments to prosper.
The cost of complying with government rules and related processes can be quite high and suffocating. These include rules on starting, maintaining, and closing a business. Reforms should include decreas-ing the number of procedures involved in and the cost of starting and closing a business. A commis-sion similar to the Grace Commission in the United States during the early 1980s could initiate and sus-tain a comprehensive and complete review of all government processes, to include policies that have the side effect of requiring elaborate documenta-tion. Among others, the whole process of start-ing a business all the way through to final license approval to operate should be examined minutely with the same spirit as zero-based budgeting, i.e., a starting point of zero documentation unless absolutely necessary. Liberal use of computerized document processing, including remote registra-tion in public databases where this information is available, must be introduced for public viewing. An example would be the choice of company names at the Securities and Exchange Commission and trade
Proposed ADB Private Sector Development Strategy
48 Private Sector Assessment: Philippines
names at the Department of Trade and Industry. The current database of registered names should be accessible to all and an ombudsman/arbitrator in transparent procedures should be available for third-party appeals in case of rejection. These are only examples of liberalizations under this general line of registration procedures and may be applied in many other instances.
Suggestions made during the interviews included all the steps in the registration of microenterprises and small businesses that appear geared toward larger firms. For example, since these microenterprises and small businesses do not have a high probability of making large profits, perhaps a law exempting them from taxes (and fees including income taxes) during the first 5 years can be passed. This would radically simplify the start-up of these firms, as it seems to be major addition to the cost of starting a business. And since the record indicates that 90% of these businesses fold within the first year or so, the reform may actually save the government in documentary and salary costs involved in this process. If the start-up can be confined to the extent possible to almost minimal registration with the LGU, this might actu-ally increase the number of risk takers and potential taxpayers. Such a review can proceed along at least two guidelines: first, differentiation among busi-nesses by size, with perhaps more than two layers of revenue or capital; and second, with or without pub-lic ownership (i.e., when capital is raised by public offer). In the same vein, requirements such as envi-ronmental and fire safety regulations can be tailored according to type of municipality or congestion stan-dards (and other objective standards not amenable to local manipulation).
These are merely examples of how the country’s procedural costs can be subjected to analysis on a comprehensive scale and can take advantage of modern technology to reduce the costs. The poten-tial for cost reduction in this area is tremendous. The World Bank has consistently ranked the Philippines low due to inefficiencies in all aspects of handling an enterprise. The environment is characterized by rigidities that are not apt in the face of globaliza-tion and deregulation. Too much emphasis on the political side of issues is taking a large chunk of the very limited economic pie of the country. The brunt of this slow absorption into the economic engine falls on the shoulders of MSMEs. If the government wants to be perceived as serious in promoting entrepreneurship, it has to create a real one-stop shop for starting a business. This entails decreasing the number of procedures in processing business applications and permits from around 1836 steps (on average) to 637 and, at the same time, reducing the cost38 of starting a business.
Along the same lines, closing a business must also be made less costly. In 2008, it was noted that bank-ruptcy in the country eats up an average of 38% of the estate value. It takes an average of 5.7 years to close a business, and the recovery rate is 4.4 cents on a dollar. And when it is expensive to close businesses, even starting a business is adversely affected: the costs of closure are considered as one that an enter-prise must include in its feasibility study, increasing the capitalized value of investments.
Enhancing market competition is foremost to improve access, especially for MSMEs. There are three aspects to this. The first is to integrate the
36 In Makati in 2008, for example, the 18 procedures needed for starting a business are: verify the availability of the company name with the Securities and Exchange Commission (SEC); obtain bank certificate of deposit of the paid-in capital from authorized agent bank; register company with the SEC and receive pre-registered taxpayer’s identification number; obtain community tax certificate from city treasurer’s office; obtain barangay clearance; notarize business permit and locational clearance application forms; obtain locational clearance at the Urban Development Department-Zoning Administration Division (UDD-ZAD); receive inspection for the locational clearance from the UDD-ZAD; obtain business permit to operate at the business permits office; present official receipt at Makati Health Department for issuance of a sanitary permit; buy special books of accounts at bookstore; register for value-added tax at the Bureau of Internal Revenue (BIR); pay documentary stamp taxes; obtain authority to print receipts and invoices from the BIR; print receipts and invoices at print shops; have receipts, invoices, and books of accounts stamped by the BIR; register with social security system; and register with Philippines Health Insurance Company.
37 The proposed six procedures can be done through reducing extra government layers (i.e., abolish regional offices and strengthen provincial offices) and implementing coding in registration of business name to decentralize processing; decentralizing access to registration and processing and making process of approval more transparent; abolishing outdated accounting requirements (e.g., legalization of books and receipts); and having two to four of the six procedures done online (e.g., company name verification, registration, or payment of fees).
38 It was 29.8% of GDP per capita in 2008 (World Bank 2008a).

Proposed ADB Private Sector Development Strategy 49
Philippine market geographically by enhancing the efficiency of the transportation and communica-tions infrastructure. This entails unblocking bottle-necks at the seaports and airports, increasing the efficiency of the road network, and improving safety and reliability on sea and air travel. As the cost and uncertainty of transportation go down, the country becomes more integrated, and the single Philippine market is realized, the benefits of a large population with spending power can be spread throughout the islands. This is the promise of infrastructure devel-opment over the medium term.
Second, the cost of doing business over the whole country should be brought down, especially for the MSMEs, through streamlining of government offices and removal of excess administrative pro-cedures. As the costs of setting up, running, and closing businesses decline through administrative efficiency, more firms participate in domestic and export production, and the market expands.
Finally, the government can initiate crafting policy and legislation on the creation of an integrated competition policy for the country that may be lodged in, among others, an antitrust and business practice code. Top priority must be given to crafting legislation on the creation of an antitrust law, allow-ing foreign ownership of land and other activities, creation of local SME development councils, and further liberalization of inter-island transportation.
Additionally, effort should be devoted to stream-lining the administrative procedures over several layers of government. In the interviews, respondents frequently mentioned cases where after obtain-ing all the clearances from national, provincial, and municipal levels, including environmental clear-ances, a project would be stymied when barangay permits are not granted or blocked. This may entail coordination on zoning regulations among the dif-ferent levels of government.
Finally, it is suggested that measures to improve the general atmosphere of doing business be under-taken—directly addressed by any move to lower the cost of doing business in the Philippines. This is further helped by a concerted effort to increase the understanding of the general populace of the risks
undertaken by those who go into business and, in an emerging economy like the Philippines, the addi-tional risk carried by those going into collaborative undertakings with government, such as in BOT-type activities to provide public facilities like toll roads and electricity. This is elaborated further later.
One of the biggest concerns of firms is the high cost of doing business. This is indicated by the cost of electricity being the highest in the region. The high cost of living and the inflexible work rules also con-tribute to making labor costs among the highest in the immediate region. It is imperative to introduce reforms to lower electricity costs from the current 14 cents/kWh (against 11 cents in Japan) and allow more flexibility in employing workers. In addition, total tax rate as share of profit is high at 50.8% (World Bank 2009a: 128).
Efficiency in enforcing contracts must be instituted through decreasing the number of procedures from 37, decreasing the number of days taken (noted at 842 in 2008), and decreasing the cost of litigation from its 2008 level of 26% of claims.
The aggregate economy has to induce confidence. To entice investors, revenue generation by the govern ment has to be improved and expenditure made on quality infrastructure, including the finance sector. This would include increasing tax revenue from 14%, increasing capital formation as share of GDP (2.39% in 2005) (Fabella 2010), and encourag-ing PPPs in research and development to increase R&D expenditures in the country. This should result in higher annual growth rate in start-ups, higher net FDI inflow growth rate, and higher growth in port-folio investments.
In the finance sector, moving priorities toward more sustainable and equitable growth rate would be indicated by a deeper financial market (M239 as share of GDP), lower nonperforming loans, higher stock market capitalization (as share of GDP), and higher share of (merchandise) exports to GDP from its current 23%.
Such reforms, in turn, lead to more sustainable growth in investments and employment genera-tion. A continuous and more robust growth in
39 Mishkin (2004) defines M2 as a “measure of money that adds to M1: money market deposit accounts, money market mutual fund shares, small-denomination time deposits, savings deposits, overnight repurchase agreements, and overnight Eurodollars.”
50 Private Sector Assessment: Philippines
productive activity will lessen the pool of underuti-lized assets, particularly the country’s most prized labor force.40
Review of country and ADB strategic framework for private sector development
ADB’s long-term strategic framework for 2008–2020, Strategy 2020, is geared toward focusing ADB operations on three agendas: inclusive economic growth, environmentally sustainable growth, and regional integration. This will be done through developing the private sector, encouraging good governance, supporting gender equity, helping developing countries gain knowledge, and expand-ing partnerships with other development institu-tions, the private sector, and community-based organizations. To achieve these, among other devel-opments, ADB will raise the share of infrastructure to 77% of the 2010–2012 work program (ADB 2009), which will be done along with important shifts in the composition of infrastructure projects. The share of investment in urban areas will increase, particularly on water supply, sanitation, and urban transport. Energy efficiency, renewable energy, and carbon trading will take more than half the share for energy projects. In addition, lending volume in education, agriculture, and health will be doubled.
In the years before 2008, the Asia and Pacific region realized significant progress in line with some of ADB’s objectives. The global financial crisis along with the spike in rice and fuel prices, however, diminished some of the gains (e.g., about 53 million people in Asia and the Pacific will remain poor due to the effects of the crises). In light of this, Strategy 2020 focuses on sectors that generate employment, promote regional cooperation and integration, and enhance investor confidence.
The country strategy and program for 2005–2007, through focus on improvement of the investment climate, has paved the way for private sector devel-opment, which is the focus of the next country part-nership strategy.
40 Unemployment rate in October 2009 was 7.1%; underemployment rate in October 2009 was 19.4%.
ADB and the Philippines’ private sector development
The Philippines is the 11th largest shareholder and the 5th largest borrower, accounting for around 8% of total sovereign and non-sovereign lending. It is also one of the largest clients for private sector lending and equity investments. In 2008 alone, ADB approved five loans for $940 million and 11 tech-nical assistance grants for $9.4 million. Including grant-financed projects worth $1.0 million, the total amounted to $950.4 million as of 31 December 2008.
Areas where ADB has been supporting the govern-ment include governance and justice reform, invest-ment climate improvement, govern ance in public expenditure management, poverty reduction, and greater social inclusion. Specific to the private sector, ADB helps indirectly by advising the govern ment on creation of a business-friendly environment, particularly tax rationalization, fair tax systems, improving the finance sector, and protection of contractual and property rights. ADB helps directly by funding and supporting approved enterprises, private equity funds, and financial institutions. It also mobilizes international capital for private enterprise.
The private sector projects in the country that ADB has actively supported include development banks, venture capital companies, mutual fund, express- way rehabilitation and expansion, power- generating projects, water and sewerage concession, and airport terminals. A list of specific projects is provided in the appendix of this report. In addition, ADB has cofinanc-ing operations with the government, multilateral financing institutions, and commercial organizations.
An evaluation of the projects undertaken led to the learning of some lessons, summarized below, particularly relevant for private sector development.
Lessons learned from country assistance program evaluation
y Selectivity based on country-specific constraints was an effective approach. In crafting recommendations, it is recognized now that
Proposed ADB Private Sector Development Strategy 51
there is no one-size-fits-all solution for all countries. Country-specific constraints have to be considered. For the Philippines, this includes governance issues that limit the benefits of most initiatives to improve revenue collection and project implementation.
y Supporting policy and institutional reform takes government commitment, stakeholder involvement, and medium-term engagement. This entails coordination among government agencies, private sector organizations, academia, and civil society to develop reforms. Also, a medium- to long-term perspective in institutional strengthening has proven helpful.
y Contributions to improving the private sector– enabling environment were largely sector-specific. Planning for reforms toward a more business-friendly environment is more fruitful if specific to particular sectors, as each sector has different limitations in allowing for improvement.
y Addressing good governance and corruption has moved beyond project boundaries. Policy-based lending and related technical support are better placed to address systemic governance issues. Successes in capital market reforms show that avoidance of corruption requires a sector focus with well-defined rules and a good regulatory framework.
y Support for local service delivery is relevant. Experience shows that rural and urban development projects give positive livelihood impacts when the local government crafts complementing policies and actions to strengthen planning and expenditure management systems.
y Linkages between rural development, SMEs, and regional cooperation supported development of value chains in Mindanao. Planned advisory activity such as quarantine, immigration, customs, and security will strengthen synergies, and has the potential to develop into a structured strategy. The canceled support for regional airport infrastructure development was a missed opportunity to integrate such linkages further.
y Focus the follow-through on fiscal reforms and further improvement in sector budget allocations and institutional reforms. It is imperative to improve sector planning and strengthen institutions needed to deliver services. Progress is needed on effective local
service delivery through a clear policy on local delivery and decentralization, and related clarification between national and local roles and capacity development.
y Improvements in the private sector–enabling environment need a wide perspective but a focused ADB response. Progress in this area is contingent upon spending on infrastructure and governance reforms, and in turn is crucial for driving growth and revenue generation needed to enhance service access and distribution. Continued attention is needed to build capacity for local service delivery—involving civil society institutions and the private sector in delivering services is a sound strategy. ADB needs to identify focused and feasible governance reforms to help generate positive momentum and identify future strategic actions that can keep the governance reform agenda moving forward in areas such as public resource management, decentralization, and utility regulation. However, governance concerns should not be a reason for avoiding investing in key constraints such as physical infrastructure.
y To address infrastructure development as a key constraint to growth and explore alternatives in supporting its development. Future infrastructure development needs to assess alternatives carefully by first looking for private sector interest, followed by PPPs, and finally public provision where there is genuine market failure. ADB should continue to address areas such as transport policy, planning, transparent procurement, and improving the prospects for PPPs, including needs for mass transit, that have potential for support through private sector operations.
y Continue the focus on southern Philippines, include other poor provinces, and expand linkages between rural development and regional cooperation initiatives. High poverty in the southern Philippines, and also other provinces with poverty levels above the national average, warrants a focus on their development. The unexpected support for value chains that confer price and productivity incentives to low-income farm households while linking to agribusiness SMEs in, for example, Mindanao can be built into ongoing projects, assessed at project completion, and lessons incorporated

52 Private Sector Assessment: Philippines
into future designs. To promote backward and forward linkages, attention is needed to enhance the enabling environment for microenterprises and rural SMEs, including further improvements in their access to finance and support services. Support for Small and Medium Enterprises Development Council (SMEDC) offers a unique opportunity to facilitate cross-provincial-boundary coordination in areas such as watershed management. Support to ARMM is better channeled through area development facilities, including the use of development partner pooled funds or bilateral assistance channels that can meet the needs of local communities more effectively and efficiently.
Up to this point, ADB’s strategy for supporting private sector development has been to identify promising areas where opportunities for private sector projects and ventures are identifiable and capital, financial, or other constraints prevent domestic or foreign investors from coming in. Most of these projects have been in infrastructure, capi-tal markets, and the credit sector. Its private sector operations have been most active as opportuni-ties have presented themselves and in funding and cooperation. However, it is becoming clear that for maximum ADB impact on both private sector and, consequently, overall economic development, assis-tance and facilitation must be carried out not only on actual projects but also in the relevant frame-work and institutional setup that largely determine the level and efficacy of private sector activities.
Proposed strategy for ADB’s private sector development support under the next country partnership strategy
The elections and an incoming administration pro-vide an opportunity to review ADB’s strategy for private sector development support to the Philippines. It is an opportune time for an assessment, as recent events point to seemingly divergent developments. On the one hand, there appears to be a distinct upward shift in the secular growth rate of the economy; on the other hand, some key social indicators such as the poverty index and distribution of income suggest deterioration. ADB has recently launched several
studies that look at underlying roots of the divergent directions and the difficulty in sustaining the rate of growth. In a nutshell, the economy’s key short coming appears to be its persistent inability to exploit the initial demand impulse provided by OFW remittances and propagate the effects beyond those directly affected by the added demand, and the apparent lack of integration in the economy, in terms of both geo-graphic and industry sector connectivity. The results have been an inadequate economic framework for spontaneous and self-sustaining growth in response to growth stimuli.
ADB’s overall examination of the Philippines’ critical development constraints using country diagnostics attributes the inability to attain self-sustaining growth to inadequate infrastructure, especially in electricity and transport, and lack of investor confidence due to an overall atmosphere of weak governance, particu-larly corruption and political instability (ADB 2007b). This has led to a growth pattern that has not been inclusive. Habito (2009) traces the common thread linking the difficulties in achieving inclusive growth to a “pervasive lack of trust in the current national government leadership” which has “hampered the growth potential of the economy…” This has con-strained the government’s ability to raise revenue, and consequently severely limited its ability to finance the infrastructure needed to support higher levels of private investment and output growth. Interacting intensively with this noninclusive pattern of growth is the deterioration in poverty and income inequality, leading to a vicious circle where the lower-income classes are excluded from participating in the fruits of economic stimuli and are therefore unable to contribute to the further enlargement of the eco-nomic pie. Thus the economy becomes dependent and in danger of being addicted to the external infusion of demand from OFW remittances, as the “Dutch disease” impact and consequent uncompeti-tiveness of its industries further constrict the internal income multiplier.
This occasion provides an opportunity for ADB to shape its interventions toward more strongly assist-ing government in easing the economy’s growth constraints and fully exploiting external stimuli for faster growth. The effort would greatly benefit from increased synergy between the public and private sector departments within ADB operating from a single game plan in a coordinated and integrated

Proposed ADB Private Sector Development Strategy 53
manner. This would more accurately reflect an attempt to achieve a seamless connection between government and the private sector for faster growth and development. To reflect this added emphasis, the public sector departments, on the one hand, will go beyond support infrastructures and provide a generally conducive environment toward affirm-atively seeking interventions that prepare the grounds for private sector activity. On the other hand, the private sector department will broaden its view from a focused engagement in sectors where the gaps are obvious and projects are noticeable into areas where pioneering and innovative private sector activities would increase national output and accelerate development.
Beyond collaboration between public and private sector operations, a few concrete strategies come to mind. First would be for public sector depart-ments to include in their technical assistance pro-gram projects to identify and alleviate structural impediments to private sector activity that would leverage public sector investments. An example is clarification of rules designed to facilitate the par-ticipation of private sector initiatives in local public projects such as water utilities and other services. A detailed manual of processes spelling out the steps and standards to be followed in order to make private participation clear and transparent while imposing safeguards against abuses and corrup-tion would facilitate private participation. Second would be an increased effort from the Private Sector Operations Department (PSOD) to make a periodic inventory of areas in the economy where the private sector could be more vibrant but is currently not so active. Through independent study or responses of constituents, it may be able to discover the reasons for inactivity and suggest remedies that either pub-lic or private sector operations or both can directly apply or include in technical assistance to policy makers for key changes in the investment environ-ment. These strategies could be crucial in helping overcome bottlenecks that have long held back private sector development in the Philippines. One indicator, at least during the early part of the added interventions, would be the increase in the level and proportion of PSOD operations. With the foregoing operations in mind, the following recommenda-tions are made.
Public sector operationsAside from its full support to infrastructure buildup within the country, especially for common resource facilities, public sector operations must even more explicitly examine how its projects can help contribute to the development of the private sector. It will examine its activities for how it can collaborate with the rest of ADB to provide this enabling environment, including joint strategy and program setting with PSOD.
Investment projects for physical capital improvement and capacity building. Physical capital improve-ment and capacity building will include projects designed to reduce the cost of doing business, and will look for projects that improve the institutional framework and environment for the private sector to operate.
y Increase ports of entry where possible to ease transit costs for imported inputs, tourism, and other personal traffic. Among the capacity building would be projects to strengthen administrative capability at points of entry, such as customs, immigration, and airport administration.
y To make operations of ports more efficient, either or both reforms may be introduced: � Privatize customs and substitute quotas
subject to international bidding; or � Make release of goods automatic after a
specific period (e.g., 72 hours); a shipment can be held for inspection only with prima facie evidence; keep a database recording how many times prima facie evidence has been produced by each responsible customs officer.
y To enhance access for tourism and investment, the subsequent points are imperative. � More liberal aviation policy, including
the possibility of open skies to ease business travel and tourism. At present, capacity is limited by domestic airline capability to provide additional seats in order to fulfill reciprocity arrangements under present airline agreements. Consideration should be given to an “open skies” policy to ease this constraint.
� Reduce the cost of internal transportation. A major effort would include improving efficiency and competition in ports,

54 Private Sector Assessment: Philippines
partly through increased competition in inter-island shipping. Include the privatization of port management (even down to privatization of individual quays to increase competition within ports), liberalizing opening of ports Philippine Ports Authority (PPA) to enhance competition between ports, e.g., between Batangas, Manila, and Morong, and more importantly repeal or modification of the Cabotage Law.
� Government-assisted export presence and trade promotions. Make Board of Investments (BOI) a promotional bureau, not a regulatory one.
� Where possible, the macroeconomic authorities should try to lean against a strong currency to mitigate the loss of price competitiveness of both exports and import substitutes. Enhance market competition.
� Provide access to technology for MSMEs by strengthening the network of testing, and experimental stations and laboratories.
� Review the liberalization of foreign ownership of land and other activities.
� Craft an antitrust law implementing the constitutional provision against monopolies and anti-competitive behavior. This will clarify issues of market concentration and contestability of markets.
� Maintain updated and credible databases for well-guided decision making. Rationalize the Philippine statistical system. Include the provision of small area statistics in the national budget, as this would level the playing field between large and small enterprises with respect to informational advantage.
� Amend SME law to create city SME development councils.
� The DOST must work on provision of access to technology for small firms. A solution to lack of access to technology would be if the DOST tapped the private sector to develop technology. SMEs have the produce, but no way to market their products.
� Fully implement the Credit System Information Act with a view to enhancing competition among providers of credit
reports and ratings by making the collection and distribution of credit information efficient and cost-effective.
y Access to credit has been very restrictive due to conservatism. This may be reversed through the following points. � Strengthen the banking sector
by facilitating bank balance sheet restructuring by implementing and strengthening reforms relating to supervision and nonperforming loan (NPL) restructuring; strengthening the prompt corrective action framework for handing distressed institutions quickly; strengthening the effectiveness of the Special Purpose Vehicle (SPV) Act with supporting and complementary legislation—the Corporate Recovery Bill and the Securitization Bill; and streamlining the respective roles of regulatory agencies, improving the coordination of the multiple financial regulatory agencies, and ensuring the consistency of the resulting regulations (World Bank 2008b).
� Reduce documentary procedures for banks lending to SMEs.
� Increase contestability among banks (e.g., foreign ownership of land would allow foreign banks to be more active). This, in turn, would result in lower interest rates and longer tenor of financial instruments.
y For the development of more infrastructure, it is suggested privatizing sectors and/or basic utilities that the private sector is willing to take over, and using PPP (MWSS model). Apparently, one of the barriers to entry is the large capital requirement (including the bid cost). Improvement must be introduced for both large capital-intensive projects and small projects. For large capital-intensive projects the process must first be made more competitive. It is also important to have a pipeline of projects coming up so the private sector can think about bidding on these. And foremost in the bidding process, there must be transparency. For small projects, skills of people handling PPPs must be enhanced through a learning-by-doing approach.

Proposed ADB Private Sector Development Strategy 55
Budget-support operations to support structural reform. The overall objective is to increase invest-ments through lowering the cost of productive activity in the country. This is especially true for MSMEs, which are more vulnerable to economic stress. Since a glaring deficiency in the Philippines is the “missing middle” whereby no SMEs support the large global companies, these weaknesses take on magnified importance. Improving processes and access would also contribute to the measures improving the general investment climate.
y Cut down the number of procedures (from 18 to 6). � Reduce extra government layers (i.e.,
abolish regional offices and strengthen provincial offices); implement coding in registration of business names to decentralize processing.
� Decentralize access to registration and processing, and make the process of approval more transparent. Coding in registration of business name would make issuance of business names easier/faster.
� Modify accounting requirements (e.g., legalization of books and receipts).
� Have two to four of the six procedures done online (e.g., company name verification, registration, or payment of fees).
y Empower local governments. � Induce local leadership to have a longer-
term horizon. Interview respondents suggested that the present 3-year term be reviewed when local government provisions of the constitution are examined.
� To strengthen local governments’ ability to provide local infrastructure and an enabling environment to the private sector, local government budgets should be more predictable and their ability to finance projects should be enhanced. One of the ingredients of this effort would be to ensure that internal revenue allocation (IRA) is automatic and not subject to national government impoundment. To incorporate revenue shortfalls, the IRA formula can be refined to take this into account. Another action would be to examine the regulations regarding local government borrowing and the need for national government guarantees.
� Empower local governments in the approval, regulatory, and permit administrative processes by devolving as much of these to the lower levels of government as possible. This might imply reducing the role of regional offices of national agencies or the removal of this layer of government in applicable cases.
� Improve governance. y On creating a rules-based environment,
some of the recommendations in the previous PSA (ADB 2005) still apply and are repeated below. � Clarify anticompetitive provisions of
existing legislation and make them part of the commercial code.
� Strengthen the capacity of the courts to adjudicate.
� Increase computerization in the government and use information technology to reduce corruption and the cost of doing business.
� Phase in the new government accounting system.
� Complete the cadastral titling of all lands in the country.
� Establish a central registry for land titles and secured transactions that is fully accessible by the public online.
� Strengthen the independence of sector regulators and give them sole authority over utility tariffs.
y The Office of the Ombudsman must be independent of the President.
y The National Competitiveness Council (NCC)should be made stronger, and the next administration should use this as the main way to partner with the private sector. Look at it at the local level.
y Full implementation of anti-graft law, where government offices show timeline of processes.
Private sector operationsPrivate sector operations will become more proac-tive in seeking and even formulating projects useful for improving the private sector environment and promoting its growth. Among others these opera-tions will include the following.
y Assisting the private sector in funding and organization of trade promotions.

56 Private Sector Assessment: Philippines
� More serious attempt at the Hong Kong, China41 model.
� Attempt the Singapore42 model. y Organization of dialogue between
management and unions over minimum wages.
y Organization of dialogue between export processing zones in Mindanao and the Muslims on what opportunities the latter would need and what the former could provide. As mentioned earlier, the lack of opportunities in the formal labor market in Mindanao is pointed to as the reason why Muslims take up arms.
y Release of a policy note on the adverse effects of the Cabotage Law on Philippine tourism, investment inflow, and export industries.
Public–private partnershipsGovernance plays a large part in improving pro-cesses in the country. Hence, the goals should include more transparent processes, better account-ing of government revenues and expenditures, and improved rankings pertaining to corruption and rule of law. In effect, this would lead to an enabling environment for PPPs.
The role of FDI in fixed capital creation and in private sector development in the Philippines has been limited up to now. The inability of FDI to penetrate the Philippine market shows how inhospitable the environment has been. The success of reforms in both rules and administrative processes and infra-structure support is expected to result in higher FDI and an increase in fixed capital. Along these lines, the following activities will be undertaken.
y Facilitation of joint venture projects between public and private sectors in the provision of power plants drawing on more natural and renewable sources in Luzon, Visayas, and Mindanao. Given the relative magnitude of the problem, it would be best to prioritize this project for Mindanao.
y Facilitation of joint venture projects between public and private sectors in the provision of water services in Visayas and Mindanao.
41 The Hong Kong Trade Development Council asks members to pay 0.5% of their sales income into a fund to promote Hong Kong, China.
42 Students are asked to contribute and participate in export promotions for Singapore as part of their education.
y Government to provide a food terminal complex in Mindanao to improve pricing and tonnage (or at least facilitate this for the private sector).
y Drawing up a project for a centralized solid waste management and garbage collection and disposal, to be financed through PPP.
y Facilitation of PPP in research and development.
y Facilitation of PPP in education. y Exploit information technology for good
governance. To support transparency, the rule of law, and reduction of the cost of doing business, use IT as an important tool. � To promote transparency and improve
frontline service for routine procedures, information about the process needs to be known to the public. The government already has an administrative order instructing all levels of government to standardize usual procedures, estimate standards for time for completion, and post them. These procedures, how long it should take to finish the process, and fees required should be posted in bulletin boards where they are openly visible. To facilitate this, a website can be maintained where a database of all these standardized procedures and fees can be accessed. For cost recovery and to avoid elaborate government procedures, this can be privatized: concessionaires will be allowed to post advertisements to recover the cost of operations.
� In the refinement of customs procedures suggested above, the database can be computerized together with the processing line for shipments.
� In the Bureau of Internal Revenue (BIR), privatize computerization of internal revenue returns, asset declarations, and other pertinent data, including data maintenance. This process has been ongoing for a long time through own implementation, not necessarily with satisfactory results. To address the concern for confidentiality, all personnel
Proposed ADB Private Sector Development Strategy 57
of private suppliers can be subject to the same confidentiality and sanctions as government staff. With the computerized database, statistical techniques can be used to identify objectively returns to be examined solely inside BIR premises.
� For the judiciary, a record for each judge of all cases filed as to the date of filing and final resolution, the number of temporary restraining orders (TROs), and the reversals in higher court can be kept in a computerized database. The average
length of time from filing to resolution for cases, number of TROs and average duration, and number of judgments sustained or reversed can be produced automatically every year. These will be used for promotions and even awards.
Regional cooperation improvementEncourage the government to participate in regional activities to promote regional cooperation, including regional investment facilitation and trade enhancement.

58
The present private sector assessment is an update and extension of the previous report (ADB 2005). The Philippines has seen some positive changes in recent years. With increasing OFW (overseas Filipino worker) remittances, average GDP growth has been signifi-cantly higher than in recent decades, the national savings rate and the gross international reserves have increased, and exchange rate uncertainties have largely disappeared, leading to improved sovereign risk ratings. With major bottlenecks to economic take-off removed, it is imperative that remaining obstacles be overcome. On the other hand, the strong inflow of foreign currency and purchasing power has substi-tuted for investment and export growth, which have been lackluster. As a result, the manufacturing sec-tor is hollowing out and industry has been growing in consumption-oriented activities, while the service sector is expanding tremendously. The composition of exports and the rest of industry point to a private sector that is less than healthy. The main findings from the previous report still hold. Traditional weak-nesses such as lack of infrastructure and rule of law, a weak finance sector aggravated by national govern-ment competition with the private sector for access to investment funds, and the high cost of doing busi-ness still abound to debilitate the private sector.
While the effects of those weaknesses continue, their harm is magnified by a fragmented market leading to wasted opportunities, especially in the face of a strong growth stimulus from OFW remit-tances. The Philippine economy is fragmented both geographically and vertically among industries. Geographic fragmentation owes much to the high cost of transport due to the industrial structure of domestic transportation and inefficiencies in the road and port network. The vertical fragmentation of the economy is indicated by the “missing middle” of industry, grouping firms into a dual distribution with a few large enterprises providing most of the
output and numerous small and micro industries. Medium-sized enterprises providing a seamless link between exporting and world-class firms and the rest of the economy are largely absent. As a result, the lack of inter- and intra-industry linkage leads to an inability to magnify the original demand stimu-lus to consumption-oriented and service industries sufficiently to mount a self-sustaining takeoff. To accelerate development and alleviate poverty the private sector, especially small, medium-sized, and micro enterprises, will have to be strengthened and encouraged.
Main principles
This report suggests a strategic approach to resolv-ing the continuing weaknesses by emphasizing five principles in interventions over the next country program strategy period: (i) focusing physical inter-ventions on completion of integrated national road, maritime, communications, and other basic networks and integrating these with industrial and geographic development programs such as tour-ism and regional plans; (ii) enhancing and leveling access to markets, credit, and basic services, includ-ing justice, across industries, regions, and firm size; (iii) designing interventions toward reducing the cost of doing business; (iv) devolving administra-tive services and decision making to lower levels of government; and (v) using modern technology and techniques to facilitate governance and administra-tive process. A sixth principle, not discussed here, is ensuring inclusive growth to promote long-term social investments and mitigate social pressures. The first principle may mean that the more egali-tarian approach to budget determination currently used has to be moderated to accommodate national systems needs. A rough apportionment could be made between funds to be allocated according to
Private Sector Assessment Report: Main Issues and Recommendations

Private Sector Assessment Report 59
egalitarian formulas and those for national integrated system plans. It may entail an agreement in principle between executive and legislative branches. This does not imply derogation of strengthening and devolution of powers to local governments, which can still be made consistent with national plans through suitable matching-grant schemes.
The government should also aim for policy over the long run, involving wider consultations so that policy and program changes can be minimized, allowing businesses a longer planning and execution horizon. To implement seriously the new administration’s policy of reward and penalty for agencies and local governments, a widely accepted output-oriented system of rating agencies and offices, perhaps involv-ing key informants, with widely understood criteria for each department (depending on function and mandate) could be developed.
Main recommendations
Investment projects for physical capital improvement and capacity buildingPhysical capital improvement and capacity build-ing should focus on projects designed to reduce the cost of doing business and improve the institutional framework and environment for the private sector. Infrastructure development should be coordinated with industrial and geographic development plans, explicitly supporting industries and areas targeted for promotion, with the objective of reducing the cost of doing business.
y Increase ports of entry where possible to ease the transit costs for imported inputs, tourism and other traffic. Strengthen administrative capability such as customs, immigration, and airport administration at points of entry.
y To make ports operations more efficient, include either or both of the following. � Privatize customs and substitute quotas
subject to international bidding. � Automatic release of goods after a specific
period (e.g., 72 hours). Shipments can be held for inspection only with prima facie evidence. Maintain a database recording number of times prima facie evidence has been produced by each responsible customs officer, and prepare a periodic
summary report for the highest levels of the Bureau of Customs or the Department of Finance.
Enhancing access for tourism and investment
y More liberal aviation policy, including the possibility of open skies to ease business travel and tourism.
y Reduce the cost of internal transportation by improving efficiency and competition in ports through increasing competition in inter-island shipping; privatization of port management (even down to individual quays); liberalizing opening of ports to enhance competition between ports; and repeal or modification of the Cabotage Law.
y Government-assisted export presence through trade promotions, making BOI a promotional bureau.
y Reforms to enhance market competition. � Strengthen the network of testing and
experimental stations and laboratories to provide technology access for MSMEs, including the use of public–private partnerships.
� Review foreign ownership of land and similar restrictions.
� Craft an antitrust law. � Rationalize Philippine statistical system to
include small area statistics in the national budget to level the playing field between large and small enterprises.
� Create city SME development councils. � Fully implement the Credit System
Information Act, ensuring competition among providers of credit reports and ratings by improving efficiency and cost effectiveness of collection and distribution of credit information.
y Wherever possible, macroeconomic authorities should favor policies leading to a competitive currency in order to mitigate the loss of price competitiveness of both exports and import substitutes.
Enhancements to credit and capital access
y Reduce financial conservatism. � Facilitate bank balance sheet restructuring
through reforms related to supervision and NPL restructuring.
60 Private Sector Assessment: Philippines
� Strengthen the prompt corrective action framework for handing distressed institutions quickly.
� Strengthen SPV Act with supporting and complementary legislation—the Corporate Recovery Bill and the Securitization Bill.
y Streamline the roles of regulatory agencies, improving coordination of the multiple financial regulatory agencies and ensuring consistency of the resulting regulations.
y Reduce documentary procedures for bank lending to SMEs.
y Increase contestability among banks (e.g., foreign ownership of land would allow foreign banks to be more active).
Administrative processThe overall objective is to increase investment by lowering the cost of productive activity, especially for MSMEs, which are more vulnerable to econo - mic stress.
y Cut down the number of administrative procedures (from 18 to 6). � Reduce extra government layers
(e.g., consolidate and/or abolish regional offices and strengthen provincial offices).
� Decentralize access to registration and processing, and make approval process more transparent.
� Modify accounting requirements (e.g., legalization of books and receipts).
� Computerize procedures for online processing (e.g., company name verification, registration, and payment of fees).
y Empower local governments. � Induce a longer-term horizon for LGUs.
Respondents find the present 3-year terms too short.
� Make local government budgets more predictable so planning and financing projects are enhanced. Make internal revenue allocation (IRA) automatic and not subject to impoundment. Refine the IRA formula to incorporate revenue shortfalls. Examine regulations on local government borrowing and national government guarantees.
� Devolve as much of the approval, regulatory, and permit process to the lower levels of government as possible, including reduction of the role of regional offices of national agencies.
Improving governanceTo create a rules-based environment, some of the recommendations in the previous PSA are seen still to apply and are repeated below.
y Clarify anticompetitive provisions of existing legislation and make them part of the commercial code.
y Strengthen the capacity of the courts to adjudicate.
y Increase computerization in the government and use information technology to reduce corruption and the cost of doing business.
y Phase in the new government accounting system.
y Complete the cadastral titling of all lands in the country.
y Establish a central registry for land titles and secured transactions that is fully accessible by the public online.
y Strengthen the independence of sector regulators and give them sole authority over utility tariffs.
The Office of the Ombudsman must be indepen-dent of the President.
The NCC should be made stronger, and the next administration should use this as the main way to partner with the private sector. Look at it at the local level.
Full implementation of anti-graft law is neces-sary, where government offices show timeline of processes.
Public–private partnershipsThe following activities appear promising: facilita-tion of joint venture projects between public and private sectors in the provision of power plants, water services, solid waste management and gar-bage collection, research and development, educa-tion, information technology for good governance, and similar activities like a centralized food terminal in Mindanao.

Private Sector Assessment Report 61
Information technology useExploit information technology and similar innova-tions to bring about good governance.
y To promote transparency and improve front-line services, fully implement the government administrative order instructing all levels to standardize usual procedures, estimate processing times, and post them where openly visible. Allow privatized websites where this information can be accessed.
y For customs procedures, the database can be computerized together with the processing line for shipments.
y In the Bureau of Internal Revenue, privatize computerization of internal revenue returns, asset declarations, and other pertinent data, including the maintenance of the data. Statistical techniques can objectively identify returns to be examined solely inside
internal revenue premises. All personnel will be subject to the same confidentiality and sanctions as BIR staff.
y For the judiciary, a record of all cases filed as to the date of filing and final resolution, the number of temporary restraining orders (TROs), and the reversals in higher court can be kept in a computerized database. For each judge, the average length of time from filing to resolution for cases, number of TROs and average duration, and the number of judgments sustained and reversed can be produced automatically every year. These will be used for promotions and even awards.
Inclusive growthSocial needs must also be attended to for longer-term impact and short-term stability to prevent social and political disruptions with profound eco-nomic effects.
62
Agarwal, A. 2010. Public–Private Partnership in Infrastructure Development. Public Sector Workshop for Enhancing Institutional Framework for PPP in Infrastructure Develop-ment. Manila: Ernst & Young.
Arvis, J. et al. 2007. Connecting to Compete: Trade Logistics in the Global Economy. Washington DC, US: The World Bank.
Asian Development Bank (ADB). 2000. Private Sector Develop-ment Strategy. Manila, Philippines: ADB. March.
———. 2005. Private Sector Assessment: Philippines. Manila, Philippines: ADB. May.
———. 2006. Private Sector Development: A Revised Strategic Framework. Manila, Philippines: ADB. February.
———. 2007a. Philippines: Critical Development Cons traints. Manila, Philippines: ADB. December.
———. 2007b. Private Sector Development and Operations: Harnessing Synergies with the Public Sector. Special Evaluation Study. Manila, Philippines: ADB. May.
———. 2008a. Strategy 2020: The Long-Term Strategic Framework of the Asian Development Bank 2008–2020. Manila, Philippines: ADB. April.
———. 2008b. Public–Private Partnership Handbook. Manila, Philippines: ADB. September.
———. 2008c. Infrastructure Planning Framework Report. Manila, Philippines: ADB.
———. 2009a. Country Operations Business Plan: Philippines 2010–2012. Manila, Philippines: ADB. October.
———. 2009b. Background Note on the Justice Sector of the Philippines. Manila, Philippines: ADB. December.
ADB/Centennial Group Holdings, LLC. 2007. Supporting Enhanced Cooperation Among Southeast Asian Equity Markets. Manila, Philippines: ADB.
A. T. Kearney. 2005. Building the Optimal Global Footprint—Global Services Location Index Report. Chicago, IL, US: A.T. Kearney.
———. 2009. The Shifting Geography of Offshoring— Global Services Location Index Report. Chicago, IL, US: A.T. Kearney.
Audretsch, D. B., and M. Fritsch. 1994. The Geography of Firm Births in Germany. Regional Studies Volume 28. Issue 4: 359–365. Routledge Group.
Australian Agency for International Development (AusAID). 2007. Australia–Philippines Development Assistance Strategy 2007–11. Canberra, Australia: AusAID. May.
Austria, M. S. 2002 Philippine Domestic Shipping Industry: State of Competition and Market Structure.
Philippine APEC Study Center Network (PASCN) Discussion Paper Series No. 2002–04. Makati City, Philippines: PASCN. June.
Balisacan, A.M., and H. Hill, eds. 2003. The Philippine Economy: Development, Policies, and Challenges. Quezon City, Philippines: Ateneo de Manila University Press.
Bas, R. Q. 2006. Our Traffic Mess Costs P140B. The Manila Times. 20 August.
Bayan Telecommunications (Bayan) and Institute for Development and Econometric Analysis (IDEA). 2007. The Philippine Outsourcing and Offshoring Industry. Quezon City, Philippines: Bayan Business. October.
Bernardo, R. L. 2009a. Crude Solution. BusinessWorld. 26 October.
———. 2009b. Oil Price Controls – One Step Forward, Two Steps Backward? BusinessWorld . 2 November.
Bondoc, J. R. 2005. Proof of Rice Import Fraud. The Philippine Star. 4 April.
Briones, R. M. 2009. Asia’s Underachiever: Deep Con straints in Philippine Economic Growth. Philippine Institute for Development Studies (PIDS) Discussion Paper Series No. 2009-04. Makati City, Philippines: PIDS. February.
Burgess, R., and V. Haksar. 2005. Migration and Foreign Remittances in the Philippines. IMF Working Paper No. 05/111. Washington, DC, US: IMF. June.
Cabarles, M. 2009. RP Labor Among Southeast Asia’s Most Expensive. BusinessWorld. 22 December.
Danao, R. A. 2009. Market Power in the Philippine Power Market. Discussion Paper No. 2009-09. Quezon City, Philippines: University of the Philippines School of Economics (UPSE). September.
de Dios, E. S. 2009. Governance, Institutions, and Political Economy. In D. B. Canlas, M. E. Khan, and J. Zhuang, eds. Diagnosing the Philippine Economy towards Inclusive Growth. London, UK: Anthem Publishing.
Department of Economic Affairs (DEA), Ministry of Finance, Government of India and Asian Development Bank. 2006. Facilitating Public–Private Partnership for Accelerated Infrastructure Development in India. Workshop Report for the Regional Workshops of Chief Secretaries on Public–Private Partnership held between June and September 2006 in India. Manila, Philippines: ADB. December.
Department of Energy. 2009. 14th Status Report on EPIRA Implementation (Period Covering November 2008 to April 2009). Taguig City, Philippines.
Bibliography

Bibliography 63
Diaz, J. 2009. RP Power Cost Highest in Asia. The Philippine Star. 1 July.
Diokno, B. E. 2008. Political Economy of Subsidy. Business World. 16 April.
The Economist. 2010. Inside the miracle: How Germany weathered the recession. 13–19 March. http://www.economist.com/specialreports/displaystory.cfm?story _id=15641021Fabella, R. V. 2000. The Soft State: The Market and
Governance. Philippine Review of Economics. 37(1): 1–11.
———. 2010. Infrastructure Gap: Symptoms and Roots. BusinessWorld. 28 February.
Financial Executives Institute of the Philippines (FINEX). 2010. Getting to Know the National Budget. Makati City, Philippines: FINEX. January.
Fitch Ratings. 2010. Banks in Asia (Excluding Japan): Outlook for 2010 Special Report. New York, NY, US: Fitch, Inc. February.
Global Integrity. 2008. Global Integrity Scorecard: Philippines. In Global Integrity Report. http://www.globalintegrity.org/report
Gonzales, I. 2010. 5 Groups Eye MRT controlling stake. The Philippine Star. 18 January.
Grimsey, D., and M. K. Lewis, eds. 2005. The Economics of Public-Private Partnerships. The International Library of Critical Writings in Economics 183. Cheltenham, UK: Edward Elgar Publishing.
Habito, C. F. 2009. Patterns of Inclusive Growth in Develop-ing Asia: Insights from an Enhanced Growth-Poverty Elasticity Analysis. ADB Institute (ADBI) Working Paper Series No. 145. Tokyo, Japan: ADBI. August.
Herzberg, B., and A. Wright. 2005. Competitiveness Part-nerships: Building and Maintaining Public-Private Dialogue to Improve the Investment Climate. A Resource Drawn from 40 Countries Experiences. World Bank Policy Research Working Paper No. 3683. Washington, DC, US: The World Bank.
Horowitz, M. D., and J.A. Rosensweig. 2007. Medical Tourism – Health Care in the Global Economy. The Physician Executive Journal. Tampa, FL, US: American College of Physician Executives. November.
International Monetary Fund (IMF). 2009. Philippines: Selected Issues. IMF Country Report No. 09/63. Washington, DC, US: IMF. February.
———. 2010. Philippines: Financial System Stability Assessment Update. IMF Country Report No. 10/90. Washington, DC, US: IMF. April.
JPMorgan Chase. n.d. Report on Investment Competi-tiveness. p. 37
Joint Foreign Chambers (JFC). 2009. Impact of the Global Economic Crisis on the Philippines: Preparing to
Rebuild Foreign Investment Inflows. Paper presented during the JFC press conference at the Dusit Thani Hotel. Makati City, Philippines. 1 June.
LaRocque, N. 2008. Public–Private Partnerships in Basic Education: An International Review. Berkshire, UK: CfBT Education Trust. May.
Leano, R. M. 2006. SMEs in the Philippines. Confederation of Asia Pacific Chambers of Commerce and Industry (CACCI) Journal. Volume 1, 1-10. Taipei,China: CACCI.
Llanto, G. M., E. Basilio, and L. Basilio. 2005. Competition Policy and Regulation in Ports and Shipping. PIDS Working Paper No. 2005-02. Makati City, Philippines: PIDS-World Bank Competition Policy Project. February.
Magnoli Bocchi, A. 2008. Rising Growth, Declining Investment: Puzzle of the Philippines. World Bank Policy Research Working Paper No. 4472. Washington, DC, US: The World Bank.
Mangahas, J. V. 2006. The Philippines. In B. Roberts and T. Kanaley, eds. Urbanization and Sustainability in Asia: Case Studies of Good Practices. Manila, Philippines: ADB and Cities Alliance. 273–307.
Mapa, D. S., and A.M. Balisacan. 2004. Quantifying the Impact of Population on Economic Growth and Poverty: The Philippines in an East Asian Context. Paper presented during the 9th Convention of the East Asian Economic Association held on 13–14 November 2004. Hong Kong, China.
Mishkin, F. C. 2004. The Economics of Money, Banking , and Financial Markets, 7th Edition. New York, NY, US: Addison Wesley.
National Economic and Development Authority. 2004. The Medium Term Philippine Development Plan 2004–2010. Manila, Philippines.
Paderanga, C. W. 2009a. Smugglers’ Dreams Come True. BusinessWorld. 29 November.
———. 2009b. The Macroeconomic Impact of Remittances in the Philippines. Discussion Paper No. 2009–03. Quezon City, Philippines: UPSE. September.
Paderanga, C. W., and K. S. Canales. 2009. The Philippines. In A. Kohsaka, ed. Pacific Economic Outlook Structure Project: External Adjustments under Increasing Integ-ration in the Pacific Region. Osaka, Japan: Pacific Economic Cooperation Council. May. 41– 42.
Pascual, A. E. 2008. North Luzon Expressway Project: A successful public–private partnership in the Philippines. 3–7 November. Presentation at ADB Institute. Tokyo, Japan.
Patrinos, H.A., F. Barrera-Osorio, and J. Guaqueta. 2009. The Role and Impact of Public–Private Partnerships in Education. Washington, DC, US: The World Bank. March.

64 Bibliography
Pernia, E. M. 2006. Diaspora, Remittances, and Poverty RP’s Regions. UPSE Discussion Paper. Quezon City, Philippines: UPSE.
———. 2008a. Is Labor Export Good Development Policy. Discussion Paper No. 2008-13. Paper presented at the 3rd Ayala Corporation-UPSE Economic Forum, Tower One, Makati City. 15 October 2008. Quezon City, Philippines: UPSE.
———. 2008b. Migration, Remittances, Poverty and Inequality: The Philippines. Discussion Paper No. 0801. Quezon City, Philippines: UPSE. February.
Pernia, E. M., and J. I. Salas. 2005. Investment Climate and Regional Development in the Philippines. Discussion Paper No. 0501. Quezon City, Philippines: UPSE. March.
Petersen, M. A., and G. R. Raghuram. 1992. The Benefits of Firm-Creditor Relationships: Evidence from Small Business Data. University of Chicago Working Paper No. 362. Chicago, IL, US: UC.
Porter, M. E. 2009. The Competitive Advantage of Nations, States and Regions. Presentation for the Advanced Management Program. Boston, MA, US: Harvard Business School. 15 April.
Quimbo, R. S. 2007. Role of Private Sector in Building Trade Related Infrastructure: The MNTC Experience. Paper presented during the Mobilizing Aid for Trade: Focus Asia and the Pacific Convention co-hosted by the Philippine government, ADB, and the World Trade Organization. Manila, Philippines: ADB. 18 September.
Rangan, V. K., D. Wheeler, and J. Comeault. 2007. Manila Water Company. Harvard Business School Case No. 508– 004. Boston, MA, US: Harvard Business School.
Reside, R. E. 2009. Global Determinants of Stress and Risk in Public-Private Partnerships (PPP) in Infrastructure. ADBI Working Paper Series No. 133. Tokyo, Japan: ADBI. March.
Reside, R. E., and A. M. Mendoza. 2010. Determinants of Outcomes of Public–Private Partnerships (PPP) in Infrastructure in Asia. Discussion Paper No. 2010–03. Quezon City, Philippines: UPSE. March.
Rostow, W. W. 1953. The Process of Economic Growth. New York, NY, US: W. W. Norton.
Roumasset, J. 2000. Black Hole Security. University of Hawaii Working Paper No. 00-5. Hawaii, US: UH. April.
Sanez, O. 2008. Philippine Off-shoring and Outsourcing (O&O) Industry: Facing Global Challenges Today. Presen tation for the Business Processing Association of the Philippines (BPA/P).
Schwab, K., and M. Porter. 2009. The Global Competitiveness Report 2009–2010. Geneva, Switzerland: World Economic Forum.
Schwalbach, J. 1989. Small Business in German Manu-facturing. Small Business Economics 1:129–136.
Solsten, E., ed. 1995. German Industry. In Germany: A Country Study. Washington, DC, US: US Government Printing Office (GPO) for the Library of Congress. http://countrystudies.us/germany/145.htm
Stewart-Smith, M. 1995. Private Financing and Infra-structure Provision in Emerging Markets. In D. Grimsey and M. K. Lewis, eds.
United States Agency for International Development (USAID). Local Implementation of National Competi-tiveness for Economic Growth (LINC-EG). A USAID-supported project managed by Nathan Associates, Inc.
Venohr, B., and K. E. Meyer. 2007. The German Miracle Keeps Running: How Germany’s Hidden Champions Stay Ahead in the Global Economy. Working Paper No. 30. Berlin, Germany: FHW Berlin (Berlin School of Economics). May. http://www.berndvenohr.de/ download/veroeffentlichungen/forschung/The_German_Miracle_Keeps_Running.pdf
Viray, F. L. 2008. Challenges in the Philippines’ Energy Sector. 9 July.
Wallace, P. 2010. Behind the Border Barriers to Investments. In FDI Barrier. Washington, DC, US: The World Bank.
World Bank (WB). 2007. Connecting to Compete: Trade Logistics in the Global Economy. The Logistics Performance Index and Its Indicators. Washington, DC, US: The World Bank.
———. 2008a. Deepening and Diversifying the Financial System. Discussion Draft in Capital Market Development in the Philippines. Washington, DC, US: The World Bank. 23 June.
———. 2008b. Doing Business in the Philippines. Washington, DC, US: The World Bank.
———. 2008c. Infrastructure Planning Framework: Preparing the Philippines Basic Urban Services Sector Project. World Bank Office Manila. February.
———. 2008d. Land Reform, Rural Development, and Poverty in the Philippines: Revisiting the Agenda. World Bank Office. Manila. Draft.
———. 2009a. Doing Business. Washington, DC, US: The World Bank.
———. 2009b. Philippines: Country Assistance Strategy. Washington, DC, US: The World Bank.
———. 2009c. Philippines Quarterly Update: Sailing Through Stormy Waters. WB Economic Monitoring Report. Washington, DC, US: The World Bank. July.
———. 2009d. Philippines Quarterly Update: Towards an Inclusive Recovery. WB Economic Monitoring Report. Washington, DC, US: The World Bank. November.
———. 2009e. Worldwide Governance Indicators, 1996–2008. Washington, DC, US: World Bank Institute.
———. 2010a. Doing Business. Washington, DC, US: The World Bank.

Bibliography 65
———. 2010b. Philippines Quarterly Update: Laying Out the Exit Strategies. WB Economic Monitoring Report. Washington, DC, US: The World Bank. February.
World Bank and Public–Private Investment Advisory Facility (PPIAF). 2007. Public–Private Partnership Units: Lessons for their Design and Use in Infrastructure. Washington, DC, US: World Bank. October.
World Economic Forum (WEF). 2009. Global Competi-tiveness Report 2009–2010. Geneva, Switzerland: WEF.
Wu, X., and N. A. Malaluan. 2008. A Tale of Two Conces-sionaires: A Natural Experiment of Water Privatisation in Metro Manila. Urban Studies (2008, 45: 207. DOI: 10.1177/0042098007085108).
Yap, J. T. 2008. Policy Coherence Initiative on Growth, Investment and Employment: The Case of the Philippines (Policy Coherence and Critical Development Constraints in the Philippines). Paper prepared for the International Labour Organization (ILO).
Linkshttp://www.dotcmrt3.gov.ph/company_portfolio_historyhttp://www.lrta.gov.ph/srts_project.htmhttp://www.urbanrail.net/as/mani/manila.htmhttp://www.dotcmrt3.gov.ph/ridership
Interviewed personsAmerican Chamber of Commerce of the Philippines: John
Forbes and Robert SearsAmerican Chamber of Commerce & Industry, Cebu: John
DomingoAsian Development Bank, PPP: Jon LindborgAsian Development Bank, Social Sectors Division,
Southeast Asia Department: Norman LaRocqueAsian Development Bank, Transport and Urban Develop-
ment Division, Southeast Asia Department: Florian Steinberg
Asian Development Bank: Kelly Bird and Heidi MendozaAsian Institute of Management Policy Center: Federico
MacaranasBusiness Process Association of the Philippines: Oscar
Sanez and Gigi VirataCebu Business Club: Fernando C. FajardoCebu Court of First Insurance Community Cooperative:
Judge Esperanza F. Garcia (ret.)
Cebu Filipino Chinese Chamber of Commerce: Filomeno Lim and Rodrigo Go
Cebu Investment Promotions Center: Joel Mari YuCity Cooperative Development Office: Engr. Jaime G.
AdalinDavao City Chamber of Commerce & Industry: Patrick
Castro, Edward So, John Gaisano, Sofronio Jucutan, Napoleon Liloc, and Atty. Domingo Duerme
European Chamber of Commerce of the Philippines: Henry Schumacher
Filipino Cebuano Business Club: Rey E. CalooyGelatone: Ma. Teresa SongcoGlobalSource and IDEA: Romeo Bernardo, Christine Tang,
and Margarita DebuqueIDEA: Eduard Joseph Robleza, Jackson Ubias, Ruby Anne
Lemence, and Julius SantosInternational Finance Corporation: Jesse AngMakati Business Club: Alberto LimMandaue Chamber of Commerce & Industry: Wilson P. NgMindanao Business Council, Regional Development Council XI, Regional Development Committee, NEDA 11: Vicente LaoNEDA Reg. VII: Madeline EscandorNEDA Reg. XI: Dir. Maria Lourdes D. LimOffice of City Planning & Development Coordinator: Engr.
Mario Luis J. JacintoPHILEXPORT, Cebu: Jay Yuvallos, Apolinar Suarez, Jr.,
Charles M. Streegan, Venus Genson, Fred Escalona, Maximo A. Ricohermoso, et al.
Philippine Chamber of Commerce and Industry: Edgardo G. Lacson, Sergio R. Ortiz-Luiz, Jr., and Amb. Donald Dee
Philippine education sector representatives: Milwilda Guevara (Synergeia Foundation), Mike Luz, Chito Salazar (PBed), Vincent Fabella (PACU), and Rosita Navarro (PACUCOA)
Rotary South Davao: Bernard P. BenedictoUniversity of the Philippines School of Economics: Felipe
Medalla and Ernesto PerniaWorld Bank, Poverty Reduction & Economic Management:
Eric Le BorgneWorld Bank, Public–Private Infrastructure Advisory
Facility: Paul Reddel and Hope Gerochi

66
Appendix A
BOT Projects Funded by the Private Sector
Sector Project NameAmount
(P million)Date
Approved
Energy Privatization and Refurbishment of the Calaca Coal-fired Thermal Power Plant Project
210.00 2 Jun 2008
Acquisition and Rehabilitation of the Masinloc Coal-fired Thermal Power Plant
200.00 15 Jan 2008
Mirant Pagbilao Corporation (formerly Southern Eenrgy (Quezon) Inc./formerly Hopewell Power)
50.00 18 May 1993
Batangas Power Corp. 29.50 18 May 1993
Hopewell Energy (Philippines) Corp. 21.10 23 Nov 1989
Finance SME Development Support (Credit Information Bureau) 1.00 29 Sep 2005
SME Development Support (Financing Access Improvement Project (36419-01))
18.40 29 Sep 2005
Purchase and Resolution of Equitable PCI Bank’s Portfolio of Nonperforming Loans and Assets
5.00 24 Jun 2005
PHI: NHMFC’s Disposal of Non-performing Loans 34.00 17 Dec 2004
Bahay Financial Services, Inc. (BFSI) 1.00 17 Dec 2004
PHI: Equity Investment in LGU Guarantee Corporation (LGUGC)
2.00 19 Jan 2004
PS Peso Swap and Financing 200.00 13 Jan 2004
Planters Development Bank 0.85 9 Dec 1991
Asiatrust Development Bank 0.54 6 Dec 1990
BPI/PCICC 4.00 11 Oct 1990
PDB Leasing Corp. 0.37 3 Aug 1989
H & Q Philippine Ventures 2.50 15 Sep 1988
Industry and Trade Primo Oleochemicals, Inc. 6.04 14 Apr 1998
Primo Oleochemicals, Inc 2.30 14 Apr 1998
Bukidnon Resources Co., Inc. 0.30 20 Dec 1994
Primo Oleochemicals, Inc. 25.50 9 Nov 1993
Bukidnon Resources Co., Inc. 5.50 21 Sep 1993
Marcopper Mining Corporation 15.00 8 Aug 1991
Shemberg Biotech Corporation 5.46 6 Jun 1991
Avantex Mill Corp. 13.00 11 Dec 1990
continued on next page

BOT Projects Funded by the Private Sector 67
Sector Project NameAmount
(P million)Date
Approved
Transport and ICT North Luzon Expressway Rehabilitation and Expansion (formerly Manila North Tollways Corporation)
70.00 26 Oct 2000
Philippine International Air Terminals Co. Inc. 80.00 17 Dec 1999
Philippine Long Distance Telephone Co. 24.00 29 Mar 1988
Water and Other Municipal Infrastructure and Services
Maynilad Water Services, Inc. _ 14 Sep 1999
Unclassified Visayas Base-Load Power Project 120.00 11 Dec 2009
Mutual Fund Co. of the Philippines, Inc. 3.85 9 Apr 1996
Walden AB Ayala Management Co., Inc. 0.03 26 Jul 1995
Walden AB Ayala Ventures Co., Inc. 2.89 27 Oct 1994
Walden AB Ayala Management Co., Inc. 0.02 27 Oct 1994
Appendix A continued

68
Sector Project NameAmount
(P million)Date
Approved
Agriculture and Natural Resources
Agrarian Reform Communities Project II 70.00 27 Oct 2008
Integrated Coastal Resources Management 33.80 23 Jan 2007
Infrastructure for Rural Productivity Enhancement Sector Project
75.00 31 Oct 2000
Grains Sector Development Program—Program Loan 100.00 24 Apr 2000
Grains Sector Development Program—Project Loan 75.00 24 Apr 2000
Agrarian Reform Communities 93.16 18 Dec 1998
Southern Philippines Irrigation Sector 60.00 18 Dec 1998
Fisheries Resource Management (formerly Fisheries Sector Development)
35.20 16 Oct 1997
Cordillera Highland Agricultural Resource Management 9.50 11 Jan 1996
Second Irrigation Systems Improvement 15.00 30 Aug 1995
Second Irrigation Systems Improvement 15.00 29 Aug 1995
Small Farmers Credit 75.00 22 Dec 1992
Forestry Sector 50.00 19 Nov 1992
Industrial Forest Plantations (Sector) 25.00 17 Oct 1991
Irrigation Systems Improvement 20.00 8 Nov 1990
Irrigation Systems Improvement 9.00 8 Nov 1990
Low Income Upland Communities 32.00 14 Dec 1989
Fisheries Sector Program 30.00 26 Sep 1989
Fisheries Sector Program 50.00 26 Sep 1989
Forestry Sector Program 60.00 28 Jun 1988
Allah River Irrigation (Supplementary) 27.90 20 Dec 1984
Agricultural Inputs Program 130.00 27 Mar 1984
Forestry Development 34.00 20 Dec 1983
Aquaculture Development 21.84 20 Dec 1983
Irrigation Sector Loan I (Southern Philippines) 67.40 12 Dec 1983
Fourth Mindanao Irrigation Study 1.50 12 Dec 1983
Agro-Processing and Marketing 36.00 25 Nov 1982
Cotton Development 26.70 4 Nov 1982
Third Davao del Norte Irrigation 45.30 2 Sep 1982
Smallholder Livestock Development 8.00 25 Nov 1981
Second Laguna de Bay Irrigation 20.00 25 Sep 1980
Northern Palawan Fisheries Development 18.00 27 Sep 1979
Appendix B
Projects Financed by ADB Loans
continued on next page
Projects Financed by ADB Loans 69
Sector Project NameAmount
(P million)Date
Approved
Agriculture and Natural Resources
Laguna de Bay Fish Pen Development 9.00 1 Dec 1978
Second Agusan Irrigation 14.00 31 Oct 1978
Allah River Irrigation 23.50 11 May 1978
Tago River Irrigation 22.00 1 Sep 1977
Second Davao del Norte Irrigation 15.00 7 Dec 1976
Laguna de Bay Development 27.50 9 Dec 1975
Pulangui River Irrigation 13.50 26 Jun 1975
Agusan del Sur Irrigation 5.80 17 Dec 1974
Davao del Norte Irrigation 4.20 22 Nov 1973
Angat-Magat Integrated Agricultural Development 3.60 28 Jun 1973
Angat-Magat Integrated Agricultural Development 6.00 28 Jun 1973
Cotabato Irrigation 2.50 18 Nov 1969
Education Fund for Technical Education and Skills Development 19.87 24 Aug 2000
Technical Education and Skills Development 25.00 24 Aug 2000
Secondary Education Development and Improvement 53.00 11 Dec 1998
Nonformal Education 25.20 30 Sep 1993
Secondary Education Development Sector 70.00 11 Aug 1988
Agricultural Technology Education 15.86 8 Mar 1988
Technical and Vocational Education 27.00 8 Oct 1981
Engineering Education 16.00 1 Sep 1977
Energy Philippine Energy Efficiency Project 31.10 29 Jan 2009
Power Sector Development Program Loan 450.00 8 Dec 2006
Electricity Market and Transmission Development 40.00 19 Dec 2002
Power Sector Restructuring Program 300.00 16 Dec 1998
Power Transmission Reinforcement 191.40 16 Dec 1997
Leyte–Mindanao Interconnection Engineering 5.35 30 Sep 1996
Northern Luzon Transmission and Generation 244.00 2 Nov 1995
Power Transmission 164.00 14 Dec 1993
Meralco Distribution 138.00 10 Dec 1992
Sixteenth Power (Masinloc Thermal Power) 200.00 30 Oct 1990
Fifteenth Power (Sector) 160.00 14 Nov 1989
Fourteenth Power (Sector) 120.00 27 Oct 1988
Third Power System Development 92.00 18 Dec 1986
PNOC Energy Loan 85.00 20 Dec 1984
Second Power System Development 33.00 20 Dec 1984
Negros–Panay Interconnection 43.80 12 Dec 1983
Power System Development 32.75 7 Dec 1982
Rural Electrification 87.50 17 Nov 1981
Negros and Mindanao Power Transmission 60.50 18 Nov 1980
Sixth Mindanao Power 60.70 27 Nov 1979
continued on next page
Appendix B continued
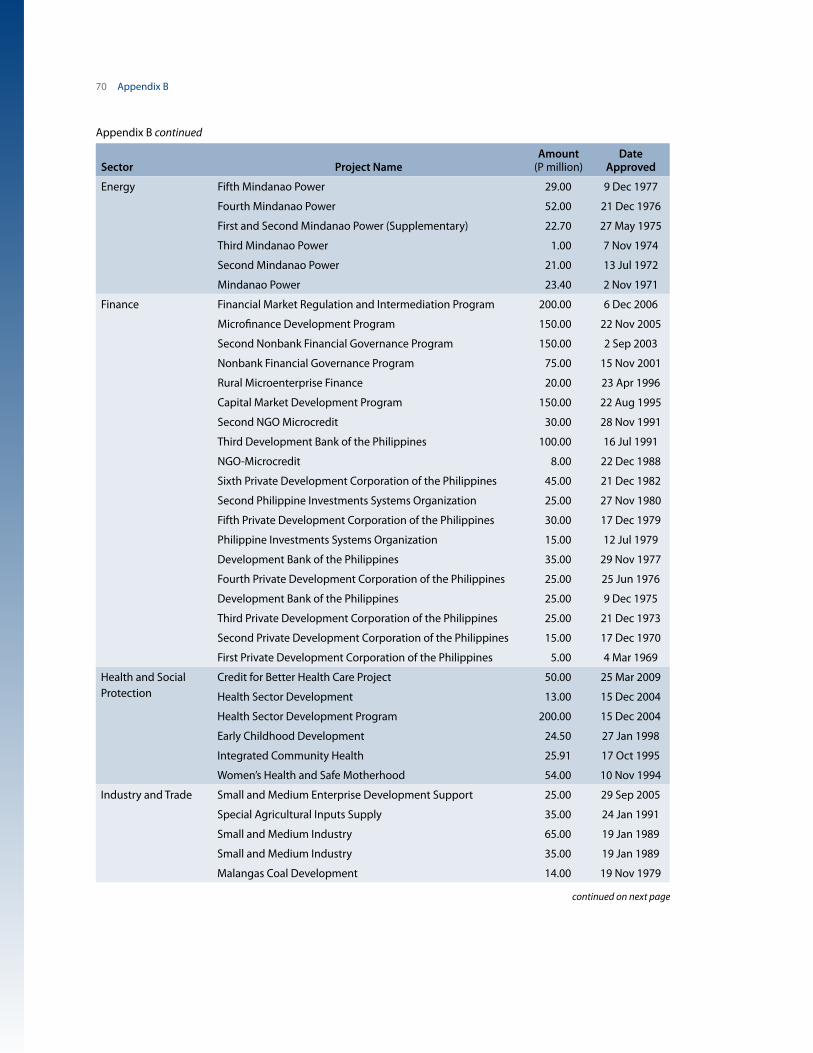
70 Appendix B
Sector Project NameAmount
(P million)Date
Approved
Energy Fifth Mindanao Power 29.00 9 Dec 1977
Fourth Mindanao Power 52.00 21 Dec 1976
First and Second Mindanao Power (Supplementary) 22.70 27 May 1975
Third Mindanao Power 1.00 7 Nov 1974
Second Mindanao Power 21.00 13 Jul 1972
Mindanao Power 23.40 2 Nov 1971
Finance Financial Market Regulation and Intermediation Program 200.00 6 Dec 2006
Microfinance Development Program 150.00 22 Nov 2005
Second Nonbank Financial Governance Program 150.00 2 Sep 2003
Nonbank Financial Governance Program 75.00 15 Nov 2001
Rural Microenterprise Finance 20.00 23 Apr 1996
Capital Market Development Program 150.00 22 Aug 1995
Second NGO Microcredit 30.00 28 Nov 1991
Third Development Bank of the Philippines 100.00 16 Jul 1991
NGO-Microcredit 8.00 22 Dec 1988
Sixth Private Development Corporation of the Philippines 45.00 21 Dec 1982
Second Philippine Investments Systems Organization 25.00 27 Nov 1980
Fifth Private Development Corporation of the Philippines 30.00 17 Dec 1979
Philippine Investments Systems Organization 15.00 12 Jul 1979
Development Bank of the Philippines 35.00 29 Nov 1977
Fourth Private Development Corporation of the Philippines 25.00 25 Jun 1976
Development Bank of the Philippines 25.00 9 Dec 1975
Third Private Development Corporation of the Philippines 25.00 21 Dec 1973
Second Private Development Corporation of the Philippines 15.00 17 Dec 1970
First Private Development Corporation of the Philippines 5.00 4 Mar 1969
Health and Social Protection
Credit for Better Health Care Project 50.00 25 Mar 2009
Health Sector Development 13.00 15 Dec 2004
Health Sector Development Program 200.00 15 Dec 2004
Early Childhood Development 24.50 27 Jan 1998
Integrated Community Health 25.91 17 Oct 1995
Women’s Health and Safe Motherhood 54.00 10 Nov 1994
Industry and Trade Small and Medium Enterprise Development Support 25.00 29 Sep 2005
Special Agricultural Inputs Supply 35.00 24 Jan 1991
Small and Medium Industry 65.00 19 Jan 1989
Small and Medium Industry 35.00 19 Jan 1989
Malangas Coal Development 14.00 19 Nov 1979
continued on next page
Appendix B continued
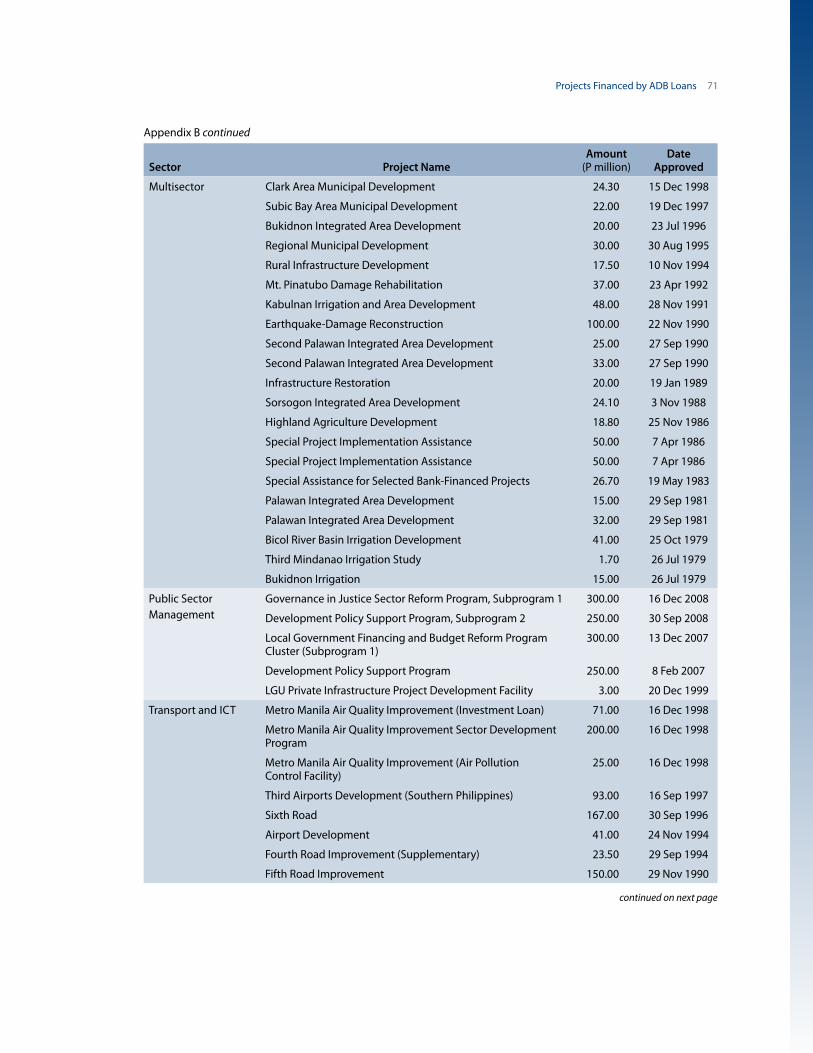
Projects Financed by ADB Loans 71
Sector Project NameAmount
(P million)Date
Approved
Multisector Clark Area Municipal Development 24.30 15 Dec 1998
Subic Bay Area Municipal Development 22.00 19 Dec 1997
Bukidnon Integrated Area Development 20.00 23 Jul 1996
Regional Municipal Development 30.00 30 Aug 1995
Rural Infrastructure Development 17.50 10 Nov 1994
Mt. Pinatubo Damage Rehabilitation 37.00 23 Apr 1992
Kabulnan Irrigation and Area Development 48.00 28 Nov 1991
Earthquake-Damage Reconstruction 100.00 22 Nov 1990
Second Palawan Integrated Area Development 25.00 27 Sep 1990
Second Palawan Integrated Area Development 33.00 27 Sep 1990
Infrastructure Restoration 20.00 19 Jan 1989
Sorsogon Integrated Area Development 24.10 3 Nov 1988
Highland Agriculture Development 18.80 25 Nov 1986
Special Project Implementation Assistance 50.00 7 Apr 1986
Special Project Implementation Assistance 50.00 7 Apr 1986
Special Assistance for Selected Bank-Financed Projects 26.70 19 May 1983
Palawan Integrated Area Development 15.00 29 Sep 1981
Palawan Integrated Area Development 32.00 29 Sep 1981
Bicol River Basin Irrigation Development 41.00 25 Oct 1979
Third Mindanao Irrigation Study 1.70 26 Jul 1979
Bukidnon Irrigation 15.00 26 Jul 1979
Public Sector Management
Governance in Justice Sector Reform Program, Subprogram 1 300.00 16 Dec 2008
Development Policy Support Program, Subprogram 2 250.00 30 Sep 2008
Local Government Financing and Budget Reform Program Cluster (Subprogram 1)
300.00 13 Dec 2007
Development Policy Support Program 250.00 8 Feb 2007
LGU Private Infrastructure Project Development Facility 3.00 20 Dec 1999
Transport and ICT Metro Manila Air Quality Improvement (Investment Loan) 71.00 16 Dec 1998
Metro Manila Air Quality Improvement Sector Development Program
200.00 16 Dec 1998
Metro Manila Air Quality Improvement (Air Pollution Control Facility)
25.00 16 Dec 1998
Third Airports Development (Southern Philippines) 93.00 16 Sep 1997
Sixth Road 167.00 30 Sep 1996
Airport Development 41.00 24 Nov 1994
Fourth Road Improvement (Supplementary) 23.50 29 Sep 1994
Fifth Road Improvement 150.00 29 Nov 1990
continued on next page
Appendix B continued

72 Appendix B
Sector Project NameAmount
(P million)Date
Approved
Transport and ICT Road and Road Transport Sector Program 50.00 8 Nov 1990
Road and Road Transport Sector Program 50.00 8 Nov 1990
Second Manila Port 43.50 15 Dec 1987
Fourth Road Improvement 82.00 25 Nov 1986
Third Road Improvement 68.00 11 Nov 1982
Second Road Improvement 30.00 30 Oct 1980
Manila Port 27.00 27 Sep 1979
Mindanao Secondary and Feeder Roads 24.00 12 Dec 1978
Road Improvement 45.00 29 Sep 1977
Philippine National Railways 24.20 25 Mar 1976
Mindanao Secondary and Feeder Roads 0.50 14 Aug 1975
Manila International Airport Development 29.60 11 Dec 1973
Tarlac–Santa Rosa and Feeder Roads 3.60 28 Jun 1973
Cotabato Port Development 6.60 3 Apr 1973
Iligan–Cagayan de Oro–Butuan Road 22.25 9 Nov 1972
Fisheries Port 1.00 4 Mar 1971
Fisheries Port 4.50 4 Mar 1971
Cotabato-General Santos Road 10.60 23 Dec 1970
Water and Other Municipal Infrastructure and Services
Development of Poor Urban Communities Sector 30.50 18 Dec 2003
MWSS New Water Source Development Project 3.26 14 Oct 2003
Mindanao Basic Urban Services Sector 30.00 27 Sep 2001
Pasig River Environmental Management and Rehabilitation Sector Development Program (Policy Loan)
100.00 20 Jul 2000
Pasig River Environmental Management and Rehabilitation Sector Development Program Loan (Investment Loan)
75.00 20 Jul 2000
Small Towns Water Supply Sector 50.00 30 Sep 1996
Rural Water Supply and Sanitation Sector 18.50 4 Jun 1996
Rural Water Supply and Sanitation Sector 18.50 4 Jun 1996
Umiray–Angat Transbasin 92.00 21 Sep 1995
continued on next page
Appendix B continued

Projects Financed by ADB Loans 73
Sector Project NameAmount
(P million)Date
Approved
Water and Other Municipal Infrastructure and Services
Municipal Water Supply 43.20 25 Nov 1993
Umiray–Angat Transbasin Technical Assistance 2.60 22 Dec 1992
Manila South Water Distribution 31.40 19 Dec 1991
Metropolitan Cebu Water Supply 6.00 29 Nov 1990
Metropolitan Cebu Water Supply 16.00 29 Nov 1990
Second Islands Provinces Rural Water Supply 24.00 20 Nov 1990
Angat Water Supply Optimization 130.00 14 Nov 1989
Second Manila Water Supply Rehabilitation 26.40 24 Jan 1989
Island Provinces Rural Water Supply Sector 24.00 4 Dec 1986
Manila Water Supply Rehabilitation 39.30 27 Oct 1983
Water Supply Sector 46.00 25 Nov 1981
Manila Sewerage 42.80 24 Jun 1980
Second Manila Water Supply 49.00 7 Sep 1978
Provincial Cities Water Supply 16.80 16 Dec 1975
Manila Water Supply 51.30 28 Aug 1974
Unclassified Local Government Financing and Budget Reform Program—Subprogram 2
225.00 26 Nov 2009
Development Policy Support Program—Subprogram 3 250.00 15 Sep 2009
Countercyclical Support Loan _ 24 Aug 2009
Appendix B continued

74
Appendix C
Projects Funded by ADB Grants
Sector Project NameAmount
(P million)Date
Approved
Agriculture and Natural Resources
Integrated Coastal Resources Management 9.00 23 Jan 2007
Energy Philippine Energy Efficiency Project 1.50 29 Jan 2009
Renewable Energy and Livelihood Development Project for the Poor in Negros Occidental
1.50 19 Jan 2004
Finance Developing Microinsurance Project 1.00 15 Feb 2008
Developing Financial Cooperatives _ 14 Mar 2006
NGO Development Program and Institutional Strengthening of DTI
1.80 29 May 1992
Credit Program for the Poorest of the Poor 3.00 28 Nov 1991
Health and Social Protection
Enhancing Midwives’ Entrepreneurial and Financial Literacy (Credit for Better Health Care Project)
0.40 25 Mar 2009
Social Protection for Poor Women Vendors in Mindanao Cities
1.00 7 Aug 2002
Industry and Trade Developing the Philippine Business Registry 0.70 8 Aug 2005
Multisector Southern Leyte Landslide Disaster Assistance 3.00 15 Dec 2006
Strategic Private Sector Partnerships for Urban Poverty Reduction in Metro Manila
3.60 24 Sep 2002
Off-Site and Off-City Relocation of Vulnerable Slum Communities of Muntinlupa City
1.00 21 Dec 2000
On-Site Urban Upgrading for Vulnerable Slum Communities of Payatas
1.00 13 Dec 2000
Supporting the Sustainable Livelihood for the Poor in Southern Philippines
2.80 31 Oct 2000
Unclassified Typhoon Ketsana (Ondoy) Project under Asia Pacific Disaster Response Fund
3.00 29 Sep 2009

75
Appendix D
Projects Granted with Technical Assistance by ADB
Sector Project NameAmount
(P million) Date Approved
Agriculture and Natural Resources
Integrated Natural Resources and Environmental Management Sector Development Program (Supplementary)
0.29 15 Oct 2009
Agusan River Basin Integrated Water Resources Management Project
1.18 24 Mar 2009
Irrigation System Operation Efficiency Improvement Project
1.00 30 Sep 2008
Integrated Natural Resources and Environmental Management Sector Development Program
0.85 28 Jul 2008
Strategy for Sustainable Aquaculture Development for Poverty Reduction
0.60 2 Dec 2005
Master Plan for Agusan River Basin 0.97 23 Dec 2004
Agrarian Reform Communities II 0.25 14 Sep 2004
Integrated Coastal Resources Management 0.93 2 Aug 2001
Capacity Building Support for Pasig River Environmental Management and Rehabilitation
1.00 20 Jul 2000
Grains Policy and Institutional Reforms 0.63 24 Apr 2000
Implementation of the Convention on Biological Diversity 0.12 21 Jan 2000
Community-Based Forest Resource Management 0.84 25 Oct 1999
Review of Cost Recovery Mechanisms for National Irrigation Systems
0.30 4 Aug 1999
Air Emission Policy Studies 1.50 16 Dec 1998
Southern Philippines Irrigation Sector 0.60 13 Aug 1997
Pasig River Environmental Management and Rehabilitation 0.80 29 May 1997
Agrarian Reform Communities (DAR) 0.25 12 Mar 1997
Institutional Capacity Building for Policy Formulation, Planning, Monitoring and Evaluation for the Agriculture Sector
0.98 24 Dec 1996
Grains Sector Development Program 0.85 18 Dec 1996
Evaluation of Environmental Standards for Selected Industry Subsectors
0.40 30 Jul 1996
Water Resources Management (Angat Reservoir) 0.10 6 Oct 1995
continued on next page

76 Appendix D
Sector Project NameAmount
(P million) Date Approved
Agriculture and Natural Resources
Environmental Evaluation of Swamps and Marshlands 0.10 30 Aug 1995
Biodiversity Conservation and National Integrated Protected Areas
0.60 13 Dec 1994
Fisheries Sector Development 0.55 13 Dec 1994
Western Visayas Agro-Industrial Development 0.82 23 Jun 1994
Integrated Pest Management for Highland Vegetables 0.60 15 Dec 1993
Second Highland Agriculture Development 0.55 26 Jul 1993
Second Irrigation Systems Improvement 0.60 11 May 1993
Study on the Establishment of Small-Scale Community-Based Forest Industries
0.25 19 Nov 1992
Monitoring and Evaluation of Sector Activities 0.49 19 Nov 1992
Improving the Implementation of Environmental Impact Assessment
0.30 27 Dec 1991
Assessment of Credit Needs for the Small Farmer Credit Program of the LBP
0.04 21 Nov 1991
Tree Improvement in Industrial Forest Plantations 0.54 17 Oct 1991
Management, Supervision and Institutional Support to the Industrial Forest Plantations Program
0.68 17 Oct 1991
Study on Foodcrop Policies 0.40 24 Jan 1991
Master Plan for Forestry Development—Extension Phase 1.24 9 Jan 1991
Second Forestry Sector Program 0.10 2 Jan 1991
Livestock Sector Program 0.60 15 Mar 1990
Mindanao Smallholder Development 0.33 30 Jan 1990
Agro-Forestry Research and Development 0.60 14 Dec 1989
Master Plan for Forestry Development (Supplementary) 0.37 5 Dec 1989
Horticulture Development 0.35 20 Nov 1989
Mangrove Development 0.60 20 Nov 1989
Institutional Strengthening in the Fisheries Sector 0.90 26 Sep 1989
Institutional Strengthening of the National Irrigation Administration
0.35 27 Jun 1989
Irrigation Systems Improvement (Detailed Engineering) 0.40 1 Jun 1989
Socio-Economic Study for Mindanao Smallholder Development
0.03 9 Feb 1989
Bicol River Basin Flood Control Irrigation Development 3.75 8 Dec 1988
Manila Metropolitan Region Environmental Improvement Study
0.55 8 Nov 1988
Master Plan for Forestry Development 1.32 28 Jun 1988
Rattan Plantations Development 0.25 28 Jun 1988
Rationalization of Wood-Based Industry 0.35 28 Jun 1988
Strengthening of DENR’s System for Selection, Appraisal and Monitoring of Forestation Projects
0.68 28 Jun 1988
Formulation of a Comprehensive Scheme for the Promotion of Commercial and Industrial Tree Plantations
0.21 28 Jun 1988
Appendix D continued
continued on next page
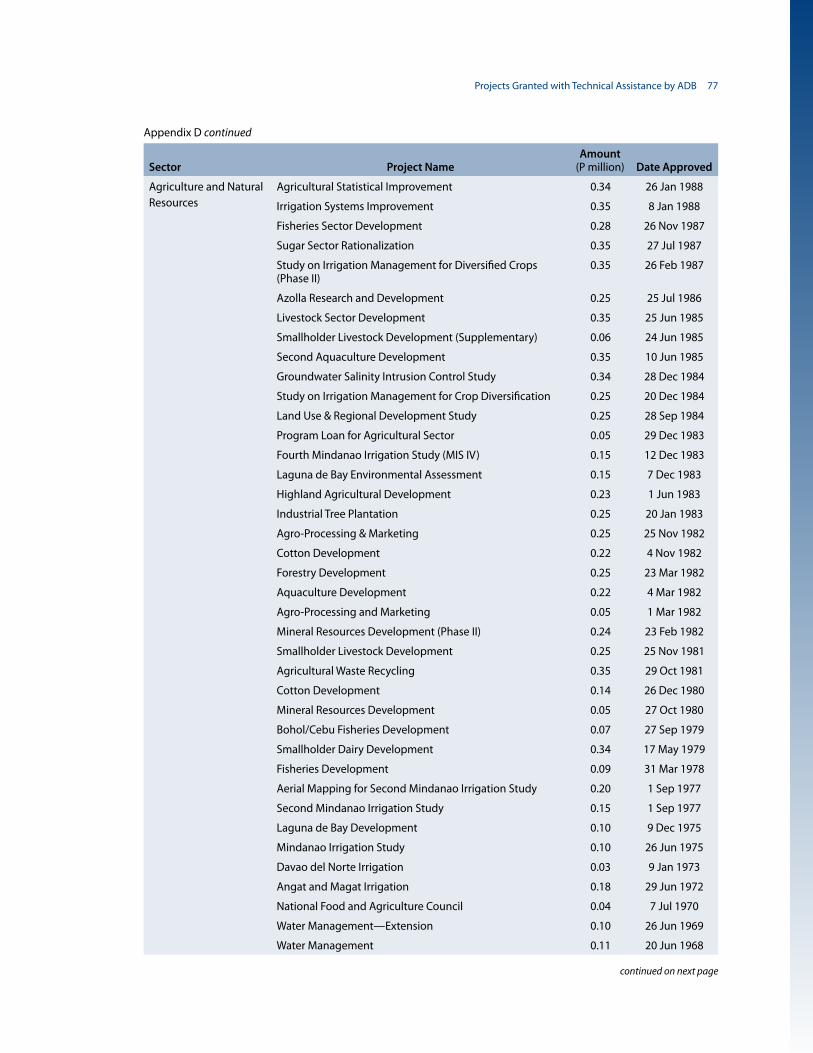
Projects Granted with Technical Assistance by ADB 77
Appendix D continued
Sector Project NameAmount
(P million) Date Approved
Agriculture and Natural Resources
Agricultural Statistical Improvement 0.34 26 Jan 1988
Irrigation Systems Improvement 0.35 8 Jan 1988
Fisheries Sector Development 0.28 26 Nov 1987
Sugar Sector Rationalization 0.35 27 Jul 1987
Study on Irrigation Management for Diversified Crops (Phase II)
0.35 26 Feb 1987
Azolla Research and Development 0.25 25 Jul 1986
Livestock Sector Development 0.35 25 Jun 1985
Smallholder Livestock Development (Supplementary) 0.06 24 Jun 1985
Second Aquaculture Development 0.35 10 Jun 1985
Groundwater Salinity Intrusion Control Study 0.34 28 Dec 1984
Study on Irrigation Management for Crop Diversification 0.25 20 Dec 1984
Land Use & Regional Development Study 0.25 28 Sep 1984
Program Loan for Agricultural Sector 0.05 29 Dec 1983
Fourth Mindanao Irrigation Study (MIS IV) 0.15 12 Dec 1983
Laguna de Bay Environmental Assessment 0.15 7 Dec 1983
Highland Agricultural Development 0.23 1 Jun 1983
Industrial Tree Plantation 0.25 20 Jan 1983
Agro-Processing & Marketing 0.25 25 Nov 1982
Cotton Development 0.22 4 Nov 1982
Forestry Development 0.25 23 Mar 1982
Aquaculture Development 0.22 4 Mar 1982
Agro-Processing and Marketing 0.05 1 Mar 1982
Mineral Resources Development (Phase II) 0.24 23 Feb 1982
Smallholder Livestock Development 0.25 25 Nov 1981
Agricultural Waste Recycling 0.35 29 Oct 1981
Cotton Development 0.14 26 Dec 1980
Mineral Resources Development 0.05 27 Oct 1980
Bohol/Cebu Fisheries Development 0.07 27 Sep 1979
Smallholder Dairy Development 0.34 17 May 1979
Fisheries Development 0.09 31 Mar 1978
Aerial Mapping for Second Mindanao Irrigation Study 0.20 1 Sep 1977
Second Mindanao Irrigation Study 0.15 1 Sep 1977
Laguna de Bay Development 0.10 9 Dec 1975
Mindanao Irrigation Study 0.10 26 Jun 1975
Davao del Norte Irrigation 0.03 9 Jan 1973
Angat and Magat Irrigation 0.18 29 Jun 1972
National Food and Agriculture Council 0.04 7 Jul 1970
Water Management—Extension 0.10 26 Jun 1969
Water Management 0.11 20 Jun 1968
continued on next page
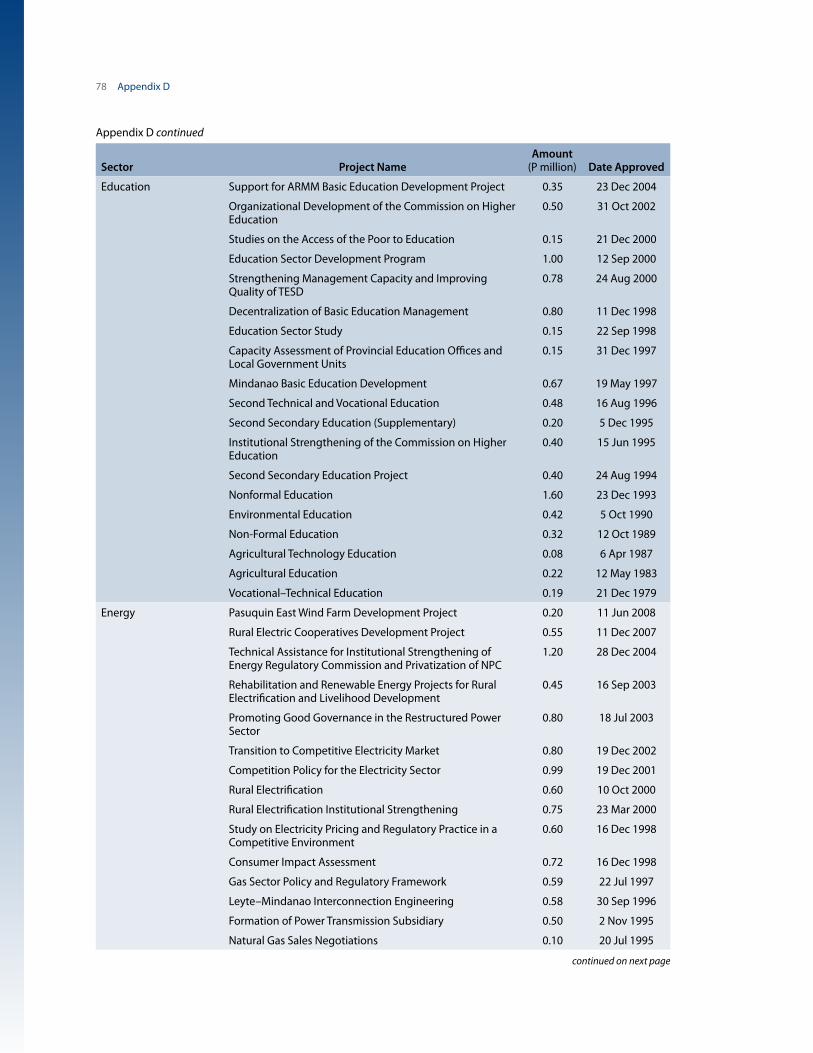
78 Appendix D
Sector Project NameAmount
(P million) Date Approved
Education Support for ARMM Basic Education Development Project 0.35 23 Dec 2004
Organizational Development of the Commission on Higher Education
0.50 31 Oct 2002
Studies on the Access of the Poor to Education 0.15 21 Dec 2000
Education Sector Development Program 1.00 12 Sep 2000
Strengthening Management Capacity and Improving Quality of TESD
0.78 24 Aug 2000
Decentralization of Basic Education Management 0.80 11 Dec 1998
Education Sector Study 0.15 22 Sep 1998
Capacity Assessment of Provincial Education Offices and Local Government Units
0.15 31 Dec 1997
Mindanao Basic Education Development 0.67 19 May 1997
Second Technical and Vocational Education 0.48 16 Aug 1996
Second Secondary Education (Supplementary) 0.20 5 Dec 1995
Institutional Strengthening of the Commission on Higher Education
0.40 15 Jun 1995
Second Secondary Education Project 0.40 24 Aug 1994
Nonformal Education 1.60 23 Dec 1993
Environmental Education 0.42 5 Oct 1990
Non-Formal Education 0.32 12 Oct 1989
Agricultural Technology Education 0.08 6 Apr 1987
Agricultural Education 0.22 12 May 1983
Vocational–Technical Education 0.19 21 Dec 1979
Energy Pasuquin East Wind Farm Development Project 0.20 11 Jun 2008
Rural Electric Cooperatives Development Project 0.55 11 Dec 2007
Technical Assistance for Institutional Strengthening of Energy Regulatory Commission and Privatization of NPC
1.20 28 Dec 2004
Rehabilitation and Renewable Energy Projects for Rural Electrification and Livelihood Development
0.45 16 Sep 2003
Promoting Good Governance in the Restructured Power Sector
0.80 18 Jul 2003
Transition to Competitive Electricity Market 0.80 19 Dec 2002
Competition Policy for the Electricity Sector 0.99 19 Dec 2001
Rural Electrification 0.60 10 Oct 2000
Rural Electrification Institutional Strengthening 0.75 23 Mar 2000
Study on Electricity Pricing and Regulatory Practice in a Competitive Environment
0.60 16 Dec 1998
Consumer Impact Assessment 0.72 16 Dec 1998
Gas Sector Policy and Regulatory Framework 0.59 22 Jul 1997
Leyte–Mindanao Interconnection Engineering 0.58 30 Sep 1996
Formation of Power Transmission Subsidiary 0.50 2 Nov 1995
Natural Gas Sales Negotiations 0.10 20 Jul 1995
continued on next page
Appendix D continued

Projects Granted with Technical Assistance by ADB 79
Sector Project NameAmount
(P million) Date Approved
Energy Long-Term Power System Planning Study 0.60 20 Oct 1993
Environmental Management of Coal-Based Power Generation
0.64 30 Oct 1990
Review of National Power Corporation’s Asset Revaluation 0.10 11 Sep 1990
Power Sector Training 0.09 21 Jun 1989
Power Sector Cost Structure and Transfer Pricing Study 0.23 27 Oct 1988
Development Study of the Visayas Power System 0.36 22 Jul 1988
Luzon Power System Development 0.26 18 Dec 1986
Geothermal Steam Pricing Study (Supplementary) 0.06 15 Oct 1986
Mindanao Power System Development 0.35 17 Jun 1986
Geothermal Steam Pricing Study 0.21 24 Dec 1985
Institutional Strategy Study (ISS) 0.20 20 Dec 1984
Refinery Sector Rationalization Study (RSRS) 0.45 20 Dec 1984
Electricity Tariff Study 0.23 5 Jul 1984
BRC Subprojects (Energy Sector Loan) 0.07 23 Mar 1984
Cagayan River (Mindanao) Hydropower Study 0.15 7 Dec 1982
Industrial Energy Audits and Conservation Program 0.56 25 Feb 1982
Rural Electrification (Dendro-Thermal Study) 0.15 17 Nov 1981
Rural Electrification (Financial Study) 0.12 17 Nov 1981
Finance Capacity Building for Housing Microfinance (Supplementary)
0.50 27 Jun 2008
Strengthening Regulation and Governance 0.80 6 Dec 2006
Government Owned and Controlled Corporations Reform (GOCC)
0.75 29 Jun 2006
Support the Implementation of the Microfinance Development Program
0.50 22 Nov 2005
Enhancing Access of the Poor to Microfinance Services in Frontier Areas
0.25 23 Dec 2004
Strengthening Governance of Securities Trading Markets 0.25 18 Mar 2004
Capacity Building for Housing Microfinance 1.50 18 Dec 2003
Support for the Nonbank Financial Sector 0.50 2 Sep 2003
Strengthening the Anti-Money Laundering Regime 1.00 19 Mar 2002
Microfinance for Rural Development 0.56 19 Dec 2001
Strengthening Regulatory and Market Governance 1.00 15 Nov 2001
Nonbank Financial Sector Development 2.00 25 Aug 1999
Institutional Strengthening of the Philippine Insurance Commission
0.60 15 Dec 1998
Institutional Capacity Building of the Philippine Deposit Insurance Corporation
0.74 31 Dec 1997
Strengthening Rural Microenterprise Finance 0.60 23 Apr 1996
Capital Market Development 0.60 22 Aug 1995
Institutional Strengthening of Cooperatives 1.40 22 Dec 1992
continued on next page
Appendix D continued

80 Appendix D
Sector Project NameAmount
(P million) Date Approved
Finance Institutional Strengthening of the Securities and Exchange Commission
0.59 2 Jan 1992
Stockmarket Development 0.59 2 Jan 1992
Rural Credit 0.64 28 Nov 1991
Development of a Corporate Bond Market 0.10 18 Nov 1991
Institutional Strengthening of Financial Intermediaries 0.12 16 Jul 1991
Second NGO Microcredit 0.10 24 Aug 1990
Institutional Strengthening of the Land Bank of the Philippines
0.50 7 Apr 1989
Microenterprise Sector 0.60 3 Jan 1989
Institutional Strengthening of NGOs 0.49 22 Dec 1988
Private Development Corporation of the Philippines Rehabilitation Program
0.08 9 Mar 1988
Study of the Thrift Banks in the Philippines 0.08 9 Mar 1988
Study of the Venture Capital Industry 0.08 25 Feb 1988
Feasibility Study for Establishing a Mutual Fund 0.08 29 May 1987
Development Bank of the Philippines (DBP) 0.08 21 Aug 1986
Health and Social Protection
Support for Conditional Cash Transfers 0.20 21 Dec 2009
Public–Private Partnership in Health (piggy-backed TA to the Credit for Better Health Care Project)
1.00 25 Mar 2009
Support for Health Sector Reform 1.00 15 Sep 2005
Health Sector Development 0.60 19 Dec 2002
Health Sector Strategy Study – 10 Nov 1998
Capacity Building for Resettlement Management in Development Projects
0.10 12 Dec 1995
Strengthening Hospital Standards, Licensing and Regulation
0.45 17 Oct 1995
Sustaining Health of the Working Age Population 0.58 30 Jun 1995
Early Childhood Development 0.60 25 Apr 1995
Cebu Longitudinal Health and Nutrition Study 0.10 29 Dec 1993
Implementation of the Local Government Code in the Health Sector
0.30 16 Aug 1993
Women’s Health and Safe Motherhood 0.10 16 Aug 1993
Integrated Community Health Services 0.54 19 May 1993
Devolution of Health Services to Local Government Units 0.10 30 Oct 1992
National Hospital Services Development Plan 0.47 6 Feb 1989
Industry and Trade Strengthening Small and Medium Enterprise Credit Management Systems
0.50 23 Dec 2004
Institutional Strengthening for the Development of the Natural Gas Industry
0.80 16 Oct 2003
Program to Accelerate Small and Medium Enterprise Financing
0.40 19 Dec 2002
Promotion of Cleaner Production 0.78 6 Sep 2002
continued on next page
Appendix D continued
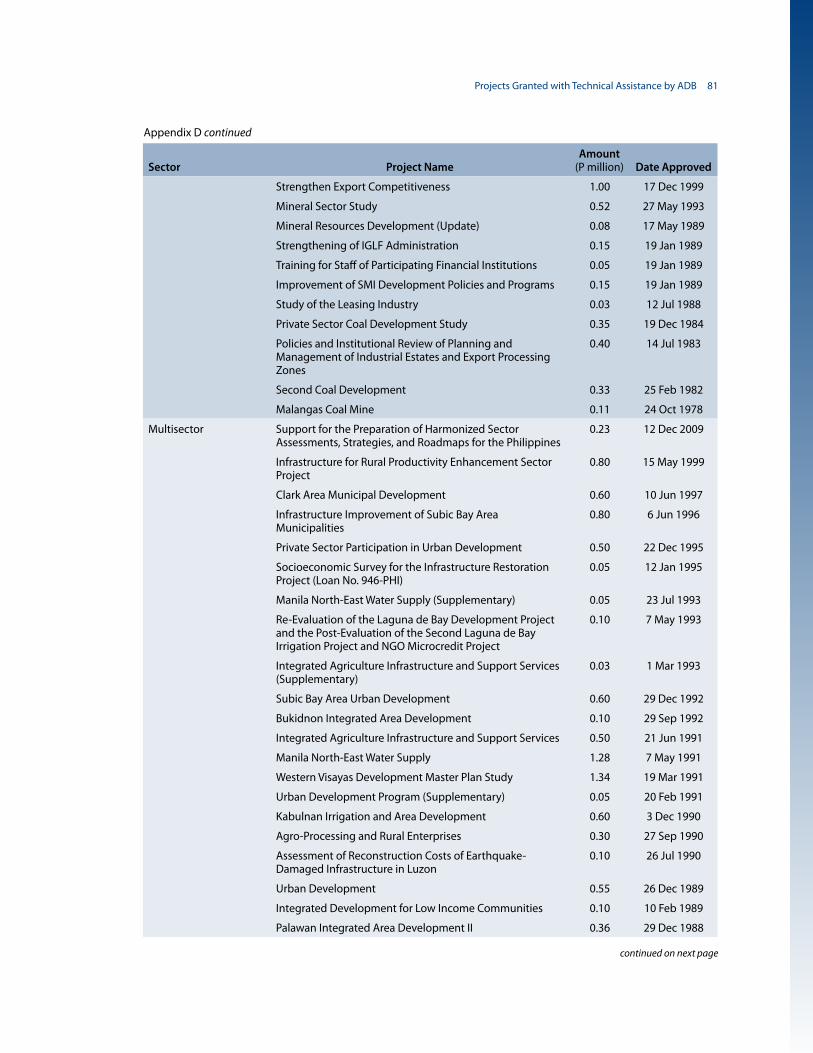
Projects Granted with Technical Assistance by ADB 81
Sector Project NameAmount
(P million) Date Approved
Strengthen Export Competitiveness 1.00 17 Dec 1999
Mineral Sector Study 0.52 27 May 1993
Mineral Resources Development (Update) 0.08 17 May 1989
Strengthening of IGLF Administration 0.15 19 Jan 1989
Training for Staff of Participating Financial Institutions 0.05 19 Jan 1989
Improvement of SMI Development Policies and Programs 0.15 19 Jan 1989
Study of the Leasing Industry 0.03 12 Jul 1988
Private Sector Coal Development Study 0.35 19 Dec 1984
Policies and Institutional Review of Planning and Management of Industrial Estates and Export Processing Zones
0.40 14 Jul 1983
Second Coal Development 0.33 25 Feb 1982
Malangas Coal Mine 0.11 24 Oct 1978
Multisector Support for the Preparation of Harmonized Sector Assessments, Strategies, and Roadmaps for the Philippines
0.23 12 Dec 2009
Infrastructure for Rural Productivity Enhancement Sector Project
0.80 15 May 1999
Clark Area Municipal Development 0.60 10 Jun 1997
Infrastructure Improvement of Subic Bay Area Municipalities
0.80 6 Jun 1996
Private Sector Participation in Urban Development 0.50 22 Dec 1995
Socioeconomic Survey for the Infrastructure Restoration Project (Loan No. 946-PHI)
0.05 12 Jan 1995
Manila North-East Water Supply (Supplementary) 0.05 23 Jul 1993
Re-Evaluation of the Laguna de Bay Development Project and the Post-Evaluation of the Second Laguna de Bay Irrigation Project and NGO Microcredit Project
0.10 7 May 1993
Integrated Agriculture Infrastructure and Support Services (Supplementary)
0.03 1 Mar 1993
Subic Bay Area Urban Development 0.60 29 Dec 1992
Bukidnon Integrated Area Development 0.10 29 Sep 1992
Integrated Agriculture Infrastructure and Support Services 0.50 21 Jun 1991
Manila North-East Water Supply 1.28 7 May 1991
Western Visayas Development Master Plan Study 1.34 19 Mar 1991
Urban Development Program (Supplementary) 0.05 20 Feb 1991
Kabulnan Irrigation and Area Development 0.60 3 Dec 1990
Agro-Processing and Rural Enterprises 0.30 27 Sep 1990
Assessment of Reconstruction Costs of Earthquake-Damaged Infrastructure in Luzon
0.10 26 Jul 1990
Urban Development 0.55 26 Dec 1989
Integrated Development for Low Income Communities 0.10 10 Feb 1989
Palawan Integrated Area Development II 0.36 29 Dec 1988
continued on next page
Appendix D continued
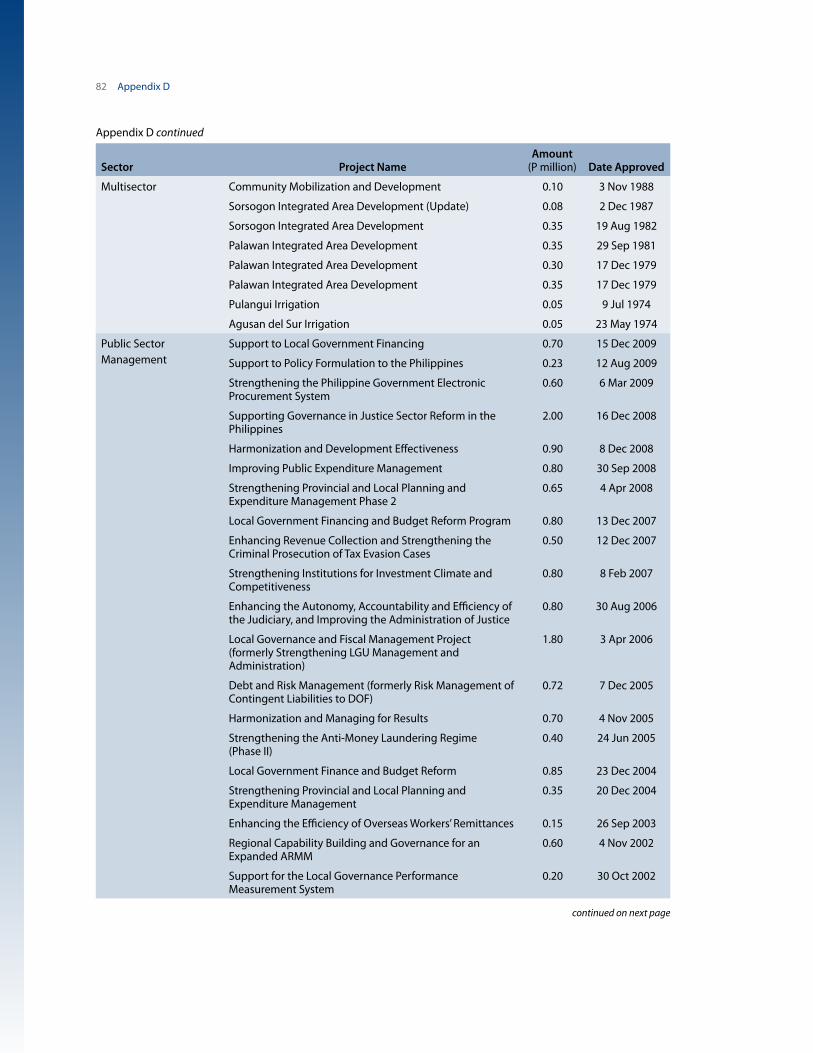
82 Appendix D
Sector Project NameAmount
(P million) Date Approved
Multisector Community Mobilization and Development 0.10 3 Nov 1988
Sorsogon Integrated Area Development (Update) 0.08 2 Dec 1987
Sorsogon Integrated Area Development 0.35 19 Aug 1982
Palawan Integrated Area Development 0.35 29 Sep 1981
Palawan Integrated Area Development 0.30 17 Dec 1979
Palawan Integrated Area Development 0.35 17 Dec 1979
Pulangui Irrigation 0.05 9 Jul 1974
Agusan del Sur Irrigation 0.05 23 May 1974
Public Sector Management
Support to Local Government Financing 0.70 15 Dec 2009
Support to Policy Formulation to the Philippines 0.23 12 Aug 2009
Strengthening the Philippine Government Electronic Procurement System
0.60 6 Mar 2009
Supporting Governance in Justice Sector Reform in the Philippines
2.00 16 Dec 2008
Harmonization and Development Effectiveness 0.90 8 Dec 2008
Improving Public Expenditure Management 0.80 30 Sep 2008
Strengthening Provincial and Local Planning and Expenditure Management Phase 2
0.65 4 Apr 2008
Local Government Financing and Budget Reform Program 0.80 13 Dec 2007
Enhancing Revenue Collection and Strengthening the Criminal Prosecution of Tax Evasion Cases
0.50 12 Dec 2007
Strengthening Institutions for Investment Climate and Competitiveness
0.80 8 Feb 2007
Enhancing the Autonomy, Accountability and Efficiency of the Judiciary, and Improving the Administration of Justice
0.80 30 Aug 2006
Local Governance and Fiscal Management Project (formerly Strengthening LGU Management and Administration)
1.80 3 Apr 2006
Debt and Risk Management (formerly Risk Management of Contingent Liabilities to DOF)
0.72 7 Dec 2005
Harmonization and Managing for Results 0.70 4 Nov 2005
Strengthening the Anti-Money Laundering Regime (Phase II)
0.40 24 Jun 2005
Local Government Finance and Budget Reform 0.85 23 Dec 2004
Strengthening Provincial and Local Planning and Expenditure Management
0.35 20 Dec 2004
Enhancing the Efficiency of Overseas Workers’ Remittances 0.15 26 Sep 2003
Regional Capability Building and Governance for an Expanded ARMM
0.60 4 Nov 2002
Support for the Local Governance Performance Measurement System
0.20 30 Oct 2002
continued on next page
Appendix D continued

Projects Granted with Technical Assistance by ADB 83
Sector Project NameAmount
(P million) Date Approved
Public Sector Management
Capacity Building of the Mindanao Economic Development Council to Enhance Private Sector Activity in the Philippine EAGA
0.20 16 Oct 2002
Improving the Climate for Investment and Productivity in the Philippines: An Approach to Long-Term Poverty Reduction
0.12 25 Sep 2002
Metro Manila Urban Services for the Poor 1.00 5 Nov 2001
TA to Strengthen the Independence of the Judiciary 1.20 2 Aug 2001
Improving Poverty Monitoring Surveys 0.35 24 May 2001
Institutional Strengthening of Housing and Urban Development Sector
0.15 2 Aug 2000
Establishment of an Official Development Assistance Unit in the Flagship Committee
0.10 23 Mar 2000
Joint ADB, UNDP, and World Bank Poverty Consultations 0.12 8 Mar 2000
Capacity Building in Local Government Unit Financing 0.60 20 Dec 1999
Capacity Building for Procurement 0.40 25 Nov 1999
Strengthening Results Monitoring and Evaluation 0.40 24 Nov 1999
National Urban Policy Framework 0.15 20 May 1999
Capacity Building in the International Finance Group of the DOF
0.15 31 Dec 1998
Strengthening Public Finance and Planning of Local Government Units
0.87 23 Dec 1998
Capacity Building in the Special Zone for Peace and Development
0.15 25 Sep 1998
Assistance to the Development Bank of the Philippines 0.15 12 Dec 1997
Institutional Strengthening of the System of National Accounts
0.45 25 Sep 1997
Institutional Strengthening of the Department of Social Welfare and Development
0.58 15 Aug 1997
Pilot Implementation of the Project Performance Management System
0.25 16 Apr 1997
LGU/Private Sector Infrastructure Facility (LGUIF) and LGU Guarantee Corp. (LGUGC)
0.08 13 Sep 1996
Capacity Building of the Philippine Coordination Council for BIMP-EAGA
0.40 30 Jul 1996
ZOPP Applications for Strengthening Community and Local Government Participation
0.60 21 Apr 1994
Development of a Gender-Disaggregated Data Base System
0.22 24 Dec 1992
Seasonal Adjustment of Time Series Data 0.10 4 Jun 1992
Strengthening Post Evaluation Capacity of the NEDA 0.10 7 Jan 1992
Institutional Strengthening of the Bureau of Internal Revenue
0.60 20 Mar 1991
continued on next page
Appendix D continued
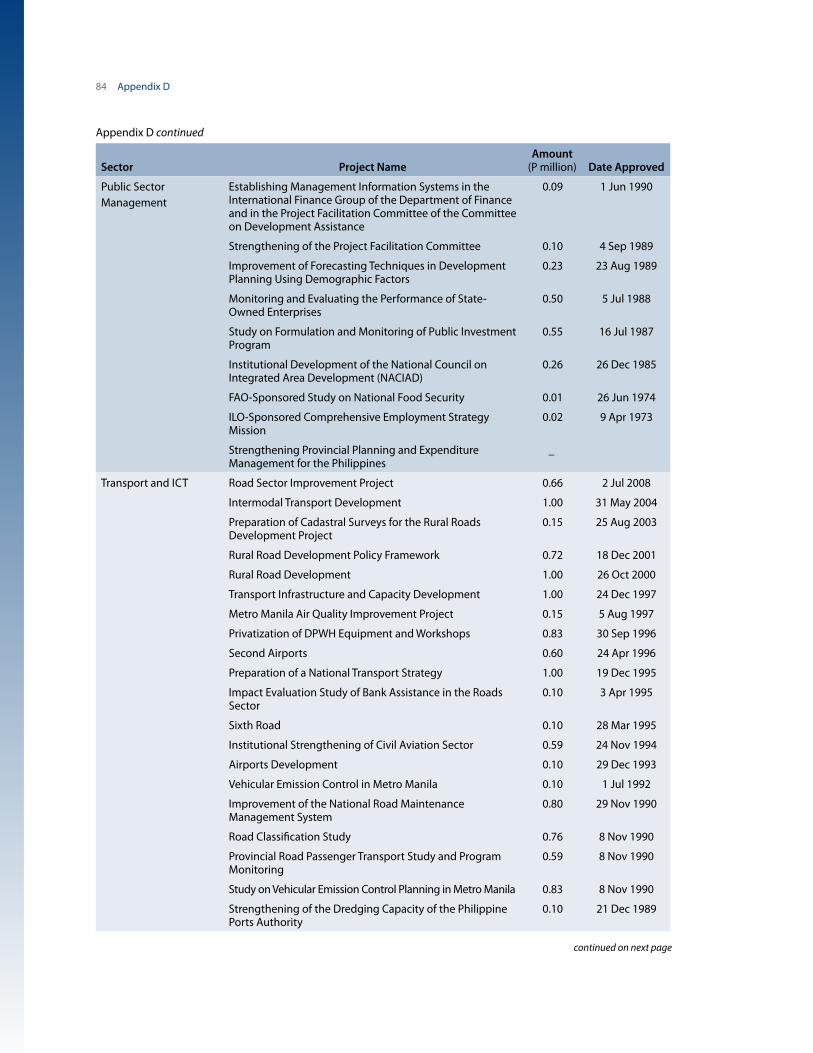
84 Appendix D
Sector Project NameAmount
(P million) Date Approved
Public Sector Management
Establishing Management Information Systems in the International Finance Group of the Department of Finance and in the Project Facilitation Committee of the Committee on Development Assistance
0.09 1 Jun 1990
Strengthening of the Project Facilitation Committee 0.10 4 Sep 1989
Improvement of Forecasting Techniques in Development Planning Using Demographic Factors
0.23 23 Aug 1989
Monitoring and Evaluating the Performance of State-Owned Enterprises
0.50 5 Jul 1988
Study on Formulation and Monitoring of Public Investment Program
0.55 16 Jul 1987
Institutional Development of the National Council on Integrated Area Development (NACIAD)
0.26 26 Dec 1985
FAO-Sponsored Study on National Food Security 0.01 26 Jun 1974
ILO-Sponsored Comprehensive Employment Strategy Mission
0.02 9 Apr 1973
Strengthening Provincial Planning and Expenditure Management for the Philippines
_
Transport and ICT Road Sector Improvement Project 0.66 2 Jul 2008
Intermodal Transport Development 1.00 31 May 2004
Preparation of Cadastral Surveys for the Rural Roads Development Project
0.15 25 Aug 2003
Rural Road Development Policy Framework 0.72 18 Dec 2001
Rural Road Development 1.00 26 Oct 2000
Transport Infrastructure and Capacity Development 1.00 24 Dec 1997
Metro Manila Air Quality Improvement Project 0.15 5 Aug 1997
Privatization of DPWH Equipment and Workshops 0.83 30 Sep 1996
Second Airports 0.60 24 Apr 1996
Preparation of a National Transport Strategy 1.00 19 Dec 1995
Impact Evaluation Study of Bank Assistance in the Roads Sector
0.10 3 Apr 1995
Sixth Road 0.10 28 Mar 1995
Institutional Strengthening of Civil Aviation Sector 0.59 24 Nov 1994
Airports Development 0.10 29 Dec 1993
Vehicular Emission Control in Metro Manila 0.10 1 Jul 1992
Improvement of the National Road Maintenance Management System
0.80 29 Nov 1990
Road Classification Study 0.76 8 Nov 1990
Provincial Road Passenger Transport Study and Program Monitoring
0.59 8 Nov 1990
Study on Vehicular Emission Control Planning in Metro Manila 0.83 8 Nov 1990
Strengthening of the Dredging Capacity of the Philippine Ports Authority
0.10 21 Dec 1989
continued on next page
Appendix D continued

Projects Granted with Technical Assistance by ADB 85
Sector Project NameAmount
(P million) Date Approved
Transport and ICT Feeder Ports 0.50 2 Aug 1988
Advisory Services for the Telecommunications Sector 0.88 18 Jul 1988
Privatization Strategy Study for Philippine Airlines 0.35 4 Apr 1988
Second Manila Port 0.08 12 Jan 1987
National Road Improvement 0.50 25 Nov 1986
Pilot Program for Contract Maintenance of National Roads 0.40 25 Nov 1986
National Road Improvement 0.55 25 Nov 1986
Rural Roads 0.15 11 Nov 1982
Road Improvement 0.81 29 Jul 1981
Manila Grain Terminal 0.15 13 Aug 1980
Manila Domestic Container Terminal 0.15 27 Sep 1979
Road Improvement Study 0.15 1 Sep 1977
Mindanao Secondary and Feeder Roads 0.10 14 Aug 1975
Luzon Roads Feasibility Study 0.31 1 Jul 1975
Philippine National Railways 0.05 9 Jun 1974
Tarlac–Santa Rosa Highway 0.03 1 Sep 1972
Cotabato Port Development 0.25 19 Oct 1971
Fisheries Port 0.07 4 Mar 1971
Feasibility Study of Iligan–Cagayan de Oro–Butuan Road 0.22 9 Feb 1971
Fisheries Port 0.33 25 Jul 1968
Water and Other Municipal Infrastructure and Services
Pasig River Catchment Sewerage Project 0.30 26 Oct 2009
Water District Development Sector Project 1.20 10 Sep 2008
Philippines Basic Urban Services Sector Project 0.65 19 Feb 2008
Metro Manila Services for the Urban Poor (Supplementary) 0.50 7 Jul 2006
Metro Manila Services for the Urban Poor 0.70 19 Jul 2005
Development of Poor Urban Communities (Supplementary)
0.15 2 Apr 2002
Metro Manila Solid Waste Management 1.25 18 Mar 2002
Capacity Building for the Regulatory Office of the Metropolitan Waterworks and Sewerage System
0.80 8 Aug 2001
Development of Poor Urban Communities 0.85 10 Nov 1999
Mindanao Urban Planning and Basic Services 1.00 27 May 1998
Water Supply and Sanitation Sector Plan Study 0.60 24 Nov 1997
MWSS Privatization Support 0.58 21 Sep 1995
MWSS Water Supply Improvement Study 0.58 27 Dec 1994
Small Towns Water Supply and Sanitation Sector 0.10 27 Dec 1994
MWSS Operational Strengthening Study 0.60 24 Dec 1994
Socioeconomic Survey and Evaluation of the Island Provinces Rural Water Supply Sector
0.10 12 May 1994
Appendix D continued
continued on next page
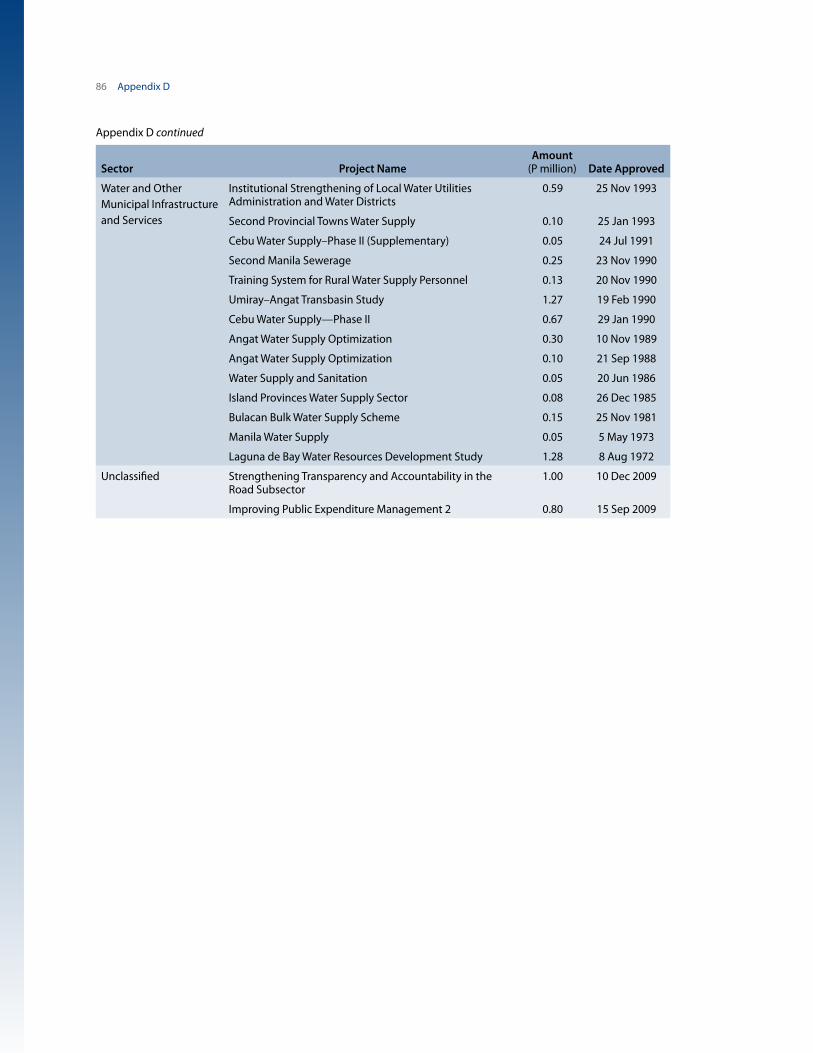
86 Appendix D
Sector Project NameAmount
(P million) Date Approved
Water and Other Municipal Infrastructure and Services
Institutional Strengthening of Local Water Utilities Administration and Water Districts
0.59 25 Nov 1993
Second Provincial Towns Water Supply 0.10 25 Jan 1993
Cebu Water Supply–Phase II (Supplementary) 0.05 24 Jul 1991
Second Manila Sewerage 0.25 23 Nov 1990
Training System for Rural Water Supply Personnel 0.13 20 Nov 1990
Umiray–Angat Transbasin Study 1.27 19 Feb 1990
Cebu Water Supply—Phase II 0.67 29 Jan 1990
Angat Water Supply Optimization 0.30 10 Nov 1989
Angat Water Supply Optimization 0.10 21 Sep 1988
Water Supply and Sanitation 0.05 20 Jun 1986
Island Provinces Water Supply Sector 0.08 26 Dec 1985
Bulacan Bulk Water Supply Scheme 0.15 25 Nov 1981
Manila Water Supply 0.05 5 May 1973
Laguna de Bay Water Resources Development Study 1.28 8 Aug 1972
Unclassified Strengthening Transparency and Accountability in the Road Subsector
1.00 10 Dec 2009
Improving Public Expenditure Management 2 0.80 15 Sep 2009
Appendix D continued
Private Sector Assessment: Philippines
Despite the leading role of the private sector in the Philippine economy, its potential remains significantly underutilized. This translates into fewer jobs for the fast-growing population than there can be. Fast-growing and so far successfully evolving industries such as the business process outsourcing industry are unlikely to absorb surplus labor and drive productivity-based economic growth. Private sector development is not benefiting from the abundance of capital in the economy: significant savings are either “locked” in the banking system or are exported. Within the private sector there is insufficient synergy between the small and medium-sized enterprises (SMEs), as suppliers of inputs, and the large firms, as clients for the inputs of SMEs. Drawing on nationwide consultations with the private sector, this publication identifies inefficient state processes and inadequate business environment as the major reasons for such insufficient synergy. It proposes measures to address the inefficiency of state processes. It also provides suggestions on how ADB could support private sector development through its public and private sector operations.
About the Asian Development Bank
ADB’s vision is an Asia and Pacific region free of poverty. Its mission is to help its developing member countries reduce poverty and improve the quality of life of their people. Despite the region’s many successes, it remains home to two-thirds of the world’s poor: 1.8 billion people who live on less than $2 a day, with 903 million struggling on less than $1.25 a day. ADB is committed to reducing poverty through inclusive economic growth, environmentally sustainable growth, and regional integration.
Based in Manila, ADB is owned by 67 members, including 48 from the region. Its main instruments for helping its developing member countries are policy dialogue, loans, equity investments, guarantees, grants, and technical assistance.
Printed on recycled paper
Private Sector AssessmentPhilippinesCayetano W. Paderanga, Jr.
Printed in the Philippines
Asian Development Bank6 ADB Avenue, Mandaluyong City1550 Metro Manila, Philippineswww.adb.orgISBN 978-92-9092-354-1Publication Stock No. RPT113102