Embed Size (px)
Citation preview

Private Healthcare Australia Conference
How is healthcare performing? - an industry economists perspective
Dean Pearson Head of Industry Analysis, NABNovember 29, 2013 Hobart, Australia

2
“Confidence is contagious, but so is a lack of confidence”Vince Lombardi, legendary NFL player & coach

The Numbers
Cartoon by Nicholson from “The Australian” newspaper: www.nicholsoncartoons.com.au

44
Global economic forecastsHalf of current global growth still coming from China, India & Brazil but a bigger contribution in 2014 from advanced economies.
4.14.24.04.2Trading partners
4.4
3.5
7.5
1.9
-0.3
1.7
2.9
20132012 2014 2015
World GDP growth 3.2 3.5 3.6
United States 2.8 2.6 2.9
Euro zone -0.6 1.1 1.4
Japan 2.0 2.1 1.5
China 7.8 7.2 7.0
Emerging Asia (a)
3.8 3.8 4.2
India 5.1 4.9 5.3
(a) South Korea, Taiwan, ASEAN
55
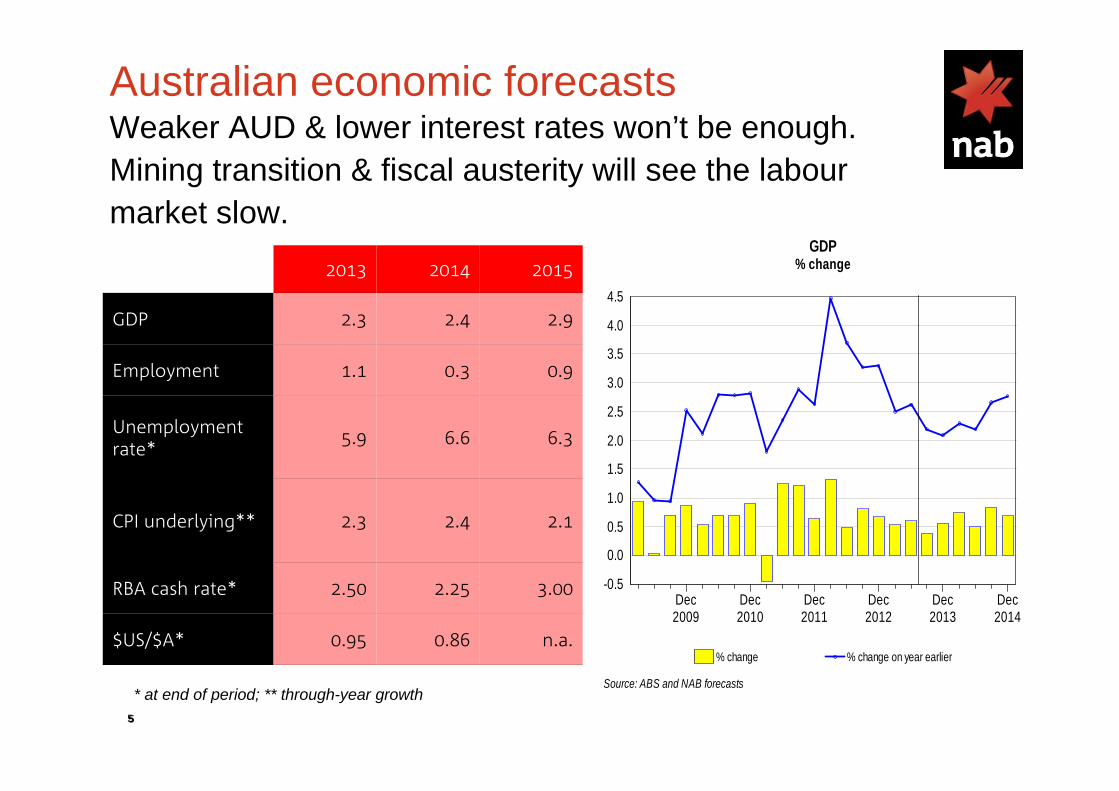
Australian economic forecastsWeaker AUD & lower interest rates won’t be enough.Mining transition & fiscal austerity will see the labour market slow.
* at end of period; ** through-year growth
n.a.0.860.95$US/$A*
3.002.252.50RBA cash rate*
2.12.42.3CPI underlying**
6.36.65.9Unemployment rate*
0.90.31.1Employment
2.92.42.3GDP
201520142013
Dec2009
Dec2010
Dec2011
Dec2012
Dec2013 2014
Dec
4.5
4.0
3.5
3.0
2.5
2.0
1.5
1.0
0.5
0.0
-0.5
GDP% change
Source: ABS and NAB forecasts
% change % change on year earlier

The Business Environment
Cartoon by Nicholson from “The Australian” newspaper: www.nicholsoncartoons.com.au

77
Australian business conditions & confidenceAfter surging to a 3½ year high in September, the business confidence fell back significantly in October suggesting businesses have reassessed their expectations given the continued weakness in actual conditions.
Source: NAB Monthly Business Survey
-40
-30
-20
-10
0
10
20
IV I II III IV I II III IV I II III IV
2010 2011 2012 2013
Seasonally adjusted TrendConds 1990s recn Conds GFC
Business conditions (net balance)
-40
-30
-20
-10
0
10
20
IV I II III IV I II III IV I II III IV
2010 2011 2012 2013
Seasonally adjusted TrendConf 1990s recn Conf GFC
Business confidence (net balance)
Average of the indexes of trading conditions, profitability and employment.
Excl. normal seasonal changes, how do you expect conditions facing your industry in the next mth to change?

8
Capacity utilisation & capital expenditureCapacity utilisation by industry shows little incentive for new investment. There is still little evidence that business investment outside the mining sector is likely to pick up strongly any time soon.
Capacity Utilisation
70
75
80
85
90
95
2008 2009 2010 2011 2012 2013
%
70
75
80
85
90
95
%
Mining
Manufacturing
Source: NAB
All industriesTransport& utilities
-4
-2
0
2
4
6
8
10
12
IV I II III IV I II III IV
2011 2012 2013
Seasonally adjusted Trend
Capital expenditure (net balance)

99
Business conditions by state State conditions have converged as weakness infiltrates previously strong performers. More recently, conditions have lifted significantly in WA.
Business conditions by state (net balance), 3-month moving average
-40
-30
-20
-10
0
10
20
IV I II III IV I II III IV
2011 2012 2013
Australia NSW VIC
-40
-30
-20
-10
0
10
20
IV I II III IV I II III IV
2011 2012 2013
Australia QLD WA
-40
-30
-20
-10
0
10
20
IV I II III IV I II III IV
2011 2012 2013
Australia SA TAS

10
Regional UnemploymentBig disparities in unemployment within and across Australian regions. Some suburbs & towns clearly missed out on the “boom”.
Unemployment Rate by Statistical Division(avg year to October 2013)
0123456789
1011
NS
WS
YD
NE
YIn
ner &
Inne
r Wes
tern
Syd
ney
Inne
r Syd
ney
Inne
r Wes
tern
Syd
ney
Eas
tern
Sub
urbs
St G
eorg
e-S
uthe
rland
Can
terb
ury-
Ban
ksto
wn
Fairf
ield
-Liv
erpo
ol &
Out
er S
outh
Wes
tern
Syd
ney
Fairf
ield
-Liv
erpo
olO
uter
Sou
th W
este
rn S
ydne
yC
entra
l Wes
tern
Syd
ney
Nor
th W
este
rn S
ydne
yLo
wer
Nor
ther
n S
ydne
yC
entra
l Nor
ther
n S
ydne
yN
orth
ern
Bea
ches
Gos
ford
-Wyo
ngB
ALA
NC
E O
F N
SW
Hun
ter
New
cast
leH
unte
r exc
ludi
ng N
ewca
stle
Illaw
arra
& S
outh
Eas
tern
Illaw
arra
Wol
long
ong
Illaw
arra
exc
ludi
ng W
ollo
ngon
gS
outh
Eas
tern
Ric
hmon
d-Tw
eed
& M
id-N
orth
Coa
stN
orth
ern,
Far
Wes
t-Nor
th W
este
rn &
Cen
tral
Nor
ther
n, N
orth
Wes
tern
& C
entra
l Wes
tFa
r Wes
tM
urra
y-M
urru
mbi
dgee
VIC
TOR
IAM
ELB
OU
RN
EN
orth
Wes
tern
Mel
bour
neO
uter
Wes
tern
Mel
bour
neIn
ner M
elbo
urne
Nor
th E
aste
rn M
elbo
urne
Inne
r Eas
tern
Mel
bour
neS
outh
ern
Mel
bour
neO
uter
Eas
tern
Mel
bour
neS
outh
Eas
tern
Mel
bour
neM
orni
ngto
n P
enin
sula
BA
LAN
CE
OF
VIC
Bar
won
-Wes
tern
Dis
trict
Cen
tral H
ighl
ands
-Wim
mer
aLo
ddon
-Mal
lee
Gou
lbur
n-O
vens
-Mur
ray
All
Gip
psla
ndQ
UE
EN
SLA
ND
BR
ISB
AN
EB
risba
ne C
ity In
ner R
ing
Bris
bane
City
Out
er R
ing
Sou
th &
Eas
t BS
DN
orth
BS
D B
alan
ceIp
swic
h C
ityB
ALA
NC
E O
F Q
LDG
old
Coa
stG
old
Coa
st N
orth
Gol
d C
oast
Sou
thS
unsh
ine
Coa
stW
est M
oret
onW
ide
Bay
-Bur
nett
Mac
kay-
Fitz
roy-
Cen
tral W
est
Dar
ling
Dow
ns-S
outh
Wes
tN
orth
ern-
Nor
th W
est
Far N
orth
SO
UTH
AU
STR
ALI
AA
DE
LAID
EN
orth
ern
Ade
laid
eW
este
rn A
dela
ide
Eas
tern
Ade
laid
eS
outh
ern
Ade
laid
eB
ALA
NC
E O
F S
AS
outh
ern
& E
aste
rn S
AN
orth
ern
& W
este
rn S
AW
ES
TER
N A
US
TRA
LIA
PE
RTH
Cen
tral M
etro
polit
anE
ast M
etro
polit
anN
orth
Met
ropo
litan
Sou
th W
est M
etro
polit
anS
outh
Eas
t Met
ropo
litan
BA
LAN
CE
OF
WA
Low
er W
este
rn W
AR
emai
nder
-Bal
ance
WA
TAS
MA
NIA
HO
BA
RT
BA
LAN
CE
OF
TAS
Sou
ther
nN
orth
ern
Mer
sey-
Lyel
lN
OR
THE
RN
TE
RR
ITO
RY
AC
TA
US
TRA
LIA
NSW VIC QLD SA WA
%
TAS

11
Labour market challengeAdjustment process to go into reverse! Mining could release 100k construction jobs in 3 years. But jobs are being made as well as lost. Health has been a key driver of jobs growth!

12
Population growthAustralia's population grew by 1.8% in 2012, well above its long-term average. WA population growing at more than double the national average.
12
Annual Population Growth: Australia
0
50,000
100,000
150,000
200,000
250,000
300,000
350,000
400,000
450,000
500,000
Mar
-83
Mar
-84
Mar
-85
Mar
-86
Mar
-87
Mar
-88
Mar
-89
Mar
-90
Mar
-91
Mar
-92
Mar
-93
Mar
-94
Mar
-95
Mar
-96
Mar
-97
Mar
-98
Mar
-99
Mar
-00
Mar
-01
Mar
-02
Mar
-03
Mar
-04
Mar
-05
Mar
-06
Mar
-07
Mar
-08
Mar
-09
Mar
-10
Mar
-11
Mar
-12
Mar
-13
Natural Increase Net Migration
persons

13
Net Interstate MigrationAt the State level, net interstate migration is also important (ie. movements within states). And here there are some big differences.
Caroline Springs, on Melbourne's western fringe
Annual Net Interstate Migration
-60,000
-40,000
-20,000
0
20,000
40,000
60,000
Mar
-82
Mar
-83
Mar
-84
Mar
-85
Mar
-86
Mar
-87
Mar
-88
Mar
-89
Mar
-90
Mar
-91
Mar
-92
Mar
-93
Mar
-94
Mar
-95
Mar
-96
Mar
-97
Mar
-98
Mar
-99
Mar
-00
Mar
-01
Mar
-02
Mar
-03
Mar
-04
Mar
-05
Mar
-06
Mar
-07
Mar
-08
Mar
-09
Mar
-10
Mar
-11
Mar
-12
Mar
-13
NSW VIC QLD SA WA NT
persons

14
Lower rates have seen expectations (& actual) house prices increase, esp. in NSWBut we still expect relatively moderate gains (by historical norms) in the next 12 months (around 5%) but with differences across cities.
Source: Nab Residential Housing Survey Q3 2013
Property Survey - House Price Expectations
-4.0
-3.0
-2.0
-1.0
0.0
1.0
2.0
3.0
4.0
5.0
6.0
Q1'11 Q2'11 Q3'11 Q4'11 Q1'12 Q2'12 Q3'12 Q4'12 Q1'13 Q2'13 Q3'13 Next 6months
Next 12months
Next 2years
Australia Victoria NSW Qld SA/NT WA
%
Current expectations in...
Estimated price growth during relevant survey period...

15
More interest in investor market - esp. foreignOwner occupier the largest share and appears to be increasing again. But overseas investors are around 12.5%. Main focus is Qld & recently NSW.
Share of Demand for New Properties from Overseas Buyers
0
5
10
15
20
25
Q2
2010
Q3
2010
Q4
2010
Q1
2011
Q2
2011
Q3
2011
Q4
2011
Q1
2012
Q2
2012
Q3
2012
Q4
2012
Q1
2013
Q2
2013
Q3
2013
Australia Victoria NSW QLD WA
%Percentage Share of Buyers - New Developments
0
10
20
30
40
50
60
FHBs ResidentOwner
Occupiers
AustralianInvestors
OverseasBuyers
Other FHBs ResidentOwner
Occupiers
AustralianInvestors
OverseasBuyers
Other
Q3'11 Q3'12 Q2'13 Q3'13
%
Current Quarter Next 12 Months

16
Industry share of state productionWhen comparing conditions across states, important to review the contribution of industry sectors to each economy. The most notable disparity is the mining sector.

17
Aust industry structure & growthConstruction, Finance and Health Services have recorded the fastest growth rate of all sectors over the past decade. And Health a key employer!
Australia Industry Structure(bubble size = employment)
Arts & Recreation
Health & Social AssistanceEducation & Training
Public Administration& Safety
Admin & SupportServices
Prof, Scientific & Technical Services
Rental, Hiring& Real Estate
Finance & Insurance
Communications
Transport, Post & Warehousing
Hospitality
Retail
Wholesale
Construction
Utilities
Manufacturing
Mining
Agriculture
0
20,000
40,000
60,000
80,000
100,000
120,000
140,000
160,000
0.0 1.0 2.0 3.0 4.0 5.0 6.0 7.0
average growth in gross value-added 2002/03 - 2011/12 (%)
gros
s va
lue
adde
d 20
11/1
2 ($
mn)

1818
Business conditions by industry sectorMulti-speed economy narrowing: but fast lane slowing. Big fall in mining since peak. Consumer dependent sectors remain poor. Where is the strength? = “Recreational & Personal Services” (incl. Health, Education, Travel).
Source: NAB Monthly Business Survey
-30
-20
-10
0
10
20
30
40
IV I II III IV I II III IV
2011 2012 2013
Mining Manuf Constn
-30
-20
-10
0
10
20
30
40
IV I II III IV I II III IV
2011 2012 2013
Retail Wsale Transp
-30
-20
-10
0
10
20
30
40
IV I II III IV I II III IV
2011 2012 2013
Fin, bus, prop Rec, pers
1919
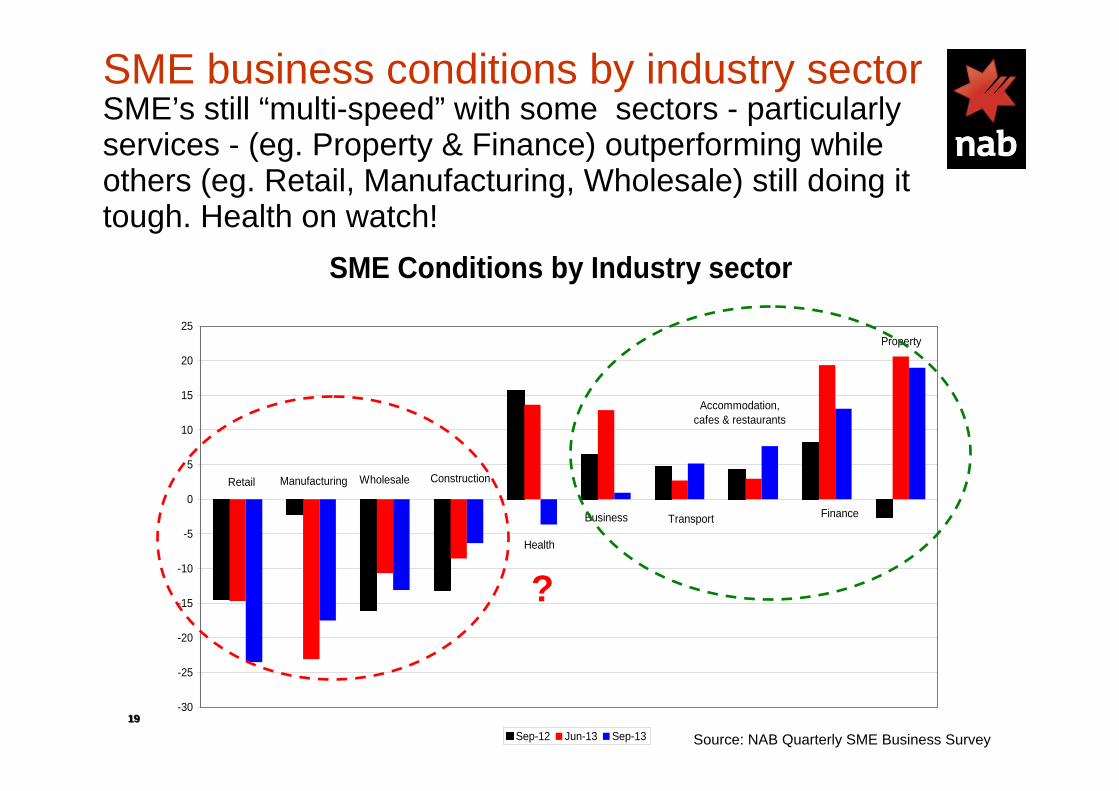
SME business conditions by industry sectorSME’s still “multi-speed” with some sectors - particularly services - (eg. Property & Finance) outperforming while others (eg. Retail, Manufacturing, Wholesale) still doing it tough. Health on watch!
Source: NAB Quarterly SME Business Survey
SME Conditions by Industry sector
Property
Finance
Accommodation, cafes & restaurants
Retail Manufacturing Wholesale Construction
Health
Business Transport
-30
-25
-20
-15
-10
-5
0
5
10
15
20
25
Sep-12 Jun-13 Sep-13
?

20
Will consumers remain cautious?Yes! Consumers still saving to repair balance sheets. Lower interest rates & higher equity & house prices will help, but higher unemployment will affect job security.
Jun2005
Jun2007
Jun2009
Jun2011 2013
Jun
14
12
10
8
6
4
2
0
-2
Household saving ratePer cent of net household disposable income
Source: ABS & NAB calculations
Seasonally adjusted Trend

21
NAB Online Retail Sales IndexAustralians spend >$14bn a yr online (6.3% of retail excl. food). Growing fast but has slowed. Around 70% of online spend domestic. Average spend around $40 per transaction.
80
100
120
140
160
180
200
220
240
260
280
Jan-10 Oct-10 Jul-11 Apr-12 Jan-13
Online Index (nsa)Online Index (sa)ABS Retail Sales (nsa)ABS Retail Sales (sa)
Online sales vs. Retail sales (monthly)“We tend to overestimate the effect of a technology in the short run and underestimate the effect in the long run..”Roy Amara, American futurologist.

22
Where to from here for retail? The future of retail is multi-channel, building brands & multiple touch-points. Stores have to become “FUN” to visit.
“Every morning, at opening time, the crew picks one child to “unlock imagination” with
an over-sized key to open the store for the day!”

23
ManufacturingAustralian manufacturing has shifted up the global cost curve (esp. against other advanced economies). The future? Leverage our digitally-driven infrastructure, customisation and focus on sustainability.
Australia
United States

2424
Chinese firms also moving up the cost curveShifting demographics & higher cost structure has seen China lose some allure as base for multinationals.

''It is one thing to sell a homogenous minerals commodity to a minerals-hungry
industrialist in China, and another thing entirely to design and market a
sophisticated personal service to someone living in that culture….''
Former Treasury secretary & lead author of the White Paper on Australia in the Asian Century, Dr Ken Henry.

Health in Focus

27
Government finances & health expenditureThe problem for Government is on the spending side. And against the backdrop of demographic forces & ongoing global economic uncertainty, the cost of healthcare continues to rise.
Total Australian government health expenditure with & without non-
demographic growth (in 2009-10 $’s)

28
ASX S&P 200 v Healthcare & Property returnsThe healthcare sector has been the standout performer on the Australian stock exchange. Healthcare property also mitigates downside risk - underperforms pre-GFC & outperforms during and post GFC.
Source: IPD
ASX 200 vs ASX 200 Healthcare Price Index (5-Jan-2007 = 100, weekly)
40
60
80
100
120
140
160
180
200
Jan-
07
Jun-
07
Oct
-07
Mar
-08
Aug-
08
Jan-
09
Jun-
09
Oct
-09
Mar
-10
Aug-
10
Jan-
11
Jun-
11
Nov
-11
Mar
-12
Aug-
12
Jan-
13
Jun-
13
Nov
-13
40
60
80
100
120
140
160
180
200
ASX 200 ASX 200 - Healthcare

29
Most efficient healthcare countriesAustralia already has one of the OECD’s most efficient health systems, in terms of life expectancy achieved for dollars spent.
Source: Bloomberg
30
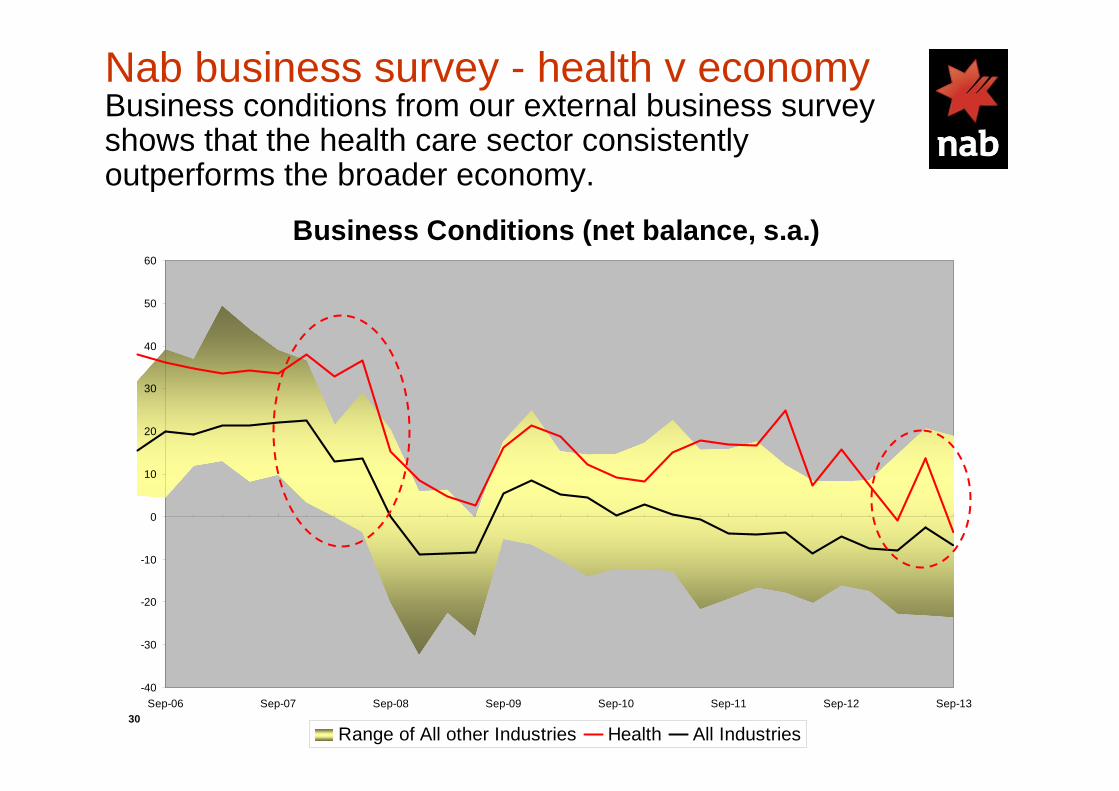
Nab business survey - health v economyBusiness conditions from our external business survey shows that the health care sector consistently outperforms the broader economy.
Business Conditions (net balance, s.a.)
-40
-30
-20
-10
0
10
20
30
40
50
60
Sep-06 Sep-07 Sep-08 Sep-09 Sep-10 Sep-11 Sep-12 Sep-13
Range of All other Industries Health All Industries
31
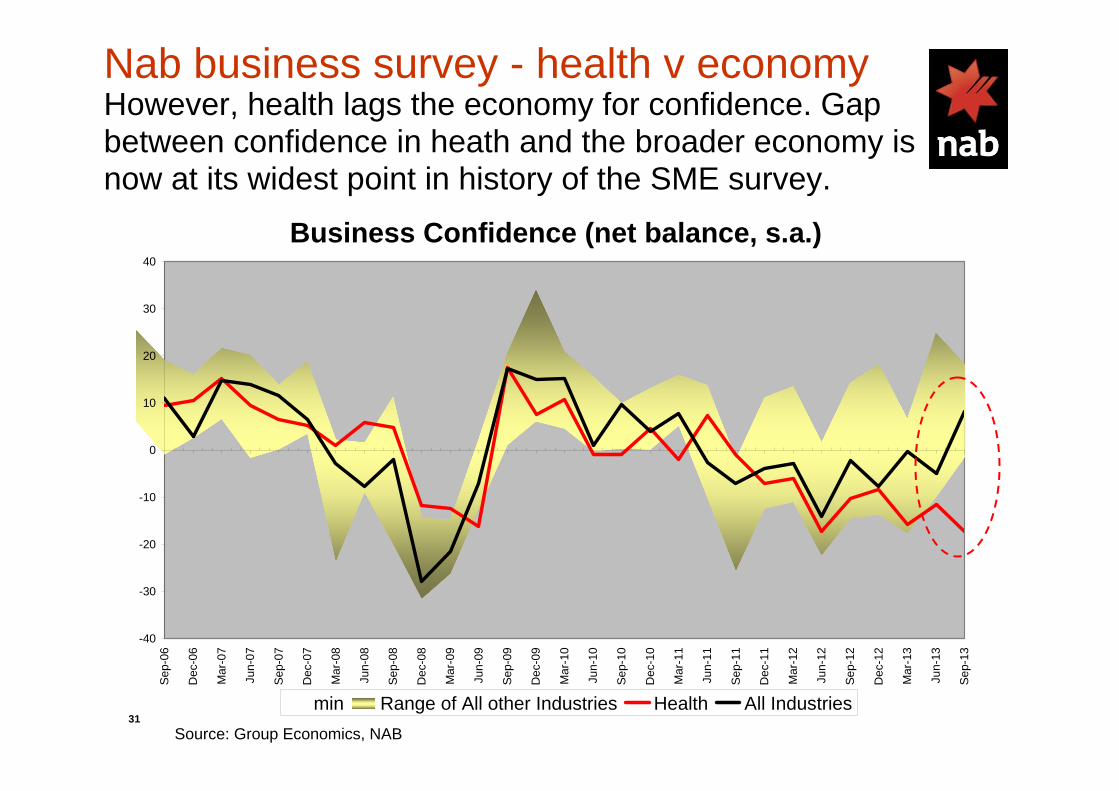
Nab business survey - health v economyHowever, health lags the economy for confidence. Gap between confidence in heath and the broader economy is now at its widest point in history of the SME survey.
Business Confidence (net balance, s.a.)
-40
-30
-20
-10
0
10
20
30
40
Sep-
06
Dec
-06
Mar
-07
Jun-
07
Sep-
07
Dec
-07
Mar
-08
Jun-
08
Sep-
08
Dec
-08
Mar
-09
Jun-
09
Sep-
09
Dec
-09
Mar
-10
Jun-
10
Sep-
10
Dec
-10
Mar
-11
Jun-
11
Sep-
11
Dec
-11
Mar
-12
Jun-
12
Sep-
12
Dec
-12
Mar
-13
Jun-
13
Sep-
13
min Range of All other Industries Health All IndustriesSource: Group Economics, NAB
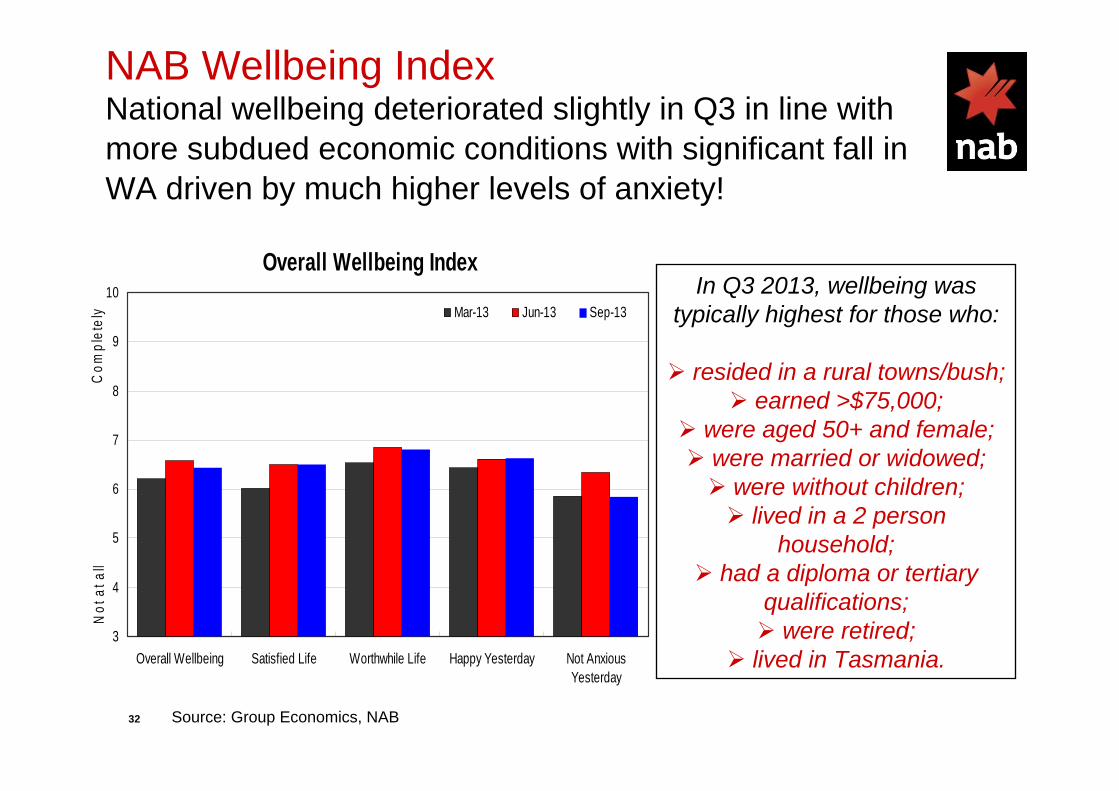
32
NAB Wellbeing IndexNational wellbeing deteriorated slightly in Q3 in line with more subdued economic conditions with significant fall in WA driven by much higher levels of anxiety!
In Q3 2013, wellbeing was typically highest for those who:
resided in a rural towns/bush;earned >$75,000;
were aged 50+ and female;were married or widowed;
were without children;lived in a 2 person
household;had a diploma or tertiary
qualifications;were retired;
lived in Tasmania.
Overall Wellbeing Index
3
4
5
6
7
8
9
10
Overall Wellbeing Satisfied Life Worthwhile Life Happy Yesterday Not AnxiousYesterday
Mar-13 Jun-13 Sep-13
Not
at a
llC
ompl
etel
y
Source: Group Economics, NAB

33
The Business of Selling “Happiness”“Happiness is not a goal, it’s a by-product”, Eleanor Roosevelt.

34
NAB Consumer Anxiety IndexConsumer anxiety still greatest around rising “cost of living”. Consumers are becoming more concerned about their ability to fund their health needs.
Overall Consumer Anxiety Index
3
4
5
6
7
8
9
10
Overall Anxiety Job Security Health Ability to FundRetirement
Cost of Living GovernmentPolicy
Jun-13 Sep-13
Nil
Extre
mel
y
Source: Group Economics, NAB

35
Are we a nation of whingers & worriers?The challenge is to capture how people define “quality of life” & “cost of living”. But… what is clear is health spending will rise, however much costs fall!

3636
thank you

3737
Important information
DISCLAIMER: “[While care has been taken in preparing this material,] NationalAustralia Bank Limited (ABN 12 004 044 937) does not warrant or represent that the information, recommendations, opinions or conclusions contained in this document (“Information”) are accurate, reliable, complete or current. The Information has been prepared for dissemination to professional investors for information purposes only and any statements as to past performance do not represent future performance. The Information does not purport to contain all matters relevant to any particular investment or financial instrument and all statements as to future matters are not guaranteed to be accurate. In all cases, anyone proposing to rely on or use the Information should independently verify and check the accuracy, completeness, reliability and suitability of the Information and should obtain independent and specific advice from appropriate professionals or experts.To the extent permissible by law, the National shall not be liable for any errors, omissions, defects or misrepresentations in the Information or for any loss or damage suffered by persons who use or rely on such Information (including by reasons of negligence, negligent misstatement or otherwise). If any law prohibits the exclusion of such liability, the National limits its liability to the re-supply of the Information, provided that such limitation is permitted by law and is fair and reasonable. The National, its affiliates and employees may hold a position or act as a price maker in the financial instruments of any issuer discussed within this document or act as an underwriter, placement agent, adviser or lender to such issuer.”