Embed Size (px)
Citation preview
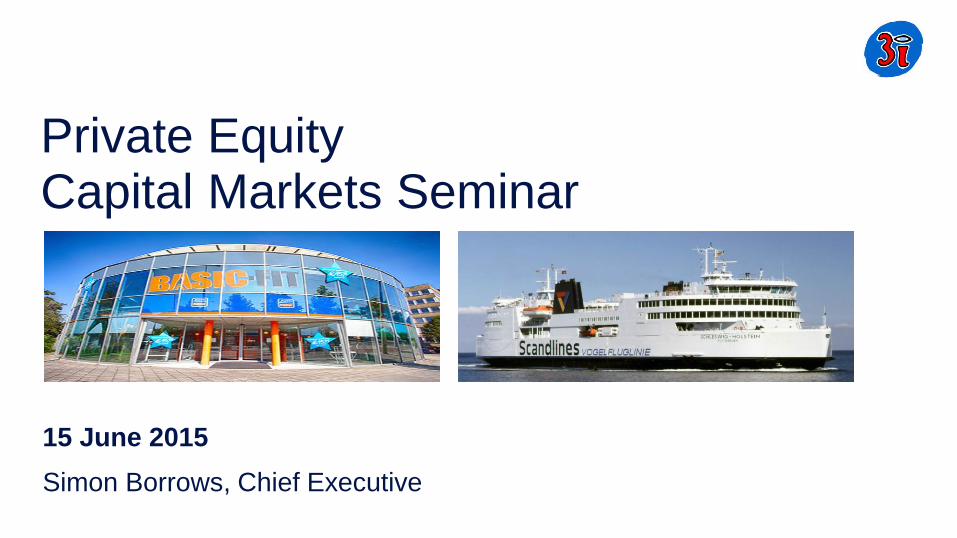
Private Equity Capital Markets Seminar
15 June 2015
Simon Borrows, Chief Executive


1
Agenda
08.30 for 09.00 Registration and coffee
09.00 to 09.10 Introduction by Simon Borrows
09.10 to 10.10 Scandlines
Introduction by Peter Wirtz
Presentation by Steve Ridgway, Chairman and Per Madsen, CFO of Scandlines
Q&A session
10.10 to 10.40 Coffee break
10.40 to 11.40 Basic-Fit
Introduction by Pieter de Jong
Presentation by Rene Moos, CEO of Basic-Fit
Q&A session
11.40 to 11.45 Closing remarks

2
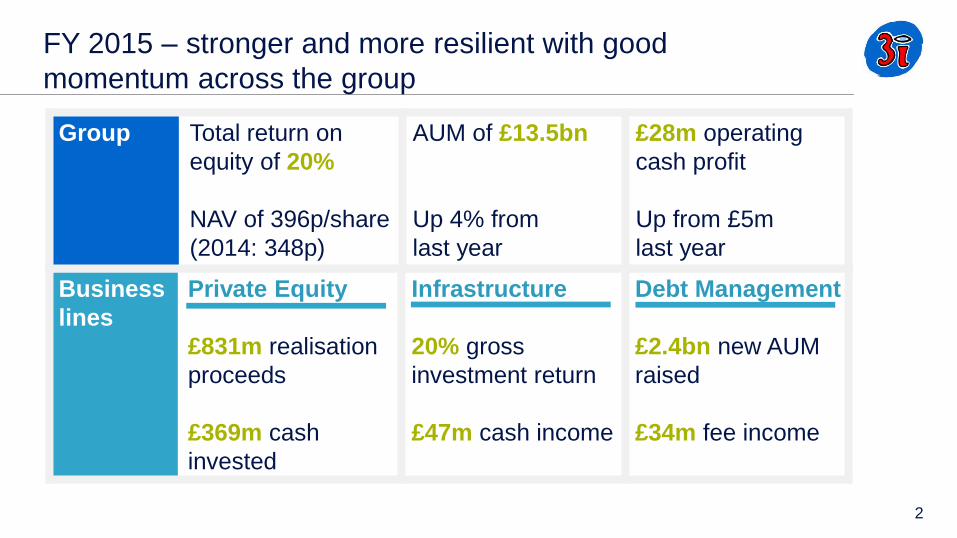
FY 2015 – stronger and more resilient with good
momentum across the group
Business
lines
Private Equity
£831m realisation
proceeds
£369m cash
invested
Infrastructure
20% gross
investment return
£47m cash income
Debt Management
£2.4bn new AUM
raised
£34m fee income
Group Total return on
equity of 20%
NAV of 396p/share
(2014: 348p)
AUM of £13.5bn
Up 4% from
last year
£28m operating
cash profit
Up from £5m
last year

3
Our business model – Private Equity drives
capital returns
Employs the majority
of 3i’s proprietary
capital
Primary driver of
third-party fund
management
business
Increasingly a third-
party fund
management
business
Private Equity Infrastructure Debt Management
Proprietary Capital portfolio value Fund Management fee income
Total AUM of £13.5bn and Proprietary Capital of £3.9bn at 31 March 2015

4
Clear geographic and sector focus
─ UK, northern Europe and north America
─ industrials, consumer and business services
Strict return and pricing filters
─ 2x return target over 3-5 years
─ opportunity to exceed that from bucket 1 assets
Value creation through earnings growth
─ leverage network to implement growth strategies through internationalisation/M&A
─ double earnings through holding period
Our strategy in Private Equity
2 Best-in-class asset
management
3 Disciplined realisations
1 Selective investment
Capable of generating material investment returns from good origination, asset management and well planned exits

5
The buckets Selected examples % of value
FY2015 FY2014
1 Longer-term hold and value
creation
Action, Element,
Basic-Fit, Scandlines c. 60% c. 42%
2 Strong performers; position for
sale over the next few years
Hilite, Vedici,
LHI, Dynatect c. 15% c. 30%
3 Manage intensively; potential
value upside
Azelis, Mémora,
OneMed c. 15% c. 26%
4 Low or nil-valued assets Boomerang, Indiareit,
Nimbus c. 1% c. 2%
5 Quoted assets Quintiles, Refresco,
Eltel c. 9% n/a
An increasingly valuable Private Equity portfolio
Strong 19% weighted average earnings growth driven by buckets 1 and 2
An introduction to Scandlines
Peter Wirtz
Partner, 3i Private Equity

2
3i has a successful track record in Germany and
the Nordic region
3i can deploy cross-border teams to source and manage international investments. Our Scandlines team draws from the expertise of our Frankfurt and Stockholm offices
Frankfurt office since 1984
– 8 investment professionals
– c.€2.2bn of equity invested since 2001
– Assets account for >20% of the current private equity portfolio
Stockholm office since 2001
– 5 investment professionals
– c.€2.3bn of equity invested since establishment
3
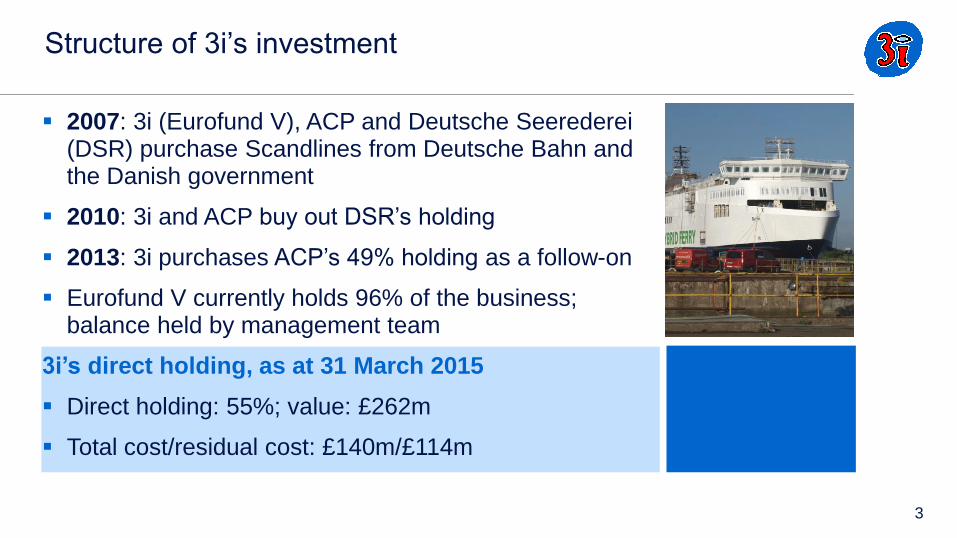
Structure of 3i’s investment
2007: 3i (Eurofund V), ACP and Deutsche Seerederei (DSR) purchase Scandlines from Deutsche Bahn and the Danish government
2010: 3i and ACP buy out DSR’s holding
2013: 3i purchases ACP’s 49% holding as a follow-on
Eurofund V currently holds 96% of the business; balance held by management team
3i’s direct holding, as at 31 March 2015
Direct holding: 55%; value: £262m
Total cost/residual cost: £140m/£114m
4
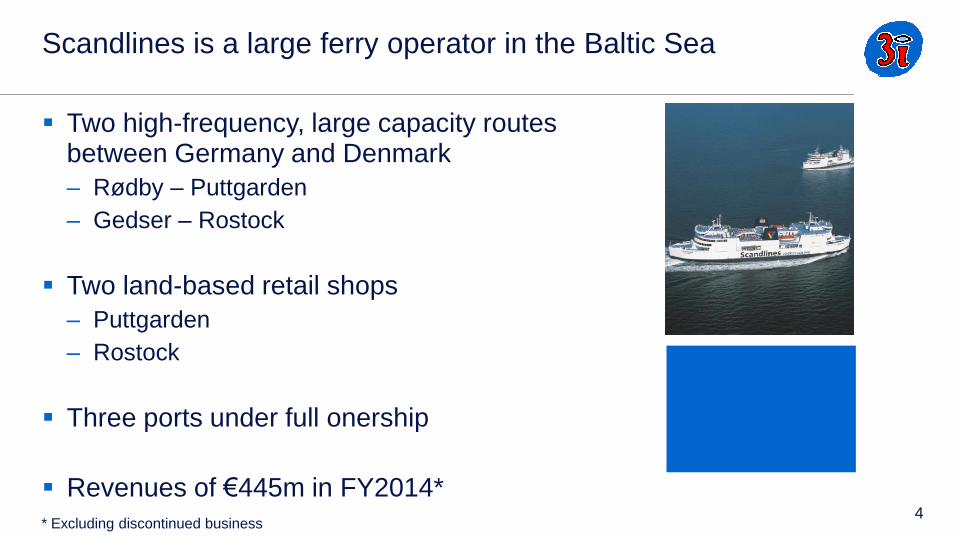
Scandlines is a large ferry operator in the Baltic Sea
Two high-frequency, large capacity routes between Germany and Denmark
– Rødby – Puttgarden
– Gedser – Rostock
Two land-based retail shops
– Puttgarden
– Rostock
Three ports under full onership
Revenues of €445m in FY2014*
* Excluding discontinued business
5
Why did we invest in Scandlines?
Opportunity to capitalise on strong position in a stable market, with good cash generation
Clear value creation levers
– fixed cost reductions by eliminating double functions in Denmark/Germany
– leverage strong market position to drive positive like-for-like volume growth on all routes
– divestment of non-core businesses
Position Scandlines as an attractive investment for infrastructure investors

6
Scandlines operates in stable and resilient markets
Source: OECD Economic Outlook (June 2015), Euromonitor, FactSet (as of 12 June 2015) Note Forecasts 2014-16E based on OECD, 2016-19E based on Euromonitor
Real GDP growth (y-o-y change in %) Consumer expenditures (y-o-y change in %)
Macroeconomic summary
Country GDP per capita GDP per capita
Consumer
confidence
Unemployment
rate Inflation (y-o-y change)
Government
bond yield Country rating Import / Export
CAGR '12-14A 2014 A(US$) 2014A 2014A 2014A 2016E 10 years Moody's / Fitch CAGR '12-16E
2.2% 45,813 High 7.9% (0.2%) 1.4% 1.81% Aaa / AAA 4.0% / 3.2%
1.2% 44,631 High 6.5% 0.6% 1.2% 1.75% Aaa / AAA 3.2% / 2.8%
1.7% 44,190 High 5.0% 0.8% 1.8% 1.39% Aaa / AAA 4.5% / 3.6%
CAGR: '04-14A '14-16E '16-19E
SE 2.1% 2.6% 4.6%
DK 0.7% 2.0% 3.5%
DE 0.8% 2.1% 3.4%
EU 0.5% 1.8% 3.7%
CAGR: '04-14A '14-16E '16-19E
SE 1.7% 2.9% 2.3%
DK 0.4% 2.1% 1.5%
DE 1.3% 1.9% 1.3%
EU 0.7% 1.8% 1.7%
0.0%
1.0%
2.0%
3.0%
4.0%
5.0%
2014A 2015E 2016E
0.0%
1.0%
2.0%
3.0%
4.0%
5.0%
2014A 2015E 2016E
7
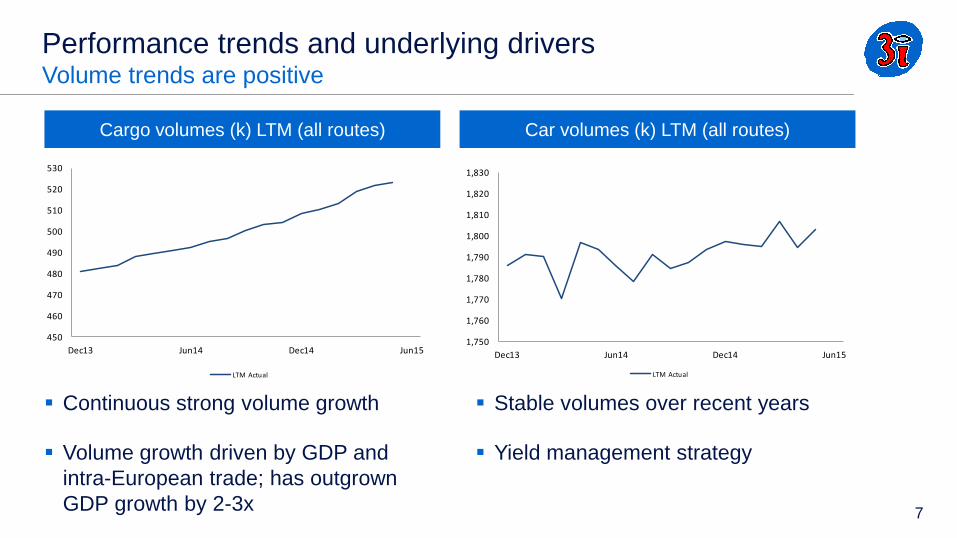
Performance trends and underlying drivers Volume trends are positive
Continuous strong volume growth
Volume growth driven by GDP and
intra-European trade; has outgrown
GDP growth by 2-3x
Stable volumes over recent years
Yield management strategy
Cargo volumes (k) LTM (all routes) Car volumes (k) LTM (all routes)
450
460
470
480
490
500
510
520
530
Dec13 Jun14 Dec14 Jun15
LTM Actual
1,750
1,760
1,770
1,780
1,790
1,800
1,810
1,820
1,830
Dec13 Jun14 Dec14 Jun15
LTM Actual

8
Performance trends and underlying drivers Disposal of Joint Venture on Helsingor-Helsingborg route
Scandlines operated the HeHe route in a joint venture (50/50) with Stena Line
Oresund AB since 2000
The JV set-up was sub-optimal, and made the achievement of significant cost
and revenue synergies challenging
Disposal of JV
Took advantage of strong market conditions in the infrastructure market to agree
sale to First State Investments
Following bilateral discussions, Scandlines and its JV partners Stena Lines signed
and closed a 100% disposal of the business in January 2015
Achievements:
– valuation >10x EV/EBITDA
– resolved complex JV set-up, resulting in a “cleaner”, more
digestible asset
– amendment of debt package in parallel
– proceeds to 3i of c.£47m
9
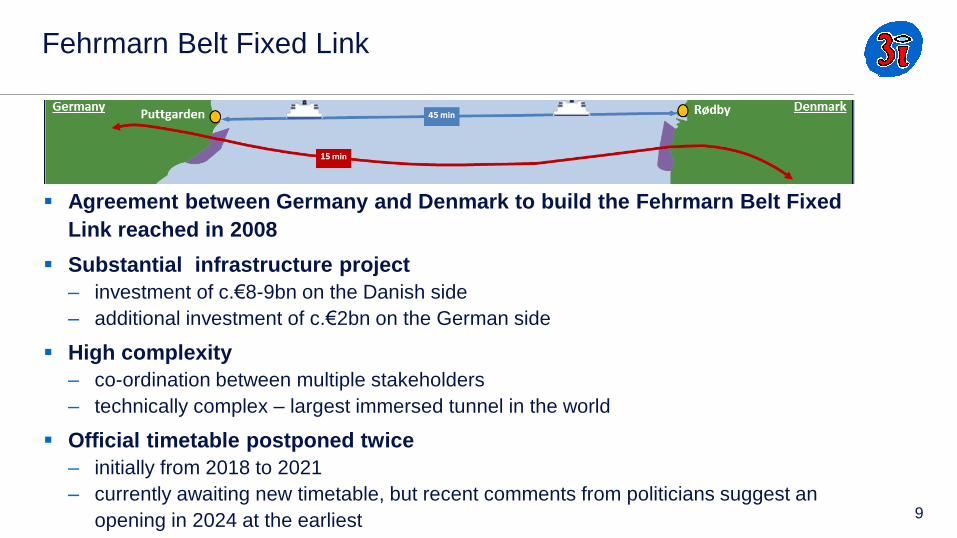
Fehrmarn Belt Fixed Link
Agreement between Germany and Denmark to build the Fehrmarn Belt Fixed
Link reached in 2008
Substantial infrastructure project
– investment of c.€8-9bn on the Danish side
– additional investment of c.€2bn on the German side
High complexity
– co-ordination between multiple stakeholders
– technically complex – largest immersed tunnel in the world
Official timetable postponed twice
– initially from 2018 to 2021
– currently awaiting new timetable, but recent comments from politicians suggest an
opening in 2024 at the earliest

10
Steve B. Ridgway Chairman, Scandlines
30 years of experience with Virgin Atlantic, including as CEO between 2001 and 2013
Valuable contribution to developing Scandlines’ strategic yield management, as well as its retail and catering services, on-board and in its land-based retail shops
Strong engagement with 3i and the Scandlines management team
Appointed in January 2014, following 3i’s acquisition of ACP’s stake
11
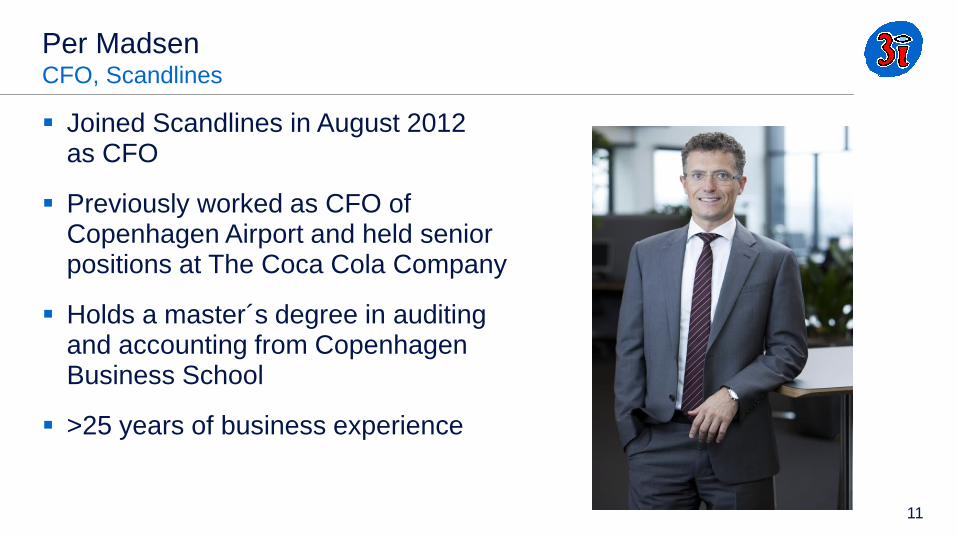
Per Madsen CFO, Scandlines
Joined Scandlines in August 2012 as CFO
Previously worked as CFO of Copenhagen Airport and held senior positions at The Coca Cola Company
Holds a master´s degree in auditing and accounting from Copenhagen Business School
>25 years of business experience


Introduction to Scandlines Steve Ridgway, Chairman and Per Madsen, CFO June 2015

‘Clear progress by driving operational excellence’

Agenda:
Scandlines is a focused, short sea route specialist
How to compete against a fixed link on Fehmarn Belt
Our onwards journey – creating further value
1
2
3

Scandlines is the essential connection between Scandinavia and
Continental Europe – route of choice for cars and freight
Market dynamics
Situated uniquely
bridging some of
Europe's most
prosperous regions
Compete against
longer and less
frequent ferry routes
and a fixed link
Stable market growth
Rostock-Gedser
8 million customers
2 short sea routes
Operate 7 ferries
Own 3 ports
Own 2 border shops
1.500 employees
BorderShops
Puttgarden-Rødby

25%
33%
22%
18%
3%
While Puttgarden–Rødby route is the largest financial contributor, earnings are split between different customer segments
53%
16%
31%
83%
10% 6%
Puttgarden-Rødby
Puttgarden-Rødby
Rostock-Gedser
BorderShops Rostock-Gedser
BorderShops
Leisure
Border-shoppers
Freight
On board R/C
Other
Revenue split by route EBITDA split by route Revenue split by segment
2014A: €445m* 2014A: €138m* 2014A: €445m*
Note: 2014 numbers exclude discontinued business

Scandlines 2006 – an unfocused state-owned company with
multiple businesses (20 routes in total)

Scandlines 2015 – a focused short sea route specialist
(2 routes in total)
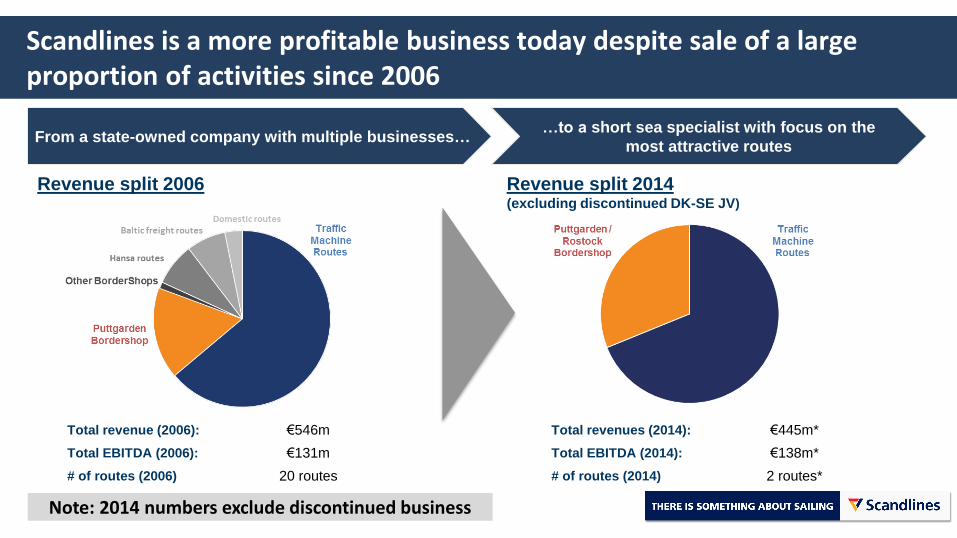
Scandlines is a more profitable business today despite sale of a large proportion of activities since 2006
From a state-owned company with multiple businesses… …to a short sea specialist with focus on the
most attractive routes
Total revenue (2006): €546m Total revenues (2014): €445m*
Total EBITDA (2006): €131m Total EBITDA (2014): €138m*
# of routes (2006) 20 routes # of routes (2014) 2 routes*
Note: 2014 numbers exclude discontinued business
Revenue split 2006 Revenue split 2014 (excluding discontinued DK-SE JV)
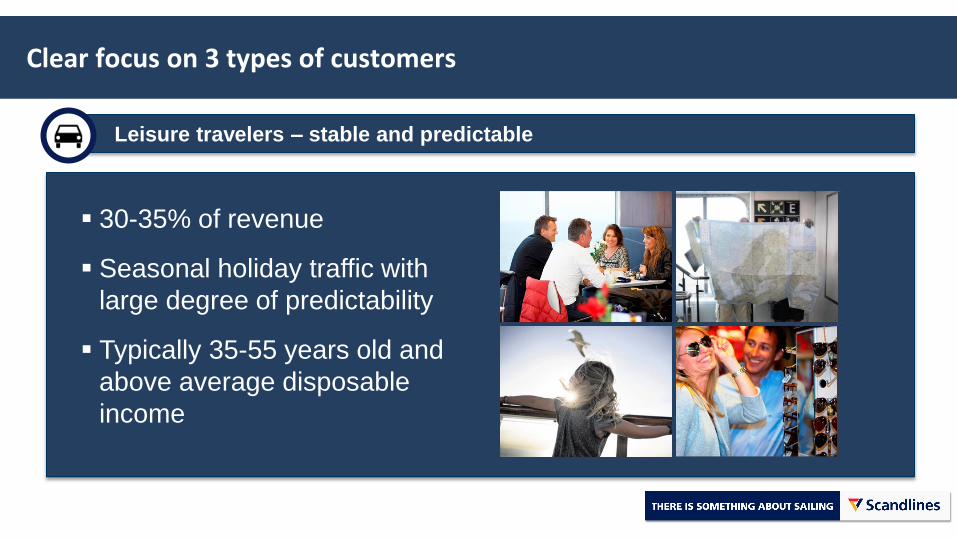
Clear focus on 3 types of customers
Leisure travelers – stable and predictable
30-35% of revenue
Seasonal holiday traffic with
large degree of predictability
Typically 35-55 years old and
above average disposable
income
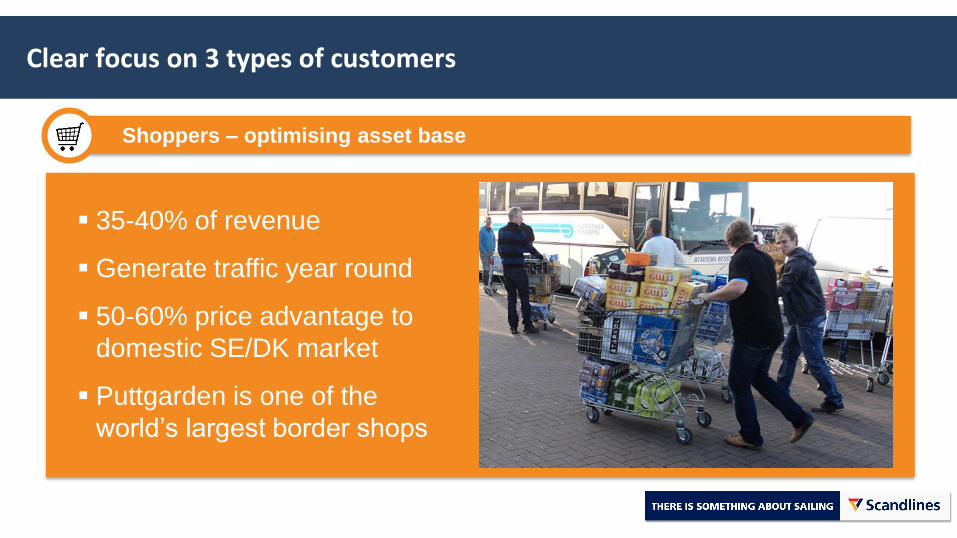
Clear focus on 3 types of customers
Shoppers – optimising asset base
35-40% of revenue
Generate traffic year round
50-60% price advantage to
domestic SE/DK market
Puttgarden is one of the
world’s largest border shops

Clear focus on 3 types of customers
Freight – high growth potential
~25% of revenue
Economic demand
Customers are commercial
decision makers
Scandlines in strong position
to gain market share

A well invested asset base – modern fleet on Puttgarden-Rødby and new vessels to be introduced on Rostock-Gedser this year
Puttgarden-Rødby Rostock-Gedser
4 double ended hybrid ferries from 1997 with at least 20 year lifetime left
Commercial areas fully refurbished 2011-2015
2 new vessels to replace current ones in 2015 Harbours fully upgraded in 2012 (new check-
in, marshalling area and ramps)
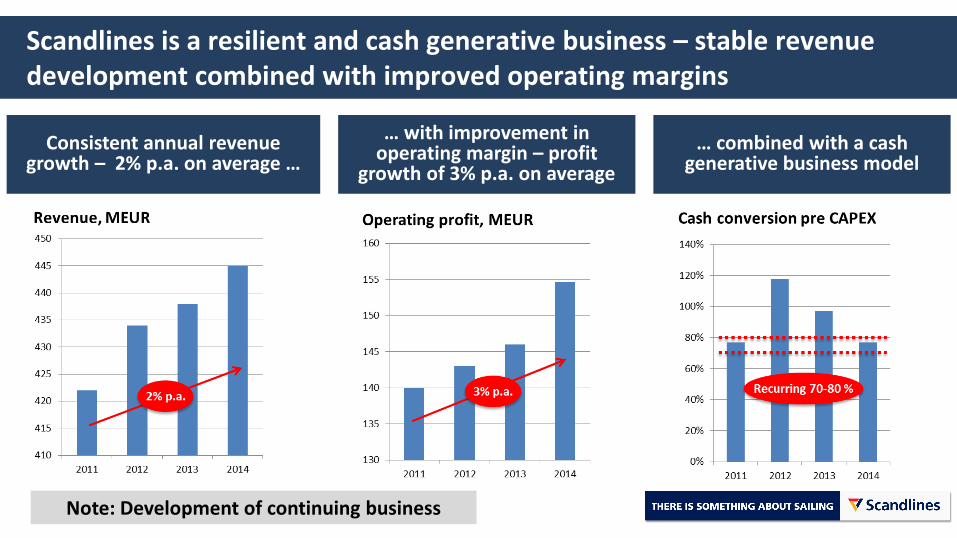
Scandlines is a resilient and cash generative business – stable revenue development combined with improved operating margins
Consistent annual revenue growth – 2% p.a. on average …
… with improvement in operating margin – profit
growth of 3% p.a. on average
… combined with a cash generative business model
Note: Development of continuing business

Agenda:
How to compete against a fixed link on Fehmarn Belt
Our onwards journey – creating further value
1
2
3
Scandlines is a focused, short sea route specialist
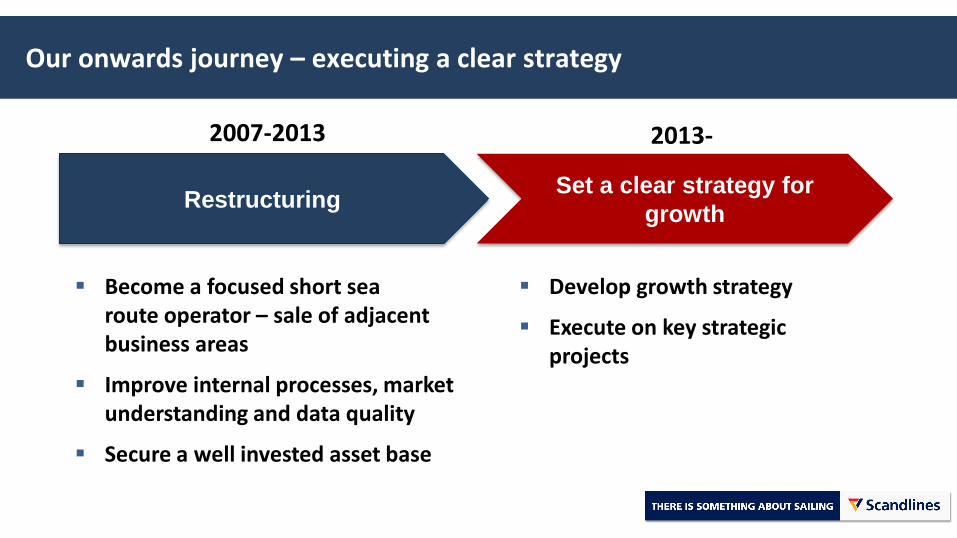
Our onwards journey – executing a clear strategy
Restructuring Set a clear strategy for
growth
Become a focused short sea route operator – sale of adjacent business areas
Improve internal processes, market understanding and data quality
Secure a well invested asset base
Develop growth strategy
Execute on key strategic projects
2007-2013 2013-

A clear strategy focused on four key themes
Clear set of projects in place to achieve strategy SMILE loyalty programme Green investment roadmap Introduce new vessels on Rostock-Gedser Increase business efficiency
5 year strategic themes:
Leisure: Capture
moderate growth
Freight: Continued
strong growth
Lead environ-mental change in the Baltic Sea
Business efficiency
Customer focus Cost focus
1 2 4 3
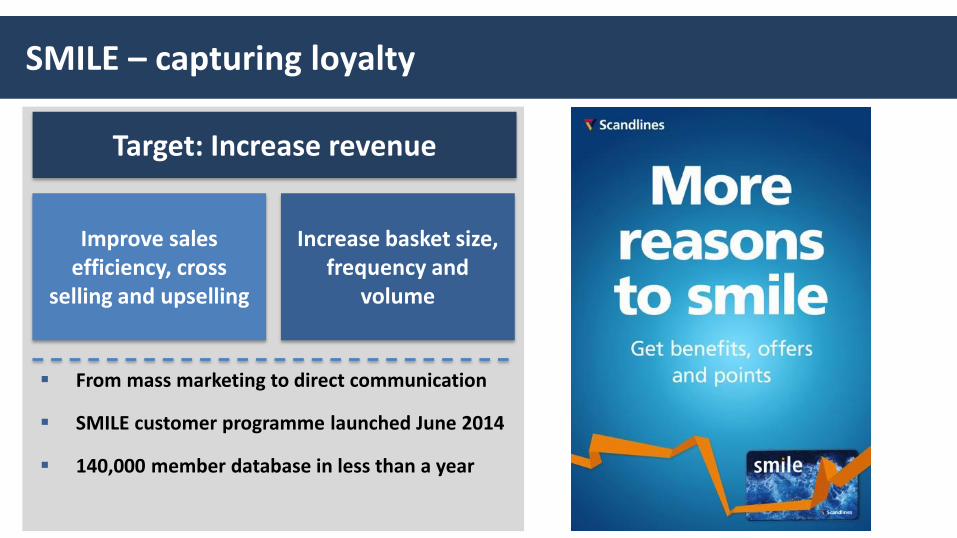
SMILE – capturing loyalty
From mass marketing to direct communication
SMILE customer programme launched June 2014
140,000 member database in less than a year
Target: Increase revenue
Improve sales efficiency, cross
selling and upselling
Increase basket size, frequency and
volume

Lead environmental change – a clear commercial benefit
Being at the forefront creates several benefits
Funding
Brand value
Cost savings Positive business case (from 0.5 to 5 years payback) – fuel efficiency and
lower maintenance
We have been able to better adjust to new sulphur regulations
Generates large interest and positive feedback from customers and employees
High profile – articles in printed media and television coverage on hybrid ferry investment
Growing political awareness of ferries’ environmental potential
Funding available
Pilot action funding achieved on largest investment (50% EU funding)

Prinsesse Benedikte – the world’s largest hybrid ferry Built in 1997, hybrid since August 2013

ZERO EMISSION
Charging in harbour
Diesel generator Battery bank Diesel generator Battery bank 3-4 battery banks Charging in harbour
Clear green investment roadmap providing commercial benefits
Hybrid Ferries
Today
Plugin Hybrid Ferries
2015-2017
Zero Emission Ferries
2018-

New vessels for Rostock-Gedser to capture growth
Capture market growth and gain market share
Rostock-Gedser offers largest growth potential covering central and eastern European corridors – especially for freight
Removal of current capacity constraint
Improved customer experience
Increased business efficiency
Replacement of 35 year old vessels
Double up on capacity
Lower cost base – smaller crew, increased fuel efficiency and lower maintenance

Increase business efficiency by reducing inherited complexity
Rostock
Copenhagen Legacy setup with two
equally large headquarters
A much simpler business
today
From develop to maintain
Adjustment of land-based headcount
Agenda:
How to compete against a fixed link on Fehmarn Belt
Our onwards journey – creating further value
1
2
3
Scandlines is a focused, short sea route specialist
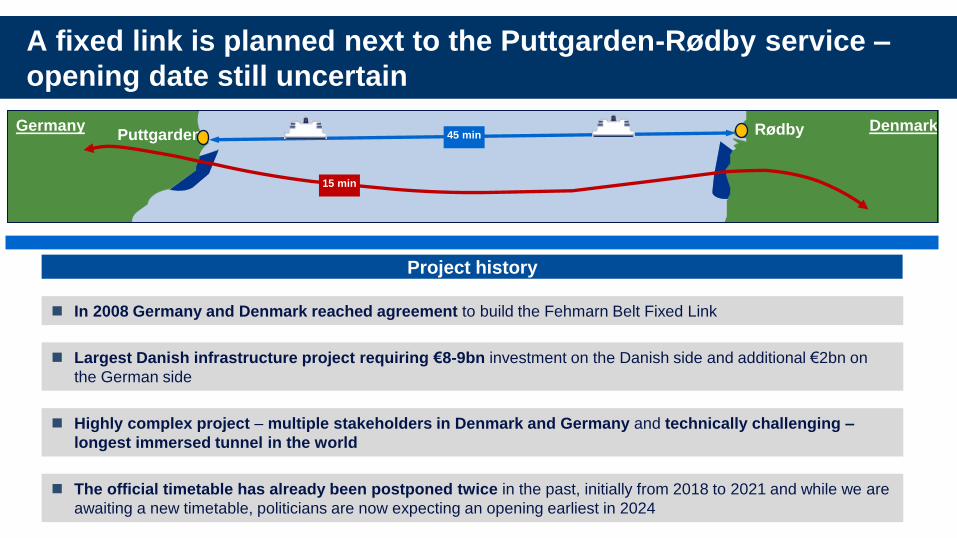
A fixed link is planned next to the Puttgarden-Rødby service –
opening date still uncertain
Germany Denmark Rødby Puttgarden 45 min
15 min
In 2008 Germany and Denmark reached agreement to build the Fehmarn Belt Fixed Link
Project history
The official timetable has already been postponed twice in the past, initially from 2018 to 2021 and while we are
awaiting a new timetable, politicians are now expecting an opening earliest in 2024
Largest Danish infrastructure project requiring €8-9bn investment on the Danish side and additional €2bn on
the German side
Highly complex project – multiple stakeholders in Denmark and Germany and technically challenging –
longest immersed tunnel in the world

A fixed link will impact our business – but a viable case for
competing
Scandlines is increasingly well prepared
Scalable cost
structure
From full service provider to low cost provider
Ability to tailor schedule to demand – i.e. lower number of departures
from 34,000 to 24,000 offering high frequency in peak hours only
Focus on
price sensitive
customers
Freight – cost focused and achieve mandatory resting break
Border shopping – we market this product and it is all about savings
Leisure – 20-30% of these customers are price sensitive
Ensure that state aided fixed link does not misuse EU funding and
state aid to drive out competition
5 separate EU state aid complaints filed against project
Legal case
against tunnel

Outlook 2015 – continued stable growth combined with impact of strategic projects
Historic - 2011-2014
Revenue: 2 % p.a.
Operating profit: 3 % p.a.
2015E
Revenue: 3-5 %
Operating profit: 3-5 %

Conclusion – Scandlines continues to be an attractive investment
Well established infrastructure business in stable market
Unique position
Strong financials
Well invested asset base
Clear strategy in place to create further value
Customer loyalty, green investments, new vessels and increased business efficiency
Well prepared for tunnel competition
Outlook from historic 2-3 % to 3-5 % growth

‘Clear progress by driving operational excellence’

Basic-Fit
Pieter de Jong
Partner, Managing Director, 3i Benelux

2
3i has a successful track record in the Benelux
Amsterdam office since 1998
Invested >€1.3bn of equity; >40% IRR since 2001 on 16
investments
Eight investment professionals
Selected
Benelux
investments
Amsterdam office since 1998
3i’s investment strategy is to grow successful companies internationally, leveraging on the international growth experience. Basic-Fit lies in the sweet-spot.

3
Leading European bottler of
soft drinks and fruit juices
Current Benelux consumer portfolio evidence strategy
A leading European non-food discounter
€25m to €2,000m sales in 16 years in low growth industry
Leading European non-food
discount stores
Winning Benelux format – now winning internationally
Leading European budget
gym operator
Winning Dutch format – now winning internationally
2010 2011 2013
56 79 105 127 149 170 190 220 245 269 321
406
514
02 03 04 05 06 07 08 09 10 11 12 13 14
NL BE GE FR0
50
100
150
200
250
300
350
400
2010 2011 2012 2013 2014 2015
-
0.5
1.0
1.5
2.0
1999 2000 2001 2002 2003 2004 2005 2006 2007 2008 2009 2010 2011 2012 2013 2014
(€bn)

4
17
9
79 94
Basic-Fit at the time of investment
Fast growing budget gym operator with a strong value proposition
Growing Basic Fit presence in Benelux, and some clubs in France and Spain
199 clubs at time of investment
Company in transition
Strong growth ambitions of management

5
Seamless fit with our investment strategy
Clear evidence of growing budget fitness markets in Netherlands and Belgium
Growth is driven by 2 consumer trends:
– Lifestyle and well-being
– Polarisation
Fragmented industry in target markets
Improvement potential
Basic-Fit operates in an attractive market
13% 15% 18% 21% 26% 30%
87% 85% 82% 79% 74% 70%
2009 2010 2011 2012 2013 2014
Budget segment share, NL
6
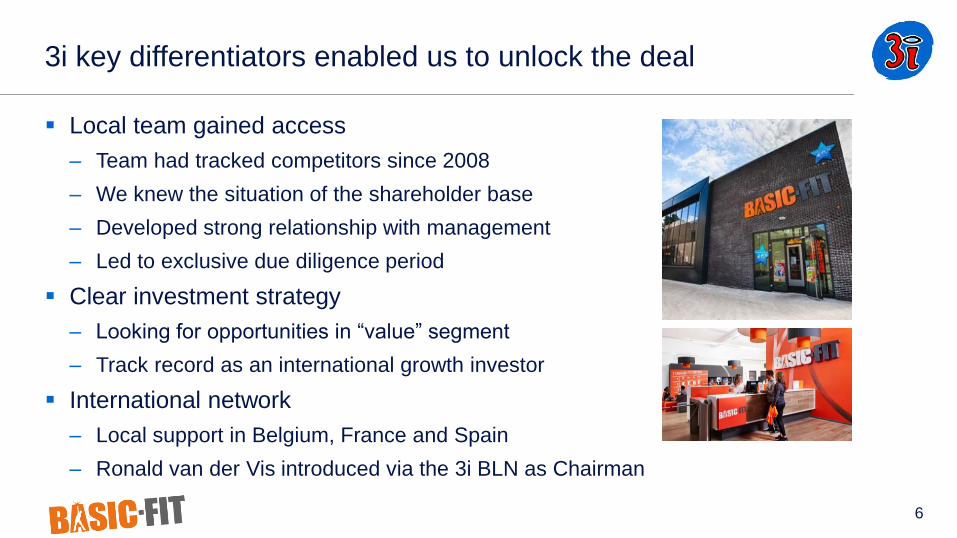
Local team gained access
– Team had tracked competitors since 2008
– We knew the situation of the shareholder base
– Developed strong relationship with management
– Led to exclusive due diligence period
Clear investment strategy
– Looking for opportunities in “value” segment
– Track record as an international growth investor
International network
– Local support in Belgium, France and Spain
– Ronald van der Vis introduced via the 3i BLN as Chairman
3i key differentiators enabled us to unlock the deal

7
Investment hypothesis confirmed, performance above plan
More than 3x number of clubs of #2 Clear market leader in the Benelux
Ingrowth of new club openings
above plan New club openings and ingrowth
drive profit growth
Roll-out exceeding investment case Roll-out potential in the Benelux
and beyond
Fitness penetration increasing with
discount fitness increasing market
share
Fast growing discount market
segment with ample headroom
8
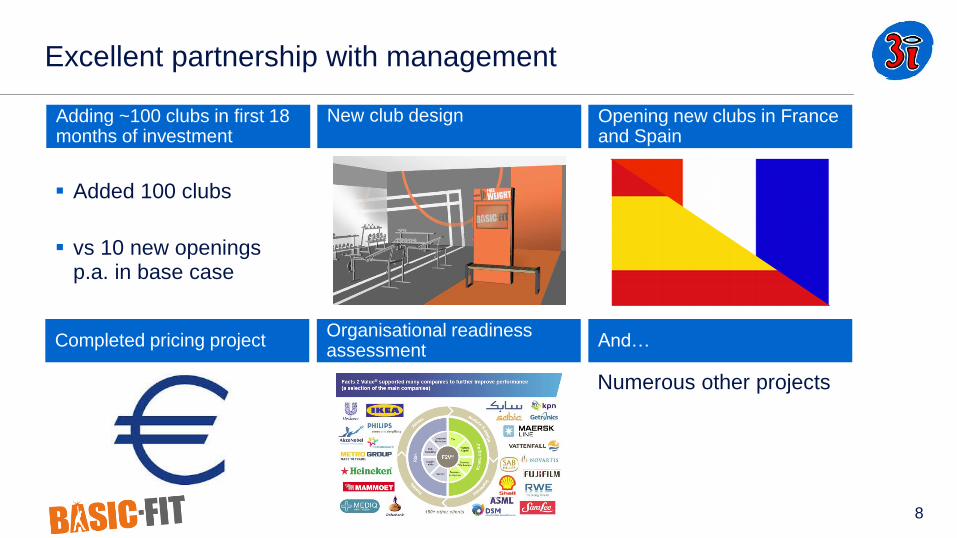
Excellent partnership with management
Opening new clubs in France and Spain
Organisational readiness assessment
Completed pricing project
Adding ~100 clubs in first 18 months of investment
New club design
Added 100 clubs
vs 10 new openings p.a. in base case
Numerous other projects
And…
9
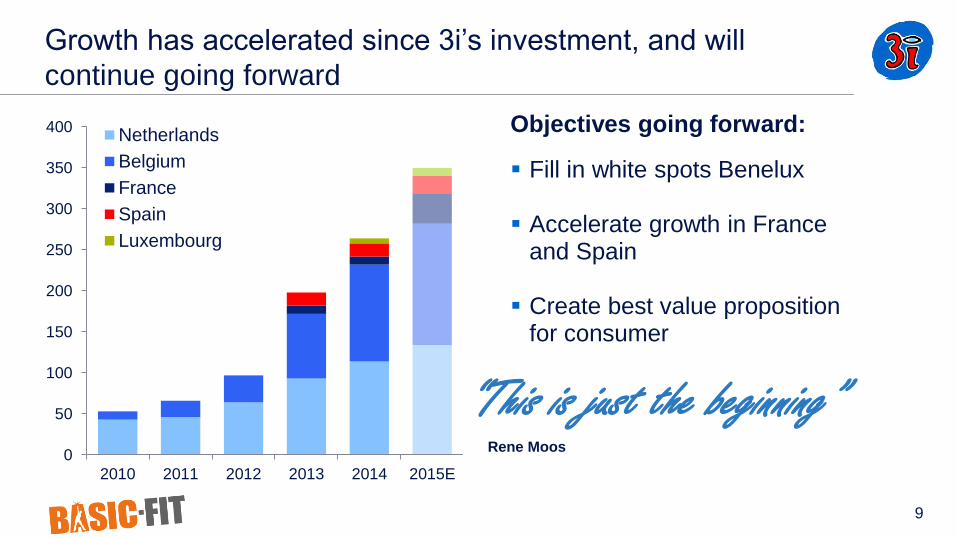
Growth has accelerated since 3i’s investment, and will
continue going forward
0
50
100
150
200
250
300
350
400
2010 2011 2012 2013 2014 2015E
Netherlands
Belgium
France
Spain
Luxembourg
Objectives going forward:
Fill in white spots Benelux
Accelerate growth in France and Spain
Create best value proposition for consumer “This is just the beginning”
Rene Moos
10
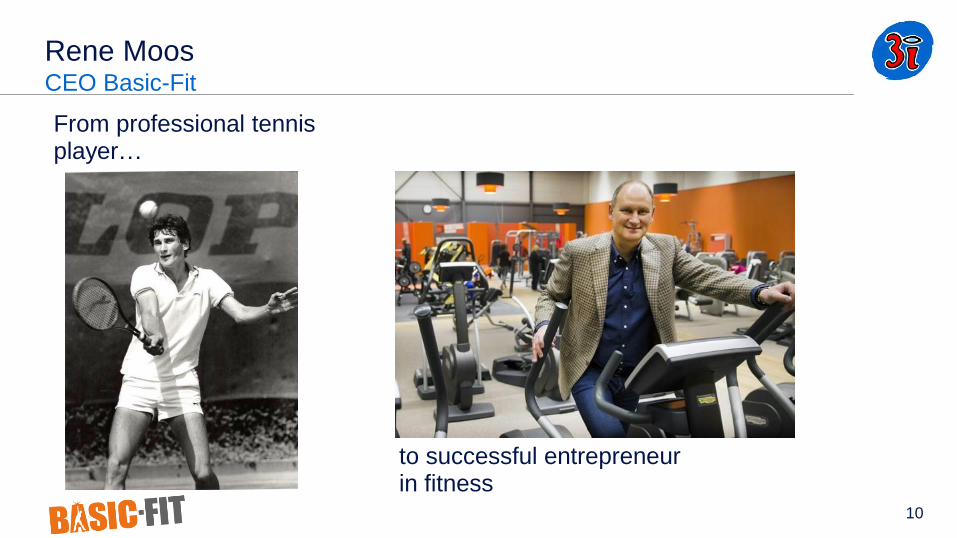
Rene Moos CEO Basic-Fit
to successful entrepreneur in fitness
From professional tennis player…
2
Structure of 3i’s investment
Year invested: 2013
Holding: 44% (balance held by co-investors and management)
Value at 31 March 2015: £102m
Residual cost at 31 March 2015: £91m


BASIC-FIT – 3I GROUP PLC CAPITAL MARKETS DAY 15 June 2015

31 YEARS TRACK RECORD OF PROFITABLE GROWTH IN THE FITNESS INDUSTRY
300
61
100
200
300
2005 2006 2007 2008 2009 2010 2011 2012 2013 2014 2015
Basic-Fit HealthCity
2010 Acquisition of Basic-Fit
1984 Rene Moos
started HealthCity
2013 Buyout of BF by 3i
Separation Basic-Fit / HealthCity

Family membership from €15.99 per month
No frills, but
- High quality equipment and facilities
- Long opening hours
- Group lessons
- Virtual cycling
- Personal Trainers
- Flexible membership
Value proposition attracts new customer groups
OVERVIEW OF BASIC-FIT BASIC-FIT: LARGEST EUROPEAN BUDGET GYM OPERATOR
Club portfolio at June 2015
21
12
126
7
133

STRONG FINANCIAL AND OPERATIONAL PERFORMANCE IN 2014
2013 2014
+43%
Members # of clubs
Sales EBITDA
199
264
2013 2014
+33%
2013 2014
+35%
2013 2014
+67%

STANDARDISED CLUB CONCEPT

HIGH QUALITY EQUIPMENT, SUPPLIED BY MATRIX AND TECHNOGYM
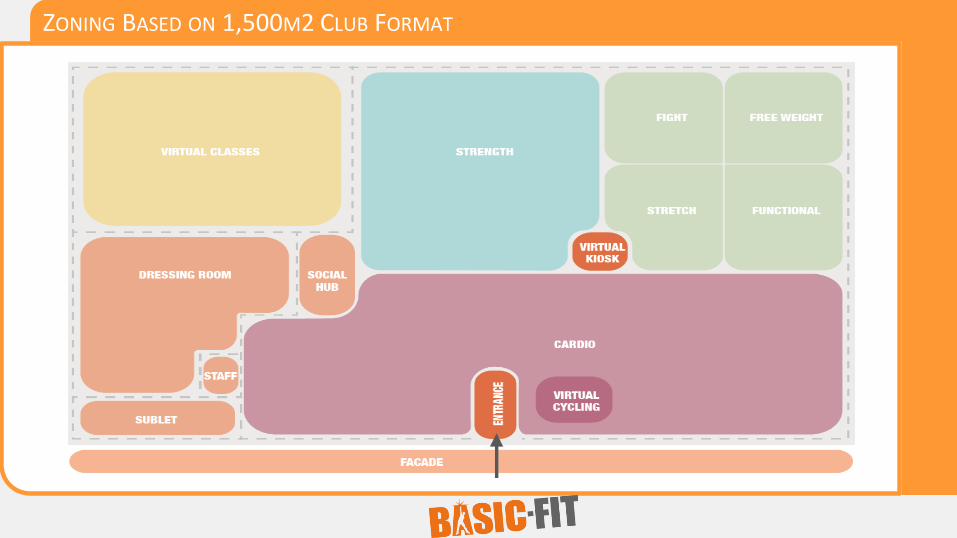
ZONING BASED ON 1,500M2 CLUB FORMAT
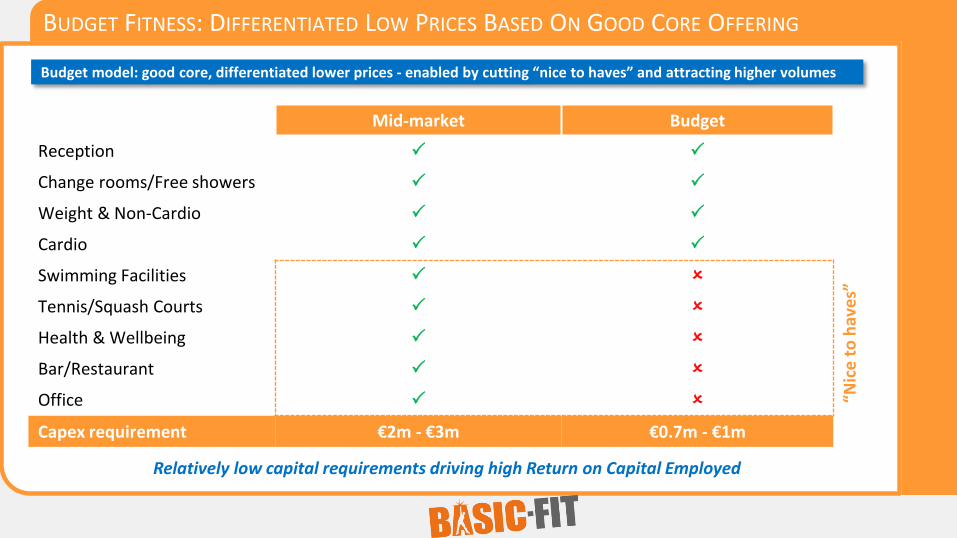
BUDGET FITNESS: DIFFERENTIATED LOW PRICES BASED ON GOOD CORE OFFERING
Mid-market Budget
Reception
Change rooms/Free showers
Weight & Non-Cardio
Cardio
Swimming Facilities
Tennis/Squash Courts
Health & Wellbeing
Bar/Restaurant
Office
Capex requirement €2m - €3m €0.7m - €1m
“Nic
e t
o h
ave
s”
Budget model: good core, differentiated lower prices - enabled by cutting “nice to haves” and attracting higher volumes
Relatively low capital requirements driving high Return on Capital Employed

13% 15% 18% 21% 26% 30%
87% 85% 82% 79% 74% 70%
2009 2010 2011 2012 2013 2014
7% 8% 10% 10% 20%
30%
93% 92% 90% 90% 80%
70%
2009 2010 2011 2012 2013 2014
STRUCTURAL GROWTH IN BUDGET FITNESS SEGMENT WITH 20 %+ CAGR
Budget segment share, NL Budget segment share, BE
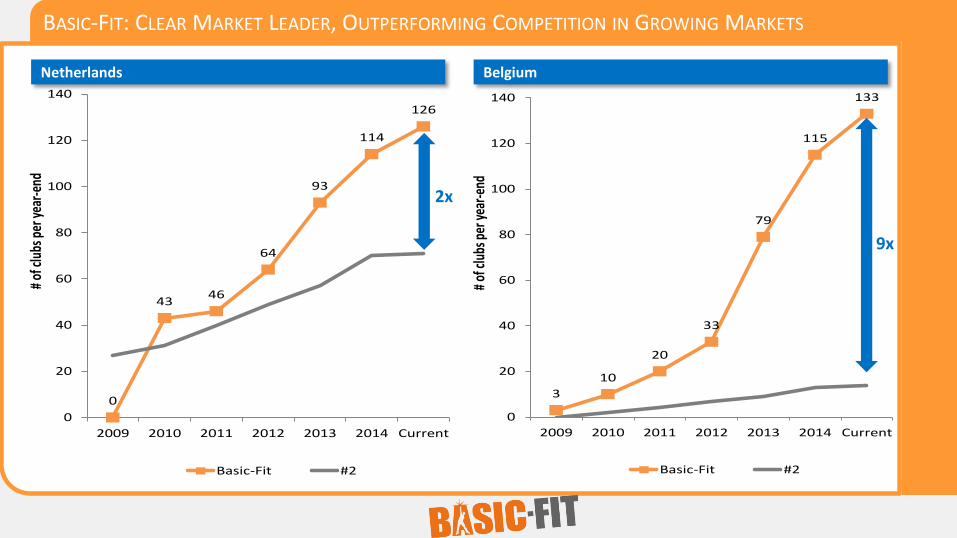
0
4346
64
93
114
126
0
20
40
60
80
100
120
140
2009 2010 2011 2012 2013 2014 Current
# of
club
s per
yea
r-en
d
Basic-Fit #2
3
10
20
33
79
115
133
0
20
40
60
80
100
120
140
2009 2010 2011 2012 2013 2014 Current
# of
club
s per
yea
r-end
Basic-Fit #2
BASIC-FIT: CLEAR MARKET LEADER, OUTPERFORMING COMPETITION IN GROWING MARKETS
Netherlands Belgium
9x
2x
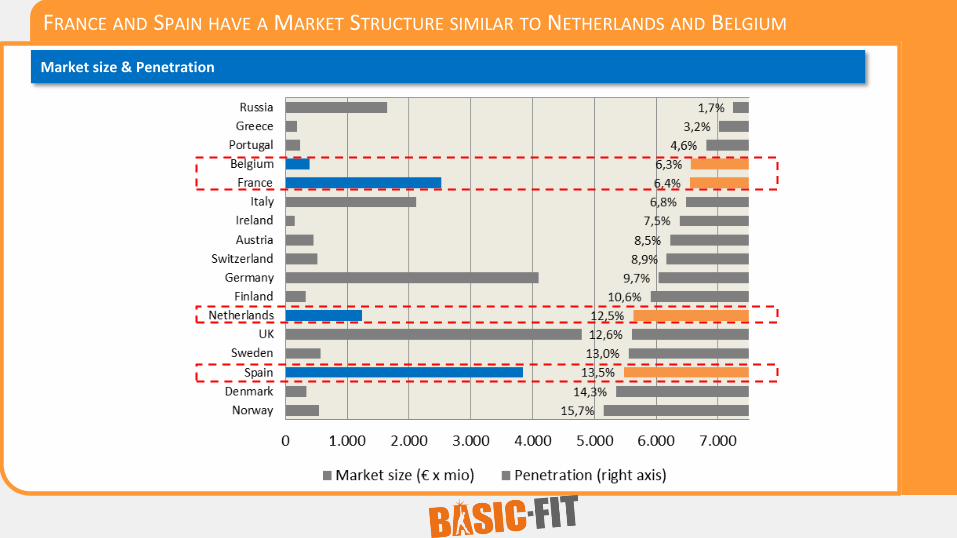
FRANCE AND SPAIN HAVE A MARKET STRUCTURE SIMILAR TO NETHERLANDS AND BELGIUM
Market size & Penetration
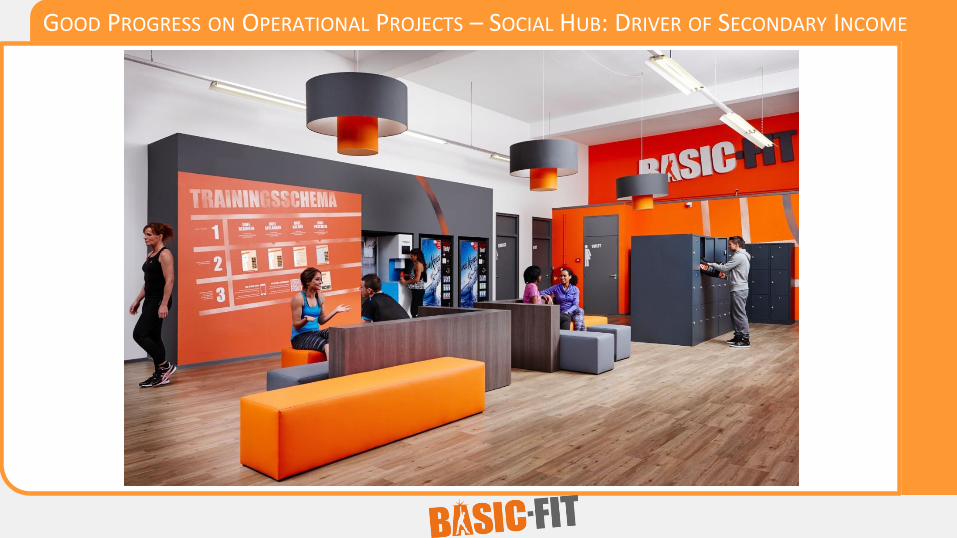
GOOD PROGRESS ON OPERATIONAL PROJECTS – SOCIAL HUB: DRIVER OF SECONDARY INCOME
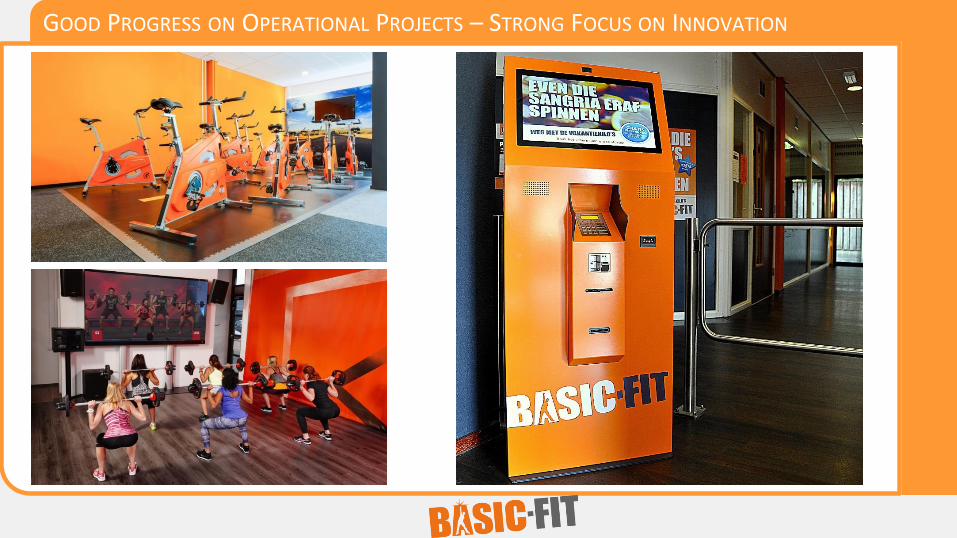
GOOD PROGRESS ON OPERATIONAL PROJECTS – STRONG FOCUS ON INNOVATION

OUTLOOK: CONTINUED INTERNATIONAL GROWTH
2010 December 2013 Mid term target
Sale
s, E
BIT
DA
, nr
of
gym
s, n
r o
f m
emb
ers…
Today / 2015
Basic-Fit acquired 28 clubs NL, BEL
3i entry 199 clubs NL, BEL, FR, SP
Today 300 clubs NL, BEL, LUX
market leader FR, SP: emerging
Mid term potential >500 clubs in NL,
BEL, LUX, FR, SP Potential for new
countries


![VENTURE CAPITAL FOR SUSTAINABILITY 2007 REPORT [2007] Venture Capital... · growing sector as Venture Capital for Sustainability ... Venture Capitalists’ stake in ... Venture Capital](https://img.pdfslide.us/doc/110x75/5a7926b77f8b9a00168dc540/venture-capital-for-sustainability-2007-2007-venture-capitalgrowing-sector.jpg)