Embed Size (px)
Citation preview
Privacy & market concentration: Intended & unintended
consequences of the GDPR
Garrett A. Johnson, Scott K. Shriver, & Samuel G. Goldberg∗
March 20, 2020
Abstract
We show that the European Union’s General Data Protection Regulation (GDPR) reduced data
sharing online, but had the unintended consequence of increasing market concentration among web
technology vendors. We collect panel data on the web technology vendors selected by more than 27,000
top websites internationally. The week after the GDPR’s enforcement, website use of web technology
vendors for EU users falls by 15%. Websites are more likely to drop smaller vendors, which increases
the relative concentration of the vendor market by 17%. Increased concentration predominantly arises
among vendors that use personal data such as cookies, and from the increased relative shares of Facebook
and Google-owned vendors, but not from website requests to process personal data. This suggests that
increases in concentration are driven by website vendor choices rather than changes in user behavior.
Keywords: Privacy, GDPR, Competition, Web technology
∗Johnson: Questrom School of Business, Boston University <[email protected]>; Shriver: Leeds School of Business, Uni-versity of Colorado – Boulder <[email protected]>; Kellogg: School of Management, Northwestern University<[email protected]>. We gratefully acknowledge the financial support of the Marketing ScienceInstitute. We thank Sam Goldberg, Avi Goldfarb, Ginger Jin, Laura Kornish, Jura Liaukonyte, Rob Porter, Liad Wagman andRan Zhuo for helpful discussions.

1 Introduction
Academics and policymakers worry that privacy regulation could harm competition. Large firms could
have more technical and financial resources to comply with regulation (Brill, 2011; Phillips, 2019). Further,
where regulations require consent for personal data processing, large firms could leverage firm recognition
to more easily obtain individual consent (Campbell et al., 2015). We suggest that policies limiting business-
to-business data sharing could also benefit large firms. Potential business partners could favor large vendors
because they may offer a better product or better regulatory compliance, thereby limiting legal risk. In this
paper, we provide novel empirical evidence of these tradeoffs between privacy and competition policy.
We examine website choices of web technology vendors in response to the European Union (EU) enforcing
the General Data Protection Regulation (GDPR). Europe’s GDPR serves as a model for privacy regulation
in Brazil, Japan, South Korea and several American states. These state-level regulations, like the California
Consumer Privacy Act, may herald privacy regulation at the federal level. Despite this policy momentum,
a growing literature reveals unintended consequences of privacy policy. Privacy policy can slow technology
diffusion (Miller and Tucker, 2009, 2017; Adjerid et al., 2016) and even increase data breaches (Miller and
Tucker, 2011). The GDPR coincided with lower venture capital investment for EU technology firms (Jia
et al., 2019), lower recorded web traffic and revenue (Goldberg et al., 2019; Aridor et al., 2020), but no
change in Internet network interconnectivity (Zhuo et al., 2019). If privacy policy harms competition, this
compounds concerns about market power in the economy (Council of Economic Advisors, 2016; Berry et al.,
2019).
Both privacy and competition concerns are acute in web technology. We define web technology as
vendors that provide support services to websites, including: raising ad revenue, hosting audiovisual content,
measuring visitor activity, and facilitating social media sharing. Web technology is an area of concern
for EU privacy regulators because of its large-scale personal data processing (Commission Nationale de
l’Informatique et des Libertés, 2019; Information Commissioner’s Office, 2019b). Web technology’s largest
companies—Google and Facebook—capture 56% of global digital advertising spend (WARC, 2019), and
draw privacy and competition scrutiny from regulators on both sides of the Atlantic.
Online web technology interactions provide an opportunity to measure the otherwise opaque data transfers
between firms that the GDPR seeks to limit. When users visit a website, their browsers also interact with the
third-party domains of web technology vendors and often share user identifiers (e.g. stored on cookies) that
the GDPR considers to be personal data. We exploit this behavior in our data collection, which periodically
crawls a sample of websites and directly observes their web technology vendor usage. We examine a panel
of over 27,000 websites drawn from the top 2,000 sites in each EU country, the US, Canada and globally.
1

We browse each site throughout 2018 using a specialized tool to record web technology vendor interactions,
which yields an initial set of over 375,000 website-vendor ties. By viewing the data through an economic
lens, we complement computer science research documenting the GDPR’s impact on web technology (e.g.
Libert et al., 2018; Sørensen and Kosta, 2019).
We find that the GDPR restricts website use of web technology vendors, while increasing the relative
concentration among web technology vendors. The GDPR creates a steep but short-lived 15% drop in
website-vendor relationships, which return to pre-GDPR levels by the end of 2018. We focus on the short
run impact where the drop in website-vendor relationships is largest, because EU regulators have since
criticized industry practices and intend to regulate the industry in 2020 (CNIL 2019; ICO 2019b). Though
we do not observe market conduct (e.g. pricing) of web technology vendors, we document changes to the
market structure of the industry. We find that relative market concentration increases 17% in aggregate in
the short run, implying that the GDPR most reduces the market shares of small web technology vendors.
Concentration also increases in the top four web technology categories that comprise 94% of categorized
vendor ties: advertising, web hosting, audience measurement, and social media. Concentration is pronounced
among web technology vendors that process personal information, so that personal data collection also
becomes more concentrated after the GDPR. We find that concentration does not depend on whether websites
elicit consumer consent for data processing, implying that website rather than user choices drive increases in
concentration. Finally, we show that website choices entrench Google and Facebook, whose web technology
offerings drive increased concentration.
Our study adds to a broader economic literature documenting the unintended consequences of legisla-
tion designed to promote consumer health or welfare. Prior studies have documented how restrictions on
advertising led to increased market concentration in markets for cigarettes (Eckard JR., 1991; Gallet, 1999;
Clark, 2007) and alcohol (Sass and Saurman, 1995). As with studies of restrictions on information flows from
firms to consumers, we find anti-competitive effects from restrictions on information flows from consumers
to firms. The rest of the paper explains the GDPR policy, then describes the data, empirical strategy, and
results.
2 GDPR Background
The European Union’s General Data Protection Regulation (GDPR) regulates the processing of personal
data of EU residents. The regulation applies to both EU firms and non-EU firms that target EU residents.
Though passed in April 2016, the GDPR delayed its enforcement until May 25, 2018 to allow stakeholders
to adjust. GDPR fines can reach 4% of a firm’s annual global revenue.
2

Though the GDPR is a multifaceted regulation, many of its elements support the key principle of data
minimization: firms must limit the personal data that they process (collect and use). Firms are explicitly
required to audit internal data processes, encrypt and anonymize personal data, and notify affected individ-
uals and the regulator in the event of a data breach. Firms are also responsible for respecting the new data
rights of EU residents under the GDPR, including the rights to: access personal data, correct data, erase
data, transfer data and object to data processing. In sum, the GDPR incentivizes firms to limit personal
data processing by increasing both its associated operational cost and legal liability.
EU regulators clarified in 2019 that "consent" is the most appropriate of the GDPR’s legal bases for
web technology vendors to process personal data for affiliated websites (Information Commissioner’s Office,
2019b). Under GDPR, personal data includes identifiers like cookies and IP addresses used in web technology.
Valid consent under the GDPR requires that individuals opt in to data processing, and that consent notices
must list both the purposes of data processing (e.g., for advertising or site analytics) and all third parties
processing the data. In 2018, most websites that sought consent did so by asking users to either click "OK" to
accept all disclosed data processing, or by clicking "More Options" to opt out of specific usage categories or
usage by specific third parties. The ICO, the UK’s privacy authority, deems the industry’s de facto opt-out
approach to be non-compliant because declining data processing should be as easy as accepting (Information
Commissioner’s Office, 2019a).
3 Data
3.1 Data description
We collect panel data on the web technology vendors employed by thousands of top websites to study the
GDPR’s impact on the web technology industry. Websites rely on inputs from specialized vendors to pro-
vide various services. For instance, many websites engage "audience measurement" vendors to record user
site visits and generate statistics on user characteristics, onsite activities, and referral channels. Websites
can choose the category’s dominant vendor—Google Analytics—and/or competitors like Adobe Audience
Manager. When a user visits a website, their browser interacts with third-party domains owned by those
vendors: google-analytics.com (Google) and/or demdex.net (Adobe). By recording these third-party do-
main interactions, we can observe whether the website employs Google Analytics, Adobe Audience Manager,
both, or neither.
We collect third-party domain data using the "webxray" tool developed by Libert (2019) and first used
in Libert (2015). For each website in our panel, webxray opens an instance of the Chrome browser and
3

records all interactions with third-party domains. Third-party cookies are the best known form of third-
party domain interactions, but webxray also records third-party domain interactions arising from http and
Javascript requests. To capture the experience of an EU user, we use a VPN service to represent the browser
as originating from France. Note that webxray does not interact with the website in any way, so we measure
web technology vendor interactions arising without user consent.
To construct our sample, we use Amazon’s Alexa service to identify the top 2,000 websites in each of the
28 EU countries as well as in each of the US, Canada and globally. These lists overlap such that our panel
includes 28,227 unique sites. For our baseline, we collect data in the two days leading up to the GPDR’s
enforcement deadline. Similar data in WhoTracks.me (2018) and Sørensen and Kosta (2019) suggests that
website use of third-party domains was relatively stable leading up to the deadline. Beginning on the May
25 deadline, we collect data weekly for six weeks, bi-weekly for the next six weeks, then every four weeks
through the end of 2018.
As Libert (2015) explains, webxray sometimes fails to scan a site. When this happens, we make at least
three attempts to scan the site. Note that 3.25% of sites never scan, perhaps because the sites block VPN
users or potential bots. For the remaining 27,311 sites, the panel is 96.36% complete.
3.2 Vendor classification
A central challenge in measuring concentration is to appropriately define the market. We define markets by
classifying web technology vendors into broad purposes like advertising and audience measurement. Mea-
suring market concentration requires not only classifying vendors by purpose, but also linking third-party
domains to vendors. To solve both challenges, we use a third-party domain database by Libert (2019).1 This
database clarifies when vendors use a third-party domain without the vendor’s name and when vendors use
multiple third-party domains. For instance, Google’s advertising category offering uses the doubleclick.net
domain (a past acquisition) and the 2mdn.net domain.
The Libert (2019) database groups vendors into nine categorizes. By unique vendors in our data, the
top categories are advertising (165 vendors), hosting (25), audience measurement (24), and social media
(11). The "advertising" category includes full service ad vendors (e.g. Google Marketing Platform/Ad
Manager, Xandr) and different ad intermediaries. These include ad exchanges (e.g. OpenX, Index Exchange);
demand side platforms (The Trade Desk, AdForm); supply side platforms (Rubicon, PubMatic); and data
management platforms (Oracle Bluekai, Lotame). "Social media" includes social platforms like Facebook1We re-label some categories and omit the subcategories of the "hosting" category: "general", "code", "font", and "video."
We combine Google’s ad vendor offering ("Google Marketing Platform/Ad Manager") as well as its video offering ("GoogleVideo/YouTube"). We combine "TrustArc" & "TRUSTe" (a rebranding) and "Are You a Human" & "Distill Network" (a 2017merger).
4
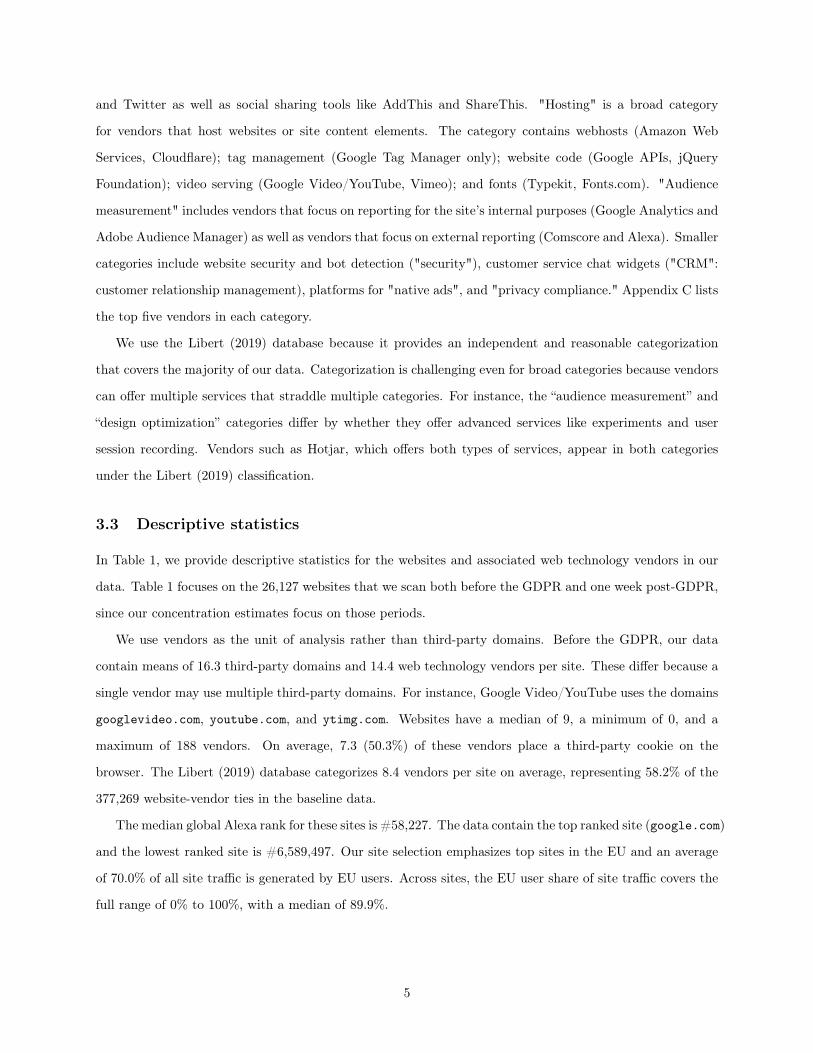
and Twitter as well as social sharing tools like AddThis and ShareThis. "Hosting" is a broad category
for vendors that host websites or site content elements. The category contains webhosts (Amazon Web
Services, Cloudflare); tag management (Google Tag Manager only); website code (Google APIs, jQuery
Foundation); video serving (Google Video/YouTube, Vimeo); and fonts (Typekit, Fonts.com). "Audience
measurement" includes vendors that focus on reporting for the site’s internal purposes (Google Analytics and
Adobe Audience Manager) as well as vendors that focus on external reporting (Comscore and Alexa). Smaller
categories include website security and bot detection ("security"), customer service chat widgets ("CRM":
customer relationship management), platforms for "native ads", and "privacy compliance." Appendix C lists
the top five vendors in each category.
We use the Libert (2019) database because it provides an independent and reasonable categorization
that covers the majority of our data. Categorization is challenging even for broad categories because vendors
can offer multiple services that straddle multiple categories. For instance, the “audience measurement” and
“design optimization” categories differ by whether they offer advanced services like experiments and user
session recording. Vendors such as Hotjar, which offers both types of services, appear in both categories
under the Libert (2019) classification.
3.3 Descriptive statistics
In Table 1, we provide descriptive statistics for the websites and associated web technology vendors in our
data. Table 1 focuses on the 26,127 websites that we scan both before the GDPR and one week post-GDPR,
since our concentration estimates focus on those periods.
We use vendors as the unit of analysis rather than third-party domains. Before the GDPR, our data
contain means of 16.3 third-party domains and 14.4 web technology vendors per site. These differ because a
single vendor may use multiple third-party domains. For instance, Google Video/YouTube uses the domains
googlevideo.com, youtube.com, and ytimg.com. Websites have a median of 9, a minimum of 0, and a
maximum of 188 vendors. On average, 7.3 (50.3%) of these vendors place a third-party cookie on the
browser. The Libert (2019) database categorizes 8.4 vendors per site on average, representing 58.2% of the
377,269 website-vendor ties in the baseline data.
The median global Alexa rank for these sites is #58,227. The data contain the top ranked site (google.com)
and the lowest ranked site is #6,589,497. Our site selection emphasizes top sites in the EU and an average
of 70.0% of all site traffic is generated by EU users. Across sites, the EU user share of site traffic covers the
full range of 0% to 100%, with a median of 89.9%.
5
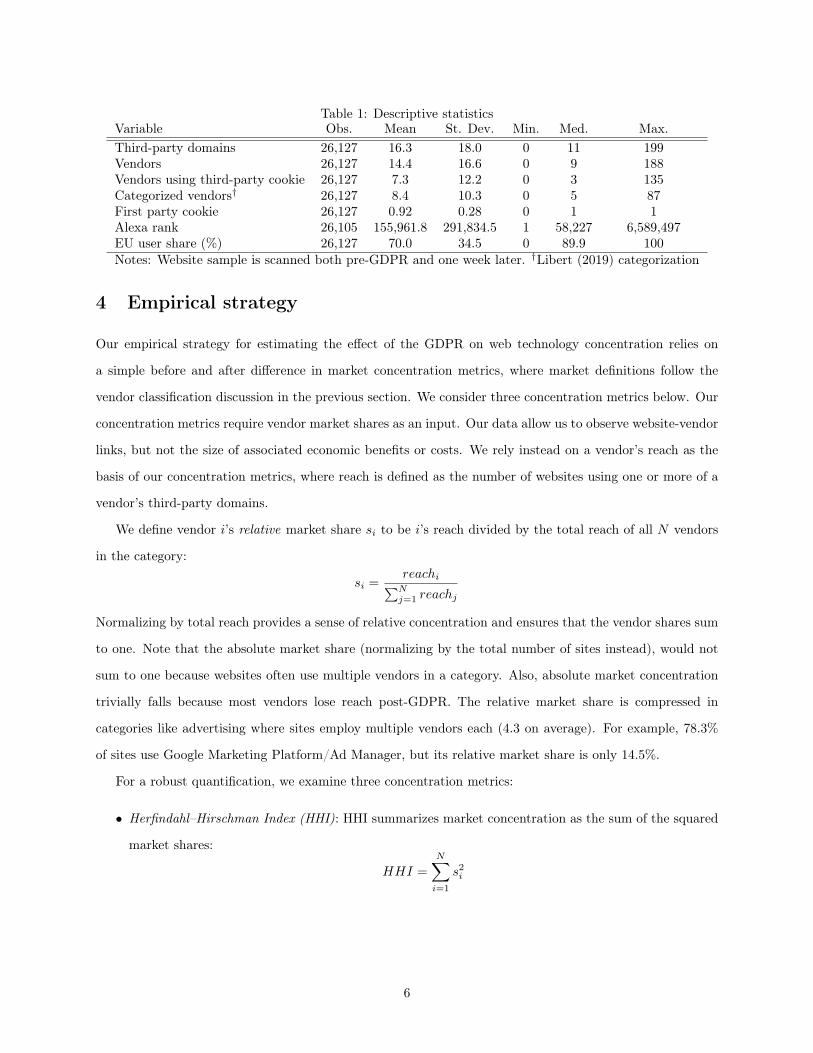
Table 1: Descriptive statisticsVariable Obs. Mean St. Dev. Min. Med. Max.Third-party domains 26,127 16.3 18.0 0 11 199Vendors 26,127 14.4 16.6 0 9 188Vendors using third-party cookie 26,127 7.3 12.2 0 3 135Categorized vendors† 26,127 8.4 10.3 0 5 87First party cookie 26,127 0.92 0.28 0 1 1Alexa rank 26,105 155,961.8 291,834.5 1 58,227 6,589,497EU user share (%) 26,127 70.0 34.5 0 89.9 100Notes: Website sample is scanned both pre-GDPR and one week later. †Libert (2019) categorization
4 Empirical strategy
Our empirical strategy for estimating the effect of the GDPR on web technology concentration relies on
a simple before and after difference in market concentration metrics, where market definitions follow the
vendor classification discussion in the previous section. We consider three concentration metrics below. Our
concentration metrics require vendor market shares as an input. Our data allow us to observe website-vendor
links, but not the size of associated economic benefits or costs. We rely instead on a vendor’s reach as the
basis of our concentration metrics, where reach is defined as the number of websites using one or more of a
vendor’s third-party domains.
We define vendor i’s relative market share si to be i’s reach divided by the total reach of all N vendors
in the category:
si =reachi∑Nj=1 reachj
Normalizing by total reach provides a sense of relative concentration and ensures that the vendor shares sum
to one. Note that the absolute market share (normalizing by the total number of sites instead), would not
sum to one because websites often use multiple vendors in a category. Also, absolute market concentration
trivially falls because most vendors lose reach post-GDPR. The relative market share is compressed in
categories like advertising where sites employ multiple vendors each (4.3 on average). For example, 78.3%
of sites use Google Marketing Platform/Ad Manager, but its relative market share is only 14.5%.
For a robust quantification, we examine three concentration metrics:
• Herfindahl–Hirschman Index (HHI): HHI summarizes market concentration as the sum of the squared
market shares:
HHI =
N∑i=1
s2i
6

• Concentration ratios (CR): The total market shares of the top M firms:
CR (M) =
M∑i=1
si
• Head-to-head win rate: We propose a simple metric to quantify which vendor sites are more likely to
drop. In particular, conditioning on websites that drop one of two vendors they employed prior to the
GDPR, we quantify how often the sites drop each vendor. We examine the win rate of each category’s
dominant vendor to provide an intuitive explanation for changes in concentration.
HHI is our primary concentration metric due to its simplicity and broad use by regulators. We complement
HHI with concentration ratios and head-to-head win rates as the latter metrics can be more intuitive. The
United States Department of Justice and Federal Trade Commission (US Department of Justice and the
Federal Trade Commission, 2010) use HHI to evaluate proposed horizontal mergers. HHI uses market shares
on a 0 to 100 scale as an input, so that HHI varies from 0 (perfectly competitive) to 10,000 points (monopoly).
For instance, a market with an equal duopoly would have HHI = 502 + 502 = 5, 000 points. Though some
models of competition (e.g. Cournot) link market structure to market conduct, we do not observe conduct
like pricing, so we restrict our analysis to market structure.
We emphasize that we measure relative concentration. As we will see, vendors fall on average in all but
one web technology category. We seek to measure whether websites favor vendors with large or small ex-ante
market shares when websites limit vendors. In other words, we measure whether the larger vendors get a
bigger slice of the smaller pie. Note that both the HHI and CR metrics are invariant if all vendors fall by
the same percentage.
5 Results
5.1 GDPR impact on web technology vendors
We begin by showing how website use of web technology vendors evolves over 2018. Figure 1 plots our
regression estimates for this evolution.2 We see that average web technology vendor use drops sharply after
GDPR enforcement on May 25, 2018 (denoted by the vertical red line). Vendor use reaches its minimum2Figure 1 plots the estimates of the fixed effects regression
yit = β0 +
T∑t=1
βt ·GDPRt + θi + εit
where yit is site i’s number of web technology vendors at time t, GDPRt is an indicator for the post-GDPR week t > 0, θi is asite fixed effect, and εit is the error term. Figure 1 plots the pre-GDPR average web technology vendors (β0) and subsequentweeks (β0 + βt), and confidence intervals use the standard error for βt.
7

Figure 1: Evolution of average web technology vendors per EU website
one week later – we refer to the baseline versus one week later comparison as the short-run GDPR impact
estimate. The short-run estimate shows that sites reduce web technology vendors 14.9% from an average of
14.5 to 12.4 vendors. Most of this reduction happens right after the enforcement deadline as the number of
vendors falls 11.0% between the initial scan on May 23-24 and the second scan on May 25-28. This suggests
that most publishers waited until the last minute to adjust the vendors on their site. Though we only
have one directly-collected pre-GDPR observation, in Appendix B we use related data from WhoTracks.me
(2018) to establish a flat pre-trend for 1,322 of our sample sites. Third party vendor usage is steady between
March and April 2018 (+0.04%) and declines only 0.67% in May 2018, which includes nearly a full week
post-enforcement. Results from Sørensen and Kosta (2019) also suggest a relatively stable pre-trend in
third-party domain usage.
Our findings emphasize the short run impact of the GDPR on web technology, where the potential
influence of confounding unobserved trends is minimized. One of our starkest findings is that the short-run
GDPR effect erodes over time: the effect on web technology vendors dissipates by the end of 2018. Two
weeks after the GDPR, web technology vendors increase by 0.85 vendors on average over the previous week
and continue to grow thereafter. The post-GDPR growth in vendors could arise from the web technology
sector’s dynamism, website fear of regulatory penalties falling over time due to a lack of enforcement, or
some other explanation. Given that EU regulators signaled they will intervene in this industry (Information
Commissioner’s Office, 2019b, Commission Nationale de l’Informatique et des Libertés, 2019), we theorize
the maximal impact of the GDPR in 2018 is more indicative of the industry under future enforcement.
8

Table 2 shows the short-run change in web technology vendors by category among the 26,127 sites that we
scan both before the GDPR and one week after. We see that web technology vendors fall 14.5% in the short
run and the subset of categorized vendors falls 17.7% from 8.4 to 6.9. The category-level results in Table 2
reveal that the average number of vendors falls for all but one category in the short run. The exception is
the "privacy compliance" category, which we expect would benefit from the GDPR. However, few sites use
vendors in the privacy compliance category, as these increase from only 0.017 to 0.021 vendors on average.
Advertising is both the largest category and the category that falls the most (24.3%), from 4.35 to 3.29
average vendors. Hosting, audience measurement, and social media are the next largest categories and these
categories fall by 9.7%, 10.9%, and 11.5% respectively. The remaining categories appear infrequently with
means of at most 0.22 vendors per site.
In Appendix A, we provide evidence that the reduction in web technology vendors reflects the technology
supplier decisions of websites. We first show that no vendor of consequence chooses to completely exit the
EU. We identify only 42 websites that block EU users post-GDPR and only 12 of these sites reduce the
number of vendors below 10 in the short run. Finally, we show that sites that request consumer consent
do not block third-party domains, as we see no short run change in sites loading at least one third-party
domain. Sanchez-Rola et al. (2019) also find that third-party domain interactions precede consent.
5.2 GDPR impact on concentration
To examine the effect of the GDPR on market concentration, our empirical strategy focuses on the short-run
comparison of the web technology industry where the GDPR impact was greatest.
Table 2 shows the baseline HHI and concentration ratios for the top two vendors (CR2) in every category.
We see that all categories but advertising and hosting have HHI’s above the 2,500 point threshold that
American regulators define as a “highly concentrated market” (US Department of Justice and the Federal
Trade Commission, 2010). We also compute an aggregate HHI metric among all vendors that ignores
categories. Aggregate HHI is only 146 points and aggregate HHI among all classified vendors is 308 points.
Table 2 only includes a single concentration ratio (CR2), though the total shares of the top two firms exceed
50% in all categories but advertising. Advertising has the lowest HHI (348 points) and CR2 (0.187) because
our relative market reach definition compresses these measures. Advertising contains 165 vendors and sites
use 4.3 ad vendors on average, so that even the dominant vendor (Google Marketing Platform/Ad Manager)
has a relative share of only 14.5% although it reaches 78.3% of sites.
Turning to the GDPR’s short run impact on market structure, Table 2 shows that aggregate HHI increases
17.3% among all vendors and 17.8% among all classified vendors. The top four vendor categories represent
9

Tab
le2:
ShortrunGDPR
impa
cton
concentration
Avg
.vend
ors
HHI
Con
centration
ratio(C
R2)
Head-to-headcompe
tition
Category
Pre
Post
Diff.(%
)Pre
Post
Diff.(%
)Pre
Post
Diff.(%
)W
in(%
)Dom
inan
tfirm
Allvend
ors
14.44
12.35
-14.5%
146
171
17.3%
0.098
0.105
7.0%
Allcategorizedvend
ors†
8.40
6.91
-17.7%
308
363
17.8%
0.168
0.187
11.3%
Adv
ertising
4.35
3.29
-24.3%
348
436
25.3%
0.187
0.217
15.8%
98.9%
Goo
glead
platform
††
Hosting
1.78
1.61
-9.7%
1,892
1,936
2.3%
0.569
0.578
1.7%
74.3%
Goo
gleAPIs
Aud
iencemeasurement
1.25
1.11
-10.9%
4,116
4,355
5.8%
0.697
0.719
3.1%
93.5%
Goo
gleAna
lytics
Social
media
0.79
0.70
-11.5%
4,251
4,412
3.8%
0.775
0.791
2.1%
87.2%
Facebo
okDesignop
timization
0.22
0.20
-10.5%
2,874
2,861
-0.5%
0.720
0.716
-0.6%
50.0%
Hotjar
Security
0.15
0.12
-17.8%
8,926
9,722
8.9%
0.998
0.998
0.0%
94.7%
Cloud
flare
Nativead
s0.078
0.066
-14.8%
4,229
4,024
-4.8%
0.849
0.845
-0.5%
21.7%
Tab
oola
CRM
0.022
0.019
-9.6%
6,408
6,119
-4.5%
0.982
0.980
-0.2%
.Ze
ndeskCha
tPrivacy
compliance
0.017
0.021
23.2%
3,925
4,116
4.9%
0.838
0.865
3.2%
25.0%
TrustArc
Notes:
† Libert(2019)
classification.
††Goo
glead
platform
includ
esGoo
gleMarketing
Platform
&Goo
gleAdMan
ager.
10

94.3% of categorized vendors pre-GDPR, and HHI increases post-GPDR in each of these categories. The
advertising category sees the largest increase in HHI, growing 25.3% from 348 to 436 points. The increase in
HHI among the next three top categories is more moderate: 2.3% in hosting, 5.8% in audience measurement,
and 3.8% in social media. Beyond the top 4 categories, we see mixed results. Design optimization changes
little (-0.5%), whereas HHI in security increases 8.9%. The native ads and CRM categories become less
concentrated: HHI falls -4.8% and -4.5% respectively. Both categories are highly concentrated categories
and so small that they represent only 1.1% of total categorized vendor reach. The increase in HHI in the
advertising category (25.3%) is proportional to the decrease in the average number of vendors (24.3%), though
this relationship is less than proportional in the remaining categories. Several categories see HHI increases
near or above the 100 point threshold that American regulators use to scrutinize mergers: advertising gains
88 points, audience measurement gains 239 points, social media gains 161 points, and security gains 796
points.
As the total share of the top two firms, CR2 can be a more intuitive metric than HHI. In Table 2, we see
that the sign of the short run change in CR2 reflects the change in HHI in all categories but security, where
the baseline CR2 of 0.988 creates a ceiling effect. In Appendix C, we provide the change in concentration
ratios for different numbers of top firms and we see that the change in concentration ratios generally reflects
the change in HHI until the concentration ratio exceeds 95% of the market. As with HHI, we see the largest
increase in CR2 in the advertising category with a relative increase of 15.9% from a CR2 of 0.187 to 0.217.
For the remaining top 4 categories, the relative increase in CR2 lies between 1.7% and 3.1%. The decreases
in CR2 for design optimization, native ads, and CRM are small at -0.6%, -0.5% and -0.2% respectively.
Finally, Table 2 shows the head-to-head win rate of the dominant firm in each category. Recall that this
metric reflects the probability that a publisher keeps the dominant category vendor over a competitor post-
GDPR, conditional on employing both vendors pre-GDPR. The top 4 categories suggest that the increase in
concentration is in part a story of Google and Facebook’s dominance in this metric. In advertising, Google
Ad Manager wins an exceptional 98.9% of these head-to-head battles. Google also wins in hosting (Google
APIs) 74.3% of the time and in audience measurement (Google Analytics) 93.5% of the time. For its part,
Facebook wins 87.2% of its head-to-head battles in social media. Further down the category list, we see
that the dominant firm’s win rate helps to explain the change in HHI. Hotjar wins only half of its head-
to-head battles in the design optimization category, which helps explain why the category’s HHI is flat. In
the security category, Cloudfare wins 94.7% of the time, which helps to explain why that category sees the
second largest increase in HHI. Taboola wins only 21.7% of the time in the native ads category, which helps
to explain why that category sees a 5.2% reduction in HHI.
In sum, the GDPR coincided with a short run increase in aggregate web technology concentration. While
11
market concentration does not always follow data minimization, the largest web technology categories become
more concentrated. Many of these categories are highly concentrated initially and several categories exhibit
significant increases in concentration both relative to the underlying change in category use and relative to
the 100 point threshold that regulators use to scrutinize mergers. Three different concentration metrics paint
a consistent picture of these results. Appendix D considers a second third-party domain classification scheme
by Karaj et al. (2018), which broadly replicates our findings. WhoTracks.me (2018) also show that small ad
vendors fall by more than top vendors among the top 2,000 EU sites the month after GDPR. Appendix E
shows that the evolution in aggregate concentration mirrors the evolution in average vendor use through the
end of 2018. Though aggregate HHI returns to pre-GDPR levels, concentration in the advertising category
remains at 6.3% higher than the pre-GDPR baseline.
5.3 Extensions
Below, we consider three extensions that reexamine changes in aggregate concentration by cutting the data
in three different ways.
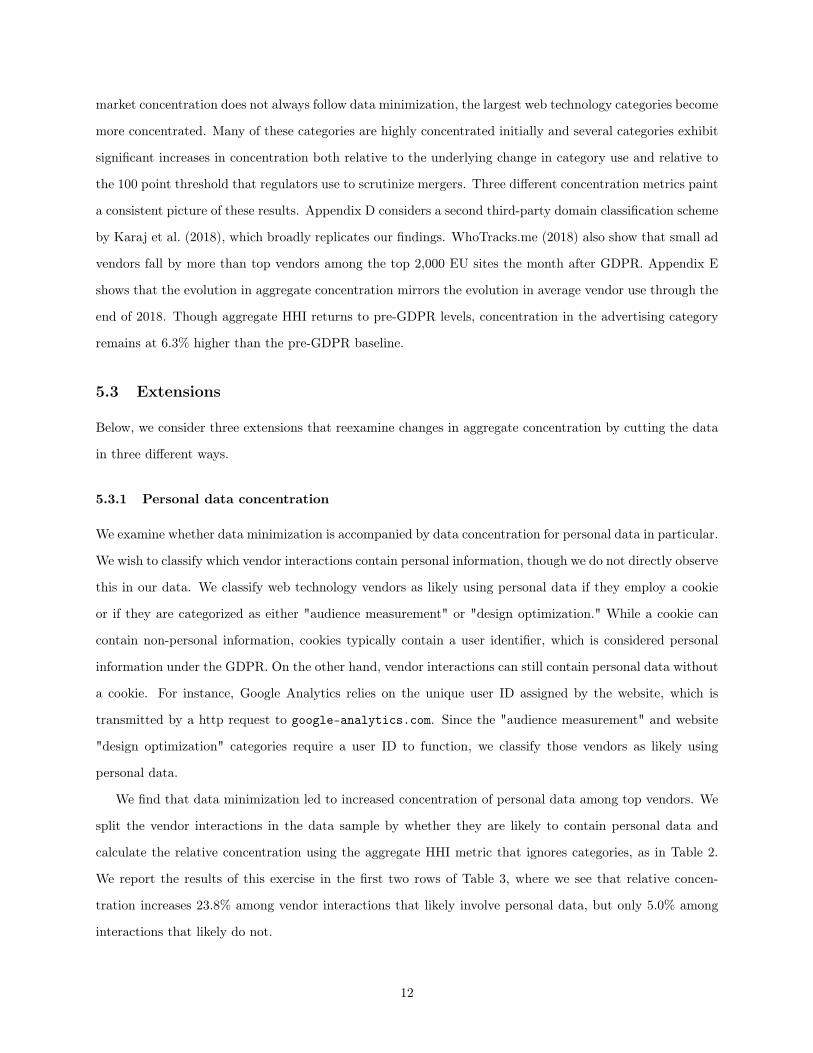
5.3.1 Personal data concentration
We examine whether data minimization is accompanied by data concentration for personal data in particular.
We wish to classify which vendor interactions contain personal information, though we do not directly observe
this in our data. We classify web technology vendors as likely using personal data if they employ a cookie
or if they are categorized as either "audience measurement" or "design optimization." While a cookie can
contain non-personal information, cookies typically contain a user identifier, which is considered personal
information under the GDPR. On the other hand, vendor interactions can still contain personal data without
a cookie. For instance, Google Analytics relies on the unique user ID assigned by the website, which is
transmitted by a http request to google-analytics.com. Since the "audience measurement" and website
"design optimization" categories require a user ID to function, we classify those vendors as likely using
personal data.
We find that data minimization led to increased concentration of personal data among top vendors. We
split the vendor interactions in the data sample by whether they are likely to contain personal data and
calculate the relative concentration using the aggregate HHI metric that ignores categories, as in Table 2.
We report the results of this exercise in the first two rows of Table 3, where we see that relative concen-
tration increases 23.8% among vendor interactions that likely involve personal data, but only 5.0% among
interactions that likely do not.
12

Table 3: GDPR & aggregate concentration: Three extensionsHHI
Data samples Pre Post Diff. Diff. (%)
Role of personal dataLikely personal data 187.0 231.5 44.5 23.8%Unlikely personal data 360.0 378.1 18.1 5.0%Role of consentSites with privacy extension 100.1 117.9 17.8 17.8%Sites without privacy extension 153.6 179.4 25.8 16.8%Role of top 2 companies (Google & Facebook)All vendors 145.7 171.0 25.2 17.3%All but top 2 companies 46.0 43.2 -2.8 -6.2%
The pool of online personal data thus became more concentrated in the hands of the largest vendors,
which is another unintended consequence of the GDPR. To the extent that vendors can generate value from
personal data, data concentration can further strengthen the market position of large vendors.
5.3.2 Consent
Past work has theorized a role for user privacy consent in increasing market concentration (Campbell et al.,
2015). Under the GDPR, websites should obtain user consent for sharing personal data with vendors and
list all these vendors. As a result, websites may reduce the number of listed vendors and favor large vendors
familiar to consumers. Although sites may create their own systems to process user consent, many sites
adopt third party consent management platforms (CMPs) in an effort to comply with the GDPR. Using
data from builtwith.com described in Appendix A.2, we split the sample by whether sites implemented
a known consent management platform (7.1% of sites) by the week after the GDPR. In rows 3 and 4 of
Table 3, we report that the relative increase in concentration is similar whether the site implements a CMP
(17.8%) or not (16.8%). We therefore conclude consent-related effects have limited influence on our market
concentration results.
5.3.3 Google & Facebook
We provide more evidence that Google-owned vendors and Facebook play an important role in increasing
relative market concentration. These two companies dominate digital advertising, collecting 56% of global
spending (WARC, 2019). In our pre-GDPR baseline, Google’s many vendors represent 28.8% of all website-
vendor pairs and Facebook represents 3.4%. The companies top the four largest web technology categories
and Table 2 shows that sites keep the dominant vendor over a competitor the majority of the time post-
GDPR.
The final two rows (5 and 6) of Table 3 compare the pre/post-GDPR change in aggregate HHI with and
13

without the big two companies. Row 5 of Table 3 replicates the “all vendor” aggregate HHI measures in
Table 2, showing that relative vendor concentration among all vendors rises 17.3% from an HHI of 146 to 171.
The final row excludes the big two companies from the HHI measures, revealing that relative concentration
falls 6.2% in their absence (from 46 to 43). Note also that HHI is much lower without the big two companies,
because the remaining vendors have smaller relative market shares even without the dominant companies.
This difference arises because Google-owned vendors grow from 28.8% to 31.9% of site-vendor pairs in the
short run and Facebook grows from 3.4% to 3.6%.
Despite relative market share gains, the absolute position of the two companies is weaker after the GDPR.
The share of sites working with each top vendor falls one week post-GDPR: Google Marketing Platform/Ad
Manager falls from 62.8% to 57.2% of sites, Google APIs falls from 55.6% to 50.9%, Google Analytics falls
from 78.3% to 72.0%, and Facebook falls from 49.8% to 45.0%.
Google’s ad platform plays an important role in the advertising category, which has the greatest increase
in concentration. Google did not join the industry standard (IAB Europe, 2018) for sharing user consent
choices. These dueling standards put pressure on publishers to choose between Google’s ad platform or
the rest of the industry. From Table 2, we see that websites retained Google over another competing
vendor in 98.9% of such choices. Though abstaining from the industry standard may have increased Google’
relative share of the ad market, the British regulator also criticized the industry standard approach as being
inadequate (Information Commissioner’s Office, 2019b).
6 Conclusion
This paper provides novel empirical evidence of a potential tradeoff between privacy regulation and market
concentration. We study the EU’s GDPR, which serves as a global model for privacy policy. We examine
the web technology industry, which attracts attention both for its permissive privacy practices and its
high concentration. We examine over 27,000 top websites with a baseline of over 375,000 website-vendor
ties. We show that websites reduce their web technology vendor use by 15% immediately after the GDPR
enforcement deadline in response to the GDPR’s data minimization mandate, but these compliance gains
erode over time. In the short run, we see that concentration increases 17% in aggregate and in each of the
top four web technology categories that together represent 94% of website-vendor ties: advertising, hosting,
audience measurement, and social media.
In evaluating the GDPR, we see that the policy initially succeeded in its data minimization goal in the
data-intensive web technology industry. Though these gains eroded over time, renewed criticism of the indus-
try by EU regulators (Information Commissioner’s Office, 2019b, Commission Nationale de l’Informatique
14
et des Libertés, 2019) potentially signals future reductions in the industry. Despite data minimization suc-
cesses, the GDPR had the unintended consequence of increasing the industry’s relative concentration. We
show that this tradeoff between data minimization and concentration is not mechanical: some niche cate-
gories become less concentrated. However, relative concentration increases in the top web technology vendor
categories that represent most of the industry. The increase in concentration is highest among the web
technology vendors that process the personal data, which the GDPR targets. Though requiring consumer
consent could favor large vendors, the increase in concentration appears to be independent of consent. In-
stead, our evidence suggests that concentration increases because websites were more likely to drop smaller
vendors. As policymakers wrestle with how to protect individual privacy, they should balance the risk of
increasing concentration of personal data ownership and increasing market power. More research is needed
to determine how policymakers could mitigate these unintended policy consequences.
This paper shows how market structure evolves post-GDPR, but ignores market conduct. Future research
can further explore the consequences of greater relative concentration for market conduct such as vendor
pricing. Vendor revenue and cost data would further elucidate the economic magnitude of the concentration
effect. For instance, if ad vendors with greater reach are associated with greater ad revenue share, then our
findings could understate the increase in concentration. Defining the market remains a central challenge for
measuring market concentration. Our current classification scheme employs broad categories. For instance,
the advertising category contains subcategories like ad exchanges, demand side platforms, and supply side
platforms. From the perspective of evaluating the impact on competition, investigating these subcategories
may provide further insight into the role of privacy regulation.
For regulators examining competition in technology industries, the GDPR presents nuanced effects. Most
web technology vendors—including Google and Facebook—are worse off post-GDPR in that they lose website
partners. However, the relative market shares of the largest vendors—particularly Google and Facebook—
increase post-GDPR. This does not itself imply anti-competitive conduct by the large vendors. Rather, our
evidence suggests that increased relative concentration results from website choices and not from vendor or
user choices. We speculate that increased concentration could simply result from the large vendors offering
a better product or better compliance with the regulation.
References
Adjerid, I., A. Acquisti, R. Telang, R. Padman, and J. Adler-Milstein (2016). The impact of privacy regulation
and technology incentives: The case of health information exchanges. Management Science 62 (4), 1042–
1063.
15
Aridor, G., Y.-K. Che, W. Nelson, and T. Salz (2020). The economic consequences of data privacy regulation:
Empirical evidence from gdpr. Available at SSRN .
Berry, S., M. Gaynor, and F. Scott Morton (2019). Do increasing markups matter? lessons from empirical
industrial organization. Journal of Economic Perspectives 33 (3), 44–68.
Brill, J. (2011). The intersection of consumer protection and competition in the new world of privacy.
Competition Policy International 7, 7–313.
Campbell, J., A. Goldfarb, and C. Tucker (2015). Privacy regulation and market structure. Journal of
Economics & Management Strategy 24 (1), 47–73.
Clark, C. R. (2007). Advertising restrictions and competition in the children’s breakfast cereal industry. The
Journal of Law and Economics 50 (4), 757–780.
Commission Nationale de l’Informatique et des Libertés (2019, June). Online targeted advertisement: what
action plan for the CNIL?
Council of Economic Advisors (2016). Economic report of the president. Technical report.
Eckard JR., E. W. (1991). Competition and the cigarette tv advertising ban. Economic Inquiry 29 (1),
119–133.
Gallet, C. A. (1999). The effect of the 1971 advertising ban on behavior in the cigarette industry. Managerial
and Decision Economics 20 (6), 299–303.
Goldberg, S., G. Johnson, and S. Shriver (2019). Regulating privacy online: The early impact of the GDPR
on european web traffic & e-commerce outcomes. Available at SSRN 3421731 .
IAB Europe (2018, March). GDPR transparency and consent framework.
Information Commissioner’s Office (2019a, July). Guidance on the use of cookies and similar technologies.
Technical report.
Information Commissioner’s Office (2019b, June 20). Update report into adtech and real time bidding.
Technical report.
Jia, J., G. Z. Jin, and L. Wagman (2019). The short-run effects of GDPR on technology venture investment.
SSRN.
Karaj, A., S. Macbeth, R. Berson, and J. M. Pujol (2018). Whotracks.me: Monitoring the online tracking
landscape at scale. CoRR abs/1804.08959.
16
Libert, T. (2015). Exposing the hidden web: An analysis of third-party http requests on one million websites.
International Journal of Communication.
Libert, T. (2019). https://webxray.org/.
Libert, T., L. Graves, and R. K. Nielsen (2018). Changes in third-party content on european news websites
after GDPR.
Miller, A. R. and C. Tucker (2009). Privacy protection and technology diffusion: The case of electronic
medical records. Management Science 55 (7), 1077–1093.
Miller, A. R. and C. Tucker (2017). Privacy protection, personalized medicine, and genetic testing. Man-
agement Science 64 (10), 4648–4668.
Miller, A. R. and C. E. Tucker (2011). Encryption and the loss of patient data. Journal of Policy Analysis
and Management 30 (3), 534–556.
O’Connor, J. (2019, March). https://verifiedjoseph.com/.
Phillips, N. (2019, July 27). Keep it: Maintaining competition in the privacy debate. Remarks for Internet
Governance Forum.
Sanchez-Rola, I., M. Dell’Amico, P. Kotzias, D. Balzarotti, L. Bilge, P.-A. Verviker, and I. Santos (2019).
Can I opt out yet? GDPR and the global illusion of cookie control. In ACM ASIACCS 2019.
Sass, T. R. and D. S. Saurman (1995). Advertising restrictions and concentration: The case of malt beverages.
The Review of Economics and Statistics 77 (1), 66–81.
Sørensen, J. and S. Kosta (2019). Before and after GDPR: The changes in third party presence at public
and private european websites. In The World Wide Web Conference, WWW ’19, New York, NY, USA,
pp. 1590–1600. ACM.
US Department of Justice and the Federal Trade Commission (2010, August). Horizontal merger guidelines.
http://www.ftc.gov/os/2010/08/100819hmg.pdf.
WARC (2019). Internet in decline beyond google and facebook.
WhoTracks.me (2018). GDPR - what happened?
Zhuo, R., B. Huffaker, k. claffy, and S. Greenstein (2019, October). The impact of the General Data
Protection Regulation on internet interconnection. Working paper.
17
Appendix
A Compliance approaches
A.1 Vendor compliance
Our data indicates that the observed reduction in web technology vendors post-GDPR reflects publisher
rather than vendor decisions. Web technology vendors like Kargo, Verve, Drawbridge, and Factual—most
of which provide mobile ad services—indicated that they were exiting the EU as a result of the GDPR.
Nonetheless, no vendor of consequence drops out of our data after the GDPR.
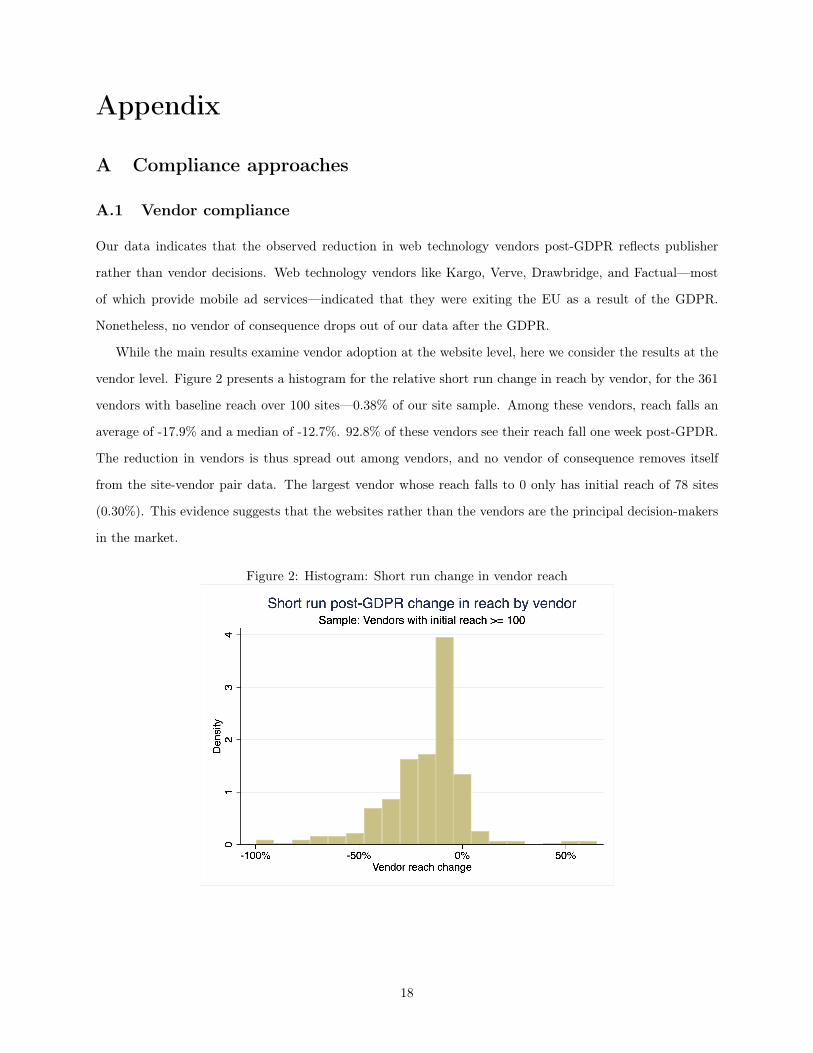
While the main results examine vendor adoption at the website level, here we consider the results at the
vendor level. Figure 2 presents a histogram for the relative short run change in reach by vendor, for the 361
vendors with baseline reach over 100 sites—0.38% of our site sample. Among these vendors, reach falls an
average of -17.9% and a median of -12.7%. 92.8% of these vendors see their reach fall one week post-GPDR.
The reduction in vendors is thus spread out among vendors, and no vendor of consequence removes itself
from the site-vendor pair data. The largest vendor whose reach falls to 0 only has initial reach of 78 sites
(0.30%). This evidence suggests that the websites rather than the vendors are the principal decision-makers
in the market.
Figure 2: Histogram: Short run change in vendor reach
18

A.2 Website compliance
The GDPR creates unusual challenges for empirical investigation because the regulation can potentially
affect both the data collection process and the underlying data generating process (Goldberg et al., 2019).
Of particular interest is the role of user consent compliance and its potential to censor the automated
collection of data. Since our data collection process does not interact with sites, all third-party domain
(3PD) interactions in our data arise without consent, implying that consent compliance mechanisms could
introduce empirical measurement issues.
We explore the role of consent compliance on our concentration measures by augmenting our sample
with data from builtwith.com, which tracks website adoption of known consent management platforms
(CMPs). Using data from builtwith.com from August 2019, we find that only 24.4% of sites in our sample
at some point employ a third-party consent management platform, and only 7.1% of sites do so by July
4, 2018. However, regardless of CMP usage, sites in our sample do not appear to wait for consent before
initiating interactions with third parties. We see no reduction in sites that load zero 3PD content among
sites using CMP’s by July 4, 2018. Instead, we see no change (s.e. .0011) in sites with zero third parties –
in other words, the change in 3PD is all on the intensive margin. The surprising irrelevance of consent is
supported by Sanchez-Rola et al. (2019), who found that 92% of the sites they scan in July 2018 set at least
one identifier cookie without consent. Further, only 4% of sites provide a clear cookie opt-out option and
only 2.5% of sites erase cookies after opt-ing out.
We further examine the incidence of sites blocking users as a compliance strategy, which could also have
implications for measurement. Though some sites block EU users post-GDPR, this approach is rare in our
data. We compare our sites to a list of 1,361 blocking sites compiled by O’Connor (2019), and only 13 of
these sites appear in our list of 27K scanned sites. We found another 29 blocking sites in our data manually,
by visiting sites with unusual post-GDPR changes. Notably, only 12 of the 42 blocking sites reduce vendors
to fewer than 10 vendors by the week post-GDPR. Only 21 of these sites reduced their 3PD at all in this
period. The 12 blocking sites of interest include chicagotribune.com and latimes.com, which reduced 3PD
from 55 and 63 to a single third-party domain post-GDPR (their parent company’s domain).
In sum, neither consent compliance nor user blocking appears to be a significant concern for our data
collection process in terms of observing site-vendor relationships.
19
B Pre-GDPR trend in web technology vendor usage
We use external data from WhoTracks.me (2018) to examine the trend in web technology use prior to GDPR
enforcement. We do not see evidence of anticipatory compliance in these data.
WhoTracks.me (2018) released public data on the monthly web technology use of the 1,500 top EU
websites beginning in March 2018. Karaj et al. (2018) describe the data collection methodology, which
employs a large panel of consumers to measure third party domain usage on websites. Karaj et al. (2018)
argue that their approach has several advantages, such as extensive sampling coverage of consumer browser
and operating system set-ups, as well as the ability to view non-public websites (e.g., sites requiring user
authentication). However, the WhoTracks.me (2018) data is dynamically selected because it evolves with the
composition and preferences of its participating users, complicating site-level inference. The WhoTracks.me
(2018) data includes the third party vendors associated with the top 1500 sites, as determined by their panel
of users residing in the EU. Although these top sites vary over time, a complete panel is available for 1,452
sites between March 2018 and December 2018. We analyze the 1,322 sites (91.0%) that also appear in our
sample data.3 Karaj et al. (2018) also map third-party domains into vendors (referred to as “trackers”)
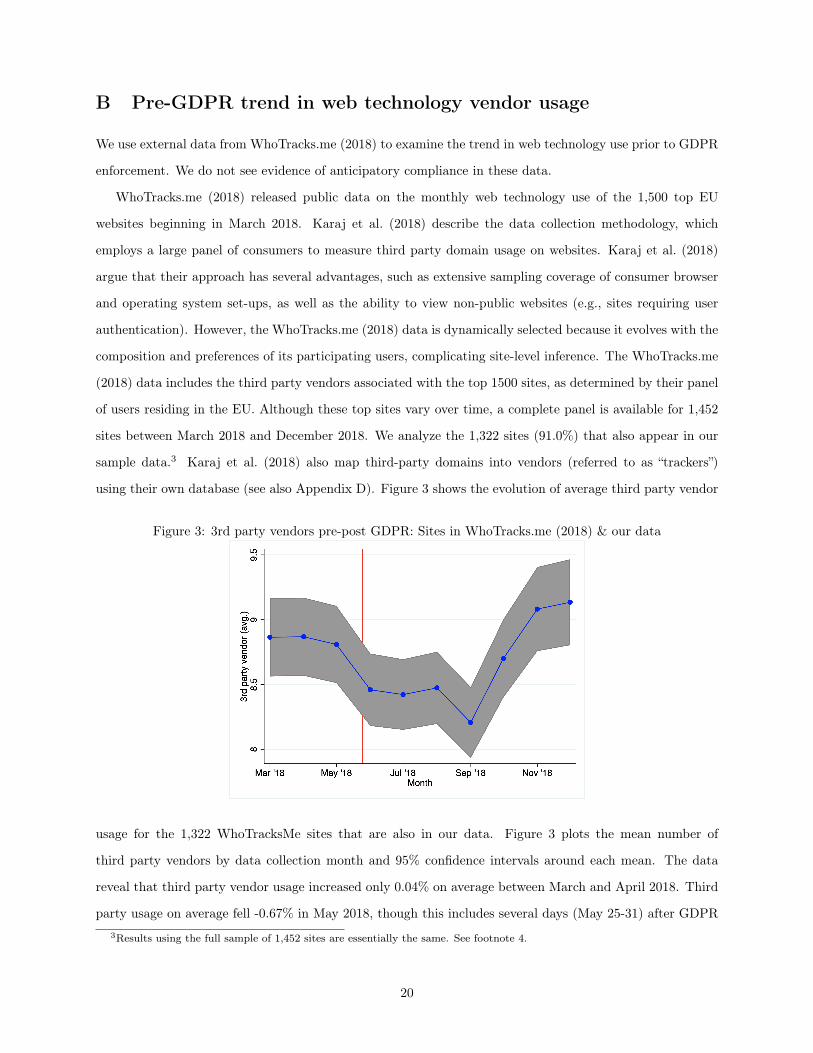
using their own database (see also Appendix D). Figure 3 shows the evolution of average third party vendor
Figure 3: 3rd party vendors pre-post GDPR: Sites in WhoTracks.me (2018) & our data
usage for the 1,322 WhoTracksMe sites that are also in our data. Figure 3 plots the mean number of
third party vendors by data collection month and 95% confidence intervals around each mean. The data
reveal that third party vendor usage increased only 0.04% on average between March and April 2018. Third
party usage on average fell -0.67% in May 2018, though this includes several days (May 25-31) after GDPR3Results using the full sample of 1,452 sites are essentially the same. See footnote 4.
20
enforcement.4 Thus, the WhoTracks.me (2018) data suggests a flat pre-trend in third party usage leading
up to enforcement, which is also supported by Sørensen and Kosta (2019). Post-GDPR, Figure 3 shows a
similar trend to Figure 1 as the number of vendors increases to pre-GDPR levels by the end of 2018.
To summarize, we do not find evidence of a pre-GDPR trend in web technology vendor use, which is
consistent with sites delaying compliance until the May 25th enforcement deadline.
C Top vendors & concentration ratios
We explore the top firms in the nine Libert (2019) vendor categories and examine how their cumulative
market shares evolve post-GDPR. Table 4 below lists the top five firms in each category as well as the
number of vendors per category.
To further unpack the changes in HHI, we examine the changes concentration ratios. The concentration
ratio is the total market share of the top M companies in the category. For instance, CR4 gives the total
market share of the top 4 firms in the category. We see that the changes in CR(M) are typically the same sign
as the change in HHI: this is by construction, but concentration ratios provide a more intuitive explanation.
In Table 5, we show the short run change in concentration ratios for the top {1, 2, 3, 4, 5, 8, 10} firms.
Note that not all categories have sufficient firms to fill out the table.
D Robustness: WhoTracksMe classification
We rely on an independent categorization of third-party vendors by Libert (2019). However, we also consider
a second vendor categorization which we refer to "WhoTracksMe" after the project developed by Karaj et al.
(2018). The WhoTracksMe project is a large-scale monitoring initiative for online tracking. WhoTracksMe
defines the equivalent of the advertising and audience measurement/website analytics categories more broadly
so that these categories include an average of 6.9 and 1.9 vendors rather than 4.3 and 1.3 vendors respectively.
The closest equivalent to the webxray hosting category is the content delivery network (CDN) and hosting
categories in Karaj et al. (2018), which collectively have the same average size of 1.8 vendors per site. Karaj
et al. (2018) also has a social media category, but this excludes Facebook as Karaj et al. (2018) instead
classified Facebook as advertising. The Karaj et al. (2018) social media category thus has only 0.2 rather
than the 0.8 vendors on average in Libert (2019). Note that the baseline average vendors is slightly lower
under the WhoTracksMe classification: 14.1 vendors in Table 6 versus 14.4 in Table 2. This difference arises
from defining uncategorized third-party domains as separate vendors and because WhoTracksMe categorizes4For the full sample of 1,452 sites, the number of third party vendors rises by only 0.08% in April and falls -0.63% in May.
21

Tab
le4:
Web
techno
logy
categories
&topvend
ors
Top
Ven
dors
Category†
Ven
dors
#1
#2
#3
#4
#5
Adv
ertising
165
Goo
glead
platform
††Xan
der
AdF
orm
The
Trade
Desk
Rub
icon
Project
Hosting
25Goo
gleAPIs
Goo
gleTag
Man
ager
Amazon
Web
Services
Cloud
flare
Goo
gleVideo/Y
ouTub
e
Aud
ienc
emeasurement
24Goo
gleAna
lytics
Hotjar
ScorecardR
esearch
Ado
beAud
ienc
eMan
ager
Qua
ntcast
Social
med
ia11
Faceb
ook
Add
This
ShareThis
Designop
timization
8Hotjar
New
Relic
Optim
izely
Visua
lWeb
site
Optim
izer
Crazy
Egg
Nativead
s4
Tab
oola
Outbrain
nscontext.eu
Con
tentStream
Secu
rity
3Cloud
flare
DistilNetworks
Kno
wnsec
CRM
3Zen
desk
Cha
tliveperson.ne
tSa
lesforce
Privacy
complianc
e3
TrustArc
Evido
niuben
da
Notes:Ven
dorrank
ingba
sedon
pre-GDPR
baseline
.†Libert(201
9)classification
.††Goo
glead
platform
includ
esGoo
gleMarketing
Platform
&Goo
gleAdMan
ager.
22

Table 5: Short run change in concentration ratiosDifference in Concentration Ratios
Category† CR1 CR2 CR3 CR4 CR5 CR8 CR10Advertising 0.0293 0.0297 0.0314 0.0299 0.0300 0.0302 0.0325Hosting 0.0043 0.0097 0.0096 0.0058 0.0028 0.0026 0.0018Audience measurement 0.0207 0.0218 0.0189 0.0130 0.0006 0.0004 0.0009Social media 0.0132 0.0162 0.0090 0.0091 0.0085 0.0000 -0.0001Design optimization 0.0042 -0.0046 -0.0039 -0.0026 0.0001Security 0.0428 -0.0004Native ads -0.0354 -0.0046 -0.0003CRM -0.0262 -0.0019Privacy compliance 0.0248 0.0268Notes: †Libert (2019) classification.
more of the vendors in the data.
Our concentration results are broadly robust to the WhoTracksMe classification in Table 6. The aggregate
increase in relative HHI is higher for both all vendors (22.3%) andWhoTracksMe categorized vendors (23.5%).
The WhoTracksMe classification results replicate the increase in HHI for advertising (29.0%), audience
measurement/website analytics (6.7%) and hosting (5.1% for CDN and 0.1% for hosting). However, the
social media HHI declines slightly (-0.5%), which confirms that Facebook plays a critical role in increasing
HHI in the Libert (2019) social media category. As with the Table 2, the picture outside of these top
categories is more mixed as several small vendor categories exhibit a decrease in HHI. Still, the top three
categories here represent 84.6% of categorized vendors and the social media category represents an additional
1.8%.
E Post-GDPR evolution of concentration
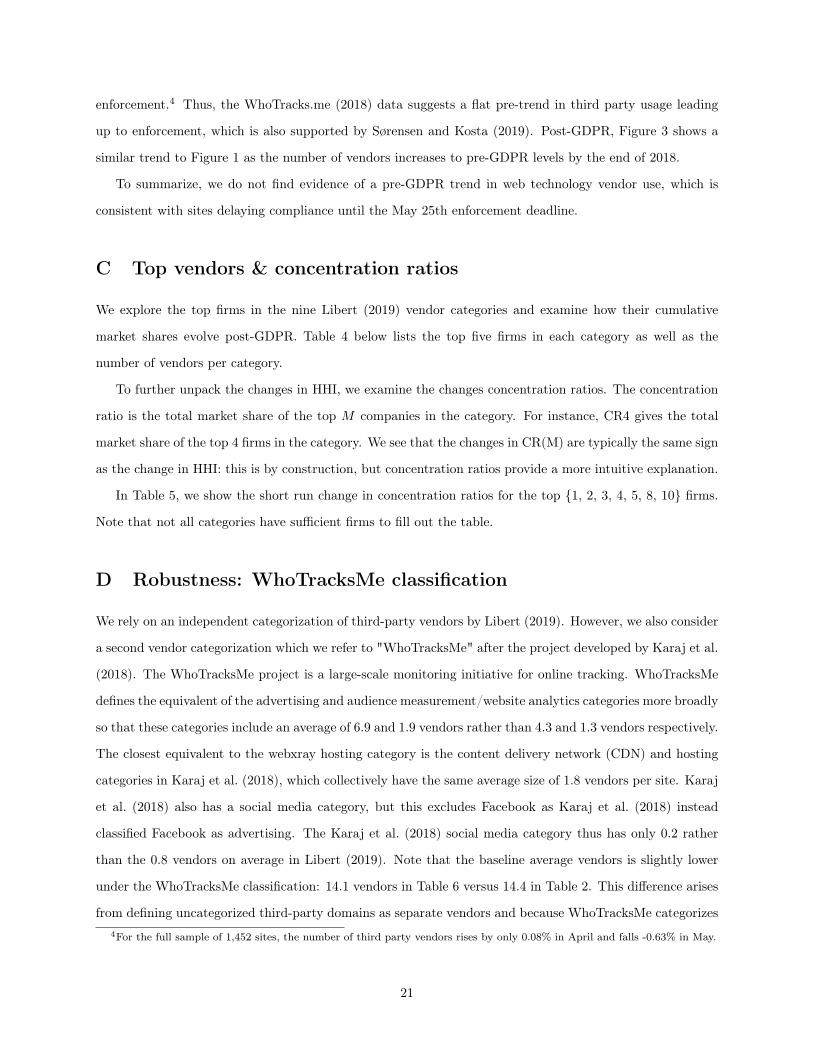
The GDPR’s impact on concentration follows its impact on web technology vendors. Figure 4 plots the
evolution in relative concentration over 2018, as measured by aggregate HHI. Aggregate HHI ignores category
information and defines the relative share as vendor reach over total vendor reach. Aggregate HHI is 146
points before the GDPR and HHI reaches its maximum one week post-GDPR. As with average vendor
use, Figure 4 reveals that web technology concentration returns to its pre-GDPR level by the end of 2018.
Figure 4 shows that the evolution of aggregate HHI over time is the mirror image of the evolution of the
average number of vendors in Figure 1. We see that both the post-GDPR increase in concentration and its
relationship with average vendors persist.
Our concentration findings emphasize the short-run impact of the GDPR, though here we also examine
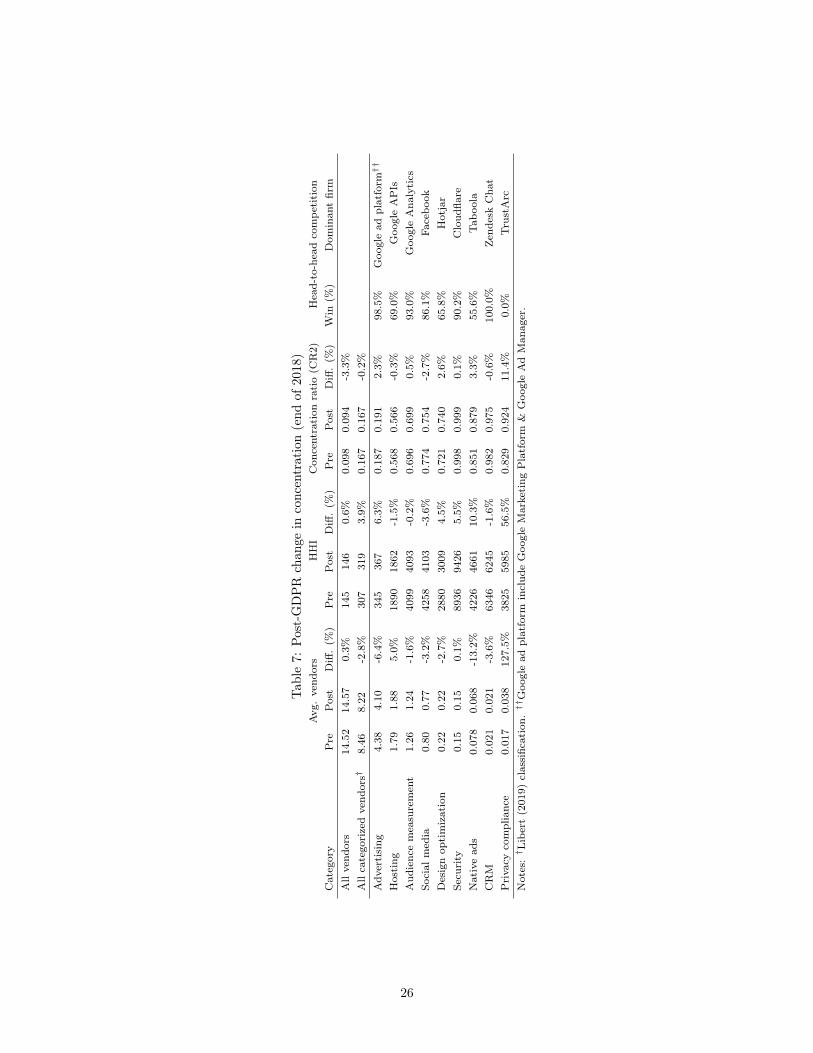
concentration levels at the end of 2018. Table 7 explores the change in concentration by category 28 weeks
23

Tab
le6:
Rob
ustness:
GDPR
impa
cton
concentrationusingW
hoTracksM
eclassification
Avg
.vend
ors
HHI
Con
centration
ratio(C
R2)
Head-to-headcompe
tition
Category
Pre
Post
Diff.(%
)Pre
Post
Diff.(%
)Pre
Post
Diff.(%
)W
in(%
)Dom
inan
tfirm
Allvend
ors
14.10
12.04
-14.6%
185
226
22.3%
0.137
0.158
15.6%
Allcategorizedvend
ors†
12.26
10.42
-15.0%
244
302
23.5%
0.157
0.183
16.2%
Adv
ertising
6.90
5.55
-19.6%
282
364
29.0%
0.182
0.21
920.7%
95.4%
Goo
glead
platform††
Website
analytics
1.85
1.64
-11.4%
1,903
2,030
6.7%
0.483
0.490
1.4%
94.1%
Goo
gleAna
lytics
Con
tent
deliv
erynetw
ork
1.59
1.50
-5.6%
2,45
92,585
5.1%
0.676
0.69
83.2%
45.1%
Goo
gleAPIs
Essential
0.65
0.62
-3.5%
5,041
4,611
-8.5%
0.764
0.726
-4.9%
67.9%
Goo
gleTag
Man
ager
Miscella
neou
s0.28
0.24
-17.3%
485
403
-17.0%
0.226
0.190
-15.9%
27.6%
Walmart
Social
media
0.22
0.20
-9.4%
3,106
3,091
-0.5%
0.625
0.624
-0.1%
75.9%
Hosting
0.20
0.18
-9.9%
8,385
8,390
0.1%
0.949
0.949
0.0%
88.2%
Amazon
Web
Services
Customer
interaction
0.20
0.17
-10.8%
366
361
-1.3%
0.182
0.168
-8.0%
20.0%
bidr.io
Aud
io-V
isua
lplayer
0.19
0.16
-13.0%
4,070
3,998
-1.8%
0.689
0.673
-2.3%
64.9%
Goo
gleVideo/Y
ouTub
eCom
ments
0.084
0.075
-11.1%
701
731
4.2%
0.250
0.243
-2.7%
0.0%
Yad
roPornv
ertising
0.054
0.048
-10.1%
4,702
4,795
2.0%
0.920
0.917
-0.3%
66.7%
exosrv.com
Notes:† K
araj
etal.(2018)
classification.††Goo
glead
platform
includ
esGoo
gleMarketing
Platform
&Goo
gleAdMan
ager.
24
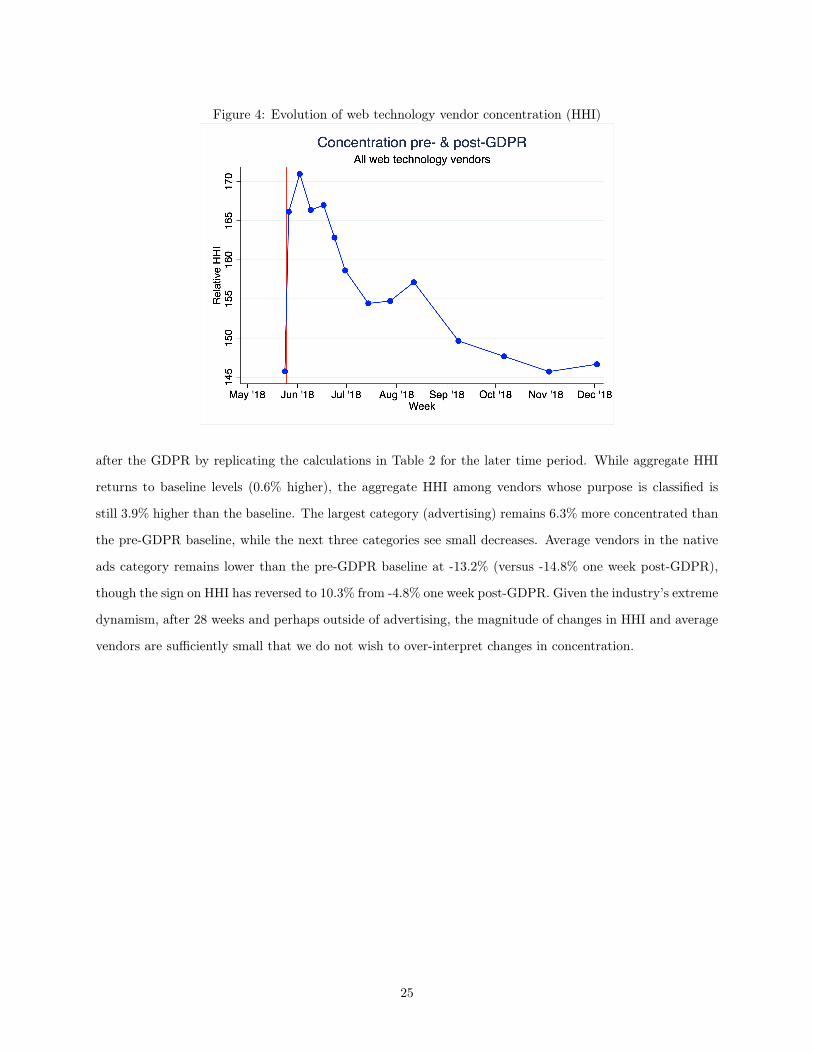
Figure 4: Evolution of web technology vendor concentration (HHI)
after the GDPR by replicating the calculations in Table 2 for the later time period. While aggregate HHI
returns to baseline levels (0.6% higher), the aggregate HHI among vendors whose purpose is classified is
still 3.9% higher than the baseline. The largest category (advertising) remains 6.3% more concentrated than
the pre-GDPR baseline, while the next three categories see small decreases. Average vendors in the native
ads category remains lower than the pre-GDPR baseline at -13.2% (versus -14.8% one week post-GDPR),
though the sign on HHI has reversed to 10.3% from -4.8% one week post-GDPR. Given the industry’s extreme
dynamism, after 28 weeks and perhaps outside of advertising, the magnitude of changes in HHI and average
vendors are sufficiently small that we do not wish to over-interpret changes in concentration.
25
Tab
le7:
Post-GDPR
chan
gein
concentration(end
of2018)
Avg
.vend
ors
HHI
Con
centration
ratio(C
R2)
Head-to-headcompe
tition
Category
Pre
Post
Diff.(%
)Pre
Post
Diff.(%
)Pre
Post
Diff.(%
)W
in(%
)Dom
inan
tfirm
Allvend
ors
14.52
14.57
0.3%
145
146
0.6%
0.098
0.094
-3.3%
Allcategorizedvend
ors†
8.46
8.22
-2.8%
307
319
3.9%
0.167
0.16
7-0.2%
Adv
ertising
4.38
4.10
-6.4%
345
367
6.3%
0.187
0.191
2.3%
98.5%
Goo
glead
platform††
Hosting
1.79
1.88
5.0%
1890
1862
-1.5%
0.568
0.566
-0.3%
69.0%
Goo
gleAPIs
Aud
iencemeasurement
1.26
1.24
-1.6%
4099
4093
-0.2%
0.696
0.699
0.5%
93.0%
Goo
gleAna
lytics
Social
media
0.80
0.77
-3.2%
4258
4103
-3.6%
0.774
0.754
-2.7%
86.1%
Facebo
okDesignop
timization
0.22
0.22
-2.7%
2880
3009
4.5%
0.721
0.740
2.6%
65.8%
Hotjar
Security
0.15
0.15
0.1%
8936
9426
5.5%
0.998
0.999
0.1%
90.2%
Cloud
flare
Nativead
s0.078
0.068
-13.2%
4226
4661
10.3%
0.851
0.879
3.3%
55.6%
Tab
oola
CRM
0.021
0.021
-3.6%
6346
6245
-1.6%
0.982
0.975
-0.6%
100.0%
Zendesk
Cha
tPrivacy
compliance
0.017
0.038
127.5%
3825
5985
56.5%
0.829
0.924
11.4%
0.0%
TrustArc
Notes:† L
ibert(2019)
classification.††Goo
glead
platform
includ
eGoo
gleMarketing
Platform
&Goo
gleAdMan
ager.
26