Embed Size (px)
Citation preview

Ardi AdjiPriadi AsmantoHendratno Tuhiman
WORKING PAPER 47 - 2019
NOVEMBER 2019
PRIORIty REGIONs fOR PREVENtION Of stuNtING

The TNP2K Working Paper Series disseminates the findings of work in progress to encourage discussion and exchange of ideas on poverty, social protection and development issues.
Support to this publication is provided by the Australian Government through the MAHKOTA Program.
The findings, interpretations and conclusions herein are those of the author(s) and do not necessarily reflect the views of the Government of Indonesia or the Government of Australia.
You are free to copy, distribute and transmit this work, for non-commercial purposes.
Suggested Citation: Adji, A., Asmanto, P., Tuhiman, H. Priority Regions for Prevention of Stunting. TNP2K Working Paper 47/2019. Jakarta, Indonesia.
To request copies of this paper or for more information,please contact: [email protected].
The papers are also available at the TNP2K (www.tnp2k.go.id).
tHE NAtIONAL tEAM fOR tHE ACCELERAtION Of POVERty REDuCtIONOffice of the Vice President's SecretariatJl. Kebon Sirih Raya No.14, Jakarta Pusat, 10110
tNP2K Working Paper 47 - 2019November 2019
PRIORIty REGIONs fOR PREVENtION Of stuNtING
Ardi Adji, Priadi Asmanto, Hendratno tuhiman

Priority Regions for Prevention of Stunting
4

Priority Regions for Prevention of Stunting
5
Abstract
One aspect of Indonesia’s health profile that still needs improvement is stunting. In 2018 Indonesia had one of the highest prevalence rates for stunting in the world at 30.8 percent. To achieve the National Medium-Term Development Plan 2015-2019 (Rencana Pembangunan Jangka Menengah Negara: RPJMN) target of a 28 percent stunting rate, in 2018 the government set priority areas for stunting prevention in 100 districts/cities through a program that will be expanded gradually until 2021. This study is intended to provide a technical explanation for the selection of districts/cities and villages/kelurahan as priority areas for stunting prevention. The indicators used in determining priority areas for stunting prevention at the district/city level include: (i) the total number of poor people; (ii) prevalence of stunting in children under the age of five years; and (iii) total number of children under the age of five years with stunting. At the village and kelurahan level, priority areas are determined using indicators adjusted to those used in preparing the index at district and city level, namely: (i) total population; (ii) total poor population; (iii) poverty rate; and (iv) total occurrences of malnutrition. Determination of priority areas uses a weighted average index, at both the district/city level and village/kelurahan level.

Priority Regions for Prevention of Stunting
6
Priority Regions for Prevention of Stunting
7
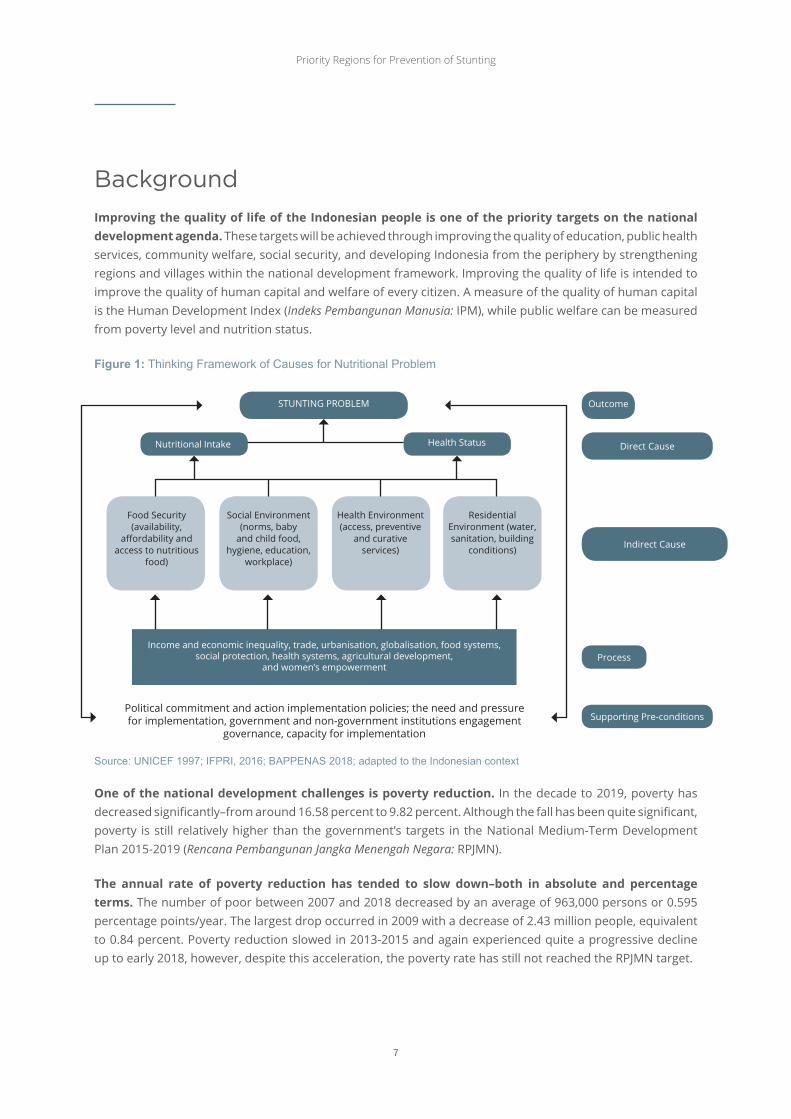
BackgroundImproving the quality of life of the Indonesian people is one of the priority targets on the national development agenda. These targets will be achieved through improving the quality of education, public health services, community welfare, social security, and developing Indonesia from the periphery by strengthening regions and villages within the national development framework. Improving the quality of life is intended to improve the quality of human capital and welfare of every citizen. A measure of the quality of human capital is the Human Development Index (Indeks Pembangunan Manusia: IPM), while public welfare can be measured from poverty level and nutrition status.
Figure 1: Thinking Framework of Causes for Nutritional Problem
STuNTINg PRObleM
Nutritional Intake
Food Security (availability,
affordability and access to nutritious
food)
Social environment (norms, baby
and child food, hygiene, education,
workplace)
Health environment (access, preventive
and curative services)
Residential environment (water, sanitation, building
conditions)
Outcome
Direct Cause
Supporting Pre-conditions
Process
Indirect Cause
Health Status
Income and economic inequality, trade, urbanisation, globalisation, food systems, social protection, health systems, agricultural development,
and women’s empowerment
Political commitment and action implementation policies; the need and pressure for implementation, government and non-government institutions engagement
governance, capacity for implementation
One of the national development challenges is poverty reduction. In the decade to 2019, poverty has decreased significantly–from around 16.58 percent to 9.82 percent. Although the fall has been quite significant, poverty is still relatively higher than the government’s targets in the National Medium-Term Development Plan 2015-2019 (Rencana Pembangunan Jangka Menengah Negara: RPJMN).
The annual rate of poverty reduction has tended to slow down–both in absolute and percentage terms. The number of poor between 2007 and 2018 decreased by an average of 963,000 persons or 0.595 percentage points/year. The largest drop occurred in 2009 with a decrease of 2.43 million people, equivalent to 0.84 percent. Poverty reduction slowed in 2013-2015 and again experienced quite a progressive decline up to early 2018, however, despite this acceleration, the poverty rate has still not reached the RPJMN target.
Source: UNICEF 1997; IFPRI, 2016; BAPPENAS 2018; adapted to the Indonesian context

Priority Regions for Prevention of Stunting
8
Poverty is a factor that disrupts food availability in households, preventing them from meeting nutritional requirements for adequate quality and quantity which, in turn, results in stunted growth and nutritional status.1 The government has undertaken various poverty alleviation programs that target individuals, households, and community groups as beneficiaries, however, there are indications that these programs have not achieved the optimal targets set by the government. The complexity of poverty requires an integrated and coordinated policy intervention (integrated solution). Poverty reduction efforts have, to date, tended to be partial, not properly measured, and some are even unsustainable.
Various short-term shocks affect the dynamics of the poverty rate in Indonesia. Poverty reduction efforts have, therefore, aimed at improving access to basic services, such as education and health. Improving both is expected to have an effect on long-term poverty reduction trends by severing inter-generational poverty.
One of the health factors that needs to be improved is stunting. Children under three years of age who are stunted will not achieve their intellectual potential, making them more vulnerable to illnesses in the future and at risk of reduced productivity and income. International experience shows that stunted children could potentially lose up to 20 percent of their income as adults, resulting in an increase in poverty and a widening of income disparity in the future.
The results of the Riskesdas 2018 study published in November 2018 show an improvement in indicators for nutritional status of children under five years of age, especially in relation to status of stunted children. The stunting prevalence among children under the age of five years declined from 37.2 percent in 2013 to 30.8 percent in 2018. The proportion of malnourished and undernourished children in this age group also declined from 19.6 percent to 17.7 percent while the prevalence of severely underweight and underweight children under the age of five years has improved from 12.1 percent to 10.2 percent. While these improvements are encouraging, there is a need for more robust interventions to accelerate the rates of reduction in these key indicators.
ObjectivesTo achieve the RPJMN 2015-2019 stunting target of 28 percent, in 2018 the government established priority regions for stunting prevention in 100 districts/cities through a program that will be gradually expanded until 2021. This document aims to explain for stakeholders the technical reasons behind the selection of priority districts/cities and villages/kelurahan for stunting prevention. Stunting prevention efforts using an intensity approach are not new. During the New Order period, a poverty reduction approach–known as the Inpres Desa Tertinggal (Presidential Instruction for underdeveloped Villages) program–was implemented to target pockets of poverty. Area-based poverty targeting approaches have not only been applied in Indonesia, but also in several other developing countries, such in China, burkina Faso, India, Turkey, and the Slovak Republic.
1 BAPPENAS 2018, Pedoman Pelaksanaan Intervensi Penurunan Stunting Terintegrasi di Kabupaten/Kota.
Priority Regions for Prevention of Stunting
9
Maximising the implementation of
programs related to stunting in
50 municipalities/cities to coordinate and implement the pillars of
stunting prevention
2018 2019 2020 2021
Maximising the implementation of
programs related to stunting in
160 municipalities/cities to coordinate and implement the pillars of
stunting prevention
Maximising the implementation of
programs related to stunting in
390 municipalities/cities to coordinate and implement the pillars of
stunting prevention
Maximising the implementation of
programs related to stunting in
514 municipalities/cities to coordinate and implement the pillars of
stunting prevention
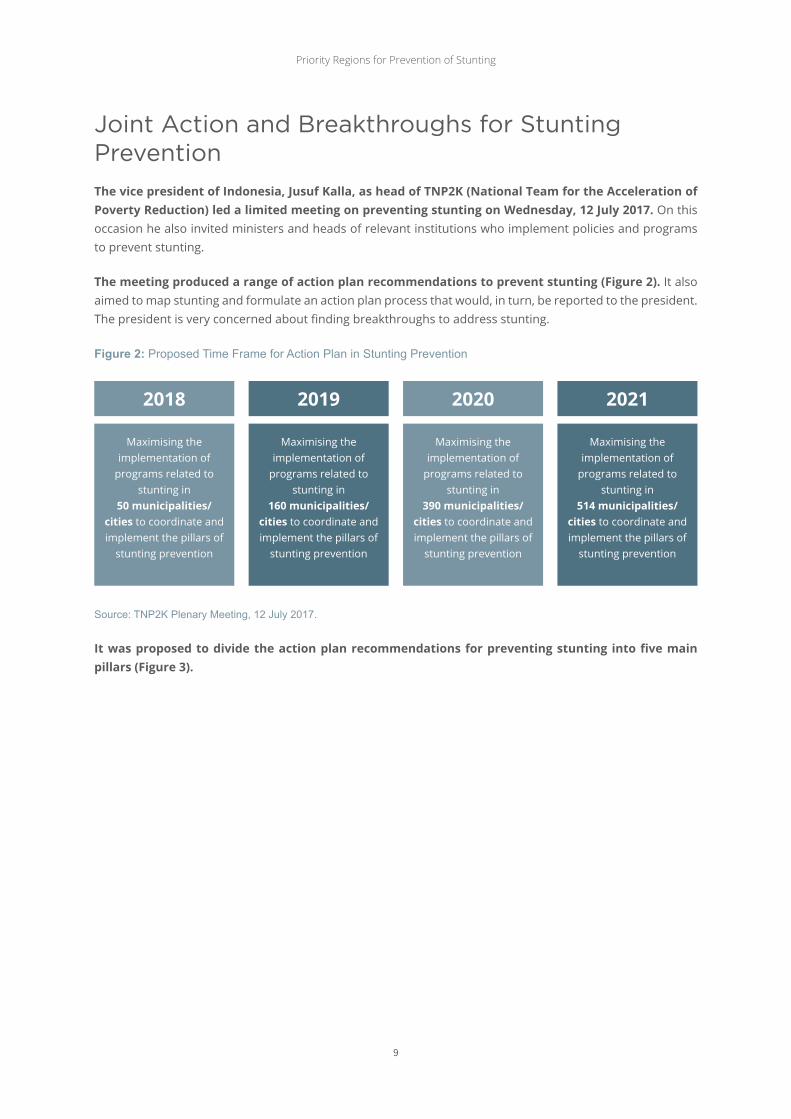
Joint Action and Breakthroughs for Stunting PreventionThe vice president of Indonesia, Jusuf Kalla, as head of TNP2K (National Team for the Acceleration of Poverty Reduction) led a limited meeting on preventing stunting on Wednesday, 12 July 2017. On this occasion he also invited ministers and heads of relevant institutions who implement policies and programs to prevent stunting.
The meeting produced a range of action plan recommendations to prevent stunting (Figure 2). It also aimed to map stunting and formulate an action plan process that would, in turn, be reported to the president. The president is very concerned about finding breakthroughs to address stunting.
Figure 2: Proposed Time Frame for Action Plan in Stunting Prevention
Source: TNP2K Plenary Meeting, 12 July 2017.
It was proposed to divide the action plan recommendations for preventing stunting into five main pillars (Figure 3).

Priority Regions for Prevention of Stunting
10
PIlA
R 1:
Com
mitm
ent a
nd
lead
ersh
ip V
isio
n
Impr
ovin
g sc
ope
of in
terv
entio
n fo
r ta
rget
s of
the
firs
t 1,0
00 d
ays
of li
fe p
rogr
am
STu
NTI
Ng
Nut
ritio
n Co
nsum
ptio
n
Pare
ntin
g Pa
tter
n
Hea
lth S
ervi
ces
envi
ronm
enta
l Hea
lth
• blo
od S
uppl
emen
t Tab
let
(exp
ecta
nt m
othe
rs a
nd
adol
esce
nt g
irls
)• b
reas
tfee
ding
Cou
nsel
ling
and
Prom
otio
n• P
MbA
cou
nsel
ing
and
prom
otio
n• M
acro
nut
rien
t sup
plem
ent
(Pem
beria
n M
akan
an T
amba
han)
• Man
agem
ent o
f Mal
nutr
ition
• gro
wth
Mon
itori
ng a
nd
Prom
otio
n• C
alci
um S
uppl
emen
t• V
itam
in A
Sup
plem
ent
• Zin
c Su
pple
men
t for
Dia
rrhe
a• P
regn
ancy
Che
ck• I
mm
unis
atio
n• M
icro
nutr
ient
Sup
plem
ent
(Tab
uria
)• I
nteg
rate
d M
anag
emen
t of
Illne
ss in
Chi
ldre
n un
der
Five
• Dis
trib
utio
n of
Wor
m M
edic
atio
n
• Cle
an w
ater
and
san
itatio
n• N
on-c
ash
Food
Tra
nsfe
r• N
atio
nal H
ealth
Insu
ranc
e• e
arly
Chi
ldho
od e
duca
tion
• Fam
ily H
ope
Prog
ram
• gui
danc
e fo
r Fa
mili
es w
ith
Child
ren
unde
r Fi
ve Y
ears
of A
ge• S
usta
inab
le F
ood
Hou
se R
egio
n• F
ood
fort
ifica
tion
CON
VeRg
eNCe
IN
TeRV
eNTI
ON
INTe
RVeN
TIO
NO
uTP
uT
INTe
RMeD
IATe
Ou
TCO
Me
IMPA
CT
PIlA
R 2:
Nat
iona
l Cam
paig
n an
d be
havi
oura
l Ch
ange
PIlA
R 3:
Conv
erge
nce
of
Cent
ral,
Regi
onal
, an
d Vi
llage
Pr
ogra
ms
PIlA
R 4:
Food
and
Nut
ritio
n Se
curi
ty
PIlA
R 5:
Mon
itori
ng a
nd
eval
uatio
n
• An
emia
• lo
w b
irth
wei
ght (
bera
t
bada
n la
hir
Rend
ah)
• ex
clus
ive
brea
stfe
edin
g
• D
iarr
hea
• H
elm
inth
iasi
s
• M
alnu
triti
on
Nut
ritio
n In
take
Im
prov
emen
t
Redu
cing
Infe
ctio
n
Figu
re 3
: Con
cept
ual F
ram
ewor
k fo
r Int
egra
ted
Stu
ntin
g R
educ
tion
Inte
rven
tion
Priority Regions for Prevention of Stunting
11
Pillar 1: Commitment and vision of the top leadership of the country. In this pillar, the president/vice president’s commitment is needed to direct relevant ministries/agencies to manage stunting at both the national and sub-national levels by establishing a policy and strategy as well as targets at national and sub-national (both provincial and district/city) levels. It is also necessary to leverage the Secretariat of Sustainable Development goals and the Secretariat of TNP2K as coordination and control institutions for relevant stunting prevention programs.
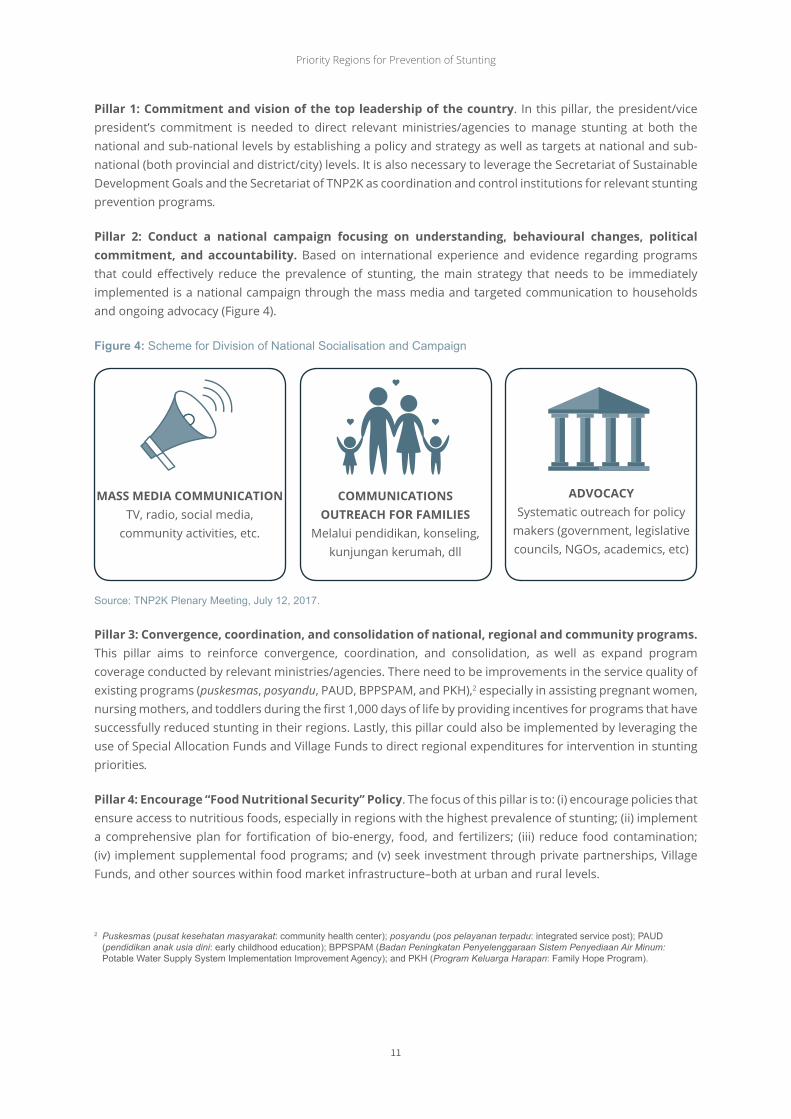
Pillar 2: Conduct a national campaign focusing on understanding, behavioural changes, political commitment, and accountability. based on international experience and evidence regarding programs that could effectively reduce the prevalence of stunting, the main strategy that needs to be immediately implemented is a national campaign through the mass media and targeted communication to households and ongoing advocacy (Figure 4).
Figure 4: Scheme for Division of National Socialisation and Campaign
MAss MedIA COMMuNICATION TV, radio, social media,
community activities, etc.
COMMuNICATIONs OuTReACh FOR FAMIlIes
Melalui pendidikan, konseling, kunjungan kerumah, dll
AdvOCACy Systematic outreach for policy
makers (government, legislative councils, NgOs, academics, etc)
Source: TNP2K Plenary Meeting, July 12, 2017.
Pillar 3: Convergence, coordination, and consolidation of national, regional and community programs. This pillar aims to reinforce convergence, coordination, and consolidation, as well as expand program coverage conducted by relevant ministries/agencies. There need to be improvements in the service quality of existing programs (puskesmas, posyandu, PAuD, bPPSPAM, and PKH),2 especially in assisting pregnant women, nursing mothers, and toddlers during the first 1,000 days of life by providing incentives for programs that have successfully reduced stunting in their regions. lastly, this pillar could also be implemented by leveraging the use of Special Allocation Funds and Village Funds to direct regional expenditures for intervention in stunting priorities.
Pillar 4: encourage “Food Nutritional security” Policy. The focus of this pillar is to: (i) encourage policies that ensure access to nutritious foods, especially in regions with the highest prevalence of stunting; (ii) implement a comprehensive plan for fortification of bio-energy, food, and fertilizers; (iii) reduce food contamination; (iv) implement supplemental food programs; and (v) seek investment through private partnerships, Village Funds, and other sources within food market infrastructure–both at urban and rural levels.
2 Puskesmas (pusat kesehatan masyarakat: community health center); posyandu (pos pelayanan terpadu: integrated service post); PAUD (pendidikan anak usia dini: early childhood education); BPPSPAM (Badan Peningkatan Penyelenggaraan Sistem Penyediaan Air Minum: Potable Water Supply System Implementation Improvement Agency); and PKH (Program Keluarga Harapan: Family Hope Program).

Priority Regions for Prevention of Stunting
12
Pillar 5: Monitoring and evaluation. This last pillar includes monitoring awareness and behavioural change as a result of the stunting national campaign; periodic monitoring and evaluation to ensure the provision and quality of program services in stunting prevention; periodic measurement and publication of results of stunting prevention and annual development of children for accountability; national and sub-national government programs with results-based planning and budgeting; and control of stunting prevention programs.
Selection of Priority Regions for Prevention of Stuntingthinking framework
The results of the stunting action plan should be seen over the medium to long term–more or less within six years. by implementing effective policies and programs in the right regions, it is expected that efforts to manage stunting will reduce its prevalence while also reducing the rate of poverty.
Figure 5: Target for Reducing Prevalence of Stunting and Poverty Rate in 2019
ReDuCINg STuNTINg PReVAleNCe
ReDuCINg POVeRTY RATe
TARGeT RPJMN 2019
28%7%
-8%
Source: 2015-2019 RPJMN.
Joint actions and breakthroughs to prevent stunting serve as the basis for determining priority regions. based on the joint agreement, 100 districts/cities have been selected as priority regions in preventing and reducing stunting. It is hoped that the selection of appropriate regions will significantly reduce the prevalence of stunting. An important argument in determining the priority regions is government budget constraints. It is, therefore, necessary to determine the regions in a way to ensure that the allocated budget is effective and on target to achieve the objective of reducing the incidence of stunting. In addition to reducing the prevalence of stunting, selecting these priority regions is also expected to reduce poverty.
Method for Region selection
selection of priority regions for reducing poverty is through using an approach to determine the priority of region-based interventions, better known as geographical targeting. Priority regions for poverty reduction are selected following those with high rates of stunting, then compiled and determined using two main indicators, namely: (i) prevalence; and (ii) the number of children under the age of five years with stunting. Another indicator used to reflect poverty at the district/city level is the number of poor as a weighting factor.
Priority Regions for Prevention of Stunting
13
Districts and Cities
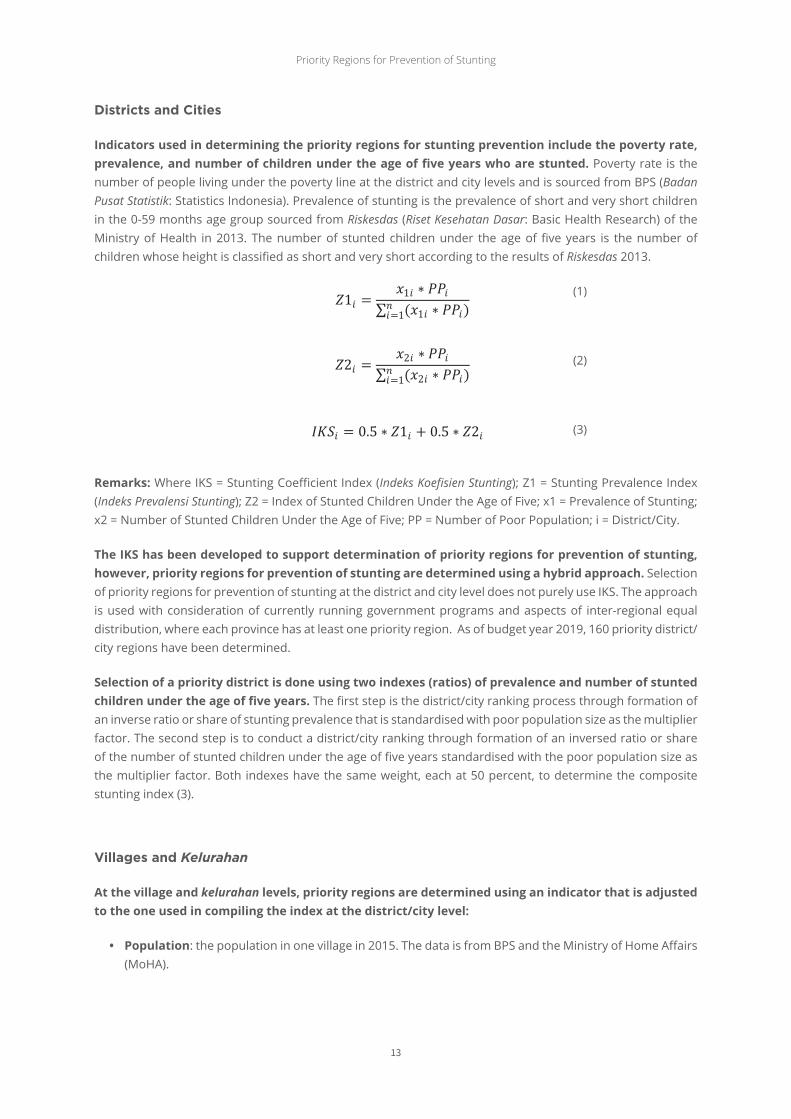
Indicators used in determining the priority regions for stunting prevention include the poverty rate, prevalence, and number of children under the age of five years who are stunted. Poverty rate is the number of people living under the poverty line at the district and city levels and is sourced from bPS (Badan Pusat Statistik: Statistics Indonesia). Prevalence of stunting is the prevalence of short and very short children in the 0-59 months age group sourced from Riskesdas (Riset Kesehatan Dasar: basic Health Research) of the Ministry of Health in 2013. The number of stunted children under the age of five years is the number of children whose height is classified as short and very short according to the results of Riskesdas 2013.
(1)
(2)
(3)
Remarks: Where IKS = Stunting Coefficient Index (Indeks Koefisien Stunting); Z1 = Stunting Prevalence Index (Indeks Prevalensi Stunting); Z2 = Index of Stunted Children under the Age of Five; x1 = Prevalence of Stunting; x2 = Number of Stunted Children under the Age of Five; PP = Number of Poor Population; i = District/City.
The IKs has been developed to support determination of priority regions for prevention of stunting, however, priority regions for prevention of stunting are determined using a hybrid approach. Selection of priority regions for prevention of stunting at the district and city level does not purely use IKS. The approach is used with consideration of currently running government programs and aspects of inter-regional equal distribution, where each province has at least one priority region. As of budget year 2019, 160 priority district/city regions have been determined.
selection of a priority district is done using two indexes (ratios) of prevalence and number of stunted children under the age of five years. The first step is the district/city ranking process through formation of an inverse ratio or share of stunting prevalence that is standardised with poor population size as the multiplier factor. The second step is to conduct a district/city ranking through formation of an inversed ratio or share of the number of stunted children under the age of five years standardised with the poor population size as the multiplier factor. both indexes have the same weight, each at 50 percent, to determine the composite stunting index (3).
Villages and Kelurahan
At the village and kelurahan levels, priority regions are determined using an indicator that is adjusted to the one used in compiling the index at the district/city level:
• Population: the population in one village in 2015. The data is from bPS and the Ministry of Home Affairs (MoHA).
𝑍𝑍1𝑖𝑖 =𝑥𝑥1𝑖𝑖 ∗ 𝑃𝑃𝑃𝑃𝑖𝑖
(𝑥𝑥1𝑖𝑖 ∗ 𝑃𝑃𝑃𝑃𝑖𝑖)𝑛𝑛𝑖𝑖=1
𝑍𝑍2𝑖𝑖 =𝑥𝑥2𝑖𝑖 ∗ 𝑃𝑃𝑃𝑃𝑖𝑖
(𝑥𝑥2𝑖𝑖 ∗ 𝑃𝑃𝑃𝑃𝑖𝑖)𝑛𝑛𝑖𝑖=1
𝐼𝐼𝐼𝐼𝐼𝐼𝑖𝑖 = 0.5 ∗ 𝑍𝑍1𝑖𝑖 + 0.5 ∗ 𝑍𝑍2𝑖𝑖

Priority Regions for Prevention of Stunting
14
• Poor Population size: the number of village poor, sourced from the bPS/TNP2K Integrated Database. The village poor population distribution is adjusted to the district/city poor population issued by bPS.
• Poverty Rate: the percentage of the village population who are poor. The data is produced from bPS and TNP2K calculation proportional to the poverty rate of district/city in 2014.
• Malnutrition: the incidence of malnourished people, both in marasmus and kwashiorkor forms in the past three years.3 The data is from the Village Potential (Podes) Survey 2014. This indicator is a proxy of indicators of stunted children under the age of five years that is unavailable at the village/kelurahan level.
Those indicators are also indicators used by the Ministry of Finance (MoF) in allocating village funds. MoF and TNP2K refined the formula used as the basis for Village Fund allocations for the 2018 budget year.
(4)
(5)
(6)
(7)
Remarks: IKS = Village Poverty Score; Z1 = Share of Village Poor Population to Poor Population of District/City; Z2 = Share of Village Poverty Rate to Total Poverty Rate of District/City; Z3 = Share of Number of Malnourished Population to Total Malnutrition of District/City; x1 = Total Poor Population (Direktorat Jenderal Perimbangan Keuangan/DJPK, Dana Desa/DD 2017); x2 = Poverty Rate (DJPK, DD 2017); x3 = Number of Malnourished Population (Podes 2014); i = Village; j = District/City.
selection of priority districts is done using three indexes (ratio): total poor population; poverty rate; and total malnutrition incidence. In determining the village composite index of stunting (7) the three indexes have the same weight, each at one-third.
evaluation of Region Selection Results
selected priority regions for preventing stunting are spread from west to east. The priority regions in poverty reduction have also been adopted for stunting prevention, however, most of the priority regions are in Java, due to the selection approach used, namely, the number and prevalence of children under the age of five years with stunting.
3 Marasmus is a form of malnutrition caused by an inadequate energy intake in all forms, including protein, while kwashiorkor is a form of malnutritioncausedbyaproteindeficiency.
𝑍𝑍1𝑖𝑖𝑗𝑗 =𝑥𝑥1𝑖𝑖 𝑥𝑥1𝑗𝑗
𝑍𝑍2𝑖𝑖𝑗𝑗 =𝑥𝑥2𝑖𝑖 𝑥𝑥2𝑗𝑗
𝑍𝑍3𝑖𝑖𝑗𝑗 =𝑥𝑥3𝑖𝑖 𝑥𝑥3𝑗𝑗
IKS𝑖𝑖𝑗𝑗 = 13∗ 𝑍𝑍1𝑖𝑖𝑗𝑗 +
13∗ 𝑍𝑍2𝑖𝑖𝑗𝑗 +
13∗ 𝑍𝑍3𝑖𝑖𝑗𝑗

Priority Regions for Prevention of Stunting
15
Figure 6: Distribution of Priority Regions
Source: Estimation Results.
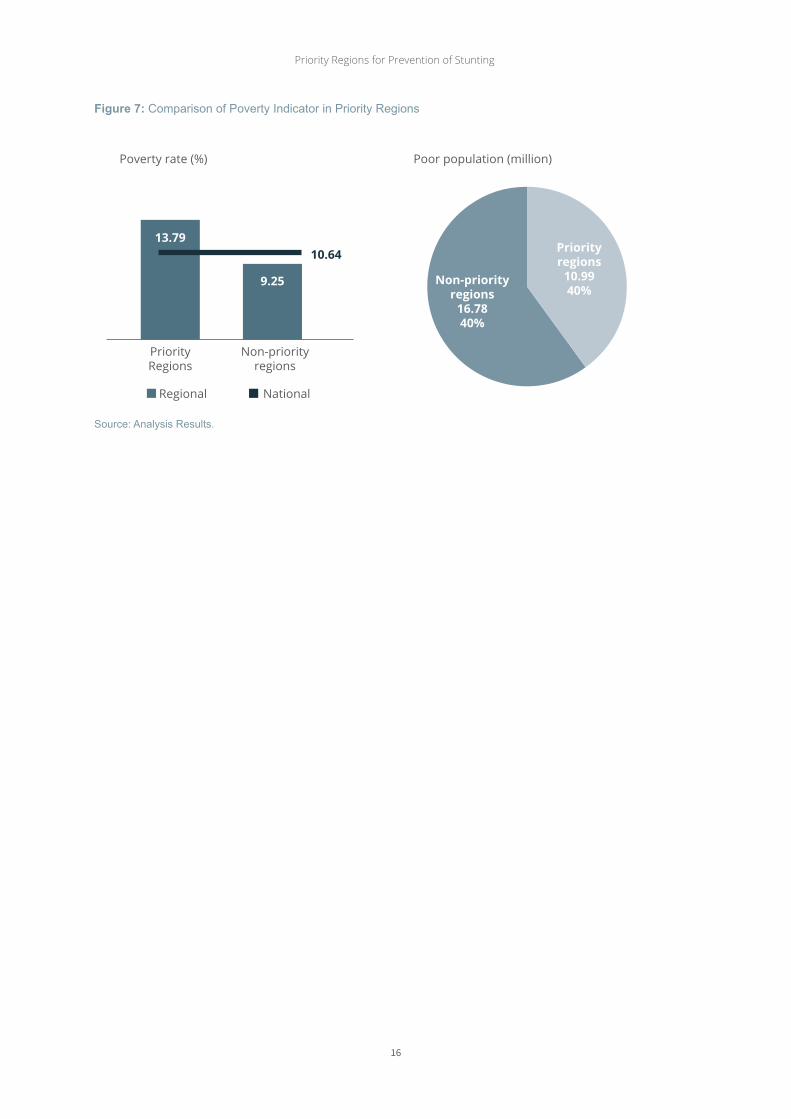
In general, selected regions have relatively worse stunting indicators compared to non-priority regions. In addition to the relatively worse condition of stunting, the poverty rate is also higher in priority regions. About 40 percent of the poor population is found in priority regions, or about 10.99 million people (Table 1 and Figure 7). The priority regions also have a poverty rate of 13.79 percent, which is higher than the national rate of 10.64 percent, or to non-priority regions at 9.25 percent (Table 1).
Table 1: Comparison of Poverty Indicators and Stunting in Priority Regions
Indikator Nasionaldaerah
PrioritasBukan daerah
Prioritas
Jumlah daerah 514 100 414
Kondisi stunting
Prevalensi balita Stunting (%) 37,2 41.73 31,21
Jumlah balita Stunting (ribu jiwa) 8.378 3.105 5.683
Angka Kemiskinan
Tingkat Kemiskinan (%) 10.64 13.79 9.25
Jumlah Penduduk Miskin (Juta) 27.77 10.99 16.78
Priority Regions for Prevention of Stunting
16
Figure 7: Comparison of Poverty Indicator in Priority Regions
Priorityregions
10.9940%
Non-priority regions
16.7840%
PriorityRegions
Regional National
Non-priorityregions
Poverty rate (%) Poor population (million)
13.7910.64
9.25
Source: Analysis Results.

Priority Regions for Prevention of Stunting
17
Recommendations
update of District and City Index
In reference to publication of Riskesdas 2018 results, there is a potential for updating the stunting coefficient index at district and city levels. The update is important to provide an overview of the most current condition of nutritional status of children under the age of five years, especially stunting prevalence. This step is also important to determine priority regions after 2019, where there are still 354 districts/cities that are not yet included in the national priority.
Improving and updating Village and Kelurahan Index Indicator
Podes 2018 has been completed by collecting similar information to Podes 2014, namely, the rate of malnourishment at village level that includes malnourished population, both marasmus and kwashiorkor for the past three years. An update with this approach has an advantage of being consistent with previously used indicators. A disadvantage of this indicator, however, is that the collection was conducted across all age groups, whereas intervention to prevent stunting is ideally done for 0-59-month age group. The use of this indicator also received feedback from ministries/agencies regarding the accuracy of information.
To obtain a more comprehensive picture of malnourishment, there should ideally be an estimate at the village/kelurahan level so that the compiled composite index at the village/kelurahan level is the same as the index at the district/city level. To meet those needs, TNP2K and Balitbangkes (National Institute for Health Research and Development) should work together to provide information on the nutritional status of children under the age of five years at the village/kelurahan level through development of nutrition mapping. Cooperation should be encouraged to use updated data because it still uses Riskesdas 2013.
updating of Priority Regions Indicators
Assuming both of the previous recommendations are adopted, priority regions after the 2019 budget year could use the most recent data but should still consider path dependence of the previous priorities. The priority regions in 2018 of 100 districts/cities and in 2019 of 60 districts/cities have, therefore, not experienced change. Specifically, for these regions, updates shall only be done on nutritional status indicators of children under the age of five years, specifically stunting and poverty rate as well as IKS without changing priority regions status. The 354 districts/cities priority regions are then determined using IKS that have been updated with new data and information.

Priority Regions for Prevention of Stunting
18
Bibliography
• Badan Pusat Statistik. (2017). Data dan Informasi Kemiskinan Kabupaten/ Kota Tahun 2017. Jakarta.• Badan Pusat Statistik. (2016). Data dan Informasi Kemiskinan Kabupaten/ Kota Tahun 2016. Jakarta.• Bappenas. (2018). Pedoman Pelaksanaan Intervensi Penurunan Stunting Terintegrasi di Kabupaten/ Kota,
Edisi November 2018. Jakarta.• Kementerian Dalam Negeri, Bappenas dan TNP2K. (2018). Strategi Nasional Percepatan Pencegahan Anak
Kerdil (Stunting). Jakarta.• Kementerian Kesehatan. (2013). Hasil Riskesdas 2013. Jakarta: badan Penelitian dan Pengembangan
Kesehatan.• Kementerian Kesehatan. (2013). Penyajian Pokok-Pokok Riskesdas 2013. Jakarta: badan Penelitian dan
Pengembangan Kesehatan.• Kementerian Kesehatan. (2018). Hasil Utama Riskesdas 2018. Jakarta: badan Penelitian dan
Pengembangan Kesehatan.• Kementerian Sekretariat Negara. (2018). Memorandum: Hasil Riset Kesehatan Dasar (Riskesdas) 2018
terkait Anak Kerdil (Stunting). Jakarta.• Kemenko PMK, Bappenas dan TNP2K. (2018). 100 Kabupaten/Kota Dengan Masing-masing 10 Desa
Prioritas dan 60 Kabupaten/Kota Prioritas Tambahan Untuk Penanganan Stunting (Kerdil). Jakarta.

Priority Regions for Prevention of Stunting
19
Appendix

Priority Regions for Prevention of Stunting
20
No Province district/City
Number of sub-
districts***
Number of
villages***
2016 Population
(000s of
persons)**
2013Prevalence
of stunting
(%)*
2013 Number
of stunted Children
under Five
(persons)**
2016 Poverty
Rate (%)**
2016 Poor
Population (000s
of persons)
**
1 ACeH ACeH TeNgAH 14 295 199.30 59.25 13,237 16.64 33.16
2 PIDIe 4 54 424.23 57.47 20,903 21.25 90.16
3 NORTH SuMATRA lANgKAT 23 277 1,019.24 55.48 54,961 11.36 115.79
4 PADANg lAWAS 12 304 262.29 54.86 18,239 8.69 22.80
5 NIAS uTARA 11 113 134.74 54.83 9,296 30.92 41.66
6 guNuNgSITOlI 6 101 137.28 52.32 8,618 23.43 32.17
7 WeST SuMATRA PASAMAN 12 36 272.11 55.20 15,025 7.65 20.83
8 PASAMAN bARAT 11 19 415.62 51.54 23,435 7.40 30.76
9 RIAu ROKAN Hulu 4 54 610.38 59.01 42,142 11.05 67.42
10 JAMbI KeRINCI 16 287 235.63 55.26 9,846 7.48 17.62
11 SOuTH SuMATRA
OgANKOMeRINg IlIR 18 326 795.74 40.55 35,160 16.03 127.54
12 beNgKulu K A u R 15 195 116.92 50.71 5,845 22.36 26.14
13 lAMPuNg lAMPuNg SelATAN 17 260 979.87 43.01 42,971 16.16 158.38
14 lAMPuNg TIMuR 24 264 1,016.31 43.17 40,790 16.98 172.61
15 lAMPuNg TeNgAH 28 307 1,247.10 52.68 59,838 13.28 165.67
16bANgKA belITuNg ISlANDS
bANgKA bARAT 6 64 199.04 39.14 8,902 2.74 5.46
17 RIAu ISlANDS NATuNA 12 76 75.07 35.19 3,122 4.33 3.25
18 DKI JAKARTA KePulAuAN SeRIbu 2 6 23.53 41.29 1.175 12.58 2.96
19 WeST JAVA bOgOR 40 434 5,555.45 28.29 148,764 8.83 490.80
20 SuKAbuMI 47 386 2,442.09 37.10 85,651 8.13 198.66
21 CIANJuR 32 360 2,249.20 41.76 95,023 11.62 261.39
22 bANDuNg 31 280 3,581.24 40.70 137,156 7.61 272.65
23 gARuT 42 442 2,564.52 37.83 100,964 11.64 298.52
24 TASIKMAlAYA 39 351 1,740.74 41.73 69,401 11.24 195.61
25 KuNINgAN 32 376 1,060.29 42.00 36,672 13.59 144.07
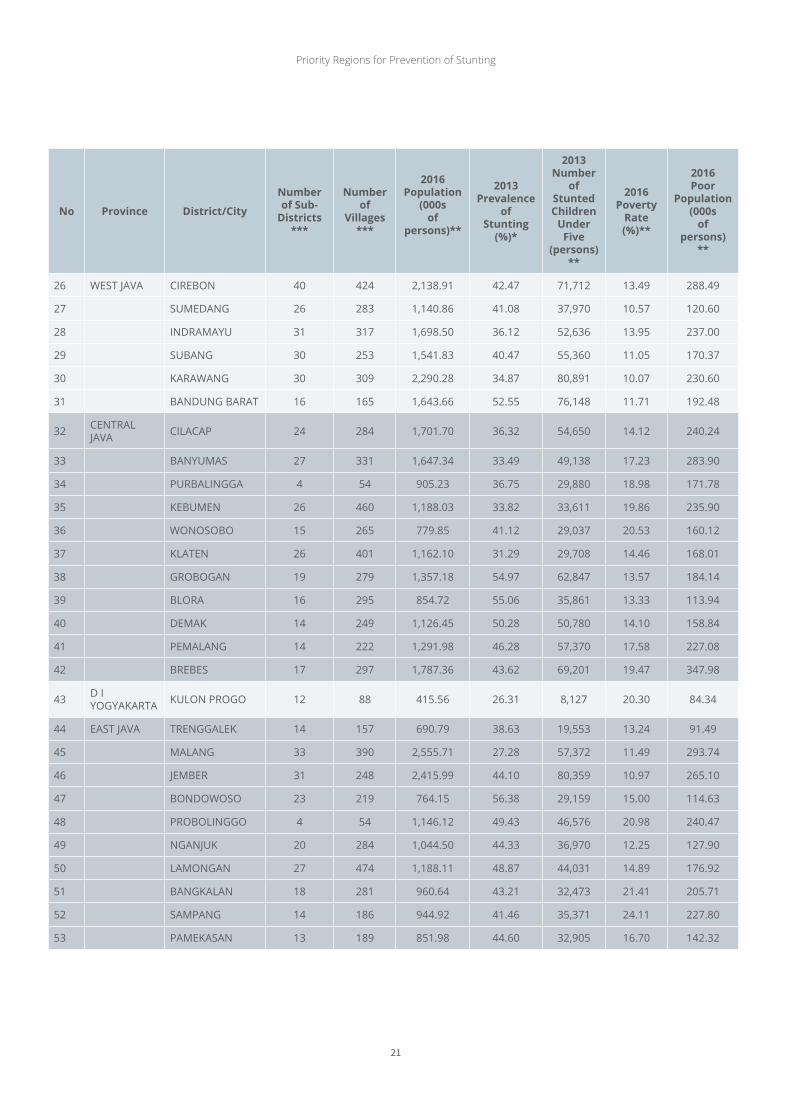
List of 100 Priority Districts/Cities for 2018 Budget Year
Priority Regions for Prevention of Stunting
21
No Province district/City
Number of sub-
districts***
Number of
villages***
2016 Population
(000s of
persons)**
2013Prevalence
of stunting
(%)*
2013 Number
of stunted Children
under Five
(persons)**
2016 Poverty
Rate (%)**
2016 Poor
Population (000s
of persons)
**
26 WeST JAVA CIRebON 40 424 2,138.91 42.47 71,712 13.49 288.49
27 SuMeDANg 26 283 1,140.86 41.08 37,970 10.57 120.60
28 INDRAMAYu 31 317 1,698.50 36.12 52,636 13.95 237.00
29 SubANg 30 253 1,541.83 40.47 55,360 11.05 170.37
30 KARAWANg 30 309 2,290.28 34.87 80,891 10.07 230.60
31 bANDuNg bARAT 16 165 1,643.66 52.55 76,148 11.71 192.48
32 CeNTRAl JAVA CIlACAP 24 284 1,701.70 36.32 54,650 14.12 240.24
33 bANYuMAS 27 331 1,647.34 33.49 49,138 17.23 283.90
34 PuRbAlINggA 4 54 905.23 36.75 29,880 18.98 171.78
35 KebuMeN 26 460 1,188.03 33.82 33,611 19.86 235.90
36 WONOSObO 15 265 779.85 41.12 29,037 20.53 160.12
37 KlATeN 26 401 1,162.10 31.29 29,708 14.46 168.01
38 gRObOgAN 19 279 1,357.18 54.97 62,847 13.57 184.14
39 blORA 16 295 854.72 55.06 35,861 13.33 113.94
40 DeMAK 14 249 1,126.45 50.28 50,780 14.10 158.84
41 PeMAlANg 14 222 1,291.98 46.28 57,370 17.58 227.08
42 bRebeS 17 297 1,787.36 43.62 69,201 19.47 347.98
43 D I YOgYAKARTA KulON PROgO 12 88 415.56 26.31 8,127 20.30 84.34
44 eAST JAVA TReNggAleK 14 157 690.79 38.63 19,553 13.24 91.49
45 MAlANg 33 390 2,555.71 27.28 57,372 11.49 293.74
46 JeMbeR 31 248 2,415.99 44.10 80,359 10.97 265.10
47 bONDOWOSO 23 219 764.15 56.38 29,159 15.00 114.63
48 PRObOlINggO 4 54 1,146.12 49.43 46,576 20.98 240.47
49 NgANJuK 20 284 1,044.50 44.33 36,970 12.25 127.90
50 lAMONgAN 27 474 1,188.11 48.87 44,031 14.89 176.92
51 bANgKAlAN 18 281 960.64 43.21 32,473 21.41 205.71
52 SAMPANg 14 186 944.92 41.46 35,371 24.11 227.80
53 PAMeKASAN 13 189 851.98 44.60 32,905 16.70 142.32

Priority Regions for Prevention of Stunting
22
No Province district/City
Number of sub-
districts***
Number of
villages***
2016 Population
(000s of
persons)**
2013Prevalence
of stunting
(%)*
2013 Number
of stunted Children
under Five
(persons)**
2016 Poverty
Rate (%)**
2016 Poor
Population (000s
of persons)
**
54 eAST JAVA SuMeNeP 27 332 1,075.62 52.44 33,196 20.09 216.14
55 bANTeN PANDeglANg 35 339 1,199.16 38.57 46,775 9.67 115.90
56 bAlI gIANYAR 7 70 498.57 40.99 16,189 4.44 22.13
57 WeST NuSA TeNggARA lOMbOK bARAT 10 122 662.56 46.89 28,533 16.73 110.85
58 lOMbOK TeNgAH 12 139 919.81 47.79 49,092 15.80 145.37
59 lOMbOK TIMuR 20 254 1,171.04 43.77 54,051 18.46 216.18
60 SuMbAWA 24 166 444.42 50.30 22,147 16.12 71.66
61 DOMPu 8 81 241.05 47.78 10,741 14.23 34.31
62 lOMbOK uTARA 5 33 213.86 65.77 13,451 33.21 71.02
63 eAST NuSA TeNggARA SuMbA bARAT 6 74 123.43 55.35 9,033 29.34 36.21
64 SuMbA TIMuR 22 156 248.78 51.31 15,801 31.43 78.19
65 TIMOR TeNgAH SelATAN 32 278 463.20 70.43 38,773 29.89 138.43
66 TIMOR TeNgAH uTARA 24 193 246.56 39.94 11,486 24.07 59.34
67 A l O R 17 175 201.11 55.66 13,058 22.35 44.95
68 leMbATA 9 151 133.99 55.08 7,715 26.26 35.18
69 NgADA 12 151 155.75 62.14 10,648 12.69 19.76
70 MANggARAI 11 162 322.90 58.78 22,212 22.50 72.65
71 ROTe NDAO 4 54 152.25 55.38 9,472 29.60 45.06
72 SuMbA TeNgAH 5 65 69.33 63.61 5,765 36.55 25.34
73 SuMbA bARAT DAYA 11 131 324.05 61.22 26,809 30.63 99.26
74 MANggARAI TIMuR 9 176 275.58 58.92 18,277 27.71 76.37
75 SAbu RAIJuA 23 731 88.10 62.49 8,967 32.44 28.58
76 WeST KAlIMANTAN KeTAPANg 20 249 483.00 34.83 15,881 10.99 53.07
77 CeNTRAl KAlIMANTAN bARITO TIMuR 10 103 116.15 54.84 6,362 7.64 8.88

Priority Regions for Prevention of Stunting
23
No Province district/City
Number of sub-
districts***
Number of
villages***
2016 Population
(000s of
persons)**
2013Prevalence
of stunting
(%)*
2013 Number
of stunted Children
under Five
(persons)**
2016 Poverty
Rate (%)**
2016 Poor
Population (000s
of persons)
**
78 SOuTH KAlIMANTAN
Hulu SuNgAI uTARA 10 219 227.35 56.03 12,176 6.76 15.38
79 eAST KAlIMANTAN
PeNAJAM PASeR uTARA 4 54 155.71 34.63 5,965 7.49 11.66
80 NORTH KAlIMANTAN MAlINAu 15 109 79.86 40.27 3,027 7.15 5.71
81 NORTH SulAWeSI
bOlAANg MONgONDOW uTARA
6 107 76.95 56.66 3,212 9.38 7.22
82 CeNTRAl SulAWeSI bANggAI 23 337 358.59 35.39 11,728 9.47 33.97
83 SOuTH SulAWeSI eNReKANg 12 129 201.22 53.73 12,384 13.41 26.98
84 SOuTHeAST SulAWeSI buTON 7 95 266.92 49.61 16,939 13.53 36.11
85 gORONTAlO bOAleMO 7 85 152.96 39.37 5,691 21.11 32.29
86 gORONTAlO 19 207 372.59 42.62 14,824 21.03 78.36
87 WeST SulAWeSI MAJeNe 8 82 165.83 58.62 10,885 14.89 24.69
88 POleWAlI MANDAR 4 54 428.02 48.48 21,151 17.06 73.04
89 MAMuJu 11 99 269.80 47.26 22,241 6.48 17.47
90 MAluKu MAluKu TeNgAH 18 187 370.22 42.15 16,977 21.68 80.28
91 SeRAM bAgIAN bARAT 11 92 169.91 59.86 11,193 26.50 45.03
92 NORTH MAluKu
HAlMAHeRA SelATAN 30 256 220.57 50.60 13,083 4.11 9.06
93 WeST PAPuA SORONg SelATAN 13 121 43.72 60.70 3,541 19.92 8.71
94 TAMbRAuW 12 83 13.69 59.29 571 36.67 5.02
95 PAPuA JAYAWIJAYA 40 331 209.26 49.88 11,329 39.66 83.00
96 TOlIKARA 45 516 134.77 52.01 6,739 33.63 45.33
97 NDugA 32 248 95.44 56.55 5,376 38.47 36.72
98 lANNY JAYA 37 140 173.05 60.89 6,368 41.68 72.13
99 DOgIYAI 10 79 93.40 66.12 6,143 31.21 29.15
100 INTAN JAYA 6 37 46.95 68.95 3,704 43.73 20.53
Source: *Riskesdas 2013, Kemenkes **Susenas 2013, BPS ***Podes 2014, BPS

Priority Regions for Prevention of Stunting
24
No Province District
1 ACeH ACeH TIMuR
2 bAlI buleleNg
3 bANTeN lebAK
4 beNgKulu beNgKulu uTARA
5 DI YOgYAKARTA bANTul
6 gORONTAlO POHuWATO
7 JAMbI TJg JAbuNg TIMuR
8 WeST JAVA MAJAleNgKA
9 CeNTRAl JAVA Kab. PeKAlONgAN
10 eAST JAVA Kab. KeDIRI
11 WeST KAlIMANTAN SAMbAS
12 SINTANg
13 SOuTH KAlIMANTAN TANAH buMbu
14 CeNTRAl KAlIMANTAN KAPuAS
15 KOTAWARINgIN TIMuR
16 eAST KAlIMANTAN KuTAI
17 NORTH KAlIMANTAN NuNuKAN
18 ISlANDS OF bANgKA belITuNg bANgKA
19 ISlANDS OF RIAu KAMPAR
20 lINggA
21 lAMPuNg TANggAMuS
22 MAluKu KePulAuAN ARu
23 NORTH MAluKu KePulAuAN SulA
24 WeST NuSA TeNggARA b I M A
25 SuMbAWA bARAT
26 eAST NuSA TeNggARA b e l u
27 e N D e
28 FlOReS TIMuR
29 KuPANg
30 MAlAKA
31 MANggARAI bARAT
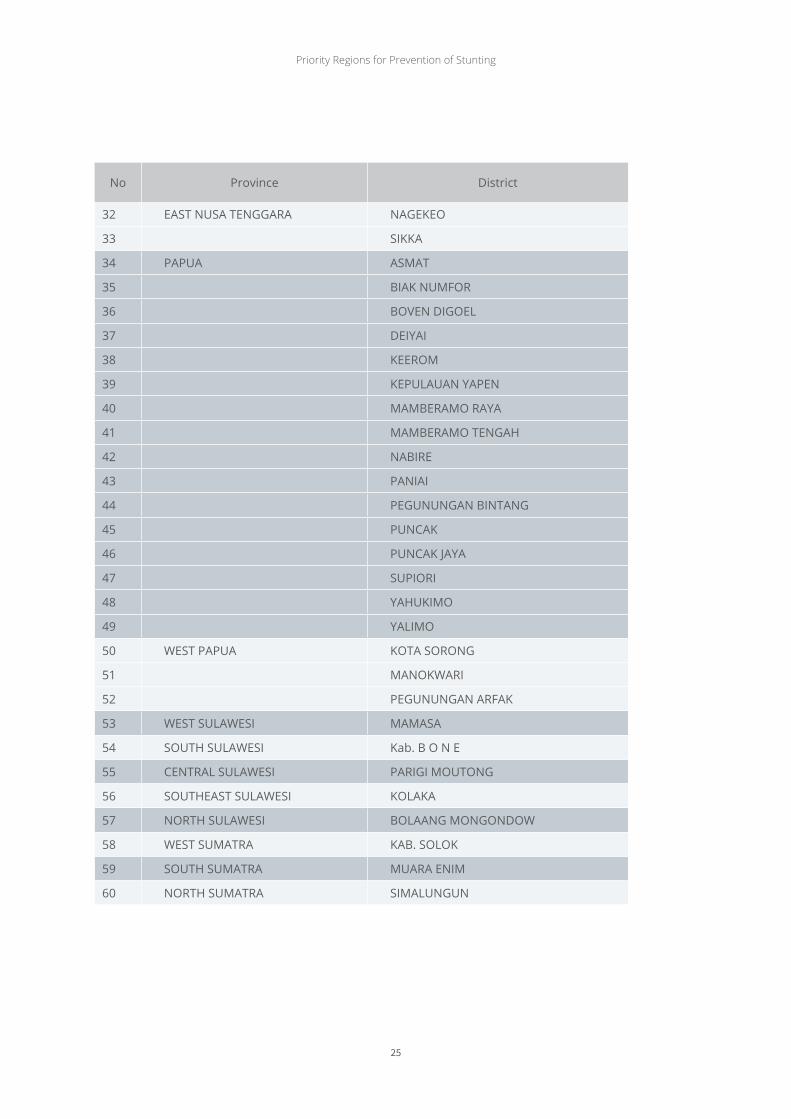
List of 60 Priority Districts/Cities for 2019 Budget Year
Priority Regions for Prevention of Stunting
25
No Province District
32 eAST NuSA TeNggARA NAgeKeO
33 SIKKA
34 PAPuA ASMAT
35 bIAK NuMFOR
36 bOVeN DIgOel
37 DeIYAI
38 KeeROM
39 KePulAuAN YAPeN
40 MAMbeRAMO RAYA
41 MAMbeRAMO TeNgAH
42 NAbIRe
43 PANIAI
44 PeguNuNgAN bINTANg
45 PuNCAK
46 PuNCAK JAYA
47 SuPIORI
48 YAHuKIMO
49 YAlIMO
50 WeST PAPuA KOTA SORONg
51 MANOKWARI
52 PeguNuNgAN ARFAK
53 WeST SulAWeSI MAMASA
54 SOuTH SulAWeSI Kab. b O N e
55 CeNTRAl SulAWeSI PARIgI MOuTONg
56 SOuTHeAST SulAWeSI KOlAKA
57 NORTH SulAWeSI bOlAANg MONgONDOW
58 WeST SuMATRA KAb. SOlOK
59 SOuTH SuMATRA MuARA eNIM
60 NORTH SuMATRA SIMAluNguN

Priority Regions for Prevention of Stunting
26


tIM NAsIONAL PERCEPAtAN PENANGGuLANGAN KEMIsKINAN
Kantor Sekretariat Wakil PresidenJl. Kebon Sirih Raya No.14, Jakarta Pusat, 10110
Telpon : (021) 3912812Faksimili : (021) 3912511Email : [email protected] : www.tnp2k.go.id