Embed Size (px)
Citation preview

Maharashtra’s Child Stunting Declines: What is Driving Them? Findings of a Multidisciplinary AnalysisWritten by Lawrence Haddad, Nick Nisbett, Inka Barnett, Elsa Valli
MAHARASHTRA SPECIAL COLLECTION 2014
Maharashtra’s C
hild Stunting Declines: W
hat is Driving Them
? Findings of a Multidisciplinary A
nalysis
20
14

Cover photographUNICEF/India/Giacomo Pirozzi.Portrait of a married adolescent girl with her one year old child.
Copy-editor Judy Hartley at Quincewood Communications - www.quincewood.co.uk
Designers Nexus Design & Print - www.nexusdp.co.uk
Citation Haddad, L.; Nisbett, N.; Barnett, I. and Valli, E. (2014) Maharashtra’s Child Stunting Declines: What is Driving Them? Findings of a Multidisciplinary Analysis, Brighton: IDS
Disclaimer IDSThe Institute of Development Studies and Editors cannot be held responsible for errors or any consequences arising from the use of information contained in this report. The views and opinions expressed do not necessarily reflect those of the IDS and Editors.
Disclaimer UNICEFThe statements contained in this publication do not imply or constitute official opinions or policy positions by UNICEF.
Copyright © Institute of Development Studies and UNICEF 2014.
ISBN 978-1-78118-179-9
© All rights reserved. Reproduction, copy, transmission, or translation of any part of this publication may be made only under the following conditions:• with the prior permission of the publisher; or• under the terms set out below.This publication is copyright, but may be reproduced by any method without fee for teaching or nonprofit purposes, but not for resale. Formal permission is required for all such uses, but normally will be granted immediately. For copying in any other circumstances, or for re-use in other publications, or for translation or adaptation, prior written permission must be obtained from the publisher and a fee may be payable.
Funding The Comprehensive Nutrition Survey of Maharashtra and the analyses included in this report were funded with financial support by Megha and Aditya Mittal and the United Nations Children’s Fund (UNICEF).
Institute of Development StudiesBrightonBN1 9REUKwww.ids.ac.uk
IDS is a charitable company limited by guarantee and registered in England (No 877338).
ContentsAcknowledgements i List of Abbreviations ii
1 Executive Summary and Overview: Maharashtra’s Child Stunting Declines: What is Driving Them? Findings of a Multidisciplinary Analysis
Lawrence Haddad, Nick Nisbett and Inka Barnett
1.1 Introduction 1
1.2 The decline in stunting in Maharashtra in a national and global context 1
1.3 Changes in Maharashtra, 2000–2012 2
1.4 What do the survey data tell us? 3
1.5 What does the stakeholder analysis tell us? 4
1.6 Conclusions 5
2 What is Driving the Stunting Declines in Maharashtra? Clues from Extant Data Lawrence Haddad
Executive Summary 6
2.1 Introduction 7
2.2 Trends in pre-schooler anthropometry, 2006 to 2012 7
2.3 Trends in basic determinants 8
2.4 Trends in underlying determinants 17
2.5 Trends in performance of the Integrated Child Development Services Programme (ICDS) 22
2.6 Conclusions 26
3 Maharashtra’s Rapid Decline in Stunting Rates between 2006 and 2012: What do the Survey Data Tell Us?
Lawrence Haddad and Elsa Valli
Executive summary 28
3.1 Introduction 30
3.2 The surveys and data sets 30
3.3 Comparing the data from 2006 and 2012 32
3.4 Comparing the potential determinants across survey years 33
3.5 Comparing the outcomes by potential determinants across survey years 44
3.6 Econometric analysis 55
3.7 Conclusions 62

4 An Analysis of Maharashtra’s Decline in Childhood Stunting: Stakeholder Perspectives Inka Barnett and Nick Nisbett
Executive summary 64
4.1 Introduction 65
4.2 Findings 66
4.3 Conclusions, reflections and implications 78
References 81
Annexes 84
Annex 1: The Case of Maharashtra in the UNICEF 2013 Report 84
Annex 2: How Maharashtra is Tackling Child Malnutrition 86
Annex 3: Maharashtra’s Malnutrition Miracle 87
Annex 4: Background Set of Tables 89Annex 5: Fully Interacted Model Testing for Differences in Estimated Coefficients across Two
Survey Years 109
Annex 6: List of Stakeholders Interviewed 112
Annex 7: Stakeholder Interview Guide 113
Annex 8: Letter to Stakeholders 118
Annex 9: Key Activities, Malnutrition Removal Campaign and Nutrition Mission 119

AcknowledgementsThis project was funded by UNICEF India. We are extremely grateful to all participants listed in the annexes of this study for giving up their time to be interviewed and in particular to the Chief Minister Mr Prithviraj Chavan, the Minister for Women and Child Development Ms Varsha Gaikwad, Chief Secretary Dr JK Banthia and the current and former Mission Director Generals, Ms Vandana Krishna and Mr V. Ramani for making time in their busy schedules to accommodate our questioning. We are also grateful to IIPS for their assistance in providing data and responding to queries on the Comprehensive Nutrition Survey Maharashtra (CNSM) 2012. UNICEF Maharashtra, India and South Asia offices provided much-appreciated support along the way and we are grateful for their comments on the papers forming this report, particularly to Victor Aguayo, France Begin and Raji Nair. We are also grateful to Alex Cornelius, José Gallegos, Rupinder Kaur, Shilpi Srivastava for their research assistance, to Leah Plati for project coordination, to Tina Nelis and Alison Norwood for editorial support; and to Shilpa Deshpande, who provided helpful background on nutrition in Maharashtra and the work of the Mission. All errors and omissions remain those of the authors.
i

List of AbbreviationsACDPO Additional Child Development Project OfficerANC Antenatal Care ANM Auxiliary Nurse MidwifeASHA Auxiliary Social Health ActivistAWC Anganwadi Centre AWW Anganwadi WorkerCDCs Child Development Centres CDPO Child Development Project OfficerCEBs Census Enumeration Blocks CECM Committee to Evaluate Child Mortality CNSM Comprehensive Nutrition Survey of MaharashtraDWCD Department of Women and Child DevelopmentFSI Food Security Index GoM Government of Maharashtra GSDP Gross State Domestic ProductHAZ Height for Age Z scoresHBNBC Home-Based Newborn Care IAP Indian Academy of Paediatrics IAS Indian Administrative Service ICDS Integrated Child Development ServicesICRIER Indian Council for Research on International Economic Relations IFPRI International Food Policy Research InstituteIGIDR Indira Gandhi Institute of Development ResearchIIPS International Institute for Population Sciences IMR Infant Mortality RateIMNCI Integrated Management of Neonatal and Childhood Illnesses MAM Moderate Acute Malnutrition MOHFW Ministry of Health and Family Welfare MoPH Ministry of Public Health MUW Moderate UnderweightNCAER National Council of Applied Economic Research (India)NGO Non-Governmental OrganisationNFHS National Family Health Survey NIPFP National Institute of Public Finance and Policy, India NREGA National Rural Employment Guarantee ActNRHM National Rural Health Mission ORS Oral Rehydration SaltsPCA Principal Components AnalysisPDS Public Distribution SystemPH Public HealthPHCs Primary Health Care Centres PHD Public Health Department PSUs Primary Sampling UnitsRJMCHN Rajmata Jijau Mother–Child Health and Nutrition MissionSAM Severe Acute Malnutrition SNDT Shreemati Nathibai Damodar Thackersey Women’s UniversitySNEHA A Mumbai-based NGO focusing on maternal and child healthST Scheduled Tribe TISS Tata Institute of Social SciencesTPDS Targeted Public Distribution SchemeVCDCs Village Child Development Centres WASH Water, Sanitation and HygieneWCD (Department of) Women and Child Development
ii
1
1 Executive Summary and Overview: Maharashtra’s Child Stunting Declines: What is Driving Them? Findings of a Multidisciplinary Analysis Lawrence Haddad, Nick Nisbett and Inka Barnett1.1 Introduction
Between 2006 and 2012, Maharashtra’s stunting rate among children under two years of age was reported to decline by 15 percentage points – one of the fastest declines in stunting seen anywhere at any time. This was seemingly more remarkable because it occurred within a context where Indian stunting levels nationally are regularly characterised as stuck or static. Maharashtra, the second largest state in India with a population of over 100 million people, appears to represent a major departure from the norm. This report aims to understand the driving factors behind this rapid decline.
The report draws on three source papers written by the authors, which are summarised in this overview paper: one drawing on secondary data (section 2 – Haddad 2014), one drawing on primary survey data (section 3 – Haddad and Valli 2014) and one drawing on primary qualitative data (section 4 – Barnett and Nisbett 2014).1 As will become clear, the three papers, using different methods and written by different combinations of the three principal authors, arrive at very similar conclusions, giving us greater confidence in their validity.
This overview first surveys the literature to describe the broad economic, political and social changes occurring within the state in the 2000–2012 period. In what kind of environment did these declines in stunting occur? Second, the paper analyses two child-level surveys undertaken in 2006 and 2012 to describe the distribution of stunting declines, identify factors correlated with the higher stunting (and wasting) rates in both years and to assess whether the relationship between stunting, wasting and its correlates has profoundly changed. Third, we conducted interviews and focus group discussions with key stakeholders in academia, civil society, government, international partner organisations, media and the private sector to identify the perceived critical factors for the decline in stunting. The final section of the paper concludes with a series of messages that we believe are important for nutrition policymaking in India and globally.
1.2 The decline in stunting in Maharashtra in a national and global context
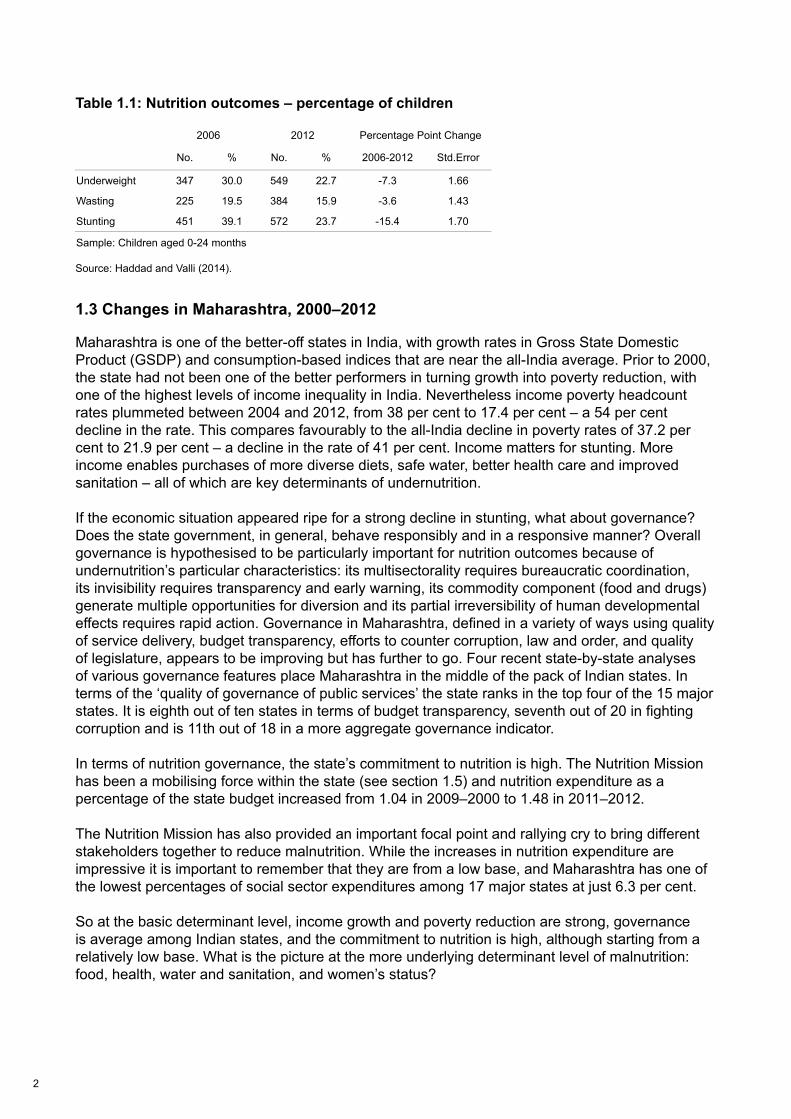
A comparison of stunting rates for children under two years old, using the 2005–2006 National Family Health Survey (NFHS) survey and the 2012 Maharashtra Comprehensive Nutrition Survey, shows that rates declined from 39 per cent to 24 per cent – a decline of almost three percentage points per year (Table 1.1). This is faster than any recent country-level trend. Bangladesh comes closest to this performance with declines of two percentage points over a similar period. The decline is even more remarkable given that the state’s performance in reducing stunting between 1992 and 2006 was lower than the all-India average. To put the recent decline in a national context, if India posted a ten percentage point decline in stunting over the same period, the number of stunted children under five years old would decline from 60 million to 45 million. Global stunting numbers would be reduced from 165 million to 150 million, well on the way to the World Health Assembly targets of 100 million by 2025.2
1 Each paper comprises its own executive summary and conclusions and can be read separately or as part of the overall report.2 Haddad and Valli report that the age-adjusted decline in stunting rates of under-2s is slightly smaller at 13 per cent instead of 15 per cent. This is still a major decline and, while the correction is important to make, it does not change the nature of the achievements of the state or our conclusion.
2
Table 1.1: Nutrition outcomes – percentage of children
Source: Haddad and Valli (2014).
1.3 Changes in Maharashtra, 2000–2012
Maharashtra is one of the better-off states in India, with growth rates in Gross State Domestic Product (GSDP) and consumption-based indices that are near the all-India average. Prior to 2000, the state had not been one of the better performers in turning growth into poverty reduction, with one of the highest levels of income inequality in India. Nevertheless income poverty headcount rates plummeted between 2004 and 2012, from 38 per cent to 17.4 per cent – a 54 per cent decline in the rate. This compares favourably to the all-India decline in poverty rates of 37.2 per cent to 21.9 per cent – a decline in the rate of 41 per cent. Income matters for stunting. More income enables purchases of more diverse diets, safe water, better health care and improved sanitation – all of which are key determinants of undernutrition.
If the economic situation appeared ripe for a strong decline in stunting, what about governance? Does the state government, in general, behave responsibly and in a responsive manner? Overall governance is hypothesised to be particularly important for nutrition outcomes because of undernutrition’s particular characteristics: its multisectorality requires bureaucratic coordination, its invisibility requires transparency and early warning, its commodity component (food and drugs) generate multiple opportunities for diversion and its partial irreversibility of human developmental effects requires rapid action. Governance in Maharashtra, defined in a variety of ways using quality of service delivery, budget transparency, efforts to counter corruption, law and order, and quality of legislature, appears to be improving but has further to go. Four recent state-by-state analyses of various governance features place Maharashtra in the middle of the pack of Indian states. In terms of the ‘quality of governance of public services’ the state ranks in the top four of the 15 major states. It is eighth out of ten states in terms of budget transparency, seventh out of 20 in fighting corruption and is 11th out of 18 in a more aggregate governance indicator.
In terms of nutrition governance, the state’s commitment to nutrition is high. The Nutrition Mission has been a mobilising force within the state (see section 1.5) and nutrition expenditure as a percentage of the state budget increased from 1.04 in 2009–2000 to 1.48 in 2011–2012.
The Nutrition Mission has also provided an important focal point and rallying cry to bring different stakeholders together to reduce malnutrition. While the increases in nutrition expenditure are impressive it is important to remember that they are from a low base, and Maharashtra has one of the lowest percentages of social sector expenditures among 17 major states at just 6.3 per cent.
So at the basic determinant level, income growth and poverty reduction are strong, governance is average among Indian states, and the commitment to nutrition is high, although starting from a relatively low base. What is the picture at the more underlying determinant level of malnutrition: food, health, water and sanitation, and women’s status?
2006 2012 Percentage Point Change
No. % No. % 2006-2012 Std.Error
Underweight 347 30.0 549 22.7 -7.3 1.66
Wasting 225 19.5 384 15.9 -3.6 1.43
Stunting 451 39.1 572 23.7 -15.4 1.70
Sample: Children aged 0-24 months
Table 1: Nutrition Outcomes - Percentage of Children
2006 2012 Change 2006-2012Underweight 30.03 22.74 -7.29Severe Underweight 10.22 6.16 -4.06Wasting 19.49 15.86 -3.63Severe Wasting 7.81 4.16 -3.65Stunting 39.08 23.59 -15.49Severe Stunting 14.78 7.68 -7.09
Sample: Children under two years of age (IIPS 2007; 2013)
Table 2: Nutrition Outcomes - Percentage of Children, by Wealth Indicators
2005-6 2012 2005/6-2012 Std.Error
Wealth index quantilesPoorest 53.71 30.75 -22.96 4.13Second 38.29 29.21 -9.08 4.05Middle 38.67 22.46 -16.22 3.77Fourth 30.00 18.80 -11.20 3.62Richest 22.99 17.12 -5.87 3.41
Source: Haddad and Valli (2014)
3
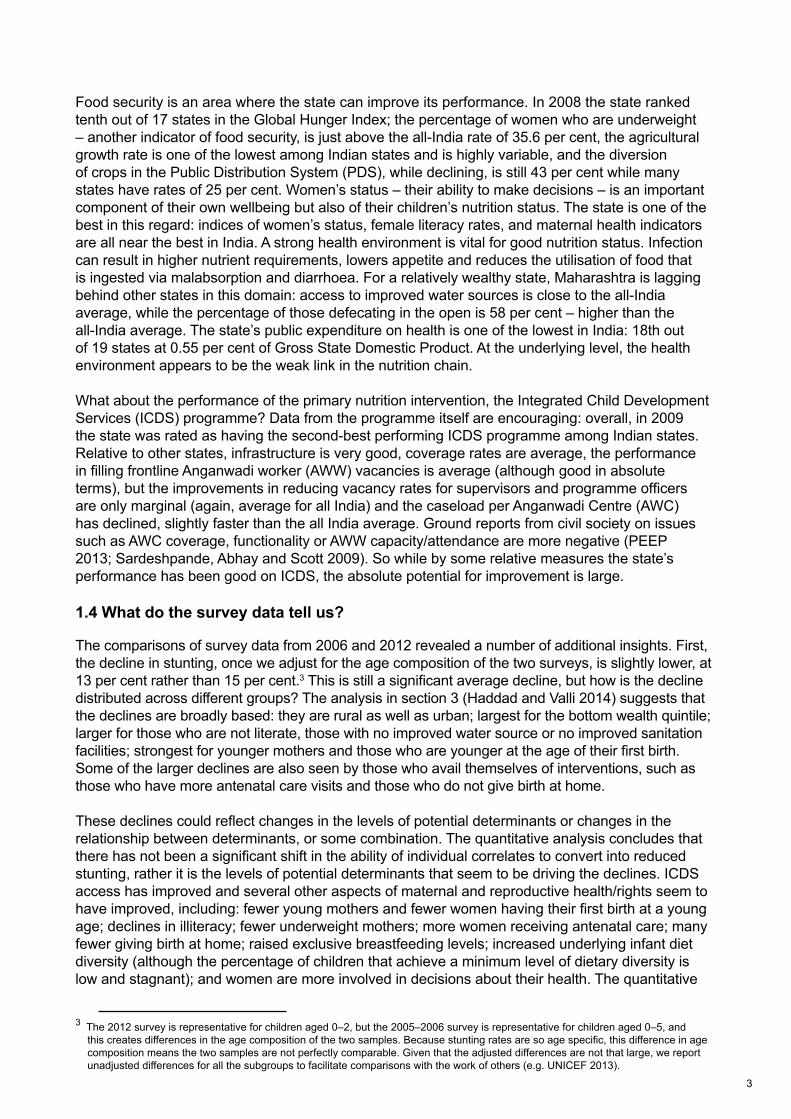
Food security is an area where the state can improve its performance. In 2008 the state ranked tenth out of 17 states in the Global Hunger Index; the percentage of women who are underweight – another indicator of food security, is just above the all-India rate of 35.6 per cent, the agricultural growth rate is one of the lowest among Indian states and is highly variable, and the diversion of crops in the Public Distribution System (PDS), while declining, is still 43 per cent while many states have rates of 25 per cent. Women’s status – their ability to make decisions – is an important component of their own wellbeing but also of their children’s nutrition status. The state is one of the best in this regard: indices of women’s status, female literacy rates, and maternal health indicators are all near the best in India. A strong health environment is vital for good nutrition status. Infection can result in higher nutrient requirements, lowers appetite and reduces the utilisation of food that is ingested via malabsorption and diarrhoea. For a relatively wealthy state, Maharashtra is lagging behind other states in this domain: access to improved water sources is close to the all-India average, while the percentage of those defecating in the open is 58 per cent – higher than the all-India average. The state’s public expenditure on health is one of the lowest in India: 18th out of 19 states at 0.55 per cent of Gross State Domestic Product. At the underlying level, the health environment appears to be the weak link in the nutrition chain.
What about the performance of the primary nutrition intervention, the Integrated Child Development Services (ICDS) programme? Data from the programme itself are encouraging: overall, in 2009 the state was rated as having the second-best performing ICDS programme among Indian states. Relative to other states, infrastructure is very good, coverage rates are average, the performance in filling frontline Anganwadi worker (AWW) vacancies is average (although good in absolute terms), but the improvements in reducing vacancy rates for supervisors and programme officers are only marginal (again, average for all India) and the caseload per Anganwadi Centre (AWC) has declined, slightly faster than the all India average. Ground reports from civil society on issues such as AWC coverage, functionality or AWW capacity/attendance are more negative (PEEP 2013; Sardeshpande, Abhay and Scott 2009). So while by some relative measures the state’s performance has been good on ICDS, the absolute potential for improvement is large.
1.4 What do the survey data tell us?
The comparisons of survey data from 2006 and 2012 revealed a number of additional insights. First, the decline in stunting, once we adjust for the age composition of the two surveys, is slightly lower, at 13 per cent rather than 15 per cent.3 This is still a significant average decline, but how is the decline distributed across different groups? The analysis in section 3 (Haddad and Valli 2014) suggests that the declines are broadly based: they are rural as well as urban; largest for the bottom wealth quintile; larger for those who are not literate, those with no improved water source or no improved sanitation facilities; strongest for younger mothers and those who are younger at the age of their first birth. Some of the larger declines are also seen by those who avail themselves of interventions, such as those who have more antenatal care visits and those who do not give birth at home.
These declines could reflect changes in the levels of potential determinants or changes in the relationship between determinants, or some combination. The quantitative analysis concludes that there has not been a significant shift in the ability of individual correlates to convert into reduced stunting, rather it is the levels of potential determinants that seem to be driving the declines. ICDS access has improved and several other aspects of maternal and reproductive health/rights seem to have improved, including: fewer young mothers and fewer women having their first birth at a young age; declines in illiteracy; fewer underweight mothers; more women receiving antenatal care; many fewer giving birth at home; raised exclusive breastfeeding levels; increased underlying infant diet diversity (although the percentage of children that achieve a minimum level of dietary diversity is low and stagnant); and women are more involved in decisions about their health. The quantitative
3 The 2012 survey is representative for children aged 0–2, but the 2005–2006 survey is representative for children aged 0–5, and this creates differences in the age composition of the two samples. Because stunting rates are so age specific, this difference in age composition means the two samples are not perfectly comparable. Given that the adjusted differences are not that large, we report unadjusted differences for all the subgroups to facilitate comparisons with the work of others (e.g. UNICEF 2013).

4
analysis notes that it is much more difficult to explain changes in wasting than stunting and, combined with the small decline in wasting in the period between 2006 and 2012, this issue needs to remain a high priority.
The multivariate analysis, for each survey year confirms many of these trends, although there are some factors that show no correlations in either year. The generally weak correlation between some breastfeeding practices, household food security and water and sanitation access variables with stunting and wasting rates warrants more in-depth exploration.
1.5 What does the stakeholder analysis tell us?
To capture stakeholders’ opinions and perceptions of the driving forces for the decline in child stunting, 28 stakeholder interviews and four focus group discussions were conducted in October 2013 in several districts in Maharashtra. The analysis of the interviews found that stakeholders held multiple factors responsible for the decline, including strong economic growth, improved social, nutrition and health programming and coverage, the launch of the state’s Nutrition Mission and the National Rural Health Mission (NRHM), strong political will to improve nutrition and a wider enabling environment for nutrition created by the media and civil society action.
The state’s Nutrition Mission and its predecessor, the Malnutrition Removal Campaign (or ‘Marathwada Initiative’) in Aurangabad district, were seen to be both driven by – and a driver of – the state’s political will and commitment to address undernutrition. The Nutrition Mission helped to make undernutrition more visible, for example by streamlining data collection at the ICDS and by introducing new approaches to data visualisation and communication to different political levels and the public. The strong focus on building capacity and the motivation of frontline workers to deliver nutrition and health services more effectively, the consistent involvement of a team of highly motivated and passionate people (both from inside and outside the Nutrition Mission) and the ability to innovate outside of usual bureaucratic functioning thanks to departmental independence and external funding were also highlighted by the stakeholders. Quantitative data documenting the good performance of ICDS in Maharashtra suggest that at least some of the efforts of the Nutrition Mission have paid off (see Haddad 2014).
The launch of the National Rural Health Mission in April 2005 was perceived as very important for the success in tackling child stunting. The NRHM improved access to public health care with a specific focus on maternal and child health services (including antenatal care and institutional delivery). Some stakeholders reflected that some of the observed improvements in child stunting may have occurred through strengthening of primary health care alone, but a majority of stakeholders argued that the combination of both improved nutrition and health service delivery is likely to have resulted in a much larger and more rapid decline in stunting.
The initial focus of the Nutrition Mission was on districts with high proportions of Scheduled Tribe (ST) populations.4 Consequently, many stakeholders speculated that the decline in stunting may be especially due to a decrease in undernutrition in these districts. Nevertheless, high levels of stunting persist among Scheduled Tribes and remain one of the greatest remaining challenges alongside urban stunting prevalence, persistent divisional variations in stunting and maintaining the Nutrition Mission’s momentum.5 As highlighted in the quantitative data, access to safe water and improved sanitation facilities were perceived as outstanding challenges, despite some improvements.
4 For the purposes of this report’s local and international readership we have used the common label ‘Scheduled Tribe’ (ST) to refer to those so categorised within the Indian Constitution and Maharashtra, or we use ‘tribal communities’. These refer to the diverse groups of people who might also be categorised elsewhere (whether in local or international contexts) as ‘indigenous’ or Adivasis. We have avoided where possible the common term ‘tribals’ (which can sometimes have a derogatory connotation, depending on usage). In the accompanying chapters on extant and survey data, these populations are categorised under the label ST.5 Analysis of the survey data supports the conclusions both that stunting was and is higher amongst ST communities and that it declined quicker. But when considering the range of factors that may be significant in predicting stunting amongst ST communities, the econometric analysis for stunting does not find an ‘ST-specific’ factor in either year (although it does for wasting – higher – in 2012). This lends credence to the conclusion that the same issues were affecting the ST population as were affecting other groups and communities (e.g. lack of adequate food and care), only more strongly – that is, there is no evidence to attribute higher stunting to the specificities of ‘tribal culture’.
5
1.6 Conclusions
The three very different approaches to answering the same question – what is driving the declines in stunting? – have produced similar conclusions. The conclusions are as follows.
First, if stunting cannot decline in this kind of context then it would struggle to decline in many places. The political, social and economic environment for stunting declines in Maharashtra was favourable. This includes: good economic growth, strong poverty reduction performance, governance that is not the best but not the worst, food security levels that are average, good performance on women’s empowerment and health, but with a vulnerability in the water and sanitation environment. ICDS performance is relatively good and slightly above all-India averages and the Nutrition Mission, supported by UNICEF, seems to have emerged organically and gained strength over time, serving as a model for many other states, particularly in its successful harnessing of the resources of the NRHM towards nutrition outcomes. The survey data confirm the broad-based and pro-poor nature of the declines in stunting, with large improvements in some of the determinants (although not improved water and sanitation). When most nutrition determinants are moving in the right direction, even in modest ways, large changes can happen.
Second, while the context is positive, it is far from perfect, and yet stunting has declined dramatically. For example, the water and sanitation environment remains relatively weak, nor is it improving as quickly as in some other Indian states; the food security situation could improve significantly; and ICDS frontline supervisor vacancies are not declining. That stunting rates can decline so rapidly in the absence of perfection is a very positive story and it is something of a counterpoint to an interpretation of the recent nutrition literature that implies we need to implement ten nutrition-specific interventions to 90 per cent coverage to generate 20 per cent declines in stunting.6 It is important to remember that those results are average results – there are plenty of cases where the impacts are much larger. It is also important to remember that these estimates are based on past data and that they do not have to define the future.
Third, while the future does not have to be captured by the past it needs to build on it and respect it – impacts of this nature can take over a decade to be fully realised and scaled up. This is especially true if the aim is to break the intergenerational cycle of undernutrition and improve maternal and child nutrition sustainably. In particular, we note that the journey to lower stunting rates in 2012 had its roots in the early 2000s work of V. Ramani and others. A number of dedicated bureaucrats, civil society activists and members of the media worked hard to frame the notion that a high level of undernutrition is not an acceptable norm. Once all the elements came together – good economic performance, improving governance (particularly of nutrition programmes), some strength in underlying determinants, improvements in the commitment to nutrition spending and interventions – it appears that a threshold was crossed and nutrition improved quickly.
Finally, while it is difficult to say whether or not the declines could have been achieved without the Nutrition Mission, we can say from our qualitative work that the stakeholders interviewed said it was very helpful. Primarily it signalled commitment from the top, it served to recalibrate norms of what is acceptable, it served as a clarion call to help focus both new and existing resources on malnutrition reduction and it meant that successive chief ministers were prepared to be held accountable for the delivery of results. The Nutrition Mission also sheds some light on the importance of leadership, both in the civil service and then civil society (V. Ramani and V. Krishna) and in government (the chief ministers).
It is impossible to speculate on whether the observed decline in stunting could have been achieved without the Nutrition Mission; however, it is without doubt that the vision and skills of the Mission leadership and its staff allowed much to be accomplished – from motivating the frontline to maintaining the political impetus and focus. Leadership on undernutrition reduction is particularly important given the lack of an institutional home and the multisectorality of action required. When leadership in government and civil society join forces within a reasonably supportive socioeconomic context, as Maharashtra shows us, public action can reduce undernutrition – fast.
6 This is the interpretation often given to the conclusions in Bhutta et al. (2013).
6
2 What is Driving the Stunting Declines in Maharashtra? Clues from Extant DataLawrence HaddadExecutive summary
The overall conclusion reached from this review of extant data and evidence is that if stunting cannot decline rapidly in Maharashtra then it cannot decline rapidly anywhere.
All the ingredients are present for strong declines in stunting: (1) strong economic growth that has an increasing ability to convert itself into poverty reduction; (2) governance that is moderately good in general and particularly good around nutrition; (3) a budget commitment to nutrition and social services that is increasing, although from a very low base; (4) stronger trends in some underlying determinants (women’s status and health services) and with weaker performance in hunger reduction and sanitation; and (5) relatively good performance of the Integrated Child Development Services (ICDS) programme and the National Rural Health Mission (NRHM) programme.
The implications of this paper are several. First, rapid declines in stunting are possible and seem to be linked to improvements on multiple fronts: the enabling environment (economic, governance, commitment); underlying determinants (food security, women’s status, health environment); and immediate determinants (for example ICDS and NRHM). Second, it is difficult to apportion out the reductions by factor. The quantitative analysis might be able to do some of this, but not at the level of detail we would like because some of the key variables do not vary at the household or individual level (for example governance or economic growth or the Nutrition Mission) or we simply do not have the variables (for example Anganwadi Centre [AWC] data) attribute the improvement to any. Third, there is substantial room for improvement in some of the determinants. Food security efforts seem less strong, open defecation rates are very high, nutrition budgets seem low as a percentage of overall state budgets, ICDS coverage rates of the supplementary nutrition programme remain low and the nutrition knowledge of Anganwadi Workers (AWWs) remains variable. Finally, political commitment seems to be key for greater leverage of a fundamentally positive background for stunting reductions. The qualitative interview paper will give us more insights into just exactly why the Nutrition Mission came into being, what it has achieved and how it has achieved it, but its importance seems clear.
Several questions remain unanswered. First, based on the data assembled here, can we anticipate large declines in stunting rates in other Indian states? It is difficult to say. On the one hand, the changes in the determinants have not been spectacular relative to other states, but the confluence of factors moving in the right direction, from an already strong base, does feel special. One could credibly argue that such stunting declines will be seen in other states but perhaps not at such rapid rates. Second, would a Nutrition Mission make a positive difference to stunting rates against a less promising backdrop? Again we can only guess, but our sense is that a Nutrition Mission has a good benefit-to-cost ratio although it is impossible to say what the benefits foregone would be if a Nutrition Mission meant one less Mission on another issue. Finally, what are the lessons for India and beyond? As argued earlier, in Maharashtra, our sense is that the large number of factors pulling in favour of reductions in stunting rates is unusual and that in many other contexts, there will be a greater need to prioritise investments more carefully, to identify the weak links in the nutrition chain, to invest in the factors that hold other efforts back.
The final lesson for other contexts is that stunting rates can be driven down fast – the conditions in Maharashtra were conducive, but not so perfect and unique that these results cannot be achieved elsewhere.
7
2.1 Introduction
In Maharashtra, stunting rates of children under the age of two have declined dramatically. What were the main drivers of this dramatic decline? The answer to this question may prove to be very helpful to Maharashtra, to India, and to the wider nutrition community as it attempts to scale up improved nutrition outcomes towards the World Health Assembly nutrition goals.
There are several hypotheses in the less academic arena for this rapid decline in stunting rates – and none from the more academic literature. Annex 1 outlines some suggestions from UNICEF on what is responsible for the declines: the 2006 Nutrition Mission and good performance in filling frontline nutrition worker positions. Annex 2 (an article from Business Today) suggests the movement of services closer to households, together with better monitoring of nutrition outcomes and their links to child growth. An article from the popular publication Jigyasa highlights improved education of mothers, better capacity of frontline nutrition workers, stronger targeting of vulnerable groups and better departmental coordination.
This paper begins by briefly reviewing some of the key nutrition outcomes in Maharashtra and how they have declined. It then reviews the literature and extant data on the basic determinants of nutrition status – economic performance, governance and nutrition commitment. We then discuss underlying determinants such as food security, women’s status and the health environment and finally some of the programmatic factors that impinge on the more immediate determinants of nutrition status, such as ICDS performance.
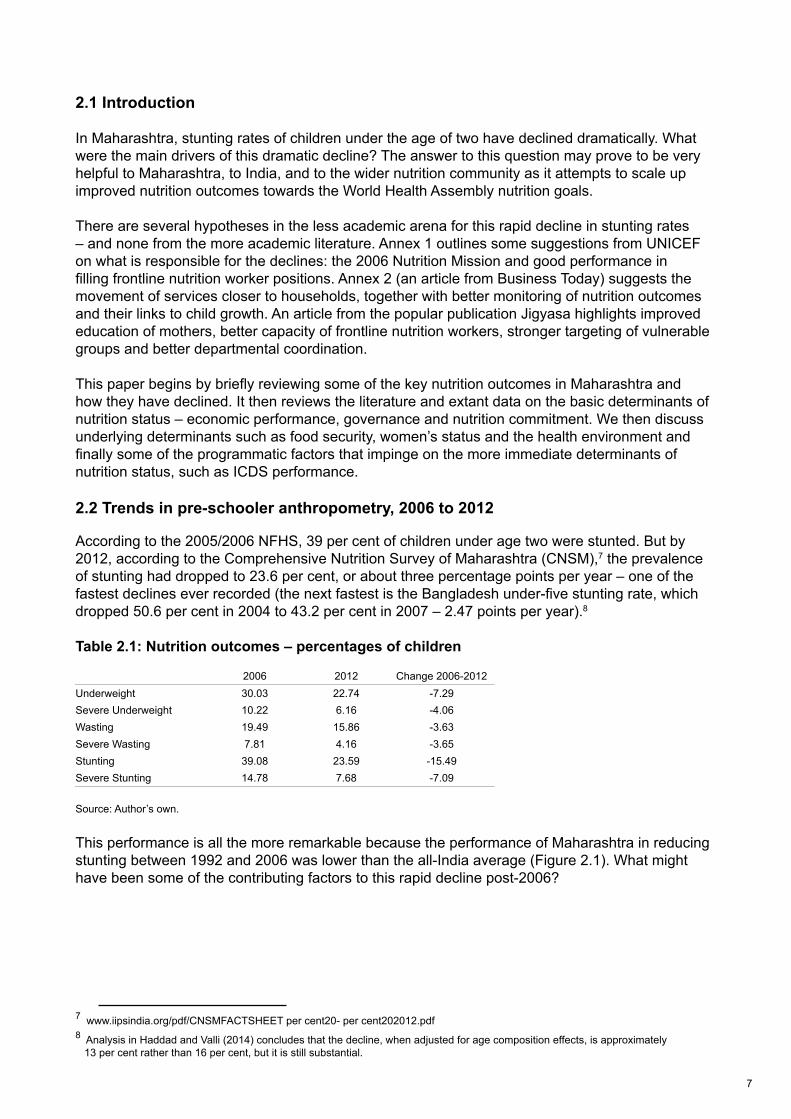
2.2 Trends in pre-schooler anthropometry, 2006 to 2012
According to the 2005/2006 NFHS, 39 per cent of children under age two were stunted. But by 2012, according to the Comprehensive Nutrition Survey of Maharashtra (CNSM),7 the prevalence of stunting had dropped to 23.6 per cent, or about three percentage points per year – one of the fastest declines ever recorded (the next fastest is the Bangladesh under-five stunting rate, which dropped 50.6 per cent in 2004 to 43.2 per cent in 2007 – 2.47 points per year).8
Table 2.1: Nutrition outcomes – percentages of children
Source: Author’s own.
This performance is all the more remarkable because the performance of Maharashtra in reducing stunting between 1992 and 2006 was lower than the all-India average (Figure 2.1). What might have been some of the contributing factors to this rapid decline post-2006?
7 www.iipsindia.org/pdf/CNSMFACTSHEET per cent20- per cent202012.pdf8 Analysis in Haddad and Valli (2014) concludes that the decline, when adjusted for age composition effects, is approximately 13 per cent rather than 16 per cent, but it is still substantial.
2006 2012 Percentage Point Change
No. % No. % 2006-2012 Std.Error
Underweight 347 30.0 549 22.7 -7.3 1.66
Wasting 225 19.5 384 15.9 -3.6 1.43
Stunting 451 39.1 572 23.7 -15.4 1.70
Sample: Children aged 0-24 months
Table 1: Nutrition Outcomes - Percentage of Children
2006 2012 Change 2006-2012Underweight 30.03 22.74 -7.29Severe Underweight 10.22 6.16 -4.06Wasting 19.49 15.86 -3.63Severe Wasting 7.81 4.16 -3.65Stunting 39.08 23.59 -15.49Severe Stunting 14.78 7.68 -7.09
Sample: Children under two years of age (IIPS 2007; 2013)
Table 2: Nutrition Outcomes - Percentage of Children, by Wealth Indicators
2005-6 2012 2005/6-2012 Std.Error
Wealth index quantilesPoorest 53.71 30.75 -22.96 4.13Second 38.29 29.21 -9.08 4.05Middle 38.67 22.46 -16.22 3.77Fourth 30.00 18.80 -11.20 3.62Richest 22.99 17.12 -5.87 3.41
Source: Haddad and Valli (2014)

8
Figure 2.1: Change in stunting, by state, in India, 1992/1993 to 2005/2006
Source: Adapted from Menon (2012).
As Table 2.2 notes, a large proportion of this decline has come from the bottom wealth quintile, which suggests a pro-poor approach to stunting reduction.
Table 2.2: Nutrition outcomes – percentages of children, by wealth indicators
Source: Haddad and Valli (2014).
2.3 Trends in basic determinants
Basic determinants are less proximal than the immediate or underling determinants but create a positive space for these determinants to work within and can improve their potency (Smith and Haddad 2014).
2.3.1 Economic performance
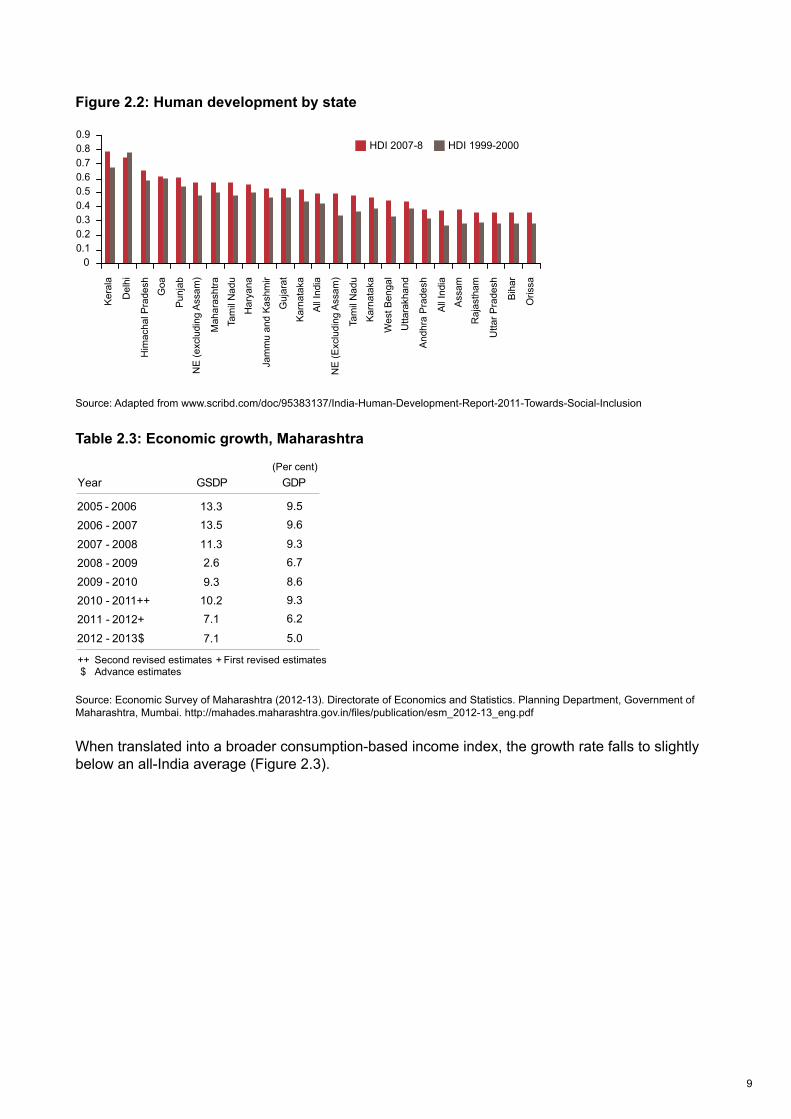
Maharashtra is one of the wealthiest states in India, despite this it is only seventh out of 21 in terms of the Human Development Index (Figure 2.2). Its economic growth rate in terms of Gross State Domestic Product (GSDP) has been strong and slightly above all-India levels (Figure 2.3).
1
Trip
ura
Aru
nach
al P
rade
shA
ssam
Ja
mm
u an
d K
ashm
irP
unja
bB
ihar
Goa
All
Indi
aU
ttar P
rade
shH
arya
naO
rissa
Ker
ala
Miz
oram
Raj
asth
amK
arna
taka
Meg
hala
yaM
anip
urD
elhi
Mah
aras
htra
Guj
arat
Nag
alan
dH
imac
hal P
rade
shS
ikki
mW
est B
enga
lM
adhy
a P
rade
shA
ndhr
a P
rade
shTa
mil
Nad
uU
ttara
ncha
lJh
arkh
and
Chh
attis
garh
5
0
-5
-10
-15
-20
-25
Not available because height data not gathered in 1992-93
Change in stunting
2006 2012 Percentage Point Change
No. % No. % 2006-2012 Std.Error
Underweight 347 30.0 549 22.7 -7.3 1.66
Wasting 225 19.5 384 15.9 -3.6 1.43
Stunting 451 39.1 572 23.7 -15.4 1.70
Sample: Children aged 0-24 months
Table 1: Nutrition Outcomes - Percentage of Children
2006 2012 Change 2006-2012Underweight 30.03 22.74 -7.29Severe Underweight 10.22 6.16 -4.06Wasting 19.49 15.86 -3.63Severe Wasting 7.81 4.16 -3.65Stunting 39.08 23.59 -15.49Severe Stunting 14.78 7.68 -7.09
Sample: Children under two years of age (IIPS 2007; 2013)
Table 2: Nutrition Outcomes - Percentage of Children, by Wealth Indicators
2005-6 2012 2005/6-2012 Std.Error
Wealth index quantilesPoorest 53.71 30.75 -22.96 4.13Second 38.29 29.21 -9.08 4.05Middle 38.67 22.46 -16.22 3.77Fourth 30.00 18.80 -11.20 3.62Richest 22.99 17.12 -5.87 3.41
Source: Haddad and Valli (2014)
9
Figure 2.2: Human development by state
Source: Adapted from www.scribd.com/doc/95383137/India-Human-Development-Report-2011-Towards-Social-Inclusion
Table 2.3: Economic growth, Maharashtra
Source: Economic Survey of Maharashtra (2012-13). Directorate of Economics and Statistics. Planning Department, Government of Maharashtra, Mumbai. http://mahades.maharashtra.gov.in/files/publication/esm_2012-13_eng.pdf
When translated into a broader consumption-based income index, the growth rate falls to slightly below an all-India average (Figure 2.3).
3
Ker
ala
Del
hi
Him
acha
l Pra
desh
Goa
Pun
jab
NE
(exc
ludi
ng A
ssam
)
Mah
aras
htra
Tam
il N
adu
Har
yana
Jam
mu
and
Kas
hmir
Guj
arat
Kar
nata
ka
All
Indi
a
NE
(Exc
ludi
ng A
ssam
)
Tam
il N
adu
Kar
nata
ka
Wes
t Ben
gal
Utta
rakh
and
And
hra
Pra
desh
All
Indi
a
Ass
am
Raj
asth
am
Utta
r Pra
desh
Bih
ar
Oris
sa
HDI 1999-2000 HDI 2007-8
4
2005 - 20062006 - 20072007 - 20082008 - 20092009 - 20102010 - 2011++2011 - 2012+2012 - 2013$
10
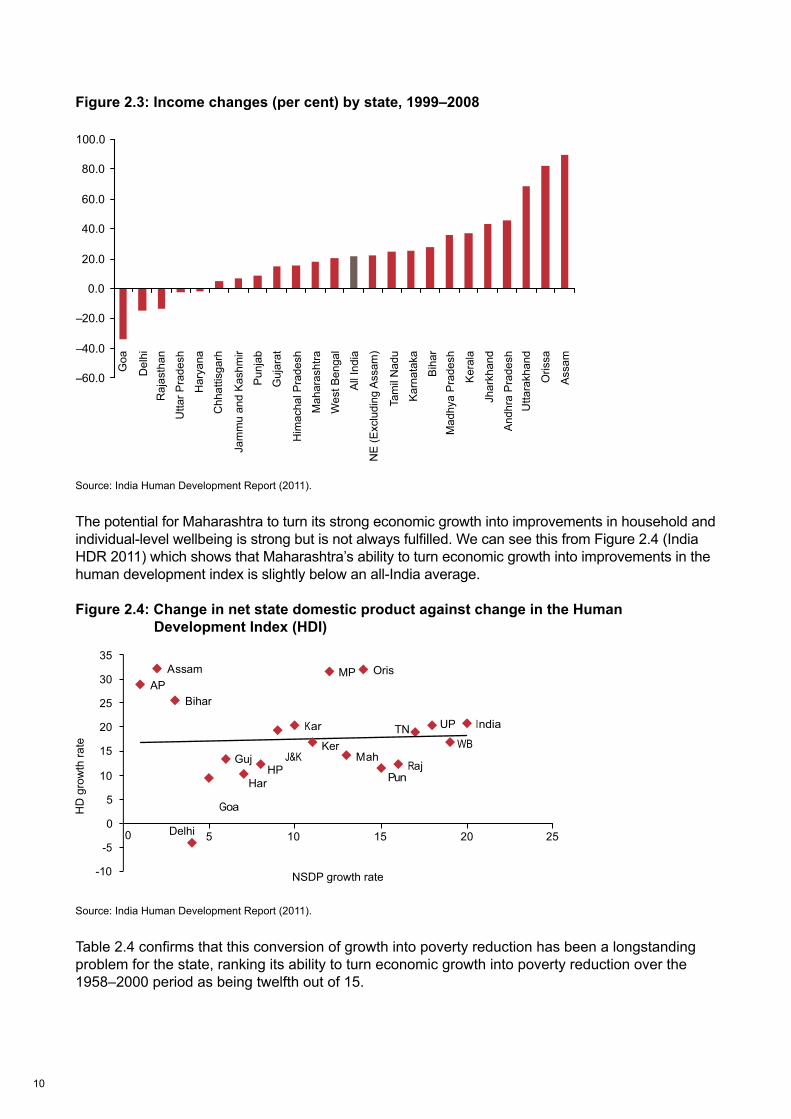
Figure 2.3: Income changes (per cent) by state, 1999–2008
Source: India Human Development Report (2011).
The potential for Maharashtra to turn its strong economic growth into improvements in household and individual-level wellbeing is strong but is not always fulfilled. We can see this from Figure 2.4 (India HDR 2011) which shows that Maharashtra’s ability to turn economic growth into improvements in the human development index is slightly below an all-India average.
Figure 2.4: Change in net state domestic product against change in the Human Development Index (HDI)
Source: India Human Development Report (2011).
Table 2.4 confirms that this conversion of growth into poverty reduction has been a longstanding problem for the state, ranking its ability to turn economic growth into poverty reduction over the 1958–2000 period as being twelfth out of 15.
5
Goa
Del
hiR
ajas
than
Utta
r Pra
desh
Har
yana
Chh
attis
garh
Jam
mu
and
Kas
hmir
Pun
jab
Guj
arat
Him
acha
l Pra
desh
Mah
aras
htra
Wes
t Ben
gal
All
Indi
a
NE
(Exc
ludi
ng A
ssam
)
Tam
il N
adu
Kar
nata
ka
Bih
arM
adhy
a P
rade
sh
Ker
ala
Jhar
khan
d
And
hra
Pra
desh
Utta
rakh
and
Oris
sa
Ass
am
6
NSDP growth rate
HD
gro
wth
rate
11
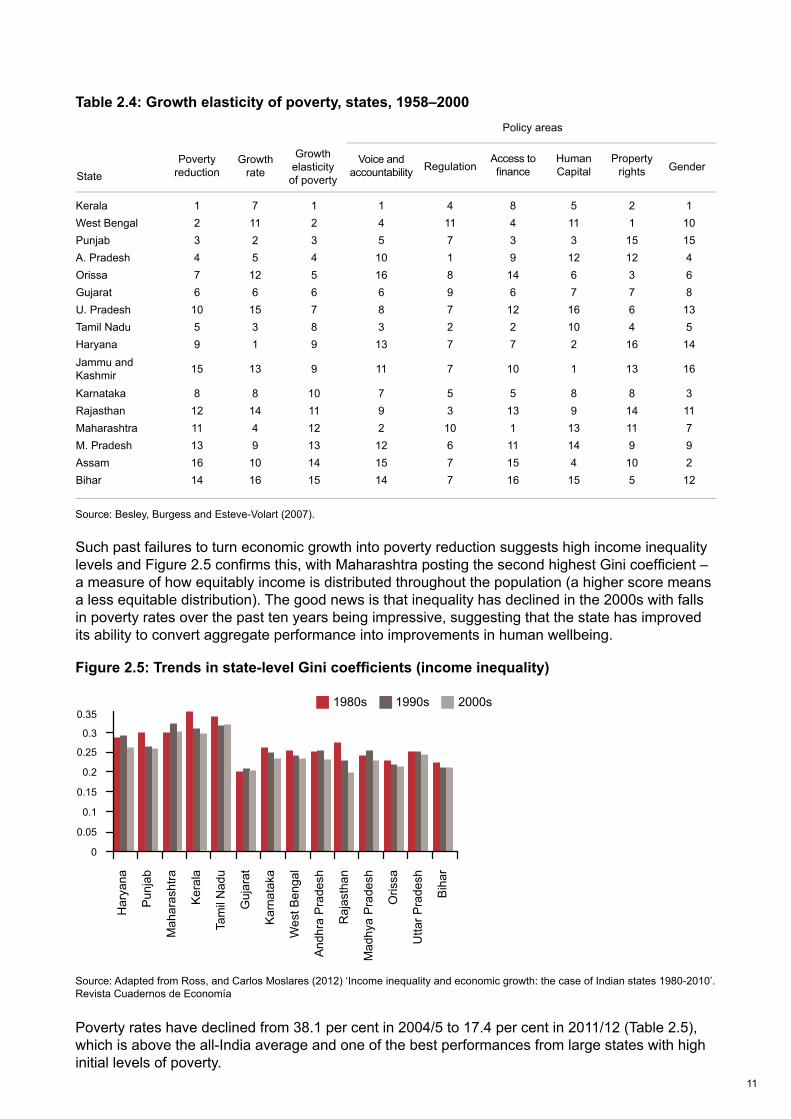
Table 2.4: Growth elasticity of poverty, states, 1958–2000
Source: Besley, Burgess and Esteve-Volart (2007).
Such past failures to turn economic growth into poverty reduction suggests high income inequality levels and Figure 2.5 confirms this, with Maharashtra posting the second highest Gini coefficient – a measure of how equitably income is distributed throughout the population (a higher score means a less equitable distribution). The good news is that inequality has declined in the 2000s with falls in poverty rates over the past ten years being impressive, suggesting that the state has improved its ability to convert aggregate performance into improvements in human wellbeing.
Figure 2.5: Trends in state-level Gini coefficients (income inequality)
Source: Adapted from Ross, and Carlos Moslares (2012) ‘Income inequality and economic growth: the case of Indian states 1980-2010’.Revista Cuadernos de Economía
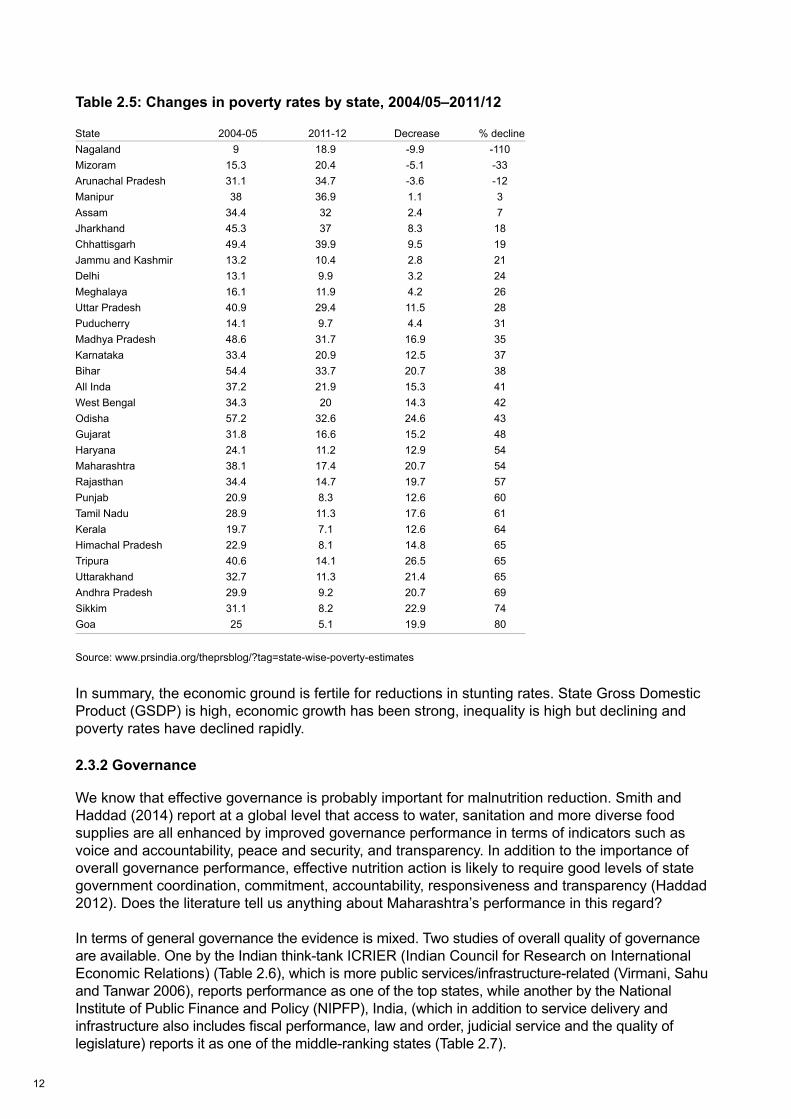
Poverty rates have declined from 38.1 per cent in 2004/5 to 17.4 per cent in 2011/12 (Table 2.5), which is above the all-India average and one of the best performances from large states with high initial levels of poverty.
7
Kerala 1 7 1 1 4 8 5 2 1West Bengal 2 11 2 4 11 4 11 1 10Punjab 3 2 3 5 7 3 3 15 15A. Pradesh 4 5 4 10 1 9 12 12 4Orissa 7 12 5 16 8 14 6 3 6Gujarat 6 6 6 6 9 6 7 7 8U. Pradesh 10 15 7 8 7 12 16 6 13Tamil Nadu 5 3 8 3 2 2 10 4 5Haryana 9 1 9 13 7 7 2 16 14Jammu and Kashmir 15 13 9 11 7 10 1 13 16
Karnataka 8 8 10 7 5 5 8 8 3Rajasthan 12 14 11 9 3 13 9 14 11Maharashtra 11 4 12 2 10 1 13 11 7M. Pradesh 13 9 13 12 6 11 14 9 9Assam 16 10 14 15 7 15 4 10 2Bihar 14 16 15 14 7 16 15 5 12
StatePoverty
reductionGrowth
rate
Growthelasticityof poverty
Voice and accountability Regulation
Access to fi nance
Human Capital
Property rights Gender
Policy areas
8
Har
yana
Pun
jab
Mah
aras
htra
Ker
ala
Tam
il N
adu
Guj
arat
Kar
nata
ka
Wes
t Ben
gal
And
hra
Pra
desh
Raj
asth
an
Mad
hya
Pra
desh
Oris
sa
Utta
r Pra
desh
Bih
ar
0.35
0.3
0.25
0.2
0.15
0.1
0.05
0
1980s 1990s 2000s
12
Table 2.5: Changes in poverty rates by state, 2004/05–2011/12
Source: www.prsindia.org/theprsblog/?tag=state-wise-poverty-estimates
In summary, the economic ground is fertile for reductions in stunting rates. State Gross Domestic Product (GSDP) is high, economic growth has been strong, inequality is high but declining and poverty rates have declined rapidly.
2.3.2 Governance
We know that effective governance is probably important for malnutrition reduction. Smith and Haddad (2014) report at a global level that access to water, sanitation and more diverse food supplies are all enhanced by improved governance performance in terms of indicators such as voice and accountability, peace and security, and transparency. In addition to the importance of overall governance performance, effective nutrition action is likely to require good levels of state government coordination, commitment, accountability, responsiveness and transparency (Haddad 2012). Does the literature tell us anything about Maharashtra’s performance in this regard?
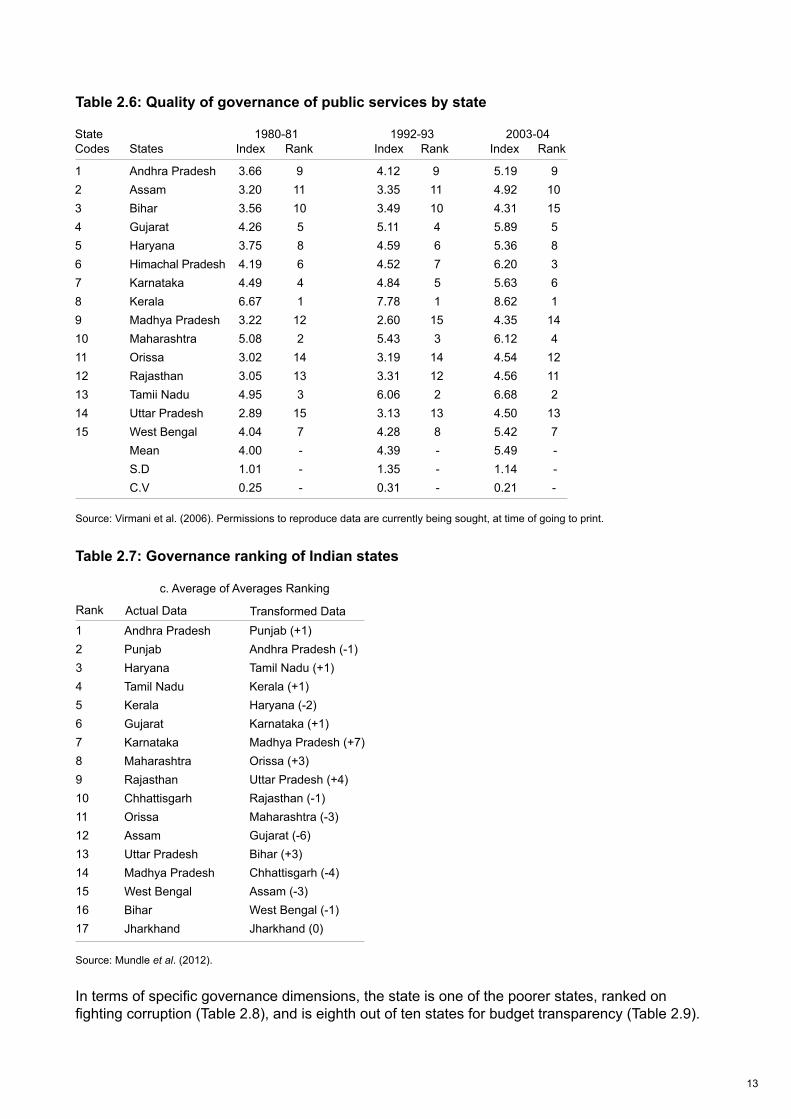
In terms of general governance the evidence is mixed. Two studies of overall quality of governance are available. One by the Indian think-tank ICRIER (Indian Council for Research on International Economic Relations) (Table 2.6), which is more public services/infrastructure-related (Virmani, Sahu and Tanwar 2006), reports performance as one of the top states, while another by the National Institute of Public Finance and Policy (NIPFP), India, (which in addition to service delivery and infrastructure also includes fiscal performance, law and order, judicial service and the quality of legislature) reports it as one of the middle-ranking states (Table 2.7).
Figure 9: Changes in Poverty Rates by State, 2004-05 to 2011-12
State 2004-05 2011-12 Decrease % declineNagaland 9 18.9 -9.9 -110Mizoram 15.3 20.4 -5.1 -33Arunachal Pradesh 31.1 34.7 -3.6 -12Manipur 38 36.9 1.1 3Assam 34.4 32 2.4 7Jharkhand 45.3 37 8.3 18Chhattisgarh 49.4 39.9 9.5 19Jammu and Kashmir 13.2 10.4 2.8 21Delhi 13.1 9.9 3.2 24Meghalaya 16.1 11.9 4.2 26Uttar Pradesh 40.9 29.4 11.5 28Puducherry 14.1 9.7 4.4 31Madhya Pradesh 48.6 31.7 16.9 35Karnataka 33.4 20.9 12.5 37Bihar 54.4 33.7 20.7 38All Inda 37.2 21.9 15.3 41West Bengal 34.3 20 14.3 42Odisha 57.2 32.6 24.6 43Gujarat 31.8 16.6 15.2 48Haryana 24.1 11.2 12.9 54Maharashtra 38.1 17.4 20.7 54Rajasthan 34.4 14.7 19.7 57Punjab 20.9 8.3 12.6 60Tamil Nadu 28.9 11.3 17.6 61Kerala 19.7 7.1 12.6 64Himachal Pradesh 22.9 8.1 14.8 65Tripura 40.6 14.1 26.5 65Uttarakhand 32.7 11.3 21.4 65Andhra Pradesh 29.9 9.2 20.7 69Sikkim 31.1 8.2 22.9 74Goa 25 5.1 19.9 80
Source: http://www.prsindia.org/theprsblog/?tag=state-wise-poverty-estimates
9
State 1980-81 1992-93 2003-04Codes States Index Rank Index Rank Index Rank
1 Andhra Pradesh 3.66 9 4.12 9 5.19 92 Assam 3.20 11 3.35 11 4.92 103 Bihar 3.56 10 3.49 10 4.31 154 Gujarat 4.26 5 5.11 4 5.89 55 Haryana 3.75 8 4.59 6 5.36 8 6 Himachal Pradesh 4.19 6 4.52 7 6.20 3 7 Karnataka 4.49 4 4.84 5 5.63 68 Kerala 6.67 1 7.78 1 8.62 19 Madhya Pradesh 3.22 12 2.60 15 4.35 14 10 Maharashtra 5.08 2 5.43 3 6.12 411 Orissa 3.02 14 3.19 14 4.54 1212 Rajasthan 3.05 13 3.31 12 4.56 1113 Tamii Nadu 4.95 3 6.06 2 6.68 214 Uttar Pradesh 2.89 15 3.13 13 4.50 1315 West Bengal 4.04 7 4.28 8 5.42 7 Mean 4.00 - 4.39 - 5.49 - S.D 1.01 - 1.35 - 1.14 - C.V 0.25 - 0.31 - 0.21 -
13
Figure 9: Changes in Poverty Rates by State, 2004-05 to 2011-12
State 2004-05 2011-12 Decrease % declineNagaland 9 18.9 -9.9 -110Mizoram 15.3 20.4 -5.1 -33Arunachal Pradesh 31.1 34.7 -3.6 -12Manipur 38 36.9 1.1 3Assam 34.4 32 2.4 7Jharkhand 45.3 37 8.3 18Chhattisgarh 49.4 39.9 9.5 19Jammu and Kashmir 13.2 10.4 2.8 21Delhi 13.1 9.9 3.2 24Meghalaya 16.1 11.9 4.2 26Uttar Pradesh 40.9 29.4 11.5 28Puducherry 14.1 9.7 4.4 31Madhya Pradesh 48.6 31.7 16.9 35Karnataka 33.4 20.9 12.5 37Bihar 54.4 33.7 20.7 38All Inda 37.2 21.9 15.3 41West Bengal 34.3 20 14.3 42Odisha 57.2 32.6 24.6 43Gujarat 31.8 16.6 15.2 48Haryana 24.1 11.2 12.9 54Maharashtra 38.1 17.4 20.7 54Rajasthan 34.4 14.7 19.7 57Punjab 20.9 8.3 12.6 60Tamil Nadu 28.9 11.3 17.6 61Kerala 19.7 7.1 12.6 64Himachal Pradesh 22.9 8.1 14.8 65Tripura 40.6 14.1 26.5 65Uttarakhand 32.7 11.3 21.4 65Andhra Pradesh 29.9 9.2 20.7 69Sikkim 31.1 8.2 22.9 74Goa 25 5.1 19.9 80
Source: http://www.prsindia.org/theprsblog/?tag=state-wise-poverty-estimates
Table 2.6: Quality of governance of public services by state
Source: Virmani et al. (2006). Permissions to reproduce data are currently being sought, at time of going to print.
Table 2.7: Governance ranking of Indian states
Source: Mundle et al. (2012).
In terms of specific governance dimensions, the state is one of the poorer states, ranked on fighting corruption (Table 2.8), and is eighth out of ten states for budget transparency (Table 2.9).
9
State 1980-81 1992-93 2003-04Codes States Index Rank Index Rank Index Rank
1 Andhra Pradesh 3.66 9 4.12 9 5.19 92 Assam 3.20 11 3.35 11 4.92 103 Bihar 3.56 10 3.49 10 4.31 154 Gujarat 4.26 5 5.11 4 5.89 55 Haryana 3.75 8 4.59 6 5.36 8 6 Himachal Pradesh 4.19 6 4.52 7 6.20 3 7 Karnataka 4.49 4 4.84 5 5.63 68 Kerala 6.67 1 7.78 1 8.62 19 Madhya Pradesh 3.22 12 2.60 15 4.35 14 10 Maharashtra 5.08 2 5.43 3 6.12 411 Orissa 3.02 14 3.19 14 4.54 1212 Rajasthan 3.05 13 3.31 12 4.56 1113 Tamii Nadu 4.95 3 6.06 2 6.68 214 Uttar Pradesh 2.89 15 3.13 13 4.50 1315 West Bengal 4.04 7 4.28 8 5.42 7 Mean 4.00 - 4.39 - 5.49 - S.D 1.01 - 1.35 - 1.14 - C.V 0.25 - 0.31 - 0.21 -
10
Rank
1234567891011121314151617
Actual Data Transformed Data
c. Average of Averages Ranking
Punjab (+1)Andhra Pradesh (-1)Tamil Nadu (+1)Kerala (+1)Haryana (-2)Karnataka (+1)Madhya Pradesh (+7)Orissa (+3)Uttar Pradesh (+4)Rajasthan (-1)Maharashtra (-3)Gujarat (-6)Bihar (+3)Chhattisgarh (-4)Assam (-3)West Bengal (-1)Jharkhand (0)
Andhra Pradesh PunjabHaryanaTamil NaduKeralaGujaratKarnatakaMaharashtraRajasthanChhattisgarhOrissaAssamUttar PradeshMadhya PradeshWest BengalBiharJharkhand

14
Table 2.8: Rating major states on anti corruption efforts (World Financial Review)
Note: A higher number means a bigger effort in fighting corruption
Source: www.worldfinancialreview.com/?p=1575
Table 2.9: Budget transparency in selected states (Centre for Budget and Governance Accountability)
Source: Centre for Budget and Governance Accountability (n.d.).
11
Transparency Parameters
Availability of Budget Documents 68 67 65 87 72 68 65 68 80 64
Completeness of the Information 75 74 81 85 74 81 77 75 56 69
Facilitating Understanding and Interpretation of the Information
Timeliness of the Information 59 51 77 77 53 84 53 69 25 33
Audit and Performance Assessment 39 29 55 39 23 67 35 31 35 35
Scope for Legislative Scrutiny 50 55 43 55 38 62 41 60 36 36
Practices relating to Budgeting forDisadvantaged Sections
Practices relating to Fiscal Decentralization 24 31 19 24 27 14 17 29 19 29
Overall Budget Transparency Score (in %) 51.8 50.1 56.1 61.7 48.4 60.2 48.3 52.6 44.0 43.5
And
hra
Pra
desh
Ass
am
Chh
attis
garh
Guj
arat
Jhar
khan
d
Mad
hya
Pra
desh
Mah
aras
htra
Odi
sha
Raj
asth
an
Utta
r Pra
desh
Average Transparency Score
Stat
es
51 50 39 65 64 35 70 47 71 42
49 44 71 63 37 70 29 43 30 40
12
States 1990-95 1996-2000 2001-2005 2006-2010
Bihar 0.41 0.30 0.43 0.88Gujarat 0.48 0.57 0.64 0.69Andhra Pradesh 0.53 0.73 0.55 0.61Punjab 0.32 0.46 0.46 0.60Jammu & Kashmir 0.13 0.32 0.17 0.40Haryana 0.33 0.60 0.31 0.37Himachal Pradesh 0.26 0.14 0.23 0.35Uttaranchal - - 0.32 0.33Tamil Nadu 0.19 0.20 0.24 0.29Madhya Pradesh 0.23 0.22 0.31 0.29Karnataka 0.24 0.19 0.20 0.29Rajasthan 0.27 0.23 0.26 0.27Kerala 0.16 0.20 0.22 0.27Maharashtra 0.45 0.29 0.27 0.26Chhattisgarh - - 0.34 0.24Uttar Pradesh 0.11 0.11 0.16 0.21Orissa 0.22 0.16 0.15 0.19Assam 0.21 0.02 0.14 0.17Jharkhand - - 0.25 0.17West Bengal 0.11 0.08 0.03 0.01
15
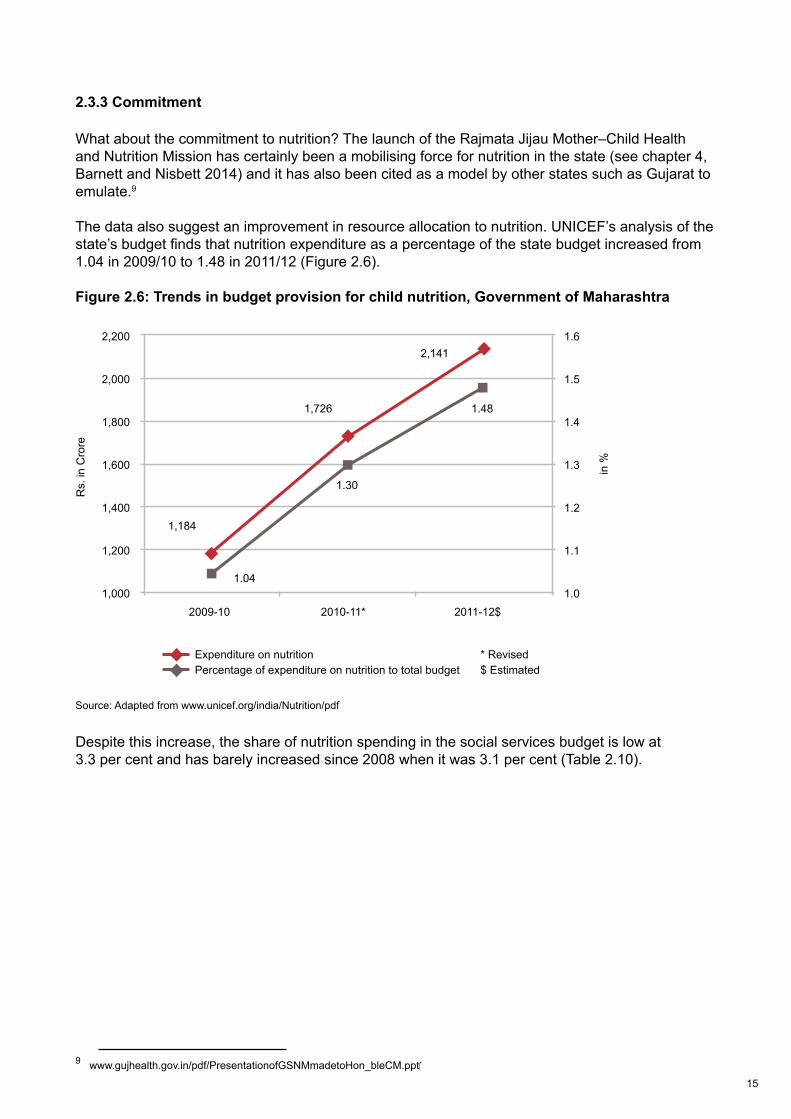
2.3.3 Commitment
What about the commitment to nutrition? The launch of the Rajmata Jijau Mother–Child Health and Nutrition Mission has certainly been a mobilising force for nutrition in the state (see chapter 4, Barnett and Nisbett 2014) and it has also been cited as a model by other states such as Gujarat to emulate.9
The data also suggest an improvement in resource allocation to nutrition. UNICEF’s analysis of the state’s budget finds that nutrition expenditure as a percentage of the state budget increased from 1.04 in 2009/10 to 1.48 in 2011/12 (Figure 2.6).
Figure 2.6: Trends in budget provision for child nutrition, Government of Maharashtra
Source: Adapted from www.unicef.org/india/Nutrition/pdf
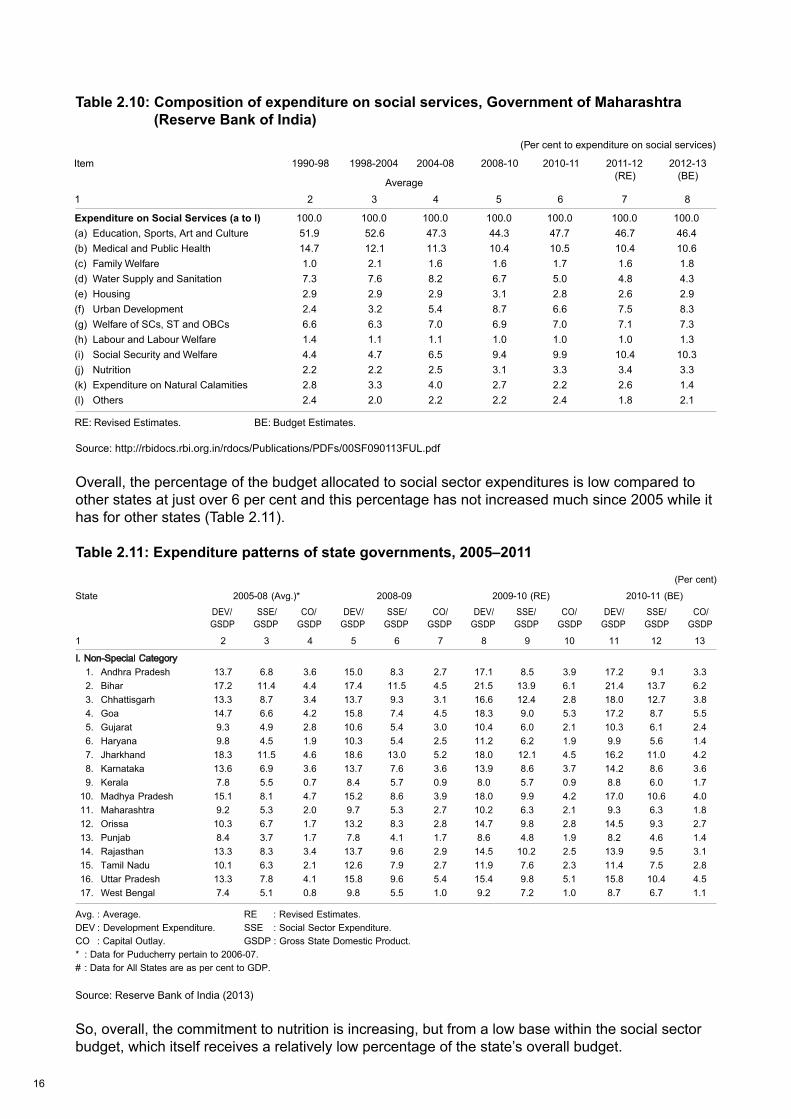
Despite this increase, the share of nutrition spending in the social services budget is low at 3.3 per cent and has barely increased since 2008 when it was 3.1 per cent (Table 2.10).
9 www.gujhealth.gov.in/pdf/PresentationofGSNMmadetoHon_bleCM.ppt
13
2,200
2,000
1,800
1,600
1,400
1,200
1,000
1.6
1.5
1.4
1.3
1.2
1.1
1.02009-10 2010-11* 2011-12$
* Revised$ Estimated
Expenditure on nutritionPercentage of expenditure on nutrition to total budget
Rs.
in C
rore
in %
1,184
1,726
2,141
1.48
1.30
1.04
16
Table 2.10: Composition of expenditure on social services, Government of Maharashtra (Reserve Bank of India)
Source: http://rbidocs.rbi.org.in/rdocs/Publications/PDFs/00SF090113FUL.pdf
Overall, the percentage of the budget allocated to social sector expenditures is low compared to other states at just over 6 per cent and this percentage has not increased much since 2005 while it has for other states (Table 2.11).
Table 2.11: Expenditure patterns of state governments, 2005–2011
Source: Reserve Bank of India (2013)
So, overall, the commitment to nutrition is increasing, but from a low base within the social sector budget, which itself receives a relatively low percentage of the state’s overall budget.
2012-132011-12(RE) (BE)
2008-10 2010-112004-081990-98 1998-2004Item
Average
17
2.4 Trends in underlying determinants
Food security, the status of women, and the quality of the health environment are vital underlying determinants of undernutrition. If these underlying determinants are strong they will help accelerate declines in undernutrition.
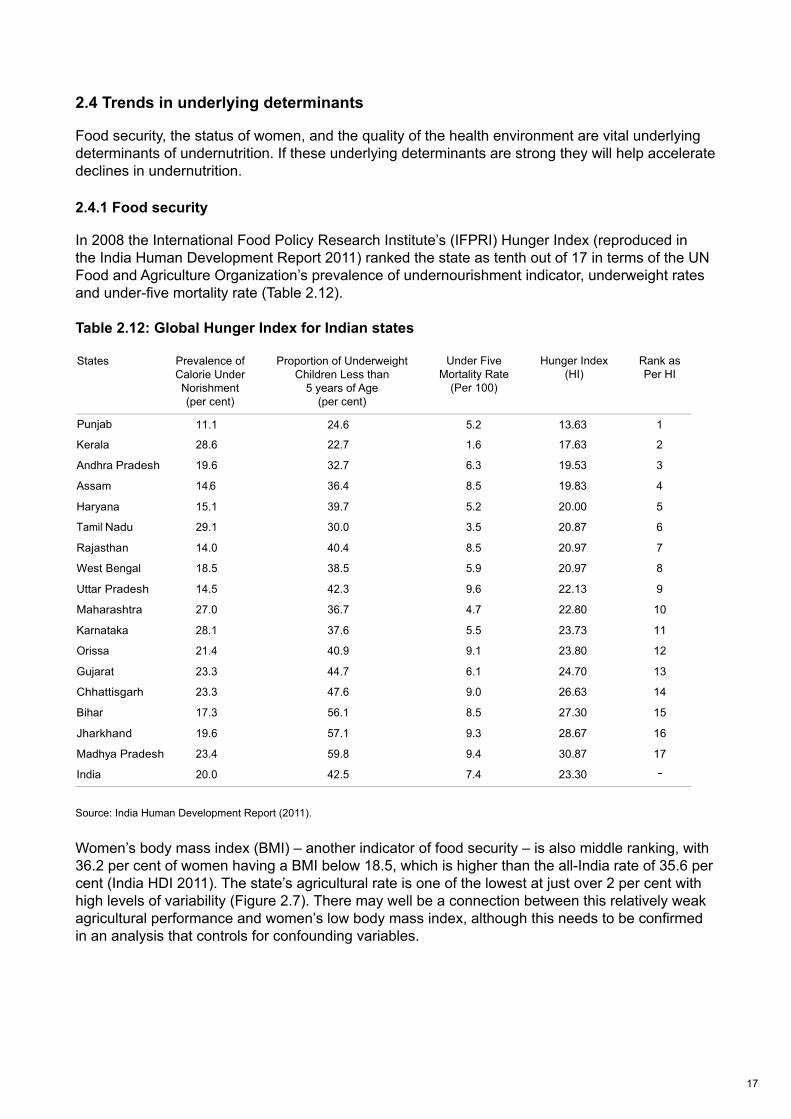
2.4.1 Food security
In 2008 the International Food Policy Research Institute’s (IFPRI) Hunger Index (reproduced in the India Human Development Report 2011) ranked the state as tenth out of 17 in terms of the UN Food and Agriculture Organization’s prevalence of undernourishment indicator, underweight rates and under-five mortality rate (Table 2.12).
Table 2.12: Global Hunger Index for Indian states
Source: India Human Development Report (2011).
Women’s body mass index (BMI) – another indicator of food security – is also middle ranking, with 36.2 per cent of women having a BMI below 18.5, which is higher than the all-India rate of 35.6 per cent (India HDI 2011). The state’s agricultural rate is one of the lowest at just over 2 per cent with high levels of variability (Figure 2.7). There may well be a connection between this relatively weak agricultural performance and women’s low body mass index, although this needs to be confirmed in an analysis that controls for confounding variables.
Punjab
States Prevalence ofCalorie UnderNorishment(per cent)
Proportion of UnderweightChildren Less than
5 years of Age(per cent)
Under FiveMortality Rate
(Per 100)
Hunger Index(HI)
Rank asPer HI
-

18
Figure 2.7: Annual average growth rate from agriculture, Indian states
Source: Adapted from http://164.100.47.132/paperlaidfiles/AGRICULTURE/State%20of%20Indian%20Agriculture%202012-13%20(English)%20with%20cover.pdf
Even though Maharashtra is one of the more industrialised states in India, agriculture is still a major employer with agriculture claiming over 50 per cent of the workforce in the 2001 census. So this low agricultural productivity is important because agriculture is not only about food production but is also a generator of jobs and income, especially for the poorer households in rural areas, and a downward pressure on food price inflation.
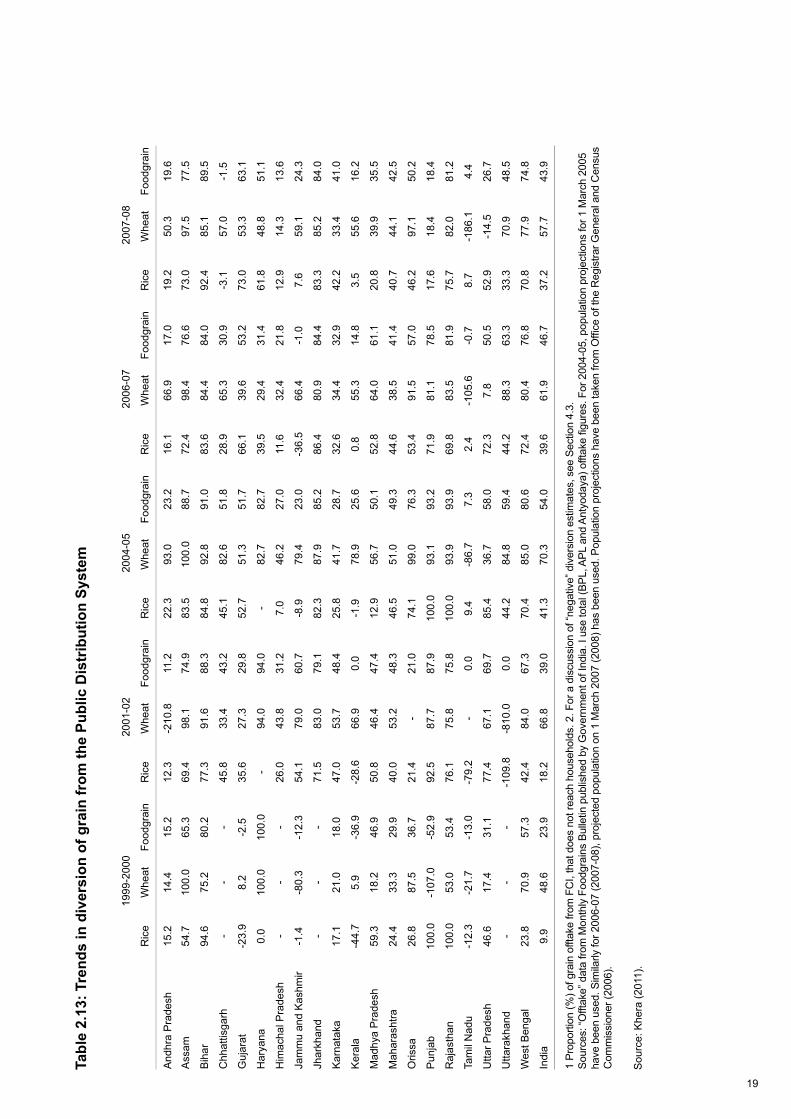
The Public Distribution System (PDS) is a key food safety net, providing important food staples at subsidised prices. One indicator of the performance of the PDS system is the quantity of food grain diverted from those it is intended to serve. Maharashtra is a middle-ranking performer in this regard (Table 2.13). In 2004/5, 49.3 per cent of its food grain was diverted, and in 2007/8 this declined to 42.5 per cent (12th out of 20 states). While this performance is marginally better than the all-India levels (diversion falling from 54.0 per cent to 43.9 per cent), the potential for improvement is large, with several states showing diversion rates below 25 per cent. This 25 per cent figure could be an important goal for Maharashtra to achieve.
17
State of Indian Agriculture 2012-13, Gol
19
Tabl
e 2.
13: T
rend
s in
div
ersi
on o
f gra
in fr
om th
e Pu
blic
Dis
trib
utio
n Sy
stem
Sou
rce:
Khe
ra (2
011)
.
18
1999
-200
020
01-0
220
04-0
520
06-0
720
07-0
8
Ric
eW
heat
Food
grai
nR
ice
Whe
atFo
odgr
ain
Ric
eW
heat
Food
grai
nR
ice
Whe
atFo
odgr
ain
Ric
eW
heat
Food
grai
n
And
hra
Pra
desh
15.2
14.4
15.2
12.3
-210
.811
.222
.393
.023
.216
.166
.917
.019
.250
.319
.6
Ass
am54
.710
0.0
65.3
69.4
98.1
74.9
83.5
100.
088
.772
.498
.476
.673
.097
.577
.5
Bih
ar94
.675
.280
.277
.391
.688
.384
.892
.891
.083
.684
.484
.092
.485
.189
.5
Chh
attis
garh
--
-45
.833
.443
.245
.182
.651
.828
.965
.330
.9-3
.157
.0-1
.5
Guj
arat
-23.
98.
2-2
.535
.627
.329
.852
.751
.351
.766
.139
.653
.273
.053
.363
.1
Har
yana
0.0
100.
010
0.0
-94
.094
.0-
82.7
82.7
39.5
29.4
31.4
61.8
48.8
51.1
Him
acha
l Pra
desh
--
-26
.043
.831
.27.
046
.227
.011
.632
.421
.812
.914
.313
.6
Jam
mu
and
Kas
hmir
-1.4
-80.
3-1
2.3
54.1
79.0
60.7
-8.9
79.4
23.0
-36.
566
.4-1
.07.
659
.124
.3
Jhar
khan
d-
--
71.5
83.0
79.1
82.3
87.9
85.2
86.4
80.9
84.4
83.3
85.2
84.0
Kar
nata
ka17
.121
.018
.047
.053
.748
.425
.841
.728
.732
.634
.432
.942
.233
.441
.0
Ker
ala
-44.
75.
9-3
6.9
-28.
666
.90.
0-1
.978
.925
.60.
855
.314
.83.
555
.616
.2
Mad
hya
Pra
desh
59.3
18.2
46.9
50.8
46.4
47.4
12.9
56.7
50.1
52.8
64.0
61.1
20.8
39.9
35.5
Mah
aras
htra
24.4
33.3
29.9
40.0
53.2
48.3
46.5
51.0
49.3
44.6
38.5
41.4
40.7
44.1
42.5
Oris
sa26
.887
.536
.721
.4-
21.0
74.1
99.0
76.3
53.4
91.5
57.0
46.2
97.1
50.2
Pun
jab
100.
0-1
07.0
-52.
992
.587
.787
.910
0.0
93.1
93.2
71.9
81.1
78.5
17.6
18.4
18.4
Raj
asth
an10
0.0
53.0
53.4
76.1
75.8
75.8
100.
093
.993
.969
.883
.581
.975
.782
.081
.2
Tam
il N
adu
-12.
3-2
1.7
-13.
0-7
9.2
-0.
09.
4-8
6.7
7.3
2.4
-105
.6-0
.78.
7-1
86.1
4.4
Utta
r Pra
desh
46.6
17.4
31.1
77.4
67.1
69.7
85.4
36.7
58.0
72.3
7.8
50.5
52.9
-14.
526
.7
Utta
rakh
and
--
--1
09.8
-810
.00.
044
.284
.859
.444
.288
.363
.333
.370
.948
.5
Wes
t Ben
gal
23.8
70.9
57.3
42.4
84.0
67.3
70.4
85.0
80.6
72.4
80.4
76.8
70.8
77.9
74.8
Indi
a9.
948
.623
.918
.266
.839
.041
.370
.354
.039
.661
.946
.737
.257
.743
.9
1 Pr
opor
tion
(%) o
f gra
in o
fftak
e fro
m F
CI,
that
doe
s no
t rea
ch h
ouse
hold
s. 2
. For
a d
iscu
ssio
n of
“neg
ativ
e” d
iver
sion
est
imat
es, s
ee S
ectio
n 4.
3.So
urce
s: “O
fftak
e” d
ata
from
Mon
thly
Foo
dgra
ins
Bulle
tin p
ublis
hed
by G
over
nmen
t of I
ndia
. I u
se to
tal (
BPL,
APL
and
Ant
yoda
ya) o
fftak
e fi g
ures
. For
200
4-05
, pop
ulat
ion
proj
ectio
ns fo
r 1 M
arch
200
5ha
ve b
een
used
. Sim
ilarly
for 2
006-
07 (2
007-
08),
proj
ecte
d po
pula
tion
on 1
Mar
ch 2
007
(200
8) h
as b
een
used
. Pop
ulat
ion
proj
ectio
ns h
ave
been
take
n fro
m O
ffi ce
of t
he R
egis
trar G
ener
al a
nd C
ensu
sC
omm
issi
oner
(200
6).
20
The need to improve food security in the state is substantial; fortunately the potential for improving food security also seems substantial.
2.4.2 Women’s status
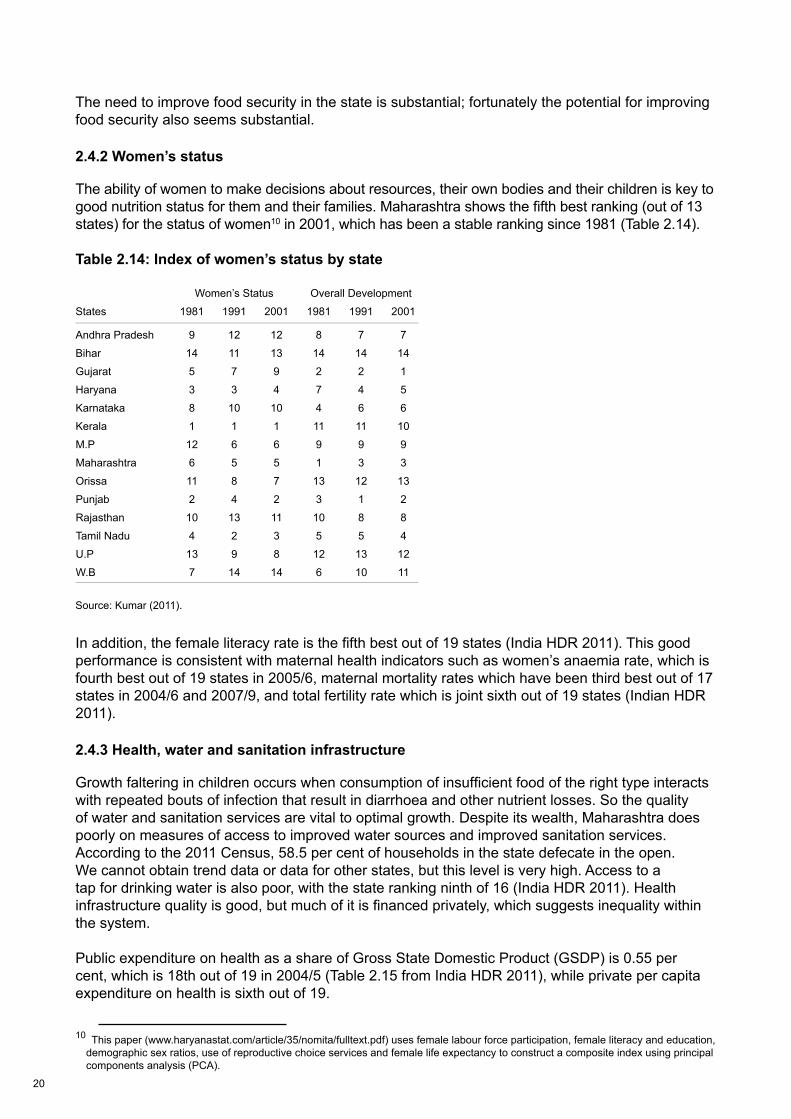
The ability of women to make decisions about resources, their own bodies and their children is key to good nutrition status for them and their families. Maharashtra shows the fifth best ranking (out of 13 states) for the status of women10 in 2001, which has been a stable ranking since 1981 (Table 2.14).
Table 2.14: Index of women’s status by state
Source: Kumar (2011).
In addition, the female literacy rate is the fifth best out of 19 states (India HDR 2011). This good performance is consistent with maternal health indicators such as women’s anaemia rate, which is fourth best out of 19 states in 2005/6, maternal mortality rates which have been third best out of 17 states in 2004/6 and 2007/9, and total fertility rate which is joint sixth out of 19 states (Indian HDR 2011).
2.4.3 Health, water and sanitation infrastructure
Growth faltering in children occurs when consumption of insufficient food of the right type interacts with repeated bouts of infection that result in diarrhoea and other nutrient losses. So the quality of water and sanitation services are vital to optimal growth. Despite its wealth, Maharashtra does poorly on measures of access to improved water sources and improved sanitation services. According to the 2011 Census, 58.5 per cent of households in the state defecate in the open. We cannot obtain trend data or data for other states, but this level is very high. Access to a tap for drinking water is also poor, with the state ranking ninth of 16 (India HDR 2011). Health infrastructure quality is good, but much of it is financed privately, which suggests inequality within the system.
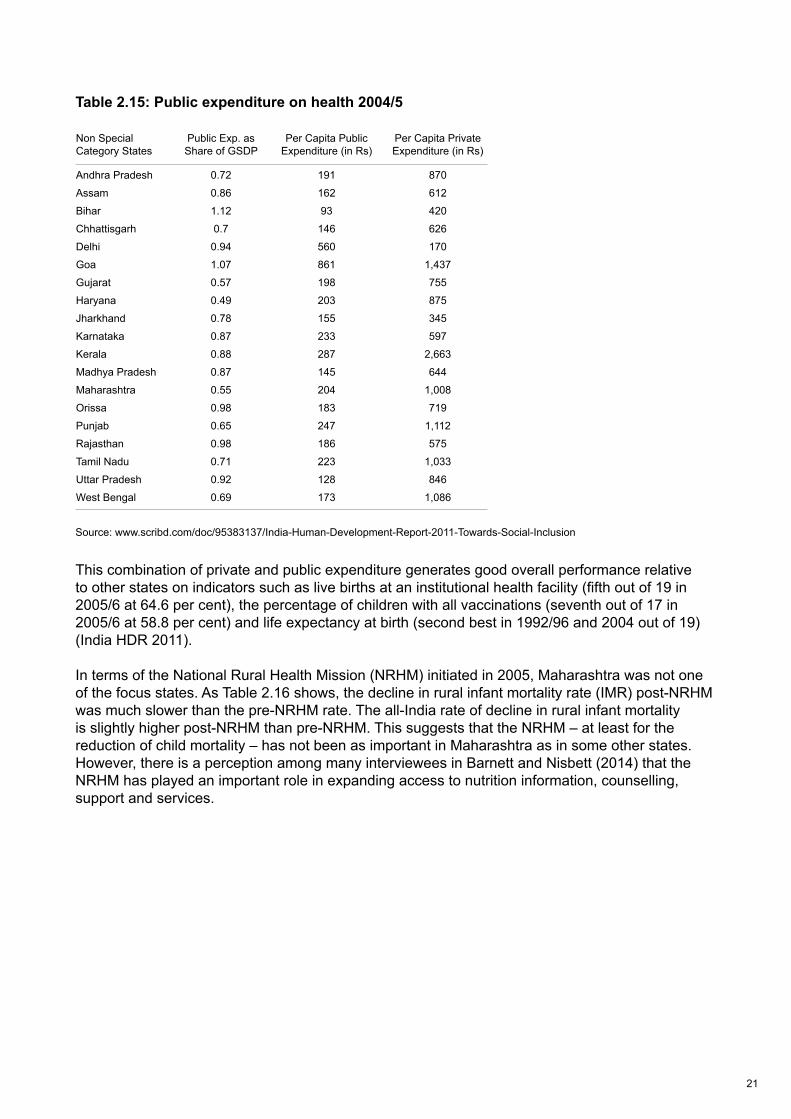
Public expenditure on health as a share of Gross State Domestic Product (GSDP) is 0.55 per cent, which is 18th out of 19 in 2004/5 (Table 2.15 from India HDR 2011), while private per capita expenditure on health is sixth out of 19.
10 This paper (www.haryanastat.com/article/35/nomita/fulltext.pdf) uses female labour force participation, female literacy and education, demographic sex ratios, use of reproductive choice services and female life expectancy to construct a composite index using principal components analysis (PCA).
23
Women’s Status Overall Development
States 1981 1991 2001 1981 1991 2001
Andhra Pradesh 9 12 12 8 7 7
Bihar 14 11 13 14 14 14
Gujarat 5 7 9 2 2 1
Haryana 3 3 4 7 4 5
Karnataka 8 10 10 4 6 6
Kerala 1 1 1 11 11 10
M.P 12 6 6 9 9 9
Maharashtra 6 5 5 1 3 3
Orissa 11 8 7 13 12 13
Punjab 2 4 2 3 1 2
Rajasthan 10 13 11 10 8 8
Tamil Nadu 4 2 3 5 5 4
U.P 13 9 8 12 13 12
W.B 7 14 14 6 10 11
21
Table 2.15: Public expenditure on health 2004/5
Source: www.scribd.com/doc/95383137/India-Human-Development-Report-2011-Towards-Social-Inclusion
This combination of private and public expenditure generates good overall performance relative to other states on indicators such as live births at an institutional health facility (fifth out of 19 in 2005/6 at 64.6 per cent), the percentage of children with all vaccinations (seventh out of 17 in 2005/6 at 58.8 per cent) and life expectancy at birth (second best in 1992/96 and 2004 out of 19) (India HDR 2011).
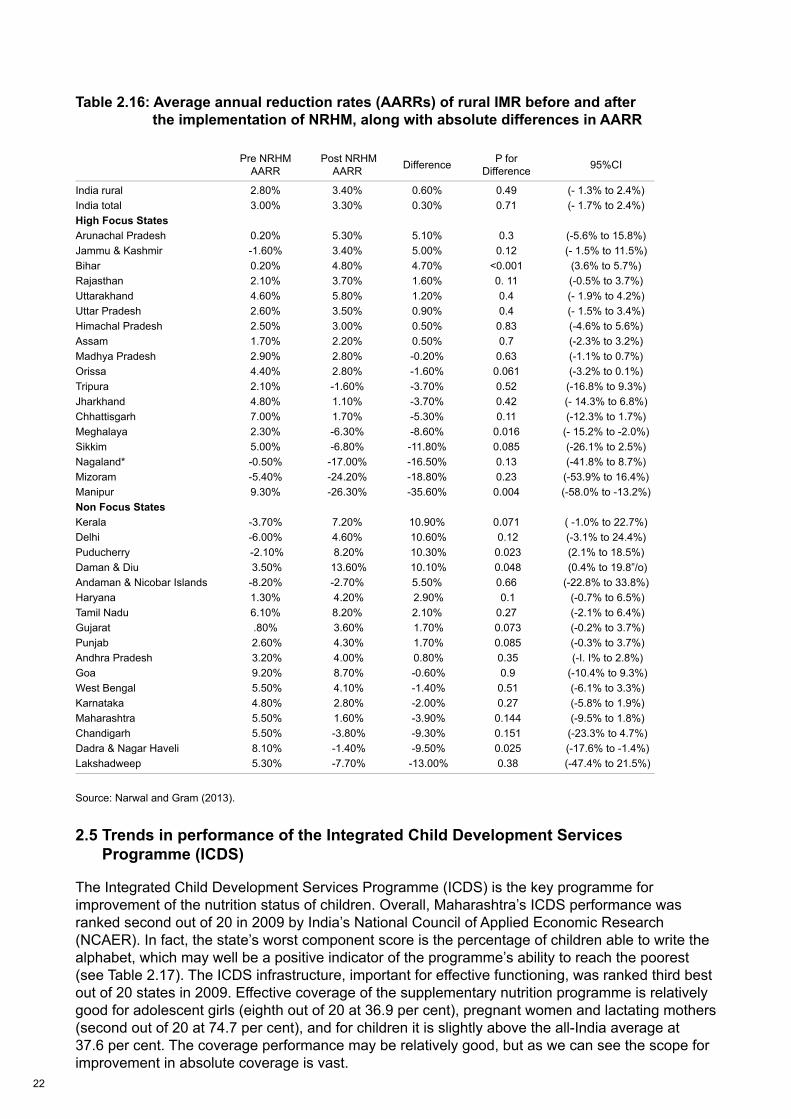
In terms of the National Rural Health Mission (NRHM) initiated in 2005, Maharashtra was not one of the focus states. As Table 2.16 shows, the decline in rural infant mortality rate (IMR) post-NRHM was much slower than the pre-NRHM rate. The all-India rate of decline in rural infant mortality is slightly higher post-NRHM than pre-NRHM. This suggests that the NRHM – at least for the reduction of child mortality – has not been as important in Maharashtra as in some other states. However, there is a perception among many interviewees in Barnett and Nisbett (2014) that the NRHM has played an important role in expanding access to nutrition information, counselling, support and services. 24
Non SpecialCategory States
Public Exp. asShare of GSDP
Per Capita Public Expenditure (in Rs)
Per Capita Private Expenditure (in Rs)
Andhra Pradesh 0.72 191 870
Assam 0.86 162 612
Bihar 1.12 93 420
Chhattisgarh 0.7 146 626
Delhi 0.94 560 170
Goa 1.07 861 1,437
Gujarat 0.57 198 755
Haryana 0.49 203 875
Jharkhand 0.78 155 345
Karnataka 0.87 233 597
Kerala 0.88 287 2,663
Madhya Pradesh 0.87 145 644
Maharashtra 0.55 204 1,008
Orissa 0.98 183 719
Punjab 0.65 247 1,112
Rajasthan 0.98 186 575
Tamil Nadu 0.71 223 1,033
Uttar Pradesh 0.92 128 846
West Bengal 0.69 173 1,086
22
Table 2.16: Average annual reduction rates (AARRs) of rural IMR before and after the implementation of NRHM, along with absolute differences in AARR
Source: Narwal and Gram (2013).
2.5 Trends in performance of the Integrated Child Development Services Programme (ICDS)
The Integrated Child Development Services Programme (ICDS) is the key programme for improvement of the nutrition status of children. Overall, Maharashtra’s ICDS performance was ranked second out of 20 in 2009 by India’s National Council of Applied Economic Research (NCAER). In fact, the state’s worst component score is the percentage of children able to write the alphabet, which may well be a positive indicator of the programme’s ability to reach the poorest (see Table 2.17). The ICDS infrastructure, important for effective functioning, was ranked third best out of 20 states in 2009. Effective coverage of the supplementary nutrition programme is relatively good for adolescent girls (eighth out of 20 at 36.9 per cent), pregnant women and lactating mothers (second out of 20 at 74.7 per cent), and for children it is slightly above the all-India average at 37.6 per cent. The coverage performance may be relatively good, but as we can see the scope for improvement in absolute coverage is vast.
Pre NRHMAARR
Post NRHMAARR Difference P for
Difference 95%CI
India rural 2.80% 3.40% 0.60% 0.49 (- 1.3% to 2.4%)India total 3.00% 3.30% 0.30% 0.71 (- 1.7% to 2.4%)High Focus StatesArunachal Pradesh 0.20% 5.30% 5.10% 0.3 (-5.6% to 15.8%)Jammu & Kashmir -1.60% 3.40% 5.00% 0.12 (- 1.5% to 11.5%)Bihar 0.20% 4.80% 4.70% <0.001 (3.6% to 5.7%)Rajasthan 2.10% 3.70% 1.60% 0. 11 (-0.5% to 3.7%)Uttarakhand 4.60% 5.80% 1.20% 0.4 (- 1.9% to 4.2%)Uttar Pradesh 2.60% 3.50% 0.90% 0.4 (- 1.5% to 3.4%)Himachal Pradesh 2.50% 3.00% 0.50% 0.83 (-4.6% to 5.6%)Assam 1.70% 2.20% 0.50% 0.7 (-2.3% to 3.2%)Madhya Pradesh 2.90% 2.80% -0.20% 0.63 (-1.1% to 0.7%)Orissa 4.40% 2.80% -1.60% 0.061 (-3.2% to 0.1%)Tripura 2.10% -1.60% -3.70% 0.52 (-16.8% to 9.3%)Jharkhand 4.80% 1.10% -3.70% 0.42 (- 14.3% to 6.8%)Chhattisgarh 7.00% 1.70% -5.30% 0.11 (-12.3% to 1.7%)Meghalaya 2.30% -6.30% -8.60% 0.016 (- 15.2% to -2.0%)Sikkim 5.00% -6.80% -11.80% 0.085 (-26.1% to 2.5%)Nagaland* -0.50% -17.00% -16.50% 0.13 (-41.8% to 8.7%)Mizoram -5.40% -24.20% -18.80% 0.23 (-53.9% to 16.4%)Manipur 9.30% -26.30% -35.60% 0.004 (-58.0% to -13.2%)Non Focus StatesKerala -3.70% 7.20% 10.90% 0.071 ( -1.0% to 22.7%)Delhi -6.00% 4.60% 10.60% 0.12 (-3.1% to 24.4%)Puducherry -2.10% 8.20% 10.30% 0.023 (2.1% to 18.5%)Daman & Diu 3.50% 13.60% 10.10% 0.048 (0.4% to 19.8”/o)Andaman & Nicobar Islands -8.20% -2.70% 5.50% 0.66 (-22.8% to 33.8%)Haryana 1.30% 4.20% 2.90% 0.1 (-0.7% to 6.5%)Tamil Nadu 6.10% 8.20% 2.10% 0.27 (-2.1% to 6.4%)Gujarat .80% 3.60% 1.70% 0.073 (-0.2% to 3.7%)Punjab 2.60% 4.30% 1.70% 0.085 (-0.3% to 3.7%)Andhra Pradesh 3.20% 4.00% 0.80% 0.35 (-I. I% to 2.8%)Goa 9.20% 8.70% -0.60% 0.9 (-10.4% to 9.3%)West Bengal 5.50% 4.10% -1.40% 0.51 (-6.1% to 3.3%)Karnataka 4.80% 2.80% -2.00% 0.27 (-5.8% to 1.9%)Maharashtra 5.50% 1.60% -3.90% 0.144 (-9.5% to 1.8%)Chandigarh 5.50% -3.80% -9.30% 0.151 (-23.3% to 4.7%)Dadra & Nagar Haveli 8.10% -1.40% -9.50% 0.025 (-17.6% to -1.4%)Lakshadweep 5.30% -7.70% -13.00% 0.38 (-47.4% to 21.5%)
23
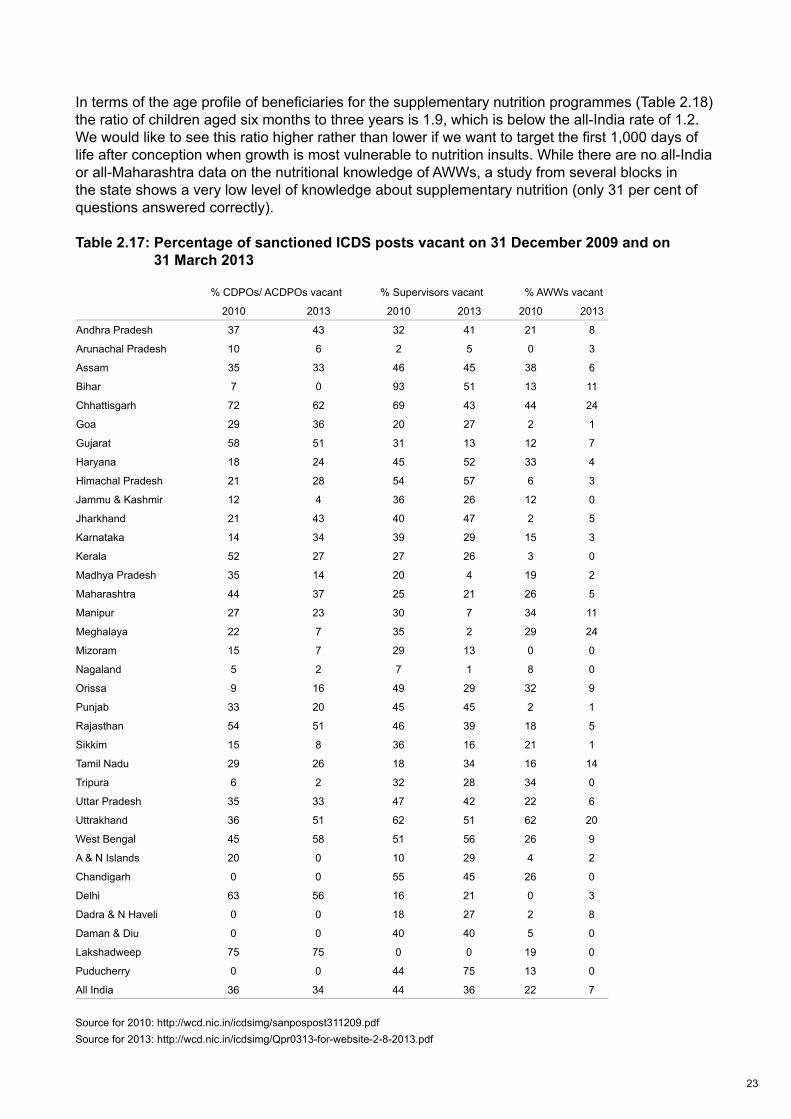
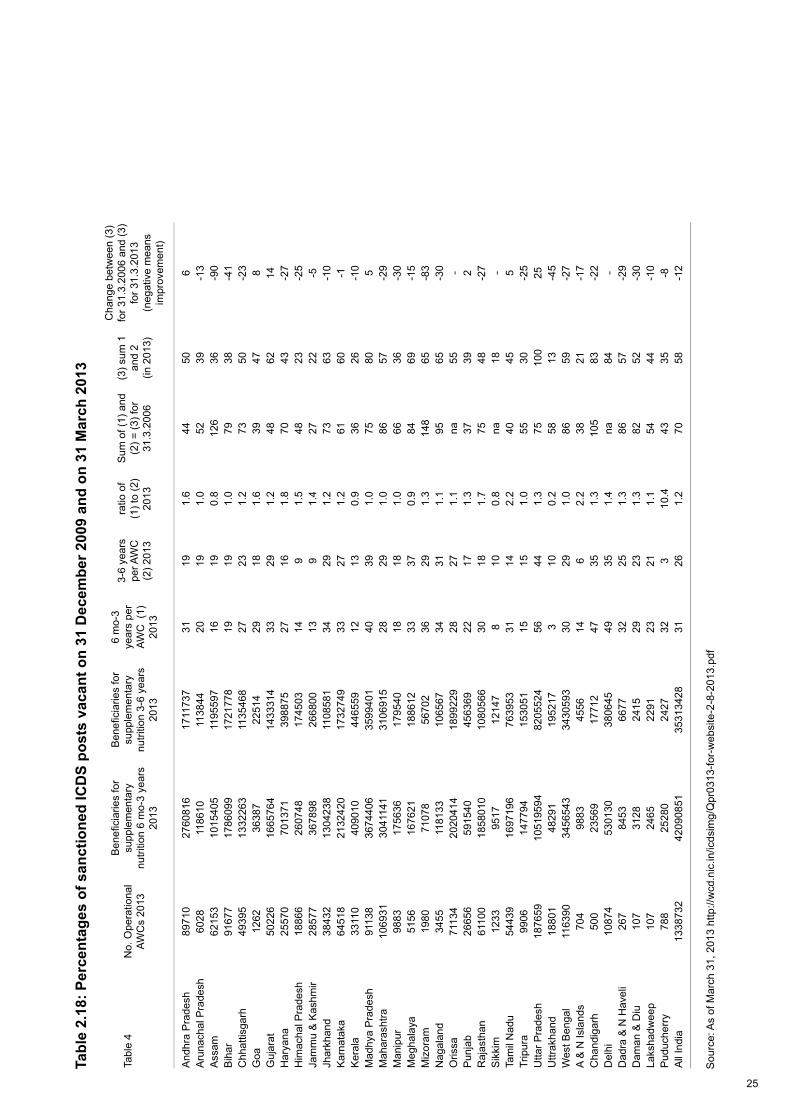
In terms of the age profile of beneficiaries for the supplementary nutrition programmes (Table 2.18) the ratio of children aged six months to three years is 1.9, which is below the all-India rate of 1.2. We would like to see this ratio higher rather than lower if we want to target the first 1,000 days of life after conception when growth is most vulnerable to nutrition insults. While there are no all-India or all-Maharashtra data on the nutritional knowledge of AWWs, a study from several blocks in the state shows a very low level of knowledge about supplementary nutrition (only 31 per cent of questions answered correctly).
Table 2.17: Percentage of sanctioned ICDS posts vacant on 31 December 2009 and on 31 March 2013
Source for 2010: http://wcd.nic.in/icdsimg/sanpospost311209.pdfSource for 2013: http://wcd.nic.in/icdsimg/Qpr0313-for-website-2-8-2013.pdf
% CDPOs/ ACDPOs vacant % Supervisors vacant % AWWs vacant
2010 2013 2010 2013 2010 2013
Andhra Pradesh 37 43 32 41 21 8
Arunachal Pradesh 10 6 2 5 0 3
Assam 35 33 46 45 38 6
Bihar 7 0 93 51 13 11
Chhattisgarh 72 62 69 43 44 24
Goa 29 36 20 27 2 1
Gujarat 58 51 31 13 12 7
Haryana 18 24 45 52 33 4
Himachal Pradesh 21 28 54 57 6 3
Jammu & Kashmir 12 4 36 26 12 0
Jharkhand 21 43 40 47 2 5
Karnataka 14 34 39 29 15 3
Kerala 52 27 27 26 3 0
Madhya Pradesh 35 14 20 4 19 2
Maharashtra 44 37 25 21 26 5
Manipur 27 23 30 7 34 11
Meghalaya 22 7 35 2 29 24
Mizoram 15 7 29 13 0 0
Nagaland 5 2 7 1 8 0
Orissa 9 16 49 29 32 9
Punjab 33 20 45 45 2 1
Rajasthan 54 51 46 39 18 5
Sikkim 15 8 36 16 21 1
Tamil Nadu 29 26 18 34 16 14
Tripura 6 2 32 28 34 0
Uttar Pradesh 35 33 47 42 22 6
Uttrakhand 36 51 62 51 62 20
West Bengal 45 58 51 56 26 9
A & N Islands 20 0 10 29 4 2
Chandigarh 0 0 55 45 26 0
Delhi 63 56 16 21 0 3
Dadra & N Haveli 0 0 18 27 2 8
Daman & Diu 0 0 40 40 5 0
Lakshadweep 75 75 0 0 19 0
Puducherry 0 0 44 75 13 0
All India 36 34 44 36 22 7
24
Are there any available indicators of ICDS performance over time? Table 2.17 data on the percentage of sanctioned ICDS posts that were vacant on 31 December 2009 and on 31 March 2013 show that Maharashtra has done better than the all-India average in filling vacancies for supervisors and AWWs, although it has done a below-average job of filling vacancies for sanctioned CDPO/ACDPO posts. Other data available over time are the numbers of child beneficiaries (six months to six years) per ICDS centre (AWC). Between 2006 and 2013 these fell from 86 to 57 for Maharashtra as opposed to 70 to 58 for all-India. So the decline in Maharashtra was faster than the national picture although the absolute numbers of child beneficiaries per AWC for Maharashtra in 2013 is the same as the national average. In other words, the decline in child beneficiaries per AWC has been good but not relatively spectacular.
25
Tabl
e 2.
18: P
erce
ntag
es o
f san
ctio
ned
ICD
S po
sts
vaca
nt o
n 31
Dec
embe
r 200
9 an
d on
31
Mar
ch 2
013
Sou
rce:
As
of M
arch
31,
201
3 ht
tp://
wcd
.nic
.in/ic
dsim
g/Q
pr03
13-fo
r-w
ebsi
te-2
-8-2
013.
Tabl
e 4
No.
Ope
ratio
nal
AWC
s 20
13
Ben
efi c
iarie
s fo
r su
pple
men
tary
nu
tritio
n 6
mo-
3 ye
ars
2013
Ben
efi c
iarie
s fo
r su
pple
men
tary
nu
tritio
n 3-
6 ye
ars
2013
6 m
o-3
year
s pe
r AW
C (
1)
2013
3-6
year
s pe
r AW
C
(2) 2
013
ratio
of
(1) t
o (2
) 20
13
Sum
of (
1) a
nd
(2) =
(3) f
or
31.3
.200
6
(3) s
um 1
an
d 2
(in 2
013)
Cha
nge
betw
een
(3)
for 3
1.3.
2006
and
(3)
for 3
1.3.
2013
(n
egat
ive
mea
ns
impr
ovem
ent)
And
hra
Pra
desh
8971
027
6081
617
1173
731
191.
644
506
Aru
nach
al P
rade
sh60
2811
8610
1138
4420
191.
052
39-1
3A
ssam
6215
310
1540
511
9559
716
190.
812
636
-90
Bih
ar91
677
1786
099
1721
778
1919
1.0
7938
-41
Chh
attis
garh
4939
513
3226
311
3546
827
231.
273
50-2
3G
oa12
6236
387
2251
429
181.
639
478
Guj
arat
5022
616
6576
414
3331
433
291.
248
6214
Har
yana
2557
070
1371
3988
7527
161.
870
43-2
7H
imac
hal P
rade
sh18
866
2607
4817
4503
149
1.5
4823
-25
Jam
mu
& K
ashm
ir28
577
3678
9826
6800
139
1.4
2722
-5Jh
arkh
and
3843
213
0423
811
0858
134
291.
273
63-1
0K
arna
taka
6451
821
3242
017
3274
933
271.
261
60-1
Ker
ala
3311
040
9010
4465
5912
130.
936
26-1
0M
adhy
a P
rade
sh91
138
3674
406
3599
401
4039
1.0
7580
5M
ahar
asht
ra10
6931
3041
141
3106
915
2829
1.0
8657
-29
Man
ipur
9883
1756
3617
9540
1818
1.0
6636
-30
Meg
hala
ya51
5616
7621
1886
1233
370.
984
69-1
5M
izor
am19
8071
078
5670
236
291.
314
865
-83
Nag
alan
d34
5511
8133
1065
6734
311.
195
65-3
0O
rissa
7113
420
2041
418
9922
928
271.
1na
55-
Pun
jab
2665
659
1540
4563
6922
171.
337
392
Raj
asth
an61
100
1858
010
1080
566
3018
1.7
7548
-27
Sik
kim
1233
9517
1214
78
100.
8na
18-
Tam
il N
adu
5443
916
9719
676
3953
3114
2.2
4045
5Tr
ipur
a99
0614
7794
1530
5115
151.
055
30-2
5U
ttar P
rade
sh18
7659
1051
9594
8205
524
5644
1.3
7510
025
Uttr
akha
nd18
801
4829
119
5217
310
0.2
5813
-45
Wes
t Ben
gal
1163
9034
5654
334
3059
330
291.
086
59-2
7A
& N
Isla
nds
704
9883
4556
146
2.2
3821
-17
Cha
ndig
arh
500
2356
917
712
4735
1.3
105
83-2
2D
elhi
1087
453
0130
3806
4549
351.
4na
84-
Dad
ra &
N H
avel
i26
784
5366
7732
251.
386
57-2
9D
aman
& D
iu10
731
2824
1529
231.
382
52-3
0La
ksha
dwee
p10
724
6522
9123
211.
154
44-1
0P
uduc
herr
y78
825
280
2427
323
10.4
4335
-8A
ll In
dia
1338
732
4209
0851
3531
3428
3126
1.2
7058
-12
26
So, overall ICDS performance is relatively good compared to other states (overall, infrastructure, coverage, vacancies filled, number of beneficiaries per AWC), and is improving over time (vacancies filled, number of beneficiaries), but not any faster than all-India rates of improvement. Moreover, the potential for improvement in coverage is vast.
2.6 Conclusions
The overall conclusion reached from this review of extant data and evidence is that if stunting cannot decline rapidly in Maharashtra then it cannot decline rapidly anywhere.
All the ingredients are present for strong declines in stunting: (1) strong economic growth that has an increasing ability to convert itself into poverty reduction; (2) governance that is moderately good in general and particularly good around nutrition; (3) a budget commitment to nutrition and social services that is increasing, although from a very low base; (4) stronger trends in some underlying determinants (women’s status and health services) and with weaker performance in hunger reduction and sanitation; and (5) relatively good performance of the ICDS programme and the National Rural Health Mission (NRHM) programme.
The implications of this paper are several. First, rapid declines in stunting are possible and seem to be linked to improvements on multiple fronts: the enabling environment (economic, governance, commitment – see Gillespie et al. 2013); underlying determinants (food security, women’s status, health environment); and immediate determinants (for example ICDS and NRHM). Second, it is difficult to apportion out the reductions by factor. The quantitative analysis might be able to do some of this, but not at the level of detail we would like because some of the key variables do not vary at the household or individual level (e.g. governance or economic growth or the Nutrition Mission) or we simply do not have the variables (for example Anganwadi [AWC] data) to which we may attribute the improvement. Third, there is substantial room for improvement in some of the determinants. Food security efforts seem lees strong, open defecation rates are very high, nutrition budgets seem low as a percentage of overall state budgets, ICDS coverage rates for the supplementary nutrition programme remain low and the nutrition knowledge of AWWs remains questionable. Finally, political commitment seems to be key to greater leverage of a fundamentally positive background for stunting reductions. The qualitative interview paper will give us more insights into just exactly why the Nutrition Mission came into being, what it has achieved and how it has achieved it, but its importance seems clear.
Several questions remain unanswered. First, based on the data assembled here, can we anticipate large declines in stunting rates in other Indian states? It is difficult to say. On the one hand the changes in the determinants have not been spectacular relative to other states, but the confluence of factors moving in the right direction, from an already strong base, does feel special. One could credibly argue that such stunting declines will be seen in other states but perhaps not at such rapid rates. Second, would a Nutrition Mission make a positive difference to stunting rates against a less promising backdrop? Again we can only guess, but our sense is that a Nutrition Mission has a good benefit-to-cost ratio. Even if we could estimate the benefit to cost ratio of the nutrition mission it is impossible to compare that ratio with the benefit to cost ratio of another mission that might have been declared in its place. Finally, what are the lessons for India and beyond? As argued earlier, in Maharashtra, our sense is that the large number of factors pulling in favour of reductions in stunting rates is unusual and that, in many other contexts, there will be a greater need to prioritise investments more carefully, to identify the weak links in the nutrition chain, to invest in the factors that hold other efforts back.
The final lesson for other contexts is that stunting rates can be driven down fast – the conditions in Maharashtra were conducive, but not so perfect and unique that these results cannot be achieved elsewhere.

27

28
3 Maharashtra’s Rapid Decline in Stunting Rates between 2006 and 2012: What do the Survey Data Tell Us? Lawrence Haddad and Elsa ValliExecutive summary
The 2006 NFHS-3 reported that 39 per cent of children under the age of two in the Indian state of Maharashtra were stunted. By 2012, according to data from the statewide Comprehensive Nutrition Survey of Maharashtra (CNSM 2012) conducted by the International Institute of Population Sciences, the prevalence of stunting had dropped to 23.7 per cent. This is a decline of approximately three percentage points per year – one of the fastest declines ever recorded. On the other hand, wasting rates declined by only approximately 3.6 percentage points in total over the period.1
This paper compares these two data sets to address the following question: what are the reasons for the rapid decline in stunting rates and the small decline in wasting?
First, the paper summarises key features of the two surveys. Second, the paper compares nutrition status outcomes and determinants within and between the two surveys. Third the paper examines stunting, and in some cases wasting, rates for each year, disaggregated by values of key potential determinants. Fourth, the paper undertakes econometric analysis of stunting and wasting that attempts to isolate the effects of key determinants of stunting in 2006 and 2012. Finally, the paper draws some conclusions from the descriptive and econometric analysis.
There are several conclusions to be drawn from the analysis contained in this paper.
First, the decline in stunting is large between 2006 and 2012, even accounting for changes in the age structure of the two samples. We estimate the decline in stunting to be 12.5 percentage points instead of the more commonly reported 15.4 percentage points. The decline in wasting is much smaller at around three to four percentage points and, combined with our inability to explain variations within survey years, means that we have a better sense of what to do about stunting than about wasting.
Second, this decline in stunting is broad-based, involving many different subgroups and strata of the sample. Even more importantly, the decline seems to be pro-poor: the declines are, in general, larger for those who are nearer the bottom end of the stunting and wealth distributions – whether measured in absolute or relative terms.
Third, the declines do not seem to be driven by changes in the nature of the relationship between undernutrition and its correlates, but rather by the changes in the levels of the determinants. Our tests for changes in the relationship between stunting and its multivariate correlates cannot reject the hypothesis that – as a set – they are identical across the two survey years. The two variables for which the nature of the relationship with stunting does seem to change are age at first birth and wealth. Stunting in 2012 is still vulnerable to low age at first birth and low wealth, but not as vulnerable as in 2006.
Fourth, the levels of the key factors that can reduce stunting and wasting have improved between 2006 and 2012 across a broad range: the age of mothers has increased; there are fewer young ages at first birth; maternal underweight is down; literacy is higher; mothers are making increased
1 Figures used here differ from those reported in IIPS 2013 due to the different age group weights used to calculate these figures – see section 3.1 below for an explanation.
29
antenatal clinic visits; the percentage of mothers giving birth at home is down; vaccination rates are up; some breastfeeding and child feeding practices have improved (e.g. exclusive breastfeeding, number of unique foods provided for the 6–24 month age range, although the latter remains low); there are lower percentages of people with no toilet; women are more involved in making decisions about their own health; and ICDS access has improved.
Fifth, there are some key determinants of undernutrition that have not changed in the six-year period between surveys: educational attainment; improved water access; some breastfeeding practices (e.g. early initiation); and the percentage of children achieving minimum dietary diversity levels (only 10–11 per cent). These are key areas for policymakers to pay attention to – they will likely become a drag on future declines in undernutrition rates.
Sixth, the multivariate correlates of stunting are as expected – age of child (an increase in stunting as age in months increases), mother’s literacy, higher age at first pregnancy, more antenatal visits, birthplace in a facility, and women’s wealth are all positively associated with declines in stunting.
Seventh, some variables do not have the expected results. Mother’s underweight has the expected sign (increases stunting) but is not significant, even at 10 per cent. Mother’s underweight is important for wasting, however. Boys have higher stunting and severe stunting rates, which is something that is observed in 2012 but not 2006: this may signal a decline in gender bias against girls as in countries with less gender bias we tend to see higher stunting rates among boys. Breastfeeding variables show no correlations, except for children exclusively breastfed for the first three days, which increases the likelihood of stunting – a counterintuitive result. When we replace these simple breastfeeding variables with those we construct for exclusive and predominant breastfeeding we find that predominant breastfeeding compared to zero or very partial breastfeeding is associated with reduced stunting.
Eighth, water and sanitation variables show very little association with stunting, with or without the inclusion of wealth variables, which is puzzling. We constructed a women’s decision-making index and estimated the regressions with it, but due to the very few common variables across the two surveys we opted for including the component variables (such as literacy) separately in the regressions.
Finally, the compatibility of the two surveys, although adequate, was less than perfect. The 2006 survey is representative for under-fives, not for under two-year-olds like the 2012 survey. This caused some problems with age composition and stunting as outlined above and it may have caused problems with other variables. We could not explore the survey-to-survey relationships between stunting and food security (as there were no questions on food security in 2006). Nor could we see which districts have performed better than others over the intervening six years because neither survey is representative at the district level.
Stunting in Maharashtra has declined rapidly between 2006 and 2012. It has not done so because of an increasing power of stunting’s determinants to effect change. It has done so because the level of those determinants has increased substantially over the period. Moreover this change has happened in a broad-based and pro-equity way. The Maharashtra government deserves great credit for this. It is this broad-based improvement in the determinants of nutrition that has led to such significant improvements in stunting.
Nevertheless there have been some important gaps in progress, and these need to be urgently addressed by the Maharashtra government. First, wasting has declined only modestly and it is not clear from our analysis why that is so. Second, the coverage of improved water sources has not increased. Third, household food security seems to be disconnected from children’s anthropometry, which may suggest that while in many households there is food security, the diets of children are sub-optimal and/or access to water and sanitation coverage (which has increased) may not be high enough. Finally, while the rates of good infant and young child feeding practices have improved modestly in some domains, they have not done so in all areas and are still quite low. These gaps in progress may well be key contributors to the lack of progress on reducing wasting rates.
30
3.1 Introduction
The 2006 NFHS-3 reported that 39 per cent of children under the age of two in the Indian state of Maharashtra were stunted. By 2012, according to the statewide Comprehensive Nutrition Survey conducted by the International Institute of Population Sciences,2 the prevalence of stunting had dropped to 23.6 per cent. This is a decline of approximately three percentage points per year – one of the fastest declines ever recorded.3
This paper compares these two data sets to address the following question: what are the reasons for the rapid decline in stunting rates?
First, the paper summarises key features of the two surveys. Second, the paper compares nutrition status outcomes and determinants within and between the two surveys. Third the paper examines stunting rates for each year, disaggregated by values of key potential determinants. Fourth, the paper undertakes econometric analysis that attempts to isolate the effect of key determinants of stunting in 2006 and 2012. Finally the paper draws some conclusions from the descriptive and econometric analysis.
The analysis is limited in several ways. First, the sample is not a household panel. The households in 2012 are not the same households as in 2006. This means we cannot control for unobservable household characteristics that do not change over time. This makes it harder to portray our econometric estimates as determinants rather than simple correlates. Second, the primary sampling units (PSUs) in 2012 are not the same as those in 2006. This means that we cannot estimate a PSU level panel to control for unobservable PSU characteristics. Third, the PSUs were kept anonymous in 2006 because HIV testing was a major component of the NFHS3 survey and neither sample is representative at the district level. This means we cannot merge district-level data from other sources on to the child level or PSU level data sets to try to increase our ability to explain the sharp drop in stunting rates. Finally, the 2006 survey was representative for the under-fives, therefore the under-twos subgroup of such populations cannot be considered as representative of the state. Generalisations of the results at the state level need to be made with appropriate caution.
3.2 The surveys and data sets
The two surveys we draw upon for this analysis are described here.
3.2.1 National Family Health Survey (NFHS)
The National Family Health Survey (NFHS) is a large-scale, multi-round survey conducted in a representative sample of households throughout India, aimed at providing national and state estimates of fertility, family planning, infant and child mortality, reproductive and child health, nutrition of women and children, the quality of health and family welfare services, and socioeconomic conditions. The Ministry of Health and Family Welfare (MOHFW) designated the International Institute for Population Sciences (IIPS) as the main agency to conduct the three rounds of the NFHS.
The three rounds were collected respectively in 1992/93, in 1998/99 and finally in 2005/06. Over the rounds, the NFHS has been adding information on new and emerging health-related issues and has been increasing the population of reference. The NFHS-3 in particular provides information on the quality of health and family welfare services, reproductive health problems, domestic violence, high-risk sexual behaviour, perinatal mortality, and HIV prevalence and behaviour-related information among adult men and women.
2 www.iipsindia.org/pdf/CNSMFACTSHEET per cent20- per cent202012.pdf3 The next fastest is the Bangladesh under-five stunting rate, which dropped from 50.6 in 2004 to 43.2 in 2007, 2.47 points per year.
31
The NFHS-3 relied on three types of questionnaires, the Household Questionnaire, the Women’s Questionnaire and the Men’s Questionnaire. The Household Questionnaire lists all household members in each household and information for each individual was registered on age, sex, marital status, relationship to the household head, and education. Information was also gathered on main source of drinking water, type of toilet facility, source of lighting, type of cooking fuel, religion and caste/tribe of household head, ownership of a house, agricultural land, livestock and assets. Height and weight were recorded for women aged 15–49, men 15–49 and children aged five. Blood samples were taken from those who agreed to haemoglobin measurement and HIV testing.
The Women’s Questionnaire focused on never and ever-married women aged 15–49 and reported sections on background characteristics, reproductive behaviour and intentions, marriage and cohabitation, knowledge and use of contraception, quality of care and contacts with health personnel, antenatal, delivery, and post-natal care, general health, child immunisations, child health, and child feeding practices, women’s and child nutrition, utilisation of ICDS services, status of women and spousal violence, sexual life and HIV/AIDS and other sexually transmitted infections. Finally, the Men’s Questionnaire, targeted men aged 15–54 on background characteristics, reproductive behaviour and intentions, knowledge and use of contraception, male involvement in health care, sexual life, health and nutrition, attitude toward gender roles and HIV/AIDS and other sexually transmitted infections.4
Since a large number of indicators to be estimated from NFHS-3 refer to ever-married women aged 15–49, the state sample target was estimated in terms of these women. Maharashtra was one of the states for which the sample was meant to be representative for slum and non-slum urban areas (for big cities) as well as for HIV testing. The initial target sample size for ever-married women aged 15–49 was 4,000, adjusted then to 8,000 to be representative also for slum and non-slum areas in Mumbai and Nagpur and for state-level HIV estimates. The sample selection was done separately in rural and urban areas using a multi-stage stratified sampling procedure.
For the rural population, two stages were implemented. The first stage involved the selection of primary sampling units (PSUs), namely villages with probability proportional to population size (PPS) that were stratified to insure the inclusion of villages with different socioeconomic characteristics. The second stage involved the systematic selection of households within each PSU. For urban areas, a three-stage sample design was used as the data on census enumeration blocks (CEBs) in all wards were collected in the 2001 Census; these data were not available in published form. The first stage involved selection of wards with PPS sampling; then one CEB was selected by PPS from each ward; in the final stage households were randomly selected within each selected CEB. National-level and state-level weights were produced to first take care of the non-equal probability of selection in different domains and secondly to account for non-response rates of household interviews in different domains.
3.2.2 The Comprehensive Nutrition Survey of Maharashtra (CNSM)
The Comprehensive Nutrition Survey of Maharashtra (CNSM) 20125 is the first ever state-specific nutrition survey with a focus on infants and children in the first two years of life and their mothers. The survey aimed at assessing the nutritional status of children under two through anthropometric measurements and infant and young child feeding practices in rural and urban areas of the state as well as in each of the six administrative divisions of the state. The Government of Maharashtra and UNICEF requested the International Institute for Population Sciences (IIPS) to implement the CNSM survey because of their previous experience with NFHS surveys. Data collection and editing was assigned to the Population Research Centre at the Gokhale Institute of Politics and Economics.
4 www.rchiips.org/nfhs/5 IIPS (2013).
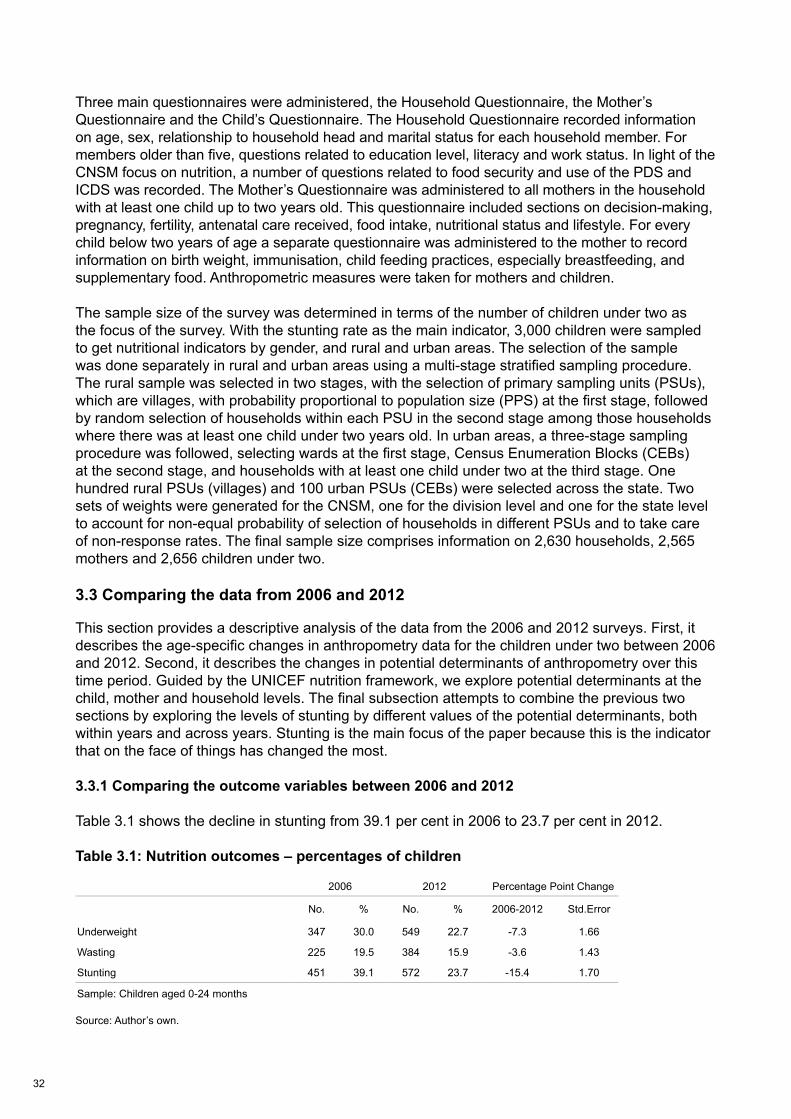
32
Three main questionnaires were administered, the Household Questionnaire, the Mother’s Questionnaire and the Child’s Questionnaire. The Household Questionnaire recorded information on age, sex, relationship to household head and marital status for each household member. For members older than five, questions related to education level, literacy and work status. In light of the CNSM focus on nutrition, a number of questions related to food security and use of the PDS and ICDS was recorded. The Mother’s Questionnaire was administered to all mothers in the household with at least one child up to two years old. This questionnaire included sections on decision-making, pregnancy, fertility, antenatal care received, food intake, nutritional status and lifestyle. For every child below two years of age a separate questionnaire was administered to the mother to record information on birth weight, immunisation, child feeding practices, especially breastfeeding, and supplementary food. Anthropometric measures were taken for mothers and children.
The sample size of the survey was determined in terms of the number of children under two as the focus of the survey. With the stunting rate as the main indicator, 3,000 children were sampled to get nutritional indicators by gender, and rural and urban areas. The selection of the sample was done separately in rural and urban areas using a multi-stage stratified sampling procedure. The rural sample was selected in two stages, with the selection of primary sampling units (PSUs), which are villages, with probability proportional to population size (PPS) at the first stage, followed by random selection of households within each PSU in the second stage among those households where there was at least one child under two years old. In urban areas, a three-stage sampling procedure was followed, selecting wards at the first stage, Census Enumeration Blocks (CEBs) at the second stage, and households with at least one child under two at the third stage. One hundred rural PSUs (villages) and 100 urban PSUs (CEBs) were selected across the state. Two sets of weights were generated for the CNSM, one for the division level and one for the state level to account for non-equal probability of selection of households in different PSUs and to take care of non-response rates. The final sample size comprises information on 2,630 households, 2,565 mothers and 2,656 children under two.
3.3 Comparing the data from 2006 and 2012
This section provides a descriptive analysis of the data from the 2006 and 2012 surveys. First, it describes the age-specific changes in anthropometry data for the children under two between 2006 and 2012. Second, it describes the changes in potential determinants of anthropometry over this time period. Guided by the UNICEF nutrition framework, we explore potential determinants at the child, mother and household levels. The final subsection attempts to combine the previous two sections by exploring the levels of stunting by different values of the potential determinants, both within years and across years. Stunting is the main focus of the paper because this is the indicator that on the face of things has changed the most.
3.3.1 Comparing the outcome variables between 2006 and 2012
Table 3.1 shows the decline in stunting from 39.1 per cent in 2006 to 23.7 per cent in 2012.
Table 3.1: Nutrition outcomes – percentages of children
Source: Author’s own.
.
Table 1: Nutrition Outcomes - Percentage of Children
2006 2012 Percentage Point Change
No. % No. % 2006-2012 Std.Error
Underweight 347 30.0 549 22.7 -7.3 1.66
Wasting 225 19.5 384 15.9 -3.6 1.43
Stunting 451 39.1 572 23.7 -15.4 1.70
Sample: Children aged 0-24 months
Table 2: Child’s characteristics - Frequencies and Percentage
Age in months 2006 2012
Less than 6 177 15.3 581 24
6 to 10 258 22.4 537 22.2
11 to 15 268 23.2 457 18.9
16 to 20 252 21.8 512 21.2
21 to 25 200 17.3 328 13.6
Total 1,155 100 2,414 100
Sample: Children under 2 years of age
Table 3: Stunting Outcomes by age group, months
Age in months 2006 2012 2006-2012 Std.Error
Less than 6 15.44 9.78 -5.66 2.87
6 to 10 25.42 12.77 -12.65 2.97
11 to 15 49.44 26.52 -22.92 3.86
16 to 20 53.53 35.78 -17.75 3.94
21 to 24 45.53 43.32 -2.21 4.88
Sample: Children under 2 years of age
2006 2012Gender No. % No. %Boy 624 54.1 1,329 55.1Girl 530 45.9 1,085 44.9Total 1,155 100 2,414 100Birth order1st 506 43.8 1,068 44.32nd 360 31.2 885 36.73rd 181 15.7 316 13.14th or higher 107 9.3 145 6Total 1,155 100 2,414 100Age in monthsLess than 6 177 15.3 581 246 to 10 258 22.4 537 22.211 to 15 268 23.2 457 18.916 to 20 252 21.8 512 21.221 to 25 200 17.3 328 13.6Total 1,155 100 2,414 100Sample: Children under 2 years of age

33
However, we cannot take the strict comparability of the two data sets as a given. As we have noted, the NFHS 2006 data set is representative at the Maharashtra level for children aged 0–59 months old, not necessarily for under-2s. Table 3.2 highlights the issue. Here we can see that the percentage of children under six months of age is much higher in the 2012 sample than in the 2006 sample (24 vs 15.3). Now assume the 2012 percentage is reflective of what a representative sample of under-2s should be in 2006 (assuming no major demographic changes in five years). The difference in age distribution between 2006 and 2012 would not matter if stunting rates were similar by age group. However, from Table 3.3 we can see that children under the age of six months tend to have lower stunting rates.
Table 3.2: Child’s characteristics – frequencies and percentages
Source: Author’s own.
In other words, the stunting rate for under-2s in the 2006 sample is worse than it should be, therefore overstating the decline between 2006 and 2012. The question is: how much of an overstatement is it? Applying the age group weights from 2012 (which we are assume are more representative) to the stunting rates by age group from 2006 generates a stunting rate for 2006 of 36.2 per cent, a difference of just under 3 per cent from that reported in Table 3.1. So instead of a decline of 15.40 percentage points in stunting of under-2s between 2006 and 2012, we estimate a decline of 12.52 percentage points. This is still a substantial decline, from 36 per cent to 23 per cent. It is worth bearing in mind that the tables in section 3.3 do not adjust for the age group differences.
Table 3.3: Stunting outcomes by age group, months
Source: Author’s own.
3.4 Comparing the potential determinants across survey years
This section compares the potential determinants of stunting across the two survey years. The section is organised around child, mother and household characteristics. From the tables we can observe the following:
3.4.1 Child characteristics
The proportions of boys and girls are similar across the years (Table 3.4). This is consistent with analysis that suggests high levels of selective abortions in India (Jha et al. 2011), reflecting a strong male preference, especially if the first born is a girl.
.
Table 1: Nutrition Outcomes - Percentage of Children
2006 2012 Percentage Point Change
No. % No. % 2006-2012 Std.Error
Underweight 347 30.0 549 22.7 -7.3 1.66
Wasting 225 19.5 384 15.9 -3.6 1.43
Stunting 451 39.1 572 23.7 -15.4 1.70
Sample: Children aged 0-24 months
Table 2: Child’s characteristics - Frequencies and Percentage
Age in months 2006 2012
Less than 6 177 15.3 581 24
6 to 10 258 22.4 537 22.2
11 to 15 268 23.2 457 18.9
16 to 20 252 21.8 512 21.2
21 to 25 200 17.3 328 13.6
Total 1,155 100 2,414 100
Sample: Children under 2 years of age
Table 3: Stunting Outcomes by age group, months
Age in months 2006 2012 2006-2012 Std.Error
Less than 6 15.44 9.78 -5.66 2.87
6 to 10 25.42 12.77 -12.65 2.97
11 to 15 49.44 26.52 -22.92 3.86
16 to 20 53.53 35.78 -17.75 3.94
21 to 24 45.53 43.32 -2.21 4.88
Sample: Children under 2 years of age
2006 2012Gender No. % No. %Boy 624 54.1 1,329 55.1Girl 530 45.9 1,085 44.9Total 1,155 100 2,414 100Birth order1st 506 43.8 1,068 44.32nd 360 31.2 885 36.73rd 181 15.7 316 13.14th or higher 107 9.3 145 6Total 1,155 100 2,414 100Age in monthsLess than 6 177 15.3 581 246 to 10 258 22.4 537 22.211 to 15 268 23.2 457 18.916 to 20 252 21.8 512 21.221 to 25 200 17.3 328 13.6Total 1,155 100 2,414 100Sample: Children under 2 years of age

34
The percentage of children under six months has increased from 15 to 24; the percentage that are 21–24 months old is down from 17 to 14 (Table 3.4). It is not clear why the 2012 sample contains more younger infants, but infants under six months tend to have lower stunting levels than those who are older (see Table 3.2)
Table 3.4: Stunting outcomes by child characteristics
Source: Author’s own.
Antenatal care (ANC) visits have increased between the years, with the percentage of mothers making more than seven visits increasing from 26 to 47. The percentage of mothers receiving folic acid has increased from 84 to 89; and the percentage of mothers receiving visits from doctors during the ANC period declined from 85 to 78 (Table 3.5)
The percentage of births at home has declined from 35 to 13 (Table 3.5).
Table 3.5: Antenatal care – frequencies and percentages
Source: Author’s own.
.
Table 1: Nutrition Outcomes - Percentage of Children
2006 2012 Percentage Point Change
No. % No. % 2006-2012 Std.Error
Underweight 347 30.0 549 22.7 -7.3 1.66
Wasting 225 19.5 384 15.9 -3.6 1.43
Stunting 451 39.1 572 23.7 -15.4 1.70
Sample: Children aged 0-24 months
Table 2: Child’s characteristics - Frequencies and Percentage
Age in months 2006 2012
Less than 6 177 15.3 581 24
6 to 10 258 22.4 537 22.2
11 to 15 268 23.2 457 18.9
16 to 20 252 21.8 512 21.2
21 to 25 200 17.3 328 13.6
Total 1,155 100 2,414 100
Sample: Children under 2 years of age
Table 3: Stunting Outcomes by age group, months
Age in months 2006 2012 2006-2012 Std.Error
Less than 6 15.44 9.78 -5.66 2.87
6 to 10 25.42 12.77 -12.65 2.97
11 to 15 49.44 26.52 -22.92 3.86
16 to 20 53.53 35.78 -17.75 3.94
21 to 24 45.53 43.32 -2.21 4.88
Sample: Children under 2 years of age
2006 2012Gender No. % No. %Boy 624 54.1 1,329 55.1Girl 530 45.9 1,085 44.9Total 1,155 100 2,414 100Birth order1st 506 43.8 1,068 44.32nd 360 31.2 885 36.73rd 181 15.7 316 13.14th or higher 107 9.3 145 6Total 1,155 100 2,414 100Age in monthsLess than 6 177 15.3 581 246 to 10 258 22.4 537 22.211 to 15 268 23.2 457 18.916 to 20 252 21.8 512 21.221 to 25 200 17.3 328 13.6Total 1,155 100 2,414 100Sample: Children under 2 years of age
Table 5: ANC care - Frequencies and Percentage
2006 2012Any ANC visit during pregnancy No. % No. %Yes 1,070 92.6 2,330 97.4No 85 7.4 63 2.6Total 1,154 100 2,394 100Visit from a doctorDoctor 926 85.3 1,850 78.2Other 160 14.7 515 21.8Total 1,086 100 2,365 100Number of ANC visits2/3 370 34.5 424 17.94/6 424 39.6 822 34.77/30 277 25.9 1,124 47.4Total 1,071 100 2,370 100Folic acid receivedYes 960 83.5 2,134 89.1No 190 16.5 261 10.9Total 1,149 100 2,395 100Place of delivery last childGovernment hosp/clinic 279 24.2 930 38.9Public hosp/clinic 466 40.4 1,149 48Home or other 409 35.4 315 13.1Total 1,154 100 2,394 100 Sample: Children aged 0-24 months
Table 6a: Breastfeeding and Complementary Feeding of under 2’s
35
3.4.2 Breastfeeding and complementary feeding
We spend some time on this vital and complex set of feeding activities. Table 3.6a goes through the issues, survey question by question. Our conclusions are as follows:
Some breastfeeding practices remain essentially unchanged between the two surveys.
• BF1 (ever breastfed), BF2 (early initiation of breastfeeding), and BF4 and BF5 (exclusivity for first three days).
• Several breastfeeding and feeding practice variables have improved, however.
• From BF6 there is evidence that a higher percentage of children between the ages of 21 and 24 months of age are still receiving breast milk in 2012 compared to 2006, which is very positive.
• Breastfeeding frequencies during the day and night are similar across the two survey years (BF10 and 11).
• The percentage of children given breast milk non-optimally by spoon, cup or bottle has declined (B12) from 6.5 per cent to 3.5 per cent between 2006 and 2012, which is good.
• The percentage of children under the age of 6 months who are still breastfeeding who have been given plain water declined substantially from 47 per cent to 27 per cent (BF15) between the two surveys, which is good.
• The number of unique foods consumed by children 6–24 months of age has increased between the two survey years, almost tripling for the 6–12 month age group (BF16), although even for this group it is still very low (less than two unique items), signalling poor diversity. Dairy/eggs and pulses/nuts seem to have increased the most in terms of frequency of consumption.
• In 2012, 10 per cent of children 6–24 months of age consumed commercially fortified baby foods (BF16).
• In terms of supplements, the percentage of children who have ever received vitamin A has not changed across the two survey years and 30 per cent of all children under two have received a vitamin A dose in the past six months (in 2012, no data for 2006) (IM9 and IM11).
• The consumption of iron pills or syrup is approximately the same across the two years but the percentage of children being treated for worms has more than doubled from 8 to 19 per cent (IM12 and IM13), which is good.
• Ninety per cent of households use iodised salt in 2012 (SI1).
.
Table 1: Nutrition Outcomes - Percentage of Children
2006 2012 Percentage Point Change
No. % No. % 2006-2012 Std.Error
Underweight 347 30.0 549 22.7 -7.3 1.66
Wasting 225 19.5 384 15.9 -3.6 1.43
Stunting 451 39.1 572 23.7 -15.4 1.70
Sample: Children aged 0-24 months
Table 2: Child’s characteristics - Frequencies and Percentage
Age in months 2006 2012
Less than 6 177 15.3 581 24
6 to 10 258 22.4 537 22.2
11 to 15 268 23.2 457 18.9
16 to 20 252 21.8 512 21.2
21 to 25 200 17.3 328 13.6
Total 1,155 100 2,414 100
Sample: Children under 2 years of age
Table 3: Stunting Outcomes by age group, months
Age in months 2006 2012 2006-2012 Std.Error
Less than 6 15.44 9.78 -5.66 2.87
6 to 10 25.42 12.77 -12.65 2.97
11 to 15 49.44 26.52 -22.92 3.86
16 to 20 53.53 35.78 -17.75 3.94
21 to 24 45.53 43.32 -2.21 4.88
Sample: Children under 2 years of age
2006 2012Gender No. % No. %Boy 624 54.1 1,329 55.1Girl 530 45.9 1,085 44.9Total 1,155 100 2,414 100Birth order1st 506 43.8 1,068 44.32nd 360 31.2 885 36.73rd 181 15.7 316 13.14th or higher 107 9.3 145 6Total 1,155 100 2,414 100Age in monthsLess than 6 177 15.3 581 246 to 10 258 22.4 537 22.211 to 15 268 23.2 457 18.916 to 20 252 21.8 512 21.221 to 25 200 17.3 328 13.6Total 1,155 100 2,414 100Sample: Children under 2 years of age
Table 5: ANC care - Frequencies and Percentage
2006 2012Any ANC visit during pregnancy No. % No. %Yes 1,070 92.6 2,330 97.4No 85 7.4 63 2.6Total 1,154 100 2,394 100Visit from a doctorDoctor 926 85.3 1,850 78.2Other 160 14.7 515 21.8Total 1,086 100 2,365 100Number of ANC visits2/3 370 34.5 424 17.94/6 424 39.6 822 34.77/30 277 25.9 1,124 47.4Total 1,071 100 2,370 100Folic acid receivedYes 960 83.5 2,134 89.1No 190 16.5 261 10.9Total 1,149 100 2,395 100Place of delivery last childGovernment hosp/clinic 279 24.2 930 38.9Public hosp/clinic 466 40.4 1,149 48Home or other 409 35.4 315 13.1Total 1,154 100 2,394 100 Sample: Children aged 0-24 months
Table 6a: Breastfeeding and Complementary Feeding of under 2’s
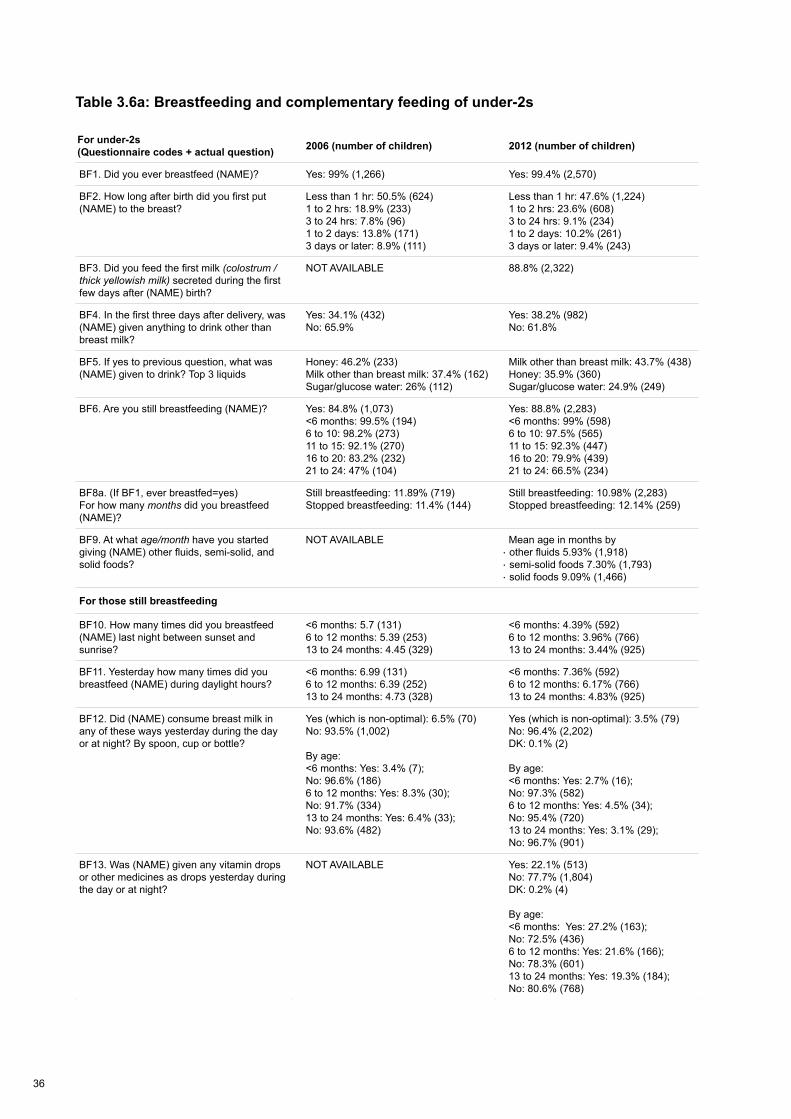
36
For under-2s (Questionnaire codes + actual question) 2006 (number of children) 2012 (number of children)
BF1. Did you ever breastfeed (NAME)? Yes: 99% (1,266) Yes: 99.4% (2,570)
BF2. How long after birth did you first put (NAME) to the breast?
Less than 1 hr: 50.5% (624)1 to 2 hrs: 18.9% (233)3 to 24 hrs: 7.8% (96)1 to 2 days: 13.8% (171)3 days or later: 8.9% (111)
Less than 1 hr: 47.6% (1,224)1 to 2 hrs: 23.6% (608)3 to 24 hrs: 9.1% (234)1 to 2 days: 10.2% (261)3 days or later: 9.4% (243)
BF3. Did you feed the first milk (colostrum / thick yellowish milk) secreted during the first few days after (NAME) birth?
NOT AVAILABLE 88.8% (2,322)
BF4. In the first three days after delivery, was (NAME) given anything to drink other than breast milk?
Yes: 34.1% (432)No: 65.9%
Yes: 38.2% (982)No: 61.8%
BF5. If yes to previous question, what was (NAME) given to drink? Top 3 liquids
Honey: 46.2% (233)Milk other than breast milk: 37.4% (162)Sugar/glucose water: 26% (112)
Milk other than breast milk: 43.7% (438)Honey: 35.9% (360)Sugar/glucose water: 24.9% (249)
BF6. Are you still breastfeeding (NAME)? Yes: 84.8% (1,073)<6 months: 99.5% (194)6 to 10: 98.2% (273)11 to 15: 92.1% (270)16 to 20: 83.2% (232)21 to 24: 47% (104)
Yes: 88.8% (2,283)<6 months: 99% (598)6 to 10: 97.5% (565)11 to 15: 92.3% (447)16 to 20: 79.9% (439)21 to 24: 66.5% (234)
BF8a. (If BF1, ever breastfed=yes) For how many months did you breastfeed (NAME)?
Still breastfeeding: 11.89% (719)Stopped breastfeeding: 11.4% (144)
Still breastfeeding: 10.98% (2,283)Stopped breastfeeding: 12.14% (259)
BF9. At what age/month have you started giving (NAME) other fluids, semi-solid, and solid foods?
NOT AVAILABLE Mean age in months by · other fluids 5.93% (1,918)· semi-solid foods 7.30% (1,793)· solid foods 9.09% (1,466)
For those still breastfeeding
BF10. How many times did you breastfeed (NAME) last night between sunset and sunrise?
<6 months: 5.7 (131)6 to 12 months: 5.39 (253)13 to 24 months: 4.45 (329)
<6 months: 4.39% (592)6 to 12 months: 3.96% (766)13 to 24 months: 3.44% (925)
BF11. Yesterday how many times did you breastfeed (NAME) during daylight hours?
<6 months: 6.99 (131)6 to 12 months: 6.39 (252)13 to 24 months: 4.73 (328)
<6 months: 7.36% (592)6 to 12 months: 6.17% (766)13 to 24 months: 4.83% (925)
BF12. Did (NAME) consume breast milk in any of these ways yesterday during the day or at night? By spoon, cup or bottle?
Yes (which is non-optimal): 6.5% (70)No: 93.5% (1,002)
By age:<6 months: Yes: 3.4% (7); No: 96.6% (186) 6 to 12 months: Yes: 8.3% (30); No: 91.7% (334)13 to 24 months: Yes: 6.4% (33); No: 93.6% (482)
Yes (which is non-optimal): 3.5% (79)No: 96.4% (2,202)DK: 0.1% (2)
By age:<6 months: Yes: 2.7% (16); No: 97.3% (582) 6 to 12 months: Yes: 4.5% (34); No: 95.4% (720)13 to 24 months: Yes: 3.1% (29); No: 96.7% (901)
BF13. Was (NAME) given any vitamin drops or other medicines as drops yesterday during the day or at night?
NOT AVAILABLE Yes: 22.1% (513)No: 77.7% (1,804)DK: 0.2% (4)
By age:<6 months: Yes: 27.2% (163); No: 72.5% (436) 6 to 12 months: Yes: 21.6% (166); No: 78.3% (601)13 to 24 months: Yes: 19.3% (184); No: 80.6% (768)
BF14. Was (NAME) given [local name for ORS] yesterday during the day or at night?
NOT AVAILABLE
Yes: 4.8% (111)No: 95% (2,204)DK: 0.2% (6)
By age:<6 months: Yes: 4.1% (24); No: 95.9% (576) 6 to 12 months: Yes: 5.3% (40); No: 94.6% (725)13 to 24 months: Yes: 4.8% (46); No: 94.7% (903)
BF15. What did (NAME) drink yesterday (during the day or at night)?
Plain water: 87.2% (936)Tinned/powder or fresh milk: 35.2% (378)Tea or coffee: 23.7% (255)
By age:< 6 months:Plain water: 47.3% (92)Tinned/powder or fresh milk: 12% (23)6 to 12 months:Plain water: 92.8% (338)Tinned/powder or fresh milk: 27.1% (99)Child baby formula: 8.6% (31)13 to 24 months:Plain water: 98.3% (506)Tinned/powder or fresh milk: 49.7% (256)Tea or coffee: 43.4% (224)
Plain water: 76.4% (1,773)Fresh animal milk: 35.9% (833)Dal water/rice water: 29.5% (685)
By age:< 6 months:Plain water: 26.9% (162)Fresh animal milk: 10.6% (63)Dal water/rice water: 4.3% (26)6 to 12 months:Plain water: 90.3% (693)Fresh animal milk: 37.3% (286)Dal water/rice water: 33.1% (254)13 to 24 months:Plain water: 96.4% (919)Fresh animal milk: 50.7% (483)Dal water/rice water: 42.6% (406)
Complementary foods
BF16. Now, I would like to ask you about the food (NAME) ate yesterday during the day or at night, either separately or combined with other foods?
NEW VAR: Number of foods
Mean no. items: 1.15 (719)
By age:<6 months: 0.001 (133)6 to 12 months: 0.59 (254)13 to 24 months: 1.98 (332)
Mean no. items: 1.96 (2,311)
By age:<6 months: 0.14 (595)6 to 12 months: 1.82 (776)13 to 24 months: 3.12 (940)
Using BF16
% of children 6–24 months who consumed in the last day: Meat/fish: One: 2.5% (27)Three: 0.08% (1)Dairy/eggs:One: 6.3% (68)Two: 4.1% (44)Micronutrient rich squash, fruits and veg:One: 19% (206)Three: 2.1% (23)Pulses/nuts:One: 5.9% (64)Both: 1.3% (14)
NOT AVAILABLE
% of children 6–24 months who consumed in the last day:Meat/fish: One: 4% (81)Two: 0.5% (9)Dairy/eggs:One: 15.3% (308)Two: 3.6% (73)Micronutrient rich squash, fruits and veg:One: 21.6% (436)Three: 1% (21)Pulses/nuts:One: 9.5% (192)Both: 1% (20)
% of children 6–24 months who consumed commercially fortified baby foods in the last day: 9.9% (199)
IM9. Has (NAME) ever received a vitamin A dose?
0 to 5 months: 7.4% (14)6 to 24 months: 64.5% (671)
0 to 5 months: 3.7% (22)6 to 24 months: 60.6% (1,170)
IM10. How many times has (NAME) received a vitamin A dose NOT AVAILABLE 0 to 6 months child: 1.8% (15)
7 to 24 months: 1.46% (1,071)
IM11. How many months ago did (NAME) take the last dose? NOT AVAILABLE % children who have taken a Vit A dose
in last 6 months: 30.8% (808)
IM12. Has (NAME) taken any drug to get rid of INTESTINAL WORMS in the past 6 months?
Yes: 7.8% (100) Yes: 18.8% (485)
IM13. Is (NAME) currently taking the iron pills or syrup? Yes: 9.7% (124) Yes: 8% (205)
SI1. HH SURVEYWe would like to check whether the salt used in your household is iodised. May I have a sample of the salt used to cook meals in your household?
NOT AVAILABLE
hhs not iodised 0ppm: 9.2% (242)hhs more than 0ppm & less than 15ppm: 13.4% (351)hhs 15ppm or more: 76.6% (2,010)hhs no salt in the house: 0.3% (7)hhs salt not tested: 0.6% (16)
Table 3.6a: Breastfeeding and complementary feeding of under-2s
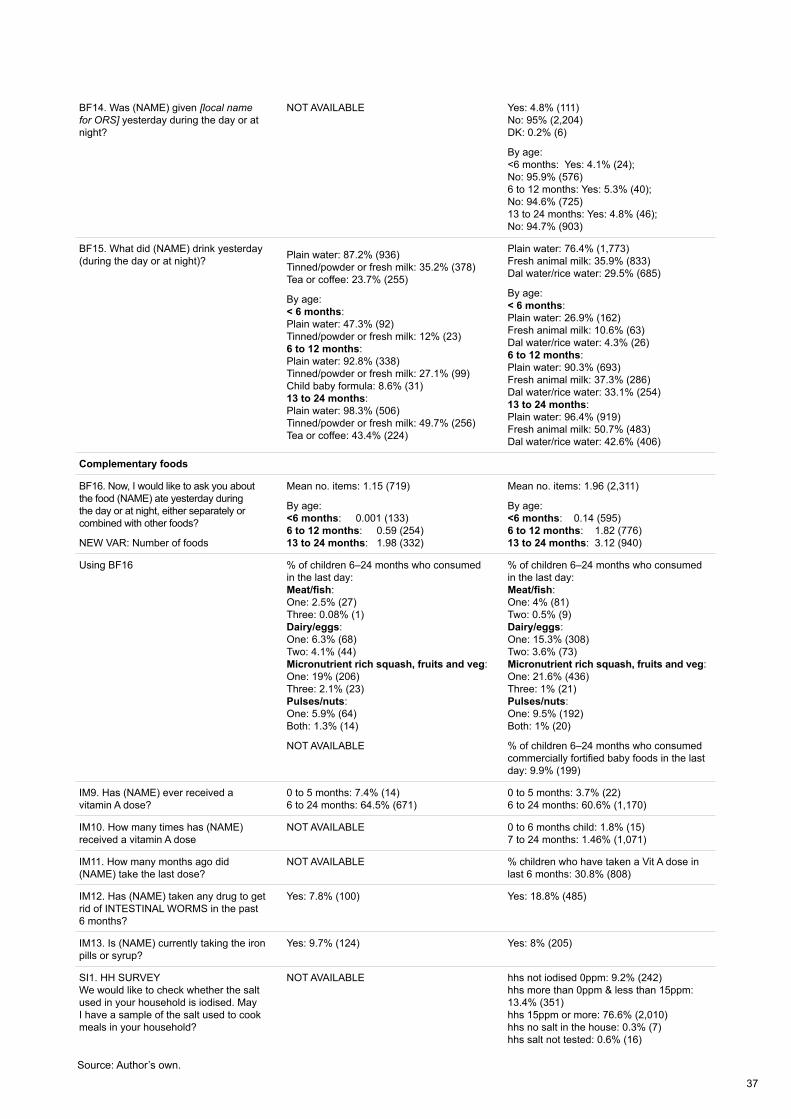
37
BF14. Was (NAME) given [local name for ORS] yesterday during the day or at night?
NOT AVAILABLE Yes: 4.8% (111)No: 95% (2,204)DK: 0.2% (6)
By age:<6 months: Yes: 4.1% (24); No: 95.9% (576) 6 to 12 months: Yes: 5.3% (40); No: 94.6% (725)13 to 24 months: Yes: 4.8% (46); No: 94.7% (903)
BF15. What did (NAME) drink yesterday (during the day or at night)? Plain water: 87.2% (936)
Tinned/powder or fresh milk: 35.2% (378)Tea or coffee: 23.7% (255)
By age:< 6 months:Plain water: 47.3% (92)Tinned/powder or fresh milk: 12% (23)6 to 12 months:Plain water: 92.8% (338)Tinned/powder or fresh milk: 27.1% (99)Child baby formula: 8.6% (31)13 to 24 months:Plain water: 98.3% (506)Tinned/powder or fresh milk: 49.7% (256)Tea or coffee: 43.4% (224)
Plain water: 76.4% (1,773)Fresh animal milk: 35.9% (833)Dal water/rice water: 29.5% (685)
By age:< 6 months:Plain water: 26.9% (162)Fresh animal milk: 10.6% (63)Dal water/rice water: 4.3% (26)6 to 12 months:Plain water: 90.3% (693)Fresh animal milk: 37.3% (286)Dal water/rice water: 33.1% (254)13 to 24 months:Plain water: 96.4% (919)Fresh animal milk: 50.7% (483)Dal water/rice water: 42.6% (406)
Complementary foods
BF16. Now, I would like to ask you about the food (NAME) ate yesterday during the day or at night, either separately or combined with other foods?
NEW VAR: Number of foods
Mean no. items: 1.15 (719)
By age:<6 months: 0.001 (133)6 to 12 months: 0.59 (254)13 to 24 months: 1.98 (332)
Mean no. items: 1.96 (2,311)
By age:<6 months: 0.14 (595)6 to 12 months: 1.82 (776)13 to 24 months: 3.12 (940)
Using BF16 % of children 6–24 months who consumed in the last day: Meat/fish: One: 2.5% (27)Three: 0.08% (1)Dairy/eggs:One: 6.3% (68)Two: 4.1% (44)Micronutrient rich squash, fruits and veg:One: 19% (206)Three: 2.1% (23)Pulses/nuts:One: 5.9% (64)Both: 1.3% (14)
NOT AVAILABLE
% of children 6–24 months who consumed in the last day:Meat/fish: One: 4% (81)Two: 0.5% (9)Dairy/eggs:One: 15.3% (308)Two: 3.6% (73)Micronutrient rich squash, fruits and veg:One: 21.6% (436)Three: 1% (21)Pulses/nuts:One: 9.5% (192)Both: 1% (20)
% of children 6–24 months who consumed commercially fortified baby foods in the last day: 9.9% (199)
IM9. Has (NAME) ever received a vitamin A dose?
0 to 5 months: 7.4% (14)6 to 24 months: 64.5% (671)
0 to 5 months: 3.7% (22)6 to 24 months: 60.6% (1,170)
IM10. How many times has (NAME) received a vitamin A dose
NOT AVAILABLE 0 to 6 months child: 1.8% (15)7 to 24 months: 1.46% (1,071)
IM11. How many months ago did (NAME) take the last dose?
NOT AVAILABLE % children who have taken a Vit A dose in last 6 months: 30.8% (808)
IM12. Has (NAME) taken any drug to get rid of INTESTINAL WORMS in the past 6 months?
Yes: 7.8% (100) Yes: 18.8% (485)
IM13. Is (NAME) currently taking the iron pills or syrup?
Yes: 9.7% (124) Yes: 8% (205)
SI1. HH SURVEYWe would like to check whether the salt used in your household is iodised. May I have a sample of the salt used to cook meals in your household?
NOT AVAILABLE hhs not iodised 0ppm: 9.2% (242)hhs more than 0ppm & less than 15ppm: 13.4% (351)hhs 15ppm or more: 76.6% (2,010)hhs no salt in the house: 0.3% (7)hhs salt not tested: 0.6% (16)
Source: Author’s own.
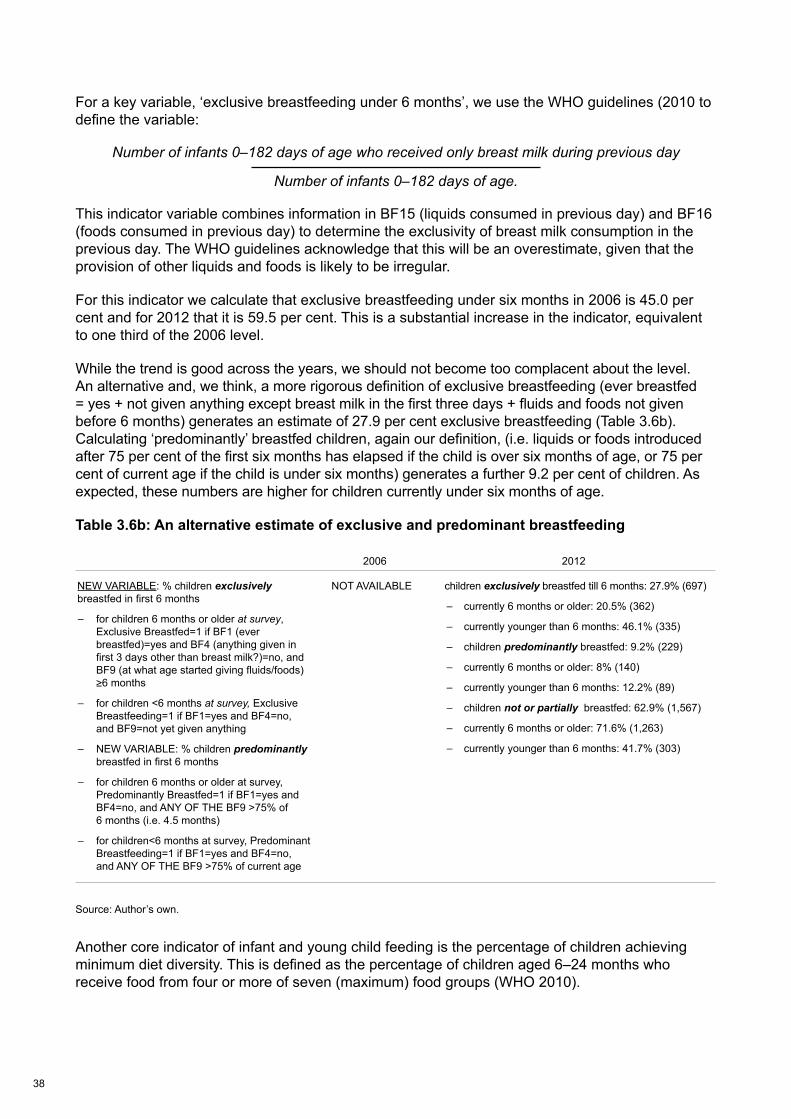
38
For a key variable, ‘exclusive breastfeeding under 6 months’, we use the WHO guidelines (2010 to define the variable:
Number of infants 0–182 days of age who received only breast milk during previous day
Number of infants 0–182 days of age.
This indicator variable combines information in BF15 (liquids consumed in previous day) and BF16 (foods consumed in previous day) to determine the exclusivity of breast milk consumption in the previous day. The WHO guidelines acknowledge that this will be an overestimate, given that the provision of other liquids and foods is likely to be irregular.
For this indicator we calculate that exclusive breastfeeding under six months in 2006 is 45.0 per cent and for 2012 that it is 59.5 per cent. This is a substantial increase in the indicator, equivalent to one third of the 2006 level.
While the trend is good across the years, we should not become too complacent about the level. An alternative and, we think, a more rigorous definition of exclusive breastfeeding (ever breastfed = yes + not given anything except breast milk in the first three days + fluids and foods not given before 6 months) generates an estimate of 27.9 per cent exclusive breastfeeding (Table 3.6b). Calculating ‘predominantly’ breastfed children, again our definition, (i.e. liquids or foods introduced after 75 per cent of the first six months has elapsed if the child is over six months of age, or 75 per cent of current age if the child is under six months) generates a further 9.2 per cent of children. As expected, these numbers are higher for children currently under six months of age.
Table 3.6b: An alternative estimate of exclusive and predominant breastfeeding
Source: Author’s own.
Another core indicator of infant and young child feeding is the percentage of children achieving minimum diet diversity. This is defined as the percentage of children aged 6–24 months who receive food from four or more of seven (maximum) food groups (WHO 2010).
2006 2012
NEW VARIABLE: % children exclusively breastfed in first 6 months
– for children 6 months or older at survey, Exclusive Breastfed=1 if BF1 (ever breastfed)=yes and BF4 (anything given in first 3 days other than breast milk?)=no, and BF9 (at what age started giving fluids/foods) ≥6 months
– for children <6 months at survey, Exclusive Breastfeeding=1 if BF1=yes and BF4=no, and BF9=not yet given anything
– NEW VARIABLE: % children predominantly breastfed in first 6 months
– for children 6 months or older at survey, Predominantly Breastfed=1 if BF1=yes and BF4=no, and ANY OF THE BF9 >75% of 6 months (i.e. 4.5 months)
– for children<6 months at survey, Predominant Breastfeeding=1 if BF1=yes and BF4=no, and ANY OF THE BF9 >75% of current age
NOT AVAILABLE children exclusively breastfed till 6 months: 27.9% (697)
– currently 6 months or older: 20.5% (362)
– currently younger than 6 months: 46.1% (335)
– children predominantly breastfed: 9.2% (229)
– currently 6 months or older: 8% (140)
– currently younger than 6 months: 12.2% (89)
– children not or partially breastfed: 62.9% (1,567)
– currently 6 months or older: 71.6% (1,263)
– currently younger than 6 months: 41.7% (303)

39
For 2006 this was 10.7 per cent and for 2012 it was 10.1 per cent. So despite an underlying positive trend in the number of unique foods consumed, this is not translating through into dietary diversity across the seven broad food groups. Only 10 per cent of children are achieving a minimum level of diet diversity.
In sum there appears to be some significant improvement in infant and young child feeding practices, but the room for improvement (e.g. early initiation, diet diversity and exclusive breastfeeding – using either definition) remains substantial.
3.4.3 Child health
The percentage of under-2s that have been vaccinated increases from 91 to 98 per cent; but the percentage receiving vitamin A has gone down (55 to 47) as has the percentage receiving iron tablets (10 to 8) (Table 3.7)
The percentage of under-2s diagnosed with diarrhoea has increased from 14 to 28. It is not clear if this is due to greater incidence of diarrhoea or more frequent diagnosis (Table 3.7)
Table 3.7: Child health – frequencies and percentages
Source: Author’s own.
ICDS/Anganwadi access has improved dramatically in the 2006–2012 period (Table 3.8). The percentage of children who received ICDS benefits in the previous 12 months and during pregnancy doubled, and the percentage of those receiving benefits while breastfeeding tripled.
2006 2012Child Vaccinated No. % No. %Yes 524 91.3 2,472 98No 50 8.7 50 2Total 574 100 2,522 100Diagnosed with diarrhoeaYes 164 14.2 663 27.5No 989 85.8 1,752 72.5Total 1,153 100 2,415 100Vitamin AYes 617 55.4 1,114 46.9No 497 44.6 1,260 53.1Taking iron tabletYes 111 9.7 196 8.2No 1,036 90.3 2,204 91.8Total 1,147 100 2,400 100
Sample: Children under 2 years of age
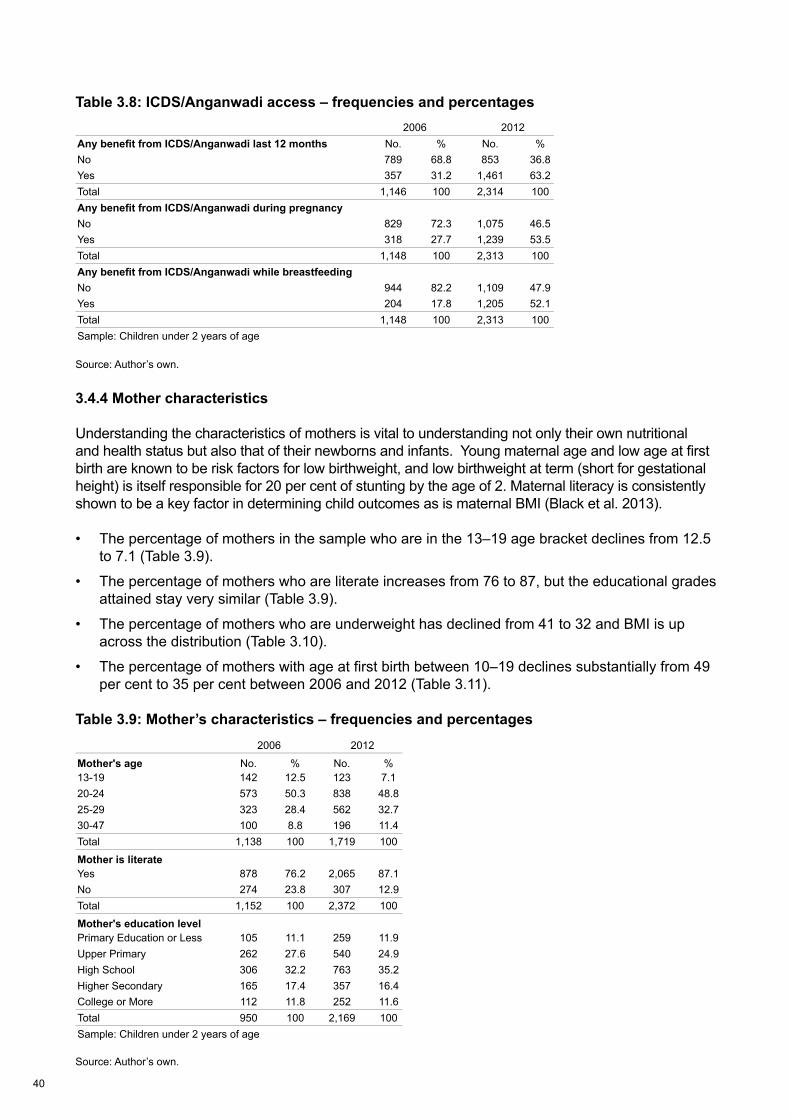
40
Table 3.8: ICDS/Anganwadi access – frequencies and percentages
Source: Author’s own.
3.4.4 Mother characteristics
Understanding the characteristics of mothers is vital to understanding not only their own nutritional and health status but also that of their newborns and infants. Young maternal age and low age at first birth are known to be risk factors for low birthweight, and low birthweight at term (short for gestational height) is itself responsible for 20 per cent of stunting by the age of 2. Maternal literacy is consistently shown to be a key factor in determining child outcomes as is maternal BMI (Black et al. 2013).
• The percentage of mothers in the sample who are in the 13–19 age bracket declines from 12.5 to 7.1 (Table 3.9).
• The percentage of mothers who are literate increases from 76 to 87, but the educational grades attained stay very similar (Table 3.9).
• The percentage of mothers who are underweight has declined from 41 to 32 and BMI is up across the distribution (Table 3.10).
• The percentage of mothers with age at first birth between 10–19 declines substantially from 49 per cent to 35 per cent between 2006 and 2012 (Table 3.11).
Table 3.9: Mother’s characteristics – frequencies and percentages
Source: Author’s own.
2006 2012Any benefit from ICDS/Anganwadi last 12 months No. % No. %No 789 68.8 853 36.8Yes 357 31.2 1,461 63.2Total 1,146 100 2,314 100Any benefit from ICDS/Anganwadi during pregnancyNo 829 72.3 1,075 46.5Yes 318 27.7 1,239 53.5Total 1,148 100 2,313 100Any benefit from ICDS/Anganwadi while breastfeedingNo 944 82.2 1,109 47.9Yes 204 17.8 1,205 52.1Total 1,148 100 2,313 100Sample: Children under 2 years of age
2006 2012
Mother's age No. % No. %13-19 142 12.5 123 7.120-24 573 50.3 838 48.825-29 323 28.4 562 32.730-47 100 8.8 196 11.4Total 1,138 100 1,719 100
Mother is literateYes 878 76.2 2,065 87.1No 274 23.8 307 12.9Total 1,152 100 2,372 100
Mother's education levelPrimary Education or Less 105 11.1 259 11.9Upper Primary 262 27.6 540 24.9High School 306 32.2 763 35.2Higher Secondary 165 17.4 357 16.4College or More 112 11.8 252 11.6Total 950 100 2,169 100Sample: Children under 2 years of age
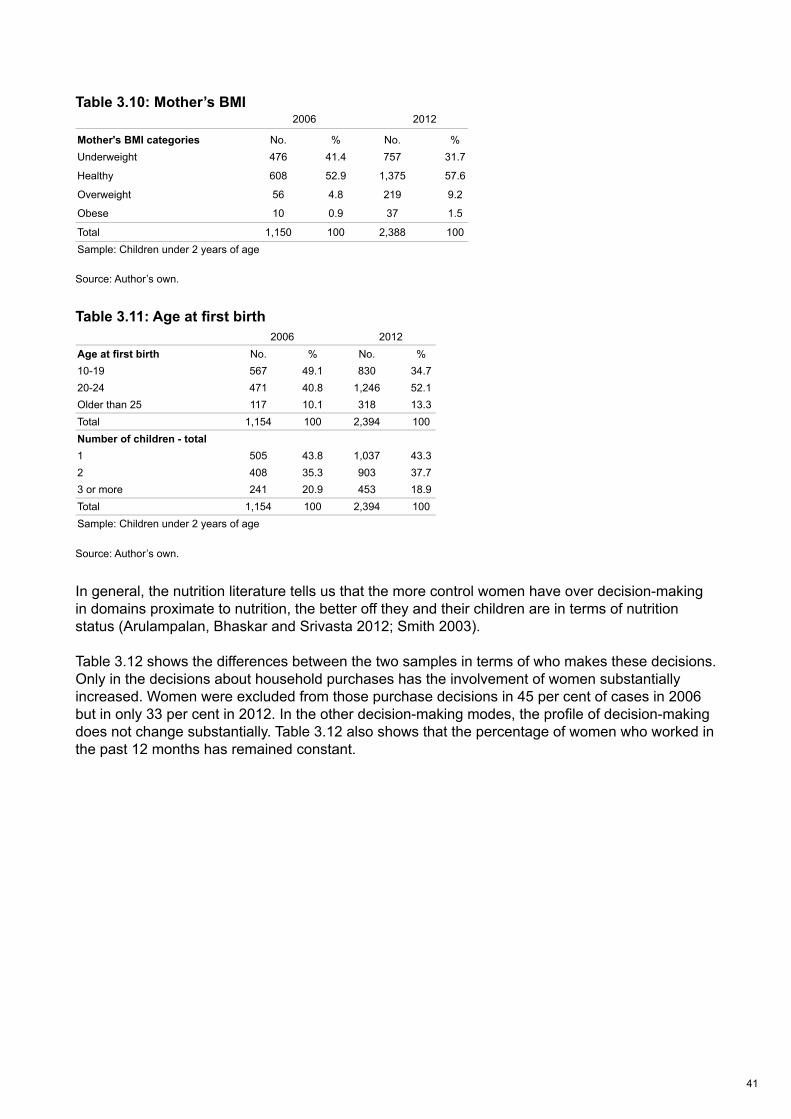
41
Table 3.10: Mother’s BMI
Source: Author’s own.
Table 3.11: Age at first birth
Source: Author’s own.
In general, the nutrition literature tells us that the more control women have over decision-making in domains proximate to nutrition, the better off they and their children are in terms of nutrition status (Arulampalan, Bhaskar and Srivasta 2012; Smith 2003).
Table 3.12 shows the differences between the two samples in terms of who makes these decisions. Only in the decisions about household purchases has the involvement of women substantially increased. Women were excluded from those purchase decisions in 45 per cent of cases in 2006 but in only 33 per cent in 2012. In the other decision-making modes, the profile of decision-making does not change substantially. Table 3.12 also shows that the percentage of women who worked in the past 12 months has remained constant.
2006 2012
Mother's BMI categories No. % No. %Underweight 476 41.4 757 31.7
Healthy 608 52.9 1,375 57.6
Overweight 56 4.8 219 9.2
Obese 10 0.9 37 1.5
Total 1,150 100 2,388 100Sample: Children under 2 years of age
2006 2012Age at first birth No. % No. %10-19 567 49.1 830 34.720-24 471 40.8 1,246 52.1Older than 25 117 10.1 318 13.3Total 1,154 100 2,394 100Number of children - total1 505 43.8 1,037 43.32 408 35.3 903 37.73 or more 241 20.9 453 18.9Total 1,154 100 2,394 100Sample: Children under 2 years of age

42
Table 3.12 Decisions by women – frequencies and percentages
Source: Author’s own.
3.4.5 Household characteristics
The percentage of households residing in urban areas has increased slightly from 43 to 45 per cent (Table 3.13).
The percentage of the children with no toilet decreased from 50 to 42 per cent (Table 3.13).
The percentage of children with access to piped water from the yard has decreased from 33 to 25 and the percentage of those with access to a tubewell or borehole has increased from 11 to 20 per cent, but there are no consistent patterns in changes in water source between the two survey years in terms of improvement or worsening of clean water access (Table 3.13).
The percentage of indigenous or ‘tribal’ children has stayed constant between the surveys (Table 3.13).
Household size has declined between the two years, with more children from households with four or fewer individuals and fewer children in households with eight or more members (Table 3.13).
2006 2012
Decisions on household purchases No. % No. % By others only 513 45 754 33.2
By woman and others 595 52.1 1,460 64.3
By woman only 33 2.9 58 2.5
Total 1,141 100 2,272 100
Decisions on visiting relativesBy others only 313 27.4 725 31.9
By woman and others 723 63.3 1,336 58.8
By woman only 105 9.2 210 9.2
Total 1,141 100 2,272 100
Decisions about health care for yourselfBy others only 390 34.2 723 31.8
By woman and others 409 35.8 1,044 45.9
By woman only 343 30 505 22.2
Total 1,141 100 2,272 100
Woman has worked last 12 monthsNo 801 70.2 1,571 69.1
Yes 341 29.8 701 30.9
Total 1,141 100 2,272 100
Sample: Children under 2 years of age
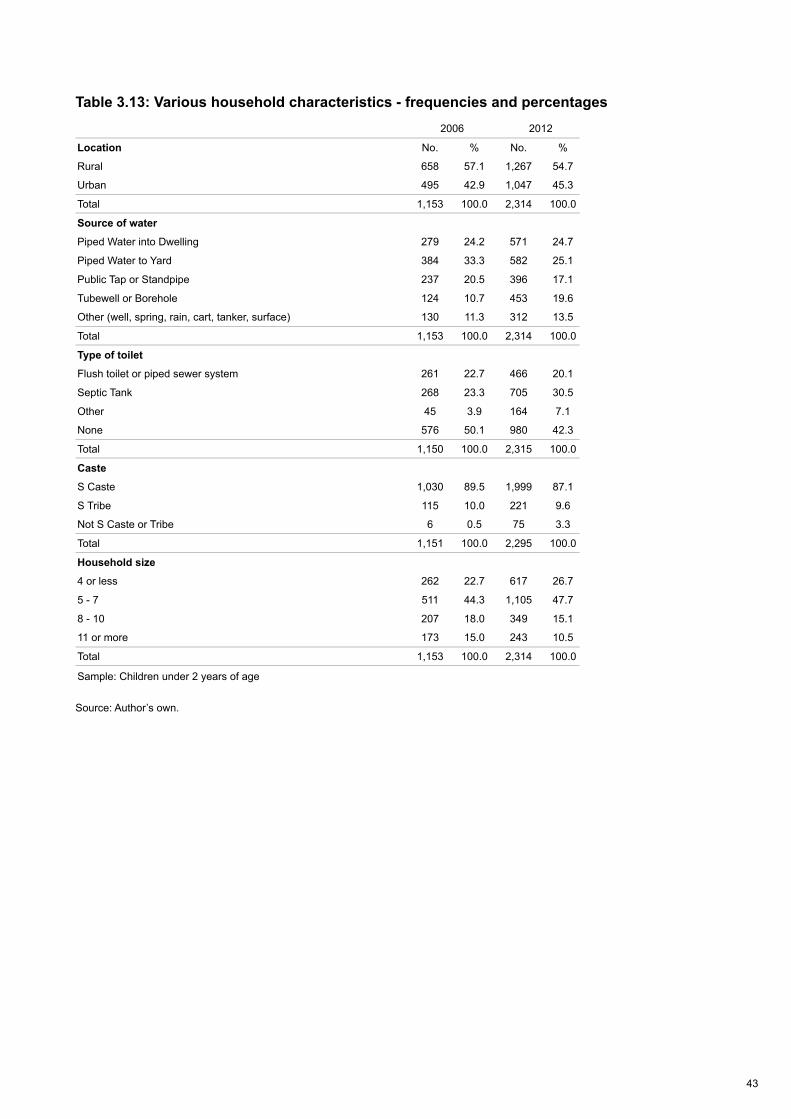
43
Table 3.13: Various household characteristics - frequencies and percentages
Source: Author’s own.
2006 2012
Location No. % No. %
Rural 658 57.1 1,267 54.7
Urban 495 42.9 1,047 45.3
Total 1,153 100.0 2,314 100.0
Source of water
Piped Water into Dwelling 279 24.2 571 24.7
Piped Water to Yard 384 33.3 582 25.1
Public Tap or Standpipe 237 20.5 396 17.1
Tubewell or Borehole 124 10.7 453 19.6
Other (well, spring, rain, cart, tanker, surface) 130 11.3 312 13.5
Total 1,153 100.0 2,314 100.0
Type of toilet
Flush toilet or piped sewer system 261 22.7 466 20.1
Septic Tank 268 23.3 705 30.5
Other 45 3.9 164 7.1
None 576 50.1 980 42.3
Total 1,150 100.0 2,315 100.0
Caste
S Caste 1,030 89.5 1,999 87.1
S Tribe 115 10.0 221 9.6
Not S Caste or Tribe 6 0.5 75 3.3
Total 1,151 100.0 2,295 100.0
Household size
4 or less 262 22.7 617 26.7
5 - 7 511 44.3 1,105 47.7
8 - 10 207 18.0 349 15.1
11 or more 173 15.0 243 10.5
Total 1,153 100.0 2,314 100.0
Sample: Children under 2 years of age
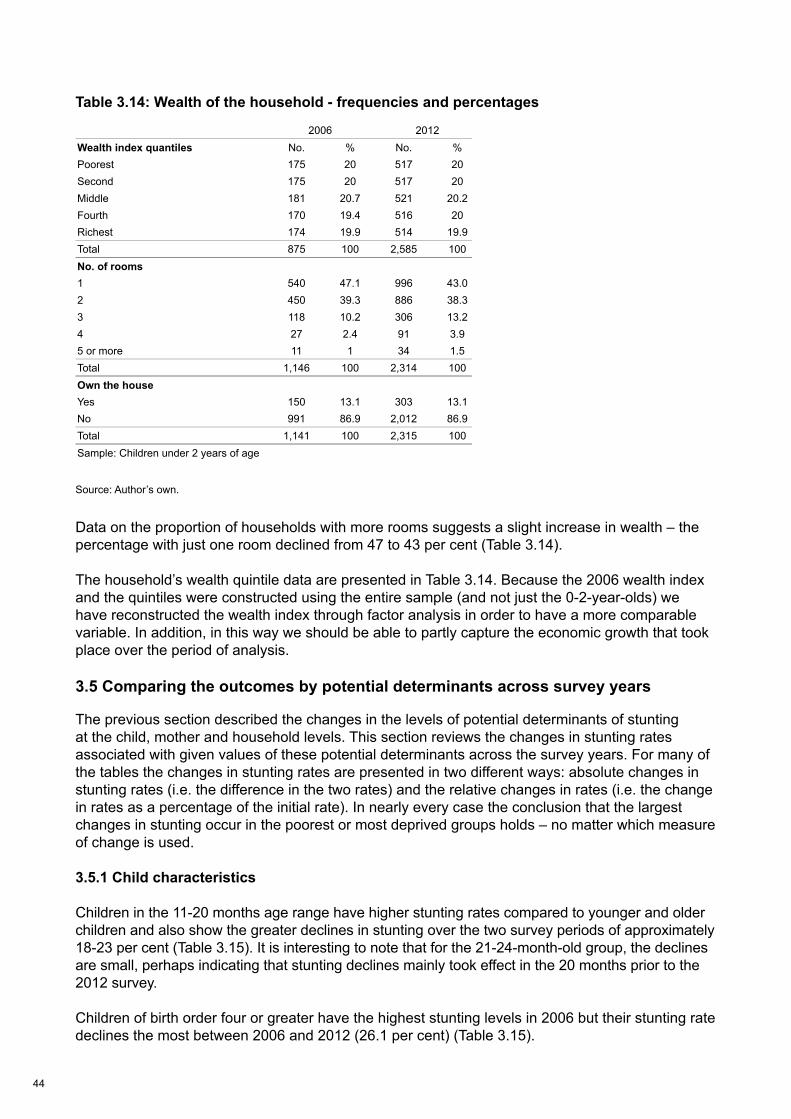
44
Table 3.14: Wealth of the household - frequencies and percentages
Source: Author’s own.
Data on the proportion of households with more rooms suggests a slight increase in wealth – the percentage with just one room declined from 47 to 43 per cent (Table 3.14).
The household’s wealth quintile data are presented in Table 3.14. Because the 2006 wealth index and the quintiles were constructed using the entire sample (and not just the 0-2-year-olds) we have reconstructed the wealth index through factor analysis in order to have a more comparable variable. In addition, in this way we should be able to partly capture the economic growth that took place over the period of analysis.
3.5 Comparing the outcomes by potential determinants across survey years
The previous section described the changes in the levels of potential determinants of stunting at the child, mother and household levels. This section reviews the changes in stunting rates associated with given values of these potential determinants across the survey years. For many of the tables the changes in stunting rates are presented in two different ways: absolute changes in stunting rates (i.e. the difference in the two rates) and the relative changes in rates (i.e. the change in rates as a percentage of the initial rate). In nearly every case the conclusion that the largest changes in stunting occur in the poorest or most deprived groups holds – no matter which measure of change is used.
3.5.1 Child characteristics
Children in the 11-20 months age range have higher stunting rates compared to younger and older children and also show the greater declines in stunting over the two survey periods of approximately 18-23 per cent (Table 3.15). It is interesting to note that for the 21-24-month-old group, the declines are small, perhaps indicating that stunting declines mainly took effect in the 20 months prior to the 2012 survey.
Children of birth order four or greater have the highest stunting levels in 2006 but their stunting rate declines the most between 2006 and 2012 (26.1 per cent) (Table 3.15).
2006 2012Wealth index quantiles No. % No. %Poorest 175 20 517 20Second 175 20 517 20Middle 181 20.7 521 20.2Fourth 170 19.4 516 20Richest 174 19.9 514 19.9Total 875 100 2,585 100No. of rooms1 540 47.1 996 43.02 450 39.3 886 38.33 118 10.2 306 13.24 27 2.4 91 3.95 or more 11 1 34 1.5Total 1,146 100 2,314 100Own the houseYes 150 13.1 303 13.1No 991 86.9 2,012 86.9Total 1,141 100 2,315 100Sample: Children under 2 years of age
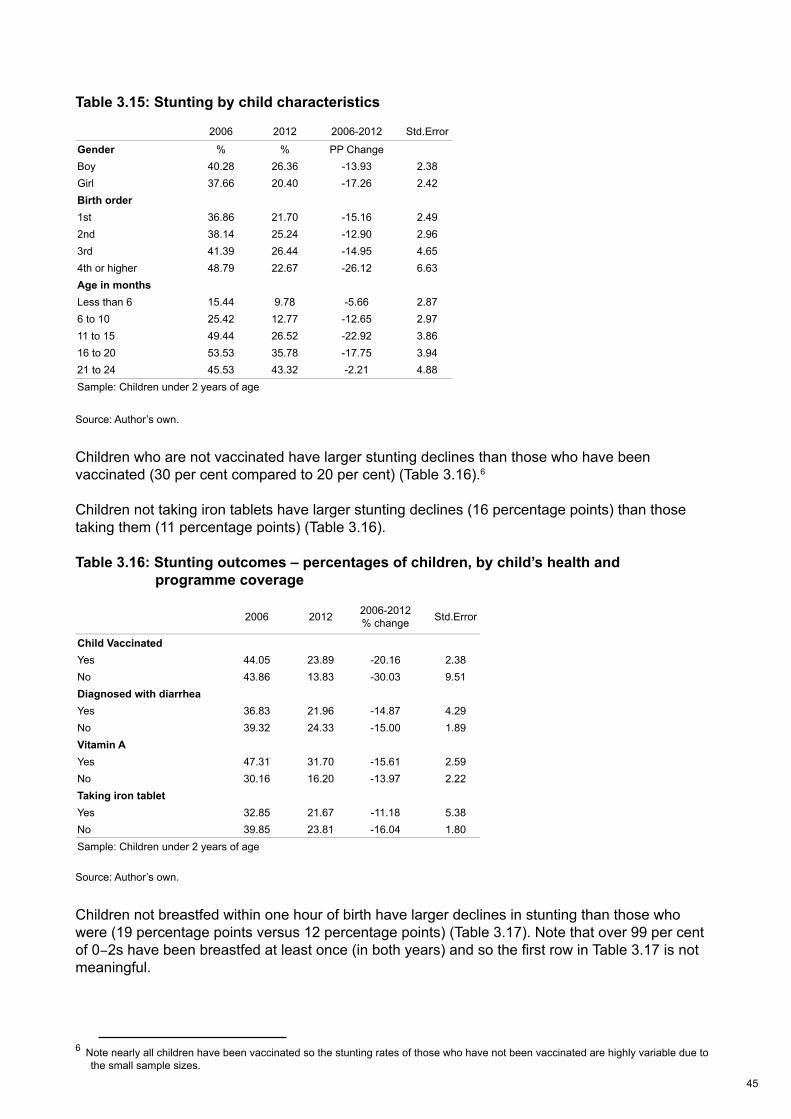
45
Table 3.15: Stunting by child characteristics
Source: Author’s own.
Children who are not vaccinated have larger stunting declines than those who have been vaccinated (30 per cent compared to 20 per cent) (Table 3.16).6
Children not taking iron tablets have larger stunting declines (16 percentage points) than those taking them (11 percentage points) (Table 3.16).
Table 3.16: Stunting outcomes – percentages of children, by child’s health and programme coverage
Source: Author’s own.
Children not breastfed within one hour of birth have larger declines in stunting than those who were (19 percentage points versus 12 percentage points) (Table 3.17). Note that over 99 per cent of 0-2s have been breastfed at least once (in both years) and so the first row in Table 3.17 is not meaningful.
6 Note nearly all children have been vaccinated so the stunting rates of those who have not been vaccinated are highly variable due to the small sample sizes.
2006 2012 2006-2012 Std.Error
Gender % % PP ChangeBoy 40.28 26.36 -13.93 2.38Girl 37.66 20.40 -17.26 2.42Birth order1st 36.86 21.70 -15.16 2.492nd 38.14 25.24 -12.90 2.963rd 41.39 26.44 -14.95 4.654th or higher 48.79 22.67 -26.12 6.63Age in monthsLess than 6 15.44 9.78 -5.66 2.876 to 10 25.42 12.77 -12.65 2.9711 to 15 49.44 26.52 -22.92 3.8616 to 20 53.53 35.78 -17.75 3.9421 to 24 45.53 43.32 -2.21 4.88Sample: Children under 2 years of age
2006 2012 2006-2012% change Std.Error
Child VaccinatedYes 44.05 23.89 -20.16 2.38No 43.86 13.83 -30.03 9.51Diagnosed with diarrheaYes 36.83 21.96 -14.87 4.29No 39.32 24.33 -15.00 1.89Vitamin AYes 47.31 31.70 -15.61 2.59No 30.16 16.20 -13.97 2.22Taking iron tabletYes 32.85 21.67 -11.18 5.38No 39.85 23.81 -16.04 1.80Sample: Children under 2 years of age
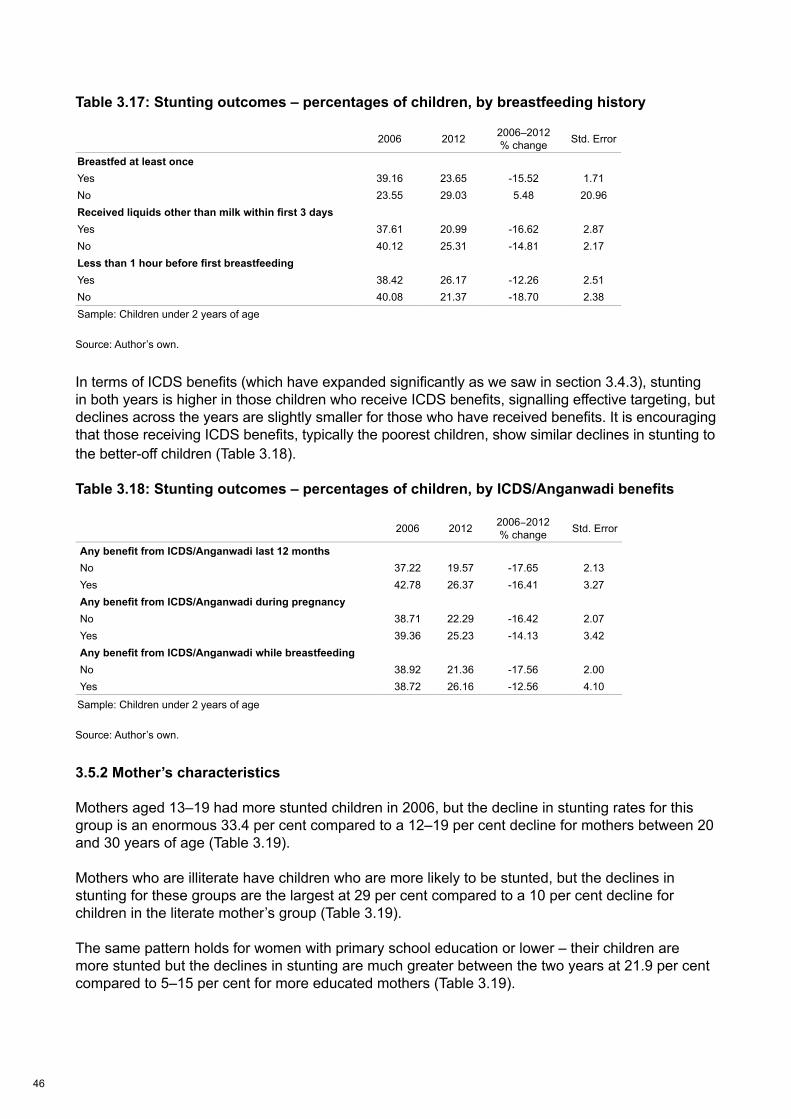
46
Table 3.17: Stunting outcomes – percentages of children, by breastfeeding history
Source: Author’s own.
In terms of ICDS benefits (which have expanded significantly as we saw in section 3.4.3), stunting in both years is higher in those children who receive ICDS benefits, signalling effective targeting, but declines across the years are slightly smaller for those who have received benefits. It is encouraging that those receiving ICDS benefits, typically the poorest children, show similar declines in stunting to the better-off children (Table 3.18).
Table 3.18: Stunting outcomes – percentages of children, by ICDS/Anganwadi benefits
Source: Author’s own.
3.5.2 Mother’s characteristics
Mothers aged 13–19 had more stunted children in 2006, but the decline in stunting rates for this group is an enormous 33.4 per cent compared to a 12–19 per cent decline for mothers between 20 and 30 years of age (Table 3.19).
Mothers who are illiterate have children who are more likely to be stunted, but the declines in stunting for these groups are the largest at 29 per cent compared to a 10 per cent decline for children in the literate mother’s group (Table 3.19).
The same pattern holds for women with primary school education or lower – their children are more stunted but the declines in stunting are much greater between the two years at 21.9 per cent compared to 5–15 per cent for more educated mothers (Table 3.19).
2006 2012 2006–2012% change Std. Error
Breastfed at least onceYes 39.16 23.65 -15.52 1.71No 23.55 29.03 5.48 20.96Received liquids other than milk within first 3 daysYes 37.61 20.99 -16.62 2.87No 40.12 25.31 -14.81 2.17Less than 1 hour before first breastfeedingYes 38.42 26.17 -12.26 2.51No 40.08 21.37 -18.70 2.38Sample: Children under 2 years of age
2006 2012 2006-2012% change Std. Error
Any benefit from ICDS/Anganwadi last 12 monthsNo 37.22 19.57 -17.65 2.13Yes 42.78 26.37 -16.41 3.27Any benefit from ICDS/Anganwadi during pregnancyNo 38.71 22.29 -16.42 2.07Yes 39.36 25.23 -14.13 3.42Any benefit from ICDS/Anganwadi while breastfeedingNo 38.92 21.36 -17.56 2.00Yes 38.72 26.16 -12.56 4.10
Sample: Children under 2 years of age
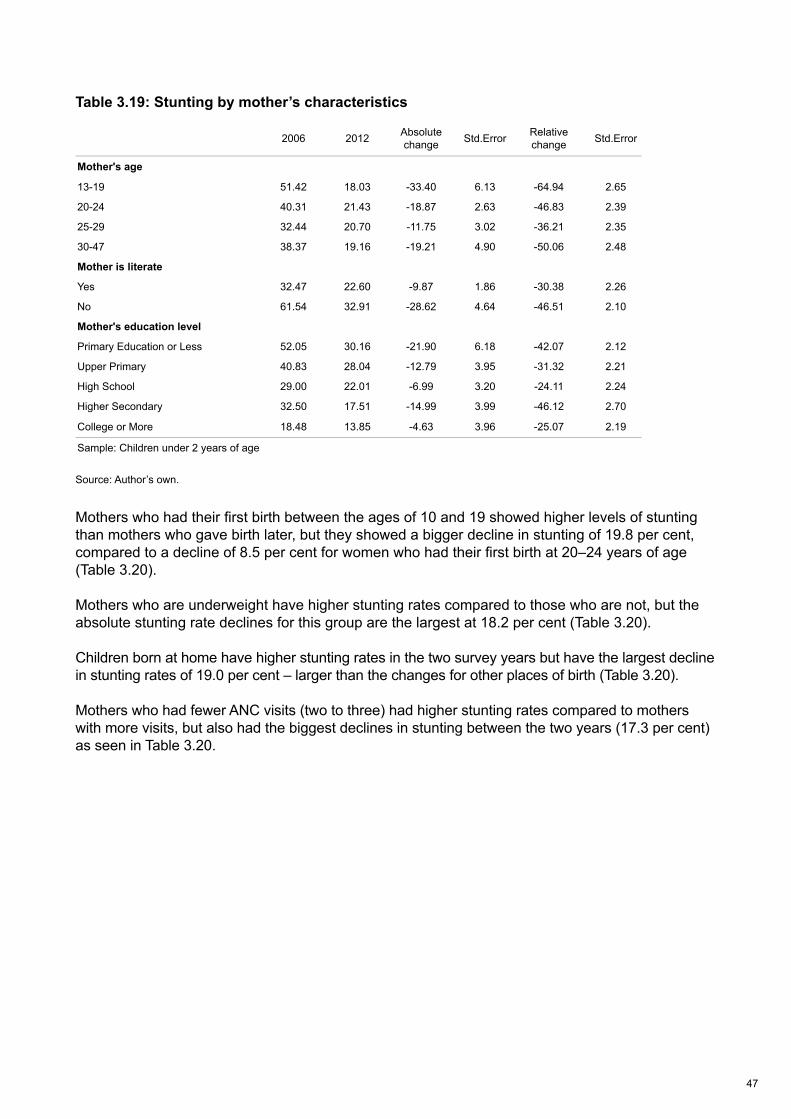
47
Table 3.19: Stunting by mother’s characteristics
Source: Author’s own.
Mothers who had their first birth between the ages of 10 and 19 showed higher levels of stunting than mothers who gave birth later, but they showed a bigger decline in stunting of 19.8 per cent, compared to a decline of 8.5 per cent for women who had their first birth at 20–24 years of age (Table 3.20).
Mothers who are underweight have higher stunting rates compared to those who are not, but the absolute stunting rate declines for this group are the largest at 18.2 per cent (Table 3.20).
Children born at home have higher stunting rates in the two survey years but have the largest decline in stunting rates of 19.0 per cent – larger than the changes for other places of birth (Table 3.20).
Mothers who had fewer ANC visits (two to three) had higher stunting rates compared to mothers with more visits, but also had the biggest declines in stunting between the two years (17.3 per cent) as seen in Table 3.20.
2006 2012 Absolute change Std.Error Relative
change Std.Error
Mother's age
13-19 51.42 18.03 -33.40 6.13 -64.94 2.65
20-24 40.31 21.43 -18.87 2.63 -46.83 2.39
25-29 32.44 20.70 -11.75 3.02 -36.21 2.35
30-47 38.37 19.16 -19.21 4.90 -50.06 2.48
Mother is literate
Yes 32.47 22.60 -9.87 1.86 -30.38 2.26
No 61.54 32.91 -28.62 4.64 -46.51 2.10
Mother's education level
Primary Education or Less 52.05 30.16 -21.90 6.18 -42.07 2.12
Upper Primary 40.83 28.04 -12.79 3.95 -31.32 2.21
High School 29.00 22.01 -6.99 3.20 -24.11 2.24
Higher Secondary 32.50 17.51 -14.99 3.99 -46.12 2.70
College or More 18.48 13.85 -4.63 3.96 -25.07 2.19
Sample: Children under 2 years of age
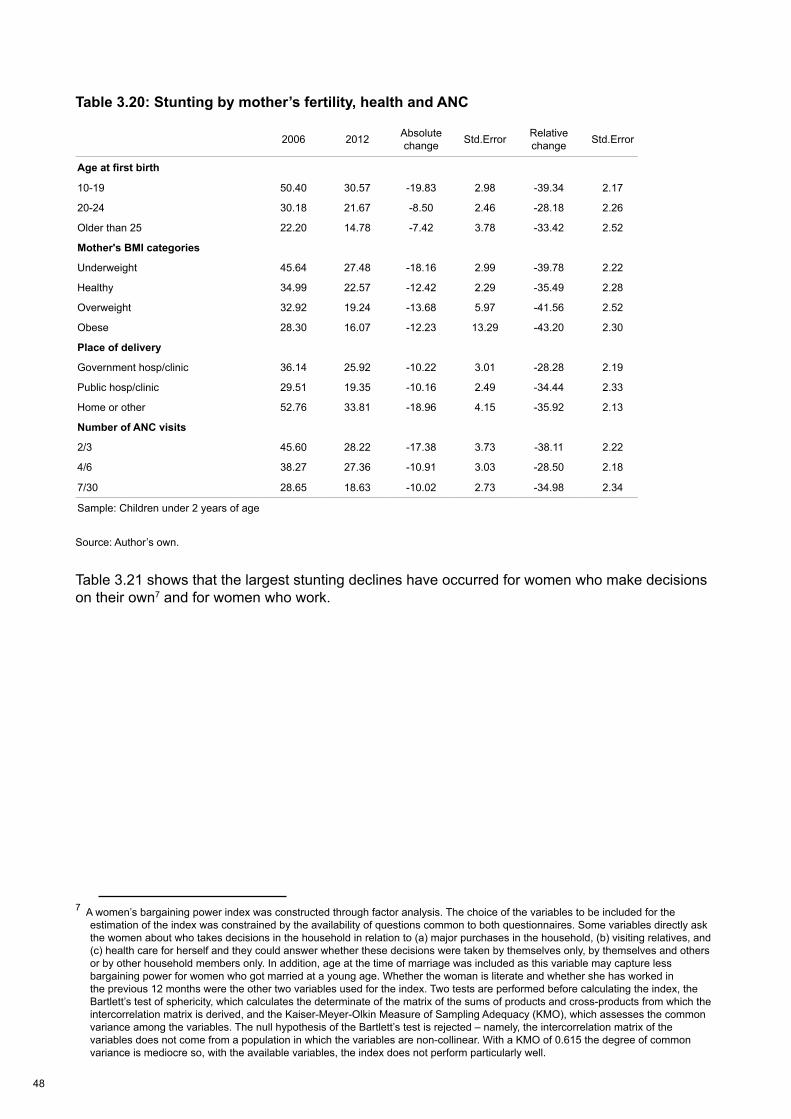
48
Table 3.20: Stunting by mother’s fertility, health and ANC
Source: Author’s own.
Table 3.21 shows that the largest stunting declines have occurred for women who make decisions on their own7 and for women who work.
7 A women’s bargaining power index was constructed through factor analysis. The choice of the variables to be included for the estimation of the index was constrained by the availability of questions common to both questionnaires. Some variables directly ask the women about who takes decisions in the household in relation to (a) major purchases in the household, (b) visiting relatives, and (c) health care for herself and they could answer whether these decisions were taken by themselves only, by themselves and others or by other household members only. In addition, age at the time of marriage was included as this variable may capture less bargaining power for women who got married at a young age. Whether the woman is literate and whether she has worked in the previous 12 months were the other two variables used for the index. Two tests are performed before calculating the index, the Bartlett’s test of sphericity, which calculates the determinate of the matrix of the sums of products and cross-products from which the intercorrelation matrix is derived, and the Kaiser-Meyer-Olkin Measure of Sampling Adequacy (KMO), which assesses the common variance among the variables. The null hypothesis of the Bartlett’s test is rejected – namely, the intercorrelation matrix of the variables does not come from a population in which the variables are non-collinear. With a KMO of 0.615 the degree of common variance is mediocre so, with the available variables, the index does not perform particularly well.
2006 2012 Absolute change Std.Error Relative
change Std.Error
Age at first birth
10-19 50.40 30.57 -19.83 2.98 -39.34 2.17
20-24 30.18 21.67 -8.50 2.46 -28.18 2.26
Older than 25 22.20 14.78 -7.42 3.78 -33.42 2.52
Mother's BMI categories
Underweight 45.64 27.48 -18.16 2.99 -39.78 2.22
Healthy 34.99 22.57 -12.42 2.29 -35.49 2.28
Overweight 32.92 19.24 -13.68 5.97 -41.56 2.52
Obese 28.30 16.07 -12.23 13.29 -43.20 2.30
Place of delivery
Government hosp/clinic 36.14 25.92 -10.22 3.01 -28.28 2.19
Public hosp/clinic 29.51 19.35 -10.16 2.49 -34.44 2.33
Home or other 52.76 33.81 -18.96 4.15 -35.92 2.13
Number of ANC visits
2/3 45.60 28.22 -17.38 3.73 -38.11 2.22
4/6 38.27 27.36 -10.91 3.03 -28.50 2.18
7/30 28.65 18.63 -10.02 2.73 -34.98 2.34
Sample: Children under 2 years of age
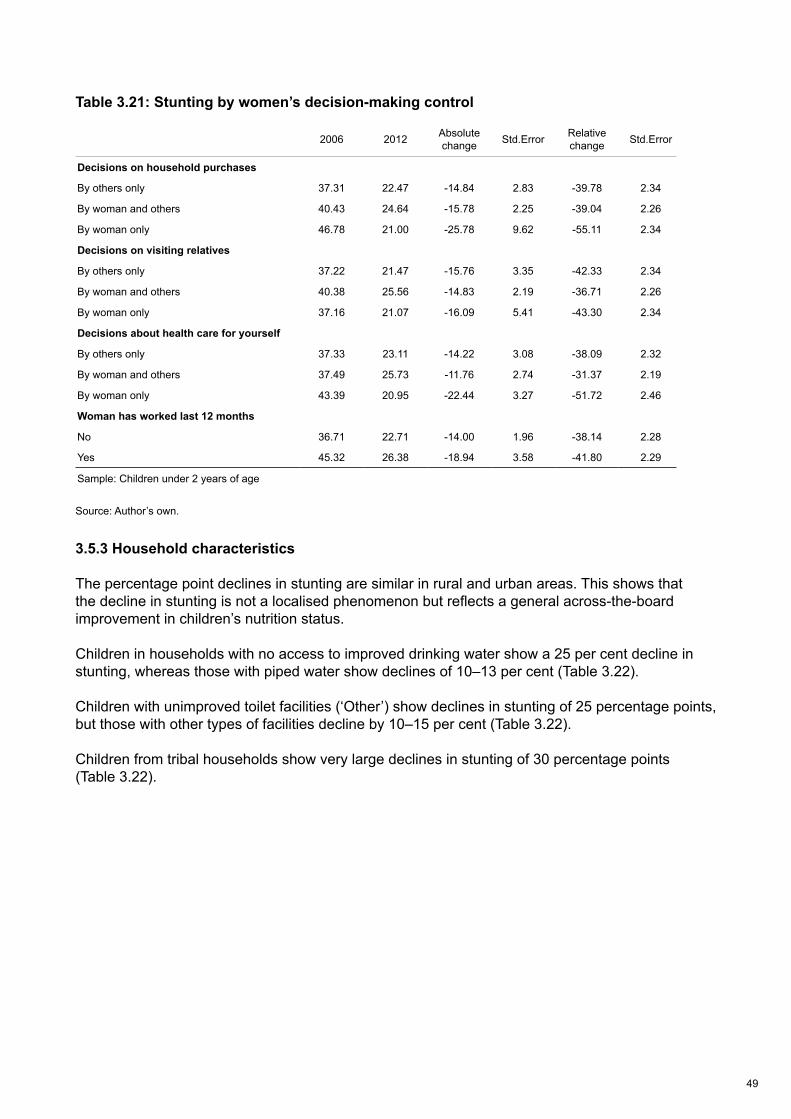
49
Table 3.21: Stunting by women’s decision-making control
Source: Author’s own.
3.5.3 Household characteristics
The percentage point declines in stunting are similar in rural and urban areas. This shows that the decline in stunting is not a localised phenomenon but reflects a general across-the-board improvement in children’s nutrition status.
Children in households with no access to improved drinking water show a 25 per cent decline in stunting, whereas those with piped water show declines of 10–13 per cent (Table 3.22).
Children with unimproved toilet facilities (‘Other’) show declines in stunting of 25 percentage points, but those with other types of facilities decline by 10–15 per cent (Table 3.22).
Children from tribal households show very large declines in stunting of 30 percentage points (Table 3.22).
2006 2012 Absolute change Std.Error Relative
change Std.Error
Decisions on household purchases
By others only 37.31 22.47 -14.84 2.83 -39.78 2.34
By woman and others 40.43 24.64 -15.78 2.25 -39.04 2.26
By woman only 46.78 21.00 -25.78 9.62 -55.11 2.34
Decisions on visiting relatives
By others only 37.22 21.47 -15.76 3.35 -42.33 2.34
By woman and others 40.38 25.56 -14.83 2.19 -36.71 2.26
By woman only 37.16 21.07 -16.09 5.41 -43.30 2.34
Decisions about health care for yourself
By others only 37.33 23.11 -14.22 3.08 -38.09 2.32
By woman and others 37.49 25.73 -11.76 2.74 -31.37 2.19
By woman only 43.39 20.95 -22.44 3.27 -51.72 2.46
Woman has worked last 12 months
No 36.71 22.71 -14.00 1.96 -38.14 2.28
Yes 45.32 26.38 -18.94 3.58 -41.80 2.29
Sample: Children under 2 years of age
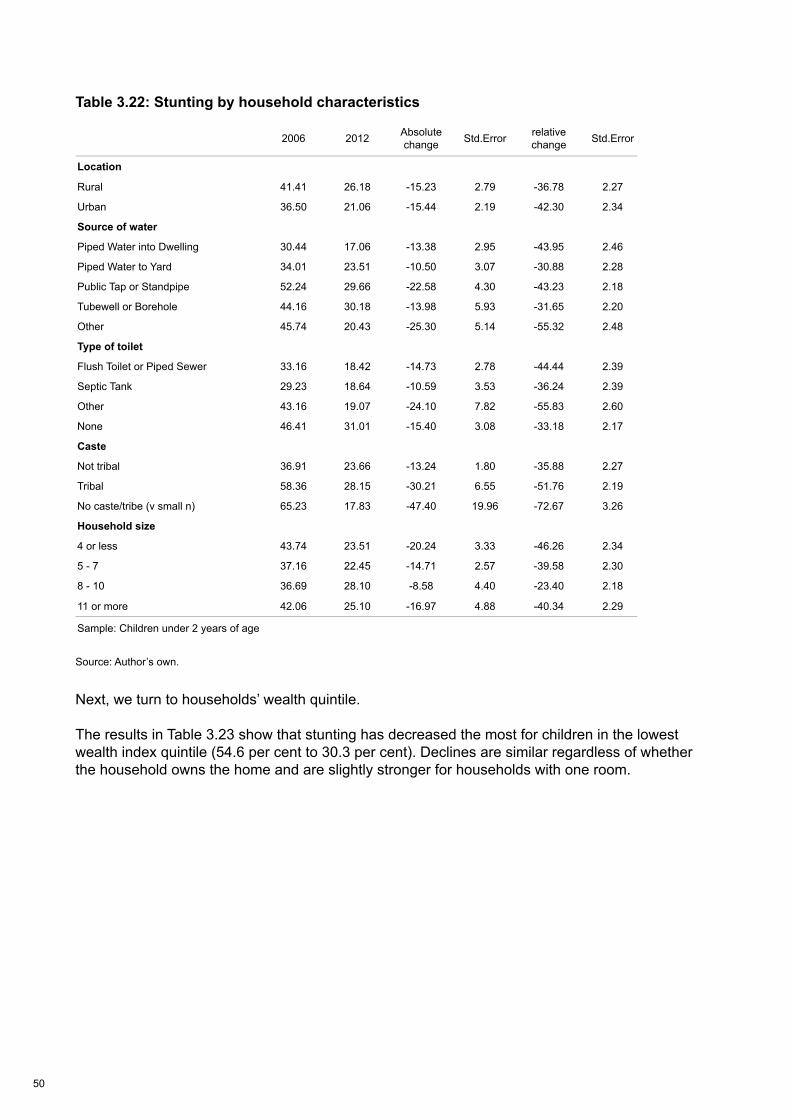
50
Table 3.22: Stunting by household characteristics
Source: Author’s own.
Next, we turn to households’ wealth quintile.
The results in Table 3.23 show that stunting has decreased the most for children in the lowest wealth index quintile (54.6 per cent to 30.3 per cent). Declines are similar regardless of whether the household owns the home and are slightly stronger for households with one room.
2006 2012 Absolute change Std.Error relative
change Std.Error
Location
Rural 41.41 26.18 -15.23 2.79 -36.78 2.27
Urban 36.50 21.06 -15.44 2.19 -42.30 2.34
Source of water
Piped Water into Dwelling 30.44 17.06 -13.38 2.95 -43.95 2.46
Piped Water to Yard 34.01 23.51 -10.50 3.07 -30.88 2.28
Public Tap or Standpipe 52.24 29.66 -22.58 4.30 -43.23 2.18
Tubewell or Borehole 44.16 30.18 -13.98 5.93 -31.65 2.20
Other 45.74 20.43 -25.30 5.14 -55.32 2.48
Type of toilet
Flush Toilet or Piped Sewer 33.16 18.42 -14.73 2.78 -44.44 2.39
Septic Tank 29.23 18.64 -10.59 3.53 -36.24 2.39
Other 43.16 19.07 -24.10 7.82 -55.83 2.60
None 46.41 31.01 -15.40 3.08 -33.18 2.17
Caste
Not tribal 36.91 23.66 -13.24 1.80 -35.88 2.27
Tribal 58.36 28.15 -30.21 6.55 -51.76 2.19
No caste/tribe (v small n) 65.23 17.83 -47.40 19.96 -72.67 3.26
Household size
4 or less 43.74 23.51 -20.24 3.33 -46.26 2.34
5 - 7 37.16 22.45 -14.71 2.57 -39.58 2.30
8 - 10 36.69 28.10 -8.58 4.40 -23.40 2.18
11 or more 42.06 25.10 -16.97 4.88 -40.34 2.29
Sample: Children under 2 years of age
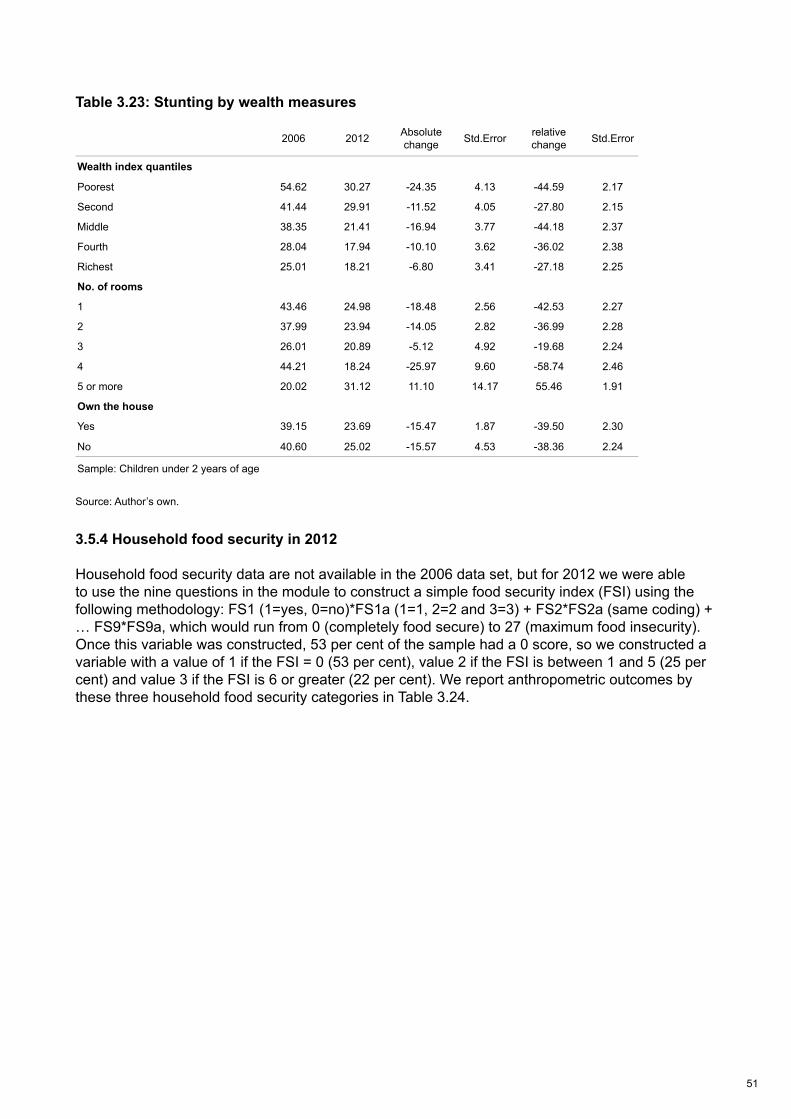
51
Table 3.23: Stunting by wealth measures
Source: Author’s own.
3.5.4 Household food security in 2012
Household food security data are not available in the 2006 data set, but for 2012 we were able to use the nine questions in the module to construct a simple food security index (FSI) using the following methodology: FS1 (1=yes, 0=no)*FS1a (1=1, 2=2 and 3=3) + FS2*FS2a (same coding) + … FS9*FS9a, which would run from 0 (completely food secure) to 27 (maximum food insecurity). Once this variable was constructed, 53 per cent of the sample had a 0 score, so we constructed a variable with a value of 1 if the FSI = 0 (53 per cent), value 2 if the FSI is between 1 and 5 (25 per cent) and value 3 if the FSI is 6 or greater (22 per cent). We report anthropometric outcomes by these three household food security categories in Table 3.24.
2006 2012 Absolute change Std.Error relative
change Std.Error
Location
Rural 41.41 26.18 -15.23 2.79 -36.78 2.27
Urban 36.50 21.06 -15.44 2.19 -42.30 2.34
Source of water
Piped Water into Dwelling 30.44 17.06 -13.38 2.95 -43.95 2.46
Piped Water to Yard 34.01 23.51 -10.50 3.07 -30.88 2.28
Public Tap or Standpipe 52.24 29.66 -22.58 4.30 -43.23 2.18
Tubewell or Borehole 44.16 30.18 -13.98 5.93 -31.65 2.20
Other 45.74 20.43 -25.30 5.14 -55.32 2.48
Type of toilet
Flush Toilet or Piped Sewer 33.16 18.42 -14.73 2.78 -44.44 2.39
Septic Tank 29.23 18.64 -10.59 3.53 -36.24 2.39
Other 43.16 19.07 -24.10 7.82 -55.83 2.60
None 46.41 31.01 -15.40 3.08 -33.18 2.17
Caste
Not tribal 36.91 23.66 -13.24 1.80 -35.88 2.27
Tribal 58.36 28.15 -30.21 6.55 -51.76 2.19
No caste/tribe (v small n) 65.23 17.83 -47.40 19.96 -72.67 3.26
Household size
4 or less 43.74 23.51 -20.24 3.33 -46.26 2.34
5 - 7 37.16 22.45 -14.71 2.57 -39.58 2.30
8 - 10 36.69 28.10 -8.58 4.40 -23.40 2.18
11 or more 42.06 25.10 -16.97 4.88 -40.34 2.29
Sample: Children under 2 years of age
2006 2012 Absolute change Std.Error relative
change Std.Error
Wealth index quantiles
Poorest 54.62 30.27 -24.35 4.13 -44.59 2.17
Second 41.44 29.91 -11.52 4.05 -27.80 2.15
Middle 38.35 21.41 -16.94 3.77 -44.18 2.37
Fourth 28.04 17.94 -10.10 3.62 -36.02 2.38
Richest 25.01 18.21 -6.80 3.41 -27.18 2.25
No. of rooms
1 43.46 24.98 -18.48 2.56 -42.53 2.27
2 37.99 23.94 -14.05 2.82 -36.99 2.28
3 26.01 20.89 -5.12 4.92 -19.68 2.24
4 44.21 18.24 -25.97 9.60 -58.74 2.46
5 or more 20.02 31.12 11.10 14.17 55.46 1.91
Own the house
Yes 39.15 23.69 -15.47 1.87 -39.50 2.30
No 40.60 25.02 -15.57 4.53 -38.36 2.24
Sample: Children under 2 years of age

52
Table 3.24: Stunting and wasting by food security in 2012
Source: Author’s own.
What is immediately obvious is that the anthropometric rates do not vary much by food security category. For the most food secure, stunting is 20.5 per cent and for the most food insecure group it is 27.4 per cent. There is more of a response for severe stunting (5.8 per cent to 11.9 per cent, a doubling), but the differences for wasting (15 per cent to 18 per cent) and severe wasting (4 per cent to 6 per cent) are small. These results reinforce the perception that the drivers of anthropometry in Maharashtra are only due in small part to household food security.
3.5.5 Summary
The most obvious feature of the data is that the biggest declines in stunting are associated with the highest initial levels of stunting – this is typically the case for absolute changes as well as for relative changes. For example, declines in stunting rates are largest for:
• young mothers
• mothers with the lowest age at first birth
• underweight mothers
• those who are illiterate
• the least educated
• those giving birth at home
• those with no improved water source
• those in the lowest wealth quintile
No matter how we present the data, it is clear that stunting has decreased most strongly for the most deprived.
Food secure Medium food insecure Food insecure Total
Stunting No. % No. % No. % No. %
Non stunted 1,099 79.5 472 72.5 432 72.6 2,003 76.2
Stunted 283 20.5 179 27.5 163 27.4 625 23.8
Total 1,382 100 650 100 596 100 2,628 100
Severe stunting
Non severe stunted 1,302 94.2 596 91.6 525 88.1 2,423 92.2
Severe stunted 80 5.8 54 8.4 71 11.9 205 7.8
Total 1,382 100 650 100 596 100 2,628 100
Wasting
Non wasted 1,169 85 553 85 489 82 2,211 84
Wasted 213 15 98 15 106 18 417 16
Total 1,382 100 650 100 596 100 2,628 100
Severe wasting
Non severe wasted 1,332 96 626 96 558 94 2,516 96
Wasted 49 4 25 4 37 6 112 4
Total 1,382 100 650 100 596 100 2,628 100
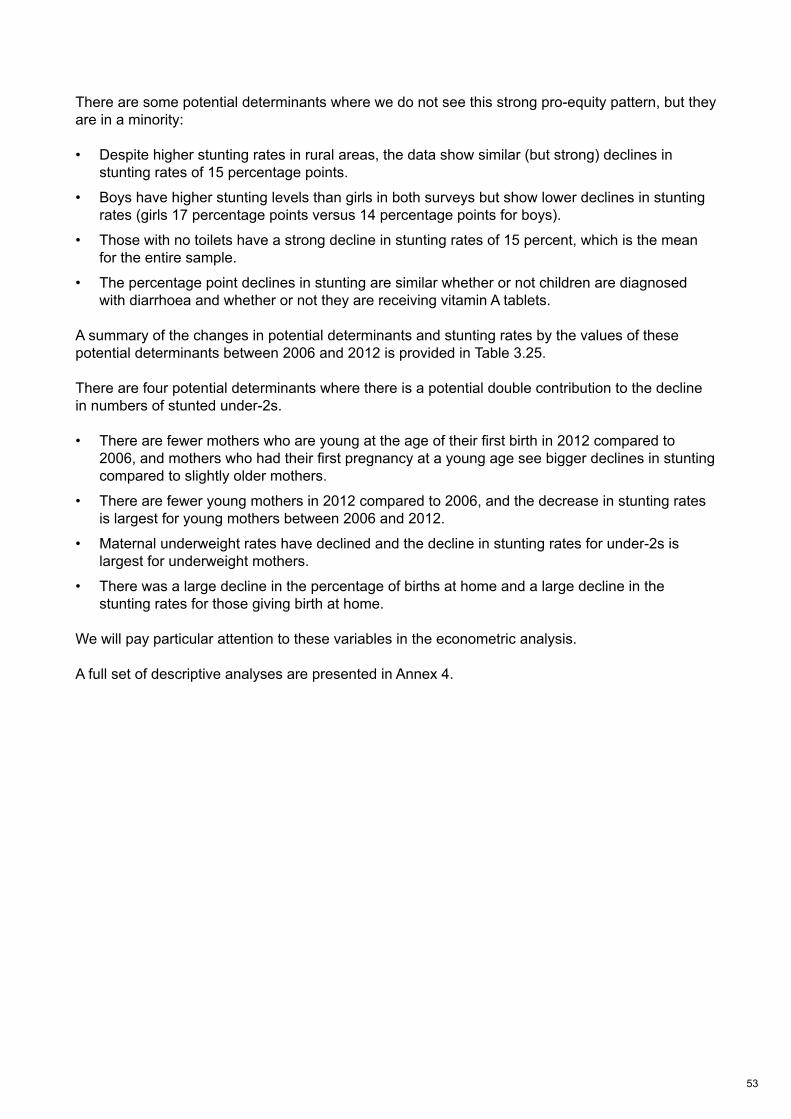
53
There are some potential determinants where we do not see this strong pro-equity pattern, but they are in a minority:
• Despite higher stunting rates in rural areas, the data show similar (but strong) declines in stunting rates of 15 percentage points.
• Boys have higher stunting levels than girls in both surveys but show lower declines in stunting rates (girls 17 percentage points versus 14 percentage points for boys).
• Those with no toilets have a strong decline in stunting rates of 15 percent, which is the mean for the entire sample.
• The percentage point declines in stunting are similar whether or not children are diagnosed with diarrhoea and whether or not they are receiving vitamin A tablets.
A summary of the changes in potential determinants and stunting rates by the values of these potential determinants between 2006 and 2012 is provided in Table 3.25.
There are four potential determinants where there is a potential double contribution to the decline in numbers of stunted under-2s.
• There are fewer mothers who are young at the age of their first birth in 2012 compared to 2006, and mothers who had their first pregnancy at a young age see bigger declines in stunting compared to slightly older mothers.
• There are fewer young mothers in 2012 compared to 2006, and the decrease in stunting rates is largest for young mothers between 2006 and 2012.
• Maternal underweight rates have declined and the decline in stunting rates for under-2s is largest for underweight mothers.
• There was a large decline in the percentage of births at home and a large decline in the stunting rates for those giving birth at home.
We will pay particular attention to these variables in the econometric analysis.
A full set of descriptive analyses are presented in Annex 4.
Food secure Medium food insecure Food insecure Total
Stunting No. % No. % No. % No. %
Non stunted 1,099 79.5 472 72.5 432 72.6 2,003 76.2
Stunted 283 20.5 179 27.5 163 27.4 625 23.8
Total 1,382 100 650 100 596 100 2,628 100
Severe stunting
Non severe stunted 1,302 94.2 596 91.6 525 88.1 2,423 92.2
Severe stunted 80 5.8 54 8.4 71 11.9 205 7.8
Total 1,382 100 650 100 596 100 2,628 100
Wasting
Non wasted 1,169 85 553 85 489 82 2,211 84
Wasted 213 15 98 15 106 18 417 16
Total 1,382 100 650 100 596 100 2,628 100
Severe wasting
Non severe wasted 1,332 96 626 96 558 94 2,516 96
Wasted 49 4 25 4 37 6 112 4
Total 1,382 100 650 100 596 100 2,628 100
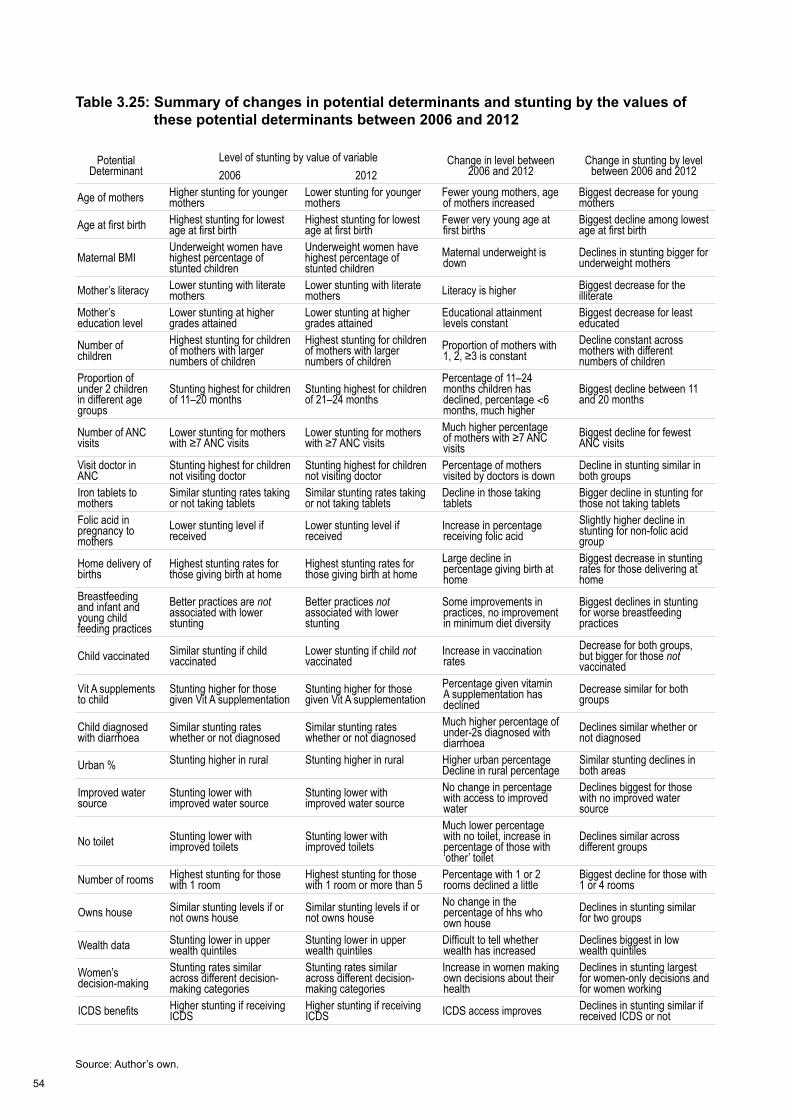
54
Table 3.25: Summary of changes in potential determinants and stunting by the values of these potential determinants between 2006 and 2012
Source: Author’s own.
Potential Determinant
Level of stunting by value of variable Change in level between 2006 and 2012
Change in stunting by level between 2006 and 20122006 2012
Age of mothers Higher stunting for younger mothers
Lower stunting for younger mothers
Fewer young mothers, age of mothers increased
Biggest decrease for young mothers
Age at first birth Highest stunting for lowest age at first birth
Highest stunting for lowest age at first birth
Fewer very young age at first births
Biggest decline among lowest age at first birth
Maternal BMIUnderweight women have highest percentage of stunted children
Underweight women have highest percentage of stunted children
Maternal underweight is down
Declines in stunting bigger for underweight mothers
Mother’s literacy Lower stunting with literate mothers
Lower stunting with literate mothers Literacy is higher Biggest decrease for the
illiterateMother’s education level
Lower stunting at higher grades attained
Lower stunting at higher grades attained
Educational attainment levels constant
Biggest decrease for least educated
Number of children
Highest stunting for children of mothers with larger numbers of children
Highest stunting for children of mothers with larger numbers of children
Proportion of mothers with 1, 2, ≥3 is constant
Decline constant across mothers with different numbers of children
Proportion of under 2 children in different age groups
Stunting highest for children of 11–20 months
Stunting highest for children of 21–24 months
Percentage of 11–24 months children has declined, percentage <6 months, much higher
Biggest decline between 11 and 20 months
Number of ANC visits
Lower stunting for mothers with ≥7 ANC visits
Lower stunting for mothers with ≥7 ANC visits
Much higher percentage of mothers with ≥7 ANC visits
Biggest decline for fewest ANC visits
Visit doctor in ANC
Stunting highest for children not visiting doctor
Stunting highest for children not visiting doctor
Percentage of mothers visited by doctors is down
Decline in stunting similar in both groups
Iron tablets to mothers
Similar stunting rates taking or not taking tablets
Similar stunting rates taking or not taking tablets
Decline in those taking tablets
Bigger decline in stunting for those not taking tablets
Folic acid in pregnancy to mothers
Lower stunting level if received
Lower stunting level if received
Increase in percentage receiving folic acid
Slightly higher decline in stunting for non-folic acid group
Home delivery of births
Highest stunting rates for those giving birth at home
Highest stunting rates for those giving birth at home
Large decline in percentage giving birth at home
Biggest decrease in stunting rates for those delivering at home
Breastfeeding and infant and young child feeding practices
Better practices are not associated with lower stunting
Better practices not associated with lower stunting
Some improvements in practices, no improvement in minimum diet diversity
Biggest declines in stunting for worse breastfeeding practices
Child vaccinated Similar stunting if child vaccinated
Lower stunting if child not vaccinated
Increase in vaccination rates
Decrease for both groups, but bigger for those not vaccinated
Vit A supplements to child
Stunting higher for those given Vit A supplementation
Stunting higher for those given Vit A supplementation
Percentage given vitamin A supplementation has declined
Decrease similar for both groups
Child diagnosed with diarrhoea
Similar stunting rates whether or not diagnosed
Similar stunting rates whether or not diagnosed
Much higher percentage of under-2s diagnosed with diarrhoea
Declines similar whether or not diagnosed
Urban % Stunting higher in rural Stunting higher in rural Higher urban percentage Decline in rural percentage
Similar stunting declines in both areas
Improved water source
Stunting lower with improved water source
Stunting lower with improved water source
No change in percentage with access to improved water
Declines biggest for those with no improved water source
No toilet Stunting lower with improved toilets
Stunting lower with improved toilets
Much lower percentage with no toilet, increase in percentage of those with ‘other’ toilet
Declines similar across different groups
Number of rooms Highest stunting for those with 1 room
Highest stunting for those with 1 room or more than 5
Percentage with 1 or 2 rooms declined a little
Biggest decline for those with 1 or 4 rooms
Owns house Similar stunting levels if or not owns house
Similar stunting levels if or not owns house
No change in the percentage of hhs who own house
Declines in stunting similar for two groups
Wealth data Stunting lower in upper wealth quintiles
Stunting lower in upper wealth quintiles
Difficult to tell whether wealth has increased
Declines biggest in low wealth quintiles
Women’s decision-making
Stunting rates similar across different decision-making categories
Stunting rates similar across different decision-making categories
Increase in women making own decisions about their health
Declines in stunting largest for women-only decisions and for women working
ICDS benefits Higher stunting if receiving ICDS
Higher stunting if receiving ICDS ICDS access improves Declines in stunting similar if
received ICDS or not
55
3.6 Econometric analysis
The descriptive tables are merely suggestive because they cannot control for confounding factors. So it is important to complement the descriptive analysis with an econometric analysis where we can identify the association of an explanatory variable with stunting, controlling for the level of a number of other potential correlates. In this section we conduct an econometric analysis to further explore the correlates of stunting in under-2s.
Our econometric strategy is to specify a regression of the form:
Stunting = f (child characteristics, mother characteristics, childcare, household characteristics, ICDS use)
We use logit regression to estimate this model separately for 2006 and for 2012. We want to determine which factors are most strongly correlated with height for age Z scores (HAZ) in each year. We also test whether the estimated coefficients on the factors are significantly different across the two years for the underlying variable, HAZ, and these results are presented in Annex 5.8
The key findings are:
1. The equivalence of the two sets of estimated coefficients cannot be rejected in the logit model. In other words, even though some of the estimated slope coefficients are different between the two years, as a set we cannot reject the hypothesis that they are equal (p = 0.5151).
2. Only two estimated coefficients on the determinants of HAZ are significantly different between 2006 and 2012 (Annex 5). Age at first birth is much more negatively associated with HAZ in 2006 compared to 2012 (5 per cent level). Similarly, being in a low wealth quintile household had a strong negative association with HAZ in 2006 and less so in 2012 (although this difference is only significant at the 10 per cent level).9
Table 3.26 presents the model for stunting, severe stunting, wasting and severe wasting using the 2006 and 2012 data sets. There is an additional panel for the 2012 estimates where we include regional controls (which we cannot do in the 2006 regressions because we do not know which clusters are in which regions).
8 We tried to construct an indicator of food security to compare across the two years, but there are no questions on food security in the 2006 survey. 9 These differences in slope estimates when HAZ is the dependent variable mean we can reject the null of common effects across years at 5 per cent (p = 0.0314).
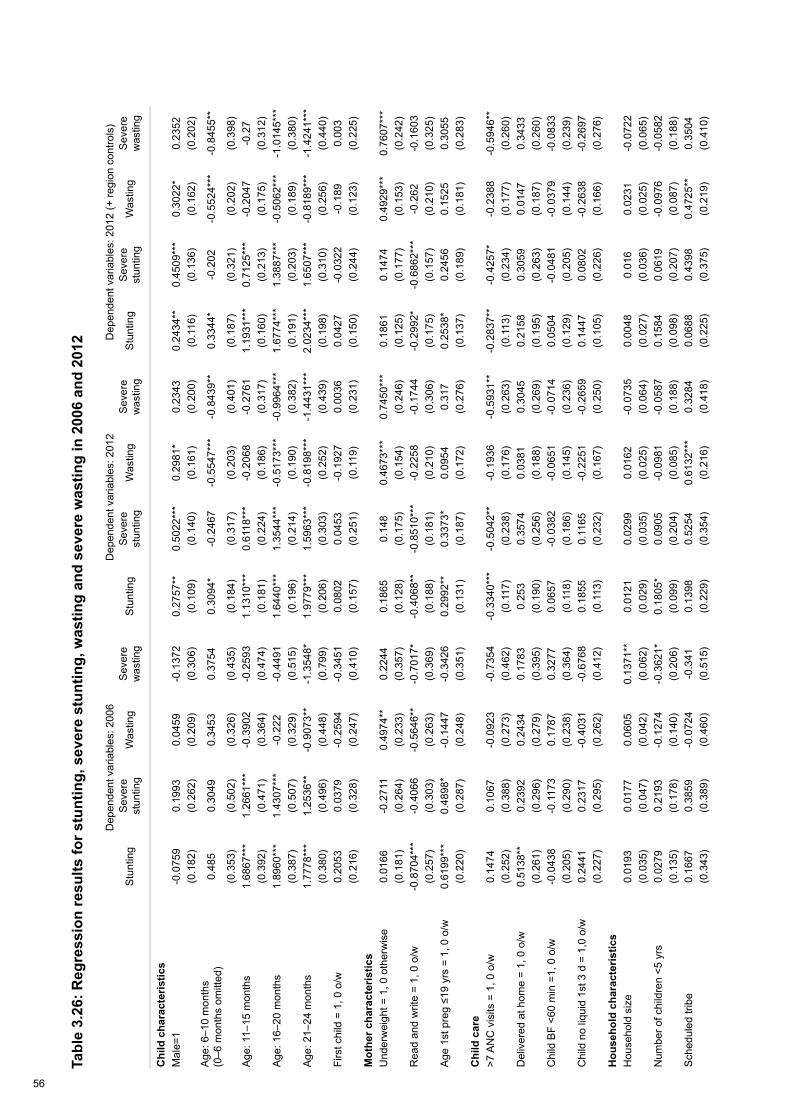
56
Tabl
e 3.
26: R
egre
ssio
n re
sults
for s
tunt
ing,
sev
ere
stun
ting,
was
ting
and
seve
re w
astin
g in
200
6 an
d 20
12
Dep
ende
nt v
aria
bles
: 200
6D
epen
dent
var
iabl
es: 2
012
Dep
ende
nt v
aria
bles
: 201
2 (+
regi
on c
ontro
ls)
Stu
ntin
g S
ever
e st
untin
gW
astin
gS
ever
e w
astin
gS
tunt
ing
Sev
ere
stun
ting
Was
ting
Sev
ere
was
ting
Stu
ntin
gS
ever
e st
untin
gW
astin
gS
ever
e w
astin
g
Chi
ld c
hara
cter
istic
sM
ale=
1-0
.075
90.
1993
0.04
59-0
.137
20.
2757
**0.
5022
***
0.29
81*
0.23
430.
2434
**0.
4509
***
0.30
22*
0.23
52(0
.182
)(0
.262
)(0
.209
)(0
.306
)(0
.109
)(0
.140
)(0
.161
)(0
.200
)(0
.116
)(0
.136
)(0
.162
)(0
.202
)A
ge: 6
–10
mon
ths
(0
–6 m
onth
s om
itted
)0.
485
0.30
490.
3453
0.37
540.
3094
*-0
.246
7-0
.554
7***
-0.8
439*
*0.
3344
*-0
.202
-0.5
524*
**-0
.845
5**
(0.3
53)
(0.5
02)
(0.3
26)
(0.4
35)
(0.1
84)
(0.3
17)
(0.2
03)
(0.4
01)
(0.1
87)
(0.3
21)
(0.2
02)
(0.3
98)
Age
: 11–
15 m
onth
s1.
6867
***
1.26
61**
*-0
.390
2-0
.259
31.
1310
***
0.61
18**
*-0
.206
8-0
.276
11.
1931
***
0.71
25**
*-0
.204
7-0
.27
(0.3
92)
(0.4
71)
(0.3
64)
(0.4
74)
(0.1
81)
(0.2
24)
(0.1
86)
(0.3
17)
(0.1
60)
(0.2
13)
(0.1
75)
(0.3
12)
Age
: 16–
20 m
onth
s1.
8960
***
1.43
07**
*-0
.222
-0.4
491
1.64
40**
*1.
3544
***
-0.5
173*
**-0
.996
4***
1.67
74**
*1.
3887
***
-0.5
062*
**-1
.014
5***
(0.3
87)
(0.5
07)
(0.3
29)
(0.5
15)
(0.1
96)
(0.2
14)
(0.1
90)
(0.3
82)
(0.1
91)
(0.2
03)
(0.1
89)
(0.3
80)
Age
: 21–
24 m
onth
s1.
7778
***
1.25
36**
-0.9
073*
*-1
.354
8*1.
9779
***
1.59
63**
*-0
.819
8***
-1.4
431*
**2.
0234
***
1.65
07**
*-0
.818
9***
-1.4
241*
**(0
.380
)(0
.496
)(0
.448
)(0
.799
)(0
.206
)(0
.303
)(0
.252
)(0
.439
)(0
.198
)(0
.310
)(0
.256
)(0
.440
)Fi
rst c
hild
= 1
, 0 o
/w0.
2053
0.03
79-0
.259
4-0
.345
10.
0802
0.04
53-0
.192
70.
0036
0.04
27-0
.032
2-0
.189
0.00
3(0
.216
)(0
.328
)(0
.247
)(0
.410
)(0
.157
)(0
.251
)(0
.119
)(0
.231
)(0
.150
)(0
.244
)(0
.123
)(0
.225
)M
othe
r cha
ract
eris
tics
Und
erw
eigh
t = 1
, 0 o
ther
wis
e0.
0166
-0.2
711
0.49
74**
0.22
440.
1865
0.14
80.
4673
***
0.74
50**
*0.
1861
0.14
740.
4929
***
0.76
07**
*(0
.181
)(0
.264
)(0
.233
)(0
.357
)(0
.128
)(0
.175
)(0
.154
)(0
.246
)(0
.125
)(0
.177
)(0
.153
)(0
.242
)R
ead
and
writ
e =
1, 0
o/w
-0.8
704*
**-0
.406
6-0
.564
6**
-0.7
017*
-0.4
068*
*-0
.851
0***
-0.2
258
-0.1
744
-0.2
992*
-0.6
862*
**-0
.262
-0.1
603
(0.2
57)
(0.3
03)
(0.2
63)
(0.3
69)
(0.1
88)
(0.1
81)
(0.2
10)
(0.3
06)
(0.1
75)
(0.1
57)
(0.2
10)
(0.3
25)
Age
1st
pre
g ≤1
9 yr
s =
1, 0
o/w
0.61
99**
*0.
4898
*-0
.144
7-0
.342
60.
2992
**0.
3373
*0.
0954
0.31
70.
2538
*0.
2456
0.15
250.
3055
(0.2
20)
(0.2
87)
(0.2
48)
(0.3
51)
(0.1
31)
(0.1
87)
(0.1
72)
(0.2
76)
(0.1
37)
(0.1
89)
(0.1
81)
(0.2
83)
Chi
ld c
are
>7 A
NC
vis
its =
1, 0
o/w
0.14
740.
1067
-0.0
923
-0.7
354
-0.3
340*
**-0
.504
2**
-0.1
936
-0.5
931*
*-0
.283
7**
-0.4
257*
-0.2
388
-0.5
946*
*(0
.252
)(0
.388
)(0
.273
)(0
.462
)(0
.117
)(0
.238
)(0
.176
)(0
.263
)(0
.113
)(0
.234
)(0
.177
)(0
.260
)D
eliv
ered
at h
ome
= 1,
0 o
/w0.
5138
**0.
2392
0.24
340.
1783
0.25
30.
3574
0.03
810.
3045
0.21
580.
3059
0.01
470.
3433
(0.2
61)
(0.2
96)
(0.2
79)
(0.3
95)
(0.1
90)
(0.2
56)
(0.1
88)
(0.2
69)
(0.1
95)
(0.2
63)
(0.1
87)
(0.2
60)
Chi
ld B
F <6
0 m
in =
1, 0
o/w
-0.0
438
-0.1
173
0.17
870.
3277
0.06
57-0
.038
2-0
.065
1-0
.071
40.
0504
-0.0
481
-0.0
379
-0.0
833
(0.2
05)
(0.2
90)
(0.2
38)
(0.3
64)
(0.1
18)
(0.1
86)
(0.1
45)
(0.2
36)
(0.1
29)
(0.2
05)
(0.1
44)
(0.2
39)
Chi
ld n
o liq
uid
1st 3
d =
1,0
o/w
0.24
410.
2317
-0.4
031
-0.6
768
0.18
550.
1165
-0.2
251
-0.2
659
0.14
470.
0802
-0.2
638
-0.2
697
(0.2
27)
(0.2
95)
(0.2
62)
(0.4
12)
(0.1
13)
(0.2
32)
(0.1
67)
(0.2
50)
(0.1
05)
(0.2
26)
(0.1
66)
(0.2
76)
Hou
seho
ld c
hara
cter
istic
sH
ouse
hold
siz
e0.
0193
0.01
770.
0605
0.13
71**
0.01
210.
0299
0.01
62-0
.073
50.
0048
0.01
60.
0231
-0.0
722
(0.0
35)
(0.0
47)
(0.0
42)
(0.0
62)
(0.0
29)
(0.0
35)
(0.0
25)
(0.0
64)
(0.0
27)
(0.0
36)
(0.0
25)
(0.0
65)
Num
ber o
f chi
ldre
n <5
yrs
0.02
790.
2193
-0.1
274
-0.3
621*
0.18
05*
0.09
05-0
.098
1-0
.058
70.
1584
0.06
19-0
.097
6-0
.058
2(0
.135
)(0
.178
)(0
.140
)(0
.206
)(0
.099
)(0
.204
)(0
.085
)(0
.188
)(0
.098
)(0
.207
)(0
.087
)(0
.188
)S
ched
uled
trib
e0.
1667
0.38
59-0
.072
4-0
.341
0.13
980.
5254
0.61
32**
*0.
3284
0.06
880.
4398
0.47
25**
0.35
04(0
.343
)(0
.389
)(0
.460
)(0
.515
)(0
.229
)(0
.354
)(0
.216
)(0
.418
)(0
.225
)(0
.375
)(0
.219
)(0
.410
)
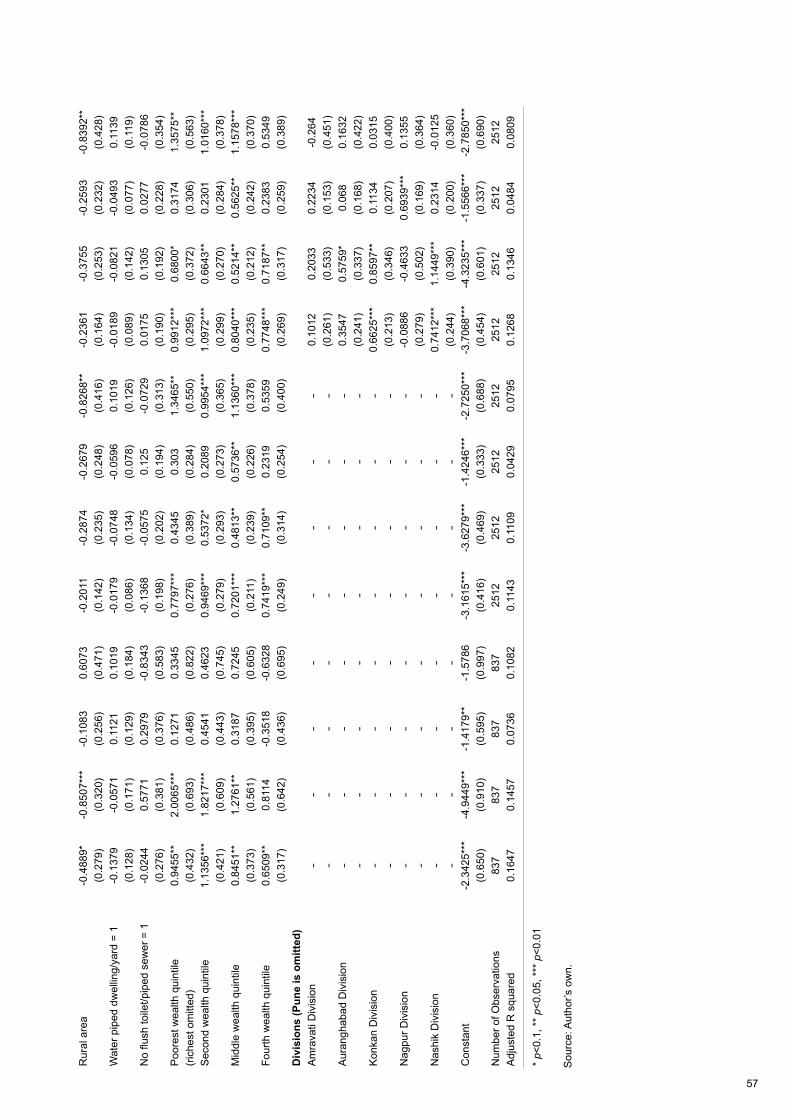
57
Rur
al a
rea
-0.4
889*
-0.8
507*
**-0
.108
30.
6073
-0.2
011
-0.2
874
-0.2
679
-0.8
268*
*-0
.236
1-0
.375
5-0
.259
3-0
.839
2**
(0.2
79)
(0.3
20)
(0.2
56)
(0.4
71)
(0.1
42)
(0.2
35)
(0.2
48)
(0.4
16)
(0.1
64)
(0.2
53)
(0.2
32)
(0.4
28)
Wat
er p
iped
dw
ellin
g/ya
rd =
1-0
.137
9-0
.057
10.
1121
0.10
19-0
.017
9-0
.074
8-0
.059
60.
1019
-0.0
189
-0.0
821
-0.0
493
0.11
39(0
.128
)(0
.171
)(0
.129
)(0
.184
)(0
.086
)(0
.134
)(0
.078
)(0
.126
)(0
.089
)(0
.142
)(0
.077
)(0
.119
)N
o flu
sh to
ilet/p
iped
sew
er =
1-0
.024
40.
5771
0.29
79-0
.834
3-0
.136
8-0
.057
50.
125
-0.0
729
0.01
750.
1305
0.02
77-0
.078
6(0
.276
)(0
.381
)(0
.376
)(0
.583
)(0
.198
)(0
.202
)(0
.194
)(0
.313
)(0
.190
)(0
.192
)(0
.228
)(0
.354
)P
oore
st w
ealth
qui
ntile
0.
9455
**2.
0065
***
0.12
710.
3345
0.77
97**
*0.
4345
0.30
31.
3465
**0.
9912
***
0.68
00*
0.31
741.
3575
**(r
iche
st o
mitt
ed)
(0.4
32)
(0.6
93)
(0.4
86)
(0.8
22)
(0.2
76)
(0.3
89)
(0.2
84)
(0.5
50)
(0.2
95)
(0.3
72)
(0.3
06)
(0.5
63)
Sec
ond
wea
lth q
uint
ile1.
1356
***
1.82
17**
*0.
4541
0.46
230.
9469
***
0.53
72*
0.20
890.
9954
***
1.09
72**
*0.
6643
**0.
2301
1.01
60**
*(0
.421
)(0
.609
)(0
.443
)(0
.745
)(0
.279
)(0
.293
)(0
.273
)(0
.365
)(0
.299
)(0
.270
)(0
.284
)(0
.378
)M
iddl
e w
ealth
qui
ntile
0.84
51**
1.27
61**
0.31
870.
7245
0.72
01**
*0.
4813
**0.
5736
**1.
1360
***
0.80
40**
*0.
5214
**0.
5625
**1.
1578
***
(0.3
73)
(0.5
61)
(0.3
95)
(0.6
05)
(0.2
11)
(0.2
39)
(0.2
26)
(0.3
78)
(0.2
35)
(0.2
12)
(0.2
42)
(0.3
70)
Four
th w
ealth
qui
ntile
0.65
09**
0.81
14-0
.351
8-0
.632
80.
7419
***
0.71
09**
0.23
190.
5359
0.77
48**
*0.
7187
**0.
2383
0.53
49(0
.317
)(0
.642
)(0
.436
)(0
.695
)(0
.249
)(0
.314
)(0
.254
)(0
.400
)(0
.269
)(0
.317
)(0
.259
)(0
.389
)D
ivis
ions
(Pun
e is
om
itted
)A
mra
vati
Div
isio
n-
--
--
--
-0.
1012
0.20
330.
2234
-0.2
64-
--
--
--
-(0
.261
)(0
.533
)(0
.153
)(0
.451
)A
uran
ghab
ad D
ivis
ion
--
--
--
--
0.35
470.
5759
*0.
068
0.16
32-
--
--
--
-(0
.241
)(0
.337
)(0
.168
)(0
.422
)K
onka
n D
ivis
ion
--
--
--
--
0.66
25**
*0.
8597
**0.
1134
0.03
15-
--
--
--
-(0
.213
)(0
.346
)(0
.207
)(0
.400
)N
agpu
r Div
isio
n-
--
--
--
--0
.088
6-0
.463
30.
6939
***
0.13
55-
--
--
--
-(0
.279
)(0
.502
)(0
.169
)(0
.364
)N
ashi
k D
ivis
ion
--
--
--
--
0.74
12**
*1.
1449
***
0.23
14-0
.012
5-
--
--
--
-(0
.244
)(0
.390
)(0
.200
)(0
.360
)C
onst
ant
-2.3
425*
**-4
.944
9***
-1.4
179*
*-1
.578
6-3
.161
5***
-3.6
279*
**-1
.424
6***
-2.7
250*
**-3
.706
8***
-4.3
235*
**-1
.556
6***
-2.7
850*
**
(0.6
50)
(0.9
10)
(0.5
95)
(0.9
97)
(0.4
16)
(0.4
69)
(0.3
33)
(0.6
88)
(0.4
54)
(0.6
01)
(0.3
37)
(0.6
90)
Num
ber o
f Obs
erva
tions
837
837
837
837
2512
2512
2512
2512
2512
2512
2512
2512
Adj
uste
d R
squ
ared
0.16
470.
1457
0.07
360.
1082
0.11
430.
1109
0.04
290.
0795
0.12
680.
1346
0.04
840.
0809
* p<
0.1,
**
p<0.
05, *
** p
<0.0
1
Sou
rce:
Aut
hor’s
ow
n.
58
The key findings from Table 3.26 are summarised below.
Child characteristics
1. Boys are more likely to be stunted, severely stunted and wasted (although for wasting the effect is only significant at 10 per cent) than girls in 2012, but not in 2006.
2. Age shows the familiar pattern for stunting and severe stunting: an increase in the rate, as age increases, compared to the 0–6 month age group. The increases are similar in each survey year. For wasting the pattern is reversed: as infants get older – especially in the 16–24-month-old period – they become less wasted than the 0–6-month-old age group.
3. Being a first born child is not associated with any of the anthropometric indicators in either year.
Mother’s characteristics
4. If the mother is underweight this has no significant association with stunting or severe stunting in either year. However, wasting is associated with maternal underweight in both years and with severe wasting in 2012.
5. Mother’s literacy is significantly associated with decreases in stunting in both survey years, although smaller in 2012 and with severe stunting in 2012. For wasting the association is only associated with declines in wasting in 2006, but there is no association in 2012.
6. Mother’s age at first birth of 19 or younger is significantly associated with large increases in stunting rates in 2006 and 2012 (although smaller in 2012), there is weak significance with severe stunting in both years, but there is no association with wasting.
Childcare
7. More than seven antenatal clinic visits is significantly associated with lower stunting, and severe stunting rates in 2012 and with severe wasting in 2012, but there is no significant association for any of the four dependent variables in 2006.
8. Delivery of birth at home is positively and significantly associated with stunting in 2006 but not in any of the other indicators for either of the survey years.
9. Children breastfed less than 60 minutes after birth (a positive outcome for nutrition status) shows no association with stunting in either year. Not being given other liquids in the first three days (also recommended for nutrition status) has a 10 per cent positive association with stunting in 2012. This latter result is certainly counterintuitive and needs further exploration (see Table 3.27).
Household characteristics
10. Household size has no association with stunting or severe stunting in either year, although it is associated with increased severe wasting in 2006, but no other wasting variable in any year. The number of children under 5 is not associated with any dependent variable except severe wasting in 2006 which declines with increases in the number of children under 5 in 2006.
11. Once a range of other factors are controlled for, being from a tribal (indigenous) group is not associated with higher levels of stunting in either year but it is associated with an increase in wasting (but not severe wasting) in both years.
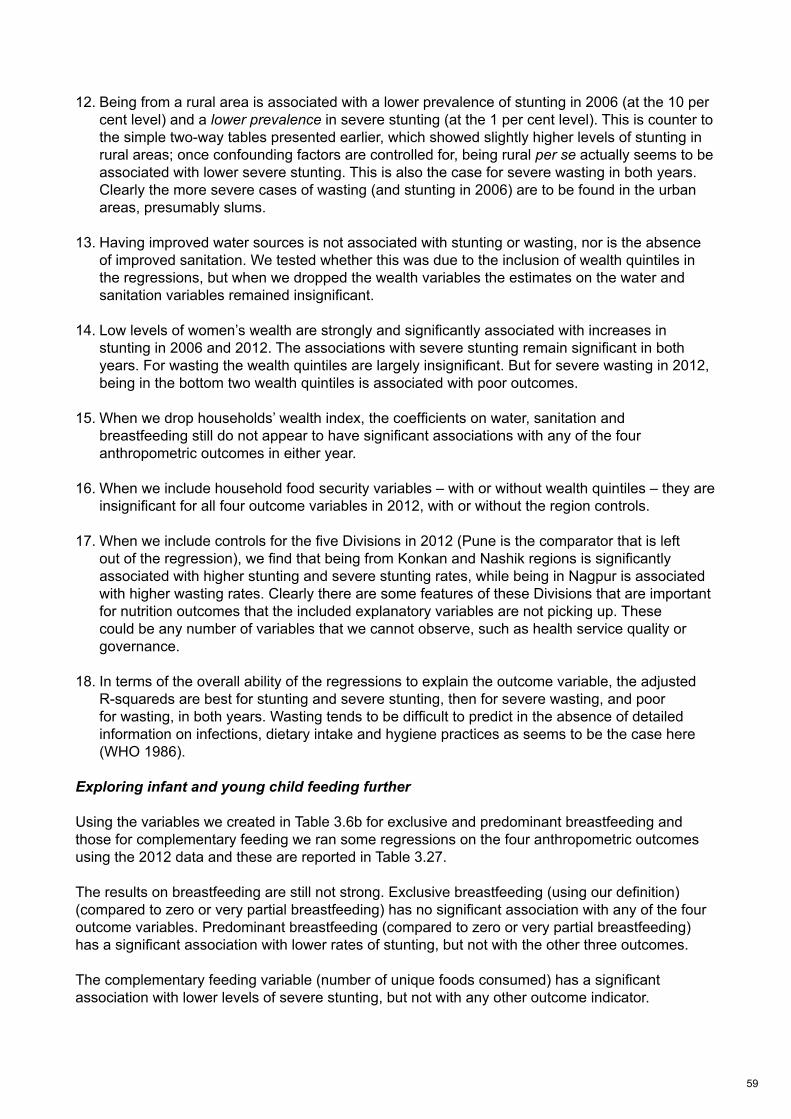
59
12. Being from a rural area is associated with a lower prevalence of stunting in 2006 (at the 10 per cent level) and a lower prevalence in severe stunting (at the 1 per cent level). This is counter to the simple two-way tables presented earlier, which showed slightly higher levels of stunting in rural areas; once confounding factors are controlled for, being rural per se actually seems to be associated with lower severe stunting. This is also the case for severe wasting in both years. Clearly the more severe cases of wasting (and stunting in 2006) are to be found in the urban areas, presumably slums.
13. Having improved water sources is not associated with stunting or wasting, nor is the absence of improved sanitation. We tested whether this was due to the inclusion of wealth quintiles in the regressions, but when we dropped the wealth variables the estimates on the water and sanitation variables remained insignificant.
14. Low levels of women’s wealth are strongly and significantly associated with increases in stunting in 2006 and 2012. The associations with severe stunting remain significant in both years. For wasting the wealth quintiles are largely insignificant. But for severe wasting in 2012, being in the bottom two wealth quintiles is associated with poor outcomes.
15. When we drop households’ wealth index, the coefficients on water, sanitation and breastfeeding still do not appear to have significant associations with any of the four anthropometric outcomes in either year.
16. When we include household food security variables – with or without wealth quintiles – they are insignificant for all four outcome variables in 2012, with or without the region controls.
17. When we include controls for the five Divisions in 2012 (Pune is the comparator that is left out of the regression), we find that being from Konkan and Nashik regions is significantly associated with higher stunting and severe stunting rates, while being in Nagpur is associated with higher wasting rates. Clearly there are some features of these Divisions that are important for nutrition outcomes that the included explanatory variables are not picking up. These could be any number of variables that we cannot observe, such as health service quality or governance.
18. In terms of the overall ability of the regressions to explain the outcome variable, the adjusted R-squareds are best for stunting and severe stunting, then for severe wasting, and poor for wasting, in both years. Wasting tends to be difficult to predict in the absence of detailed information on infections, dietary intake and hygiene practices as seems to be the case here (WHO 1986).
Exploring infant and young child feeding further
Using the variables we created in Table 3.6b for exclusive and predominant breastfeeding and those for complementary feeding we ran some regressions on the four anthropometric outcomes using the 2012 data and these are reported in Table 3.27.
The results on breastfeeding are still not strong. Exclusive breastfeeding (using our definition) (compared to zero or very partial breastfeeding) has no significant association with any of the four outcome variables. Predominant breastfeeding (compared to zero or very partial breastfeeding) has a significant association with lower rates of stunting, but not with the other three outcomes.
The complementary feeding variable (number of unique foods consumed) has a significant association with lower levels of severe stunting, but not with any other outcome indicator.
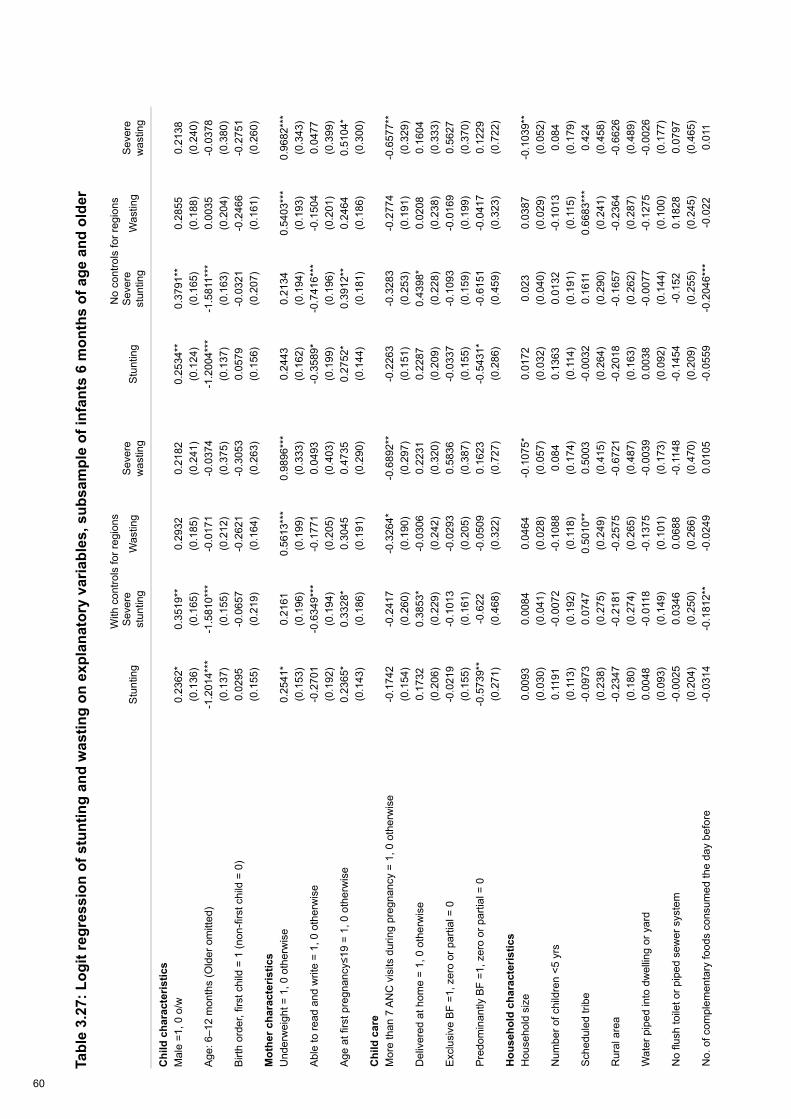
60
Tabl
e 3.
27: L
ogit
regr
essi
on o
f stu
ntin
g an
d w
astin
g on
exp
lana
tory
var
iabl
es, s
ubsa
mpl
e of
infa
nts
6 m
onth
s of
age
and
old
er
With
con
trols
for r
egio
nsN
o co
ntro
ls fo
r reg
ions
Stu
ntin
gS
ever
e st
untin
gW
astin
gS
ever
e w
astin
gS
tunt
ing
Sev
ere
stun
ting
Was
ting
Sev
ere
was
ting
Chi
ld c
hara
cter
istic
sM
ale
=1, 0
o/w
0.23
62*
0.35
19**
0.29
320.
2182
0.25
34**
0.37
91**
0.28
550.
2138
(0.1
36)
(0.1
65)
(0.1
85)
(0.2
41)
(0.1
24)
(0.1
65)
(0.1
88)
(0.2
40)
Age
: 6–1
2 m
onth
s (O
lder
om
itted
)-1
.201
4***
-1.5
810*
**-0
.017
1-0
.037
4-1
.200
4***
-1.5
811*
**0.
0035
-0.0
378
(0.1
37)
(0.1
55)
(0.2
12)
(0.3
75)
(0.1
37)
(0.1
63)
(0.2
04)
(0.3
80)
Birt
h or
der,
first
chi
ld =
1 (n
on-fi
rst c
hild
= 0
)0.
0295
-0.0
657
-0.2
621
-0.3
053
0.05
79-0
.032
1-0
.246
6-0
.275
1(0
.155
)(0
.219
)(0
.164
)(0
.263
)(0
.156
)(0
.207
)(0
.161
)(0
.260
)M
othe
r cha
ract
eris
tics
Und
erw
eigh
t = 1
, 0 o
ther
wis
e0.
2541
*0.
2161
0.56
13**
*0.
9896
***
0.24
430.
2134
0.54
03**
*0.
9682
***
(0.1
53)
(0.1
96)
(0.1
99)
(0.3
33)
(0.1
62)
(0.1
94)
(0.1
93)
(0.3
43)
Abl
e to
read
and
writ
e =
1, 0
oth
erw
ise
-0.2
701
-0.6
349*
**-0
.177
10.
0493
-0.3
589*
-0.7
416*
**-0
.150
40.
0477
(0.1
92)
(0.1
94)
(0.2
05)
(0.4
03)
(0.1
99)
(0.1
96)
(0.2
01)
(0.3
99)
Age
at fi
rst p
regn
ancy
≤19
= 1,
0 o
ther
wis
e0.
2365
*0.
3328
*0.
3045
0.47
350.
2752
*0.
3912
**0.
2464
0.51
04*
(0.1
43)
(0.1
86)
(0.1
91)
(0.2
90)
(0.1
44)
(0.1
81)
(0.1
86)
(0.3
00)
Chi
ld c
are
Mor
e th
an 7
AN
C v
isits
dur
ing
preg
nanc
y =
1, 0
oth
erw
ise
-0.1
742
-0.2
417
-0.3
264*
-0.6
892*
*-0
.226
3-0
.328
3-0
.277
4-0
.657
7**
(0.1
54)
(0.2
60)
(0.1
90)
(0.2
97)
(0.1
51)
(0.2
53)
(0.1
91)
(0.3
29)
Del
iver
ed a
t hom
e =
1, 0
oth
erw
ise
0.17
320.
3853
*-0
.030
60.
2231
0.22
870.
4398
*0.
0208
0.16
04(0
.206
)(0
.229
)(0
.242
)(0
.320
)(0
.209
)(0
.228
)(0
.238
)(0
.333
)E
xclu
sive
BF
=1, z
ero
or p
artia
l = 0
-0
.021
9-0
.101
3-0
.029
30.
5836
-0.0
337
-0.1
093
-0.0
169
0.56
27(0
.155
)(0
.161
)(0
.205
)(0
.387
)(0
.155
)(0
.159
)(0
.199
)(0
.370
)P
redo
min
antly
BF
=1, z
ero
or p
artia
l = 0
-0.5
739*
*-0
.622
-0.0
509
0.16
23-0
.543
1*-0
.615
1-0
.041
70.
1229
(0.2
71)
(0.4
68)
(0.3
22)
(0.7
27)
(0.2
86)
(0.4
59)
(0.3
23)
(0.7
22)
Hou
seho
ld c
hara
cter
istic
sH
ouse
hold
siz
e0.
0093
0.00
840.
0464
-0.1
075*
0.01
720.
023
0.03
87-0
.103
9**
(0.0
30)
(0.0
41)
(0.0
28)
(0.0
57)
(0.0
32)
(0.0
40)
(0.0
29)
(0.0
52)
Num
ber o
f chi
ldre
n <5
yrs
0.11
91-0
.007
2-0
.108
80.
084
0.13
630.
0132
-0.1
013
0.08
4(0
.113
)(0
.192
)(0
.118
)(0
.174
)(0
.114
)(0
.191
)(0
.115
)(0
.179
)S
ched
uled
trib
e-0
.097
30.
0747
0.50
10**
0.50
03-0
.003
20.
1611
0.66
83**
*0.
424
(0.2
38)
(0.2
75)
(0.2
49)
(0.4
15)
(0.2
64)
(0.2
90)
(0.2
41)
(0.4
58)
Rur
al a
rea
-0.2
347
-0.2
181
-0.2
575
-0.6
721
-0.2
018
-0.1
657
-0.2
364
-0.6
626
(0.1
80)
(0.2
74)
(0.2
65)
(0.4
87)
(0.1
63)
(0.2
62)
(0.2
87)
(0.4
89)
Wat
er p
iped
into
dw
ellin
g or
yar
d0.
0048
-0.0
118
-0.1
375
-0.0
039
0.00
38-0
.007
7-0
.127
5-0
.002
6(0
.093
)(0
.149
)(0
.101
)(0
.173
)(0
.092
)(0
.144
)(0
.100
)(0
.177
)N
o flu
sh to
ilet o
r pip
ed s
ewer
sys
tem
-0.0
025
0.03
460.
0688
-0.1
148
-0.1
454
-0.1
520.
1828
0.07
97(0
.204
)(0
.250
)(0
.266
)(0
.470
)(0
.209
)(0
.255
)(0
.245
)(0
.465
)N
o. o
f com
plem
enta
ry fo
ods
cons
umed
the
day
befo
re-0
.031
4-0
.181
2**
-0.0
249
0.01
05-0
.055
9-0
.204
6***
-0.0
220.
011

61
(0.0
34)
(0.0
73)
(0.0
39)
(0.0
63)
(0.0
40)
(0.0
78)
(0.0
37)
(0.0
57)
Wom
an's
poo
rest
wea
lth q
uint
ile (r
iche
st o
r fifth
is o
mitt
ed)
0.99
84**
*0.
4946
0.23
530.
8306
0.76
37**
0.27
130.
2232
0.99
58(0
.362
)(0
.458
)(0
.313
)(0
.595
)(0
.346
)(0
.462
)(0
.291
)(0
.629
)S
econ
d w
ealth
qui
ntile
1.13
83**
*0.
524
0.22
520.
5474
0.98
77**
*0.
4307
0.22
110.
6748
(0.3
55)
(0.3
21)
(0.3
15)
(0.5
19)
(0.3
35)
(0.3
41)
(0.3
07)
(0.5
32)
Mid
dle
wea
lth q
uint
ile0.
9542
***
0.62
67**
0.58
87*
1.00
78**
0.87
69**
*0.
5997
**0.
6248
**1.
0612
**(0
.299
)(0
.286
)(0
.316
)(0
.503
)(0
.270
)(0
.301
)(0
.288
)(0
.512
)Fo
urth
wea
lth q
uint
ile0.
7365
**0.
5936
*0.
285
0.38
140.
7045
**0.
5908
*0.
3109
0.46
95(0
.299
)(0
.340
)(0
.291
)(0
.575
)(0
.278
)(0
.331
)(0
.285
)(0
.586
)D
ivis
ions
(Pun
e is
om
itted
)A
mra
vati
Div
isio
n0.
1932
0.29
420.
1969
-0.5
089
--
--
(0.2
55)
(0.4
68)
(0.1
84)
(0.6
03)
--
--
Aur
anga
bad
Div
isio
n0.
4813
*0.
6442
*0.
0115
0.17
55-
--
-(0
.279
)(0
.336
)(0
.170
)(0
.427
)-
--
-K
onka
n D
ivis
ion
0.76
70**
*0.
8614
***
0.04
5-0
.495
2-
--
-(0
.216
)(0
.317
)(0
.242
)(0
.349
)-
--
-N
agpu
r Div
isio
n0.
0414
-0.4
195
0.75
33**
*0.
1044
--
--
(0.3
14)
(0.4
24)
(0.1
95)
(0.5
04)
--
--
Nas
hik
Div
isio
n0.
9172
***
1.11
64**
*0.
3923
*-0
.062
9-
--
-(0
.254
)(0
.374
)(0
.207
)(0
.339
)-
--
-C
onst
ant
-1.8
918*
**-2
.219
4***
-2.3
403*
**-3
.683
5***
-1.1
809*
*-1
.450
0**
-2.2
906*
**-4
.084
7***
(0
.552
)(0
.658
)(0
.437
)(1
.115
)(0
.484
)(0
.568
)(0
.396
)(1
.054
)N
umbe
r of O
bser
vatio
ns19
2919
2919
2919
2919
2919
2919
2919
29A
djus
ted
R2
0.10
450.
130.
0525
0.09
370.
0878
0.10
820.
0445
0.08
71
* p<
0.1,
**
p<0.
05, *
** p
<0.0
1
Sou
rce:
Aut
hor’s
ow
n.

62
3.7 Conclusions
There are several conclusions to be drawn from the analysis contained in this paper.
First, the decline in stunting is large between 2006 and 2012, even accounting for changes in the age structure of the two samples. We estimate the decline in stunting to be 12.5 percentage points instead of the more commonly reported 15.4 percentage points. The decline in wasting is much smaller at around 3–4 percentage points and combined with our inability to explain variations within survey years means that we have a better sense of what to do about stunting than about wasting.
Second, this decline in stunting is broad-based, involving many different subgroups and strata of the sample. Even more importantly, the decline seems to be pro-poor: the declines are, in general, larger for those who are nearer the bottom end of the stunting and wealth distributions – whether measured in absolute or relative terms.
Third, the declines do not seem to be driven by changes in the nature of the relationship between undernutrition and its correlates, but rather by the changes in the levels of the determinants. Our tests for changes in the relationship between stunting and its multivariate correlates cannot reject the hypothesis that – as a set – they are identical across the two survey years. The two variables for which the nature of the relationship with stunting does seem to change are age at first birth and wealth. Stunting in 2012 is still vulnerable to low age at first birth and low wealth, but not as vulnerable as in 2006.
Fourth, the levels of the key factors that can reduce stunting and wasting have improved between 2006 and 2012 across a broad range: the age of mothers has increased; there are fewer young ages at first birth; maternal underweight is down; literacy is higher; mothers are making increased antenatal clinic visits; the percentage of mothers giving birth at home is down; vaccination rates are up; some breastfeeding and child feeding practices have improved (e.g. exclusive breastfeeding, number of unique foods provided for the 6–24-month age range, although the latter remains low); there are lower percentages of people with no toilet; women are more involved in making decisions about their own health; and ICDS access has improved.
Fifth, there are some key determinants of undernutrition that have not changed in the six-year period between surveys: educational attainment; improved water access; some breastfeeding practices (e.g. early initiation); and the percentage of children achieving minimum dietary diversity levels (only 10–11 per cent). These are key areas for policymakers to pay attention to – they will likely become a drag on future declines in undernutrition rates.
Sixth, the multivariate correlates of stunting are as expected: age of child (an increase in stunting as age in months increases); mother’s literacy; higher age at first pregnancy; more antenatal visits; birthplace in a facility; and women’s wealth. These are all positively associated with declines in stunting.
Seventh, some variables do not have the expected results. Mother’s underweight has the expected sign (increases stunting) but is not significant, even at 10 per cent. Mother’s underweight is important for wasting, however. Boys have higher stunting and severe stunting rates, which is something that is observed in 2012 but not 2006: this may signal a decline in gender bias against girls as in countries with less gender bias we tend to see boys with higher stunting rates. Breastfeeding variables show no correlations, except for children exclusively breastfed for the first three days, which increases the likelihood of stunting – a counterintuitive result. When we replace these simple breastfeeding variables with those we construct for exclusive and predominant breastfeeding we find that predominant breastfeeding compared to zero or very partial breastfeeding is associated with lower stunting prevalence.

63
Eighth, water and sanitation variables show very little association with stunting, with or without the inclusion of wealth variables, which is puzzling. We constructed a women’s decision-making index and estimated the regressions with it, but due to the very few common variables across the two surveys we opted for including the component variables (such as literacy) separately in the regressions.
Finally, the compatibility of the two surveys, although adequate, was less than perfect. The 2006 survey is representative for under-5s, not under-2s like the 2012 survey. This caused some problems with age composition and stunting as outlined above and it may have caused problems with other variables. Furthermore, we could not explore the survey-to-survey relationships between stunting and food security (as there were no questions on food security in 2006). Nor could we see which districts have performed better than others over the intervening six years because neither sample is representative at the district level.
Stunting in Maharashtra has declined rapidly between 2006 and 2012. It has not done so because of an increasing power of stunting’s determinants to effect change. It has done so because the level of those determinants has increased substantially over the period. Moreover, this change has happened in a broad-based and pro-equity way. The Maharashtra government deserves great credit for this. It is this broad-based improvement in the determinants of nutrition that has led to such significant improvements in stunting.
Nevertheless, there have been some important gaps in progress, and these need to be urgently addressed by the Maharashtra government. First, wasting has declined only modestly and it is not clear from our analysis why that is so. Second, the coverage of improved water sources has not increased. Third, household food security seems to be disconnected from children’s anthropometry which may suggest that while in many households there is food security, the diets of children are sub-optimal and/or access to water and sanitation coverage (which has increased) may not be high enough. Finally, while the rates of good infant and young child feeding practices have improved modestly in some domains, they have not done so in all areas and are still quite low. These gaps in progress may well be key contributors to the lack of progress on reducing wasting rates.

64
4 An Analysis of Maharashtra’s Decline in Childhood Stunting: Stakeholder PerspectivesInka Barnett and Nick NisbettExecutive summary
As part of a wider project to understand the determinants of the decline in childhood stunting in Maharashtra between 2006 and 2012, 28 stakeholder interviews and four focus group discussions were conducted in October 2013 in Mumbai, Pune, Thane, and in Nagpur and Amravati districts. This sub-study explored stakeholders’ opinions and knowledge of the driving forces for the decline in stunting. Interviews were carried out by a team of researchers from IDS with support from UNICEF. Analysis of the stakeholder interviews provides an insight into the wider governance and political factors at play in the state. This case study is highly relevant to wider questions of what constitutes an effective state response to the continuing crisis of child undernutrition – in India – and globally.
In line with this project’s wider analysis of primary and secondary data, multiple factors were perceived to have contributed to the observed decline in child stunting. These included economic growth, improved social, nutrition and health programming and coverage, the role of the state’s Nutrition Mission, strong political will to improve nutrition, and a wider enabling environment for nutrition created by the media and civil society action.
The Nutrition Mission was seen to be both driven by – and a driver of – the state’s political will and a strong contributor to the state’s success in reducing stunting. While the evidence does not allow us to speculate on whether the observed decline in stunting could have been achieved without the Nutrition Mission, it is without doubt that the vision and skills of the Mission leadership and its staff allowed much to be accomplished with minimal resources (a small budget and a team of no more than ten people). In particular, the Mission’s governance model (the unique set-up of the Mission as a body outside departmental structures supported both technically and financially by UNICEF by invitation from the Government of Maharashtra) gave the Nutrition Mission independence and room to innovate.
The Nutrition Mission helped to make undernutrition more visible, for example via streamlining data collection and improving data accuracy as part of growth monitoring at the ICDS and via the introduction of new approaches to data visualisation and communication. This helped to create and sustain a momentum for maternal and child nutrition in Maharashtra. Other perceived innovations included a strong policy and programmatic focus on supporting and building frontline worker capacity on nutrition (including AWWs, ASHAs [auxiliary social health activists] and district-level health workers). Equally important in many stakeholder accounts was the introduction of the National Rural Health Mission from 2005 onwards (at the same time as the Nutrition Mission) and the increased resources and personnel that were available to focus on child and maternal health (most notably the improvement in antenatal care, increases in institutional delivery and the early initiation of breastfeeding). Stakeholders reflected therefore that many improvements may have occurred through strengthening of existing healthcare delivery, but also viewed this alongside wider successes of the Nutrition Mission in working through the NRHM ‘machinery’ (personnel, resources and structures). This included, for example, the introduction of community management of acute malnutrition in the form of ‘Village Child Development Centres’.
Outside of these factors, an active civil society and responsive media played an imported role in raising awareness for child undernutrition, increasing pressure and helping to place child nutrition on the political agenda. The contribution of the private sector to the statewide decline in child stunting was deemed to be limited. However, several private sector bodies and foundations remain keen to contribute and to work with the state in future. Perceived outstanding challenges to child nutrition include poor access to clean water and adequate sanitation, urban poverty and the persistence of undernutrition amongst tribal communities.

65
4.1 Introduction
4.1.1 Background
Over the past decade the Indian state of Maharashtra has experienced a considerable decline in the overall level of early childhood stunting. In 2012 the Government of Maharashtra commissioned a statewide survey to assess progress made since 2006 in improving the nutrition situation of children and to identify priority areas for future policy and programme action. The survey was implemented by India’s International Institute for Population Sciences. Comparing data from this most recent survey with data from the 2006 National Family Health Survey reveals that the state has experienced a decline from 39 per cent in 2006 to 23 per cent in 2012 in stunting in children under two (a 2.5 percentage point annual mean decline).
UNICEF and IDS are collaborating to investigate direct and indirect determinants that might be responsible for this dramatic decline in the prevalence of child stunting in Maharashtra. Findings from this analysis are expected to inform future efforts to eradicate child undernutrition in India and globally.
To complement the statistical data analyses presented in the accompanying papers in this mixed methods study, and to fill information gaps outside the available survey data, IDS conducted a series of stakeholder interviews in Maharashtra between September and November 2013.
4.1.2 Aims
The aims of the stakeholder interviews were:
• to capture stakeholders’ opinions and knowledge of the driving forces for the decline in stunting in Maharashtra between 2006 and 2012;
• to obtain stakeholders’ perceptions of the contribution of specific forces (e.g. the state’s Nutrition Mission)10 to the reduction of stunting;
• to identify stakeholders’ views on outstanding challenges and barriers for the further reduction of stunting in Maharashtra.
The purpose was to gain a comprehensive understanding of the range of factors that might have contributed to the improvement in child nutrition in the views of key stakeholders. A number of specific factors were explored in more depth, including the role of statewide initiatives or programmes such as the Integrated Child Development Services (ICDS), the National Rural Health Mission (NRHM) and the state’s Nutrition Mission. However, it was outside the scope of this study to rigorously evaluate the contribution of these specific factors to the observed decline in child stunting.
4.1.3 Methods
An initial stakeholder mapping exercise was conducted to identify relevant key stakeholders in academia, civil society, government, international partner organisations, media and the private sector. To ensure that key stakeholders in nutrition-specific and nutrition-sensitive sectors were included, an adaptation of the conceptual framework on the causes of undernutrition (UNICEF 1990) was employed as a guide for the stakeholder selection (Figure 4.1).
10 The full title is the Rajmata Jijau Mother–Child Health and Nutrition Mission. For convenience, it will be referred to here as the ‘Mission’ or ‘Nutrition Mission’.
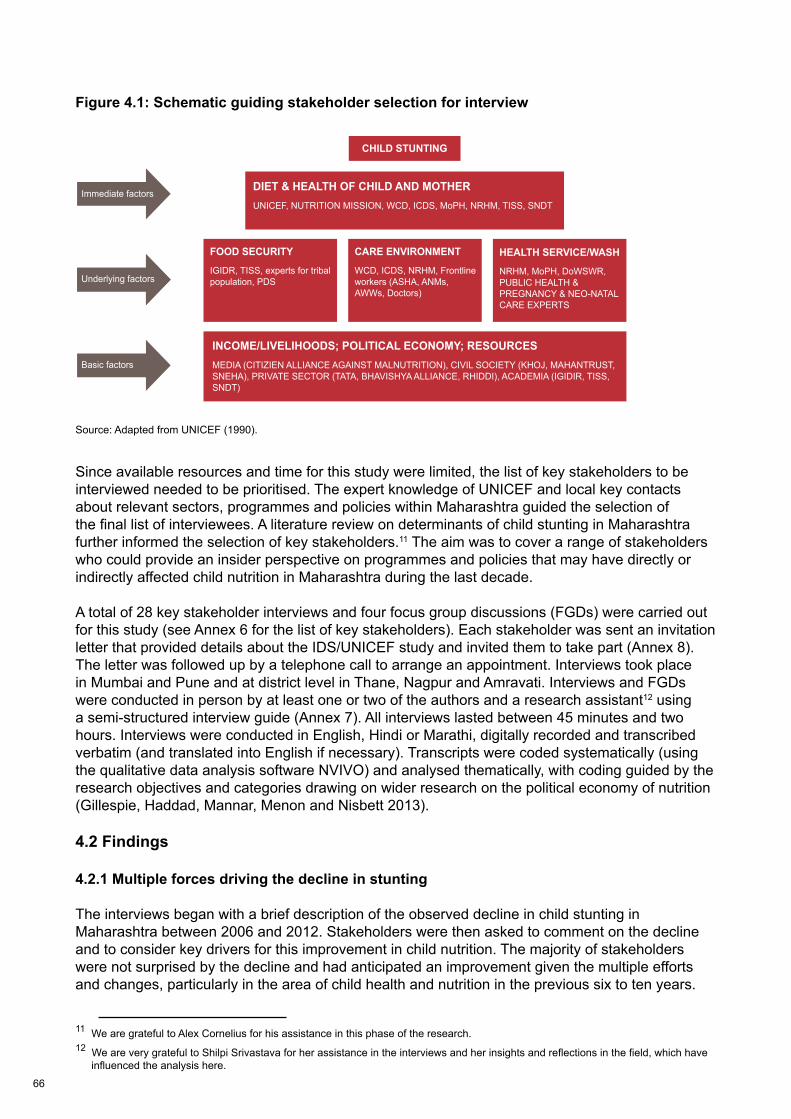
66
Figure 4.1: Schematic guiding stakeholder selection for interview
Source: Adapted from UNICEF (1990).
Since available resources and time for this study were limited, the list of key stakeholders to be interviewed needed to be prioritised. The expert knowledge of UNICEF and local key contacts about relevant sectors, programmes and policies within Maharashtra guided the selection of the final list of interviewees. A literature review on determinants of child stunting in Maharashtra further informed the selection of key stakeholders.11 The aim was to cover a range of stakeholders who could provide an insider perspective on programmes and policies that may have directly or indirectly affected child nutrition in Maharashtra during the last decade.
A total of 28 key stakeholder interviews and four focus group discussions (FGDs) were carried out for this study (see Annex 6 for the list of key stakeholders). Each stakeholder was sent an invitation letter that provided details about the IDS/UNICEF study and invited them to take part (Annex 8). The letter was followed up by a telephone call to arrange an appointment. Interviews took place in Mumbai and Pune and at district level in Thane, Nagpur and Amravati. Interviews and FGDs were conducted in person by at least one or two of the authors and a research assistant12 using a semi-structured interview guide (Annex 7). All interviews lasted between 45 minutes and two hours. Interviews were conducted in English, Hindi or Marathi, digitally recorded and transcribed verbatim (and translated into English if necessary). Transcripts were coded systematically (using the qualitative data analysis software NVIVO) and analysed thematically, with coding guided by the research objectives and categories drawing on wider research on the political economy of nutrition (Gillespie, Haddad, Mannar, Menon and Nisbett 2013).
4.2 Findings
4.2.1 Multiple forces driving the decline in stunting
The interviews began with a brief description of the observed decline in child stunting in Maharashtra between 2006 and 2012. Stakeholders were then asked to comment on the decline and to consider key drivers for this improvement in child nutrition. The majority of stakeholders were not surprised by the decline and had anticipated an improvement given the multiple efforts and changes, particularly in the area of child health and nutrition in the previous six to ten years.
11 We are grateful to Alex Cornelius for his assistance in this phase of the research.12 We are very grateful to Shilpi Srivastava for her assistance in the interviews and her insights and reflections in the field, which have influenced the analysis here.
22
CHILD STUNTING
DIET & HEALTH OF CHILD AND MOTHERUNICEF, NUTRITION MISSION, WCD, ICDS, MoPH, NRHM, TISS, SNDT
FOOD SECURITY
IGIDR, TISS, experts for tribal population, PDS
INCOME/LIVELIHOODS; POLITICAL ECONOMY; RESOURCESMEDIA (CITIZIEN ALLIANCE AGAINST MALNUTRITION), CIVIL SOCIETY (KHOJ, MAHANTRUST, SNEHA), PRIVATE SECTOR (TATA, BHAVISHYA ALLIANCE, RHIDDI), ACADEMIA (IGIDIR, TISS, SNDT)
CARE ENVIRONMENT
WCD, ICDS, NRHM, Frontline workers (ASHA, ANMs, AWWs, Doctors)
HEALTH SERVICE/WASH
NRHM, MoPH, DoWSWR,PUBLIC HEALTH &PREGNANCY & NEO-NATALCARE EXPERTS
Immediate factors
Underlying factors
Basic factors

67
One stakeholder voiced doubts about the steep decline in stunting in a relatively short time period and emphasised that it would be necessary to break down the intergenerational cycle of growth failure to eradicate child stunting in the long term.13 Two respondents wondered whether the decline would be equally distributed across Maharashtra and raised concerns about the persistently high levels of child undernutrition among tribal communities and in remote areas.
All stakeholders agreed that multiple forces contributed to the improvements in child nutrition in Maharashtra and that, in the words of one,’it is difficult to pin the success to one factor, success has many fathers’. None of the stakeholders attempted to attribute the decline to any one endeavour (e.g. the Nutrition Mission) or government department. On the contrary, many stakeholders highlighted the complexity of child undernutrition and stressed the need for a multisectoral response to undernutrition.
Box 4.1 lists changes and improvements that stakeholders perceived as important drivers for the decline in child stunting in Maharashtra. Key drivers could be sub-divided into changes in immediate and underlying factors and basic factors (according to the conceptual framework on the causes of undernutrition, see UNICEF 1990).
Box 4.1: Perceived key drivers of the decline in child stunting in MaharashtraImmediate and underlying factors• Improved child feeding practices (in particular breastfeeding);• Improved household food security and access to more nutritious diets;• Improved access to primary health care and reproductive care;• Universalistion of ICDS and improved quality of service delivery;• Improved transport and communication infrastructure even in remote rural areas;• Improved access to clean water and sanitation. Basic factors• Economic growth and increase in per capita income; • Growing number of public social and health programmes;• Globalisation and improved access to markets including in remote rural areas;• Media expansion and improved ‘access to the outside word’;• A historically strong civil society; • Improved education and female empowerment; • Strong political commitment towards undernutrition reduction (e.g. increased budgets for nutrition
and health);• Implementation of the Nutrition Mission (immediate, underlying and basic factors).
The strong economic growth of Maharashtra (perceived to be a result of agricultural intensification, industrialisation and a growing service sector) was frequently mentioned as a major basic factor underpinning the decline in stunting. Several stakeholders speculated that the economic growth led to increased household incomes and thus enabled poor families to access better food and services and improve their living conditions. Other stakeholders were more sceptical and believed that while the economic growth might have benefited urban and semi-urban households, the impact on remote rural households and tribal communities may be less pronounced or non-existent.
The implementation of the Nutrition Mission and large-scale improvements in healthcare provision (especially in rural areas) were mentioned by most stakeholders as important driving forces for the decline in child stunting and will be discussed in the following two sections, following a brief
13 Stunting begins during pregnancy with stunted and undernourished mothers being more likely to deliver low birthweight and stunted offspring who can grow up to be stunted adolescents and mothers themselves.
68
introduction to the Mission and its antecedents. The perceived contribution of the media and civil society in creating and sustaining momentum for the reduction of child undernutrition and the role of the private sector in delivering services are explored in detail in section 4.2.6. In section 4.2.7, findings on other important forces that stakeholders believed to be specific to Maharashtra are presented, followed by a brief section 4.2.8 on outstanding challenges for child nutrition.
4.2.2 The Nutrition Mission and perceived factors for its success
4.2.3 Background on the Nutrition Mission and its antecedents14 The Marathwada Initiative as the precursor to the Nutrition Mission
In September 2001 the death of 14 children as a result of undernutrition in Bhadali village, Aurangabad district, was highlighted by activists and the media, bringing the issue of child undernutrition to statewide political attention. The political pressure was heightened because Aurangabad was a stronghold of the ruling (at state level) Congress party. Triggered by these events, the divisional commissioner, responsible for the eight districts of Aurangabad, Mr V Ramani, worked with other local officials, UNICEF and other external experts to devise a response. The result was the launch of the Malnutrition Removal Campaign, also known as the Marathwada Initiative, in March 2002. The initiative focused on: effective growth monitoring of all children by the ICDS (i.e. striving for full coverage and 100 per cent survey efficiency); nutritional grading of the children; timely referral of acute cases of undernutrition to medical care; and the counselling of mothers on childcare and feeding practices. The initiative targeted children aged between zero and three years in contrast to the traditional ICDS focus on 0–6-year-olds (see Annex 9 for more information on activities of the initiative). A reported total of around 25,000 frontline functionaries and the elected representatives from district, block and village levels were sensitised and trained alongside the media.15 UNICEF support included the provision of standardised weighing scales, growth charts and registers to the AWCs in eight districts. The initiative was eventually to reach a reported 1,800,000 children.16
The Nutrition Mission
To further investigate the underlying causes of child deaths due to undernutrition the Government of Maharashtra commissioned further research in 2004 by the Committee to Evaluate Child Mortality (CECM) chaired by an activist clinician, Dr Abhay Bang. The committee’s report was published in August 2004 and raised strong concerns about the quality of the routine nutrition data collected at the ICDS. Given that the ICDS data were used by the state to plan nutrition resource allocation, an improvement of the data was described as essential. Continued media interest in undernutrition deaths (including in 2004 in Nandurbar district), emerging judicial interest in the situation, and positive reports on the success of the Marathwada Initiative further raised the public’s awareness of undernutrition. In February 2005 the cabinet of the Government of Maharashtra decided to establish a statewide Nutrition Mission based on the model of the Marathwada Initiative. The Rajmata Jijau Mother–Child Health and Nutrition Mission was formally constituted in November 2005 via a Government of Maharashtra resolution.
Mr Ramani was appointed as Director General of the Mission and deputised many of his original staff with the intention of scaling up the activities of the Marathwada Initiative. This occurred in three stages, with five high-burden districts with a high population of tribal people covered in 2005–2006, extended to another ten high-burden districts in 2006–2008, and statewide from April 2008. The Mission was supported in the bureaucratic system by three state-level committees chaired by
14 This background section draws on information from the interviews, from (Ramani 2011) and other documents. We are grateful to Rupinder Kaur for her assistance in this phase of the research.15 Source: UNICEF Mumbai.16 Source: UNICEF Mumbai.

69
the Chief Minister, the Minister for Women and Child Development and the Chief Secretary,17 and was supported externally by UNICEF who agreed to fund the small secretariat and provide further technical support.
The primary objective of the Mission was to reduce Grade III and Grade IV malnutrition (children who are 51–60 per cent or 50 per cent and below the expected weight for their age according to Indian Academy of Paediatric standards [IAP] – see Annex 9), with a number of sub-objectives including community participation, neonatal care and improved health of mothers and adolescent girls. To achieve this the Mission expanded on the Marathwada Initiative’s activities in terms of improving and increasing the reach of growth monitoring (again with a goal of 100 per cent registration) and introduced a number of innovative pilots that were later scaled up, including: capacity building and training for health and nutrition workers on infant and young child feeding; community participatory growth monitoring; and regular deworming and vitamin A supplementation (see Ramani 2011 for a full description of activities). Particularly important was the establishment of a number of new treatment and referral protocols for treatment of moderate and severe underweight (as measured by the then IAP standards) and the establishment of Child Development Centres at Rural Hospitals or local (sub-block-level) Primary Health Centres. The replacement of the IAP standards with the new WHO Child Growth standards in August 2008 improved the growth tracking (especially in children below six months of age) and also increased the detection of severe undernutrition in children (see Prinja, Thakur and Bhatia 2009). Consequently, the number of children categorised with Severe Acute Malnutrition (SAM) and Moderate Acute Malnutrition (MAM) increased substantially. To address this a protocol was developed aimed at improving community-based treatment of severe undernutrition by strengthening the collaboration between Angawadi workers and frontline health workers. This combined system was referred to as the Village Child Development Centres (VCDCs).
The Mission’s first phase came to an end in June 2010 and the Mission’s Aurangabad office closed. A review led by the Chief Minister in September 2010 concluded that there was still much to do to tackle the state’s levels of nutrition and so a second phase of the Mission was inaugurated, to last between 2010 and 2015.
The focus in this phase would continue to support some of the key activities of the first phase, including, for example, the VCDCs, but would shift further towards interventions geared towards the first 1,000 days of a child’s life (i.e. from conception until the age of two – the first 1,000 days offer a unique window of opportunity and are key to the physical and cognitive development, long-term health and wellbeing of a child). The focus on SAM and MAM for the under-2s was retained, as were vitamin A and deworming interventions. However, the Mission’s second phase also included a number of new objectives, including activities to improve maternal, neonatal and infant health plus adolescent girl health and reproductive rights, and links into wider social sector programmes (such as the National Rural Employment Guarantee) and the education sector.
4.2.4 Factors of success
There was a general consensus among many of the interviewed stakeholders that the Nutrition Mission was one of the major factors in the stunting decline in Maharashtra. The Mission had a number of enthusiastic advocates at all levels of government; in some quarters of civil society and in the media. Box 4.2 summarises the perceived contributions of the Nutrition Mission to the decline in stunting in Maharashtra.
17 In the second phase of the Mission discussed below, the committee chairmanship comprised of senior bureaucrats passed to the Additional Chief Secretary (Health).

70
Box 4.2: Perceived contributions of the Nutrition Mission to the decline in stunting in Maharashtra• Improved hygiene behaviour; • Improved motivation of frontline health and nutrition workers;• Improved childcare and feeding practices;• Improved capacity for accurate and timely growth monitoring;• Raised public awareness of undernutrition;• Improved collaboration between ICDS and public health at all political levels.
Previous literature and reports have documented the success of the Nutrition Mission, assessed the extent to which it reached its own objectives and speculated about the effects of the Mission on stunting rates in Maharashtra (Gillespie et al. 2013; Ramani 2011; UNICEF 2013). In the following, the specific factors that stakeholders perceived to be important for the Mission’s success are explored in more depth.
Strong political leadership and will
One of the most frequently cited reasons for the success of the Nutrition Mission was the role of individual and collective leadership, backed by demonstrable political will. From the early days to its current incarnation the individuals responsible for leading the Mission have been able to draw on backing from the political top. Stakeholders were able to cite a number of examples where the Mission leads had used this political support to effect bureaucratic influence (the mechanisms for this are explored below). This high-level political commitment was interpreted by different interviewees, depending on their perspectives, as either genuine, opportunistic or brave (in the latter case it was argued that launching the Mission, continuing to support it through the change of political leadership and opening the data to the public in the commissioning of the CNSM survey were all carried out against a backdrop of a fervent media blaming ineptitude for the continuing child deaths).
Whatever motivations lay behind this political commitment, interviewees reported that this support allowed for a huge range of flexibility for the individuals leading the Mission, particularly in its early days, to act innovatively.
Interviewees outside the Mission reflected on the leadership qualities of those leading the Mission in both phases as stemming from their clean and credible image (‘clean’ here implying not in any way tainted by any procurement issues) and their strong existing reputation as competent administrators. They were seen as being able to work strategically at the top levels of policy; but crucially (and, it was said, rarely for any senior officials) to take the plight of ground-level workers seriously – and to make motivating those workers the focus of the Mission. Their choice to have set up or chosen the Mission posting in the first place was said to demonstrate genuine motivation. On the one hand, it was thought that this indicated their willingness and motivation to work behind the scenes in an area previously under the radar and not considered as one of the top postings in the Indian Administrative Service (IAS). On the other hand, senior officials reflected themselves that Maharashtra’s success in its social programmes and the injection of resources into health and nutrition via the National Rural Health Mission (NRHM) and the ‘universalisation’ (expansion) of ICDS had started to make the postings more attractive and politically important.
Independence of the Nutrition Mission and support by UNICEF
This innovation and flexibility were embedded in the structure of the Mission itself, which was deliberately set up outside of the existing government ‘machinery’ in order to free itself of some of the potential pitfalls of bureaucratic functioning. UNICEF’s backing was seen as critical in this

71
freedom as it enabled the Mission to function without day-to-day recourse to state funds (and the associated bureaucracy). This was further facilitated by the decision to recruit a very small team and to work as much as possible with existing resources. As one senior official connected to the Mission noted:
Because the minute you get in government funding then a hundred things start. You know there is a question, budgets won’t get released on time, you don’t have money. Over here it’s very clear. You give a budget, it can be revised, the only person you have to deal with is [a UNICEF official] and the state head in Maharashtra. You talk to them and tell them, look, I need more because we’re going to do this or we need so much etc. and the funds come regularly. With UNICEF that’s not a problem.
Integration into the existing bureaucratic machinery
Stakeholders repeatedly stressed the role of working with the existing machinery of the ICDS and the health department if they were to have an impact at the front line. Interviewees placed a particularly strong emphasis on the decision that had been taken to ensure the Nutrition Mission had no role in the procurement and food distribution associated with the existing ICDS (including for example the supplementary nutrition programme and take-home rations). Freedom from procurement kept Mission officials away from any of the concerns to do with corruption that can potentially beset officials in the ICDS system. As one official reflected:
we decided not to take issues which could bring us in conflict with vested interest. Food is a very highly vested interest area. As we’re going to realise now when we’re trying to develop a food policy to implement the right to food. You’re going to find that all sorts of vested interests are going to come into it, starting with your public corporations, private traders and so on. It’s going to become a major issue. So we decided not to get into the food issue.
This ability to function at the top was said to have been aided by the Mission’s bureaucratic independence, combined with the decision to employ someone at the rank of Secretary as Director General, and the way the political support materialised in the functioning of a number of committees chaired by the Chief Minister, the Chief Secretary and the Deputy Chief Secretary. Whilst individuals within and outside the Mission stressed the importance of working with, not against, existing officials in charge of ICDS or the Health Department or other sectors, the ability to bring issues to these committees, combined with the support from the top, meant they had an enhanced ability to secure favourable change. However, one of the top Mission officials noted that their ability to influence at this level was not unlimited. Coordination had been difficult in the early days and could certainly still result in ‘turf wars’ – particularly over harnessing resources at the front line. Success at such forms of ‘horizontal coordination’ (Mejia Acosta and Fanzo 2012) relied on a credibility earned through effective use of evidence: ‘[s]o unless we are seen to be very, very reliable and credible, and whatever we say is based on scientific evidence it will be almost impossible to get the cooperation of the full departments’. The backing and support of UNICEF was seen as crucial in this latter role, with the Mission, with UNICEF’s help, acknowledged explicitly by key players as a conduit for global evidence.
That these strategies were successful was said to be evidenced by a number of key decisions these officials and external actors could point to in which the Mission had had a role. These included, for example, the decision in the early days of the Mission to shift the focus to monitoring SAM and referring children to Child Development Centres (CDCs) (not traditionally the role of the frontline Anganwadi Workers – AWWs – who under national guidance are only meant to measure weight for age) and (from 2010) treating children in the community in the VCDCs through both the Health Department and the ICDS machinery (in an order signed, significantly, by both departments – see Ramani 2011). Likewise, the decision to include monitoring of chronic undernutrition through monitoring stunting was also seen as a key result:
72
Internationally, height is what is being measured so it is through our own soft power as we call it, persuasive powers, we have persuaded Anganwadi workers to do this job. It’s not technically or officially a part of their mandate. So in Maharashtra we have succeeded in doing that. And why and how we succeeded is, as I said, through our persuasive powers and as long as people don’t obstruct us we can do a lot.
Focus on strengthening ground-level capacity
While this top-level bureaucratic innovation was stressed by many, the subject that most animated the current and past Mission staff was their ability to innovate, influence and motivate at the ground level. The leaders of the Mission were seen as unique amongst their rank for their willingness to get out and speak to ground-level workers and villagers. The majority of the small Mission secretariat were continuously engaged in field visits – initially in an extensive programme of capacity building accompanying the growth monitoring and community activities described above, or, more recently, activities that are the focus of the second Mission, including IEC, IYCF and approaches following the positive deviance methodology.18 The role of leadership in motivating the ground-level staff was seen by one external informant as an important factor in success and supported by her own experience of what was happening on the ground:
once you have a leadership at the top that is convinced, then it filters down, then the community will want to do something [and the government] machinery doesn’t miss it. And I remember I visited [inaudible – Garandabad] about a year ago and the local official said to me ‘we used to think nothing can [help and] suddenly we feel we can actually make a difference to the life of children’.
Mission officials noted a number of strategies they had used to ensure this ground-level motivation, including awards for highly performing AWCs, and letters from the Chief Secretary sent to frontline officials. As an external interviewee connected with the Mission commented:
And they were really young officers who really enjoyed working because they were [gaining] recognition… [and on the recommendation of the Mission DG they were] getting a letter from the Chief Secretary… So they become your ambassadors. … You are creating people who are committed to this cause.
An understanding of what worked best at the ground level to motivate workers was reported to have stemmed in part from the Nutrition Mission’s early origins in the Marathwada Initiative and the first Mission DG’s ability to innovate at sub-state levels. In Ramani’s own words this was aided by Maharashtra’s divisional commissioner system and the relative freedom this gave him to operate within the eight districts under his control. The ability for public functionaries to display leadership at even lower administrative levels was noted by other informants who felt that the Mission gave district-level officials – for example with the responsibility for ICDS – the ability to focus on nutrition in the widest possible sense rather than, for example, the delivery of supplementary nutrition.
It has not been possible for this research to map or verify the extent of the Mission’s reach in terms of capacity building of ground-level workers; community/ participatory growth monitoring, and behavioural change. Figures provided by UNICEF indicate that between 2005 and 2012 a total of 88,000 workers were trained as a result of activities initiated by the Mission but delivered through the ICDS or NRHM machinery. This was supported by academic institutions, local NGOs and professional partners. A number of independent interviewees did confirm witnessing changes in practices on the ground as a result of Mission activities – including the motivation of AWWs and mid-level workers, the sensitisation of AWWs, the adoption of new practices and the visibility of undernutrition at a community level. Others unconnected with the Mission expressed doubts as to how such a small Mission team could have sufficiently covered all 35 districts – while other praise
18 An approach to highlighting and replicating emerging best practice and innovation at the district level.

73
was slightly muted by the sense that even with sufficient reach, actual behaviours, including that of AWWs themselves, would take a long time to change:
you go to Melghat and talk to the Anganwadi workers [and] they have been trained very recently, so it’s all in place, they know their stuff. They may not do it and I think that’s the other part. So if you ask the Anganwadi worker if she herself has given the colostrum to her baby it might be no, she may not have followed the proper weaning practice, but if you ask her what you should be doing all the answers are correct. So that is impressive. The government must be getting something right.
Improved growth monitoring
Mission staff reported that significant amounts of time and energy had been invested in improving the growth monitoring carried out by the AWWs. Accurate nutrition data collection was seen to be one of the most important activities of the first phase of the Mission in increasing the visibility of undernutrition, both at community level and in the political context. Mission staff acknowledged that the data reported by AWWs was still far from accurate, but that it had greatly improved compared to the data previously collected by AWWs, where under-reporting or mis-reporting had been rife. They attributed this partly to the Mission’s philosophy of ‘fact finding not fault finding’ (where AWWs and their superiors had been persuaded that under-reporting of undernutrition was detrimental to the task of treating it) and partly to the Mission’s focus on improving ‘weighing efficiency’, particularly in its first phase.
Raising public awareness of undernutrition
Related to the Mission’s perceived role in increasing visibility, at both ground and policy levels the Mission was seen by a number of participants to have helped change the narrative on nutrition as an issue (or in the literature, the internal and external framing – Shiffman 2010; Shiffman and Smith 2007). In particular the focus was seen to have shifted from food distribution to a wider sense of nutrition (external framing) and, as reported above, the decisions that needed to be made within the nutrition community on monitoring stunting and wasting as opposed to underweight (internal framing). On the wider food narrative, one senior official bemoaned that
the way the media has been portraying this over the last many years is that is it’s a matter of hunger, it’s a matter of not getting enough food, and what is the government doing and it’s about the PDS and all
But another interviewee noted how then ‘the Nutrition [Mission] started building [a different narrative/consensus] and people started talking about nutrition, but not food’.
4.2.5 The role of the health sector and the National Rural Health Mission
Many of the stakeholders interviewed attributed the decline in undernutrition at least partly to the success of Maharashtra’s health and public health provision via the Public Health Department. The expansion of primary and auxiliary care through the health system delivery at the district level and in particular via the National Rural Health Mission (NRHM) and the integration of these services with ICDS delivery at the ground level were seen as key factors.
The integration of health and nutrition
Many stakeholders (including both ground-level and high-level bureaucrats and politicians) emphasised the importance of addressing both child and maternal health and nutrition in an effort to tackle undernutrition effectively and sustainably. One stakeholder stressed the need for an integrated approach, ‘health and nutrition cannot be separated, they are one and one; it has to go hand in hand; it should be integrated’.

74
Part of this was accomplished via the Mission’s formal role in supporting coordination between the Public Health Department (PHD) and the ICDS at senior policy levels. The most senior official interviewed noted the ‘extraordinary coordination between the PHD and the ICDS’.19 One Mission official saw, ‘The Mission’s role is convergence. The Mission is only for convergence’. An activist clinician similarly reflected how ‘the Nutrition Mission… tried to combine the existing health services that the government had together… to you know… make use of whatever is available’.
Some of this convergence can be attributed to national initiatives such as the institution of monthly Village Health and Nutrition Days. Other forms of convergence appear to be particular to Maharashtra and at the instigation of the Mission – including the operation of the community treatment of acute malnutrition via the Village Child and Development Centres. District public health clinicians interviewed confirmed that the improvements were due to the introduction of the VCDCs and the delivery of resources via the NRHM, noting ‘Earlier we were trying to achieve malnourishment [reduction] without funds, which was very difficult. Now there are funds available and there is a machinery in place which promotes accountability. Therefore we are seeing good results’.
Building the capacity of the medical profession to recognise, prevent and treat undernutrition in an effective and timely manner was perceived as important by several stakeholders (including those both with and without a medical background). Consequently, nutrition was reported to have been introduced into the medical curriculum of health professionals in most universities and colleges across Maharashtra in the previous five years. This was accompanied by making available further education courses on nutrition to medical personnel at all levels. At the ground level, joint training and capacity building with district health ICDS and NRHM workers (AWWs and Auxiliary Social Health Activists [ASHAs]) was also reported to have been carried out.
The impact of the National Rural Health Mission on maternal and child health
A number of stakeholders believed that political commitment to public health increased significantly over the last five years in Maharashtra. Three stakeholders attributed this shift towards health to the strong political leadership in the health sector provided by the current Chief Secretary, Dr. Banthia. As a result, the budget allocation to public health had increased and a number of health programmes targeting children, adolescents and mothers had been launched.
Another important change was the launch of the National Rural Health Mission (NRHM) by the Indian government in 2005. The NRHM aims to strengthen the rural health care system by providing accessible, affordable and reliable health care to poor households. The main focus of the NRHM is on the reduction of maternal and child mortality by providing access to primary health care and reproductive health. As part of the NRHM, capacity in health was increased significantly by deploying a large number of community-level accredited social health activists (ASHAs), auxiliary nurse midwives (ANMs) and nurses.
Several interviewees had observed and described in detail the positive impact of the NRHM and wider health programmes or reforms on antenatal care and the number of institutional deliveries in rural areas. Maharashtra’s success in increasing the numbers of institutional deliveries was seen as an entry point to a wider system of maternal and child care. One interviewee is quoted here in full given the strong sense they conveyed of the role of the health system and in particular the NRHM (this interviewee, with connections to both the Nutrition Mission and the health system, also noted that beyond the changes initiated by the Mission it would be hard to attribute any changes to the normal functioning of the ICDS in this period):
19 Cited from notes, not from transcript.
75
more women are delivering in institutions and especially public health institutions. You are able to counsel them better about neonatal care and immunisation and breastfeeding. So it started from there and then you had many schemes to promote institutional deliveries, you had better ANC care and the whole concept of the tracking of mother and child came up through the mother and child tracking system and the health card and the mother and child card. So it was manual tracking and now increasingly more computerised tracking. That I think would have substantially helped. Though of course there is still a lot to be done because the ANC check-ups are happening but mothers are still not gaining weight during pregnancy and they are still severely very anaemic, so all those issues are still there, but at least more of the high-risk deliveries are coming to institutions and are being referred to institutions and that is happening. And now post-delivery too, I mean, more and more of this free referral business going on and now ambulances are in place, so you just give a call and they come and pick you up for delivery or a sick child. I think that has made a difference. Overall the improvement in health facilities, access to health care, all this would help in reducing neonatal mortality. Whether this has also spilled over into reduction in stunting, that is a matter of interpretation I would say, because everything is interlinked.
The ASHAs were frequently described as the backbone of the perceived success of the NRHM. Some stakeholders noted that the 60,000 strong ‘army’ of ASHAs had made a considerable difference to the frontline resources and played an essential role in the effective and smooth implementation of various health programmes alongside and in vital support to the AWWs and ANMs. However, countering an overly optimistic portrayal of the NRHM, the focus group discussion with ASHAs as part of this study revealed many of the challenges that ASHAs face on the ground, including: the performance-based payment structure that frequently provoked them to focus on activities that were remunerated (e.g. institutional delivery) and to neglect other tasks; the ongoing burden of high workloads; and the problems caused by delayed payments for work undertaken.
4.2.6 The media, civil society and the private sector
Media
In the last decade access to media was reported to have increased dramatically across Maharashtra, especially due to rising TV ownership and internet connectivity. Rising literacy rates (including female literacy) and further use of local languages were seen to have enhanced accessibility to media (e.g. print media) even in remote rural areas.
Many stakeholders acknowledged the contribution of the media in highlighting the issue of child undernutrition in Maharashtra. The local media were perceived as more ‘useful’ than national media in this respect. Media coverage was described as important to create the initial momentum and also to draw attention to areas of the state that traditionally received less interest, particularly tribal communities.
One stakeholder explained:
In a way you can say the media highlighted this whole issue of malnutrition and has sort of pushed the government into realising the seriousness of the problem and realising that something more has to be done for this. And in that even the ICDS itself now, the whole restructuring of ICDS, is probably a result of this whole debate and the public consciousness about what needs to be done.
Media coverage of child undernutrition was generally short-lived and mainly focused on the aftermaths of tragic child deaths due to acute malnutrition, as described by a number of stakeholders. So whilst helpful in catalysing initial reactions, the long-term role of the media in sustaining the public’s interest in undernutrition and in actively holding the government accountable for their commitment towards the reduction of child undernutrition was perceived as limited.
76
Three stakeholders were concerned that most media continued to portray undernutrition as a problem of food insecurity. In the stakeholders’ opinion this simplified view of undernutrition missed an important opportunity to raise the public’s awareness of the multidimensional nature of undernutrition and the need for a multisectoral approach. Raising the media’s awareness and knowledge of the technicalities of undernutrition was perceived as important to prevent future misrepresentations. Given this wider background, officials cited media attention as both positive and negative in the trajectory of the Nutrition Mission itself and its activities; helpful in raising the status of child deaths and malnutrition in the first place, unhelpful because of simplistic portrayals of hunger and food, and a tendency to criticise any government attempt at redress no matter what the circumstances.
Civil society
Stakeholders’ views on the role of civil society in the decline in childhood stunting varied greatly, ranging from ‘NGOs have a big role’ to ‘civil society didn’t really have much to say’. One stakeholder felt that some civil society organisations had adopted confrontationist approaches, making collaboration with the public sector challenging.
While stakeholders were not aware of the activities of any statewide civil society organisations or NGOs likely to have an impact on child stunting, many highlighted the importance of local NGOs in providing advice and information on childcare and nutrition and other support to poor households in both urban and rural areas. Local NGOs were perceived as especially important for the provision of health, nutrition and childcare-related services in remote, tribal communities and informal urban slums that were less well covered by public infrastructure. As noted earlier, in many informants’ perceptions the hilly, forested and poorer regions would never have received public attention if it hadn’t been for some well-known activist NGOs working in these areas.
According to several stakeholders, two civil society movements in particular helped to raise awareness about child undernutrition, increased pressure and held government officials accountable: the Citizen’s Alliance against Malnutrition20 and the Malnutrition Monitoring Committee.21
The private sector
Most stakeholders assigned little importance to the contribution of the private sector to the decline in stunting. The Bhavishya Alliance (2006–2012) was frequently mentioned as an attempt to bring together a private sector actor (Unilever), civil society (UNICEF) and the Government of Maharashtra to address undernutrition in partnership. Experiences from the Alliance were mixed and while several stakeholders described the initiative as a very valuable learning experience for all parties, none of the initiatives of the Alliance were operating at scale and therefore there were no perceived impacts on statewide stunting levels. Nevertheless, several stakeholders remained hopeful that the private sector could play an important future role in the delivery of services (for example, logistics, marketing) and the promotion of behavioural change messages.
20 The Citizen’s Alliance against Malnutrition is an India-wide movement of young parliamentarians, NGO representatives, journalists and celebrities who created much media attention and raised the public consciousness on undernutrition by touring across India to get first-hand information on the state of child nutrition (Mohmand 2012). The Alliance was closely linked to UNICEF and led to the large-scale Hungama survey (a nutrition survey across 112 rural districts of India that covered nearly 20 per cent of Indian children) (Naandi Foundation 2011).
21 The Malnutrition Monitoring Committee was formed in 2007 in response to an order issued by the High Court of Mumbai following several child deaths due to malnutrition. The committee consisted of 14 non-governmental members including experts in childcare and nutrition, medical doctors and activists. The aim of the committee was to advise the Government of Maharashtra on how best to address child undernutrition in Maharashtra. The committee submitted their final report with recommendations in February 2012 (Malnutrition Monitoring Committee, 2012).
77
4.2.7 What makes Maharashtra different? State-specific driving forces
Apart from being one of the most urbanised and industrialised states in India, several stakeholders commented on other perceived qualities that appear to make Maharashtra exceptional – or at least, to paraphrase one interviewee’s words – a state which is beginning to put all the right things in place to make a difference. Reasons given for this ranged from historical to contemporary. Historical reasons were cited as Maharashtra’s resistance to invasion/colonisation or its role as a source of a considerable number of important social reformers and a more enlightened attitude to women and educating women (though opinions on this were mixed). Contemporary reasons were given as the functioning of the bureaucracy and the connections between political will and the role of the media and civil society.
The role of the bureaucracy has been considered in detail in the sections above, but in general terms Maharashtra was seen to have a very able and competent bureaucracy. As one IAS officer explained – there should be no reason why bureaucrats should function any differently in Maharashtra than any other state, but a number of factors enabled them to do their job better in Maharashtra. Alongside the enabling environment created by high-level political will discussed above, another reason given was the particular rules for the Maharashtra IAS cadre which make it much harder to transfer an officer for political purposes. A related and important finding for the success of nutrition and health activities was cited as the tendency to allow IAS officers more choice over their postings, which had resulted in key individuals circulating between health, nutrition and the Nutrition Mission at a senior level.
Contrasting with this, however, were the opinions of a few interviewees who cited the regional political economy of the state requiring that Mumbai politicians must lean towards their supporters in wealthier urban, industrial and agriculturally rich regions, or towards particular interest groups including sugar and cotton producers.
4.2.8 Remaining challenges to child nutrition in Maharashtra
The interview was concluded by asking stakeholders about outstanding challenges to a Maharashtra free from child stunting.
High levels of stunting among children from tribal communities
Persistently high levels of child undernutrition among children from tribal communities were described as an outstanding challenge by many stakeholders. Perceived reasons for the observed higher prevalence of child and maternal undernutrition amongst tribal communities are listed in Box 4.3.
Box 4.3: Perceived reasons for the high levels undernutrition among children from tribal communities in Maharashtra • Cultural customs and superstition• Early marriage and childbirth• Low birth spacing• High prevalence of low birthweight • Poor maternal health• Lack of maternal education• Low female decision-making autonomy• Unhealthy neonatal care practices/beliefs• Cultural dietary preferences that promote
undernutrition in mother and child • Lack of dietary diversity • High prevalence of anaemia
• Mothers’ early return to (agricultural) work after delivery
• Lack of public services/poor public services• Migration for work• Terrain (forested/hilly)• Poor livelihood options (mainly in agriculture)• Public service posts not filled/preference of
(good) public officials to work elsewhere• Lack of transport and communication
infrastructure• Poor hygiene practices• High levels of alcohol and tobacco consumption
78
These ranged from relatively broad views about the complex issues affecting areas in which large numbers of tribal people were living, to a perception that particular tribal cultural beliefs, superstitions and practices were at odds with appropriate childcare and feeding practices. Only a few noted that tribal communities in Maharashtra were very heterogeneous and that levels of undernutrition as well as the underlying reasons for undernutrition varied between communities. Others blamed more structural issues to do with Maharashtra’s economic and political geography.
Access to safe water and improved sanitation
Although some stakeholders praised the increasing access to safe water and improved sanitation in many parts of Maharashtra, several stressed that ‘there was still much work to be done’. Challenges on the ground are not only lack of access to water and sanitation and poor and irregular maintenance, but also the need for behavioural change. Two interviewees described the reluctance of some families to use the new sanitation facilities and the continued preference in some areas for open defecation.
The new challenge: Urban undernutrition
High levels of undernutrition among urban children were perceived as an increasing challenge by several stakeholders. Children in households that recently migrated to urban settings were described as particularly vulnerable to undernutrition as noted by one stakeholder:
So the people who are being there in urban areas for a long time would be better off and access better services [compared with people who recently migrated to urban areas]. You know we have a lot of urban poverty but these are people coming into urban areas. They are coming to urban areas, they come from lonely areas, they have not yet got jobs, they are not settled, they have nothing.
4.3 Conclusions, reflections and implications
This paper has focused on the perceptions of a wide range of stakeholders of the driving forces behind the decline in childhood stunting in the state of Maharashtra in the period between 2006 and 2012. All stakeholders chose to list a multiplicity of potential factors explaining this decline. Some linked the progress to wider developments in the state – including but not limited to economic growth, the increased access to information due to increasing media expansion, increased female empowerment, and the role of government social and health programmes. Such evidence is consistent with the Indian and global evidence on drivers of undernutrition reduction (Headey 2013).
Beyond these factors, the majority of informants were able to talk at length on the role of the state’s Nutrition Mission and the contribution of other sectors – predominantly health. A number of important points have been made in this stakeholder-led analysis of the governance and political economy of such endeavours, which resonate with the nutrition governance literature on issues such as leadership, horizontal and vertical coordination, overall capacity, political will and commitment, the role of the media and civil society (Gillespie et al. 2013; Mejia Acosta and Fanzo 2012).
What follows is the assessment of the research team of the credibility and plausibility of this evidence. Further reflection on this evidence is undertaken in the overview chapter in the light of the quantitative data examined in the accompanying chapters.
While this evidence must be clearly understood within the limitations of a study including a large number of those connected with the key activities undertaken by the Nutrition Mission and in related sectors such as health, there was a strong enough narrative consistency between a number of interviewees – both connected with and external to the Mission – to establish the credibility of a number of claims as follows. A number of these are also backed up by documentary evidence or established events in the past decade.

79
Whatever the drivers of political will for the state’s focus on undernutrition, the state can be seen to be exhibiting clear political will to tackle undernutrition – particularly when compared to other Indian states or India as a whole. If nothing else this is demonstrated not only by the existence of the Nutrition Mission, but also by the decision to back the 2012 CNSM survey and to open the results (and in this project’s case the raw data) to public inspection.
This political will has both enabled and supported the role of senior bureaucrats to innovate and lead the Nutrition Mission in its two phases. The innovation and skill displayed in the various endeavours of the Mission and related activities in health and the ICDS, when considered alongside external commentary and the team’s own opinion formed during the interviews, speak to a considerable level of bureaucratic competence, leadership and interpersonal abilities. Bureaucrats and senior politicians, including the Chief Minister, showed a willingness to collect and engage with nutrition evidence and data that are all too often ignored in similar policy circumstances. The circulation of key and competent personnel between positions in health, DWCD/ICDS and the Mission are also credible factors that may explain the successes in intersectoral coordination between the Mission/ICDS and health, supported by the system of committees that gave the Mission some leverage over the wider direction of nutrition policy in the state.
Externally, it is also credible that media attention and the role of skilled, committed and strong-willed civil society determined to bring child deaths to public attention, combined with a supportive external environment (i.e. the support of UNICEF), might have played a role in creating and maintaining the political will and driving this leadership.
Beyond these factors, in the research team’s opinion, there are a number of plausible factors that are impossible to verify to any extent (such as senior bureaucrats’ willingness to get out into the field and motivate ground-level staff – there is no reason to doubt such a claim, but it is impossible to verify to what extent this was carried out or what impact it had on the ground). Establishing the veracity of a number of further explanations fall out of the scope of this study’s methodology. This category includes the overall impact of any of the activities on overall statewide declines in stunting; the extent to which data quality or programme coverage improved as a result of the Nutrition Mission’s activities or other initiatives; the impact of the CDCs and VCDS on rates of underweight; SAM and MAM and the levels of knowledge and motivation of frontline staff; or community participation. In the accompanying chapters the weight of quantitative and qualitative evidence for the multiplicity of possible explanations for the stunting decline is considered in more detail.
The role and position of tribal communities in Maharashtra – commonly (and sometimes pejoratively) referred to as ‘tribals’, bear special mention. The perceptions of challenges stemming from or facing tribal communities and listed in Box 4.3 are numerous. A few who had worked substantially in these areas demonstrated a wide knowledge of these challenges. Only a few interviewees pointed out that the different tribal groups and communities are highly heterogeneous. Simple perceptions and solutions to any perceived ‘tribal problem’ must be treated with extreme caution. With the remaining high levels and pockets of undernutrition in these areas considered by most people as one of the most challenging problems to deal with in a future phase of government initiatives, further thought may be needed on how the multiplicity of problems facing these communities are framed and dealt with collectively in the first place.
Alongside these issues a number of problems face the current Nutrition Mission and any future initiatives. The list of new central and state initiatives in health, nutrition and related sectors are numerous and, as they multiply, the considerable challenge of intersectoral coordination will increase commensurately. The model of the Mission itself has encouraged such innovation but with such a small staff and such a multiplication of initiatives, at one point there may be need for consolidation and the revisiting (and proper evaluation) of the activities earlier considered successful (including, for example, refresher training of AWWs) for the effects to be sustainable. And yet at the same time, with water, sanitation and hygiene only thinly mentioned in our interviews, there seems potential for yet more intersectoral cooperation. With the 2015 end

80
of the Mission’s second phase approaching, a decision will need to be taken before long on the sustainability of the model, including its independence as a bureaucratic unit and its future direction. The phase between the incumbent DG and the first DG was seen by at least a couple of informants as a lost or stagnant period in the Mission’s functioning and so every effort must be undertaken to sustain the momentum in future.
81
ReferencesArulampalan, W.; Bhaskar, A. and N. Srivasta (2012) Does Greater Autonomy among Women Provide the Key to Better Child Nutrition? Working Paper, Warwick, UK: University of Warwick
Besley, T.; Burgess, R. and Esteve-Volart, B. (eds) (2007) ‘The Policy Origins of Poverty and Growth in India’, in T. Besley, R. Burgess and B. Esteve-Volart (eds), Delivering on the Promise of Pro-Poor Growth, Washington, DC: World Bank
Bhutta, Z.A.; Das, Jai K.; Rizvi, A.; Gaffey, M.F.; Walker, N.; Horton, S.; Webb, P.; Lartey, A. and Black, R.E. (2013) ‘Evidence-based Interventions for Improvement of Maternal and Child Nutrition: What Can be Done and At What Cost?’, The Lancet 382.9890: 452–77
Black, R.E.; Victora, C.G.; Walker, S.P.; Bhutta, Z.A.; Christian, P.; de Onis, M.; Ezzati, M. et al. (2013) ‘Maternal and Child Undernutrition and Overweight in Low-Income and Middle-Income Countries’, The Lancet 382.9890: 427–51
Centre for Budget and Governance Accountability (n.d.) ‘Transparency in State Budgets in India (Maharashtra)’, www.cbgaindia.org/files/policy_briefs/Maharashtra.pdf
Directorate of Economics and Statistics. Planning Department, Government of Maharashtra, Mumbai (2012 -13) Economic Survey of Maharashtra.
Gillespie, S.; Haddad, L.; Mannar, V.; Menon, P. and Nisbett, N. (2013) ‘The Politics of Reducing Malnutrition: Building Commitment and Accelerating Progress’, The Lancet 382.9891: 552–69
Haddad, L. (2012) ‘How Can We Build an Enabling Political Environment to Fight Undernutriton?’, European Journal of Development Research 25.1: 13–20
Headey, D.D. (2013) ‘Developmental Drivers of Nutritional Change: A Cross-Country Analysis’, World Development, 42.0: 76-88, doi: http://dx.doi.org/10.1016/j.worlddev.2012.07.002 (accessed 15 May 2014)
IIPS (International Institute for Population Sciences) (2013) Comprehensive Nutrition Survey of Maharashtra Report (CNSM), Mumbai: IIPS
IIPS (International Institute for Population Sciences) and Macro International (2007) National Family Health Survey (NFHS-3), 2005–6: India, Mumbai: IIPS
India Human Development Report (2011) Towards Social Inclusion, New Delhi: Oxford University Press, prepared by Institute of Applied Manpower Research, Government of India
Jha, P.; Kesler, M.A; Kumar, R.; Ram, F.l; Ram, U.; Aleksandrowicz, L.; Bassani, D.G.; Chandra, S. and Banthia, J.K. (2011) ‘Trends in Selective Abortions of Girls in India: Analysis of Nationally Representative Birth Histories from 1990 to 2005 and Census Data from 1991 to 2011’, The Lancet 377.9781: 1921–28
Khera R. (2011) ‘Trends in Diversion of Grain from the Public Distribution System’, Economic and Political Weekly xlvi.21, www.righttofoodindia.org/data/pds/May_2011_trends_diversion_grain_from_pds.pdf (accessed 28 May 2014)
Kumar, N. (2011) ‘Status of Women and Economic Development: A Decadal Analysis Based on Indian States’, indiastat.com, Lucknow: Giri Institute of Development Studies

82
Malnutrition Monitoring Committee (2012) Final Report and Recommendations – Malnutrition Monitoring Committee 2007–2012, www.maha-arogya.gov.in/Malnutrition/Absolutely%20Final%20report%20Malnutrition%20492012.pdf (accessed 21 May 2014)
Mejia Acosta, A. and Fanzo, J. (2012) Fighting Maternal and Child Malnutrition: Analysing the Political and Institutional Determinants of Delivering a National Multisectoral Response in Six Countries, a Synthesis Paper, Brighton: IDS
Menon, P. (2012) ‘Childhood Undernutrition in South Asia: Perspectives from the Field of Nutrition’, CESifo Economic Studies 58.2: 274–95
Mohmand, S. (2012) Analysing Nutrition Governance: India Country Report, Brighton: IDS, www.ids.ac.uk/idsproject/analysing-nutrition-governance (accessed 15 May 2014)
Mundle, S.; Chakraborty, P.; Chowdhury, S. and Sikdar, S. (2012) The Quality of Governance: How Have Indian States Performed?, NIPFP Working Paper 2012–2004, Delhi: National Institute of Public Finance and Policy
Naandi Foundation (2011) The HUNGaMA Survey Report – 2011, www.naandi.org/CP/HungamaBKDec11LR.pdf (accessed 15 May 2014)
Narwal, R. and Gram, L. (2013) ‘Has the Rate of Reduction in Infant Mortality Increased in India Since the Launch of National Rural Health Mission? Analysis of Time Trends 2000–2009 with Projection to 2015’, International Journal of MCH and AIDS 2.1: 139–52
PEEP (Public Evaluation of Entitlement Programmes) (2013) ‘Survey of Food Security Schemes in Dhadgaon, Nandurbar’, http://web.iitd.ac.in/~reetika/Preliminary per cent20Field per cent20Reports/Maharashtra/Report per cent20- per cent20Dhadgaon.pdf (accessed 15 May 2014)
Prinja, S.; Thakur, J.S. and Bhatia, S.S. (2009) ‘Pilot Testing of WHO Child Growth Standards in Chandigarh: Implications for India’s Child Health Programmes’, Bulletin of the World Health Organization 87: 116–22
Ramani, V. (2011) Making a Difference – The Mission Approach to Reducing Child Malnutrition: The Experience of the Rajmata Jijau Mother-Child Health and Nutrition Mission, Aurangabad (2005–2010), Aurangabad: Rajmata Jijau Mother-Child Health and Nutrition Mission
Reserve Bank of India (2013) ‘State Finances. A Study of Budgets of 2010-11’, http://rbidocs.rbi.org.in/rdocs/Publications/PDFs/00SF090113FUL.pdf (accessed 28 May 2014)
Sardeshpande, N.; Abhay, S. and Scott, K. (eds) (2009) Nutritional Crisis in Maharashtra, report prepared by SATHI (Society for Assistance to Children in Difficult Situation) for Maharashtra Health Equity and Rights Watch
Shiffman, J. (2010) ‘Issue Attention in Global Health: The Case of Newborn Survival’, The Lancet 375.9730: 2045–49
Shiffman, J. and Smith, S. (2007) ‘Generation of Political Priority for Global Health Initiatives: A Framework and Case Study of Maternal Mortality’, The Lancet 370: 1370–79
Smith, Lisa C. (ed.) (2003) The Importance of Women’s Status for Child Nutrition in Developing Countries, Research Report 131, Washington, DC: International Food Policy Research Institute
Smith, L. and Haddad, L. (2014) The Global Determinants of Stunting, forthcoming IDS Working Paper, Brighton: IDS
83
Stewart, R. and Moslares, C. (2012) ‘Income Inequality and Economic Growth: the case of Indian states 1980-2010’, Revista Cuadernos de EconomiÍa
UNICEF (United Nations Children’s Fund) (2013) Improving Child Nutrition. The Achievable Imperative for Global Progress, New York: UNICEF
UNICEF (United Nations Children’s Fund) (1990) Strategy for Improved Nutrition of Children and Women in Developing Countries, New York: Oxford University Press
Virmani, A. et al (2006) Governance in the Provision of Public Goods in South Asia Indian Council for Research on International Economic relations
WHO (2010) Indicators for Assessing Infant and Young Child Feeding Practices. Part II Measurement, Geneva: World Health Organisation
WHO Working Group (1986) ‘Use and Interpretation of Anthropometric Indicators of Nutritional Status’, Bulletin of the World Health Organization 64: 924–41
World Financial Review, Corruption in India, www.worldfinancialreview.com/?p=1575 (accessed 7 May 2014)
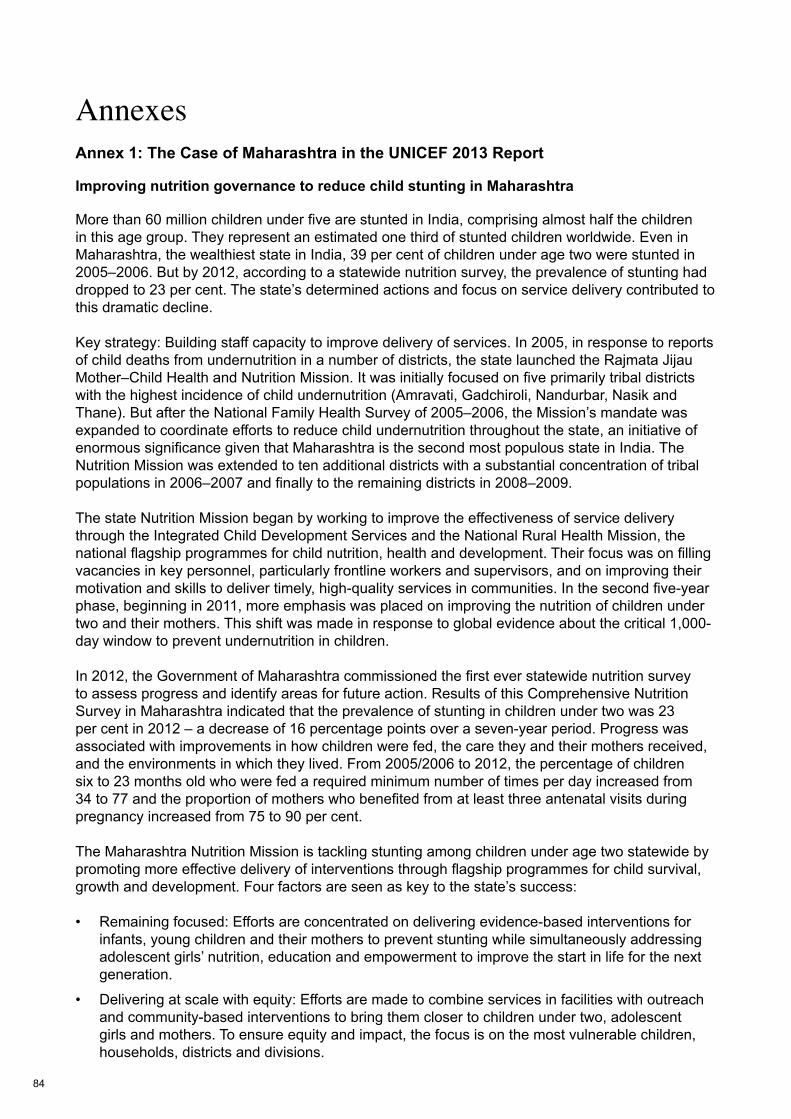
84
AnnexesAnnex 1: The Case of Maharashtra in the UNICEF 2013 Report
Improving nutrition governance to reduce child stunting in Maharashtra
More than 60 million children under five are stunted in India, comprising almost half the children in this age group. They represent an estimated one third of stunted children worldwide. Even in Maharashtra, the wealthiest state in India, 39 per cent of children under age two were stunted in 2005–2006. But by 2012, according to a statewide nutrition survey, the prevalence of stunting had dropped to 23 per cent. The state’s determined actions and focus on service delivery contributed to this dramatic decline.
Key strategy: Building staff capacity to improve delivery of services. In 2005, in response to reports of child deaths from undernutrition in a number of districts, the state launched the Rajmata Jijau Mother–Child Health and Nutrition Mission. It was initially focused on five primarily tribal districts with the highest incidence of child undernutrition (Amravati, Gadchiroli, Nandurbar, Nasik and Thane). But after the National Family Health Survey of 2005–2006, the Mission’s mandate was expanded to coordinate efforts to reduce child undernutrition throughout the state, an initiative of enormous significance given that Maharashtra is the second most populous state in India. The Nutrition Mission was extended to ten additional districts with a substantial concentration of tribal populations in 2006–2007 and finally to the remaining districts in 2008–2009.
The state Nutrition Mission began by working to improve the effectiveness of service delivery through the Integrated Child Development Services and the National Rural Health Mission, the national flagship programmes for child nutrition, health and development. Their focus was on filling vacancies in key personnel, particularly frontline workers and supervisors, and on improving their motivation and skills to deliver timely, high-quality services in communities. In the second five-year phase, beginning in 2011, more emphasis was placed on improving the nutrition of children under two and their mothers. This shift was made in response to global evidence about the critical 1,000-day window to prevent undernutrition in children.
In 2012, the Government of Maharashtra commissioned the first ever statewide nutrition survey to assess progress and identify areas for future action. Results of this Comprehensive Nutrition Survey in Maharashtra indicated that the prevalence of stunting in children under two was 23 per cent in 2012 – a decrease of 16 percentage points over a seven-year period. Progress was associated with improvements in how children were fed, the care they and their mothers received, and the environments in which they lived. From 2005/2006 to 2012, the percentage of children six to 23 months old who were fed a required minimum number of times per day increased from 34 to 77 and the proportion of mothers who benefited from at least three antenatal visits during pregnancy increased from 75 to 90 per cent.
The Maharashtra Nutrition Mission is tackling stunting among children under age two statewide by promoting more effective delivery of interventions through flagship programmes for child survival, growth and development. Four factors are seen as key to the state’s success:
• Remaining focused: Efforts are concentrated on delivering evidence-based interventions for infants, young children and their mothers to prevent stunting while simultaneously addressing adolescent girls’ nutrition, education and empowerment to improve the start in life for the next generation.
• Delivering at scale with equity: Efforts are made to combine services in facilities with outreach and community-based interventions to bring them closer to children under two, adolescent girls and mothers. To ensure equity and impact, the focus is on the most vulnerable children, households, districts and divisions.
85
• Improving children’s birthweight: The approach calls for monitoring pregnancy weight gain at every antenatal care visit and counselling and supporting mothers to gain adequate weight during pregnancy. In addition, all children are weighed at birth, and children born weighing below 2,500 grams are monitored to ensure they catch up.
• Coordinating and measuring for nutrition results across sectors: Planning and management are focused on nutrition results, and indicators of child nutrition are integrated across programmes and sectors. Another emphasis is on building strong monitoring and evaluation frameworks to measure programme performance.
Looking forward: The provisional results of the Maharashtra survey showed that in spite of more frequent meals, only 7 per cent of children 6–23 months old received a minimal acceptable diet in 2012.Too few children are being fed an adequately diverse diet rich in essential nutrients with the appropriate frequency to ensure their optimal physical growth and cognitive development. A statewide strategy to improve the quality of complementary foods and feeding and hygiene practices is essential to further reduce stunting levels and bring about far-reaching benefits.

86
Annex 2: How Maharashtra is Tackling Child Malnutrition
‘Tackling malnutrition: Nourishing the Future’, Business Today, January 2013, http://businesstoday.intoday.in/story/how-maharashtra-is-tackling-child-malnutrition/1/190744.html(accessed 6 May 2014)
Of course, it all began in Aurangabad. Despite the skeletal staff available for the initiative, V. Ramani, then Divisional Commissioner of Aurangabad, started providing children of Aurangabad district with vitamin A supplements and getting them dewormed regularly, and setting up nutrition care centres. ‘These were for children being treated for malnourishment at the hospitals and primary health centres’, says Ramani. ‘Here they got regular food and nutrition supplements for six months. Their mothers were also compensated for staying with them’.
Since such centres were expensive to maintain, a cheaper variant called ‘development centres’ were also started, located closer to the children’s homes. ‘These were places where parents could leave their malnourished children during the day and they would be given two-hourly nutrition’, adds Ramani. After the RJMCNM began, Ramani was made its first director and the same measures repeated on a larger scale.
To keep people informed of the improvement – or otherwise – in the nutritional levels of their children, the mission also set about preparing colour-coded graphs on large plastic sheets. During village communication meets, children were physically stretched out on the plastic sheets and their height and other vital statistics measured, so that parents could see for themselves the physical changes being recorded. Earlier, growth charts of children maintained by anganwadi (day care centre) workers had never been made public. ‘This helped communicate nutrition and its correlation to growth to the mothers. They could see why their children were being moved from the red zone to the green zone on the graph’, says Ramani.
A number of other states are set to replicate Maharashtra’s efforts. Gujarat has already done so, while Uttar Pradesh, Madhya Pradesh, Jharkhand and Orissa have shown interest in it. ‘The Mission’s achievement shows how data monitoring and a joining of hands by the bureaucracy, politicians and civil society can work wonders’, says Ramani. ‘We did not create any alternative machinery, just used the district apparatus and still achieved our goals’.
87
Annex 3: Maharashtra’s Malnutrition Miracle
From Jigyasa,http://jigyasa.swaniti.in/?portfolio=maharashtras-malnutrition-miracle (accessed 7 May 2014)
In 2006 Maharashtra ranked as one of the worst states affected by child malnutrition in India. With almost half of child population under the age of five suffering from stunted growth due to malnutrition the state was in distress. Maharashtra state government in collaboration with UNICEF changed this around. Since 2006 Maharashtra has almost halved the number of children suffering from malnutrition. How did Maharashtra make such huge strides in a limited time? What were the core policies adopted by the state government? What can other public leaders learn from this example? The goal of this ‘Big idea’ is to highlight how Maharashtra brought innovation to improve children’s healthcare outcomes.
Understanding the problem:
Nurse S was one of the many nurses who were employed by the state of Maharashtra to educate expecting mothers about how to take care of themselves and their babies. As part of her employment, Nurse S was responsible for talking about pre-natal care and reminding mothers-to-be about their regular intake of vitamins and folic acids. After a few months of classes, Nurse S reported a consistent observation: she noticed that many women were nervous about taking vitamins because they were afraid that the baby might become too big, eventually leading to a difficult delivery. She was surprised at how little the mothers-to-be knew about pre-natal care. Misinformation and weak understanding is one of the core issues that have led to poor nutrition outcome. Despite having higher economic standing, Maharashtra’s nutritional index is at par with Orissa and Bihar.
A comprehensive survey of the malnutrition revealed that because of a lack of information in the three different stages of utmost importance (during the pregnancy, immediately after childbirth and the subsequent first 1000 days of a child’s growth period) malnutrition has reached an alarming stage in the state. Increasingly, health experts have highlighted the importance of the time during pregnancy and the first 1000 days to ensure that the nutritional needs of a child are met. Thus the lack of knowledge and training in each of these phases, arguably, had resulted in stunted growth and chronic malnutrition in Maharashtra.
Malnutrition was a significant issue in Maharashtra that the state government, in partnership with external partners was able to reduce drastically within a few years.
Programs implemented:
Maharashtra’s success in halving malnutrition required various agencies to work together and fight malnutrition. Realizing that one of the major issues was a knowledge gap about how best to take care of nutritional needs, Maharashtra government focused on programs educating expecting mothers about childbirth and infants. The government recruited new staff and built capacity of existing program in the process. Following are some of the programs implemented by the government:
Village and Child Development Camps (VCDC): The VCDC programs focuses on educating women in how to take care of an infant by having Anganwadi workers hold knowledge camps and visit households. Previously there was little attention paid to the quality of service that Anganwadis were delivering to expecting mothers. However, the State government began to set standards on the number of visits and the quality of information disseminated. With quality and scale, there was an immediate improved notice on indicators such as the number of women who were breastfeeding within an hour of childbirth.

88
Nutritional Rehabilitation Center (NRC): NRC’s are centers focused on improving the nutritional status of severely malnourished children in the community. Often when parents find their infant suffering from diarrhea or other infectious diseases, it is because of poor nutritional standards that they are vulnerable to diseases. In which case, the NRC’s admit children and provide them with the right nutritional treatment thus improving their overall wellbeing. Maharashtra had setup six NRCs in tribal districts.
Pediatric services with a particular focus on vulnerable blocks: Previously, there was a poor availability of medical health practitioners, especially for new born, thus causing a dire health situation. In light of the malnutrition crisis, the state government had setup a system where Pediatricians were required to make two visits to ‘vulnerable’ blocks. The goal is to increase medical attention to poorer ideas.
Integrated Management of Newborn and Childhood illness: In order to provide adequate care immediately after birth, health workers are expected to visit mothers within 24 hours of delivery and subsequently thrice a week for follow-up care. For mothers needing more attention, health workers are expected to visit more frequently.
A successful program to combat malnutrition requires multiple partners and this was certainly true in Maharashtra where, in addition to the program mentioned above, there were multiple other agencies involved. From focusing on ensuring that there was an improved supply for clean drinking water to safe disposal of human waste, different agencies worked together to resolve issues that affect malnutrition.
What can we learn?
The following qualities made this a particularly successful public delivery program:
Different government agencies working in tandem
From the Women’s and Family welfare department to the Water and Sanitation Department, an exhaustive group of committed public servants came together (in addition to UNICEF) to strengthen and expand existing government service delivery program. Through regular meetings and communication, the agencies were able to work on different fronts to reduce malnutrition. In some cases, agencies were also streamlined to deliver programs. For example, the Navsanjivani scheme brought together the efforts focused on reducing efforts in tribal areas, under one nodal entity. Programs under this schemes included maintaining medical provision, checking water quality in pre-monsoon season and health check-up by anganwadi workers.
Building capacity
The Maharashtra State Government heavily recruited nurses, health workers and doctors, shortly after 2006 because the demand for healthcare services significantly exceeded the supply, especially for malnutrition. In addition to recruiting more professionals the Government also focused on training healthcare workers about how to efficiently fulfill their tasks. For example, Aganwaadi workers were underreporting malnutrition because they did not use the weighing machine correctly. After retraining the workers, malnutrition cases almost doubled.
Numbers behind policy decisions:
As different agencies came together in the Maharashtra government to assess the needs and solutions for malnutrition, their decisions were backed by the data collected through the National Health and Family Welfare survey. The data included metrics such as identifying which regions were most affected by malnutrition, which socio-economic demography required most attention and what was the existing state of healthcare for infants. Given that the survey provided detailed insight in to different regions along Maharashtra (in addition to demographic input) meant that the agencies were able to assess take a more informed program decision.

89
Annex 4: Background Set of Tables
Nutrition Outcomes
Nutrition outcomes - frequencies and percentage of children
Source: Author’s own.
Nutrition outcomes - percentage of children
Source: Author’s own.
2006 2012
No. % No. %
Underweight
Not underweight 808 70 1,866 77.3
Underweight 347 30 549 22.7
Total 1,155 100 2,414 100
Wasting
Not wasted 930 80.5 2,030 84.1
Wasted 225 19.5 384 15.9
Total 1,155 100 2,414 100
Stunting 2,006 2006 2,011 2012
Not stunted 704 60.9 1,843 76.3
Stunted 451 39.1 572 23.7
Total 1,155 100 2,414 100
Sample: Children aged 0-24 months
2006 2012 PP change
No. % No. % 2006-2012 Std.Error
Underweight 347 30.03 549 22.73 -7.30 1.66
Wasting 225 19.49 384 15.91 -3.58 1.43
Stunting 451 39.08 572 23.68 -15.40 1.70
Sample: Children aged 0-24 months
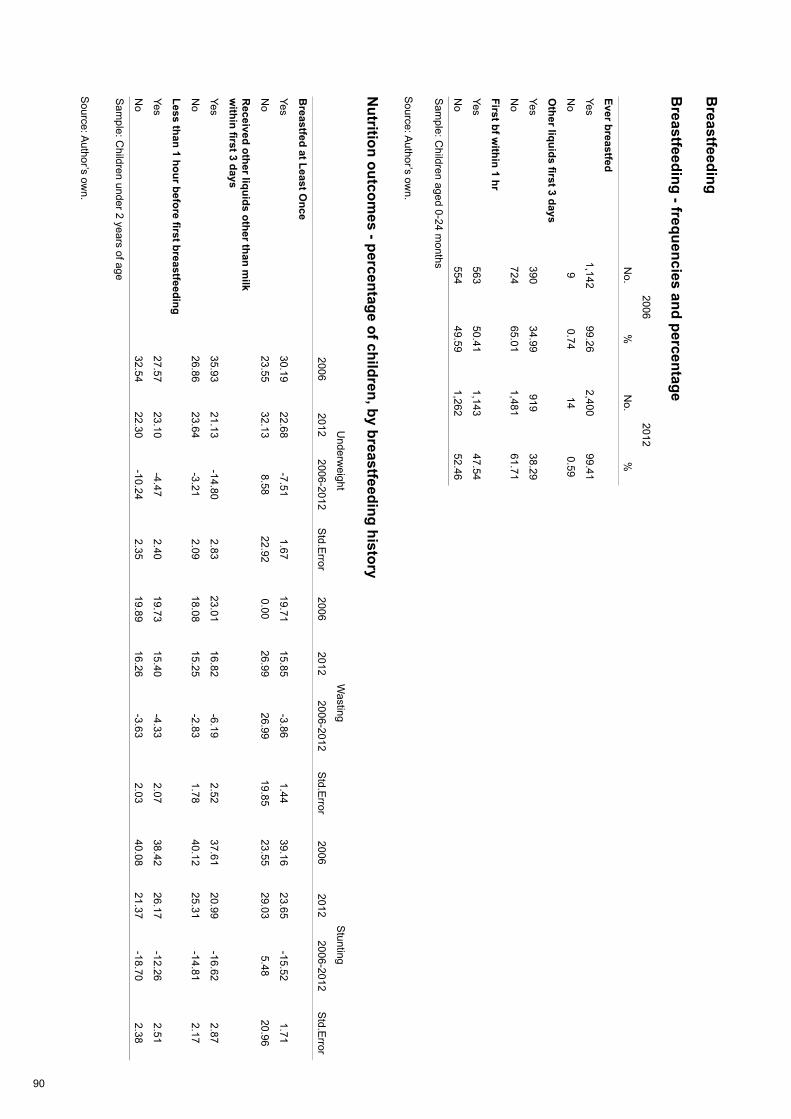
90
Breastfeeding
Breastfeeding - frequencies and percentage
Source: A
uthor’s own.
Nutrition outcom
es - percentage of children, by breastfeeding history
Source: A
uthor’s own.
2006 2012
N
o.%
No.
%
Ever breastfed
Ye s1,142
99.262,400
99.41
No
90.74
140.59
Other liquids first 3 days
Yes390
34.99919
38.29
No
72465.01
1,48161.71
First bf within 1 hr
Yes563
50.411,143
47.54
No
55449.59
1,26252.46
Sam
ple: Children aged 0-24 m
onths
Underw
eightW
astingS
tunting
2006
2012 2006-2012
Std.E
rror2006
2012 2006-2012
Std.E
rror2006
2012 2006-2012
Std.E
rror
Breastfed at Least O
nce
Yes30.19
22.68-7.51
1.6719.71
15.85-3.86
1.4439.16
23.65-15.52
1.71
No
23.5532.13
8.5822.92
0.0026.99
26.9919.85
23.5529.03
5.4820.96
Received other liquids other than m
ilk w
ithin first 3 days
Yes35.93
21.13-14.80
2.8323.01
16.82-6.19
2.5237.61
20.99-16.62
2.87
No
26.8623.64
-3.212.09
18.0815.25
-2.831.78
40.1225.31
-14.812.17
Less than 1 hour before first breastfeeding
Yes27.57
23.10-4.47
2.4019.73
15.40-4.33
2.0738.42
26.17-12.26
2.51
No
32.5422.30
-10.242.35
19.8916.26
-3.632.03
40.0821.37
-18.702.38
Sam
ple: Children under 2 years of age
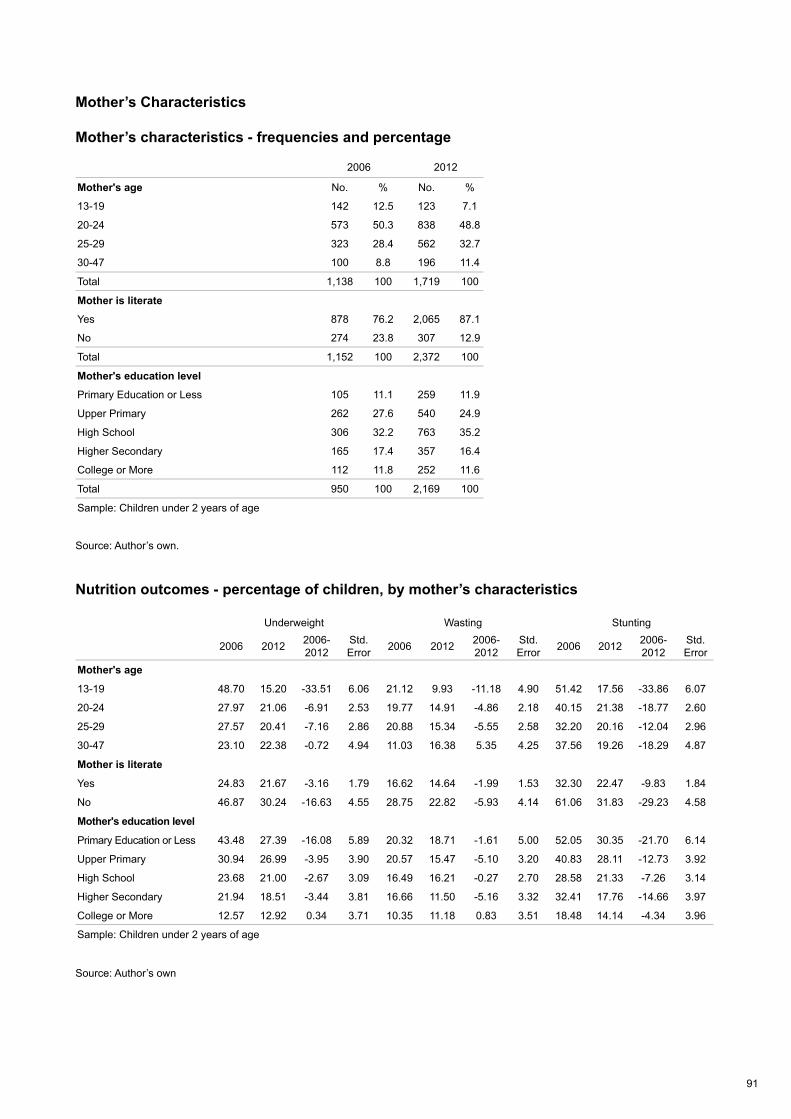
91
Mother’s Characteristics
Mother’s characteristics - frequencies and percentage
Source: Author’s own.
Nutrition outcomes - percentage of children, by mother’s characteristics
Source: Author’s own
2006 2012
Mother's age No. % No. %
13-19 142 12.5 123 7.1
20-24 573 50.3 838 48.8
25-29 323 28.4 562 32.7
30-47 100 8.8 196 11.4
Total 1,138 100 1,719 100
Mother is literate
Yes 878 76.2 2,065 87.1
No 274 23.8 307 12.9
Total 1,152 100 2,372 100
Mother's education level
Primary Education or Less 105 11.1 259 11.9
Upper Primary 262 27.6 540 24.9
High School 306 32.2 763 35.2
Higher Secondary 165 17.4 357 16.4
College or More 112 11.8 252 11.6
Total 950 100 2,169 100
Sample: Children under 2 years of age
Underweight Wasting Stunting
2006 2012 2006-2012
Std.Error 2006 2012 2006-
2012Std.Error 2006 2012 2006-
2012Std.Error
Mother's age
13-19 48.70 15.20 -33.51 6.06 21.12 9.93 -11.18 4.90 51.42 17.56 -33.86 6.07
20-24 27.97 21.06 -6.91 2.53 19.77 14.91 -4.86 2.18 40.15 21.38 -18.77 2.60
25-29 27.57 20.41 -7.16 2.86 20.88 15.34 -5.55 2.58 32.20 20.16 -12.04 2.96
30-47 23.10 22.38 -0.72 4.94 11.03 16.38 5.35 4.25 37.56 19.26 -18.29 4.87
Mother is literate
Yes 24.83 21.67 -3.16 1.79 16.62 14.64 -1.99 1.53 32.30 22.47 -9.83 1.84
No 46.87 30.24 -16.63 4.55 28.75 22.82 -5.93 4.14 61.06 31.83 -29.23 4.58
Mother's education level
Primary Education or Less 43.48 27.39 -16.08 5.89 20.32 18.71 -1.61 5.00 52.05 30.35 -21.70 6.14
Upper Primary 30.94 26.99 -3.95 3.90 20.57 15.47 -5.10 3.20 40.83 28.11 -12.73 3.92
High School 23.68 21.00 -2.67 3.09 16.49 16.21 -0.27 2.70 28.58 21.33 -7.26 3.14
Higher Secondary 21.94 18.51 -3.44 3.81 16.66 11.50 -5.16 3.32 32.41 17.76 -14.66 3.97
College or More 12.57 12.92 0.34 3.71 10.35 11.18 0.83 3.51 18.48 14.14 -4.34 3.96
Sample: Children under 2 years of age
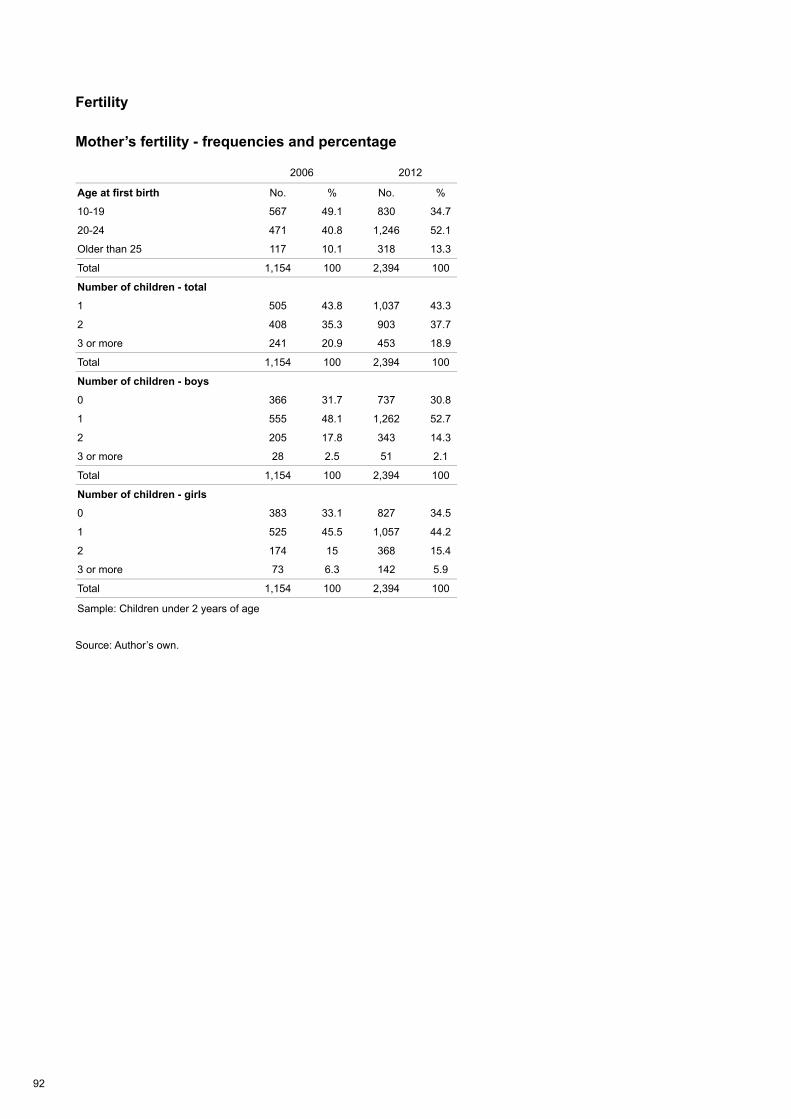
92
Fertility
Mother’s fertility - frequencies and percentage
Source: Author’s own.
2006 2012
Age at first birth No. % No. %
10-19 567 49.1 830 34.7
20-24 471 40.8 1,246 52.1
Older than 25 117 10.1 318 13.3
Total 1,154 100 2,394 100
Number of children - total
1 505 43.8 1,037 43.3
2 408 35.3 903 37.7
3 or more 241 20.9 453 18.9
Total 1,154 100 2,394 100
Number of children - boys
0 366 31.7 737 30.8
1 555 48.1 1,262 52.7
2 205 17.8 343 14.3
3 or more 28 2.5 51 2.1
Total 1,154 100 2,394 100
Number of children - girls
0 383 33.1 827 34.5
1 525 45.5 1,057 44.2
2 174 15 368 15.4
3 or more 73 6.3 142 5.9
Total 1,154 100 2,394 100
Sample: Children under 2 years of age
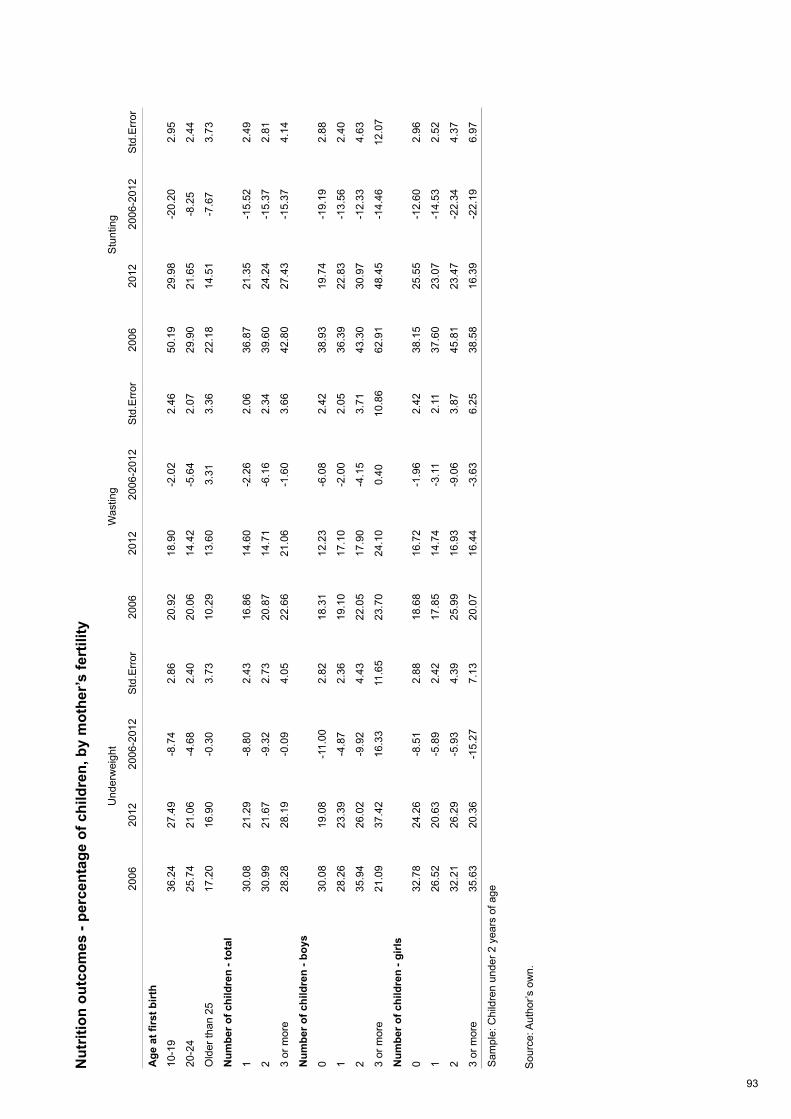
93
Nut
ritio
n ou
tcom
es -
perc
enta
ge o
f chi
ldre
n, b
y m
othe
r’s fe
rtili
ty
Sou
rce:
Aut
hor’s
ow
n.
Und
erw
eigh
tW
astin
g S
tunt
ing
20
06
2012
20
06-2
012
Std
.Err
or20
06
2012
20
06-2
012
Std
.Err
or20
06
2012
20
06-2
012
Std
.Err
or
Age
at fi
rst b
irth
10-1
936
.24
27.4
9-8
.74
2.86
20.9
218
.90
-2.0
22.
4650
.19
29.9
8-2
0.20
2.95
20-2
425
.74
21.0
6-4
.68
2.40
20.0
614
.42
-5.6
42.
0729
.90
21.6
5-8
.25
2.44
Old
er th
an 2
517
.20
16.9
0-0
.30
3.73
10.2
913
.60
3.31
3.36
22.1
814
.51
-7.6
73.
73
Num
ber o
f chi
ldre
n - t
otal
130
.08
21.2
9-8
.80
2.43
16.8
614
.60
-2.2
62.
0636
.87
21.3
5-1
5.52
2.49
230
.99
21.6
7-9
.32
2.73
20.8
714
.71
-6.1
62.
3439
.60
24.2
4-1
5.37
2.81
3 or
mor
e28
.28
28.1
9-0
.09
4.05
22.6
621
.06
-1.6
03.
6642
.80
27.4
3-1
5.37
4.14
Num
ber o
f chi
ldre
n - b
oys
030
.08
19.0
8-1
1.00
2.82
18.3
112
.23
-6.0
82.
4238
.93
19.7
4-1
9.19
2.88
128
.26
23.3
9-4
.87
2.36
19.1
017
.10
-2.0
02.
0536
.39
22.8
3-1
3.56
2.40
235
.94
26.0
2-9
.92
4.43
22.0
517
.90
-4.1
53.
7143
.30
30.9
7-1
2.33
4.63
3 or
mor
e21
.09
37.4
216
.33
11.6
523
.70
24.1
00.
4010
.86
62.9
148
.45
-14.
4612
.07
Num
ber o
f chi
ldre
n - g
irls
032
.78
24.2
6-8
.51
2.88
18.6
816
.72
-1.9
62.
4238
.15
25.5
5-1
2.60
2.96
126
.52
20.6
3-5
.89
2.42
17.8
514
.74
-3.1
12.
1137
.60
23.0
7-1
4.53
2.52
232
.21
26.2
9-5
.93
4.39
25.9
916
.93
-9.0
63.
8745
.81
23.4
7-2
2.34
4.37
3 or
mor
e35
.63
20.3
6-1
5.27
7.13
20.0
716
.44
-3.6
36.
2538
.58
16.3
9-2
2.19
6.97
Sam
ple:
Chi
ldre
n un
der 2
yea
rs o
f age
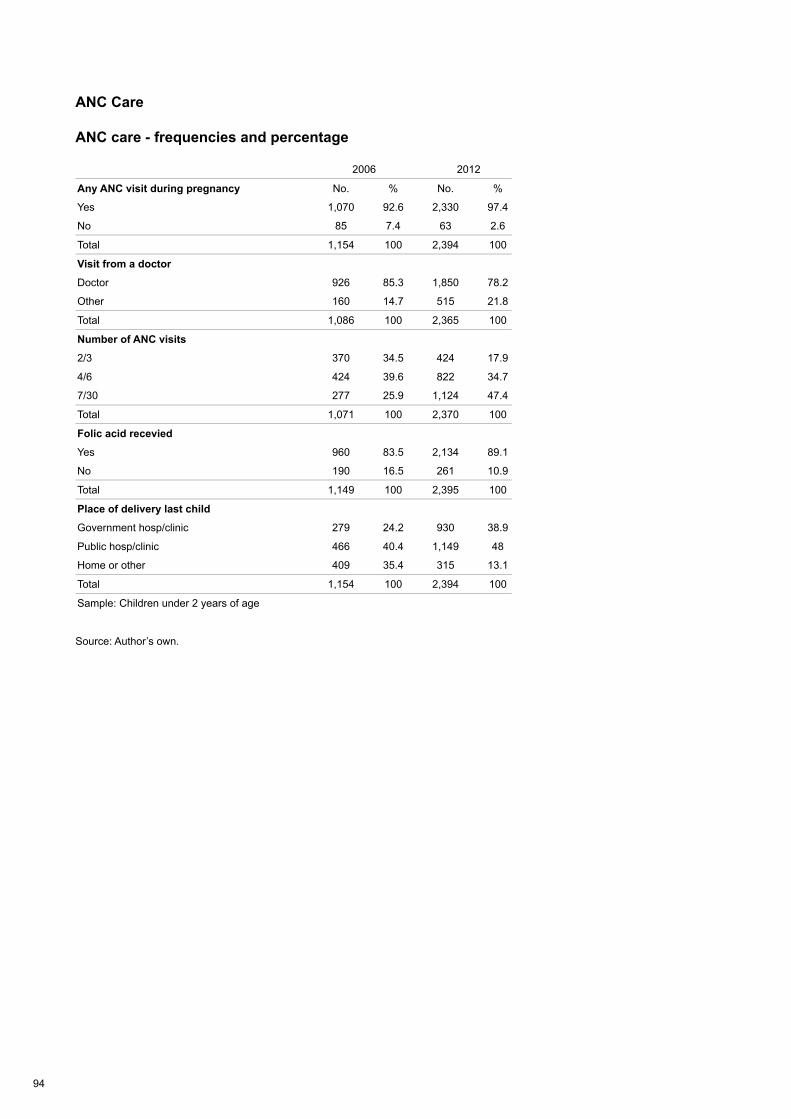
94
ANC Care
ANC care - frequencies and percentage
Source: Author’s own.
2006 2012
Any ANC visit during pregnancy No. % No. %
Yes 1,070 92.6 2,330 97.4
No 85 7.4 63 2.6
Total 1,154 100 2,394 100
Visit from a doctor
Doctor 926 85.3 1,850 78.2
Other 160 14.7 515 21.8
Total 1,086 100 2,365 100
Number of ANC visits
2/3 370 34.5 424 17.9
4/6 424 39.6 822 34.7
7/30 277 25.9 1,124 47.4
Total 1,071 100 2,370 100
Folic acid recevied
Yes 960 83.5 2,134 89.1
No 190 16.5 261 10.9
Total 1,149 100 2,395 100
Place of delivery last child
Government hosp/clinic 279 24.2 930 38.9
Public hosp/clinic 466 40.4 1,149 48
Home or other 409 35.4 315 13.1
Total 1,154 100 2,394 100
Sample: Children under 2 years of age
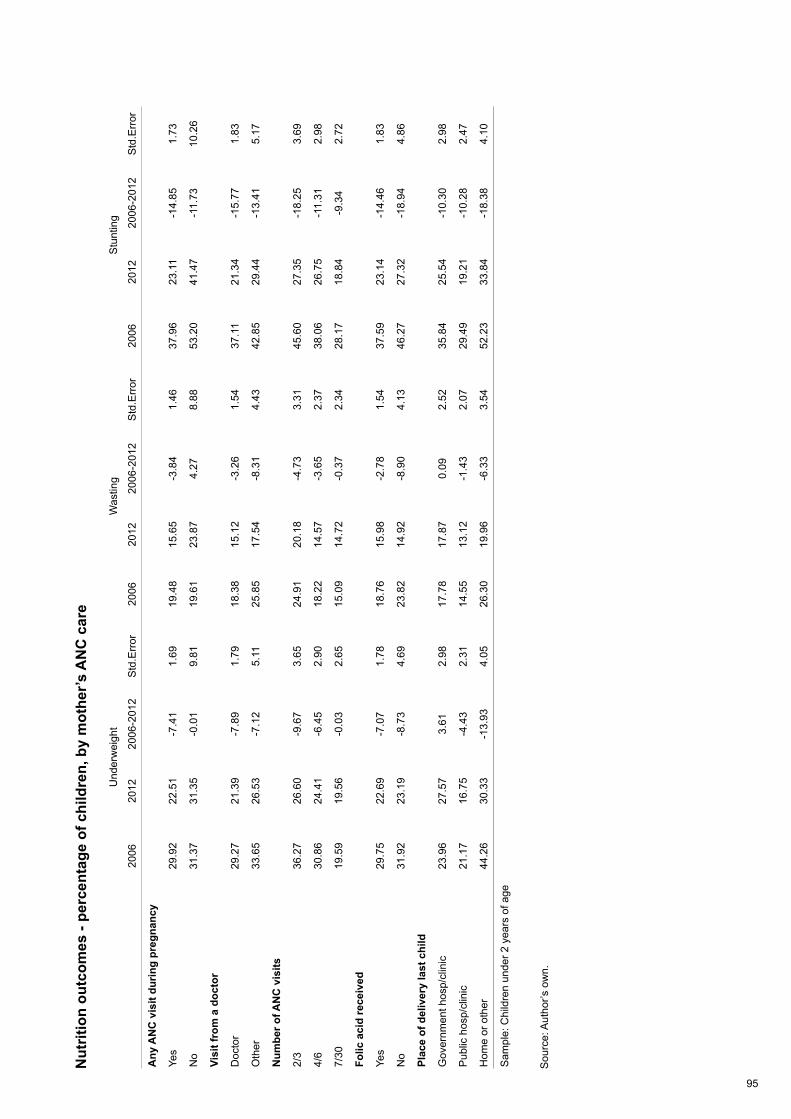
95
Nut
ritio
n ou
tcom
es -
perc
enta
ge o
f chi
ldre
n, b
y m
othe
r’s A
NC
car
e
Sou
rce:
Aut
hor’s
ow
n.
Und
erw
eigh
tW
astin
gS
tunt
ing
20
06
2012
20
06-2
012
Std
.Err
or20
06
2012
20
06-2
012
Std
.Err
or20
06
2012
20
06-2
012
Std
.Err
or
Any
AN
C v
isit
durin
g pr
egna
ncy
Yes
29.9
222
.51
-7.4
11.
6919
.48
15.6
5-3
.84
1.46
37.9
623
.11
-14.
851.
73
No
31.3
731
.35
-0.0
19.
8119
.61
23.8
74.
278.
8853
.20
41.4
7-1
1.73
10.2
6
Visi
t fro
m a
doc
tor
Doc
tor
29.2
721
.39
-7.8
91.
7918
.38
15.1
2-3
.26
1.54
37.1
121
.34
-15.
771.
83
Oth
er33
.65
26.5
3-7
.12
5.11
25.8
517
.54
-8.3
14.
4342
.85
29.4
4-1
3.41
5.17
Num
ber o
f AN
C v
isits
2/3
36.2
726
.60
-9.6
73.
6524
.91
20.1
8-4
.73
3.31
45.6
027
.35
-18.
253.
69
4/6
30.8
624
.41
-6.4
52.
9018
.22
14.5
7-3
.65
2.37
38.0
626
.75
-11.
312.
98
7/30
19.5
919
.56
-0.0
32.
6515
.09
14.7
2-0
.37
2.34
28.1
718
.84
-9.3
42.
72
Folic
aci
d re
ceiv
ed
Yes
29.7
522
.69
-7.0
71.
7818
.76
15.9
8-2
.78
1.54
37.5
923
.14
-14.
461.
83
No
31.9
223
.19
-8.7
34.
6923
.82
14.9
2-8
.90
4.13
46.2
727
.32
-18.
944.
86
Plac
e of
del
iver
y la
st c
hild
Gov
ernm
ent h
osp/
clin
ic23
.96
27.5
73.
612.
9817
.78
17.8
70.
092.
5235
.84
25.5
4-1
0.30
2.98
Pub
lic h
osp/
clin
ic21
.17
16.7
5-4
.43
2.31
14.5
513
.12
-1.4
32.
0729
.49
19.2
1-1
0.28
2.47
Hom
e or
oth
er44
.26
30.3
3-1
3.93
4.05
26.3
019
.96
-6.3
33.
5452
.23
33.8
4-1
8.38
4.10
Sam
ple:
Chi
ldre
n un
der 2
yea
rs o
f age
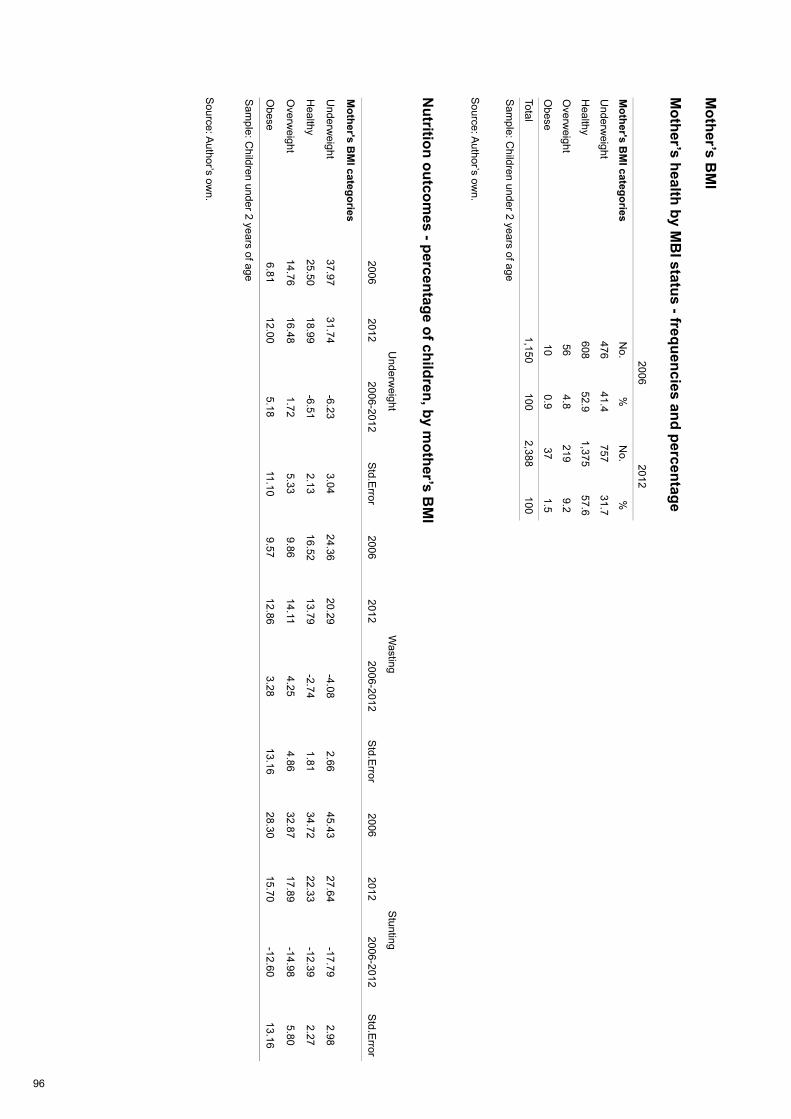
96
Mother’s B
MI
Mother’s health by M
BI status - frequencies and percentage
Source: A
uthor’s own.
Nutrition outcom
es - percentage of children, by mother’s B
MI
Source: A
uthor’s own.
2006
2012
Mother's B
MI categories
No.
%N
o.%
Underw
eight476
41.4757
31.7
Healthy
60852.9
1,37557.6
Overw
eight56
4.8219
9.2
Obese
100.9
371.5
Total1,150
1002,388
100
Sam
ple: Children under 2 years of age
Underw
eightW
astingS
tunting
2006
2012 2006-2012
Std.E
rror2006
2012 2006-2012
Std.E
rror2006
2012 2006-2012
Std.E
rror
Mother's B
MI categories
Underw
eight37.97
31.74-6.23
3.0424.36
20.29-4.08
2.6645.43
27.64-17.79
2.98
Healthy
25.5018.99
-6.512.13
16.5213.79
-2.741.81
34.7222.33
-12.392.27
Overw
eight14.76
16.481.72
5.339.86
14.1 14.25
4.8632.87
17.89-14.98
5.80
Obese
6.8112.00
5.1811.10
9.5712.86
3.2813.16
28.3015.70
-12.6013.16
Sam
ple: Children under 2 years of age
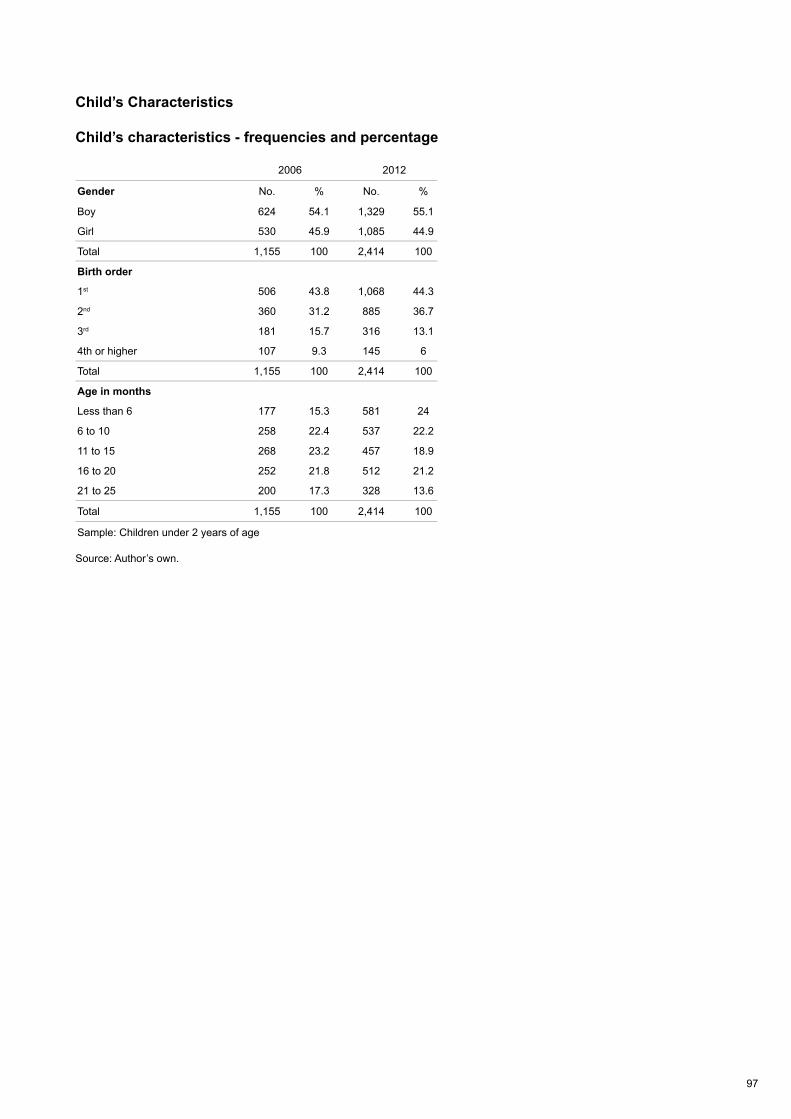
97
Child’s Characteristics
Child’s characteristics - frequencies and percentage
Source: Author’s own.
2006 2012
Gender No. % No. %
Boy 624 54.1 1,329 55.1
Girl 530 45.9 1,085 44.9
Total 1,155 100 2,414 100
Birth order
1st 506 43.8 1,068 44.3
2nd 360 31.2 885 36.7
3rd 181 15.7 316 13.1
4th or higher 107 9.3 145 6
Total 1,155 100 2,414 100
Age in months
Less than 6 177 15.3 581 24
6 to 10 258 22.4 537 22.2
11 to 15 268 23.2 457 18.9
16 to 20 252 21.8 512 21.2
21 to 25 200 17.3 328 13.6
Total 1,155 100 2,414 100
Sample: Children under 2 years of age
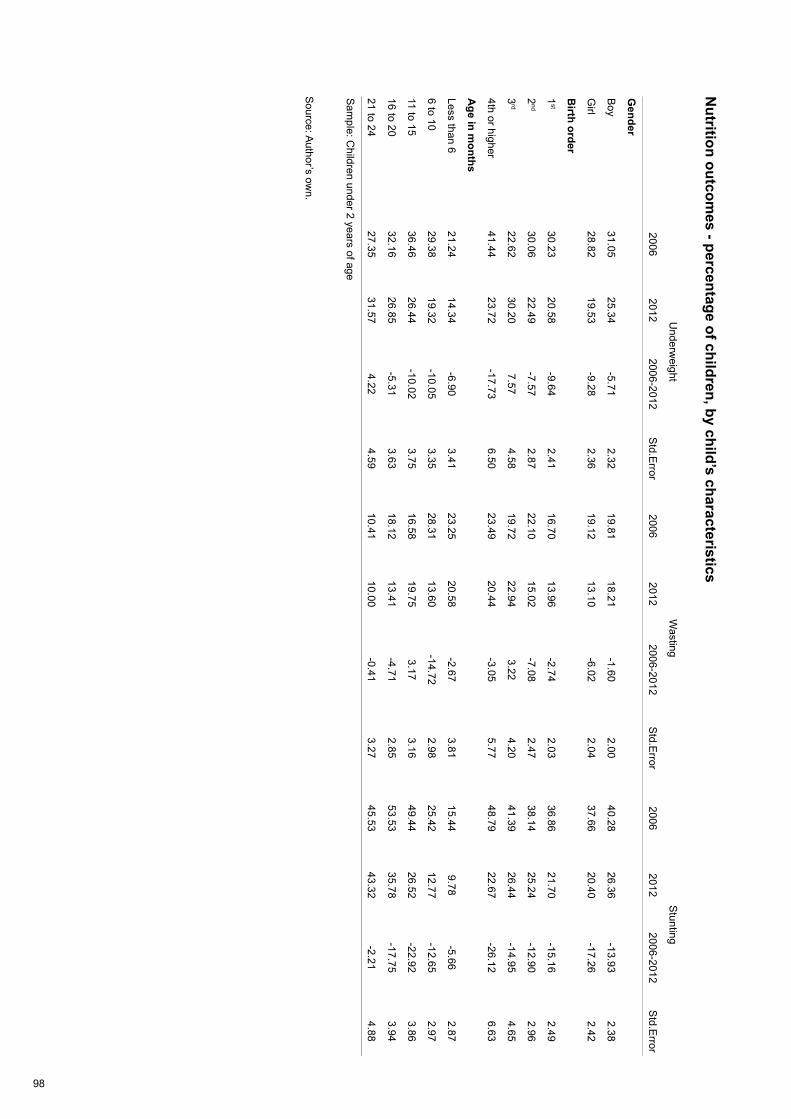
98
Nutrition outcom
es - percentage of children, by child’s characteristics
Source: A
uthor’s own.
Underw
eightW
astingS
tunting
2006
2012 2006-2012
Std.E
rror2006
2012 2006-2012
Std.E
rror2006
2012 2006-2012
Std.E
rror
Gender
Boy
31.0525.34
-5.712.32
19.8118.21
-1.602.00
40.2826.36
-13.932.38
Girl
28.8219.53
-9.282.36
19.1213.10
-6.022.04
37.6620.40
-17.262.42
Birth order
1st
30.2320.58
-9.642.41
16.7013.96
-2.742.03
36.8621.70
-15.162.49
2nd
30.0622.49
-7.572.87
22.1015.02
-7.082.47
38.1425.24
-12.902.96
3rd
22.6230.20
7.574.58
19.7222.94
3.224.20
41.3926.44
-14.954.65
4th or higher41.44
23.72-17.73
6.5023.49
20.44-3.05
5.7748.79
22.67-26.12
6.63
Age in m
onths
Less than 621.24
14.34-6.90
3.4123.25
20.58-2.67
3.8115.44
9.78-5.66
2.87
6 to 1029.38
19.32-10.05
3.3528.31
13.60-14.72
2.9825.42
12.77-12.65
2.97
11 to 1536.46
26.44-10.02
3.7516.58
19.753.17
3.1649.44
26.52-22.92
3.86
16 to 2032.16
26.85-5.31
3.6318.12
13.41-4.71
2.8553.53
35.78-17.75
3.94
21 to 2427.35
31.574.22
4.5910.41
10.00-0.41
3.2745.53
43.32-2.21
4.88
Sam
ple: Children under 2 years of age

99
Child’s Health
Child’s health - frequencies and percentage
Source: Author’s own.
2006 2012
Child Vaccinated No. % No. %
Yes 524 91.3 2,472 98
No 50 8.7 50 2
Total 574 100 2,522 100
Diagnosed with diarrhoea
Yes 164 14.2 663 27.5
No 989 85.8 1,752 72.5
Total 1,153 100 2,415 100
Vitamin A
Yes 617 55.4 1,114 46.9
No 497 44.6 1,260 53.1
Taking iron tablet
Yes 111 9.7 196 8.2
No 1,036 90.3 2,204 91.8
Total 1,147 100 2,400 100
Sample: Children under 2 years of age
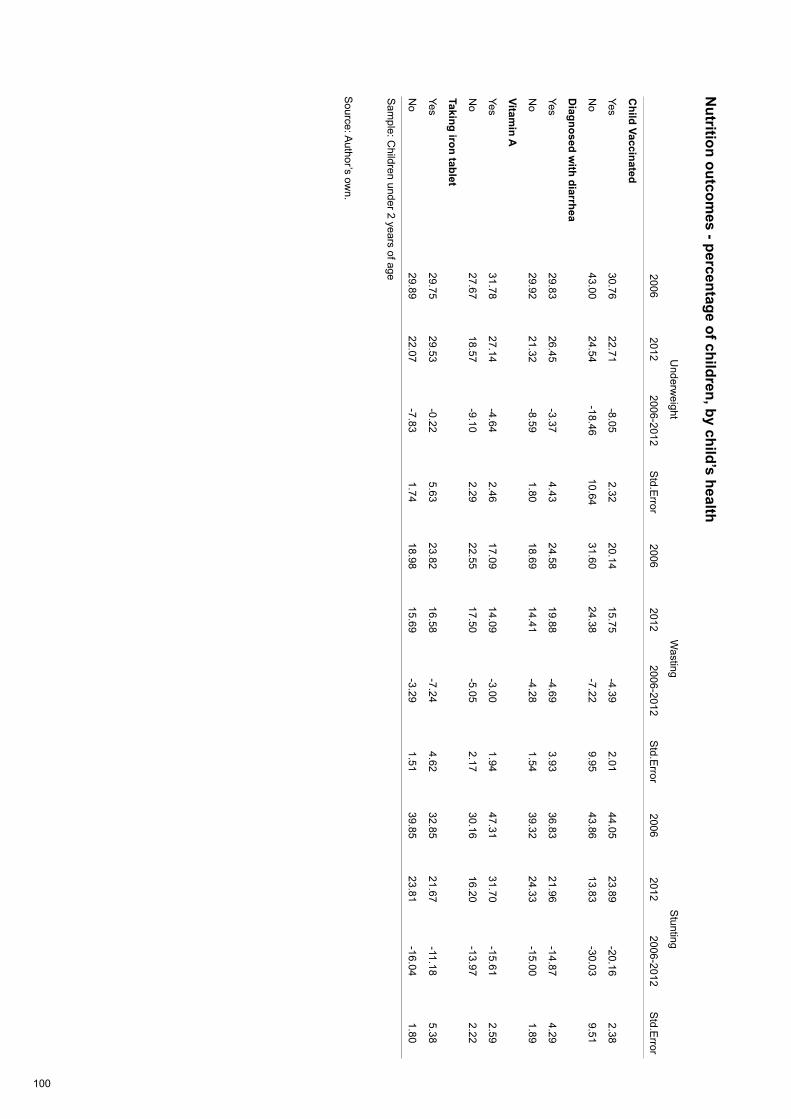
100
Nutrition outcom
es - percentage of children, by child’s health
Source: A
uthor’s own.
Underw
eightW
astingS
tunting
2006
2012 2006-2012
Std.E
rror2006
2012 2006-2012
Std.E
rror2006
2012 2006-2012
Std.E
rror
Child Vaccinated
Yes30.76
22.71-8.05
2.3220.14
15.75-4.39
2.0144.05
23.89-20.16
2.38
No
43.0024.54
-18.4610.64
31.6024.38
-7.229.95
43.8613.83
-30.039.51
Diagnosed w
ith diarrhea
Yes29.83
26.45-3.37
4.4324.58
19.88-4.69
3.9336.83
21.96-14.87
4.29
No
29.9221.32
-8.591.80
18.6914.41
-4.281.54
39.3224.33
-15.001.89
Vitamin A
Yes31.78
27.14-4.64
2.4617.09
14.09-3.00
1.9447.31
31.70-15.61
2.59
No
27.6718.57
-9.102.29
22.5517.50
-5.052.17
30.1616.20
-13.972.22
Taking iron tablet
Yes29.75
29.53-0.22
5.6323.82
16.58-7.24
4.6232.85
21.67-11.18
5.38
No
29.8922.07
-7.831.74
18.9815.69
-3.291.51
39.8523.81
-16.041.80
Sam
ple: Children under 2 years of age
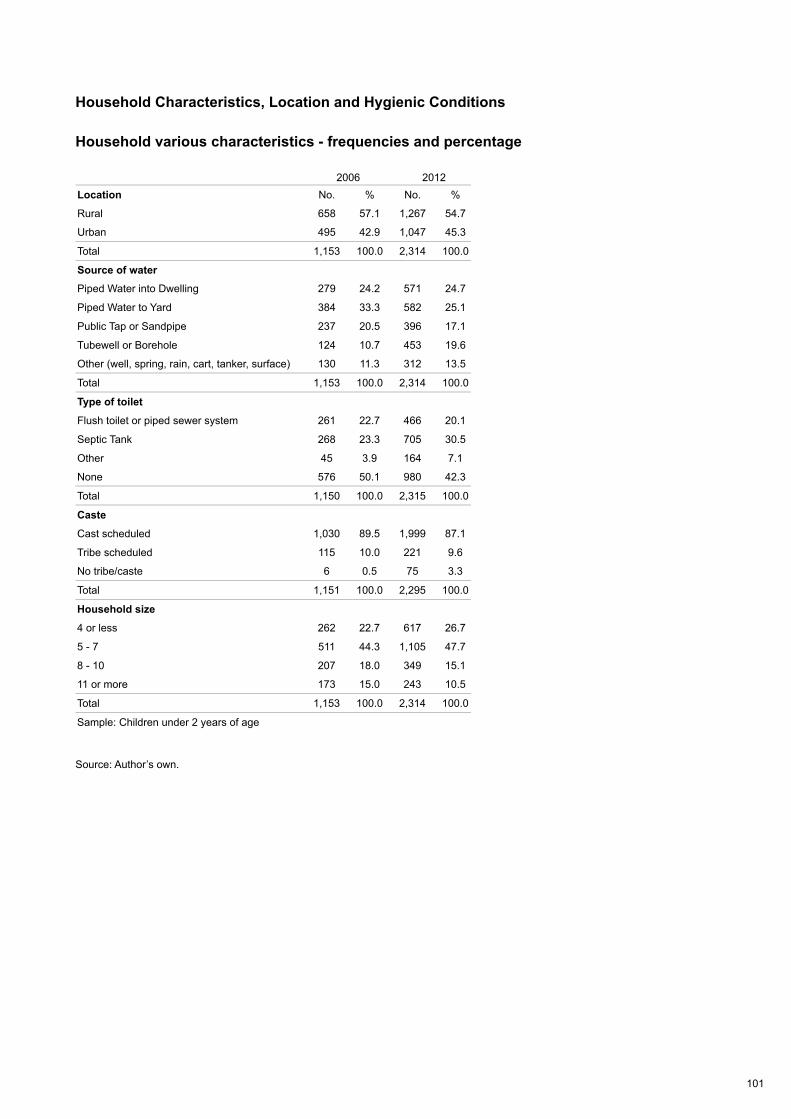
101
Household Characteristics, Location and Hygienic Conditions
Household various characteristics - frequencies and percentage
Source: Author’s own.
2006 2012Location No. % No. %
Rural 658 57.1 1,267 54.7
Urban 495 42.9 1,047 45.3
Total 1,153 100.0 2,314 100.0
Source of waterPiped Water into Dwelling 279 24.2 571 24.7
Piped Water to Yard 384 33.3 582 25.1
Public Tap or Sandpipe 237 20.5 396 17.1
Tubewell or Borehole 124 10.7 453 19.6
Other (well, spring, rain, cart, tanker, surface) 130 11.3 312 13.5
Total 1,153 100.0 2,314 100.0
Type of toilet
Flush toilet or piped sewer system 261 22.7 466 20.1
Septic Tank 268 23.3 705 30.5
Other 45 3.9 164 7.1
None 576 50.1 980 42.3
Total 1,150 100.0 2,315 100.0
Caste
Cast scheduled 1,030 89.5 1,999 87.1
Tribe scheduled 115 10.0 221 9.6
No tribe/caste 6 0.5 75 3.3
Total 1,151 100.0 2,295 100.0
Household size
4 or less 262 22.7 617 26.7
5 - 7 511 44.3 1,105 47.7
8 - 10 207 18.0 349 15.1
11 or more 173 15.0 243 10.5
Total 1,153 100.0 2,314 100.0
Sample: Children under 2 years of age
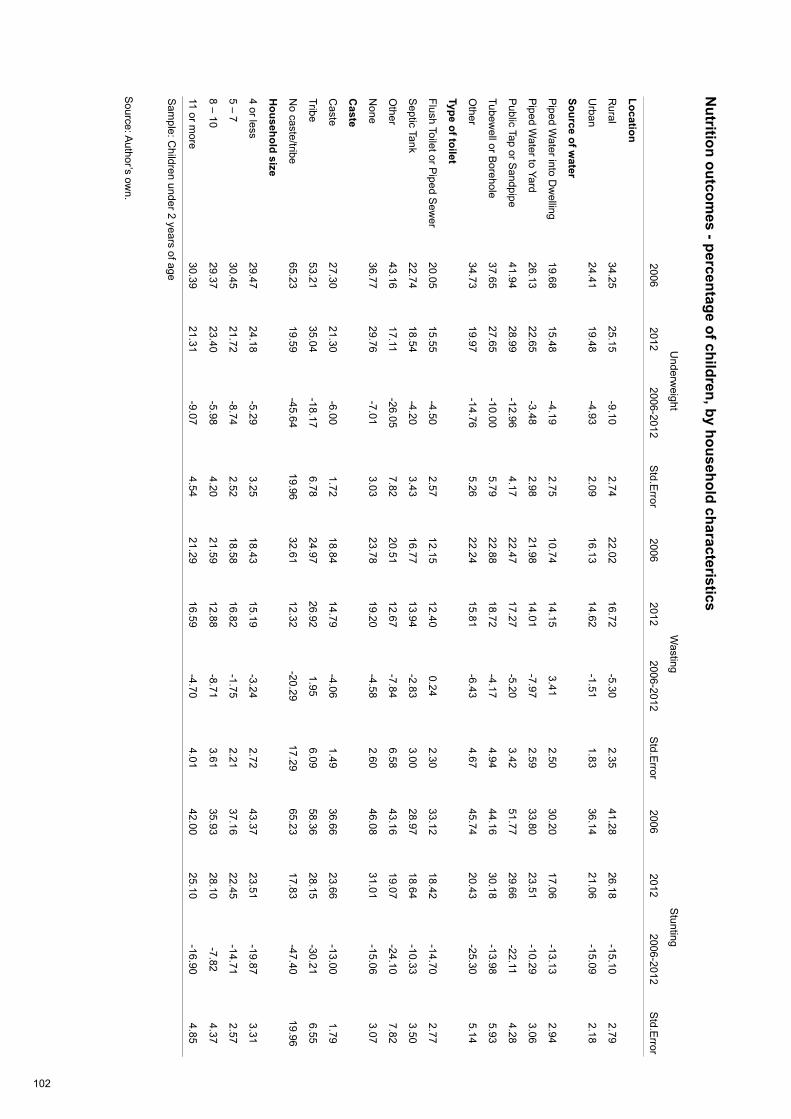
102
Nutrition outcom
es - percentage of children, by household characteristics
Source: A
uthor’s own.
Underw
eightW
astingS
tunting
2006
2012 2006-2012
Std.E
rror2006
2012 2006-2012
Std.E
rror2006
2012 2006-2012
Std.E
rror
Location
Rural
34.2525.15
-9.102.74
22.0216.72
-5.302.35
41.2826.18
-15.102.79
Urban
24.4119.48
-4.932.09
16.1314.62
-1.511.83
36.1421.06
-15.092.18
Source of water
Piped W
ater into Dw
elling19.68
15.48-4.19
2.7510.74
14.153.41
2.5030.20
17.06-13.13
2.94
Piped W
ater to Yard26.13
22.65-3.48
2.9821.98
14.01-7.97
2.5933.80
23.51-10.29
3.06
Public Tap or S
andpipe41.94
28.99-12.96
4.1722.47
17.27-5.20
3.4251.77
29.66-22.11
4.28
Tubewell or B
orehole37.65
27.65-10.00
5.7922.88
18.72-4.17
4.9444.16
30.18-13.98
5.93
Other
34.7319.97
-14.765.26
22.2415.81
-6.434.67
45.7420.43
-25.305.14
Type of toilet
Flush Toilet or Piped S
ewer
20.0515.55
-4.502.57
12.1512.40
0.242.30
33.1218.42
-14.702.77
Septic Tank
22.7418.54
-4.203.43
16.7713.94
-2.833.00
28.9718.64
-10.333.50
Other
43.1617.11
-26.057.82
20.5112.67
-7.846.58
43.1619.07
-24.107.82
None
36.7729.76
-7.013.03
23.7819.20
-4.582.60
46.0831.01
-15.063.07
Caste
Caste
27.3021.30
-6.001.72
18.8414.79
-4.061.49
36.6623.66
-13.001.79
Tribe53.21
35.04-18.17
6.7824.97
26.921.95
6.0958.36
28.15-30.21
6.55
No caste/tribe
65.2319.59
-45.6419.96
32.6112.32
-20.2917.29
65.2317.83
-47.4019.96
Household size
4 or less29.47
24.18-5.29
3.2518.43
15.19-3.24
2.7243.37
23.51-19.87
3.31
5 – 730.45
21.72-8.74
2.5218.58
16.82-1.75
2.2137.16
22.45-14.71
2.57
8 – 1029.37
23.40-5.98
4.2021.59
12.88-8.71
3.6135.93
28.10-7.82
4.37
11 or more
30.3921.31
-9.074.54
21.2916.59
-4.704.01
42.0025.10
-16.904.85
Sam
ple: Children under 2 years of age
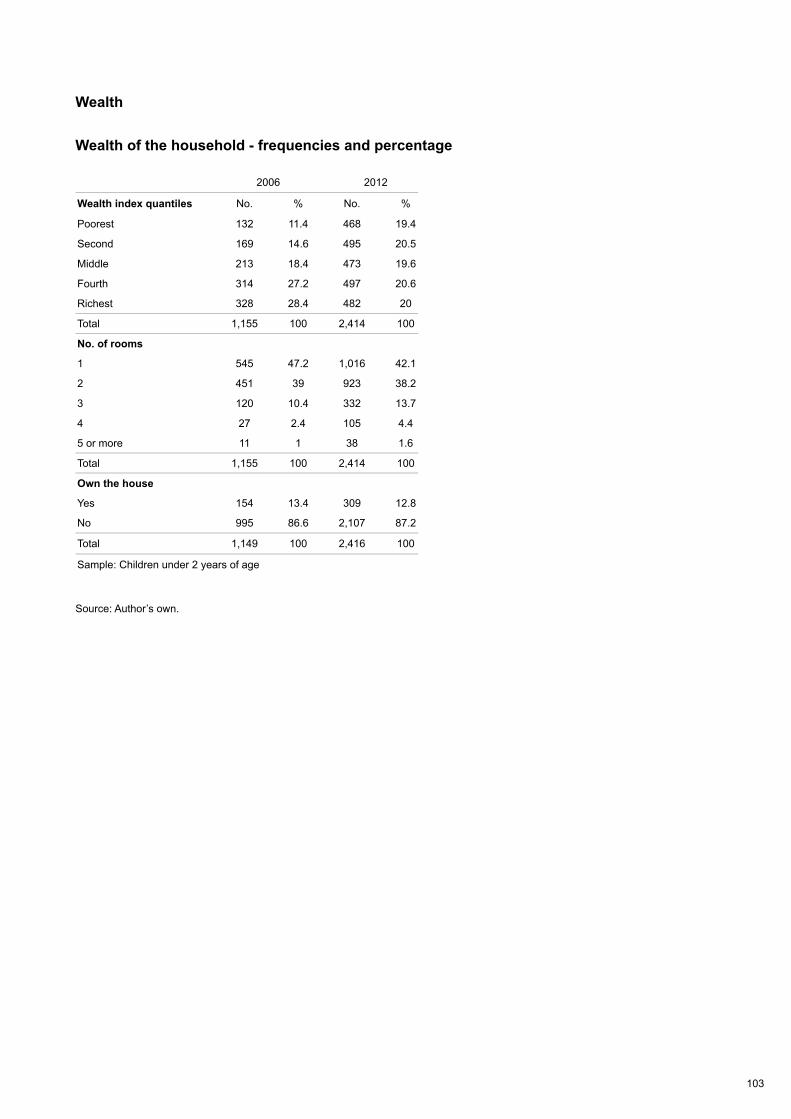
103
Wealth
Wealth of the household - frequencies and percentage
Source: Author’s own.
2006 2012
Wealth index quantiles No. % No. %
Poorest 132 11.4 468 19.4
Second 169 14.6 495 20.5
Middle 213 18.4 473 19.6
Fourth 314 27.2 497 20.6
Richest 328 28.4 482 20
Total 1,155 100 2,414 100
No. of rooms
1 545 47.2 1,016 42.1
2 451 39 923 38.2
3 120 10.4 332 13.7
4 27 2.4 105 4.4
5 or more 11 1 38 1.6
Total 1,155 100 2,414 100
Own the house
Yes 154 13.4 309 12.8
No 995 86.6 2,107 87.2
Total 1,149 100 2,416 100
Sample: Children under 2 years of age
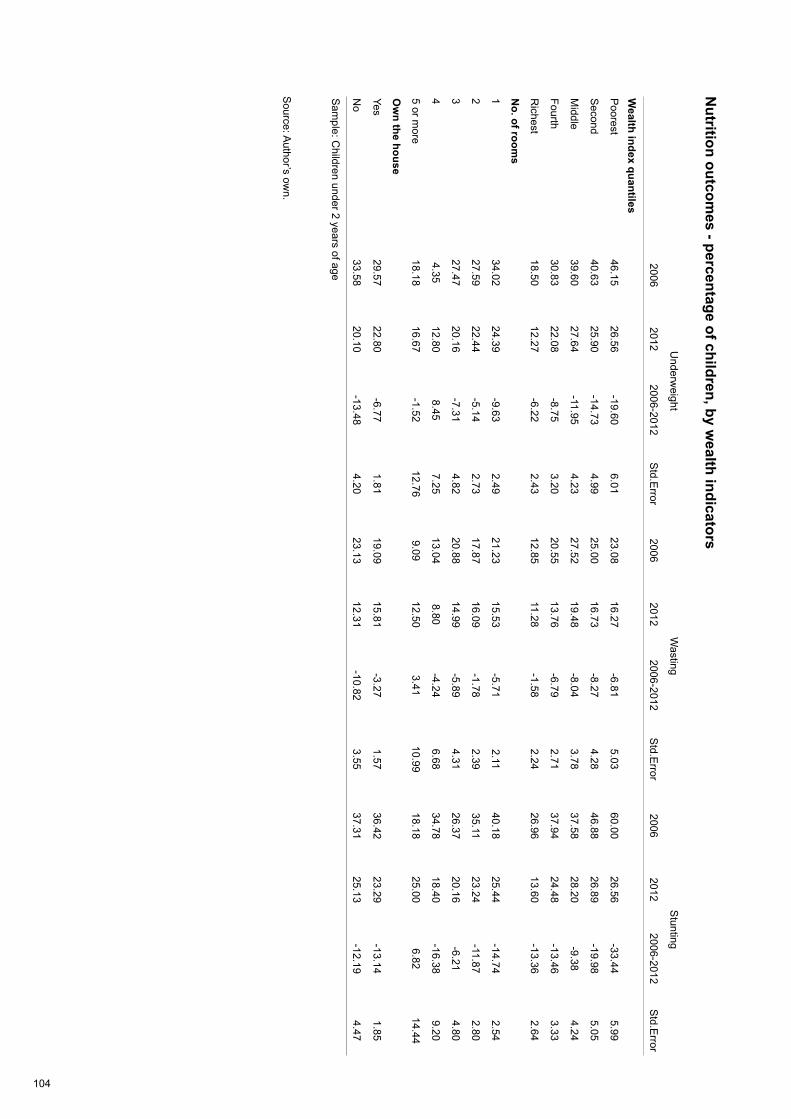
104
Nutrition outcom
es - percentage of children, by wealth indicators
Source: A
uthor’s own.
Underw
eightW
astingS
tunting
2006
2012 2006-2012
Std.E
rror2006
2012 2006-2012
Std.E
rror2006
2012 2006-2012
Std.E
rror
Wealth index quantiles
Poorest
46.1526.56
-19.606.01
23.0816.27
-6.815.03
60.0026.56
-33.445.99
Second
40.6325.90
-14.734.99
25.0016.73
-8.274.28
46.8826.89
-19.985.05
Middle
39.6027.64
-11.954.23
27.5219.48
-8.043.78
37.5828.20
-9.384.24
Fourth30.83
22.08-8.75
3.2020.55
13.76-6.79
2.7137.94
24.48-13.46
3.33
Richest
18.5012.27
-6.222.43
12.8511.28
-1.582.24
26.9613.60
-13.362.64
No. of room
s
134.02
24.39-9.63
2.4921.23
15.53-5.71
2.1140.18
25.44-14.74
2.54
227.59
22.44-5.14
2.7317.87
16.09-1.78
2.3935.11
23.24-11.87
2.80
327.47
20.16-7.31
4.8220.88
14.99-5.89
4.3126.37
20.16-6.21
4.80
44.35
12.808.45
7.2513.04
8.80-4.24
6.6834.78
18.40-16.38
9.20
5 or more
18.1816.67
-1.5212.76
9.0912.50
3.4110.99
18.1825.00
6.8214.44
Ow
n the house
Yes29.57
22.80-6.77
1.8119.09
15.81-3.27
1.5736.42
23.29-13.14
1.85
No
33.5820.10
-13.484.20
23.1312.31
-10.823.55
37.3125.13
-12.194.47
Sam
ple: Children under 2 years of age
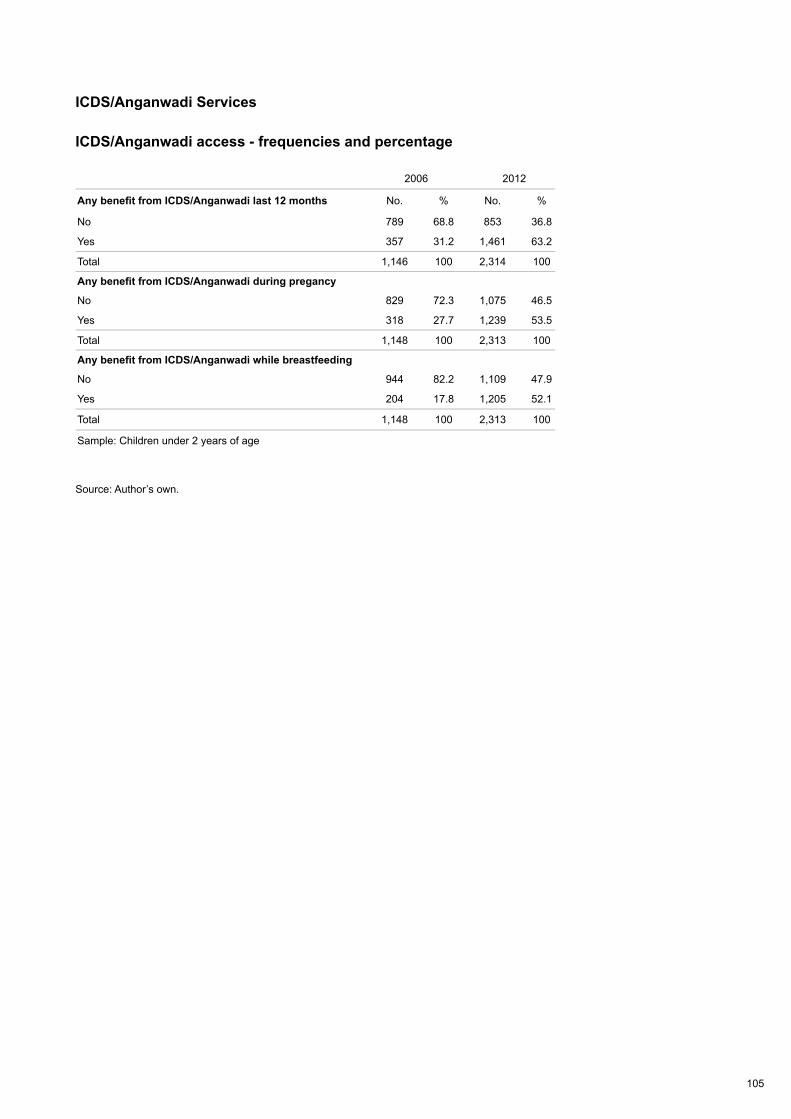
105
ICDS/Anganwadi Services
ICDS/Anganwadi access - frequencies and percentage
Source: Author’s own.
2006 2012
Any benefit from ICDS/Anganwadi last 12 months No. % No. %
No 789 68.8 853 36.8
Yes 357 31.2 1,461 63.2
Total 1,146 100 2,314 100
Any benefit from ICDS/Anganwadi during pregancy
No 829 72.3 1,075 46.5
Yes 318 27.7 1,239 53.5
Total 1,148 100 2,313 100
Any benefit from ICDS/Anganwadi while breastfeeding
No 944 82.2 1,109 47.9
Yes 204 17.8 1,205 52.1
Total 1,148 100 2,313 100
Sample: Children under 2 years of age

106
Nutrition outcom
es – percentages of children, by ICD
S/Anganw
adi benefits
Source: A
uthor’s own.
Underw
eightW
astingS
tunting
2006
2012 2006-2012
Std.E
rror2006
2012 2006-2012
Std.E
rror2006
2012 2006-2012
Std.E
rror
Any benefit from
ICD
S/Anganw
adi last 12 m
onths
No
27.8317.62
-10.212.04
17.8814.90
-2.981.80
37.2219.57
-17.652.13
Yes35.48
25.48-9.99
3.2123.45
16.27-7.18
2.7342.78
26.37-16.41
3.27
Any benefit from
ICD
S/Anganw
adi during pregnancy
No
28.1119.93
-8.181.98
17.7715.14
-2.631.71
38.7122.29
-16.422.07
Yes35.49
24.89-10.60
3.3924.29
16.31-7.98
2.9239.36
25.23-14.13
3.42
Any benefit from
ICD
S/Anganw
adi w
hile breastfeeding
No
29.1919.68
-9.501.92
18.0715.14
-2.941.67
38.9221.36
-17.562.00
Yes34.65
25.25-9.40
4.0526.56
16.35-10.21
3.4738.72
26.16-12.56
4.10
Sam
ple: Children under 2 years of age

107
Women’s Decisions
Decisions by women - frequencies and percentage
Source: Author’s own.
2006 2012
Decisions on household purchases No. % No. %
By others only 513 45 754 33.2
By woman and others 595 52.1 1,460 64.3
By woman only 33 2.9 58 2.5
Total 1,141 100 2,272 100
Decisions on visiting relatives
By others only 313 27.4 725 31.9
By woman and others 723 63.3 1,336 58.8
By woman only 105 9.2 210 9.2
Total 1,141 100 2,272 100
Decisions about health care for yourself
By others only 390 34.2 723 31.8
By woman and others 409 35.8 1,044 45.9
By woman only 343 30 505 22.2
Total 1,141 100 2,272 100
Woman has worked last 12 months
No 801 70.2 1,571 69.1
Yes 341 29.8 701 30.9
Total 1,141 100 2,272 100
Sample: Children under 2 years of age
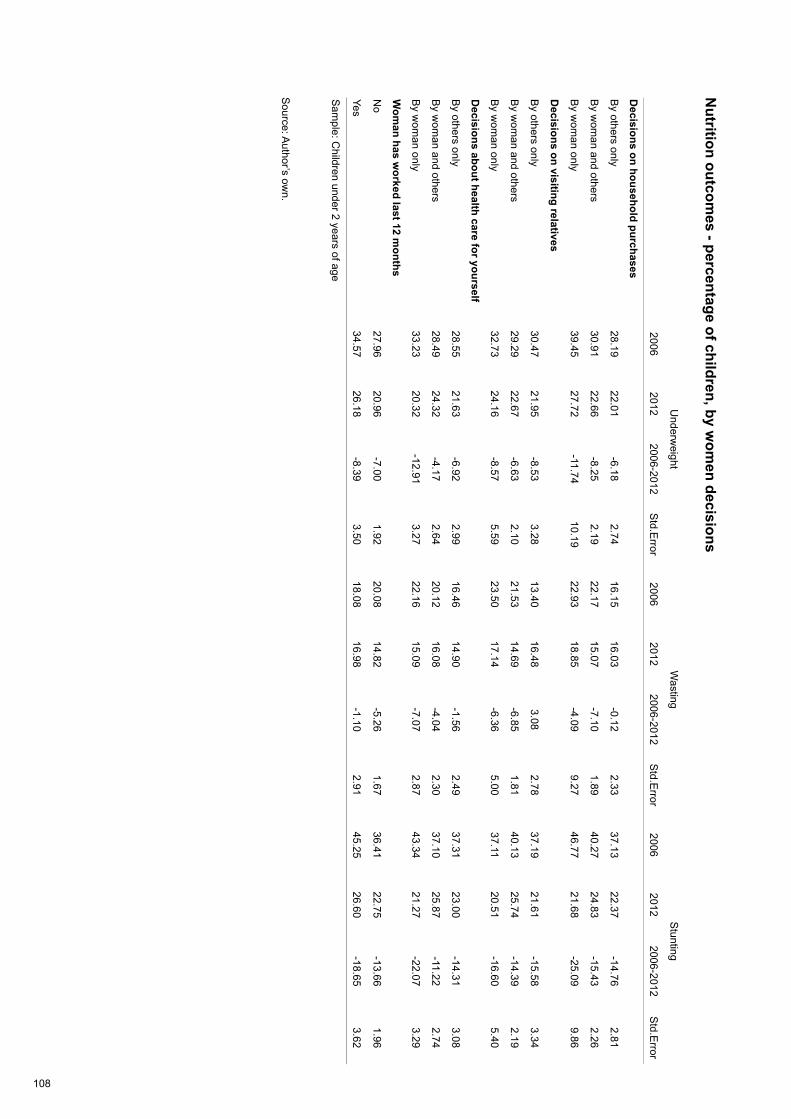
108
Nutrition outcom
es - percentage of children, by wom
en decisions
Source: A
uthor’s own.
Underw
eightW
astingS
tunting
2006
2012 2006-2012
Std.E
rror2006
2012 2006-2012
Std.E
rror2006
2012 2006-2012
Std.E
rror
Decisions on household purchases
By others only
28.1922.01
-6.182.74
16.1516.03
-0.122.33
37.1322.37
-14.762.81
By w
oman and others
30.9122.66
-8.252.19
22.1715.07
-7.101.89
40.2724.83
-15.432.26
By w
oman only
39.4527.72
-11.7410.19
22.9318.85
-4.099.27
46.7721.68
-25.099.86
Decisions on visiting relatives
By others only
30.4721.95
-8.533.28
13.4016.48
3.082.78
37.1921.61
-15.583.34
By w
oman and others
29.2922.67
-6.632.10
21.5314.69
-6.851.81
40.1325.74
-14.392.19
By w
oman only
32.7324.16
-8.575.59
23.5017.14
-6.365.00
37.1120.51
-16.605.40
Decisions about health care for yourself
By others only
28.5521.63
-6.922.99
16.4614.90
-1.562.49
37.3123.00
-14.313.08
By w
oman and others
28.4924.32
-4.172.64
20.1216.08
-4.042.30
37.1025.87
-11.222.74
By w
oman only
33.2320.32
-12.913.27
22.1615.09
-7.072.87
43.3421.27
-22.073.29
Wom
an has worked last 12 m
onths
No
27.9620.96
-7.001.92
20.0814.82
-5.261.67
36.4122.75
-13.661.96
Yes34.57
26.18-8.39
3.5018.08
16.98-1.10
2.9145.25
26.60-18.65
3.62
Sam
ple: Children under 2 years of age
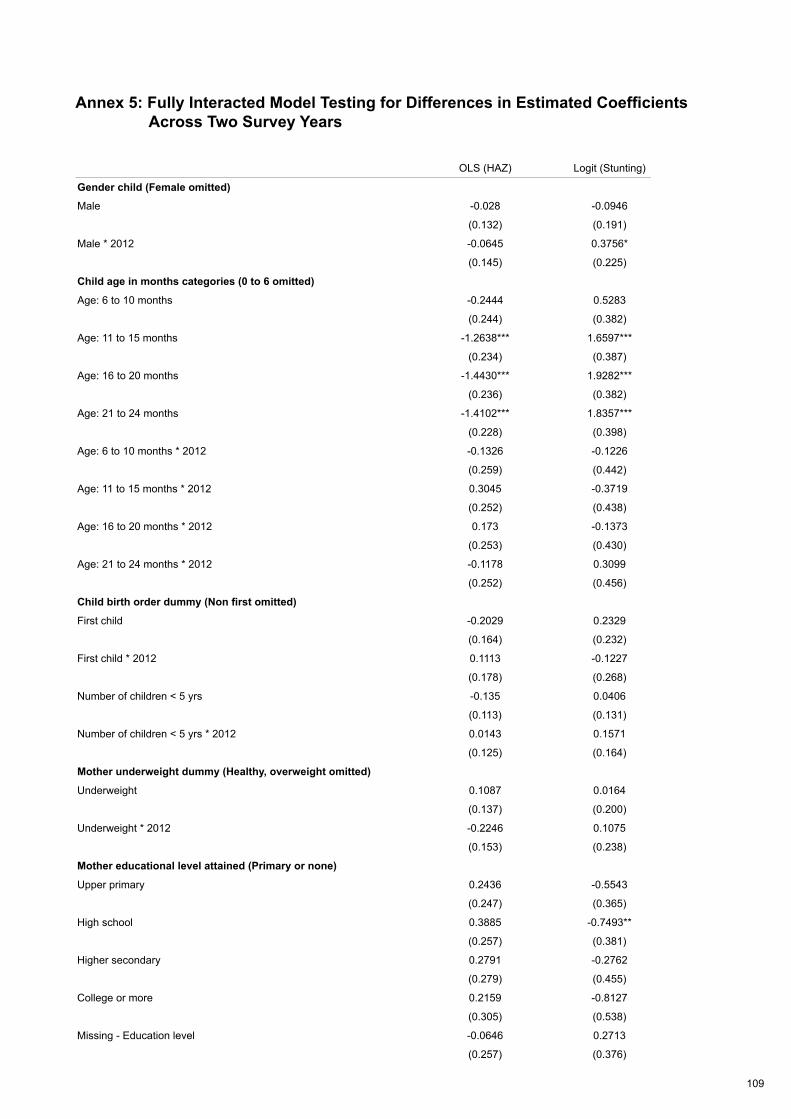
109
Annex 5: Fully Interacted Model Testing for Differences in Estimated Coefficients Across Two Survey Years
OLS (HAZ) Logit (Stunting)
Gender child (Female omitted)
Male -0.028 -0.0946
(0.132) (0.191)
Male * 2012 -0.0645 0.3756*
(0.145) (0.225)
Child age in months categories (0 to 6 omitted)
Age: 6 to 10 months -0.2444 0.5283
(0.244) (0.382)
Age: 11 to 15 months -1.2638*** 1.6597***
(0.234) (0.387)
Age: 16 to 20 months -1.4430*** 1.9282***
(0.236) (0.382)
Age: 21 to 24 months -1.4102*** 1.8357***
(0.228) (0.398)
Age: 6 to 10 months * 2012 -0.1326 -0.1226
(0.259) (0.442)
Age: 11 to 15 months * 2012 0.3045 -0.3719
(0.252) (0.438)
Age: 16 to 20 months * 2012 0.173 -0.1373
(0.253) (0.430)
Age: 21 to 24 months * 2012 -0.1178 0.3099
(0.252) (0.456)
Child birth order dummy (Non first omitted)
First child -0.2029 0.2329
(0.164) (0.232)
First child * 2012 0.1113 -0.1227
(0.178) (0.268)
Number of children < 5 yrs -0.135 0.0406
(0.113) (0.131)
Number of children < 5 yrs * 2012 0.0143 0.1571
(0.125) (0.164)
Mother underweight dummy (Healthy, overweight omitted)
Underweight 0.1087 0.0164
(0.137) (0.200)
Underweight * 2012 -0.2246 0.1075
(0.153) (0.238)
Mother educational level attained (Primary or none)
Upper primary 0.2436 -0.5543
(0.247) (0.365)
High school 0.3885 -0.7493**
(0.257) (0.381)
Higher secondary 0.2791 -0.2762
(0.279) (0.455)
College or more 0.2159 -0.8127
(0.305) (0.538)
Missing - Education level -0.0646 0.2713
(0.257) (0.376)
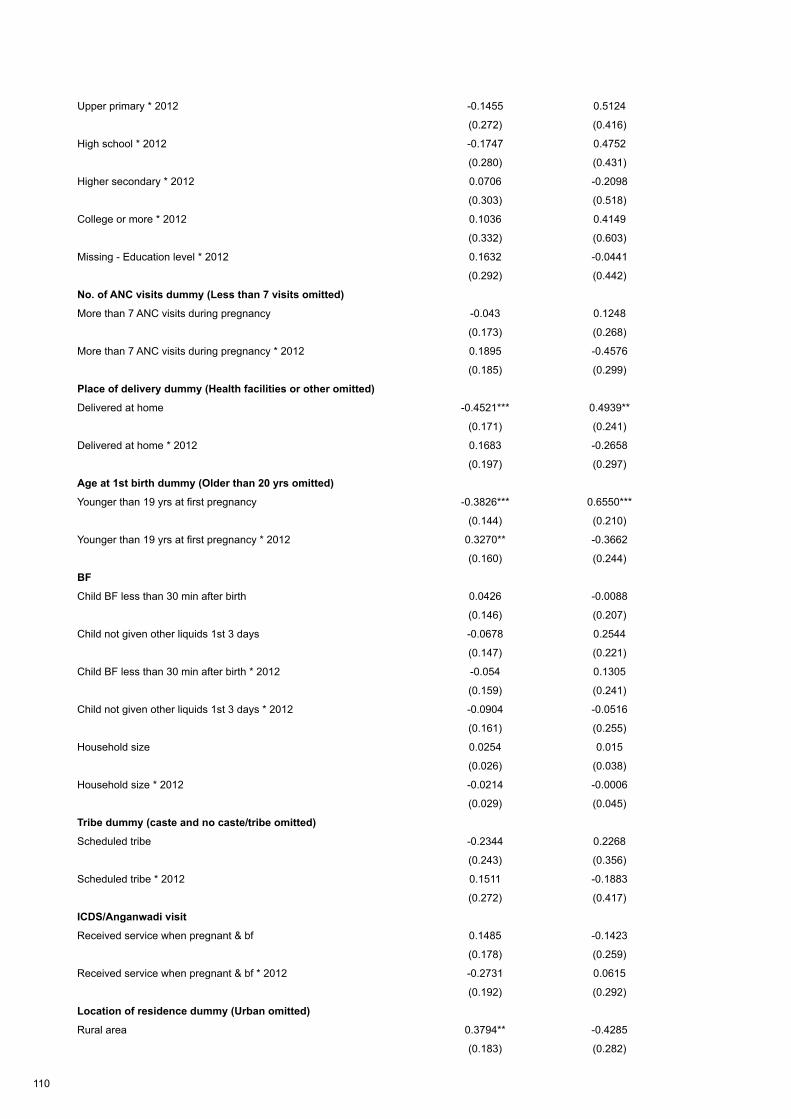
110
Upper primary * 2012 -0.1455 0.5124
(0.272) (0.416)
High school * 2012 -0.1747 0.4752
(0.280) (0.431)
Higher secondary * 2012 0.0706 -0.2098
(0.303) (0.518)
College or more * 2012 0.1036 0.4149
(0.332) (0.603)
Missing - Education level * 2012 0.1632 -0.0441
(0.292) (0.442)
No. of ANC visits dummy (Less than 7 visits omitted)
More than 7 ANC visits during pregnancy -0.043 0.1248
(0.173) (0.268)
More than 7 ANC visits during pregnancy * 2012 0.1895 -0.4576
(0.185) (0.299)
Place of delivery dummy (Health facilities or other omitted)
Delivered at home -0.4521*** 0.4939**
(0.171) (0.241)
Delivered at home * 2012 0.1683 -0.2658
(0.197) (0.297)
Age at 1st birth dummy (Older than 20 yrs omitted)
Younger than 19 yrs at first pregnancy -0.3826*** 0.6550***
(0.144) (0.210)
Younger than 19 yrs at first pregnancy * 2012 0.3270** -0.3662
(0.160) (0.244)
BF
Child BF less than 30 min after birth 0.0426 -0.0088
(0.146) (0.207)
Child not given other liquids 1st 3 days -0.0678 0.2544
(0.147) (0.221)
Child BF less than 30 min after birth * 2012 -0.054 0.1305
(0.159) (0.241)
Child not given other liquids 1st 3 days * 2012 -0.0904 -0.0516
(0.161) (0.255)
Household size 0.0254 0.015
(0.026) (0.038)
Household size * 2012 -0.0214 -0.0006
(0.029) (0.045)
Tribe dummy (caste and no caste/tribe omitted)
Scheduled tribe -0.2344 0.2268
(0.243) (0.356)
Scheduled tribe * 2012 0.1511 -0.1883
(0.272) (0.417)
ICDS/Anganwadi visit
Received service when pregnant & bf 0.1485 -0.1423
(0.178) (0.259)
Received service when pregnant & bf * 2012 -0.2731 0.0615
(0.192) (0.292)
Location of residence dummy (Urban omitted)
Rural area 0.3794** -0.4285
(0.183) (0.282)
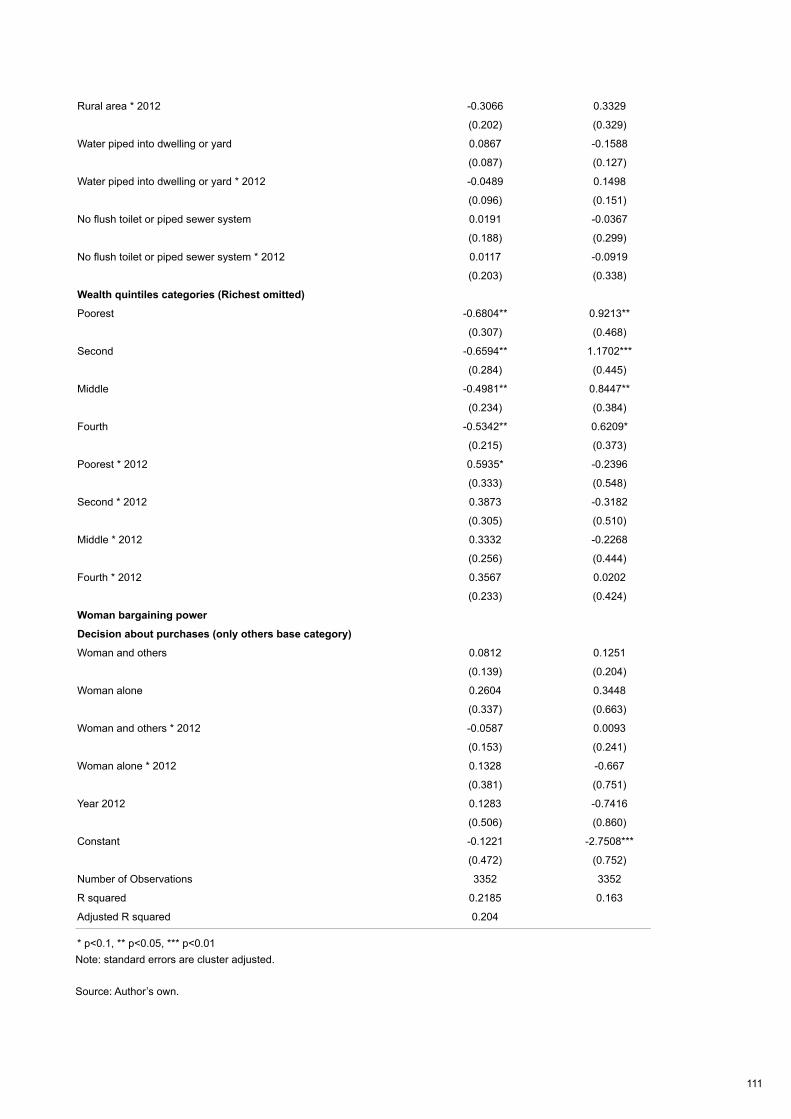
111
Note: standard errors are cluster adjusted.
Source: Author’s own.
Rural area * 2012 -0.3066 0.3329
(0.202) (0.329)
Water piped into dwelling or yard 0.0867 -0.1588
(0.087) (0.127)
Water piped into dwelling or yard * 2012 -0.0489 0.1498
(0.096) (0.151)
No flush toilet or piped sewer system 0.0191 -0.0367
(0.188) (0.299)
No flush toilet or piped sewer system * 2012 0.0117 -0.0919
(0.203) (0.338)
Wealth quintiles categories (Richest omitted)
Poorest -0.6804** 0.9213**
(0.307) (0.468)
Second -0.6594** 1.1702***
(0.284) (0.445)
Middle -0.4981** 0.8447**
(0.234) (0.384)
Fourth -0.5342** 0.6209*
(0.215) (0.373)
Poorest * 2012 0.5935* -0.2396
(0.333) (0.548)
Second * 2012 0.3873 -0.3182
(0.305) (0.510)
Middle * 2012 0.3332 -0.2268
(0.256) (0.444)
Fourth * 2012 0.3567 0.0202
(0.233) (0.424)
Woman bargaining power
Decision about purchases (only others base category)
Woman and others 0.0812 0.1251
(0.139) (0.204)
Woman alone 0.2604 0.3448
(0.337) (0.663)
Woman and others * 2012 -0.0587 0.0093
(0.153) (0.241)
Woman alone * 2012 0.1328 -0.667
(0.381) (0.751)
Year 2012 0.1283 -0.7416
(0.506) (0.860)
Constant -0.1221 -2.7508***
(0.472) (0.752)
Number of Observations 3352 3352
R squared 0.2185 0.163
Adjusted R squared 0.204
* p<0.1, ** p<0.05, *** p<0.01
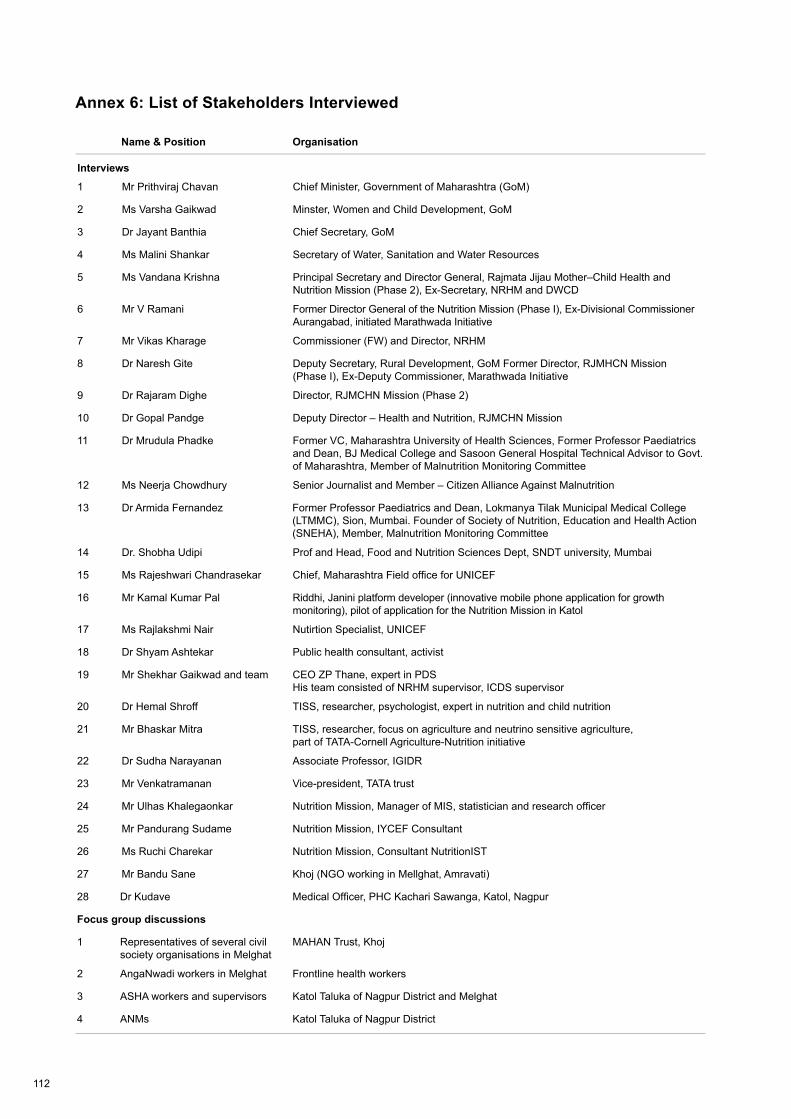
112
Annex 6: List of Stakeholders Interviewed
Name & Position Organisation
Interviews
1 Mr Prithviraj Chavan Chief Minister, Government of Maharashtra (GoM)
2 Ms Varsha Gaikwad Minster, Women and Child Development, GoM
3 Dr Jayant Banthia Chief Secretary, GoM
4 Ms Malini Shankar Secretary of Water, Sanitation and Water Resources
5 Ms Vandana Krishna Principal Secretary and Director General, Rajmata Jijau Mother–Child Health and Nutrition Mission (Phase 2), Ex-Secretary, NRHM and DWCD
6 Mr V Ramani Former Director General of the Nutrition Mission (Phase I), Ex-Divisional Commissioner Aurangabad, initiated Marathwada Initiative
7 Mr Vikas Kharage Commissioner (FW) and Director, NRHM
8 Dr Naresh Gite Deputy Secretary, Rural Development, GoM Former Director, RJMHCN Mission (Phase I), Ex-Deputy Commissioner, Marathwada Initiative
9 Dr Rajaram Dighe Director, RJMCHN Mission (Phase 2)
10 Dr Gopal Pandge Deputy Director – Health and Nutrition, RJMCHN Mission
11 Dr Mrudula Phadke Former VC, Maharashtra University of Health Sciences, Former Professor Paediatrics and Dean, BJ Medical College and Sasoon General Hospital Technical Advisor to Govt. of Maharashtra, Member of Malnutrition Monitoring Committee
12 Ms Neerja Chowdhury Senior Journalist and Member – Citizen Alliance Against Malnutrition
13 Dr Armida Fernandez Former Professor Paediatrics and Dean, Lokmanya Tilak Municipal Medical College (LTMMC), Sion, Mumbai. Founder of Society of Nutrition, Education and Health Action (SNEHA), Member, Malnutrition Monitoring Committee
14 Dr. Shobha Udipi Prof and Head, Food and Nutrition Sciences Dept, SNDT university, Mumbai
15 Ms Rajeshwari Chandrasekar Chief, Maharashtra Field office for UNICEF
16 Mr Kamal Kumar Pal Riddhi, Janini platform developer (innovative mobile phone application for growth monitoring), pilot of application for the Nutrition Mission in Katol
17 Ms Rajlakshmi Nair Nutirtion Specialist, UNICEF
18 Dr Shyam Ashtekar Public health consultant, activist
19 Mr Shekhar Gaikwad and team CEO ZP Thane, expert in PDS His team consisted of NRHM supervisor, ICDS supervisor
20 Dr Hemal Shroff TISS, researcher, psychologist, expert in nutrition and child nutrition
21 Mr Bhaskar Mitra TISS, researcher, focus on agriculture and neutrino sensitive agriculture, part of TATA-Cornell Agriculture-Nutrition initiative
22 Dr Sudha Narayanan Associate Professor, IGIDR
23 Mr Venkatramanan Vice-president, TATA trust
24 Mr Ulhas Khalegaonkar Nutrition Mission, Manager of MIS, statistician and research officer
25 Mr Pandurang Sudame Nutrition Mission, IYCEF Consultant
26 Ms Ruchi Charekar Nutrition Mission, Consultant NutritionIST
27 Mr Bandu Sane Khoj (NGO working in Mellghat, Amravati)
28 Dr Kudave Medical Officer, PHC Kachari Sawanga, Katol, Nagpur
Focus group discussions
1 Representatives of several civil society organisations in Melghat
MAHAN Trust, Khoj
2 AngaNwadi workers in Melghat Frontline health workers
3 ASHA workers and supervisors Katol Taluka of Nagpur District and Melghat
4 ANMs Katol Taluka of Nagpur District
113
Annex 7: Stakeholder Interview Guide
Background
Over the past ten years the Indian state of Maharashtra has shown dramatic reductions in rates of under-five stunting. In 2012 the Government of Maharashtra commissioned a statewide survey to assess progress made since 2006 in improving the nutrition situation of children and identify priority areas for future policy and programme action. The survey was implemented by India’s International Institute for Population Sciences. The decline has been from 39 per cent in 2005/06 to 23 per cent in 2012 (a 2.5 percentage point mean annual decline).
UNICEF and IDS are collaborating to undertake several comprehensive analyses of the direct and indirect determinants that might be responsible for this dramatic decline in the prevalence of child stunting in Maharashtra. The objectives are to establish (1) whether there have been changes in Maharashtra in the last six to ten years (e.g. WASH (Water, Sanitation and Hygiene), health services, food security, women status, social protection, economic growth, governance) and (2) whether these changes might explain the significant decline in the prevalence of stunting.
To get an in-depth understanding of the underlying factors that might help to explain the decline in stunting and to follow up and address questions/theories raised in the quantitative analysis and the literature and programme review, we plan to interview key stakeholders in Maharashtra. A stakeholder mapping exercises guided by the UNICEF framework of determinants of undernutrition was employed to identify organisations and individuals likely to play an important role within nutrition and related sectors. Shortlists of stakeholders have been further refined with input from the UNICEF Maharashtra team in-country.
A7.1 Driving forces behind the decline in stunting in 2002–2012
OBJECTIVE (‘driving force’): To capture stakeholders’ opinions and knowledge of the driving forces/most important factors for the decline in stunting in Maharashtra between 2002 and 2012 (e.g. key actors, organisations, political institutions, networks and systems, collaboration between sectors).
A7.1.1 Data
The recent data on child undernutrition from the 2012 Comprehensive Nutrition Survey Maharashtra (CNSM) show a large decline in child undernutrition compared to the 2005/2006 National Family Health Survey (NFHS-3). More specifically, stunting (short stature for age) in early childhood decreased from 39 per cent in 2005/06 to 23 per cent in 2012 (a 2.5 percentage point annual decline).
• Are you surprised by the magnitude of this change?
• Why are you/aren’t you surprised?
• Do you feel the data (from CNSM 2012 and NFHS-3) reflect/capture the decline in undernutrition between 2005 and 2012 well?
This could capture issues around the validity of the data and/or issues around regional differences. There were several child deaths caused by malnutrition in the tribal areas this August 2013! Please ask the question as neutrally as possible, do not use words like doubt, agree).
• Why do you/Why don’t you feel the data reflect the decline well?
114
This question might need to be omitted depending on stakeholder (e.g. OK for: academics, monitoring Nutrition Mission, non-nutrition-related sectors).
A7.1.2 Driving forces
• In your opinion, what do you think are the driving forces/most important factors responsible for the decline in undernutrition between 2002 and 2012?
Prompt, only if necessary:Key actors (e.g. personalities, organisations);Key programmes/policies/plans;Key systems/networks; Key political institutions.
Probe further for each ‘force’ mentioned:
• Why do you believe/think/feel XY has been an important factor in the reduction of undernutrition in Maharashtra between 2002 and 2012?
A7.1.3 Other forces
• Can you think of any other factors that might have contributed to the decline in undernutrition?
A7.2 Specific forces behind the decline in stunting in 2002–2012
OBJECTIVE (‘specific areas’): To capture stakeholders’ perceptions of the contribution of specific key actors, institutions, organisations to the reduction of stunting. a. Economic growth b. The Nutrition Missionc. Other related sectors (e.g. WASH, agriculture)d. Intersectoral coordination between departments (e.g. Rural Health Mission and ICDS)e. The contribution of the private sector (e.g. support of CDCs)f. Involvement of civil society for accountability (including the media, celebrities)g. Key actors and their commitment/leadership (e.g. personal characteristics/leadership skills)h. Political commitment at highest level
Important: These questions need to be adapted to the answers given in the previous section (both type of questions asked and order). For example, you could briefly ask a little more about the ‘key forces’ from section 1 and then ask about his/her opinion about the other potential factors.
A7.2.1 Economic growth
Maharashtra is the wealthiest state in India and benefited from an enormous economic growth in the last decade – GDP per capita growth of 18.3 per cent in the period 2008–2011. • How do you believe the economic growth in Maharashtra influenced child undernutrition
between 2002 and 2012?

115
A7.2.2 Nutrition Mission
The state Nutrition Mission (Rajmata Jijau Mother–Child Health and Nutrition Mission).
• How would you say the state Nutrition Mission influenced child undernutrition in Marashtra between 2002 and 2012?
• Why? How? (Ask for detailed information, perceptions)…
• What would you say makes the Nutrition Mission so successful (or not according to previous reply) in Maharashtra? (e.g. leadership, political commitment, cross-sectoral collaboration and commitment, focus on frontline capacity strengthening, technical support by UNICEF, financial resources)
• Can you see any unforeseen effects of the Nutrition Mission (both positive and negative)?
For stakeholders who are directly involved with the Nutrition Mission:
• Several states in India are considering or have already started to implement Nutrition Missions following the Maharashtra model (Uttar Pradesh). What advice would you give them? What key features should they focus on?
A7.2.3 Role of different sectors
Child undernutrition has complex causes and requires action from different sectors. • In your opinion, what role did different sectors play in statewide reduction of undernutrition?
(e.g. WASH, agriculture, education, health)
• Why? How? (Ask for detailed information, perceptions)…
If they are from one of the different sectors, ask more specific questions:
• Are nutrition outcomes included in the sector-specific programmes and plans? (e.g. is improvement of nutrition one of the objectives of sanitation programmes?)
Also ask for sector-specific programmes and their contribution:
• WASH: (Total Sanitation Campaign with Nirmal Gram Puraskar awards; Sant Gadgebaba Clean Village Sanitation Campaign; Drinking water plan: Jalswarajya)
• Agriculture and food security: The National Food Security Mission, the National Horticulture Mission
• Health: Rural health Mission
• Infrastructure: rural infrastructure – Bharat Nirman, urban infrastructure – Jawaharlal Nehru National Urban Renewal Mission
• Social protection: Targeted Public Distribution Scheme (TPDS), National Rural Employment Guarantee Act (NREGA)
Most of the sector-specific programmes and plans are nationwide initiatives (e.g. TPDS, NREGA, Total Sanitation Campaign).
• How were these nationwide policies and programmes adapted and implemented in Maharashtra?

116
A7.2.4 Intersectoral collaboration
• How did the different sectors come together on nutrition topics?
• Were there any other organisations/actors that joined this intersectoral collaboration?
• Were there any formal frameworks/guidelines that guided the intersectoral collaboration on nutrition?
• How did the intersectoral collaboration take place in practice (e.g. how many meetings, communication channels, monitoring of collaboration)?
• Would you say that one or a group of organisation/actors were particularly influential in the intersectoral collaboration?
A7.2.5 Private sector contribution • How would you say the private sector was involved in the reduction of undernutrition between
2002 and 2012?
Ask for specific examples (e.g. private cooperation adopt villages, use of mobile phone technology for monitoring of ICDS)
A7.2.6 Civil society (e.g. NGOs, activist groups)
• In your opinion, what role has civil society played in the reduction of undernutrition in Maharashtra between 2002 and 2012?
• How would you say civil society has influenced public discussion/practical interventions on the ground, policies on undernutrition between 2002 and 2012?
1. NGOs (e.g. SNEHA)2. Activists (e.g. Right to Food Movement)3. Celebrities (e.g. Bollywood actor Aamir Khan)4. Media (e.g. TV, films, newspapers)
A7.2.7 Key actors and their commitment/leadership
• In your opinion have there been any key actors (nutrition champions) or groups of actors who have been particularly influential in addressing undernutrition in Maharashtra between 2002 and 2012?
• Why do you think they have been so influential (e.g. personal characteristics, leadership skills)?
A7.2.8 Political commitment at highest level
• Do you feel that the causes and consequences of child undernutrition are taken seriously in Maharashtra?
• How would you describe the political commitment towards combating child undernutrition in Maharashtra between 2002 and 2012?
• How would you describe political commitment towards the reduction of undernutrition at the different levels (statewide, local)?
117
A7.3 Major changes in policy, programmes and major events between 2002 and 2012
OBJECTIVE (‘changes’): To explore the potential role of changes in policy, programmes and major events between 2002 and 2012 that might help to explain the decline in stunting (e.g. changes in administration of ICDS with new incentive structure for Anganwadi workers [some speculate that the reduction of stunting is mainly based on this change]).
A7.3.1 Programme and policy changes
• When you think about the last ten years (2002 to 2012), have there been any major changes in programmes or policies that might have influenced child undernutrition in Maharashtra?
A7.3.2 Major events
• Can you think of any other major events that could have influenced child undernutrition?
Please think about positive and negative potential changes.
A7.3.3 Social changes
• When you think about the last ten years, have there been any other changes (e.g. in attitudes towards tribal areas, SC/ST, or women status) that might have influenced child undernutrition?
A7.3.4 Other ideas
Finally, ask whether stakeholder has any other thoughts, ideas, comments on potential factors that might have had an influence on child undernutrition in Maharashtra between 2002 and 2012.
A7.4 Persistent challenges and barriers
OBJECTIVE (‘persistent challenges’): To explore persistent challenges and barriers for the further reduction of stunting in Maharashtra.
A7.4.1
The current data estimate that 23 per cent of all children in Maharashtra still suffer from chronic undernutrition. There were also several recent child deaths due to malnutrition in the tribal areas of Thane district.
• What would you say are the reasons for this persistence of undernutrition among children in Maharashtra?
• How do you think this remaining undernutrition challenge could be addressed most effectively?
Ask, whether they have questions for you.
118
Annex 8: Letter to Stakeholders
Dear…
I am contacting you on behalf of the UNICEF-IDS (Institute of Development Studies) team that is working on the project: Analysis of Maharashtra’s Decline in Childhood Stunting. The aim of the project is to establish the knowledge base on the direct and indirect factors that contributed to the reduction of child stunting recorded in Maharashtra between 2002 and 2012. The project is led by Dr Victor Aguayo (UNICEF) and Prof Lawrence Haddad (IDS).
Given your expertise and key involvement in the field of nutrition, we would like to know more about your unique perspective on the factors that might help us to explain the dramatic improvement in child nutrition in Maharashtra. A better understanding of the underlying factors is vital for future nutrition policy formulation and programme design and implementation in India and beyond.We would like to invite you to take part in our interview study in Maharashtra in October, 2013. The interview will take approximately 45 minutes and will involve an informal discussion.
Your contribution to our interview study would be very valuable and we hope you will be able to give us time. We would appreciate if you could reply to this email before 25th September, after which we will assume that you do not wish to take part on this particular occasion. We will follow up the email correspondence to fix a convenient date and time for the discussion.
If you have any questions about this interview study, please do not hesitate to contact us.Thank you for considering this invitation.
Yours sincerelyDr Victor Aguayo (UNICEF) and Prof Lawrence Haddad (IDS)
119
Annex 9: Key Activities, Malnutrition Removal Campaign and Nutrition Mission
Adapted from Ramani (2011).
Malnutrition Removal campaign, key activities:
• Complete (100 per cent) survey of all children in the 0–6 age group;• 100 per cent registration of all such children;• 100 per cent weighing of all such children;• On the basis of weighing, classification of all children into normal/Grade I to IV categories (as
appropriate);• Special concentration on children in Grade III and IV stages of malnutrition: regular weighing,
providing for health and nutrition measures for these children;• Initiating measures for ensuring health and nutrition of pregnant mothers to reduce incidence of
low birthweight children;• Greater attention to children in the 0–3 age group given the greater incidence of malnutrition in
this age group and its implications for the future development of the child;• Analysis of data to bring out the relative incidence of malnutrition based on age, gender and
social status (scheduled caste/tribe) etc.
The primary objective was to reduce Grade III and IV malnutrition* in under-6 children with the following supplementary aims:
• Ensuring provision of antenatal care to pregnant women, newborn care and special focus on health;
• Nutrition and complete immunisation of children in the 0–3 age; • Reduction of Grade I and Grade II malnutrition in the state; • Assisting the Public Health Department in provision of training for implementation of the
Integrated Management of Neonatal and Childhood Illnesses (IMNCI) and home-based newborn care programmes on a pilot basis in selected primary health centres (PHCs);
• Focus on the education of adolescent girls to reduce the incidence of child marriages and promote spacing between children;
• Making efforts to bring about social transformation through participation of the community so that the responsibility for nutrition management is transferred from the government to civil society.
The Nutrition Mission’s Action Plan included:
• Increasing survey efficiency (both within and outside the ICDS area);• Increasing weighing efficiency (both within and outside the ICDS area);• Grading children between normal and different grades of malnutrition;• Preparing AWC-wise lists of Grade III and IV children;• Monthly medical check-ups of Grade III and IV children;• Six-monthly medical check-ups of all under-6 children;• Increasing registration of pregnant women and nursing mothers;• Regular medical check-ups of pregnant women and nursing mothers;• Expert medical examination and treatment of women and children;• Regular reviews at different levels to achieve the Mission’s objectives.

120
* Malnutrition was then classified according to the degree of underweight (weight for age) based on the Indian Academy of Paediatrics (IAP) reference table for boys & girls. The ICDS and subsequently the Mission was using the IAP standards for defining grades of malnutrition.
Classification of malnutrition: IAP
Grade I (71–80 per cent)Grade II (61–70 per cent)Grade III (51–60 per cent)Grade IV (≤50 per cent)
….of expected weight for that age
Nutrition Mission Phase II objectives and activities
The primary objective of the Mission’s second phase is to reduce the proportion of malnour-ished pregnant women and children up to two years of age covered under ICDS.
Other supplementary objectives include:
• To reduce the proportion of Moderate Underweight (MUW) and Severe Underweight (SUM) malnourished children in the 0–2 years age group under ICDS;
• To take special care of pregnant women prior to delivery of child (especially those suffering from being underweight and anaemia), care of newborn infants, and focus attention on children (<9 months to 2 years) to monitor their health, diet, growth, overall development and immunisation;
• To cooperate with the Health Department by providing training and empowerment for implementation of Integrated Management of Neonatal and Childhood Illnesses (IMNCI) and Home-Based Newborn Care (HBNBC) programmes on an experimental basis in selective Primary Health Care Centres (PHCs) in certain districts of the state;
• To reduce the percentage of child marriages by: focusing more attention towards education of adolescent girls; delaying first pregnancy; increasing the duration between the births of two children; and increasing social awareness of reduction of the intensity of issues related to malnutrition.
Action plan
• To check the capacity for survey (in and outside the purview of Integrated Child Development Services);
• To improve upon the registration of the number of pregnant women and lactating mothers;
• To classify children under normal and underweight categories appropriately;
• To conduct regular health check-ups for children in the 0–2 years age group;
• To conduct regular health check-ups for pregnant women and lactating mothers;
• To conduct medical tests of vulnerable children and women by medical experts and provide proper treatment to such children/women;
• To register all school-going and non-school-going adolescent girls and to check whether they are provided with iron tablets every week and deworming tablets twice a year or not;
• To check whether at least 75 per cent of women have been covered under the National Rural Employment Guarantee Act and other poverty alleviation schemes;
• To check whether weight of 95 per cent of children 0–2 years of age is recorded or not;
121
• To verify whether breastfeeding has begun within an hour of the birth of the child and exclusive breastfeeding has continued till the child has attained six months of age;
• To provide dose of vitamin A and treatment for deworming twice a year from the age of nine months to five years;
• To take qualitative care of SAM and MAM children in Rural Child Development Centres and Child Development Centres as per the norms applicable in such centres.
Related publications by IDS/IIPS/UNICEF staff
Barnett, I. and Gallegos, J. (2013) Using Mobile Phones for Nutrition Surveillance: A Review of Evidence, IDS Evidence Report 1, Brighton: IDS
Gillespie, S.; Haddad, L.; Mannar, V.; Menon, P. and Nisbett, N.; The Maternal and Child Nutrition Study Group. (2013) ‘The Politics of Reducing Malnutrition: Building Commitment and Accelerating Progress’, The Lancet 382.9891: 552–69
Haddad, L. (2011) ‘Why India needs a National Nutrition Strategy’, British Medical Journal 343.7832: 1042–4
International Institute for Population Studies (IIPS) (2012) Comprehensive Nutrition Survey in Maharashtra, Mumbai: IIPS
Mejia Acosta, A. and Haddad, L. (2014) ‘The Politics of Success in the Fight Against Malnutrition in Peru’, Food Policy 44: 26–35
Menon P.; Bamezai, A.; Subandoro, A.; Ayoya, M. and Aguayo, V. (2013) ‘Age-appropriate Infant and Young Child Feeding Practices are Associated with Child Nutrition in India: Insights from the National Family Health Survey’, Maternal and Child Nutrition; Article first published online: 5 APR 2013 DOI: 10.1111/mcn.12036
Smith, L. and Haddad, L. (2014) Reducing Child Undernutrition: Past Drivers and Priorities for the Post-MDG Era, IDS Working Paper 441, Brighton: IDS
te Lintelo, D.; Haddad, L.; Lakshman, R. and Gatellier, K. (2013) The Hunger And Nutrition Commitment Index (HANCI 2012): Measuring the Political Commitment to Reduce Hunger and Undernutrition in Developing Countries, IDS Evidence Report 25, Brighton: IDS
United Nations Children’s Fund (UNICEF) (2014) Nutrition Wins. How Nutrition Makes Progress in India, New Delhi: UNICEF
United Nations Children’s Fund (UNICEF) (2014) Nutrition Moves. States Create Promising Change in India, New Delhi: UNICEF
United Nations Children’s Fund (UNICEF) (2013) Improving Child Nutrition. The Achievable Imperative for Global Progress, New York: UNICEF
United Nations Children’s Fund (UNICEF) (2013). Nutrition in India: The First Two Years are Forever, New Delhi: UNICEF

Between 2006 and 2012, Maharashtra’s rate of stunting in children under two years of age declined from 39% to 24%, a decline of almost three percentage points per year and one of the fastest declines in stunting seen anywhere at any time. This multidisciplinary report combines a review of available evidence with statistical analysis of the multiple variables that might explain this trend (using India’s National Family Health Survey III, 2006 and the Comprehensive Nutrition Survey of Maharashtra, 2012) and qualitative analysis of key stakeholder interviews. It is the first comprehensive piece of research shedding light on what led to these changes. Factors considered include the role of improvements and co-ordination across multiple sectors, political will and leadership, the co-ordinating role of the Maharashtra Nutrition Mission and the launch of the National Rural Health Mission. Results will be relevant to those wanting to understand the lessons of Maharashtra – for further improvements in the state, for implementation in other Indian states, or as part of a growing literature on what can drive success in tackling the global crisis of child and maternal undernutrition.