Embed Size (px)
Citation preview
Principles of Crisis Management Revisited:
The Bank of England in the 1970s
By
Tryggvi Gudmundsson
A thesis submitted to the Department of Economic History of the
London School of Economics and Political Science for the degree of
Doctor of Philosophy
November 2014
I certify that the thesis I have presented for examination for the PhD degree of the
London School of Economics and Political Science is solely my own work other than
where I have clearly indicated that it is the work of others.
The copyright of this thesis rests with the author. Quotation from it is permitted,
provided that full acknowledgement is made. This thesis may not be reproduced
without my prior written consent.
I warrant that this authorization does not, to the best of my belief, infringe the
rights of any third party.
I declare that my thesis consists of 105,018 words.
Typeset in LATEXby the author.
Abstract
The relationship between central banks and the financial sector has received renewed at-
tention following the global financial crisis that started in 2007. This thesis represents
an attempt to shed further light on this relationship by looking at the Bank of England’s
relationship with the British financial sector in the 1970s - a decade that saw the return of
financial volatility and crises.
While the previous literature on this period has focused on explaining the causes and
build-up to the increase in volatility and crises, the approach taken in this thesis is more
analytical. This is done by looking at the role, implementation and effect of the Bank of
England’s crisis management policies. To tackle these issues, I use quantitative methods,
such as non-Normal option pricing models and time series econometrics, on the one hand
and qualitative data looking at the institutions involved on the other. As such, the thesis
benefits from a multitude of primary data sources, including the Bank of England Archives,
the National Archives and the archives of the largest financial institutions of the time.
The main conclusion of the thesis is that the Bank of England’s attempts to stabilize
the financial system at times of turbulence were more costly than has previously been
argued in the literature. As such, the Bank in all likelihood underpriced its assistance to
the financial system. Channels of interconnectedness are also documented with no evidence
found of increased interdependence during crises. Finally, a closer look at the Bank’s rescue
operations during the crisis shows the extent to which its staff was unprepared to tackle the
issues involved and had neglected issues of financial stability in the lead up to the crisis.
ii
Acknowledgements
I have benefitted during the writing of this thesis from numerous conversations with
people I will make no attempt to list. There are, however, a handful of people I
would like to thank personally. My supervisor, Albrecht Ritschl, provided valuable
advice throughout the project. His advice on how best to navigate the economic-
to-history tightrope that is inevitably involved in a thesis like this was especially
helpful. Comments and suggestions from Graduate Review Committee members
and participants at department seminars were also appreciated.
I would also like to thank my two stepsons, Eiδur and Friδrik. They deserve my
gratitude for tolerating my absent-mindedness while I was in work-mode and helping
me temporarily forget this thesis when much needed down-time was in order. Finally,
and most crucially, I would like to thank my wife, Katrın. This project would never
have been undertaken without her support and patience. Her tolerance for listening
to my rants about implicit subsidies and bank interdependence was truly invaluable.
This thesis is dedicated to her.
iii
iv CONTENTS
Contents
1 Introduction 1
1.1 Disentangling Financial Institutions and Government . . . . . . . . . 1
1.2 Methods and Sources . . . . . . . . . . . . . . . . . . . . . . . . . . . 9
1.3 Thesis Outline . . . . . . . . . . . . . . . . . . . . . . . . . . . . . . . 13
2 Context and literature review 18
2.1 Introduction . . . . . . . . . . . . . . . . . . . . . . . . . . . . . . . . 18
2.2 Historical and Historiographical Context . . . . . . . . . . . . . . . . 21
2.3 Economics Context . . . . . . . . . . . . . . . . . . . . . . . . . . . . 38
2.4 Conclusions . . . . . . . . . . . . . . . . . . . . . . . . . . . . . . . . 47
3 Subsidies and Stability 51
3.1 Introduction . . . . . . . . . . . . . . . . . . . . . . . . . . . . . . . . 52
3.2 A Simple Game of Discipline and Stability . . . . . . . . . . . . . . . 61
3.3 Qualitative Evidence . . . . . . . . . . . . . . . . . . . . . . . . . . . 67
3.3.1 A Brief Overview of Post-War Banking . . . . . . . . . . . . . 70
3.3.2 The Mid-Century Transition From Old to New Banking . . . . 74
3.4 Quantitative Evidence . . . . . . . . . . . . . . . . . . . . . . . . . . 93
3.4.1 Data Selection and Sources . . . . . . . . . . . . . . . . . . . 93
CONTENTS v
3.4.2 Methodology . . . . . . . . . . . . . . . . . . . . . . . . . . . 95
3.4.3 Empirical Results . . . . . . . . . . . . . . . . . . . . . . . . . 106
3.4.4 A Jump Diffusion Model of Liability Insurance . . . . . . . . . 115
3.4.5 General Robustness . . . . . . . . . . . . . . . . . . . . . . . . 123
3.5 Conclusions . . . . . . . . . . . . . . . . . . . . . . . . . . . . . . . . 128
4 Simplistic Approaches to Regulation 132
4.1 Introduction . . . . . . . . . . . . . . . . . . . . . . . . . . . . . . . . 132
4.2 Sources and data . . . . . . . . . . . . . . . . . . . . . . . . . . . . . 140
4.3 The Rise of Slater Walker . . . . . . . . . . . . . . . . . . . . . . . . 142
4.3.1 Foundation and Funding . . . . . . . . . . . . . . . . . . . . . 143
4.3.2 Conglomeration . . . . . . . . . . . . . . . . . . . . . . . . . . 152
4.3.3 The Move to Banking . . . . . . . . . . . . . . . . . . . . . . 162
4.4 The Fall of Slater Walker . . . . . . . . . . . . . . . . . . . . . . . . . 188
4.4.1 Gradual Decline . . . . . . . . . . . . . . . . . . . . . . . . . . 188
4.4.2 The Bank of England to the Rescue . . . . . . . . . . . . . . . 205
4.5 Conclusions . . . . . . . . . . . . . . . . . . . . . . . . . . . . . . . . 234
Appendix . . . . . . . . . . . . . . . . . . . . . . . . . . . . . . . . . . . 243
4.A Slater Walker Directors and Organizational Chart . . . . . . . . . . . 243
5 Interdependence and Contagion 245
5.1 Introduction . . . . . . . . . . . . . . . . . . . . . . . . . . . . . . . . 245
5.2 The Big Four’s Reaction to the Crisis . . . . . . . . . . . . . . . . . . 253
5.3 Data and Summary Statistics . . . . . . . . . . . . . . . . . . . . . . 271
5.4 Empirical Evidence . . . . . . . . . . . . . . . . . . . . . . . . . . . . 280
5.4.1 Correlation . . . . . . . . . . . . . . . . . . . . . . . . . . . . 281
5.4.2 Volatility . . . . . . . . . . . . . . . . . . . . . . . . . . . . . 288
5.4.3 A Closer Look at Co-Movement and Interdependence . . . . . 293
5.4.4 Deflating the Results . . . . . . . . . . . . . . . . . . . . . . . 305
5.4.5 The Informational Value of Equity Versus Deposits . . . . . . 307
5.5 The Interplay between Secondary Banks and the Big Four . . . . . . 315
5.6 Conclusions . . . . . . . . . . . . . . . . . . . . . . . . . . . . . . . . 322
Appendices . . . . . . . . . . . . . . . . . . . . . . . . . . . . . . . . . . 326
5.A Data Corrections . . . . . . . . . . . . . . . . . . . . . . . . . . . . . 326
5.B Time Series Methods and Results . . . . . . . . . . . . . . . . . . . . 329
6 Conclusions 343
6.1 Chapter Summaries . . . . . . . . . . . . . . . . . . . . . . . . . . . . 343
6.1.1 Chapter 4 - Simplistic Approaches to Regulation . . . . . . . . 343
6.1.2 Chapter 3 - Subsidies and Stability . . . . . . . . . . . . . . . 346
6.1.3 Chapter 5 - Interdependence and Contagion . . . . . . . . . . 348
6.2 Conclusions, Context and Implications . . . . . . . . . . . . . . . . . 351
A List of Relevant Public Sector Officials 357
Bibliography 359
vi
LIST OF FIGURES vii
List of Figures
2.1 Real GDP Growth In Britain In The Post-War Period . . . . . . . 22
2.2 RPI Inflation In The Post-War Period . . . . . . . . . . . . . . . . 27
3.1 Extensive Form Of Simplified Game . . . . . . . . . . . . . . . . . 63
3.2 Implied Insurance Per Bank - Merton Model . . . . . . . . . . . . . 109
3.3 Robustness exercise for fixed values of r . . . . . . . . . . . . . . . 125
3.4 Robustness exercise for fixed values of λ . . . . . . . . . . . . . . . 126
3.5 Robustness exercise for fixed values of k . . . . . . . . . . . . . . . 127
4.1 Slater Walker Securities balance sheet size . . . . . . . . . . . . . . 136
4.2 The Six Phases of Slater Walker’s Story . . . . . . . . . . . . . . . 137
4.3 Slater Walker’s Monthly Share Price . . . . . . . . . . . . . . . . . 138
4.4 Real House Prices in the U.K. in the Post-War Period . . . . . . . 177
4.5 Slater Walker Ltd yearly profits and dividends, in mGBP . . . . . . 180
4.6 Slater Walker Organizational Chart 1966 . . . . . . . . . . . . . . . 244
5.1 Total Amount of Lifeboat Support at Shared Risk . . . . . . . . . . 259
5.2 Bank of England Own Risk . . . . . . . . . . . . . . . . . . . . . . 261
5.3a Log Levels of Deposits . . . . . . . . . . . . . . . . . . . . . . . . . 272
5.3b Log Levels of Cash . . . . . . . . . . . . . . . . . . . . . . . . . . . 273
viii LIST OF FIGURES
5.3c Log Levels of Advances . . . . . . . . . . . . . . . . . . . . . . . . 273
5.3d Log Levels of Bills . . . . . . . . . . . . . . . . . . . . . . . . . . . 274
5.3e Log Levels of Investments . . . . . . . . . . . . . . . . . . . . . . . 275
5.3f Log Levels of Other Assets . . . . . . . . . . . . . . . . . . . . . . 276
5.3g Log Levels of Eligible Liabilities . . . . . . . . . . . . . . . . . . . . 276
5.4 Cash Correlation by Decade . . . . . . . . . . . . . . . . . . . . . . 285
5.5 Advances Correlation by Decade . . . . . . . . . . . . . . . . . . . 286
5.6 Deposits Correlation by Decade . . . . . . . . . . . . . . . . . . . . 287
5.7 12-Month Moving Average Correlation Indices . . . . . . . . . . . . 288
5.8 Volatility of Cash . . . . . . . . . . . . . . . . . . . . . . . . . . . . 290
5.9 Volatility of Deposits . . . . . . . . . . . . . . . . . . . . . . . . . . 291
5.10 Volatility of Advances . . . . . . . . . . . . . . . . . . . . . . . . . 292
5.11 Impulse Response for Barclays Advances . . . . . . . . . . . . . . . 295
5.12 Impulse Response for Barclays Deposits . . . . . . . . . . . . . . . 296
5.13 Big Four 12M Equity Index . . . . . . . . . . . . . . . . . . . . . . 310
5.14 12-Month Moving Average Correlation Index . . . . . . . . . . . . 311
5.15 Comparison of Monthly and Daily Equity Data Correlaton . . . . . 312
5.16 Equity and Deposit Correlation Dynamics . . . . . . . . . . . . . . 313
5.17 Deposit-Equity Correlation Index . . . . . . . . . . . . . . . . . . . 314
5.18 Impulse Response for Barclays Share Price . . . . . . . . . . . . . . 319
5.19 Midland Advances Adjustment Example . . . . . . . . . . . . . . . 327
5.20a Impulse Response for Lloyds Advances . . . . . . . . . . . . . . . . 331
5.20b Impulse Response for Midland Advances . . . . . . . . . . . . . . . 332
5.20c Impulse Response for NatWest Advances . . . . . . . . . . . . . . . 332
5.20d Impulse Response for Lloyds Deposits . . . . . . . . . . . . . . . . 333
5.20e Impulse Response for Midland Deposits . . . . . . . . . . . . . . . 333
5.20f Impulse Response for NatWest Deposits . . . . . . . . . . . . . . . 334
5.21a Volatility of Deposits - Inflation Adjusted . . . . . . . . . . . . . . 337
5.21b Volatility of Advances - Inflation Adjusted . . . . . . . . . . . . . . 337
5.21c Volatility of Cash - Inflation Adjusted . . . . . . . . . . . . . . . . 338
5.22a Correlation of Deposits - Inflation Adjusted . . . . . . . . . . . . . 338
5.22b Correlation of Advances - Inflation Adjusted . . . . . . . . . . . . . 339
5.22c Correlation of Cash - Inflation Adjusted . . . . . . . . . . . . . . . 339
5.23a Impulse Response for Barclays Deposits - VAR with cash included . 340
5.23b Impulse Response for Barclays Advances - VAR with cash included 340
5.24a Impulse Response for Barclays Deposits - VAR with deposits only . 341
5.24b Impulse Response for Lloyds Deposits - VAR with deposits only . . 341
5.24c Impulse Response for Midland Deposits - VAR with deposits only . 342
5.24d Impulse Response for NatWest Deposits - VAR with deposits only . 342
List of Tables
3.1 Normal Form Of Simplified Game . . . . . . . . . . . . . . . . . . . 62
3.2 Comparison Of Other Findings . . . . . . . . . . . . . . . . . . . . 105
3.3 Implied Insurance Per Bank - Merton Model (mGBP) . . . . . . . 107
3.4 Comparison of Implicit Tax and Implicit Insurance (mGBP) . . . . 108
ix
x LIST OF TABLES
3.5 Implicit Insurance Values Using Average Volatility (mGBP) . . . . 110
3.6 Comparison of Studies . . . . . . . . . . . . . . . . . . . . . . . . . 110
3.7 Implied Insurance as % of Equity . . . . . . . . . . . . . . . . . . . 112
3.8 The effect of the risk-free rate - Difference between 2% and 0% . . 114
3.9 Implied Insurance Per Bank - Jump Diffusion Model (mGBP) . . . 120
4.1 Financing of H. Lotery by Jim Slater . . . . . . . . . . . . . . . . . 146
4.2 Simplified Slater Walker balance sheet at year end 1968 . . . . . . 157
4.3 Bank of England Comparison Report - Year End 1972 . . . . . . . 186
4.4 Bank of England Analysis of Slater Walker Limited . . . . . . . . . 197
4.5 Condensed Income Statement for SWS (thGBP) . . . . . . . . . . 201
4.6 Maturity Profile for Slater Walker (mGBP) . . . . . . . . . . . . . 214
4.7 Total Charge For Bad Debts In Four Years To 28th February 1977 234
5.1 Rescue Operations Overview . . . . . . . . . . . . . . . . . . . . . 256
5.2 Schedule of Support - Shared Risks . . . . . . . . . . . . . . . . . . 260
5.3a Summary Statistics - Cash . . . . . . . . . . . . . . . . . . . . . . . 277
5.3b Summary Statistics - Advances . . . . . . . . . . . . . . . . . . . . 277
5.3c Summary Statistics - Deposits . . . . . . . . . . . . . . . . . . . . . 278
5.3d Summary Statistics - Bills . . . . . . . . . . . . . . . . . . . . . . . 278
5.3e Summary Statistics - Investments . . . . . . . . . . . . . . . . . . . 278
5.3f Summary Statistics - Other Assets . . . . . . . . . . . . . . . . . . 279
5.3g Summary Statistics - Eligiblie Liabilities . . . . . . . . . . . . . . . 279
5.4 Cash Correlation . . . . . . . . . . . . . . . . . . . . . . . . . . . . 282
5.5 Advances Correlation . . . . . . . . . . . . . . . . . . . . . . . . . 282
LIST OF TABLES xi
5.6 Deposits Correlation . . . . . . . . . . . . . . . . . . . . . . . . . . 283
5.7 Granger Causality Test Result Summary . . . . . . . . . . . . . . . 299
5.8 Granger Causality Sub-Sample Results . . . . . . . . . . . . . . . . 301
5.9 Cointegration Relationships by Decade . . . . . . . . . . . . . . . . 302
5.10 Cointegration Relationships by Decade - Big Four Together . . . . 303
5.11 Empirical Exercise Result Overview . . . . . . . . . . . . . . . . . 304
5.12 Summary Statistics for Real Series . . . . . . . . . . . . . . . . . . 306
5.13 Correlation Matrix for Secondary Banks and Big Four . . . . . . . 316
5.14a Sub-Samples of Correlation Matrix - Pre-crisis . . . . . . . . . . . . 317
5.14b Sub-Samples of Correlation Matrix - Crisis . . . . . . . . . . . . . . 317
5.15 Granger Causality for Secondary Banks . . . . . . . . . . . . . . . 318
5.16 VAR Granger Causality including Secondary Banks . . . . . . . . . 320
5.17 Granger Causality Tests for Full VAR(12) . . . . . . . . . . . . . . 335
5.18 Granger causality tests for deposits-only VAR(12) . . . . . . . . . . 336
Chapter 1
Introduction
1.1 Disentangling Financial Institutions and Gov-
ernment
The study of the financial sector arguably represents the greatest linkage between
micro- and macroeconomics. On the micro side, studies of the sector involve address-
ing inherent issues regarding market imperfections - both informational and other.1
As for macro, the financial sector serves represents the machine whereby the all-
important preferences for present versus future consumption are matched. As such,
the sector stands as an element of macroeconomics that can be forgotten at times
but always returns. That is to say, while financial intermediation can be dismissed
for certain purposes within macroeconomics, such as business cycle fluctuations un-
der certain conditions, no complete account of the macroeconomic framework, or the
1The reason for this of course being that if the financial sector worked in the same way astraditional markets for goods there would be need to direct special attention to it.
1
2 CHAPTER 1. INTRODUCTION
macroeconomic history of any country, can be laid out without accounting for the
role of the financial sector.
It is, however, in the sector’s nature that any modelling or estimation of its
effects and role contains several complications. Measuring the value added by the
sector, for example, is no straightforward task. While traditional sector values can
be calculated by subtracting each sector’s input from its output, such calculations
are not feasible for the financial sector due not to only its intermediary role but
the wide range of information imperfections, externalities and other market failures
which accompany it.
As pointed out by Haldane et al (2010), according to traditional calculations of
value-added from intermediaries, the financial sector’s largest contribution to value
in recent years came during the height of the global financial crisis, in the autumn
of 2008.2 This is due to the fact that the calculation of a sector’s value is estimated
by looking at the differences between the resources used and the resources produced.
For the financial sector, this involves calculating the difference between an institu-
tions’ cost of funding and its charge for services provided, also known as the spread.
Financial market spread is however also an indicator of stress in the system, as in-
creased volatility leads to financial institutions increasing its spread in the face of
uncertainty, rendering simplistic value-added calculations meaningless.
In fact, any estimation of the effect and contribution of the financial sector
runs into similar difficulties due to the sector’s intrinsic information imperfections
and externalities. Another complicating factor when studying the financial system
is calculating the efficiency by which firms use their capital. This is commonly, and
simplistically, measured by calculating firms’ return on equity or return on assets.
2Turner (2010) also provides an overview of the challenges facing researchers on the financialsystem and the multitude of potential difficulties.
1.1. DISENTANGLING FINANCIAL INSTITUTIONS AND GOVERNMENT 3
However, such calculations do not take into consideration the risk or uncertainty
involved which are fundamental elements of bank operations. This is an example of
Arrow’s classic argument that producers that specialize in information cannot exhibit
their true value without rendering themselves redundant.3
An additional, non-trivial element that introduces opacity into the analysis of
the financial sector is the government’s extensive role in the sector. This role, which is
intended to combat problems that arise due to the aforementioned market failures in
the financial system, has traditionally involved a carrot-and-stick approach whereby
the sector is provided with services to ameliorate the market failures at hand but
in turn has to abide by restrictive rules regarding funding, asset selection and other
related restraints. This government involvement makes any kind of assessment of
broadly defined underlying value, or worth, trickier still.
The aim of this thesis is to take a closer look at this last peculiarity of finance,
namely the interplay between the public sector and the financial sector. The thesis
represents an attempt to untangle the outcome, or value, of financial market activity
that is due to the presence of the public sector and the core value which can be said
to be attributable to the sector as a standalone one. It is perfectly possible that
the aggregate value added of the financial sector as a stand-alone sector would be
exactly the same as it is now, leading to the conclusion that public intervention in
the sector is revenue neutral. However, it is also a real possibility that the value
would be greater - due to distortions created - or less - due to subsidies involved - as
the two are closely integrated.4
Such a separation of activities between public and financial sectors can, however,
3See Arrow (1962) and Arrow (1963).4This echoes Stiglitz (1994), who covers the role of the state in financial markets and emphasizes
government’s imperfect resolution of market failure (p. 32).
4 CHAPTER 1. INTRODUCTION
be only imprecise at best due to the lack of counterfactuals and the interconnect-
edness of the two sectors. Nonetheless, despite the inevitable imprecision of any
conclusions, the task remains a crucial one to undertake if one is to gain an un-
derstanding of the financial sector and its underlying social value. In this thesis I
approach the task of disentangling government from the financial sector through two
different, but related, disciplines; history and economics. The former provides us
with the necessary institutional context and empirical data while the latter is useful
in thinking about the quantities involved and dynamics at play.
The period and country chosen to address these issues is Britain in the 1970s.
Britain possessed during this period, as it still does, a major financial centre and was
at the forefront of financial development. It had not experienced a banking crisis
for decades and financial crises were a phenomena that was thought to be consigned
to the past.5 This all changed with the onset of the often overlooked secondary
banking crisis of 1973-1975.6 While the crisis caught both market participants and
policymakers off guard, it was preceded by a narrative familiar to anyone with passing
knowledge of a typical financial crisis, namely easy access to credit, a run-up in
property prices and the emergence of new types of financial institutions.
The narrative surrounding the secondary banking crisis in the historical litera-
ture is generally threefold with the main emphasis on the aforementioned property
bubble, lax regulation and accommodative economic policy. Reid (1982) provides
5In fact, Turner (2012) argues that there were no systemic crisis in Britain between 1826 and2007. Furthermore, even non-systemic crises were absent between 1914 and 1974. This stylized factof a calm period in British banking leading up to the 1970s was also to some extent the experienceof other advanced economies although the calm period was in certain cases shorter than in Britain.
These developments are covered later in the thesis.6As stated by Kynaston in the preface to Reid (1982), ”[t]he mid-1970s are now depicted,
invariably in near apocalyptic brushstrokes, as the time of Britain’s most severe political, socialand economic peacetime crisis since the immediate aftermath of the Napoleonic Wars, if not earlier.[...] Yet one episode, arguably just as important and pregnant with possibilities as at least most ofthe others, has gone strangely missing from our collective memory: the secondary banking crisis”.
1.1. DISENTANGLING FINANCIAL INSTITUTIONS AND GOVERNMENT 5
one of the best overviews of the crisis and emphasizes all three factors.7 The Bank of
England itself reached a similar conclusion in a post-mortem of the crisis in its Quar-
terly Bulletin. It concluded that the causes of the crisis could be categorized into two
groups; structural issues in the financial system and the economic conjuncture.8 The
former included limits to the Bank’s supervisory function and the misapplication of
credit control while the main components of the latter were property developments
and the increase in money supply.
Furthermore, as the crisis was the first of its kind for a long time - both domes-
tically and globally - central banks’ role when it came to financial stability had taken
a backseat to the management of the business cycle via’ monetary policy and govern-
ments’ fiscal policy.9 These circumstances provide us with vast amounts of archival
data that shows how policymakers moulded their role in stabilizing the financial
sector on the go and reinvented themselves as crisis managers.
An additional advantage of focusing on one of the world’s major financial cen-
tres is that it can be isolated better than many less developed financial systems that
are or were not at the forefront. The framework in place in the latter type of sys-
tems is often based on the more developed systems, with regard to both the legal
and institutional environment, and their policymakers can also try to manage their
development towards the frontier by learning from those at the frontier. The leading
countries, like Britain, on the other hand, must generally put up with a learning-
by-doing type mechanism. When trying to ascertain how decisions are made it is
thus more often the case that it is done internally, rather than gaining insight from
7Reid was helped by the fact that she was assisted by, amongst others, Eric Faulkner, Chairmanof Lloyds at the time who also served as Chairman of the Committee of London Clearing Bankersthrough much of the secondary crisis. (Lloyds Archives, HO/Ch/Fau/5, document dated 09/02/83).
8Bank of England (1978)9Chapter 2 reviews the evidence of the unusual absence of crises leading up to the period.
6 CHAPTER 1. INTRODUCTION
abroad.
This is an important point as one objective of this thesis is to gain insight into
how policymakers managed the crisis and whether one can credibly state whether a
clear, preferable alternative was viable. The intention of this thesis is thus not to
accept or reject the consensus view of the causes of the crisis. Instead, the topic
of interest is altered somewhat so that instead of looking at the causes, the focus
is on the specifics of policymakers’ decision-making process, their actions and the
intangible effect of these actions.
Placing the period in question further in context, the 1970s also signify the
return to volatility within the financial markets of developed countries. The post-
war period up until the 1970s was largely crisis free and stands out in financial history
as an uncharacteristically calm period.10,11 This had major repercussions with regard
to the reaction of policymakers when volatility returned as institutional experience in
dealing with these issues was almost nonexistent and the focus had shifted to other
matters.
As indicated above, there is general agreement on the crisis narrative, both as
regards to causes and consequences. This familiar narrative, however, circumvents
three important issues which this thesis attempts to deal with:
• While the reaction by the Bank of England may have been necessary when
looked at at the time of the intervention, it was also the role of the Bank to
prevent the need for such action in the first place. In Chapter 4 I thus ask
if, and when, the crisis could have been mitigated or dampened, as well as
analyzing the risks involved in the Bank’s policies. This is done via a case
10See Bordo et al (2001) who document the vast difference in the number of crisis periods duringthe 20th century.
11This return to volatility is covered in greater detail in Chapter 2.
1.1. DISENTANGLING FINANCIAL INSTITUTIONS AND GOVERNMENT 7
study of the most famous casualty of the crisis, Slater Walker. One possibility
is that preventing the developments that are thought to have led to the crisis
was impractical, or even impossible, for the Bank, but such questions have
mostly been ignored in the literature.
• Analysis of the Bank of England’s role as crisis manager is often given a binary
role; that the Bank could have done what it did or alternatively been completely
hands off. In Chapter 3 the Bank’s role is tackled in a different manner, by
looking at the potential for subsidies in the Bank’s actions and whether its
crisis management activities, when deemed necessary, were priced correctly.
• Amongst the most common rationales given for intervention by central banks,
including that during the secondary crisis, is the threat of contagion, or more
generally that interconnectedness means that action must be taken. That is
to say, perceived problems of one institution can have adverse effects on other
institutions whether their fundamentals warrant these effects or not. This
was most definitely a worry for policymakers during the secondary crisis. In
Chapter 5, we thus look at interdependence both within the core of the system
as well as from the fringe to the core. Policymakers’ and banks’ views on these
issues are also discussed to shed light on how serious the threat was.
By tackling these specific questions, the aim is to provide added depth to the
literature via two distinct channels. Firstly, the thesis moves away from the afore-
mentioned traditional narrative approach of the literature on the secondary crisis.
This entails asking different questions than previous research and moving towards
a more analytical view of governments’ role in the financial sector. Secondly, pre-
viously confidential data is used which allows coverage of specific aspects of the
8 CHAPTER 1. INTRODUCTION
financial sector in greater detail than in earlier attempts.
The contribution of this thesis is thus primarily a deepening of the discussion
on the state’s role in financial markets. This is achieved in several ways. Firstly,
Chapter 3 sheds new light on the effect of mechanisms such as deposit insurance
by moving away from the assumption of Normal distribution and highlights that it
is indeed the possibility of unusually large negative returns that introduces pricing
issues.12
Another contribution, found in Chapter 5, is an alternative look at intercon-
nectedness than is usually found in the literature. This is achieved by looking more
closely at how both public and private parties viewed the system as the crisis played
out and how the former was thought to be alleviating problems without putting itself
at risk. It is also achieved by looking at different indicators than many of the other
quantitative pieces of the literature with emphasis on high frequency balance sheet
data, in addition to the more traditional focus on equity prices.
Finally, all the main chapters look in detail at decision making, constraints and
possible consequences of policymakers and their actions. This is not often the case
in the economic literature and while it is the case in the historical literature, there
are few recent works on the period in question which means that the archival data
used was not often available for prior studies. For example, the main reference in the
literature remains Reid (1982) which did not have access to the material involved.
More recently, Capie (2010) does include coverage of the secondary crisis but does
so both in less detail, as the topic covered is broader, as well as from a different
perspective.
12While some prior research has used non-Normal option pricing to look at put options, e.g. Kou(2002), the subset of detailed empirical studies of deposit insurances as put options has by andlarge involved Normally distributed asset returns.
1.2. METHODS AND SOURCES 9
1.2 Methods and Sources
[W]e cannot aspire to know the world with complete precision; [...] no
single parameter will measure with precision how our economy is going
to respond to a policy or a shock. Rather, what we can aspire to establish
is a combination of logic, modelling, suggestive anecdote and experience,
and empirical measurements from multiple different perspectives that lead
to an overall view on economic phenomena. That kind of overall view on
economic phenomena moves the world forward much more than a precise
estimate of a single parameter.
Larry Summers13
One explicit goal of this thesis, as mentioned above, is to blend together the various
strands of the economic and historical literature. There is currently, and has been for
some time, a well known disconnect between both the approach and methods used
by economists and historians.14 The former group tends to emphasize the analytic
aspect via models, quantitative estimation and calibration whereas the latter are
more context specific, focusing on more of a narrative angle and qualitative evidence.
Neither approach is thus without merit and are in the view of the author not
only complementary but neither alone sufficient to study matters such as the one at
hand. This thesis consequently attempts to employ both approaches in an attempt
13Summers (2013) p. 1.14The divide has in some sense narrowed with the Cliometric ’revolution’ in recent years although
skepticism still remains between the neighbouring camps. Solow (1985) provides a lucid accountof the differences and complementarities between the two disciplines. Crafts (2011b) argues for asynergetic relationship between history and economics. Gorton (2012) argues along similar notes,stating that economists without a historical perspective are myopic (p. 96). Eichengreen (2011)argues indirectly that a partial convergence has taken place with the so-called new monetary andfinancial history. Cairncross (1996) pp. 1-16 provides an optimistic, albeit slightly dated, view.
10 CHAPTER 1. INTRODUCTION
to analyze the subject with all available tools so as to give the topic as complete a
treatment as possible.
Starting with the quantitative methods, regression analysis is employed and asset
pricing models to estimate the extent of important aspects of the financial sectors.
The asset pricing model drawn on is an option model used in Chapter 3 to estimate
the extent of implicit subsidies from the Bank of England to the financial sector’s
most central institutions. We start with a traditional Black-Scholes model before
constructing a Jump-Diffusion model to account for distributional issues and to in-
troduce the possibility of crises. The data used for this model consists of equity
prices as well as financial data from annual reports including numbers for debt and
equity.
The motive for such an approach is the general infallibility of these institutions
and the perceived, and by no means unwarranted, perception that the Bank of Eng-
land would not let these institutions fail if their existence was threatened. There
is a long tradition of using option pricing in such calculations although the chapter
deviates from the literature by altering the traditional distribution assumption and
placing the results in historical and institutional context.15 The model’s parameters
are also calibrated in an attempt to see how conservative the values need to be for
the subsidy to be trivial.
The regression analysis, introduced in Chapter 5, serves as an attempt to look at
interdependence within the financial system and the sector’s vulnerabilities during
a financial crisis. Quantitative data from Britain’s clearing banks, that is available
at a higher frequency than in most other cases, is used to estimate the amount of
15The original studies include Marcus and Shaked (1984) and Ronn and Verma (1986).
1.2. METHODS AND SOURCES 11
interdependence within the system in both normal times and during crises. As with
the option pricing method, there is also a long tradition of looking at the effect of
crises on co-movements of financial data. Various cuts of the data are looked at in the
chapter, including volatility and the link of balance sheet movements with market
prices, in an attempt to shed greater light on the operations of the banks during the
crisis.
One drawback of a bulk of the previous literature is that it is mostly focused on
publicly available data such as equity prices and bond yields.16 The reason for this
is that balance sheet data is usually at best only available at quarterly intervals via
published company accounts. This makes it hard to map the dynamics of balance
sheet variables over times, as crises tend to happen suddenly and over shorter in-
tervals. The collection of the data used therefore represents a different take than is
usually taken in the interdependence literature.
This applies to the qualitative sources as well, which are used throughout and
form an integral part of the thesis. The primary sources used are first and foremost
archival material, retrieved from public institutions. Chief amongst these is the Bank
of England, although extensive material is also used from the National Archives and
the London Metropolitan Archives, as well as private financial institutions, most
notably HSBC and Lloyds. This historical material is particularly central in Chapter
4 as the chapter serves as a case study into one of the 1970s most iconic firms,
Slater Walker. The historical material is nonetheless also critical in the other main
chapters as well and serves as a pillar to complement the quantitative material of
16Recent studies, reviewed in Chapter 5, have attempted to tackle this problem by using interbankdeposits to measure stress and contagion. Generally, however, higher frequency data on aggregatebalance sheet data has not been available.
12 CHAPTER 1. INTRODUCTION
those chapters.
This qualitative material comes in various guises. These include internal and
external correspondence of particular institutions, minutes of meetings and various
types of financial data. In addition to these primary sources and the relevant sec-
ondary material, extensive use is also made of contemporary newspapers and trade
magazine to both gauge the view of the time as well as to further deepen the analysis
in each chapter.
A particularly important point regarding the primary sources is the so called 30-
year rule in place within British public institutions and many private ones as well.
This rule states that records be made openly available for research by the time they
are 30 years old.17 This means that at the time of writing this thesis, the documents
created during the 1970s had just recently been opened for researchers. There is thus
a wealth of newly available information which, in the context of financial history,
should shed much needed light on the decade in question, especially the secondary
banking crisis. As mentioned above, many private institutions also operate under a
similar rule regarding access to their archives and this material is used extensively
in this thesis.
There has been a large boom in the attempt to better understand the issue of
lender of last resort (LOLR) and financial stability issues more broadly following the
global financial crisis.18 New empirical techniques and theoretical frameworks have
taken centre stage as researchers attempt to untangle the various aspects involved.
17The rule was in fact amended recently and has since become a 20 year rule. These changescame following an independent review of the rule, chaired by Paul Dacre and released in 2009. Alarge part of the new material in this thesis was made available due to the 20 and 30 year rules.This includes high frequency balance sheet data for the Big Four, used in Chapter 5.
18There are various different uses of these terms in the recent literature. Chapter 2 discussesthese issues and the definition used in this thesis.
1.3. THESIS OUTLINE 13
It is, however, an underlying assumption of this thesis that greater understanding
of these issues can most readily be gained by increased data and information on
previous crises episodes. By looking at actual crisis responses of policymakers and
what actually happened is arguably the most direct path to deepening understanding.
This framework is the guiding light of this thesis, the contents of which are outlined
below.
1.3 Thesis Outline
This thesis addresses the research topic outlined above with three main chapters,
outlined below. The chapters are interdependent and involve looking at different
aspects of the British financial sector in the 1970s, but all fall under the main theme
of the thesis and serve to shed light on this complex topic through distinct channels.
They each deal with separate, but connected, parts of the financial sector that all
played a central role in the secondary crisis. These three parts are the central bank,
the largest commercial banks and the newly established secondary banks. Following
this introduction, the thesis starts with a chapter on its context, including histo-
riographical and economic literature. The three main chapters then follow while a
concluding chapter attempts to tie the results of the chapters together and discusses
the thesis’ potential findings.
Chapter 2: Context and Literature Review
This chapter serves as the motivator for the thesis and puts the topic into perspective.
It does this via two channels; the historical and economic literature. The historic
section looks at the pre-existing literature on British banking in the 1970s and the
14 CHAPTER 1. INTRODUCTION
current view on matters such as the causes and consequences of the secondary bank-
ing crisis. It also sketches a broad outline of the economic framework of the time,
both domestic and international. An important conclusion reached in this part of
the chapter is that, in a broad sense, the 1970s represent a return to volatility in
financial markets following the famous post-war banking stability. This has impli-
cations when attempting to interpret the reaction of policymakers as institutional
knowledge on crises tools had diminished.19
The economic section of the chapter surveys the literature on implicit subsidies,
lender of last resort facilities and financial crises in general. This is done by looking
at the theoretical work in the field, the empirical results of the literature as well as
the methods used and the rationale behind them. Great strides have been made in
the past decades in analyzing the financial sector and its inherent, unique complica-
tions. This has primarily come about via a better recognition of the importation of
information and expectations, starting in the 1970s, as well as increasingly sophisti-
cated models dealing with both economic theory and empirics.
Chapter 3: Subsidies and Stability
The secondary banking crisis in 1970s Britain was amongst the first crises following
the breakdown of the widespread post-war stability in the global financial sector. It
can be said to represent the return to volatility as the decades following the crisis
witnessed a dramatic increase in financial and banking crises, culminating in the
2008 global financial crisis. In this chapter, we look at the relationship between poli-
cymakers and the financial system leading up to, during, and following the secondary
19Goodhart (2011) p. 140 for example claims that ”the general absence of financial stabilityproblems meant that experience and interest in this field in central banks eroded”.
1.3. THESIS OUTLINE 15
crisis. The chapter focuses on how institutional knowledge regarding financial sta-
bility policies and banking regulation had somewhat wilted away and failed to keep
up with the changing nature of the financial system.
The primary focus is through the lens of the Bank of England with the aim of
answering two overarching questions: How did the Bank approach its financial sta-
bility policy and was there potentially an implicit subsidy involved with the way the
financial system was set up at the time? It is concluded that the Bank tackled each
episode of financial turmoil with an ad hoc approach and in all likelihood seriously
underpriced financial institutions for its guardian services.
Chapter 4: Simplistic Approaches to Regulation
One reason regularly cited for the tumultuous nature of 1970s banking in Britain
is the emergence of new types of financial institutions known as secondary banks.
These banks had certain distinct characteristics which increased the likelihood of a
systemic financial crisis including rapid growth and extensive maturity transforma-
tion, limited banking expertise compared to more traditional banks, and a stand-off
approach from regulators, namely the Bank of England. The most famous of these
secondary banks was Slater Walker, which exhibited dramatic growth in the mid
to late 1960s, enabled by cheap funding and asset price increases, before collapsing
dramatically towards the end of the crisis in 1975. The Bank of England reluctantly
orchestrated a complex and involved rescue of the bank to protect depositors and
prevent contagion. Using newly available data, the chapter charts the spectacular
rise of the bank as well as its demise and bailout, all through the lens of the Bank
of England. The conclusion is that the BoE’s policy of detachment from firms such
as Slater Walker during their rise proved crucial and its approach once a bailout was
16 CHAPTER 1. INTRODUCTION
required fuelled expectations of government assistance to private institutions.
Chapter 5: Interdependence and Interconnectedness
While Chapter 3 covers the what of the crisis management policies, and Chapter 4
covers the how, this chapter will focus on the why. That is to say, what motivates
public authorities in their rescue of private institutions and why can’t they be al-
lowed to fail like other private firms? One of the findings of other chapters of the
thesis is that fear of a domino effect, whereby a small and containable problem starts
to spread through the system, was a large motivator in the rescue attempts made
during the secondary crisis. This chapter therefore goes deeper behind this motiva-
tion and looks at whether such a domino effect is to be found during the period for
the largest banks. We also look at the response to the crisis from the point of view
of the big banks, as opposed to the Bank of England as in the previous chapters,
and their relationship with policymakers during the crisis. New light can be shed
on these matters in the chapter using high frequency data. For the interdependence
study, monthly balance sheet data is used for the most part of the 20th century with
additional comparisons made to equity price data for both the core and the fringe
of the system. For the banks’ crisis response, historical evidence is used, including
minutes of meetings and letters between the banks and the Bank of England.
Chapter 6: Conclusions
The concluding chapter summarizes the results from the preceding chapters before
connecting the individual chapters to form a coherent entity. More concretely, the
individual chapter conclusions are categorized via the implementation, effect and role
of the Bank of England’s financial stability measures. Regarding the implementa-
tion of the policies, one of the principal conclusions is that a greater understanding
1.3. THESIS OUTLINE 17
from within the Bank of England on day-to-day banking operations would have been
required prior to the crisis for the Bank to perform its regulatory role. However,
even if this knowledge had been in place, actions would also have needed to be taken
much sooner than they ultimately were in order to adequately implement the Bank’s
functions. As for the effect of the Bank’s intervention, the conclusion is that both the
qualitative and quantitative evidence points to potential subsidy effects. The Bank
of England took its role of shielding creditors very seriously and with much greater
emphasis than that of subsidy prevention. Furthermore, the quantitative evidence
shows that only in the case of extremely conservative parameter values would the
cost of providing the services be trivial according to the model used.
Finally, as for the role Bank’s activities, the conclusion reached is that balance
sheet data for the largest and most shielded banks does not imply interdependence,
which was a primary reason for intervention by the Bank of England. Another
property of the data is that equity interdependence is much greater than debt inter-
dependence while equity price data shows that the secondary banks had an effect on
the core banks but not vice versa. An important caveat here is that equity represents
a small fraction of bank’s balance sheets and the effect of the debt performance is
less clear. As for the qualitative evidence, it is concluded that the Bank’s role in
the Lifeboat operations was perhaps greater than previously indicated in the liter-
ature. Following these individual chapter summaries, the concluding section then
mentions possible policy implications and places the results in the context of the
prior literature.
Chapter 2
Context and literature review
2.1 Introduction
The goal of the thesis is to shed light on the government’s role in the financial sector
through the lens of the secondary banking crisis of 1973-1975. While the thesis uses
the crisis as a focal point, it will also cover earlier and later years in an attempt to
compare calm periods with volatile ones, place the crisis in context, and possibly
to try to pinpoint previously overlooked developments that led to the crisis. The
crisis itself came amidst radical changes in the British financial sector’s internal and
external environment. These changes were multifaceted, coming both domestically
and internationally as well as stemming both from developments within the financial
sector itself and through changes in the structure of the broader economy.
This chapter has two overriding goals. The first is to set the stage for the crisis
and contextualize the scene for the financial system in the early 1970s both with
regard to the aforementioned developments and the historiography of the period.
18
2.1. INTRODUCTION 19
The second goal is to place the crisis in context regarding the relevant economic
literature and the analytic framework used in the main chapters. However, the
literature review is not exhausted in this chapter. Instead the focus here is on
material and developments relevant for the thesis as a whole while chapter specific
literature is dealt with in each subsequent chapter. We thus try to remain in touch
with the literature throughout the thesis while keeping this chapter more general in
nature.
The story of post-war banking in Britain has traditionally been seen as two-
fold; the calm continuation of pre-war banking based on informalities, traditions
and relationship building followed by the evolution towards a more competitive,
global environment with tremendous financial innovation and new types of financial
institutions.20 A well documented property of this two-fold story is that the former
period was accompanied by greater financial stability while instability started to
reappear alongside the latter period.
This is in line with global developments, for example empirical studies on crisis
frequency, (e.g. Laeven and Valencia (2010) and Reinhart and Rogoff (2008)), that
find that post-war financial markets were remarkably stable up until the 1970s when
the occurrence of crises started increasing again. Bordo et al (2001) also note that
crises became much more frequent in the 1970s and in fact doubled in frequency from
that of the Bretton Woods and classical gold standard periods. Bordo and Eichen-
20This distinction is a common one, see e.g. Grady and Weale (1986) and Capie (2010). Good-hart (1986) details the various financial innovations in the British financial system starting in thelate 1960s. He splits them into two categories, monetary and credit innovations and goes on toargue for four developments as a consequence of these innovations; increased competition, changingcharacteristics of instruments and rates, growing unification of the global financial system and thedevelopment of the payments’ system. Cobham (2002) details the stages of financial innovation inBritain in the 1970s and 1980s. He emphasizes the lead to more competition on both sides of thebalance sheet during the period as well as narrower margins and lower costs.
20 CHAPTER 2. CONTEXT AND LITERATURE REVIEW
green (2002) count 18 banking crises in industrial and emerging markets between
1919 and 1939, none between 1945 and 1971, and 26 between 1973 and 1997.21
The development from the post-war stability to the more recent instability can
be said to have started to take place in the late 1960s, and while these develop-
ments were partially global in nature, Britain’s position as a global financial centre
meant that many of the symptoms that accompanied greater innovation and fewer
restrictions were felt sooner and to a greater extent within the country. The global
developments that applied more generally to global markets, as opposed to specif-
ically to Britain, include the opening of markets and the gradually more positive
attitude towards competition within banking which lead to a transformation of the
way banks operated, both regarding incentives and constraints.
Following this change in the landscape, the economic literature has in turn
evolved a great deal with increasingly added emphasis on the nuances within finance
such as the non-linearities involved, informational issues including adverse selection
and moral hazard, and contagion within financial networks. These threads between
the historical developments of the sector and the economic and analytic literature
are the key drivers of the chapter which proceeds as follows. Section 2 provides the
historical context of the thesis. This includes both tracing the economic and finan-
cial sectors and previous work on the interpretation of the sectors’ developments. In
Section 3 the focus turns to the economics with a review of both the theoretical liter-
ature as well as the empirical. I seek to give a comprehensive view of the knowledge
on financial crises and the role that the public sector plays in them. Section 4 points
the way forward by reconciling the economic and historic literature.
21Bordo and Eichengreen (2002), Table 6. As for domestic developments in Britain, Metcalfe(1982) indirectly addresses this by calling the secondary crisis ”the most serious to hit the industryin this century” (p. 75).
2.2. HISTORICAL AND HISTORIOGRAPHICAL CONTEXT 21
2.2 Historical and Historiographical Context
This section focuses on the macroeconomic and financial developments during and
surrounding the secondary crisis as well as the related literature. I start by briefly
discussing the main macroeconomic developments of the time and how policymak-
ers approached these issues before moving towards the financial system and more
narrowly to the topic at hand. The literature on British post-war economic history
is vast, to say the least, and has been covered in detail from many angles. Chief
amongst these angles is the growth story which has even been given its own term;
the British disease. This phenomena points to the fact that post-war growth in
Britain was substantially lower than that of its neighbouring countries, leading to
convergence - and in some cases overtaking - by its rivals.
As an example, real GDP per capita was 33% higher in the U.K. than in Ger-
many in 1937 but by 1979 the U.K. had fallen 14% behind the Germans. A similar
story applies to Britain’s other European rivals, such as France, while the U.S. in-
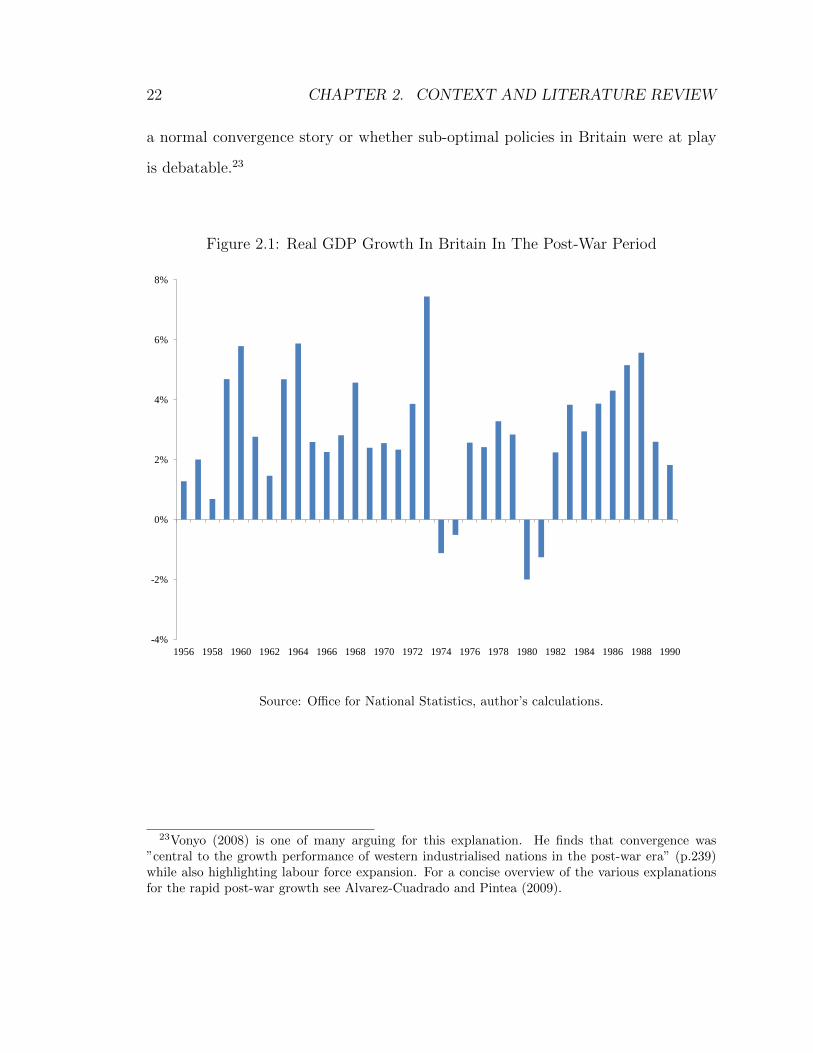
creased its advantage during the period.22 Figure 2.1 shows British quarterly real
GDP growth from 1956. As can readily be seen, GDP growth was negative on a
yearly basis for the first time in a very long time during the crisis studied in this
thesis, namely 1974 and 1975. On a quarterly basis, the economy experienced neg-
ative growth during seven quarters from 1956 to 1979 - four of which were in 1974
and 1975.
Temin (2002) provides a comparison of 15 Western European countries between
1935 and 1975 showing that growth was lowest in Britain at 2.1% compared to an
average growth rate of 3.7%. The extent to which this development was a result of
22Numbers from Maddison’s database as quoted by Crafts (2011a).
22 CHAPTER 2. CONTEXT AND LITERATURE REVIEW
a normal convergence story or whether sub-optimal policies in Britain were at play
is debatable.23
Figure 2.1: Real GDP Growth In Britain In The Post-War Period
-4%
-2%
0%
2%
4%
6%
8%
1956 1958 1960 1962 1964 1966 1968 1970 1972 1974 1976 1978 1980 1982 1984 1986 1988 1990
Source: Office for National Statistics, author’s calculations.
23Vonyo (2008) is one of many arguing for this explanation. He finds that convergence was”central to the growth performance of western industrialised nations in the post-war era” (p.239)while also highlighting labour force expansion. For a concise overview of the various explanationsfor the rapid post-war growth see Alvarez-Cuadrado and Pintea (2009).
2.2. HISTORICAL AND HISTORIOGRAPHICAL CONTEXT 23
As noted by Kitson (2008):
Explaining Britain’s poor economic performance has been, and contin-
ues to be, a growth industry [..] new – or in most cases newly resurrected
– culprits include poor entrepreneurship, low levels of innovation and in
particular a failure to commercialise science, a paucity of high-technology
clusters and low levels of social capital. 24
As mentioned above, this topic has received arguably the greatest amount of
attention in the post-war economic history of Britain and, as noted by Kitson, there
are many competing arguments. Due to space limitations, the topic is not discussed
further here but Crafts (2012) provides a recent take on the issue.25. The other
prominent contextual issue of an international nature during the period was that
of Sterling’s position in the global economy. Sterling’s journey following WW2 was
famously dramatic despite the nominal peg accompanying the Bretton-Woods era.26
Preventing devaluation was no mean task as the currency came under repeated
pressure, especially in the 1960s. In fact, Sterling came under sustained pressure in
four separate years during the 1950s and continuously from 1961 to 1968, according to
Oliver and Hamilton (2002).27 The difficulties of maintaining the peg are generally
linked with underlying fundamentals of the economy, such as the aforementioned
lack of growth. One main line of argument is the adverse effects on the balance of
payments due to the continual policy of high demand pursued by the government,
24Kitson (2008) p. 4225For further discussions see for example Broadberry (2004) who compares Britain to Germany,
Booth (2003) who tackles the sectoral decomposition and Cairncross (1996) who in fact emphasisesthe sea-change that occured during the period studied in this thesis, the 1970s.
26The history of Sterling’s plight is one of the deepest literatures in Britain’s post-war economy.The chapter will however only briefly touch upon the main developments as they relate to the topicat hand and provide references to the main works and debates in the area.
27Newton (2009) examines the reasons why the decision was made not to devalue prior to 1967.
24 CHAPTER 2. CONTEXT AND LITERATURE REVIEW
which in turn was motivated by the perceived lack of growth in Britain relative to
that of what were seen as its rival countries.
These issues of preserving stability in the currency amidst a perceived persistent
lack of growth were at the forefront of policymakers’ mind during the period studied
in this thesis.28 They should therefore be kept in mind although a closer look at
the linkages between macroeconomic policy and Sterling’s problems are beyond the
scope of this thesis.29
The effect of the increased turmoil in currency markets and balance of payment
developments should, however, briefly be mentioned due to their relevance to the
thesis topic. While the focus of this thesis is on the secondary crisis of 1973-1975,
which was indeed a relatively pure banking crisis, the interplay between the financial
system and the exchange rate system remained important. The literature on twin
crises and the interplay between banking and currency crises can thus prove relevant.
This topic became increasingly popular following the plethora of emerging market
crises around the world in the 1990s. In that vein, Kaminsky and Reinhart (1999),
in a widely cited paper, look at the connection between the two types of crisis and
conclude that they are often closely linked although banking crises generally precede
currency crises.
This pattern does not fully match that of our case, as the currency can be
seen to have been in crisis regularly for a long period before the banking crisis hit.
Furthermore, emerging market crises are often twin crises due to the fact that the
inflow of money raises credit which increases leverage, affecting both the currency
and the banking system. This is not the case for 1970s Britain as the bank’s could
28The goals and priorities of policymakers is discussed explicitly in Chapter 3 of this thesis.29Bordo (1993) includes an overview of Sterling’s plight in the context of its role as a reserve
currency.
2.2. HISTORICAL AND HISTORIOGRAPHICAL CONTEXT 25
generally rely on domestic funding and there wasn’t a rapid inflow of external credit
leading up to the secondary crisis. Foreign lending wasn’t a prevalent factor in the
crises either so the currency wasn’t a main actor on either the inflow or outflow
side. The link between the two types of crises is thus weaker than in the Kaminsky-
Reinhart framework.30 Note also the fact, highlighted in the twin currency literature,
that the linkages between currency and banking crises are very complex and would
require a stand-alone study to gain any substantial insight into the relationship
between the two. The focus in the thesis is thus on the banking side throughout
while keeping in mind the possible effects felt by any potential balance of payment
stress.
As for the Bretton Woods period specifically and its gradual breakdown, a com-
mon theme in the literature has been to compare the development of macroeconomic
variables before and after the breakdown. Eichengreen (1993) breaks down the pe-
riod into two sub-periods, and concludes that output was remarkably stable during
the second half, or 1959-1971. This applies to both the supply side, which he uses as
a proxy for the underlying environment, as well as the demand side which he inter-
prets as the influence of policy. The floating of exchange rates also coincided with the
pickup in inflation during the early 1970s which was to be, along with the slowdown
in growth, the dominant global theme of the decade. These global shifts will not be
covered in any great detail here due to lack of space but Eichengreen (2007) provides
a concise overview of post-war developments in Europe with considerable material
on Britain and its changing role in the global economy.31
30One factor that is comparable is the fact that crises tend to occur at the turning of the businesscycle, as was the case for the secondary crisis.
31For the more recent period, from 1960 to 2000, Enflo (2011) looks at the change in Europeanpolicies and institutions that coincided with the region’s increase in unemployment from the 1970sonwards and highlights labour market rigidities.
26 CHAPTER 2. CONTEXT AND LITERATURE REVIEW
The most striking macroeconomic development in Britain, as elsewhere, during
the sample period was arguably the rapid acceleration of inflation. This acceleration
was generally seen as a combination of three factors; policy errors, the breakdown of
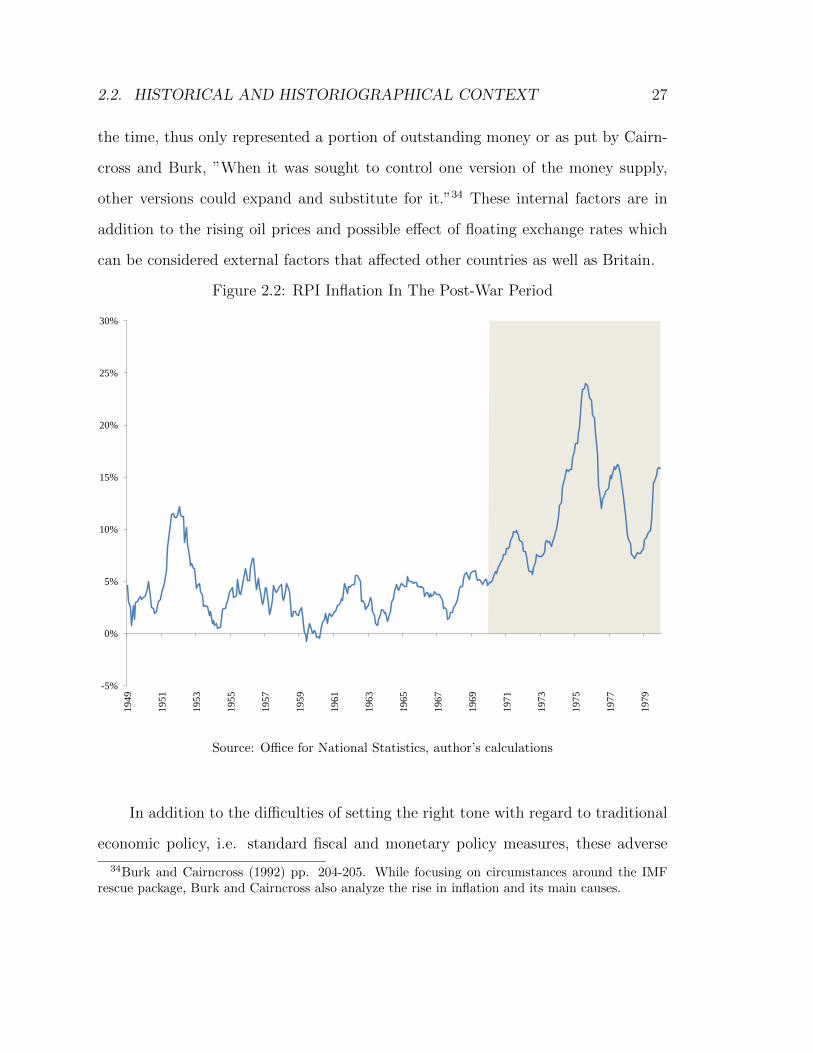
Bretton-Woods and the ongoing energy crises.32 Figure 2.2 shows monthly inflation
in Britain in the post-war period through to the end of the sample period in 1979.
Inflation remained manageable - albeit by no means trivial - throughout the first two
decades of the first-war period. However, it started to rise dramatically in the early
1970s and peaked at just under 25% in 1975.33
Deciding weights on each contributing factor to the increase in inflation is tricky.
A comprehensive discussion on the literature of the inflation of the 1970s is also
beyond the scope of this thesis but the role of policy should briefly be highlighted as
it relates to the policy environment during the period. Stripped to its bare bones,
the contribution of policy errors to the increase in inflation lay in the previously
mentioned accommodative stance of policy due to what was perceived as lacklustre
growth.
A larger fiscal deficit than could be considered prudent and the rapid increase
in money supply thus both played a role in the domestic setting, as argued for exam-
ple by Goodhart (1989). Another aspect, noted by Burk and Cairncross (1992), is
the extent to which financial innovation, highlighted elsewhere, complicated matters
when it came to conventional monetary policy. Monetary targets, as were popular at
32See Bruno and Sachs (1985).33This rise in, and volatility of, inflation heightens the importance of distinguishing between real
and nominal variables for many parts of the thesis. Care is therefore taken through the thesisin looking at both and determining whether any results are possibly due not to the underlyingvariables but the common effect of inflation.This factor is most important in Chapter 5 where thefocus is on developments of balance sheet variables across banks. The common inflation experiencedby the banks could potentially lead to a relationship being found between the different banks soextra care is taken in looking at this possibility.
2.2. HISTORICAL AND HISTORIOGRAPHICAL CONTEXT 27
the time, thus only represented a portion of outstanding money or as put by Cairn-
cross and Burk, ”When it was sought to control one version of the money supply,
other versions could expand and substitute for it.”34 These internal factors are in
addition to the rising oil prices and possible effect of floating exchange rates which
can be considered external factors that affected other countries as well as Britain.
Figure 2.2: RPI Inflation In The Post-War Period
-5%
0%
5%
10%
15%
20%
25%
30%
19
49
19
51
19
53
19
55
19
57
19
59
19
61
19
63
19
65
19
67
19
69
19
71
19
73
19
75
19
77
19
79
Source: Office for National Statistics, author’s calculations
In addition to the difficulties of setting the right tone with regard to traditional
economic policy, i.e. standard fiscal and monetary policy measures, these adverse
34Burk and Cairncross (1992) pp. 204-205. While focusing on circumstances around the IMFrescue package, Burk and Cairncross also analyze the rise in inflation and its main causes.
28 CHAPTER 2. CONTEXT AND LITERATURE REVIEW
developments were also accompanied by the widely discredited policy of Competition
and Credit Control (CCC) in the early 1970s. CCC was a group of measures taken in
a move away from credit ceilings and to attempt to level the playing field in banking
so as to increase competition.35 Richardson (2001) names two main tenants of CCC;
a move away from direct controls in the monetary sphere and towards ”a system
in which market forces could play a predominant role”.36 Ultimately CCC had the
effect of drastically increasing the money supply, by over 20% a year, and is generally
considered to have been a substantial factor in the property bubble and secondary
crisis (see Reid (1982) and Capie (2010)).37 Howson (2008) described CCC as ”the
most spectacular failure to control monetary growth”.38
These attempts at controlling inflation proved equally difficult in the sphere of
the labour market. Unemployment had been favourable in Britain in the immediate
post-war period as indeed in other major economies. However, the persistently low
unemployment of the 1950s and 1960s was somewhat anomalous when compared to
the experience of later decades, both cyclically and structurally. Broadberry (1994)
makes this point and argues further that the wage restraint which contributed to low
unemployment was partially responsible for the lack of productivity growth and thus
Britain’s relative decline. Hatton and Boyer (2005) focus on unemployment in the
immediate post-war phase and contrast it to other periods. They conclude that the
35Moran (1984) describes in detail the events leading up to CCC and how the policy affected thebanking system.
36Richardson (2001) p. 17.37Needham (2012) provides an alternative view of early 1970s’ monetary policy and the differing
stances of Treasury and the Bank of England towards monetarism. Griffiths (1973) provides aview as of the time, arguing that the reforms to the monetary system that were by then underway,including CCC, represented ”the most fundamental change since the end of cheap money policy in1951”. (p. 76). Chrystal and Mizen (2011) also provide an account of monetary developments inpost-war Britain, including CCC.
38Howson (2008) p.152.
2.2. HISTORICAL AND HISTORIOGRAPHICAL CONTEXT 29
main reason for the low post-war unemployment was not lower real wages relative to
productivity, but rather an outward shift in the labour demand curve.39
The re-emergence of unemployment was, alongside the surge in inflation, the
other major concern of policymakers during the 1970s. There are many different
strands in looking at this combination of high unemployment and inflation during
the period. In the economic sense, the breakdown of the short-run trade-off between
the two variables was central to economic thinking at the time.40 These events were
in the main predicted by Friedman (1968) and Phelps (1967) - a rare case of foresight
by the profession. The aforementioned downfall of Bretton Woods amidst exchange
rate problems is another lens through which one can look at the unemployment-
inflation dynamics, as are the energy crises of the decade.41 Hatton and Boyer
(2005) argue for labour demand shifts in the return to unemployment as well as
the adverse economic conditions, depicted above. Tomlinson (2008) implies that
the increase in unemployment was mainly exogenous and outside of the control of
policymakers. Full employment was indeed downgraded as a policy goal during the
1970s but Tomlinson makes the point that the rhetoric - ”served up to maintain
confidence in the financial markets”- was stronger than actual policy measures.42
As for the role of the central bank in management of the economic cycle, the
Bank of England’s post-war goal was generally seen to be that of maintaining the
value of currency and increasingly to foster high employment and growth as well
39See also Hatton (1988) for a longer term analysis of this view with emphasis on wages.40As mentioned by Howson (2008), ”In the years since the Second World War the role of money,
and the use of monetary policy, has been peculiarly subject to the whims of intellectual fashion ineconomic thought, in Britain as elsewhere” (p. 134). See also Booth (1983) and Tomlinson (1983)for a discussion of the interplay between theory and policy as it related to Britain during the period.
41Capie et al (1994) cover these multiple angles and put them in historical perspective. Capieand Goodhart (1995) recite the view that approval for the continued maintenance of fixed exchangerates under Bretton Woods started dwindling in the late 1960s.
42Tomlinson (2008) p.204.
30 CHAPTER 2. CONTEXT AND LITERATURE REVIEW
(see Capie et al (1994)). These ambitious goals changed gradually from the late
1960s onwards as emphasis on competition started to increase and monetary targets
became more popular, especially following the float of Sterling in the early 1970s. On
the financial side, as noted earlier, moves were made to rely more on market prices
and competition instead of direct credit control. Policy during the second half of
the decade was ”a continual struggle against inflation and unemployment”.43 This
volatility in turn paved the way for the height of monetarism in the early 1980s.44
The challenge of dealing with multiple adverse economic developments certainly
took its toll on both policymakers and the economy. Not only did unemployment
and inflation remain stubbornly high - the latter approaching 25% in 1975 - but the
balance of payments also proved difficult to handle after the breakdown of Bretton
Woods. Sterling struggled to keep up in the mid-1970s amidst concerns over gov-
ernment finances as well as the difficulties involved with the energy crisis.45 The
government, struggling to raise funds to cover its expenses and having lost control of
the currency, was ultimately forced to request assistance from the IMF in September
of 1976 - a move that was considered highly humiliating for all involved.46
Moving closer in theme to this thesis, Britain’s financial sector was at the time
considered, as it still is, a global financial centre despite the aforementioned problems
43Howson (2008) p.158.44See Goodhart (1989). He divides the structural changes of monetary policy in the 1970s and
1980s into four periods: The shift of policy towards Monetarism 1970-79, the high tide of Mon-etarism, 1979-82, the return to pragmatism 1982-85, the increasing concern with exchange rateregimes, 1985 onwards (p. 297, pp. 300-311).
45Neal (2008) points out that the oil shock hit Britain harder than the other large Europeaneconomies.
46Floud and Johnson (2008) covers the build up to the IMF agreement from various perspectives.Neal (2008) covers the energy angle and the European side of things, Clark and Dilnot (2008)through the lens of fiscal policy and Howson (2008) looks at the episode in connection with monetarypolicy. See also Burk and Cairncross (1992), which cover the crisis in great detail, and Wass (2008),who covers the lead up to the IMF package from the Treasury’s point of view.
2.2. HISTORICAL AND HISTORIOGRAPHICAL CONTEXT 31
with the macroeconomic environment.47 Amidst the country’s aforementioned rela-
tive decline and struggles, the City of London remained a beacon of pride. Kynaston
(2002) remains the seminal work in this area and covers the sector’s developments
extensively. While taking a longer term view than this thesis, Kynaston’s focus is
very much on the gradual structural shift from old-school banking to the modern
financial system, including during the 1970s.
Watson (2008), surveying post-war British banking, documents this trend as
well and points to the increasing scale of the financial sector throughout the period.
She notes that banking and finance comprised 3% of GDP at factor cost in 1948,
7% in 1975 and 20% in 1995, while similar trends can be seen in other measures of
resource utilization such as employment. Turner (2012) takes a longer term view
and looks at British banking in the 19th and 20th centuries. He concludes that only
two severe and systemic banking crisis took place during the period - in 1825 and
2007 - while the bulk of the interim period coincided with relative stability due to
either high capitalization levels or substitutes for bank capital such as government
constraints.48
Another long-term view is provided by Capie and Goodhart (1995) who, simi-
larly to this thesis, look at the relationship between commercial and central banks.
With the main emphasis on the U.K. and the U.S., they divide the relationship
47The story of London as an international financial centre is not, however, an uninterrupted one.As covered in Cassis (2006), the City experienced a decline following the reversal of the so-calledfirst period of globalization. Cassis attributes this to the state of the economy as well as strictregulation. The City then re-emerged from the early 1960s onwards, a period which he talks of as”the City’s rebirth”. Baker and Collins (2005) chronicle London’s role as an international financialcentre in the post-war period. They document the increase in foreign banks operating in Londonand the importance of the Eurodollar market - a point highlighted as well by Cassis. Baker andCollins also briefly mention the positive attitude of the authorities towards these developments.
48Additionally, Turner’s conclusions are in line with the literature more generally as regards tothe informality of the regulation imposed on the banks during the bulk of the period.
32 CHAPTER 2. CONTEXT AND LITERATURE REVIEW
between central banks and commercial banks into three periods; a shift from a com-
petitive relationship between the two towards the central bank accepting its lender of
last resort responsibilities, a second period whereby the central bank maintained this
role with ”a very limited hands-on, direct regulatory or supervisory function”,49 and
finally a new era wherein central banks are struggling with the appropriate response
to the return of volatility.50
Grossman (2011) in turn points to several financial developments which were
complementary to the macro features mentioned above. These include the gradual
elimination of interest rate controls, the growth of market-oriented mechanisms for
the allocation of capital, and the elimination of direct controls on bank lending.51
Capie et al (1994) show the return of volatility via trends in interest rates. Comparing
four periods, from 1870 to 1991, they find that the volatility of both short-term and
long-term nominal rates was unusually low in the post-war period up until 1971 and
then increased again in the period 1972-1991.
Britain’s position as a global financial centre has resulted in several similar
studies on the long-term history of British banking. Britain also figures prominently
in the literature of lender of last resort, due not only to Thornton and Bagehot’s role
in developing the concept, but also because of the fabled crises of the late 1890s. The
Bank of England’s operations during this period are indeed generally considered a
classical case of the lender of last resort (LOLR). That is to say, the Bank stepped
49Capie and Goodhart (1995) p.160.50Janssen (2009) provides an overview of many interesting aspects of British banking. He covers
the legal definition of banks in the U.K. from the 1970s onwards, as well as the supervisory frame-work. He also gives a rundown of the largest British banks via case studies, many of which featurein this thesis. The period used for the case studies is, however, more recent than that of this thesis.
51The extent to which the secondary crisis has been forgotten can be seen in Grossman’s reviewas he omits the crisis from the events that signified the return to instability, mentioning insteadonly the Herstatt crisis in Germany and Franklin National in the U.S.
2.2. HISTORICAL AND HISTORIOGRAPHICAL CONTEXT 33
in to avert collapses of the money stock by making temporary loans to solvent but
illiquid institutions against good collateral.52
More recently, the practicalities of such operations have been questioned, for
example with respect to the plausibility of determining insolvency during a crisis and
whether interventions into specific institutions, as opposed to the market as a whole,
constitute lender of last resort policies.53 These issues are discussed further below but
it is pertinent here to note that, during the episode being examined in this thesis, the
operations performed would not fall under the definition of the classic LOLR. The
Bank undertook many different types of idiosyncratic interventions during the crisis,
both in collaboration with the clearing banks as well as unilaterally, with different
justifications and different results. It even intervened in cases where it knew there
was a capital shortfall due its worries that failure of many fringe institutions could
both entail unacceptable losses and lead to knock-on effects on other institutions.54
To avoid misunderstanding or points of misapprehension, the more general term
of crisis management is used to describe these actions.55 This term is taken to encom-
pass action on behalf of the central bank to avoid not only a systemic crisis but also
an episode that would result in unacceptable loss -as defined by the central bank - to
either direct stakeholders, such as creditors or shareholders, or indirect stakeholders
including the general public. While LOLR operations could be interpreted as a case
52This definition is often appended with a reference to a penalty rate, although views differ onwhether such a term is called for. See Humphrey (1989) for a review of the classic concept.
53See also Freixas et al (2000) and Humphrey and Keheler (1984).54See the discussion in the next three chapters for examples of this thinking. Kosmetatos (2014)
looks at the 1772-1773 crisis and the extent to which typical lender of last resort policies applied.He discusses measures defined as applying to the market as a whole as well as targeted at specificfirms through direct lending.
55This is in line with Capie (2014) who contrasts the secondary crisis, covered here,and theBarings rescue in 1891 with typical lender of last resort operations. Bordo (1990) covers the variousdifferent arrangements and views of the LOLR. He also mentions the episode under scrutiny in thisthesis as one that differed significantly from the classical doctrine (p.26).
34 CHAPTER 2. CONTEXT AND LITERATURE REVIEW
of such crisis management, in the sense that the central bank intervenes at times of
stress to avoid crises, the opposite is not necessarily true and that is certainly the
case for the secondary crisis.
While the aforementioned crises of the 19th century have received considerable
exposure in the literature, much less attention has been given to the secondary
banking crisis (SBC) of the 1970s, however - possibly due to the fact that it did
not involve dramatic failures of household names.56 One interesting aspect of this
crisis is the fact that British banking had remained crisis free for an extended period
of time leading up to the SBC whereas the period following it exhibited periodic
stress periods. There is general agreement within the literature that a multi-faceted
explanation is necessary to explain why volatility increased following the calm period.
The most popular culprits for the end of the calm period are first and foremost
financial innovation, especially in the form of money market funding and new in-
stitutions, regulatory inattention towards these developments, and macroeconomic
policies that led to rapid rises in money supply and distortions in the financial sys-
tem.57 As for the secondary crisis itself, Kynaston (2002) highlights the property
bubble at the beginning of the decade, fuelled in part by CCC, as well as the regu-
latory angle as contributing factors that would lead to the crisis.
Another prominent account of the financial sector at the time is Revell (1973)
who provides a detailed overview of the structure of the financial system as it stood
56Kindleberger (1984), for example, covers the Bank of England’s historical role as lender of lastresort but makes no mention of the renewed concerns that arose due to the secondary crisis. Infact, his coverage ends in the 19th century despite the recency of the crisis at the time of writing.Watson (2008) also omits the secondary crisis from her overview of the financial services sector inBritain since 1945.
57The main works mentioned here, including Reid (1982), Kynaston (2002) and Capie (2010) allagree on these main developments as catalysts. Moran (1984b) highlights the regulatory problemsthat financial innovation can introduce.
2.2. HISTORICAL AND HISTORIOGRAPHICAL CONTEXT 35
at the time of writing. Little attention is, however, given to ongoing developments
at the time with the focus being on categorization of institutions, markets and prod-
ucts. Grady and Weale (1986), on the other hand, provide both an overview of the
structure and narrative of the development of the financial system between 1960
and 1985. They argue, similarly to the literature in general, that British banking
changed radically during the period, with a regulatory system that didn’t deal with
the introduction of new players on the scene playing a large role.
Moran (1984) represents perhaps the approach that is closest in nature to this
thesis as he focuses on the connection between the public sector - primarily through
the lens of politics - and finance. He also looks at the relationship between the Bank
of England and the commercial banks, and the changing dynamics within the British
financial system during the 1970s. He does this from the perspective of complexity
theory and puts the problems of banking policy in the wider context of general public
policy.
Capie and Billings (2004) provide supporting evidence for the consensus in the
literature on the structure of British banking. Looking at the period from 1920 to
1970, they review the narrative of the cosy relationship within the system and the
lack of competition which was to change with the financial innovation and arrival of
foreign competitors, covered above. They look for evidence of cartel-like behaviour
and find the strongest argument in the wide spreads throughout the period, which
were in turn due to well-known agreements on rates and advances between the so-
called clearers. They contend that the cartel was in fact ”softer” than is often
believed and that the increased competition for financial services eventually led to
reduced official support for this arrangement.58
58Bowden (1997) approaches the structure of the financial system from another angle, namely the
36 CHAPTER 2. CONTEXT AND LITERATURE REVIEW
As for the relationship between the government and the financial sector, the
dominant theme of this thesis, a lot of work has been done on the attitude of finance
within government. In addition to Moran (1984), mentioned above, an ongoing
theme throughout in Kynaston (2002) is the evolving sentiment from government
towards finance and vice versa - highlighting the built-in political aspect of banking
throughout the ages.59 Michie and Williamson (2004) also include several pieces on
the relationship, again with much emphasis on how each sector perceived one another
throughout the 20th century. Additionally, Michie (2004) emphasises the fact that
the interests of the two sectors, i.e. financial and public, were alternatingly aligned
and different which led to an almost cyclical relationship. Schenk (2005) highlights
the divergent views on the City between the Treasury and the Bank of England, a
feature covered in Chapter 3 of this thesis.
As for the secondary crisis itself, there is a broad consensus on its causes as
well as its consequences. Reid (1982), widely considered the go-to work on the
topic, concludes that the primary causes of the crisis were expansionary economic
policy and the run-up in property prices. Capie (2010) argues along similar lines
although he places more emphasis on regulatory factors. Other accounts are less
holistic, however. Scott (1974), for example, argues innovatively for viewing the
episode through the lens of Veblen’s theory of crisis. Davis (1995) reaches similar
conclusions to those above regarding the crisis causes, namely speculative lending
and innovation in money markets, although he adds an interesting angle on quantity
finance houses. She focuses on the short-lived attempts to restrain competition among the housesaround 1960 and argues, in line with the rest of the literature, that increasing competition andinnovation led to the demise of collusion. For a hands-on view of the City of London as a workplacein the post-war era see Thompson (1997).
59This approach of looking at attitudes contrasts with this thesis. I look only secondarily atpersonal attitudes and focus instead on economic relationships. For example by looking at howreliant various financial institutions were on public institutions and the extent of subsidies involved.
2.2. HISTORICAL AND HISTORIOGRAPHICAL CONTEXT 37
rationing for lower quality institutions.60 Matthews (2005) looks at a specific case of
failure, namely London and County Securities. Other such studies are reviewed in
Chapter 4.
These seminal texts, as well as most other works on the crisis, are predomi-
nantly of a descriptive nature and furthermore do not analyze much the possibility
of alternate routes that policymakers could have pursued. Indeed, little mention is
given to questions such as whether the Bank of England could credibly have reduced
the extent of the crisis or whether regulatory action alone would have sufficed. Ad-
ditionally, attempts to measure the direct and indirect costs of the crisis are limited.
The analytical work that does exist is more focused on macroeconomic policies, such
as the elusive quest for growth pursued relentlessly by the government.
Summing up, Britain’s economic experience in the post-war period was far from
stellar. The overarching theme of the period was that of relative decline as Britain’s
status as that of an economic leader diminished. A lot of the literature has tried to
eke out the reasons for this development and put it into context with the greater
success of Britain’s neighbours. This decline was also seen in policy circles at the
time and was a source of some frustration as economic policymaking tried to reverse
this development.
Periodic problems with the maintenance of the exchange rate exacerbated these
policy problems. As mentioned in pieces such as Oliver and Hamilton (2002), Sterling
seemed to be in constant state of crisis in the 1960s and 1970s. This gloomy economic
situation, both internally and externally, reached a peak in some sense during the
period under consideration in this thesis as Britain sought assistance at the IMF.
60On the price rationing, Davis (1995) says that it was ”evident for secondary banks in 1973;also in the interbank market after 1974, while many banks were subject to price tiering, the lowestclass often finding themselves excluded from the market altogether.” (p.194).
38 CHAPTER 2. CONTEXT AND LITERATURE REVIEW
However, despite this gloomy picture depicted in the literature, it is important to re-
member that living standards were on an upward trend during the period and growth
was for the most part not spectacular but certainly respectable. As emphasised by
Cairncross (1992), Britain’s post-war economic performance is often contextualized
in relation to catch-up by other economies rather than its own absolute demise.
As for the financial sector, given the evidence presented above it is safe to say
that there is a general consensus in the literature on the sector’s development in
the post-war period. Informalities gradually gave way to a greater emphasis on
rules amidst greater competition and globalization. Regulators were also forced to
adopt to increased modernization and financial innovation. Their reaction was only
partially successful as the increase in volatility and crisis occurrences show.
However, as mentioned elsewhere, the goal of this thesis is not necessarily to alter
this narrative. Instead, the aim is to dig deeper into the effect that the structure of
the financial sector and its relationship with the public sector had on outcomes such
as bank profitability and stability - or lack thereof - as well as public finances. We
thus turn now to the economics literature and the tools used to tackle these issues
before delving into the main chapters of the thesis.
2.3 Economics Context
Governments’ role in the financial sector features in various branches of the economic
literature. Here I look at the main strands that provide a background for the thesis
while chapter specific literature is covered in each chapter. The main strands are
the macro-prudential approach to government involvement, the micro justification of
public sector assistance, the empirical work on governments and finance, and finally
2.3. ECONOMICS CONTEXT 39
the theory and practice of bank regulation.
As in many other fields of economic research, one can distinguish between micro
and macro approaches to the topic of government and finance. The macro approach
involves looking at how specific financial frameworks affects the credit cycle, the
consequent real economy effects of these frameworks and how policy can play a
countercyclical role.
Bernanke et al (1996) is amongst the most prominent theoretical works in this
branch. The authors examine the effects of asset price fluctuations on real activity
through balance sheet deterioration or improvement. As assets on the balance sheet
increase in value, available collateral increases and investment possibilities rise. Con-
versely, when asset prices drop, a negative feedback loop leads to further declines
in both asset prices and leverage. The end result is that this so-called financial ac-
celerator exacerbates the fundamental fluctuations in the credit and hence business
cycle.
Geanakoplos (2010) introduces a similar concept, that of the leverage cycle,
which emphasises the connection between leverage and asset prices. Kiyotaki and
Moore (1997) presents yet another similar argument, focusing on how imperfections
in financial markets lead to an amplification avenue where small shocks have large
effects. This body of work has provided formal justification for the inclusion of
embedding the financial sector into macroeconomic analysis. The policy implications
of this strand of the literature are also in line with the recent emphasis on macro-
prudential regulation whereby attention is focused on financial market imperfections,
mainly information asymmetries. Bordo et al (1995) provide an overview of the
various theoretical macro approaches to financial crises and links them with historical
episodes.
40 CHAPTER 2. CONTEXT AND LITERATURE REVIEW
Finally, Minsky (1976) falls between the micro and macro approaches to finan-
cial instability. His work, which has recently become fashionable again, focuses on
how periods of stability themselves breed instability. This work has in later times
been popularized and summed up in the phrase of the ’Minsky moment’. This term
relates to Minsky’s proposition that periods of stability lead to added speculation.
The use of borrowed money for this speculation in turn leads to increased instability
followed by a dramatic downturn. In that sense, it resonates well with Chapter 3 of
this thesis where the primary conclusion is that due to the long period of stability
within British banking, institutional knowledge of financial instability had deterio-
rated and the environment was ripe for a ’Minsky moment’. However, Minsky’s work
is fairly general in nature and does not provide specifics regarding either a theoretical
framework or policy suggestions.61
Moving towards the traditional micro approach to governments’ role in the fi-
nancial sector, this part of the literature involves looking at the direct interaction
between the public sector and particular financial institutions. As mentioned in
various places in this thesis, this literature has a long tradition and dates back to
Thornton (1802) and Bagehot (1873).62 At its core, the literature looks at the fun-
damental business of financial intermediaries and the periodic instability inherent in
their role.
Both Thornton and Bagehot recognized the inherent imperfections of financial
intermediation and set out to find policy solutions so as to minimize the effects of
61Minsky himself admits this, saying that his policy suggestions are ”best interpreted as an agendafor discussion rather than a nonnegotiable program.” (Minsky (1976) p. 370).
62Grossman (2010) reviews the history of thought regarding the lender of last resort. He in factdates the tradition back even further than Thornton, to Sir Francis Baring in 1797. Redish(2001)also takes a historical look at the lender of last resort function, focusing on the experiences ofBritan, the U.S. and Canada in the 19th and early 20th centuries.
2.3. ECONOMICS CONTEXT 41
these imperfections. In short, these imperfections stem from two facts. The first
is that financial institutions’ illiquidity and insolvency are intrinsically but imper-
fectly linked and the second that the institutions within a system are themselves
intrinsically linked. The consequence of the first is that a bank can go under despite
remaining solvent, in the sense that its assets exceed liabilities, due to a general
liquidity shortage which threatens the system as a whole. The second fact means
that banks can fail due to another channel; concerns about a particular institutions
health can lead to unfounded concerns about a rival institution due to information
imperfections and subsequent panic withdrawals.
Thornton and Bagehot thus both argued that central bank assistance be pro-
vided in circumstances where solvent institutions became illiquid, while being mind-
ful of the moral hazard this could create. Thornton specifically argued, in the words
of Goodhart and Illing (2002), that ”in a system with a central bank, the commercial
banks will turn to it for assistance in any such crisis, and that the central bank must
stand ready to supply that, despite the likely concurrent drain on its gold reserves.”63
Bagehot on the other hand argued that central banks should lend at will to solvent
but illiquid institutions against good collateral at an appropriate rate.64
Many attempts have been made in recent years to formalize the several in-
sights of both Thornton and Bagehot. The most prominent example is Diamond and
Dybvig (1983) who formalize the mechanism whereby long-term assets mixed with
short-term liabilities can lead to self-fulfilling panics, even in healthy institutions.
63Goodhart and Illing (2002) p. 7.64For an account of early adaptation of Bagehot’s rule, see Bignon et al (2012). Amongst the
conclusions is the fact that the Bank of England was on ”a learning curve” in its lender of lastresort operations during the mid 19th century, only gradually developing procedures along the linesof Bagehot. Chapter 3 of this thesis argues that after the long lull in banking, the Bank of Englandwas again forced on a learning curve, albeit a much quicker one, during the secondary crisis of1973-75.
42 CHAPTER 2. CONTEXT AND LITERATURE REVIEW
More recently, focus has shifted to specific aspects of the Bagehot-Thornton anal-
ysis. Most significant for the purposes of this thesis are contagion studies and the
effect of information issues.
The former type of studies looks at the interdependence of financial institutions
and the possibility of knock-on effects between them. Amongst the most prominent of
these is Allen and Gale (2000) who provide microeconomic foundations for contagion
via overlapping interbank claims. They thus introduce the possibility of contagion
originating from an initially small liquidity preference shock with the extent of con-
tagion depending on the network structure in place. These dynamics are addressed
more closely in Chapter 5 along with a closer look at the relevant literature.
The latter type of studies, which is in fact related to the former, addresses the
effect of asymmetric or incomplete information on the equilibrium in financial mar-
kets and the possibility of sub-optimal equilibria that they introduce. By deviating
from full and complete information, one can more easily arrive at run-like equilibria
as well as moral hazard and adverse selection behaviour. These informational prop-
erties are discussed more fully in Chapter 3 while Gertler (1988) provides a survey
of the early attempts to address the properties.
The most relevant of these studies for our purposes is Stiglitz and Weiss (1981)
where it is convincingly shown that, in equilibrium, there may not be a market-
clearing price, i.e. interest rate, for loans. More concretely, they assume that bor-
rowers have different probabilities of repayment but the bank cannot fully identify
safe projects from risky ones. This would generally be resolved by charging a higher
price for the loan but with incomplete information, a higher price encourages bor-
rowers to select riskier projects. In other words, no separating equilibrium can be
found which means that the bank’s best strategy in this case is to ration credit.
2.3. ECONOMICS CONTEXT 43
While Stiglitz and Weiss’ original argument was in terms of traditional borrowers
lending from banks that finance investment projects, the same principles can apply to
the case in this thesis. This can be seen by putting banks in the role of the borrower
and the central bank as the lender. Hence, when performing its role as stabilizer of
the financial system, the central bank cannot distinguish between safer or more risky
loans to banks in the presence of asymmetric information. Consequently, a higher
rate, as argued for in the lender of last resort literature and discussed above, can
result in greater losses for the central bank and riskier projects undertaken by the
borrowing banks.
Another recent feature of the literature is the focus on the realization that
Bagehot-type rules run into several practical difficulties. Calomiris (1999) stresses
the potential for conflict between the short-term stabilization of credit supply and
the long-run stability of the banking system. Anginer et al (2014) expand upon
arguments similar to Stiglitz and Weiss in addressing when risk-bearing by the state
is good public policy. As also argued in this thesis, they highlight the importance for
government to explain ”why the state can achieve what markets cannot” in order to
justify its role in risk-bearing in financial markets.65
The argument of Anginer et al builds on Calomiris and Kahn (1991) with the
added effect of lenders’ risk aversion as well as agency frictions. These frictions come
in the form of bilateral agency frictions on the one hand and multilateral, collec-
tive frictions on the other. The authors show that these divergences from complete
markets and risk neutrality lead to a higher risk premia and market inefficiencies.
A state guarantee can thus help lower the cost of capital by spreading risk more
broadly using the state’s advantage in resolving collection action frictions.
65Anginer et al (2014) p. 85.
44 CHAPTER 2. CONTEXT AND LITERATURE REVIEW
This advantage is assumed to stem from underdeveloped financial markets where
private parties cannot fully resolve the agency frictions, unlike the state which has
a well-established taxing and spending framework.66 However, the guarantee also
has the side-effect of increasing moral hazard as the lenders incentive to monitor
the borrower is lowered. The optimality of guarantees subsequently rest on the
framework at hand, namely governance, risk management and clear mandates.
Another of their main highlighted issues, also covered at length in this thesis, is
the importance of correct pricing of such guarantees. In the words of Anginer et al,
”[u]nless this is done right and state guarantees are reasonably priced, state guar-
antees will likely end up unduly subsidizing private risk-taking, and this is bound
to distort incentives and trigger unpleasant fiscal surprises (as well as political up-
heavals) once downsides materialize.”67 This issue of correctly designing government
interventions in financial markets is currently a popular one in the literature.68
On the empirical side, many attempts have been made at capturing the costs
and benefits of various assistance episodes. The earliest attempts of such estimation
came amidst renewed interest in the topic due to the rise of bank failures in the
1980s, especially in the U.S., and include Marcus and Shaked (1984) and Ronn and
Verma (1986). More recently, attempts to quantify the implicit subsidy have again
gained traction, similar to the empirical exercise in Chapter 3.
One such study is IMF (2014) which uses three methods to quantify the subsidy:
bond-spread differentials between banks considered too important to fail and others,
a contingent claims analysis, similar to that of Chapter 3 of this thesis, and a ratings-
66The authors also argue for the state’s advantage via fuller participation, both across currenttaxpayers as well as between generations, which leads to greater capacity for risk spreading.
67Ibid.68The pricing of these interventions is at the core of Chapter 3 and the relevant literature is more
closely studied therein.
2.3. ECONOMICS CONTEXT 45
based approach.69 Such work focuses on the aforementioned moral hazard aspect of
public assistance and tries to calculate the monetary value to financial institutions
of the presence of the lender of last resort.
The greatest obstacle to such studies is isolating the part of market pricing that
is due to expectations of assistance from the public sector. The early attempts at
this generally employed normally distributed option pricing models to estimate the
value of a put option on bank liabilities. More recent attempts, such as IMF (2014),
have used credit ratings and CDS data to try and find out the difference between the
stand-alone price of bank liabilities and the realized government protected liabilities.
This latter type of exercise is unfortunately not possible for this thesis due to lack
of CDS and credit rating data for the period in question.
Governments’ role in the financial sector obviously features heavily in the theory
of regulation. It is often argued, e.g. by Buser et al (1981), that guarantees and
regulation be seen as complementary functions that go hand in hand. That is to say,
guarantees and lending by the government be used to address market imperfections,
such as those mentioned above, along with regulation which serves to address moral
hazard and adverse selection issues that the lending and guarantee schemes introduce.
Chapter 4 discusses the literature on regulation and its relevance to this thesis.
Financial regulation has, however, in the main always been atheoretical as argued
by Goodhart (2010).
Despite this, several attempts have been made to shed light on regulatory issues
and construct optimal regulatory frameworks. Dewatripont and Tirole (1994) pro-
vide a holistic view of banking regulation.70 They start by stating the motivation of
69Again, many other recent attempts to quantify the subsidy are discussed in Chapter 3.70Another notable attempt to summarize the principles of banking regulation is Brunnermeier et
al (2009). Their coverage is more practical in nature and focuses on systemic risk, counter-cyclical
46 CHAPTER 2. CONTEXT AND LITERATURE REVIEW
regulation, principally depositor protection (the ”representation hypothesis”), before
looking at the real-world institutions in place. They then move to specific exam-
ples before introducing a theoretical framework, focusing on issues of moral hazard,
agency and commitment. Work such as this is helpful in highlighting specific theo-
retical issues, such as the ones just mentioned, and are brought up throughout the
thesis when the historical and empirical work touches upon each issue.
Recent work on bank regulation has been more empirical in nature and also
more applicable to this thesis. These empirical studies tend to focus on cross-country
comparisons to see whether different regulatory regimes produce different outcomes.
Cihak et al (2012) provide several findings. By separating countries into two groups
- crisis and non-crisis - the authors find that the former group had less stringent
definitions of capital and lower capital ratios, had generally less strict regulatory
environments and had weaker incentives for the private sector to monitor banks’
risks.
Somewhat conversely, Barth et al (2004) conclude that government policies that
rely, by their definition, excessively on direct government supervision and regulation
fare worse and that disclosure, private-sector controls and incentives lead to better
outcomes. These results may however be due to the sample period and timing of the
research as the recent global financial crisis has altered thinking on these matters
substantially.71
One very recent attempt to look at the effect of government intervention on
bank fundamentals is Ding et al (2013). They use bank-level data from five Asian
regulation and countering the adverse effects of excessive maturity and liquidity mismatch.71See for example Cubillas et al (2012) who look at market discipline at times of crises. They
conclude that market discipline weakens after crises and especially so in countries where marketdiscipline was promoted by regulators and supervisor prior to the crisis.
2.4. CONCLUSIONS 47
economies to look at bank performance - defined through solvency, credit risk and
profitability - before and after intervention. Their results indicate that performance
improves following intervention while highlighting differences between countries and
along bank-specific characteristics such as internationalization.
While the papers in this area are related to the thesis insofar as they look at the
government’s role in finance from an empirical standpoint, they differ substantially
from the approach taken here. More specifically, instead of looking at the effect
of government intervention on macroeconomic variables, this thesis focuses more
on the possible microeconomic relationship between data on individual institutions
and government’s actions and presence. In particular, we look at how a bank is
affected in its routine business of matching savers and investors by the presence of
the government as a stabilizer of financial cycles.
While the economic literature has divided into several branches, it has at its
core two main tenets; motivation via market failures and policy design to negate
these failures. On the empirical side, the literature involves measuring the possible
extent of the failures and also the effect of implemented policies. Finally, despite
substantial progress, on both the theoretical and empirical front, the crucial insights
found in Bagehot (1873) remain the main anchor in the discussion.
2.4 Conclusions
The focus in this thesis is very much on the financial side of the economy and the
public policies used to address malfunctions therein. However, in this chapter the goal
has been to set the stage and describe the macroeconomic context within which these
problems arose. In so doing, we have looked at the situation of the British economy
48 CHAPTER 2. CONTEXT AND LITERATURE REVIEW
in the post-war period and leading up to the secondary crisis. The literature on
Britain’s economic development has been reviewed, as well as shortcomings during
the period, in an attempt to summarize the problems faced by policymakers and
their priorities at the time. At the forefront of these macroeconomic difficulties were
both domestic issues, such as management of the business cycle, as well as Britain’s
international position and maintaining external balance with regard to balance of
payments and exchange rate stability, as reviewed in Section 2.
These macroeconomic difficulties in turn interacted with the financial side of the
economy, while the position of macroeconomic policies at the forefront of policymak-
ers minds relegated that of financial institutions, and out-of-fashion concepts such
as lender of last resort policies, to the background. The fact that macroeconomic
policy was the main priority also meant that less resources were available to tackle
other issues, including financial stability. Not until faced with a banking crisis did
policymakers tackle the financial sector’s problem head-on as the issues could not be
ignored anymore.
In addition to this aforementioned historical coverage, this chapter has also shed
light on the economics literature that has dealt with crisis such as the one covered
in this thesis. This has been done to set the thesis in context, show how the issues
involved are generally addressed and how the methods used in later chapters have
previously been used. The coverage has shown that how public resources are used
to shore up private financial markets remains a potent topic within the literature.
Judging by the coverage, the reason behind this is an as yet unsolved dilemma in-
volved with such operations. On the one hand, there are strong welfare justifications
to be found for such public involvement due to the negative, widespread effects that
can arrive in their absence. On the other hand, such public support of markets
2.4. CONCLUSIONS 49
introduces a very real possibility of redistribution from public to private hands as
the mechanism design of such programs introduces a plethora of problems including
pricing issues, moral hazard and market distortion.
In that sense, it is easy to argue that given the complexities that have arisen in
the literature, it is the implementation of policies such as lender of last resort and
other stabilizing measures which are the crux of the topic. The rationale for their
existence was shown in the chapter to be well covered with recent works more focused
on this implementation. As previous work has highlighted the various tricky issues,
it is thus also no surprise that the implementation of the policies in previous crises
has been criticized, both in the academic literature and the mainstream coverage.
Ignoring the costs of crises is not an option while designing the right response for
confronting crises is very complex.
This is perhaps why the mantra of Bagehot (1873) remains such an alluring one
and continues to be a benchmark within the literature. In this thesis, I continue this
tradition of using Bagehot’s rule as an anchor albeit in a slightly different manner.
Thus, instead of evaluating the merits of the rule or its theoretical underpinning, I use
this chapter’s coverage of the literature as motivation for focusing on the implications
and practical difficulties policymakers run into when supposedly adhering to the rule.
In so doing, I try to estimate how achievable the rule was in practice and what aspects
of it the Bank of England was able to achieve.
As previously mentioned, this coverage only represents a broad overview and is
not the end of the part of the thesis that covers with the literature. Within each of
the following three main chapters, there is a constant connection with the chapter-
specific literature as I aim to explore the possibility for new insights. This chapter
has thus served the goal of, firstly, setting the scene and, secondly, laying out the

50 CHAPTER 2. CONTEXT AND LITERATURE REVIEW
main contributions in the previous body of work on financial stability measures,
including both the tools used as well as the results.
Chapter 3
Subsidies and Stability
The clearing banks’ relationship with government has changed and developed very
considerably in the 20 years since the banks gave evidence to the Radcliffe Commit-
tee. The process of government has become more complex and intrusive so that the
banks’ involvement has necessarily become greater. As government has become more
and more active in a growing number of areas of business life, so the banks have been
drawn increasingly into a dialogue with the Treasury and other government depart-
ments [...]. Like other institutions and interest groups, the banks have recognised the
need to become constructively involved in a complex relationship with government as
the public and private sectors have become more intimately related. Indeed they have
been encouraged by government to become so involved.
- Evidence by the CLCB to the Committee to Review the Functioning of
Financial Institutions 1977 p. 179
51
52 CHAPTER 3. SUBSIDIES AND STABILITY
3.1 Introduction
The complex relationship between the financial sector and the public sector has re-
ceived increasing attention in recent years, especially following the crisis of 2008.72
However, the main focus has been on the merits of various regulation, such as capital
adequacy and liquidity rules, and to what extent such rules should be used. This
chapter, in contrast, looks at the costs involved with the public sector’s involvement
in finance and the broad issue of the government as the back-stopper of the financial
system. There have been plenty of isolated studies of this issue in the past but the
focus has primarily been on simple, single-method estimates of the implicit subsidy
to financial institutions with very little historical background or context given. This
chapter aims to address both of these shortcomings with an exapnsion on the em-
pirical methods involved and also by providing historical context and evidence from
1970s Britain that complements the empirics.
A central objective of central banks has long been to provide financial stability
for the wider good of the economy. This objective, along with stabilization of macroe-
conomic variables, has been the centrepiece of central bank thinking and will in all
likelihood continue to be so. There is however a crucial difference between these two
objectives which has led to increased criticism for active financial stability operations
from both professionals and the general public. This stems most prominently from
the fact that the goal of financial stability is often times achieved by intervening in
individual institutions which are thus thought to benefit disproportionately at the
expense of other agents in the economy.
72From here on in, whenever I refer to the public sector or public authorities I use it as an umbrellaterm for any and all non-private, centralized authorities. I.e. central banks, treasury departments,regulators, deposit insurance funds, etc. I generally refer to the Bank of England as ’the Bank’, asis common in the literature.
3.1. INTRODUCTION 53
Bagehot’s rule, described in Chapter 2, represents one way to deal with this
problem.73 In practice, however, the appropriate interest rate is very hard to deter-
mine, as is the quality of collateral presented, and the rule itself also implies that
central banks are able to determine - in the midst of a crisis - which institutions
are simply illiquid and which are insolvent. Furthermore, reconciling Bagehot’s rule
with rational credit rationing a la Stiglitz and Weiss (1981) - also covered in Chapter
2 - is no mean feat.
It is convenient in this respect to think of any role undertaken by public author-
ities in the sphere of the financial sector - whether it be deposit insurance, liquidity
provisions in times of illiquidity, equity injections at times of crisis or any other ser-
vice - as one that the private sector is unwilling or unable to perform itself.74 This
chapter focuses on the deposit insurance mechanism but the same applies for other
traditional types of interventions on behalf of the central bank.
The common method of the deposit insurance mechanism is to charge a non-
risk-adjusted levy. This, however, means that the fee is not the same as a private
insurer would charge its customers. That is to say, riskier banks would be met with
a higher insurance premium than safe ones if they were to seek insurance from a
private insurer. It may well be the case then, and has in fact been argued, for
example in Ronn and Verma (1986) and Marcus and Shaked (1984), that safer banks
are subsidizing riskier ones by paying the same fee for deposit insurance.
While this may well be a deliberate decision by authorities, perhaps for reasons of
simplicity, the extent to which subsidization or taxation is taking place should in any
73Bagehot (1873).74Solow (2002) and Goodhart (2002) both provide cogent insights into these functions. Schwartz
(2002), while focusing on the international aspect, provides an overview of the development ofthinking on these issues, both in the U.K. and the U.S.
54 CHAPTER 3. SUBSIDIES AND STABILITY
case be estimated and decided as deliberately and transparently as possible. There
is furthermore an arguably more serious risk that as a whole banks are underpaying
for the insurance in which case the subsidy involved is not from safer banks to riskier
ones but to banks as a whole from the person who pays out the insurance in case of
”injury” - the taxpayer.75,76
There is a large literature on deposit insurance and many attempts have been
made to quantify the costs and benefits of such schemes. While explicit deposit
insurance was not introduced in Britain until 1982, implicit deposit insurance can
be just as costly.77,78 Implicit insurance happens when deposits are considered to
be insured despite no formal commitment by the authorities that this is the case.
Under these conditions banks enjoy an artificially lowered funding cost as depositors
required return does not include full allowance for credit risk.
The mechanics behind the distortionary effects of deposit insurance are as fol-
lows. Whenever a creditor perceives that he has a third-party guarantee that insures
him against principal losses he will require a lower rate of return. This benefit accrues
to both debtor and creditor - with the extent to which either benefits depending on
market structure and other factors - while the cost is born by the guarantor. The
word ”perceives” is key here, as the distortionary effect of a guarantee is in place
75This assumes a clear and unambiguous ownership relationship between the central bank andthe public. Conversely, if banks are overpaying then this represents indirect taxation in the oppositedirection - from banks to taxpayers.
76This goes back to the time inconsistency and rules vs. discretion argument, a la Kydland andPrescott (1977). See also Barro (1986).
77While the deposit insurance scheme was a consequence of the Banking Act of 1979, it was notimplemented fully until 1982.
78The structural reforms of the banking sector, which started with the Banking Act of 1979, that”gave the Bank, for the first time, the formal power to supervise the banking system”, representeda shift from informal relationships and regulation-by-persuasion to a more cutthroat environmentaccompanied by formal rules and increased competition from foreign banks and other financialinstitutions. See Chapter 2 of this thesis as well as Grady and Weale (1986) p. 39. See also Golaand Roselli (2009) for the lead up to the Banking Act.
3.1. INTRODUCTION 55
whether the guarantee is explicit or not.79 Much emphasis has been placed on the
moral hazard aspect of deposit insurance but even in the absence of moral hazard
there is the possibility of a subsidy. This can be seen by defining moral hazard as
an increase in risky behaviour by an insured agent, as it is still the case that with-
out such a change in behaviour there is the potential for subsidy if the insurance is
mispriced to begin with.
These issues can also be thought of through the lens of institutional memory.
As the number of policymakers that possess first-hand experience of financial cri-
sis management decreases, it is plausible to expect the response to a crisis to be
sub-optimal alongside policymakers’ tendency to put greater weight on more recent
experiences. This is similar to the case put forward by Berger and Udell (2004), who
look at institutional memory at the bank level. They posit that the ability of loan
officers deteriorates ”over the bank’s lending cycle that results in an easing of credit
standards.”80 Similarly, for the case here, as British banking had been crisis free for
a long time, policymakers put little emphasis on financial stability concerns.81
The analysis in this chapter is twofold; The chapter starts by looking at the
decision-making process of policymakers - mainly the Bank of England - and the
extent to which its staff thought about such problems. The traditional narrative of
79This point is expanded on in Section 2.80They add that loan quality erosion and loan losses ultimately ”helps restore institutional mem-
ory as officers re-learn how to make good loans, how to monitor them and how to avoid making badloans.” (p. 3) Likewise, the ability and agility of policymakers regarding financial stability increasesas problems are addressed. This is consistent with the evidence provided below of a renewed em-phasis on financial stability within the Bank of England. This is also linked to the argument putforth in Minsky (1986) that stability breeds instability as private and public actors let their guarddown.
81Several papers mention this mechanism in passing. Fisher and Kent (1999), in discussing thecrises in Australia of the 1890s and 1930s, suggest that ”the greater conservatism in the 1920s mayhave been due in part to the memory of the disaster of the 1890s” (p.34). They also cite Butlin andBoyce (1985), pointing to the latters’ argument that ”during the early 1930s, first-hand experienceof the 1890s depression focused bankers attention on the need for sound financial management.”
56 CHAPTER 3. SUBSIDIES AND STABILITY
the period is laid out before recently available evidence from the Bank of England
archives is added. This evidence can add weight to, or alter, the prevailing narrative.
This qualitative evidence can shed light on what the contingent policy in case of
banking panics was and how well prepared the authorities were. Such inductive
reasoning is necessary as no explicit or systematic policy was in place when it came
to financial panics. We subsequently turn to quantitative evidence, using option
pricing models to estimate the potential premium that the government could have
charged for acting as guarantor of financial stability and how the results compare to
the actual policies pursued.
The type of model chosen differs from the standard Black Scholes model favoured
by a large part of the literature. A Jump-Diffusion model is presented which alters
the standard assumption of normally distributed asset returns in favour of a Poission
distribution which allows for periodic large negative returns - or crisis episodes in
this chapters’ context. The model’s parameters are also calibrated to the case at
hand and the range of results possible are discussed thoroughly along with their
robustness, or lack thereof.
There is a large historical literature on the post-war banking environment in
Britain.82 Up until 1970, British banking had been relatively crisis-free for almost a
century. The Secondary Banking Crisis of 1973-1975 changed this but the mindset of
market participants and regulators changed only gradually and was heavily influenced
by the previous long, stable period.83
The focus in this chapter is on the so called Big Four of the time: Barclays,
82The literature on post-war British financial and economic developments is covered in Chapter2. Here, only the immediately relevant literature is covered.
83For a detailed overview of the structure of the financial sector at the time, see Revell (1973).Chapter 2 of this thesis also provides more detail.
3.1. INTRODUCTION 57
Lloyds, Midland and NatWest. This is, however, not primarily due to their size
or the concentration of the sector. In fact, in 1970 the deposit banks’ (or clearers’)
share of total assets of the financial sector was just under 47% and decreased steadily
as the decade wore on.84 The reason for concentrating on these four banks is their
position at the centre of the financial system and their proximity to the public sector
- chiefly the Bank of England. While so called fringe banks, or secondary banks,
increased their market share substantially during the period, the Big Four’s position
at the centre of the financial system provided them with access to senior Bank of
England staff and resources, as well as providing a perception in the public eye that
they were as infallible as the Bank of England itself.
While the matter received little explicit discussion, it is clear from the archival
material that bankruptcy of these major banks was generally not considered a pos-
sibility - or at least not something that entered the policy-making process. A con-
temporary account regarding the reaction to the international panic witnessed in the
banking sector during the time was provided by Hirsch (1977):
In the nervous atmosphere caused by a small crop of bank failures
in the third quarter of 1974, placements of large money market deposits
both nationally and internationally immediately became more selective;
and the dominating principle of selection was a bank that was sure of
having its central bank behind it. Marked differentials developed in rates
on certificates of deposits of different banks, with size and preeminence
being taken as the main general criterion.85
As for the British market, Hirsch says:
84The Bank of England’s Quarterly Bulletin publication includes statistical annexes which providetime series of various aspects of Britain’s banking system.
85Hirsch (1977) p. 250.
58 CHAPTER 3. SUBSIDIES AND STABILITY
In the London market for dollar certificates of deposits, the list of
issuer names acceptable to the majority of institutional buyers was de-
scribed by a market participant as having become very narrow indeed-
perhaps as few as seven names being universally acceptable.86
Executives of the Big Four met personally with the Bank of England several
times a year and discussed whatever issues were in the mind of both the clearer’s
representatives as well as Bank of England staff.87 The latter would hint as to what
its preference was regarding balance sheet growth and the former would mention
any potential dangers on the horizon. If the bank executives were uneasy about any
situation it was usually possible to arrange a meeting with the Bank within a short
period of time.
This framework suited both parties. For the banks, it meant that they could
interact with the Bank as if the Bank were a service provider that made sure that
stability was secured and also acted as guardian of their system. For the Bank
itself, informality gave them discretion and allowed them to react to problems as
they saw fit each time. Furthermore, when these matters were discussed within
the Bank, this framework was described favourably with very few suggestions of
changes to the status quo, as discussed in Section 2. In fact, even the notion of
financial regulation as a concept was quite primitive and constituted primarily of
dealing with fraud. The Protection of Depositors Act of 1963, for example, dealt
almost exclusively with nailing down which institutions could solicit deposits and
rules regarding advertisements and permission for deposit taking.88
86Hirsch (1977) fn. 14 p. 251.87A whole section of the Bank of England archives is in fact devoted to files related to meetings
of commercial bank executives and Bank of England officials.88The Bank of England (1978) includes papers submitted to the Wilson committtee, including
3.1. INTRODUCTION 59
Additionally, the Bank enjoyed its position vis-a-vis the banks due to the bankers’
balances. These were mandatory assets, in the quantity of 1.5% of eligible liabili-
ties, that the clearers were required to keep at the Bank. The balances, which were
approximately 250-300 mGBP well into the 1960s, were non-interest bearing which
meant that they served as an implicit tax on the clearers with the receipt going to
the Bank.
The income on the balances amounted to over 80% of the Bank’s total income at
the beginning of the 1970s and the cost to the clearers has been estimated in Capie
(2010) for the 20 years up to 1971 as approximately 500 mGBP. By comparison, the
Bank’s income on banker’s balances during the 1970s, as opposed to the commercial
banks’ perceived opportunity cost, amounted to just under 160 mGBP. The difference
thus indirectly measures the spread between a risk free asset and the expected interest
earned by the banks.
These balances gradually became a hot topic of debate as the clearers had to
deal with increased competition throughout the period. The banks argued, with
some legitimacy, that the balances were unfair as they didnt apply equally to all
financial institutions. The Bank even grew increasingly concerned about its own
rising profits, which arose primarily from the balances, and eventually started un-
dercharging the Treasury for services provided so as not to draw attention to the
Bank’s profitability.89
As for the regulatory discussion of the time, much of the focus was on the
an appendix on references to banking in the post-war statutes. There are five core statutes relatingto banking; the Exchange Control Act of 1947, the Companies Act of 1948, the aforementionedProtection of Depositors Act of 1963, the Companies Act of 1967 and the Income and CorporationTaxes Act of 1970.
89See Capie (2010) p. 346 and onwards for a discussion on the finances. Capie highlights theneed to preserve distance from Treasury as one reason for undercharging.
60 CHAPTER 3. SUBSIDIES AND STABILITY
distinction between the core financial institutions (deposit banks) and the fringe
banks. These fringe institutions had exhibited rapid growth in light of increased
wholesale funding possibilities and the Bank’s apathy towards these unconventional
firms. When the secondary banks ran into trouble this apathy promptly evaporated
as the Bank had to make sure that their failure would not threaten the financial
system.
The so-called Life boat operations, whereby the Bank of England worked in col-
laboration with the large banks on salvaging what could be salvaged of the secondary
banks, proved a case in point of the cooperative spirit which arose whenever potential
problems arose. It is the effect of this helping-hand policy by the Bank of England
that I try to examine in the chapter. As both expected and realized backing of the fi-
nancial system is funded with taxpayer money, it is pertinent to examine whether the
taxpayers themselves are receiving a fair deal through the financial stability policies
of its own institutions.90
The chapter proceeds as follows. Section 2 introduces a framework for thinking
about deposit insurance and other public sector guarantees and how they can be seen
as resembling insurance contracts. While the framework is simple and likely familiar
too many, it is helpful to put forth this benchmark as a reference point and to keep
clear the chain of events. Section 3 describes the relationship between the public
and financial sectors in Britain in the 1970s using newly released archival material
from the Bank of England. Section 4 introduces a rough quantitative estimate of the
value of the Bank of England to the clearing banks. Section 5 concludes.
90This becomes an even more crucial point as central banks such as the Bank of England act asde facto insurer but do not have to set aside funds to cover expected future losses, unlike otherinsurers. Thus the funds used by the Bank of England do not have to be accounted for in advancein yearly budgets and do not require parliamentary vetting. For more on the consequences of thisaspect see Lucas and Phaup (2010).
3.2. A SIMPLE GAME OF DISCIPLINE AND STABILITY 61
3.2 A Simple Game of Discipline and Stability
In this section I sketch out the vital role of expectations and rates of return with
regard to possible subsidies and the central bank’s dilemma of encouraging market
discipline while preserving financial stability. This simple thought experiment helps
clarify the issue at hand and explain the potential dangers of the central bank’s
presence. I look at a simplified game with several simplifying assumptions. A repre-
sentative investor becoming a creditor of a certain bank starts by deciding whether
he deems the banks to be safe or risky and hence what rate of return (r) to require.91
In deciding his required rate, the investor only considers whether the central bank
would bail the bank out (B) if assistance is required or not (NB).
If the central bank is thought to have a bailout policy then the bank is not
considered risky by the investor. After the investor decides r, the bailout realization
is revealed. These two variables (r, and the bailout decision), along with the solvency
of the bank, determine the payoffs to the three parties involved; the bank, the creditor
and the central bank. There are thus a total of eight possible final states (23).
I assume that if there is expectation of a bailout then r = 0. If a bailout is
not expected then the rate of return is r > 0. Denote this positive r as r∗. I also
assume that when the firm is deemed risky then r∗ is sufficient to compensate a
risk-neutral agent for the inherent riskiness of the bank’s fundamentals, i.e. r∗ =
LGD · P (NS),where LGD is Loss Given Default (1-recovery rate) and NS is the
state where the bank is Not Solvent.
91For simplification, risk neutrality is assumed on the part of the invesor, the bank and the centralbank. As argued in Anginer et al (2014), risk neutrality is the strongest assumption for the investorand possibly the bank. In this simplified game, risk aversion for the investor would lead to a higherr∗ and subsequently higher absolute payoffs in Table 3.1 and Figure 3.1 and thus not invalidateany of the results.
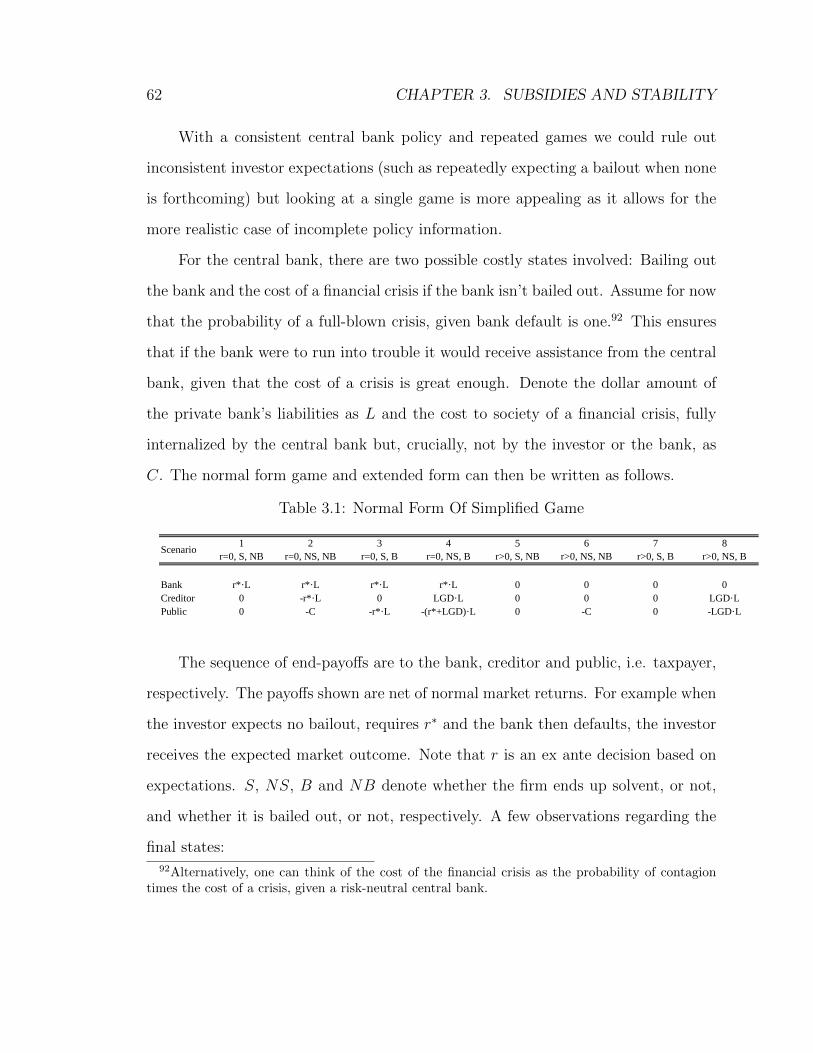
62 CHAPTER 3. SUBSIDIES AND STABILITY
With a consistent central bank policy and repeated games we could rule out
inconsistent investor expectations (such as repeatedly expecting a bailout when none
is forthcoming) but looking at a single game is more appealing as it allows for the
more realistic case of incomplete policy information.
For the central bank, there are two possible costly states involved: Bailing out
the bank and the cost of a financial crisis if the bank isn’t bailed out. Assume for now
that the probability of a full-blown crisis, given bank default is one.92 This ensures
that if the bank were to run into trouble it would receive assistance from the central
bank, given that the cost of a crisis is great enough. Denote the dollar amount of
the private bank’s liabilities as L and the cost to society of a financial crisis, fully
internalized by the central bank but, crucially, not by the investor or the bank, as
C. The normal form game and extended form can then be written as follows.
Table 3.1: Normal Form Of Simplified Game
1 2 3 4 5 6 7 8
r=0, S, NB r=0, NS, NB r=0, S, B r=0, NS, B r>0, S, NB r>0, NS, NB r>0, S, B r>0, NS, B
Bank r*·L r*·L r*·L r*·L 0 0 0 0
Creditor 0 -r*·L 0 LGD·L 0 0 0 LGD·L
Public 0 -C -r*·L -(r*+LGD)·L 0 -C 0 -LGD·L
Scenario
The sequence of end-payoffs are to the bank, creditor and public, i.e. taxpayer,
respectively. The payoffs shown are net of normal market returns. For example when
the investor expects no bailout, requires r∗ and the bank then defaults, the investor
receives the expected market outcome. Note that r is an ex ante decision based on
expectations. S, NS, B and NB denote whether the firm ends up solvent, or not,
and whether it is bailed out, or not, respectively. A few observations regarding the
final states:92Alternatively, one can think of the cost of the financial crisis as the probability of contagion
times the cost of a crisis, given a risk-neutral central bank.
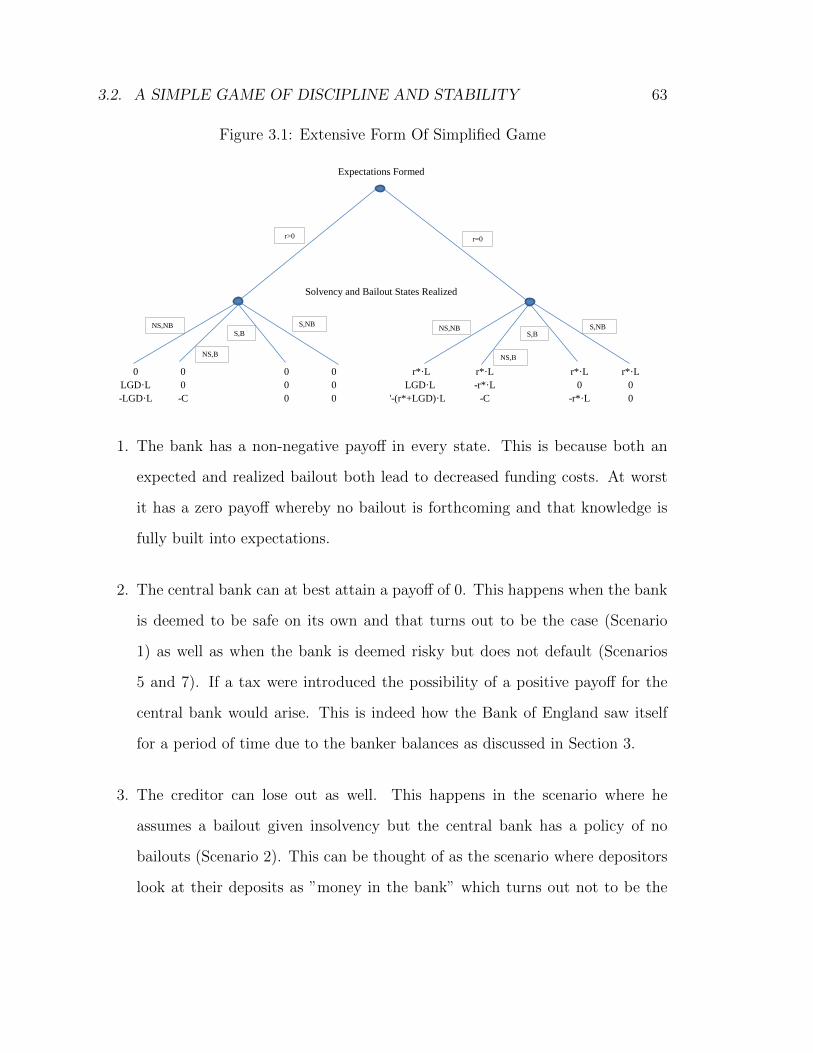
3.2. A SIMPLE GAME OF DISCIPLINE AND STABILITY 63
Figure 3.1: Extensive Form Of Simplified Game
Expectations Formed
Solvency and Bailout States Realized
0 0 0 0 r*·L r*·L r*·L
LGD·L 0 0 0 -r*·L 0 0
-LGD·L -C 0 0 -C -r*·L 0
r*·L
LGD·L
'-(r*+LGD)·L
NS,B
NS,NB S,B
S,NB NS,NB S,NB
NS,B
S,B
r>0 r=0
1. The bank has a non-negative payoff in every state. This is because both an
expected and realized bailout both lead to decreased funding costs. At worst
it has a zero payoff whereby no bailout is forthcoming and that knowledge is
fully built into expectations.
2. The central bank can at best attain a payoff of 0. This happens when the bank
is deemed to be safe on its own and that turns out to be the case (Scenario
1) as well as when the bank is deemed risky but does not default (Scenarios
5 and 7). If a tax were introduced the possibility of a positive payoff for the
central bank would arise. This is indeed how the Bank of England saw itself
for a period of time due to the banker balances as discussed in Section 3.
3. The creditor can lose out as well. This happens in the scenario where he
assumes a bailout given insolvency but the central bank has a policy of no
bailouts (Scenario 2). This can be thought of as the scenario where depositors
look at their deposits as ”money in the bank” which turns out not to be the
64 CHAPTER 3. SUBSIDIES AND STABILITY
case when the bank fails.
The optimal central bank policy depends on the relative sizes of C, r∗, LGD
and L. Knowing that the central bank contemplates the trade-off between C and
LGD · L obviously affects the investor’s decision regarding r. As the single game
above is set up, it is most likely the case that C > LGD · L so the central bank
decides upon a policy of bailing out the bank if in trouble. It should be noted that
the bailout can entail a loss to equity holders of the bank but deposit holders do not
lose out.
The dynamics at play generally involve ambiguity about the central bank pol-
icy.93 In this simple game this feature can be represented as incomplete investor
information regarding the relative sizes involved. The central bank thus knows in
advance whether it will be bailing out the bank but the investor does not as a no-
bailout policy cannot be credibly committed.
The objective by central banks in recent decades can be characterized as trying
to reach Scenario 7. They would like to convince the investor that the investment
is risky and that no bailout is forthcoming, while knowing themselves that when
trouble arose a bailout were likely.94 This scenario, which can be thought of as a
time inconsistent one, is, however, an unstable equilibrium as whenever a realization
occurs whereby the bank turns out to be insolvent, the bailout decision is realized
and investor expectations are updated.95
93Enoch et al (1997) tackle the discretionary factor and argue for ex post information disclosure.Laidler (2003) also covers the discretionary angle through the lens of Bagehot to Thornton.
94A poignant example of this objective can be seen in an internal Bank of England letter where itis stated that ”It was apparent [note: following the secondary banking crisis] that the operation ofthe Protection of Depositors Act 1963 had not adequately alerted depositors to differences in statusand risk between the various companies which were seeking to attract deposits from the generalpublic.” (Bank of England Archives 7A204/1, letter dated 26/05/78).
95Chabot and Moul (2013) look at an example of this particular case through the panics of 1854
3.2. A SIMPLE GAME OF DISCIPLINE AND STABILITY 65
The game does not allow for the possibility of the central bank charging a levy
for contingent bailouts (i.e. an insurance premium). This would amount to having a
publicly known bailout policy which would reduce the possible final states to altered
versions of Scenarios 3 and 4. These scenarios consist of the investor deeming the
bank safe and the central bank having a bailout policy, but the scenarios would
be altered by the fact that the levy would be sufficient to pay for the interest rate
subsidy involved in Scenario 3 as well as the interest rate and bailout subsidies in
Scenario 4. This would amount to the bank internalizing the externalities involved,
not dissimilar to a pollutant paying a carbon tax. The obvious and substantial
problem involved with this is determining the size of r∗ and LGD. However, by
looking at the framework above, we can see the mechanisms at play for a central
bank when trying to convince market participants to demand market rates of interest
while at the same time leaving the door open for itself to intervene if necessary. This
trade-off between market discipline and preserving financial stability is key and will
be the overarching theme in the historical discussion in Section 3.
Applying this framework to the case of 1970s Britain, it is extremely unlikely
that the Bank gave any systematic consideration of this kind to its stabilization
policies. In the next section I present evidence that the Bank did not systematically
contemplate likely costs of bailouts given crises or even put much thought into how its
own backing affected market incentives. However, it did talk about the importance
of market forces and when the topic of crisis-policy periodically came up as well as
trying to emphasize the fact that it wasnt a guarantor of individual institutions and
that market participants had to perform their own due diligence. This supports the
and 1857 in the United States. They show the importance of government guarantees and especiallythe effect of inconsistent creditor expectations with relation to the guarantees.
66 CHAPTER 3. SUBSIDIES AND STABILITY
time-inconsistency policy of Scenario 7 - trying to convince investors to treat deposits
as risky without committing to a no-bailout policy.
As previously mentioned however, there was no expectation at the time that
any of the big clearer banks would fail and financial stability required that they
be assisted if needed. The result, in this framework, would thus be the r = 0, S,
B case leading to a subsidy of deposit rates. At the stage where expectations are
formed, depositors deem the banks at the core of the financial system as essentially
safe. This means that whether they think about it or not, depositors exclude the
possibility of a core financial institution going into receivership where every deposit
is an uncollateralized claim on an institution whose sector has a historical recovery
rate of approximately 50% when defaulted.96 This is despite the fact that the equity
buffer, that presents receivership, is usually on the scale of 1/20th of the banks total
assets. This points to the disconnect between balance sheet fundamentals and the
required rate of return to the claims of the bank.
We now turn attention to historical evidence of the views of the players involved
in 1970s Britain. I look for evidence of expectation formation such as that discussed
above and how the Bank of England juggled the two competing objectives of imposing
market discipline and ensuring financial stability at the same time.
96In the U.S., as reported by Duffie et al (2003), the average loss rate for failed banks varieslargely from 8% in 1992 to a high of 61% in 1999. It can be argued that due to the complexstructure of large clearer banks, and the fact that their operations are generally not taken over bylarger banks, that their recovery rate would be lower than for FDIC failed banks which are usuallylocal commercial banks.
3.3. QUALITATIVE EVIDENCE 67
3.3 Qualitative Evidence
In this section we look at historical evidence regarding the public sector’s relation-
ship with the financial sector. In doing so, I try to deepen the discussion of financial
stability measures during the period and re-orientate the focus away from immedi-
ate crisis reactions and towards more systematic issues. I present the traditional
narrative for the British financial sector, via the secondary literature, and add to it
archival evidence from the Bank of England. I do not, however, present the evidence
in chronological order or as a narrative as is common in the literature. As such a
narrative has already been constructed forcefully, for example in Capie (2010) and
Kynaston (2002), I focus instead on specific instances of interaction between the
Bank and the banks, as well as periods of heightened volatility so as to eke out how
the Bank tackled its financial stability role.
The archives contain vast amount of documents for all branches of the Bank,
including both internal communication as well as the Bank’s dealings with the private
sector and other parts of the public sector. A large part of the evidence retrieved
has recently become available as the Bank of England operates under the so-called
”30 year rule” - or more recently the 20 year rule - discussed earlier.
As for the representativeness of the material that has been made available,
some weeding of the Bank archives was performed in the 1980s although much of
the discarded material will have been routine papers and non-informative letters.
There is thus the possibility of selection bias due to omitted documents but as the
incompleteness of the archives stems from removal of standard documents and not
systematic removal of certain important material the likelihood of this is low. The
documents that were retained are a mixture of high-level and low-level material and
68 CHAPTER 3. SUBSIDIES AND STABILITY
provide a relatively thorough narrative of the episodes under consideration in this
chapter.
The reference numbers of each entry generally refer to the department from
where the file is taken. For example, files stored under the ADM section in the
archives originate in the Administration Department and the Economic Intelligence
Department files are stored under the EID section. There are 16 categories in to-
tal and each category consists of several subcategories called classes which contain
related material. Finally, each class usually has several individual files. The end re-
sult is therefore a threefold categorization. One example would be ADM35/6 which
would be file 6, class 35 in the Administration Department. This particular class
represents the 6th file of the papers of John Fforde, the Bank’s former chief cashier,
executive director and official historian.
I use records from various departments although the main emphasis is on ma-
terial such as the papers of certain Bank staff, such as the aforementioned John
Fforde, discussions on the Banking Act, material relating to the Select Committee
on Nationalised Industries and several EID files including reports of conversations
with bank CEOs, which are stored under various reference numbers. The archival
evidence presented consists mainly of internal letters within the Bank and confiden-
tial communication with Treasury and market participants. The evidence supports
the arguments put forward in the secondary literature as I argue that the Bank had
no systematic policy in place regarding financial stability and only addressed such
issue as crises arose, on an ad hoc basis.
The story of post-WWII banking in Britain is a tale of two periods.97 The for-
97This section draws on Kynaston (2002) and Capie (2010), both of which describe vividly theintricacies of the Bank of England’s policy towards the institutions in the City.
3.3. QUALITATIVE EVIDENCE 69
mer was a continuation of an informal and uncompetitive sector with a cartel-like
structure that had characterized the industry throughout the 19th century. The lat-
ter period, beginning in the 1970s, is the story of deregulation, increased formalities
and greater competition within the sector, both domestic and foreign. As the Bank
of England played the role of linking the government (primarily Treasury) and the
financial sector (the City), the primary focus is on the Bank, its responsibilities, roles
and relationships. Other branches of government are mentioned only in passing, as
they relate to the story. Geddes (1987) sums the ruling framework up succinctly:
[...]the generally clubby atmosphere of the banking business continued
happily into the post-war years. As one Governor of the Bank put it in
1957, ”If I want to talk to the representatives of the British banks, or
indeed of the whole financial community, we can usually get together in
one room in about half an hour.” The story of post-war banking regulation
is the story of the gradual breakdown of that cosy club under pressure from
the outside world.98
This history has been researched quite extensively but has nonetheless played
second fiddle to the parallel history of monetary policy and systems.99 This is true
of both contemporary and subsequent material and applies to both outsiders, such
as journalists and academics, as well as within the Bank itself and the City. As
the financial system had been very stable for a long time, financial stability and
regulation was slowly consigned to the background with the implicit assumption
that instability was a thing of the past.
98Geddes (1987) p. 98.99Capie and Webber (1985) remains the authoritative guide. Moran (1984) focuses on the banking
side. Goodhart (1988) provides both monetary and financial coverage.
70 CHAPTER 3. SUBSIDIES AND STABILITY
What little discussion the Bank did have on supervision, it was mainly concerned
with deciding who was allowed to take deposits and which institutions were allowed
to call themselves a bank.100 These distinctions were maintained to protect the
investing public but little attention was paid to further rules for those that had been
granted banking permission. Neither was much heed given to the question whether
a formal licence to call an institution a bank served as a guarantee by the Bank of
England to the creditors. Due to the lack of discussion or attention paid to standard
regulatory measures, the primary evidence of the Bank’s attitude and policy towards
actual supervision comes from episodes where trouble arises and the Bank is forced
to act and take a stance.101
The general disinterest in regulation and broad financial stability during this
period can also be seen in the reaction to international financial instability in the mid-
1970s, not only in Britain but in Switzerland, the United States and Germany as well.
Liquidity dried up in the world’s financial system and the solvency of several major
institutions was threatened. As Hirsch (1977) acknowledges, ”many analysts, the
present author included, had assumed this class of problem to have been left behind
with the Credit-Anstalt in 1931. Thus, the issue found no place in the extensive
academic literature and official documentation of the previous fifteen years.”102
3.3.1 A Brief Overview of Post-War Banking
The first major event of the post-war period was the Bank of England Act of 1946
which, as stated, was ”an act to bring the capital stock of the Bank of England
100The Bank of England (1978) includes discussion on the Bank’s regulatory role.101Watson (2008) tackles the development of the financial sector after WW2, including the insti-
tutional framework.102Hirsch (1977) p. 242.
3.3. QUALITATIVE EVIDENCE 71
into public ownership and bring the Bank under public control”.103 The Act thus in
effect formally nationalized the Bank and, according to the Bank itself, ”enabled the
Treasury from time to time to give directions to the Bank as, after consultation with
the Governor, they thought to be necessary in the public interest”.104 The Bank’s
responsibility for financial stability had in fact been established and developed in
the banking crises of the mid-19th century so while prior to the 1946 Act the Bank
was formally privately owned, it had nonetheless acted in what was thought to be
the interest of the public.105 Hence the 1946 Act did not bring with it a sea change
regarding what the Bank was expected to do.106
The development of the Bank’s relationship with the City in the three decades
following the nationalization was one of continued familiarity whereby the Bank
tried to influence the commercial banks’ decision-making by persuasion rather than
legislation.107 There was periodic frustration on both sides but all parties involved
seemed to value the arrangement and no public calls were made for radical changes
to the environment.
Hence the Bank was seen as a sort of overseer to the banks whereby the former
would weigh in with guidance and hints as to the feasibility of the latter’s plans
103Bank of England Act 1946. Retrieved from the Bank of England website 27/06/2012.http://www.bankofengland.co.uk/about/Documents/legislation/1946act.pdf p1.104Retrieved from the Bank of England website 27/06/2012. See
http://www.bankofengland.co.uk/about/Pages/legislation/legis.aspx105In contrast to the period under review in this chapter, the late 19th century crises have been
heavily documented. See e.g. Flandreau and Ugolini (2011) and Mahate (1994).106See e.g. Capie(2010) pp. 34-36 for the significance of the 1946 Act. Capie emphasises how ill-
defined the Bank’s position was and contrasts the ease of nationalizing the Bank with the complexprocess of other new public corporations. Tempest (2011) also argues that the impact of the actwas ”minimal” with the government ”hesitant to interfere with this invaluable ’golden goose’” (p.81).107Sayers (1986) provides the official Bank of England history from 1891 to 1944. Relevant coverage
of the more recent period can, for example, be found in Cassis and Bussiere (2005) and Michie andWilliamson (2004).
72 CHAPTER 3. SUBSIDIES AND STABILITY
while staying mindful of not being regarded too bossy. This relationship suited both
sides. It provided the Bank with the illusion that it was in charge and increased
its authority and importance towards the Treasury.108 For the banks there was the
easy access to government that other firms didn’t have as well as the shelter from
competition and adverse market conditions.
The fact that the various functions of the financial system were kept separate,
each with its own clubs and cliques, meant that competition was even more scarce
and the prevailing system suited the incumbent firms quite well.109 Beginning in the
early 70s, however, increased global flows and emphasis on competition within policy
circles and academia meant that the system started to feel pressure from the outside.
The general attitude towards competition and markets was becoming more positive
and was felt within the financial system as well. This was to have huge effects on
British banks but the potential for increased instability was only gradually noticed
by the Bank.
So despite the Bank playing a prominent, yet informal, role in the banking sector
in the post-war period, the role wasn’t discussed much or given much attention. The
role was known to exist in the background but the general opinion was that it needn’t
be given much heed, presumably because banking crises were thought to be a thing
of the past. As previously mentioned, the Bank assumed responsibility for financial
stability following the crises of the 19th century but this role was never formalized
108This view held within the Bank is discussed in greater detail below. On the general relationshipbetween Treasury and the Bank, Wass (2008) recalls that ”In the exercise of all these functionsthe Bank operated with a good deal of contact with the Treasury, although the precise way that itexercised its management functions in these areas was often determined on an ad hoc basis, thatis to say the Bank would consult whenever there was an important issue at stake” (Wass (2008)p.31).109These dynamics are covered in the literature review of Chapter 2.
3.3. QUALITATIVE EVIDENCE 73
and was taken as a given due to the Bank’s status as reserve-holder for the system.110
This stability role was one that other more traditional banks refused to take part in.
The fact that other banks declined to share this burden, as Geddes (1987) puts
it, was not met with much scepticism as to why that was the case and what that
implied regarding the riskiness of ”the burden”. As for the Bank’s own view of the
clearer banks in particular and its own ability to safeguard the system, the following
admission from an internal memo is remarkably frank:
To all appearances, we know rather little about the clearing banks be-
yond what is necessary for day-to-day market management and for ob-
taining the banks’ agreement to alterations, general or specific, in their
lending policy. We know no more than the general public about their real
profitability. We know almost nothing about their efficiency as users of
real resources. Even in the field of credit control, after 14 years of reacti-
vated monetary policy, our interpretation of month-to-month changes in
bank advances relies largely upon our own speculative reasoning.111
Such a candid admission of the Bank’s lack of knowledge regarding the funda-
mentals of the financial system is refreshing but at the same time shocking. Recon-
ciling this lack of knowledge and therefore lack of information of the soundness of the
system, with the fact that one of the main objectives of the Bank was to maintain
stability in the sector is a tough ask. How the Bank intended to keep the system
safe despite knowing ”almost nothing” about the efficiency, profitability or changes
in bank advances is a mystery. It is hard to see the Bank staff approaching the issue
of stability in any other way than imagining that the clearers must have known best
110See Redish (2001) for the evolution of the lender of last resort role.111Bank of England Archives ADM35/6, letter dated 13/04/65.
74 CHAPTER 3. SUBSIDIES AND STABILITY
and should be trusted to keep the system safe. What would happen if that wasn’t
the case was a remarkably understudied scenario.
3.3.2 The Mid-Century Transition From Old to New Bank-
ing
The thrust of the Bank of England’s thinking towards economic management there-
fore came via monetary policy, primarily the bank rate, and not financial stability.
In addition to the bank rate the primary tools that the Bank used to control the
banks, and thus credit in general, were ceilings and limits.112 The Bank would tell
the banks what percentage increase in advances it would tolerate over the coming
months and the banks would begrudgingly accept - in theory at least. These were
obviously quite crude measures and were often announced to the banks without any
consultation or warning. The requests were therefore met with increasing irritation
by the banks. One such occasion which caused particular dismay to the banks was
during 1968 when another tightening of credit was announced in order to curb in-
creasing demand in the economy. The episode demonstrated the difficulties involved
with operating an institution which was public in nature but nonetheless seen as
something of a servant to industry by both its staff and its ”clients” (i.e. the banks).
With Treasury concerned about the unsustainable level of demand in the economy,
it was communicated to the Bank that further restrictions on bank lending would be
required. Bank of England Governor Sir Leslie O’Brien complained to the Treasury,
however, that a request to restrict credit further at this point in time would worsen
the already-strained relationship with the banks, possibly to a breaking point.
O’Brien feared the request might cause what the Bank had long feared; that the
112Cobham (2002) describes the workings of monetary policy at the time.
3.3. QUALITATIVE EVIDENCE 75
banks would simply decline since the Bank had no formal power to intervene. This
would put the Bank in the unenviable position of having its authority questioned or
being forced to act against the banks’ will. The Treasury didn’t back down and in
the end O’Brien was forced to go along with the Treasury line. The banks were told
to reduce their loans by 6 per cent with O’Brien having to warn them that if they
were seen as not complying then he would have no other choice but to take some
unspecified action against them.
The Bank therefore acted as a hesitant middleman between Treasury and the
banks and while sympathetic to the banks frustration, saw that it was forced to carry
out Treasury’s wishes in curbing the banks’ advances. The banks hesitantly agreed
in principle to comply but advances continued to rise nonetheless. This development
was obviously not to the Bank’s liking and constantly fearing what would happen if
the banks refused to comply decided to penalize the banks by reducing the rate of
interest paid to them on special deposits.113
Episodes such as this show the haphazard process by which the Bank developed
into a public institution with checks and balances akin to other public institutions.
Despite having been formally nationalized 22 years earlier, the Bank still felt torn in
its dual role as servant of the government - in particular the Treasury - and guardian
of the City. The banks in turn felt increasingly betrayed by the Bank and its apparent
lack of willingness to safeguard their interests. This dual-role would however be an
ongoing dilemma within the Bank.
The gradual development from City guardian to public protector can also be
seen in a debate on increased statutory powers for the Bank during the summer of
113Special deposits were a scheme whereby the Bank required banks to deposit a percentage ofcash reserves with the Bank. They ranged from 0.6 mGBP to 1.9 mGBP in the four years followingthe crisis, see Wesson (1985).
76 CHAPTER 3. SUBSIDIES AND STABILITY
1974. The Bank was for its part hesitant and stated internally that such powers
would mean that the system would
[...] soon lose its informal and flexible nature. The position of the
Bank would have undergone a decisive and irreversible change such that
we would be looked upon as the administrator of statutory powers rather
than as the senior member and leader of the banking community [...]
the informal and intimate relationship between the Bank and the banking
system would have been weakened and self-regulation given way to a lazy
acceptance of government authority and government responsibility.114
Another revealing exchange came the following year from the Select Committee
on Nationalised Industries which had long wanted a detailed look inside the cryp-
tic and mysterious ways of the Bank. During one of many visits to the committee,
O’Brien depicted the Bank as an independent body which didn’t belong to any par-
ticular minister. Its independence meant that the Bank wasn’t wholly a government
entity and was free to form its own view of its own matters. He did however allow
for the fact that the Bank executed government policy once it had been decided. It
is hard to reconcile these two views into a coherent whole and O’Brien did not state
in full what the procedure was when the government wanted the Bank to perform a
task that the latter had a negative opinion on. O’Brien spoke to the committee at
length on many issues and tried to explain how they should view the Bank within
the government sphere.
After being quizzed whether the Bank’s self-stated requirement of secrecy wasn’t
problematic at times and gave the Bank the opportunity to ”drop clangers by stealth”
114As quoted by Capie (2010) p. 609.
3.3. QUALITATIVE EVIDENCE 77
and to ”make mistakes by stealth”, O’Brien said ”Yes, that is so, but dropping
clangers is not a thing which the Bank goes in for”.115 The Bank thus saw itself as a
public institution which was unique in its role and needed not only a certain degree
of operational independence but also some distance from formal government.116 The
Bank was persistent in defending this framework and put discretion and secrecy
before accountability and openness.117 In fact, the Bank refused to reveal its accounts
to Treasury and was not keen to be held accountable for the contents of the accounts
when it did start releasing them. As Chancellor of the Exchequer, Denis Healey, put
it, the Bank saw itself as ”the guardian of mysteries which no ordinary mortal should
be allowed to understand”.118
This attitude can also be seen by dismissive remarks around the same time
made by Sir George Bolton, executive director at the Bank, who claimed that ”the
positive mania for information reveals the desire to interfere and to direct operations
in markets that take a life-time to understand”.119 Bolton, echoing a common view
within the Bank, was adamant that central banks should be left to their own devices
115As quoted by Kynaston (2002) p. 406.116Much has been written on the extent of independence of the Bank of England. The inde-
pendence it enjoyed at the time was not of the same nature as defined in the modern literatureon central bank independence but rather a more intangible distance from Treasury. According toCapie (2010), the Bank ”operated with considerable freedom” during the period. Cobham (2002),on the other hand, looks at the Bank’s independence via a quantitative index and finds that inde-pendence was weaker in the 1970s than in more recent decades. This is understandable as formaloperational independence to the Bank was only granted in 1997. Furthermore, the results are mostlikely partially driven by the fact that the index is constructed along the lines of current definitionsof independence with formalities such as appointment of the Governor and legal mandates givenhigh priority.117An internal paper titled ”Implications of changes in the British banking system” stated that In
its supervisory relationship to the banks, the Bank of England has preserved an extreme discretion”.Furthermore, regarding supervision, the Bank ”still resembles a private disciplinary force, whosebehaviour is subject to rules thought reasonable by those seeking its protection.” (Bank of EnglandArchives ADM35/6, document titled ”Implications of changes in the British banking system”).118As quoted by Kynaston (2002) p. 495.119As quoted by Kynaston (2002) pp. 407.
78 CHAPTER 3. SUBSIDIES AND STABILITY
and not be subject to ”relentless cross-examination” by public authorities.
These examples all demonstrate the lack of a holistic view of the Bank’s purpose
and the many potential principal-agent pitfalls that such an unclear view introduces.
Simple what-if questions could have shed light on the impracticality of the contem-
porary arrangement of the Bank being a part-time City agent and part-time public
protector. What if the Bank did in fact make mistakes and had the possibility of
not disclosing them? What if the City’s interests were to differ drastically from the
public’s interests? How should the owner of the Bank of England judge its perfor-
mance without any information regarding the institution? How are principal-agents
and accountability issues to be dealt with, apart from hoping that the Bank’s staff
and directors are honest, and extremely competent people?
O’Brien’s above depiction of the Bank is one attempt to answer this last question
and his answer that ”dropping clangers” isn’t something the Bank ”goes in for” gives
a clue as to how the Bank itself thought about the framework. When confronting
the issue of why the banks were willing to accept this informality as well as the
quasi-control which the Bank of England considered itself to have over these private
institutions, the Bank’s officials took the unsuspecting stance that the banks realized
that it was for their own good that their behaviour was restricted:
The success of self-regulation involves the scrupulous observance of
rules, and depends in large part on the belief of those concerned that the
rules are drawn up by a responsible and acceptable representative body or
authority and that obedience to the rules is in their own best interests.120
Why the banks should welcome this interference with their business and in fact
encourage it is not explained further. It must rest upon the assumption that the Bank
120Bank of England Quarterly Bulletin 1978 18(3) p. 379.
3.3. QUALITATIVE EVIDENCE 79
of England somehow had greater knowledge about how to keep banks safe than the
banks themselves did - which is a rare view for bank executives to have. Indeed,
Goodhart and Schoenmaker (1995) make the point that, by definition, regulated
banks should object to the interference:
Regulation is otiose, unless it forces financial intermediaries to do
what they otherwise would not voluntarily have done. Therefore unless
the regulatory body is largely an advisory, counselling body, it will be
resented by its clientele, and given few thanks for hypothetical, averted
crises, except where these are obvious, as when the Fed calmed the situa-
tion on and after October 19th 1987.121
Taken at face value it therefore seems odd that the banks were willing to take
suggestions - which were de facto orders - from the Bank despite the fact that the
Bank didn’t have any obvious statutory authority to do so.122 Wass (2008) makes
the case that ”Although there was no legal control over the banks, they were very re-
sponsive to requests by the Bank of England to limit their lending, both qualitatively
and quantitatively.”123 Griffiths (1973) concludes that the banks could best be seen
as ”a classic private oligopoly operating a cartel which was subsequently shown to
be against the public interest but who complied with the requests of the authorities
in return for the monetary authorities quasi-official support of their agreements.”124
121Goodhart and Schoenmaker (1995) p. 547.122Busch (2004), on the other hand, takes the banks actions more at face value. Regarding the
clearers’ involvement in the Lifeboat operations, Busch states that ”[t]he fact that they were willingto pay so much money without being in any way legally required to do so is an excellent indicator forthe functioning of the informal regulatory system in which feelings of solidarity and commonalitywere more important than pure profit considerations.” This is despite the fact that the banksthemselves conceded that their losses would have been much greater if they hadn’t taken part. SeeAckrill and Hannah (2001) p. 208.123Wass (2008) p. 20.124Griffiths (1973) p. 15.
80 CHAPTER 3. SUBSIDIES AND STABILITY
Capie (2010) describes this supervisory framework at the time as ”a mixture of
statutory and non-statutory powers, with the emphasis on informality and flexibility
rather than legislation and rigidity.”125
This approach of conducting monetary policy through discretionary and seem-
ingly haphazard instructions regarding loan growth patently did not appeal to the
banks but yet they complied. Their reluctant compliance can however be compre-
hended once one introduces the benefits that the relationship with the Bank pro-
vided.126 The clearers’ traditional, and formal, view was that ”The Governor of the
Bank was seen as acting both as the government’s representative in the City and as
the City’s ambassador to Whitehall.”127 But as the banks increasingly felt sceptical
about the Bank’s willingness to play the role of a general City guardian, the main
benefit that remained in place was the Bank’s function as an informal buffer against
times of difficulty.
Cameron Cobbold, the Bank Governor from 1949 to 1961, demonstrated this
role succinctly in conversation to a senior London bank manager when he stated
”Now, I’m at your personal disposal any time [...] If there’s a crisis, come and see
me personally, don’t hesitate. And if you possibly can, come see me before the crisis,
not after the crisis has started”.128
The Bank’s attitude towards safeguarding financial institutions in the post-war
125Capie (2010) pp. 589.126Ackrill and Hannah (2001) touch upon this relationship and the uneasy manner of parties on
both sides of the table.127As stated in evidence by the Committee of London Clearing Bankers (1977) to the Committee
to Review the Functioning of Financial Institutions p. 179. More informally, the clearers’ evidenceto the committee also mentioned that ”as the clearing bank spokesman put it, ’provided we keepthe Bank of England informed, they more or less leave us alone’ with the qualification that, onoccasion, the Bank might advise the clearing banks that on a particular issue they should ’leave itto us’.” p. 180.128As quoted by Kynaston (2002) p. 58.
3.3. QUALITATIVE EVIDENCE 81
period was perhaps best demonstrated by its reactions to the Secondary Banking
Crisis of 1973-1975.129 Following the rise of so called ”fringe” banks that utilized
wholesale funding markets to grow rapidly, the Bank was forced to form an opinion
on its relationship with them. In early 1973, a paper discussing an EEC directive
on regulation co-ordination stated that ”A failure of one or two among these [note:
fringe institutions] might well prove embarrassing to the authorities” and if such
an institution were to fail ”the Bank might be held implicitly to have assumed and
accepted at least some responsibility for its soundness”.130
However, it took the Bank a while to come to this conclusion. As the fringe
banks hadn’t been on the Bank’s radar, the Bank came ill prepared to tackle the
fringe’s problems when they surfaced. Initially, the Bank argued that the fringe
wasn’t its responsibility and it shouldn’t concern itself with its problems.131 When
the Bank realized that failures of fringe banks could have serious effects on the core of
the financial system, it quickly reversed its position and became a concerned partner
of the clearers. The Bank cooperated fully with the clearer banks to minimize the
fall-out and contagion of the fringe’s difficulties, both with funds and as a focal point
for cooperation. In total, 26 institutions received help from the Bank of England and
the clearers with the amount lent reaching 1.2 bnGBP at the peak.132 The clearers
provided the majority of the sum lent but the Bank’s contribution was non-trivial.
Furthermore, when the sums involved inevitably turned out to be larger than the
initial estimates, the clearers refused to cough up more money and the Bank itself
129The causes and intricacies of the secondary banking crisis are explored in more detail, separately,in the other chapters of this thesis.130As quoted by Capie (2010) p. 601.131Capie (2010) points to the fact that policymakers thought that the fringe would become irrel-
evant due to increased competition following the Competition and Credit Control policy.132See Ackrill and Hannah (2001).
82 CHAPTER 3. SUBSIDIES AND STABILITY
was forced to come up with the rest.133
At one point during the crisis, with the concerns reaching such a high level that
even the largest banks’ solvency was starting to be questioned, the clearers even
called on the Bank of England to publicly state which banks would be saved no
matter what. Such an open commitment to public liability insurance would have
represented a clear break and would have meant that implicit guarantees were made
explicit.134 The Bank ultimately refused the request although there was little doubt
- on both sides of the table - that a few key institutions would be saved - come
what may - to save the system.135 Furthermore, the mere fact that the banks should
ask for such a statement shows how they thought of the Bank and its role as their
guardian against crises.
Nonetheless, the effect of the ”Life boat” operations to safeguard the system was
to reinforce the perception that the Bank of England stood behind certain institu-
tions. This obviously had the desired effect of stabilizing the system but came at the
cost of, in some sense, socializing financial sector liabilities. Following the crisis, giv-
ing evidence to the Committee to Review the Functioning of Financial Institutions,
the Committee of London Clearing Bankers stated their view that
The crisis of confidence was to some extent indiscriminate in the banks
affected and it was therefore in the public interest to contain it so as to
avert serious damage to the economy in general, and to the reputation
133The sums are discussed and summarized in Reid (1982), Capie (2010) and Moran (1984).134This marks an important point as it sheds light on the approach to policymaking and how the
Bank thought about its role as protector of the banks. I come back to this point and the idea oflists containing those banks that would not be allowed to fail in Chapter 5.135One telling internal Bank discussion mentioned the argument that ”since it is inconceivable (and
assumed generally to be so) that the Government could allow a clearing bank to ”go under”, theclearers require less capital resources to maintain confidence than other companies or institutions”(Bank of England Archives 2A170/1, letter dated 02/09/74).
3.3. QUALITATIVE EVIDENCE 83
of the UK banking system in particular [...] A further, closely related,
objective was the protection of small depositors who might not have fully
appreciated the risks they were running in leaving funds with fringe in-
stitutions. In fact, however, the lifeboat operation had the effect of pro-
tecting all depositors, including the large corporate ones who might have
been expected to appraise the risks more realistically.136
This protection obviously came at a cost which was ultimately borne by the
collaborative efforts of the clearers and the Bank of England - with the distinction
between them even murkier than before. Following the crisis, the regulatory system
was inevitably criticized. The thrust of the Bank’s regulatory operations had con-
sisted of a staff of fifteen who relied ”too much on trust and membership of the City
club in their judgements”.137 Geddes (1987) quotes the principal of the Discount
Office at the time, discussing the unsuspecting world-view towards the fringe banks
and their various failures: ”I think we took those on trust the basis being, of course,
that if you ever found a chap out in a lie, he was finished forever. You assumed
nobody would be so stupid”.138
A final instance to mention regarding the Bank’s reactionary policy to turbu-
lence and role as City guardian was the 1967 devaluation of Sterling. Following
ongoing difficulties with maintaining a fixed exchange rate, the government had de-
cided to devalue Sterling by approximately 14% amidst continued pressure on the
136Committee of London Clearing Bankers evidence to the Committee to Review the Functioningof Financial Institutions p. 65. This dual rationale for intervention - protection of depositors andcontagion spreading - is a common one in the recent literature, e.g. Dewatripont and Tirole (1994).This rationale also ties in to the analysis in Chapter 5 where I try to ascertain how much evidencethere is for the contagion argument.137Ibid.138Geddes (1987) p. 104.
84 CHAPTER 3. SUBSIDIES AND STABILITY
currency.139 It was widely expected at the time that other members of the Sterling
Area would follow Sterling but the move was ultimately not appreciated by all mem-
bers and some refused to devalue. This caused considerable dismay for several market
participants including commodity merchants in London who had bought goods for-
ward in Sterling Area currencies and were exposed to forward currency mismatches.
When the problem arose, an internal Bank memo noted that the merchants’ ”normal
expectation would be a profit of 0.5–1%; they now face losses of 14%. Such losses
may be disastrous to individual firms”.140
The matter was complicated further by the fact that some of the merchants, con-
cerned about the possibility of this breakdown of the Sterling Area, had approached
the Bank prior to the devaluation and asked for permission to hedge this currency
risk forward. The Bank had refused the request as this was not permitted under
exchange control regulations. Following the devaluation these merchants complained
to the Bank and demanded that it compensated them in full for this loss as they had
been denied of the opportunity of preventing it.
There was considerable debate, both within the Bank and with the merchants,
and the Bank considered four ways to solve the problem141:
1. Maintain that merchants were aware of the risks and must bear them them-
selves.
2. Consider compensation in some form.
3. Approach the ultimate buyer.
4. Seek the co-operation of the local Sterling Area governments.
139See Oliver and Hamilton (2007) and Bordo (1993) for discussions on the devaluation.140Bank of England Archives 6A351/1, letter dated November 1967.141Bank of England Archives 6A351/1, letter dated November 1967.
3.3. QUALITATIVE EVIDENCE 85
The memo goes on to state that ”If indeed the losses involved are substantial,
there is clearly a risk of bankruptcies or default on contracts; either course would
be most damaging both to the Commodity Markets and to the British financial
reputation. In these circumstances we could not rule out the need to provide some
sort of help but the decision would necessarily be a political one.”
The Bank was thus not fully willing to let the merchants themselves bear full
responsibility on two grounds: The merchants had been denied permission to hedge
the risk beforehand and also that there would be reputational risk to the City. The
former argument was something that the Bank wasn’t quite willing to dismiss, de-
spite the fact that the traders had decided to pursue with the trades despite being
explicitly refused permission to hedge forward. A straightforward interpretation of
such decision-making would be that the traders considered the business profitable
despite the currency risk which they were fully aware of - not that the Bank of
England would guarantee their currency exposure going forward if problems arose.
While the losses ultimately turned out to be smaller than anticipated, there were
initial fears that the magnitude of the problem meant that it had the potential to
become a systemic one. The Bank internally noted that the losses were ”considerable
and justify the contention voiced yesterday that enough firms might well go to the
wall to threaten the survival of some of the markets. Paris is watching with gloating
expectation”.142 Anything up to 30 mGBP was thought to be on the line but the
figure was subsequently revised downwards. The initial figures were however large
enough to concern not only the Bank but Treasury as well. An internal Treasury
letter stated that:
142Bank of England Archives 6A351/1, letter dated 24/11/67. These fears of losing business toParis are similar to those documented by Meltzer (2009) p. 718.
86 CHAPTER 3. SUBSIDIES AND STABILITY
If no prospect of help is held out by the end of this week we must
expect very great public pressure on the Government both in Parliament
and the Press. There is also the possibility of some real damage to the
United Kingdom’s position as one of the leading commodity trading cen-
tres. Whatever assessment one may make of this, moreover, the fact
remains that relations between the City and the Government will be con-
siderably strained if no help is offered to firms who will represent them-
selves as having suffered severe losses on legitimate trade through no fault
of their own. This strain may well spill over into other aspects of the
Government’s relations with the business community.143
Furthermore, remarkably, the Treasury staff thought that a further argument
for assistance to the traders could be made with the fact that the amounts involved
were small compared with other items of the government’s expenditures. Treasury
predicted that market participants would claim that the losses were completely avoid-
able with more flexible exchange rules or ”by compensation in amounts which are
tiny in relation to other items of Government expenditure on what they will represent
to be less obviously worthy objects.”144
However, Treasury also recognized the fact that the risks were taken by profes-
sionals with knowledge of the possibility of losses, stating that ”by their very actions
before devaluation, these traders showed that they were well aware, not only that
the U.K. might devalue, but also that Nigeria might not follow a U.K. devaluation.
[...] To this extent they are no different from others who took a risk on devaluation
(or non-devaluation) and lost, or won, accordingly.”
143Bank of England Archives 6A351/1, letter dated 30/11/67.144Bank of England Archives 6A351/1, letter dated 30/11/67.
3.3. QUALITATIVE EVIDENCE 87
The paper concluded that refusing direct assistance was a more agreeable deci-
sion since not all firms were believed to be in danger. Some damage would however
be unavoidable and Treasury would certainly be heavily criticized. In the end, the
traders had to be held partially responsible while at the same time the reputation
of the City had to be kept intact and a financial panic avoided. The government
was thus treading the familiar line, laid out for example in Section 2, of appearing
firm and strict with regard to market discipline while maintaining the benefits of
discretion when volatility and panic arose.
The Bank’s response to Treasury’s letter was predictably somewhat sceptical.
With its history and traditional role as a go-between for Treasury and the City, the
Bank found itself more sympathetic to the traders than Treasury was. Regarding
the argument that the traders took the risks willingly, the Bank argued that such
reasoning was superficial. The Bank was of the opinion that the government and
the Bank itself were somewhat responsible for the situation following their refusal
to allow the traders to hedge forward. The Bank’s main argument however was the
possibility of systemic risk as well as using the often invoked argument of business
moving elsewhere if policy was unaccommodating towards the City.
The Bank thus leaned more towards assistance than other parts of government,
and did so using several arguments. The threat of contagion was put forward, the
fault of government itself, the potential loss of business elsewhere and the general
cooperative mood with which the Bank had always worked with the City. Indeed,
in another internal letter, Bank staff argued that inaction would lead to serious
bankruptcies as well as warning that Britain would lose a lot of business to Germany,
the Netherlands and France who had, according to Bank staffers, ”made strenuous
88 CHAPTER 3. SUBSIDIES AND STABILITY
attempts in the past to wrest London’s entrepot trade away.”145
In this spirit, the Bank was in daily communication with the main traders
involved and mentioned ideas of loans below market rates to cover the losses. These
ideas were not met with enthusiasm as the traders disliked both the terms and the
forms of assistance. In effect, they wanted the losses covered in full by direct grants.
Ultimately, the Bank stood willing to make 5 mGBP available for loans at a
5 per cent interest rate and ended up providing 3.2 million pounds. While the end
result was that no accounting losses were made and the ex post cost of the response
was small, the episode again demonstrates the Bank’s readiness to jump in as soon as
it was needed. The fact that the operation was somewhat limited in size was merely
due to the problem being smaller than expected - not that the Bank was unwilling
to commit funds when needed.146
The reoccurring episodes of crisis did presented at least one benefit, which was an
increase in debates within the Bank on the fundamental issues of financial stability.
For a period of time while the secondary banking crisis was still fresh in the mind of
the public and the City there was some thought given to a more systematic policy
regarding the Bank of Englands role in ensuring financial stability. A letter by the
Finance House Association, written in 1974 at the height of the secondary crisis,
strikes at the heart of the topic of this chapter and raises questions which went
unanswered but were of enormous importance.
The letter raised fundamental questions regarding regulation and what it meant
to be an accepted institution. Would depositing with an accepted institution mean
that the money was safe, while depositing at other institutions was done at one’s own
145Bank of England Archives 6A351/1, letter dated December 1967.146Bank of England Archives 6A351/1, letter dated 8/12/67.
3.3. QUALITATIVE EVIDENCE 89
risk? According to the Finance House Association, this was ”indistinguishable from
saying that deposits with the first group are guaranteed. Guaranteed by whom?
Other finance houses? The Bank of England? The State? What strings, what
interference in business, might attach to such a guarantee? Will a financial institution
have the option of abiding by the Code (and getting cheaper deposits at the price
of supervision) or not (and avoiding supervision at the price of paying more for
deposits)?”147
Such questions, despite their fundamental nature, were never answered following
the crisis despite the reform of the sector accompanying the Banking Act of 1979.
While a system of deposit insurance was installed at the turn of the decade, the
ultimate question of what assets were safe and who they were made safe by was
deemed too inconvenient to have a formal answer stated. The Bank thus only tackled
such questions in passing, internally and without definitive answers. Such questions
are similar to the framework put forward in Section 2 above and the discussions show
the Bank staff becoming aware of Section 2’s contradictory objective for central banks
- keeping the system safe while preserving market discipline.
The issue arose again in 1976, in a confidential internal Bank letter titled ”The
General Thinking Behind the Governments Approach to Prudential Supervision”
where the thin line between protection and market discipline was discussed. The
letter recognized the trade off between protection and moral hazard and sensibly
stated that the correct balance lay somewhere between the two extremes of explicitly
protecting all investors and letting any minor panic turn into a full-blown financial
crisis. The question would always be where to draw the line:
Once we have decided where we intend to strike the balance, there
147Bank of England Archives 7A204/1, letter dated 11/06/74.
90 CHAPTER 3. SUBSIDIES AND STABILITY
are still a number of other very difficult questions which we shall need
to consider when determining the details of the prudential system. One
such area for further consideration will be the precise height of the entry
barriers. This brings one straight back to the innovation versus risk trade
off. Another area is the relative amount of effort to be devoted to super-
vision once an institution has been authorised by the Bank. The effective
degree of protection for depositors could be the same with either a regime
which combined high entry barriers and relatively relaxed post-entry su-
pervision or with one which provided relatively low entry barriers but very
strict post-entry supervision. This is clearly an area worthy of further de-
bate if the legislation is to establish the most appropriate system for the
circumstances in the UK.148
The letter concluded that informed public debate and consultation was crucial
before legislation were to be introduced. Internal discussions such as this one intensi-
fied somewhat as the Banking Act of 1979 approached. Hence it cannot be said that
Bank staff was unaware of these tricky issues or that they gave them no thought.
Instead they remained in the background and never received the necessary attention
for a solution to be found.
This background discussion and philosophical discussion within the Bank even
went so far as to question such fundamental issues as the purpose of regulation.
One internal letter stated that there were three possible ”objects” of regulation; to
protect the financial system, protect depositors and observe EEC requirements.149
According to these three possibilities, only the last one could be considered a public
148Bank of England Archives 7A204/1, letter dated 01/08/76.149Bank of England Archives 7A204/1, letter dated 28/10/77.
3.3. QUALITATIVE EVIDENCE 91
service as the former two’s benefits fall disproportionately to certain members of
society but the costs fall on society as a whole.
One possible solution that the Bank entertained was formally introducing a two-
tier system whereby there was a predetermined core financial system which was to
be considered safe, and a defined fringe whereby returns were presumably higher but
creditors ran the risk of default. In effect, this would be similar to the system in
place prior to the crisis apart from the fact that creditors of both tiers were effectively
saved during the crisis. This conundrum was never fully dealt with, primarily due to
the fact that it would have required the Bank to decide whether ”safe” meant that
the Bank itself guaranteed any losses incurred by bankruptcy within the core.
These fundamental discussions slowly abated as memories of the crisis faded
away and the Bank. The balance sheets of the core financial institutions recovered
and confidence was restored, relieving the Bank of the task of systematically defining
the right mixture of market discipline and stabilization. It was thus free to revert
back to its preferred method of discretionary policy with regard to financial stability.
When the Bank Act of 1979 finally materialized, most attention was given to the
licensing scheme and deposit insurance which came into effect three years later.150
Due to the wide-scale changes to the British financial sector in the following decade
it is hard to estimate the effects of the 1979 Act on subsequent outcomes. For the
purposes here it can however be said that while the discussion leading up to the act
did involve fundamental questions on supervision, the end result barely touched on
these questions apart from the partial deposit insurance which was, however, not
150Gola and Roselli (2009) sum the act up thusly (p.13): ”The Banking Act 1979 extended thesupervision of the central bank to the secondary sector (licensed deposit takers), and formalizedsupervision in the primary sector (recognized banks), thus creating a kind of two-tier system. ThisAct is anyway a watershed, since before that bank supervision was conducted on an essentiallynon-statutory basis.”
92 CHAPTER 3. SUBSIDIES AND STABILITY
designed to deal with a breakdown of the core of the financial system.
The conclusion of this section is thus that the system of financial regulation and
stabilization policies of the 1970s was underdeveloped and invited various dangers.
These dangers can be seen by the response to the various crises episodes that arose,
from devaluation through to the secondary banking crisis. The fact that the banking
system had been stable for a long period of time meant that the Bank of England
had paid little attention to matters of stability or regulation. This is the aforemen-
tioned institutional memory argument that echoes the conclusions of Berger and
Udell (2004) although their take is focused on risk management within commercial
banks as opposed to the risk management of central banks discussed here. In fact,
greater attention was only paid to matters of financial stability when the Bank was
forced by circumstances to do so.
Furthermore, the ad hoc responses to the periodic crises that endangered sta-
bility opened the door for possible implicit subsidies from the Bank to the financial
sector as private liabilities became publicly backed.151 When investors tried to de-
termine the risk of investments in the U.K. financial sector, the possibility of turmoil
was reduced by the actions of the Bank of England. This meant that whether in-
vestors attributed this stability to a well-functioning system, well-run banks or the
fact that the Bank of England was ready to step in at times of trouble, it had the
effect of dampening risk premiums.
In the next section I try to estimate the extent to which these possible subsidies
arose, how to think about them and the potential pitfalls and difficulties involved.
In so doing I attempt to combine the main issues of this section, namely the Banks
151Again, this relies on the dual assumptions that the Bank is deemed a credible guarantor andthat it is considered a public entity.
3.4. QUANTITATIVE EVIDENCE 93
role of stabilizer of last resort and its effect on market outcomes.
3.4 Quantitative Evidence
In this section I try to establish and estimate the extent of implicit subsidies provided
by the Bank of England to the clearer banks. I do this by constructing a market
price for deposit insurance for the Big Four banks of the 1970s. I start by briefly
describing the data used and the main characteristics of the banks. I then move
on to the literature on the subsidy estimation methodology before explaining the
method used for the benchmark model and then present some preliminary results.
The benchmark model has severe limitations, however, which I look at before moving
on to a more subtle model that addresses some of the main limitations.
3.4.1 Data Selection and Sources
The data used consists of equity prices and balance sheet data for the Big Four
banks. The former is primarily used to calculate volatility, a key parameter in all
option models, while the latter provides leverage numbers and dividend ratios. The
equity prices are daily closing prices, and are retrieved from Datastream and Wharton
Research Data Service, whereas the balance sheet data is taken directly from hard
copies of the banks’ original annual reports.
The period chosen for the calculations is 1970-1980, or 1970-1979 in some cases.
As previously mentioned, this represented the last decade of ”traditional” banking
before the structural reforms that started in the early 1980s as well as increased
foreign competition. Using the 1970s also represents a natural experiment in a sense.
This is due to the fact that volatility in the banking environment was quite low
94 CHAPTER 3. SUBSIDIES AND STABILITY
throughout the decade, apart from the secondary crisis, giving the period a rapid
volatility jump followed by a relatively quick decline. The decade is also the most
recent decade with available official documents due to the 30-year rule.152
I focus on the so called ”Big Four” banks which dominated the scene in the City:
Barclay’s, National Westminster, Midland and Lloyds.153 The liabilities of these four
banks were roughly 45% of the total liabilities of the U.K. banking sector during the
middle of the decade.154 Furthermore, as seen in the previous section, the Big Four
had substantial influence with regard to access to the Bank of England’s personnel
and facilities and they also figure prominently in the Bank of England archives. As
discussed in Section 1, it is primarily due to these banks’ position at the centre of
the system that the focus is on them. Using a larger sample of banks would mean
that banks that were not considered as infallible were included.
The Big Four operated on a fairly low equity ratio throughout the sample period.
The average equity ratio of the Big Four during the decade was 5.9% and went as
low as 4.5% for Midland in 1973.155 This low buffer to withstand losses was not a
major concern for their regulator, the Bank of England, who didn’t seem too much
concerned with the possibility of a substantial erosion of capital.156 While banks
152While the 30 year rule has been replaced by a 20 year rule, the change is being gradually phasedin with documents from 1985 and 1986 being released in 2014.153These were known as the clearers, i.e. the clearing banks. There were six London clearing banks
in total; those used in this chapter as well as Coutts & Co. and Williams & Glyn’s but the Big Fourdominated in terms of size and influence so I restrict the calculations to them. It’s interesting tonote that RBS, which is a solid member of the current Big Four, belonged to the Scottish clearersat the time which in total amounted to roughly 10% of the size of the London clearers.154See statistical annexes in the Bank of England’s Quarterly Bulletin publications.155The clerarers did not publish their true profits until 1969, which strengthens the choice of the
1970s in this exercise. See Capie and Billings (2001) for a discussion and estimation of the trueprofits prior to the sample period.156Turner (2012) discusses the low level of capitalization in the post-war period and shows how
detached the Bank considered capital levels to be from the banks’ operations. Capital levels, andwhat represented capital, started to become a topic of discussion in the second part of the 1970s. Seee.g. London Metropolitan Archives CLC/B/029/MS321 52B/001, ”The Measurement of Capital”,
3.4. QUANTITATIVE EVIDENCE 95
in general did have to provide the Bank with ”prudential returns”, i.e. numbers
on profitability and capitalization, the clearers were excluded from this requirement
on the grounds that there was no urgent need to consider their positions. Their
only regular requirement was to partake in periodic prudential interviews with the
Bank. Section 3 discusses the Bank of England’s decision to leave it to the clearers
to manage their own business on the questionable grounds that it wouldn’t make
sense for their managers to risk bankruptcy.
As for the liability side of the Big Four, it consisted mainly of deposits (which
renders the assumption of no non-deposit liabilities less restrictive). Barclays was
the largest of the four, with just over 16 bnGBP of assets in the middle of the
decade, followed by National Westminster, Midland and Lloyds which had assets of
just under 10 bnGBP.
3.4.2 Methodology
The method of estimating the value of liability insurance via option pricing dates
back to Merton (1977). As Merton demonstrates, a guarantee against default can
be viewed as a put option where the strike price is the value of the insured liabilities
and the underlying asset is the market value of total assets. In effect an insurer pays
for the option of selling his investment at a predetermined price at some future time.
I sketch the method here.
The raison d’etre for deposit insurance is increased financial stability. By insur-
ing deposits centrally, run-like behaviour by investors is discouraged and temporarily
illiquid, but otherwise solvent, banks become less prone to self-fulfilling bankrupt-
cies. This goes back to the classic argument from Diamond and Dybvig (1983) and
which focuses on discussions between the Bank and the banks.
96 CHAPTER 3. SUBSIDIES AND STABILITY
in some sense further still to Bagehot (1873) and Thornton (1802).157 For simplifi-
cation, assume that the bank in question has a balance sheet that consists of total
assets A, total non-equity liabilities L and total equity E so that A = L+ E.158
Furthermore, I assume that the bank has no non-deposit debt, that all deposits
are insured and there is no uncertainty regarding the creditworthiness of the guaran-
tor. These are somewhat strong assumptions and will tend to overvalue the fair-value
of the insurance but nonetheless provide a plausible baseline for estimation. The as-
sumption that all liabilities are insured is in fact not excessively strong and arises
from the fact that non-payment by a bank on any liability renders the bank as a
whole insolvent. For example, if a central bank only insures a given proportion of a
bank’s liabilities then non-payment on any uninsured liability will nonetheless trigger
insolvency and thereby raise concerns about financial stability.
The central bank’s expected policy would hence be to quash concerns regarding
imminent default on any liability and thus ensuring financial stability. The expecta-
tion for this action is even stronger for large, core banks such as the Big Four. While
a central bank generally does not communicate explicitly that any particular bank
will be saved if it runs into trouble, the understandable expectations of creditors of
large banks is often that the bank is so systemically important that the central bank
157Another seminal contribution along these lines is Friedman and Schwartz (1963). On theintroduction and early experience of federal deposit insurance in the United States, they wroteapprovingly that it had ”succeeded in achieving what had been a major objective of banking reformfor at least a century, namely, the prevention of banking panics”. (p. 440). They go on to say thatfederal deposit insurance contributed so greatly to monetary stability and ”in practice far morethan the establishment of the Federal Reserve System.” (p.442)158Limitied liability is key here as equity cannot become negative. This asymmetric property of
equity in addition to the fixed value of debt contracts leads to the importance of deposit insurance.In that sense, equity can be seen as a non-negative residual once other claims have been settled.If, on the other hand, equity could become negative, as in partnerships, then the need for outsideassurance for debtholders would be decreased.
3.4. QUANTITATIVE EVIDENCE 97
would not take the risk involved with letting the bank go into receivership.159
Options are an intuitive way of representing this relationship. I focus here
exclusively on put options which can be thought of as an explicit promise and can
be priced using Merton’s and others framework. In our example, the central bank
would be the seller of the option while the buyer is the holder of the bank’s debt.
While elasticities determine who gains most from such a contract, for simplicity I
assume that the debt holder passes all gains on to the debt issuer who realizes the
gain from any mispriced option issued by the central bank. While this is a somewhat
restrictive assumption, it is common in the literature and arises from the fact that
the bank has a unique position within the financial system while the second best for
the debt holder is purchasing higher yield debt with no such option or contract in
place.
An example of a put option is where an owner of a stock wants to be insured
against extreme declines in the stock price. The stock owner then pays another
investor a premium in each time period for the privilege of being able to sell the
stock to him at a predetermined price in the future, if he so pleases. Say the stock
price of the company is currently at 34 dollars, the owner might sign a contract
whereby at the end of the year, the option seller promises to take the stock of his
hands at 30 dollars, if the owner wants to. Then, if the year-end price is lower than
30 dollars, the owner will sell the stock to the option seller for 30. If the year-end
price is above 30, the contract expires without a transaction. For this privilege the
owner of the stock pays the option seller a certain fee - akin to an insurance premium.
More concretely for the case laid out here, the option seller would be the govern-
159A large literature on these issues has developed in recent years. Freixas et al (2002) providea survey of the literature. More recently, thoughts have turned to the topic under the guise ofsystemic risk. Brunnermeier et al (2009) review the current thinking on the topic.
98 CHAPTER 3. SUBSIDIES AND STABILITY
ment which promises to ”buy” a bank’s deposit holder the face value of the deposit if
the bank runs into trouble. For example, a saver who has 100 pounds in a bank that
defaults can go to the government, hand over his claim on the bank of a 100 pounds
and receive the full 100 pounds from the government. The government will then
face a loss equal to the face value of the deposit, 100 pounds, minus whatever it can
recover from the bankrupt bank. The main difference between deposit insurance and
a traditional put option is thus the underlying instrument. Another instrument that
deposit insurance can be related to is the more recent development of CDS contracts
which also shift default risk between parties for a premium.160
I start by building the most widespread option model, following Black, Scholes
and Merton. This class of models estimates a fair price for the privilege of promises
such as put options. They give answers to questions such as how much should one
have to pay for being insured against large (in some sense) losses? The answer
typically depends on the following factors:
1. Volatility of the asset; If the value of the asset is very volatile then the proba-
bility of the asset being worthless in the future is greater and thus the value of
the put option is higher.
2. The current price and the insured price; If the current price of the asset is 100
then an option that promises that the buyer can sell the asset in the future at
99 is obviously more expensive than an option that guarantees a sale at the
160Looking at CDS spread differentials is, alongside the method used here, the most popularway of estimating implicit financial institution subsidies. This involves looking at differences incompensation required for assuming default risk between institutions considered to be implicitlyguaranteed by the public sector and other institutions. The obvious identification issue revolvesaround isolating banks that are similar along all characteristics apart from the expected guarantee.This method is, however, not possible for this chapter as CDS instruments are relatively new. Anexample of such an approach can be found in Demirguc-Kunt and Huizinga (2013).
3.4. QUANTITATIVE EVIDENCE 99
price of 10.
3. The risk-free rate; If it’s possible to find a risk-free asset that yields 5% a year
then buying an insurance for a risky asset that yields 6% might not be worth
it. If, however, a risk-free asset only gives you 1% but the risky one 6% then an
insurance for the risky asset becomes more valuable. Option models are thus
usually quite sensitive to the risk-free rate.
4. The maturity date; Whether the option, or promise, only applies at the end of
the year or for five years matters a lot. The longer the maturity of the option,
the more valuable it is.
In line with the literature, I set the maturity of the put option to one year which
is generally interpreted as the next audit that the bank undergoes and thereby the
”check-point” for whether the bank’s operations are satisfactory. As per the standard
Black-Scholes model, I assume that the underlying asset exhibits geometric Brownian
motion. This means that very large gains or losses, on any given day, are very unlikely
and expected returns are symmetric. The ex-post value of a standard put option on
the equity is thus
P (t) = Max[0, X − S], (3.1)
where X is the strike price (or option price) and S is the current price of the
asset. Hence, when the contract expires, if the option price is higher than the current
price the contract has a positive value equal to the difference between the two.
The traditional Black-Scholes formula subsequently follows as:
P (T ) = Ee−rTΦ(y2)− SΦ(y1) (3.2)
100 CHAPTER 3. SUBSIDIES AND STABILITY
Where y1 =ln(E/S)−(r+σ2
2)T
σ√T
and y2 = y1 + σ√T .
Here, E is the exercise price of the option, S is the current price and Φ represents
the cumulative standard normal distribution.161 The exponential term represents
standard discounting procedures. The well-known appeal of this approach is its
simplicity. Assuming normality with a known and constant volatility parameter, the
parameters required are essentially only the leverage of the firm in question and its
volatility.162
Following the representation of equity as a non-negative residual, mentioned
above, the value of the liabilities can be written as min[L,A]. Without any insurance,
on the maturity date, if the firm is still solvent the payout to the deposit holders
is what they were owed, L. If however, the firm is bankrupt, i.e. L > A, then the
deposit holders only recover what is left of the assets. If a guarantee is introduced,
we can view the realized, ex-post cost to the guarantor as the stop-gap in case of
default and zero otherwise:
C(T ) = Max[0, L− A] (3.3)
If the firm is solvent at maturity then A > L and the payout is 0. If the firm
is insolvent the guarantor pays the outstanding amount, L, to the deposit holder,
recovers what is left of A and therefore faces a shortfall himself of L− A.
Viewed in this way, the deposit guarantee is equal to a put option with A as
the current price and L as the strike price. Using the equation above, the value of
the liability guarantee (as opposed to an equity guarantee) can, analogously to Ronn
161Note that E here, the exercise price, is not the same E as above when defining assets (A) asthe sum of liabilities (L) and equity (E). However, the two can be related for deposit insurance asthe insurance contract is functionally exercised when equity reaches zero.162See Black and Scholes (1973) for the original formulation and derivation.
3.4. QUANTITATIVE EVIDENCE 101
and Verma (1986), now be written as:
G(T ) = Be−rTΦ(x2)− V Φ(x1) (3.4)
Where x1 =ln(B/V )−(r+σ2
2)T
σ√T
and x2 = x1 + σ√T .
As I use the standard method of time of one year (or to the next audit), all time
notations can be dropped and the model rewritten as
G = Be−rΦ(x2)− V Φ(x1) (3.5)
Where x1 =ln(B/V )−(r+σ2
2)
σand x2 = x1 + σ.
This formation is very similar to the initial notation except we now have B as
the face value of debt and V the market value of assets. We can see that the value
of the guarantee lies in the probability of the debt being higher than the value of
assets when the option expires.
While this approach requires relatively few parameters to be estimated, its main
obstacle lies in the fact that the market value of the bank’s assets, V and the firm’s
total volatility, σ, are unknown parameters. The solution to this is to use data that
is actually observable, i.e. the equity price, along with Ito’s lemma to infer the value
of the two missing parameters.
Denote the two missing parameters, the market value of assets and the asset
volatility, as A and σA respectively. The relationship between σA and the observable
equity volatility, σE, can be stated as follows:
σE =A
E
δE
δAσA (3.6)
This implies
102 CHAPTER 3. SUBSIDIES AND STABILITY
σE =A
EN(x)σA (3.7)
Using the above formula, along with the formula for G, the values of A and
σA numerically can be approached through computational iteration. The number of
iterations required generally does not exceed 300.163 All the required parameters are
subsequently in place.164
The benchmark paper for these studies, along with Merton (1977), is Ronn and
Verma (1986), who apply these methods to the deposit insurance case. In addition
to the framework laid out above, Ronn and Verma introduce a policy parameter, ρ,
which represents the fact that the central authority involved with insuring the banks’
liabilities does not use liquidation and payouts as a first-step when a bank runs into
trouble. This relates to the point mentioned above regarding insured versus non-
insured liabilities. In other words, when a bank first runs into trouble it is reasonable
to expect that regulators try to make sure that the bank remains a going concern in
the hope that its problems prove short lived and its future solvency can be ensured
without drastic measures.
If a certain (non-explicit) threshold is reached however, it must eventually be
the case that the regulators see no hope for the bank and step in to liquidate. This
was the original reasoning behind the policy parameter in Ronn and Verma (1986)
but one can also rationalize ρ on the grounds that uncertainty about the real asset
value makes regulators hesitant. That is to say, regulators are generally unwilling to
163While indirectly measuring asset volatility in this way is an imperfect measure, it is very com-mon in the literature. Another non-standard approach would be to use macroeconomic volatility asa proxy for the banks’ assets. Rough calculations suggest, however, that volatility in the macroeco-nomic environment are similar in size to the asset volatility as measured here. For further discussionon these measurements, see for example Kendall (1992) and Cron and Hayes (2007).164See Huynh et al (2008) for an applied exposition of this method.
3.4. QUANTITATIVE EVIDENCE 103
force a bank closure unless there is a high level of certainty that the bank is genuinely
insolvent. As the calculation of a bank’s actual solvency at any given point of time
is an imprecise science at best, and bank representatives generally argue that their
problems are short-term and that the business is on the whole sound, regulators
must come up with quite strong evidence that there is a substantial shortfall in
assets before they decide to close a bank.
The value that Ronn and Verma place on ρ is 0.97. This means that if the
regulator perceives there to be a shortfall in assets smaller than 3%, it will assist
the bank in question whereas if the shortfall is estimated to be greater than 3% it
will liquidate the assets, pay out the insured liabilities and wind down the bank via
traditional receivership programs. The value of 0.97 has been widely used following
Ronn and Verma. Laeven (2002) considers this to be an appropriate level of ”regu-
latory forbearance” while noting that the level of forbearance is likely to be higher
(i.e. a lower ρ) in developing countries where enforcement of regulation tends to be
weak.
It could however be argued, especially in light of recent global events, that
even within developed countries where regulation is ex ante thought to be strong,
large financial institutions, such as the Big Four, would command a lower ρ as well
due to standard too-big-to-fail arguments, regulatory capture by a powerful and
sophisticated financial sector and the risk associated with letting such institutions
fail. ρ thus ties directly into the historical discussion in Section 3 as the willingness
of Bank of England officials to provide support to banks in trouble can be interpreted
as a lower ρ.
Another factor that strengthens the regulatory-forbearance argument is the costs
of bankruptcy. Imagine a bank that is slightly insolvent but is nonetheless allowed
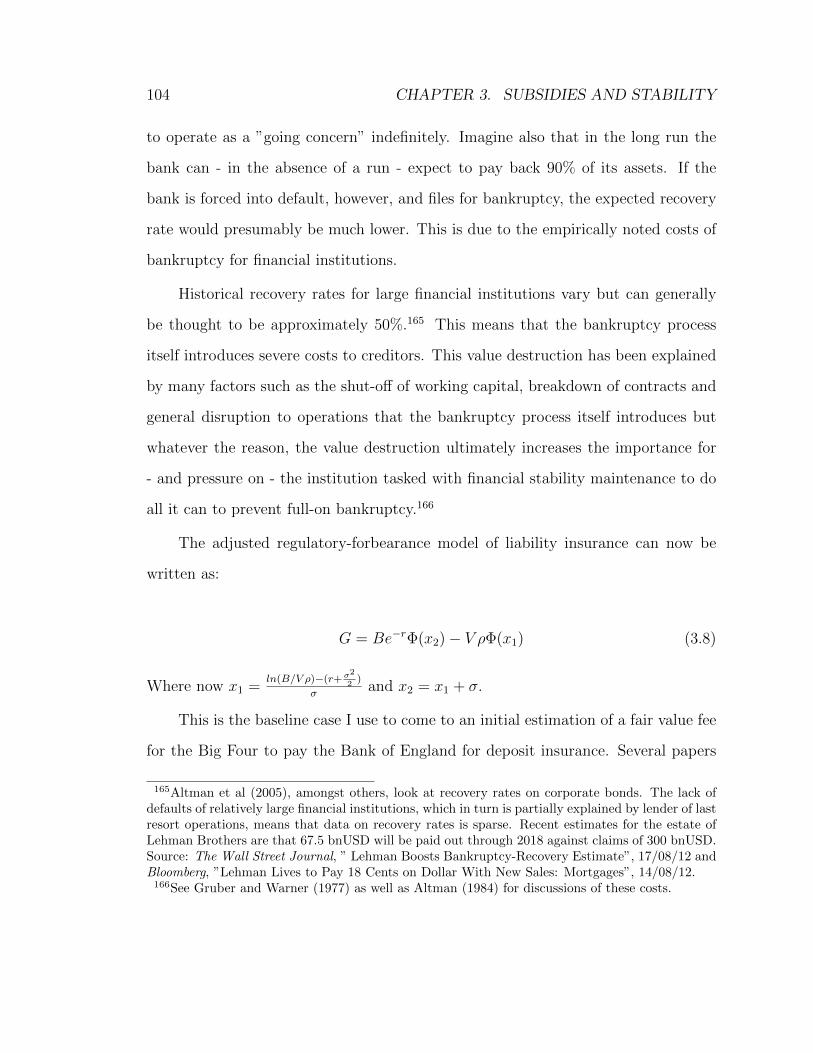
104 CHAPTER 3. SUBSIDIES AND STABILITY
to operate as a ”going concern” indefinitely. Imagine also that in the long run the
bank can - in the absence of a run - expect to pay back 90% of its assets. If the
bank is forced into default, however, and files for bankruptcy, the expected recovery
rate would presumably be much lower. This is due to the empirically noted costs of
bankruptcy for financial institutions.
Historical recovery rates for large financial institutions vary but can generally
be thought to be approximately 50%.165 This means that the bankruptcy process
itself introduces severe costs to creditors. This value destruction has been explained
by many factors such as the shut-off of working capital, breakdown of contracts and
general disruption to operations that the bankruptcy process itself introduces but
whatever the reason, the value destruction ultimately increases the importance for
- and pressure on - the institution tasked with financial stability maintenance to do
all it can to prevent full-on bankruptcy.166
The adjusted regulatory-forbearance model of liability insurance can now be
written as:
G = Be−rΦ(x2)− V ρΦ(x1) (3.8)
Where now x1 =ln(B/V ρ)−(r+σ2
2)
σand x2 = x1 + σ.
This is the baseline case I use to come to an initial estimation of a fair value fee
for the Big Four to pay the Bank of England for deposit insurance. Several papers
165Altman et al (2005), amongst others, look at recovery rates on corporate bonds. The lack ofdefaults of relatively large financial institutions, which in turn is partially explained by lender of lastresort operations, means that data on recovery rates is sparse. Recent estimates for the estate ofLehman Brothers are that 67.5 bnUSD will be paid out through 2018 against claims of 300 bnUSD.Source: The Wall Street Journal, ” Lehman Boosts Bankruptcy-Recovery Estimate”, 17/08/12 andBloomberg, ”Lehman Lives to Pay 18 Cents on Dollar With New Sales: Mortgages”, 14/08/12.166See Gruber and Warner (1977) as well as Altman (1984) for discussions of these costs.
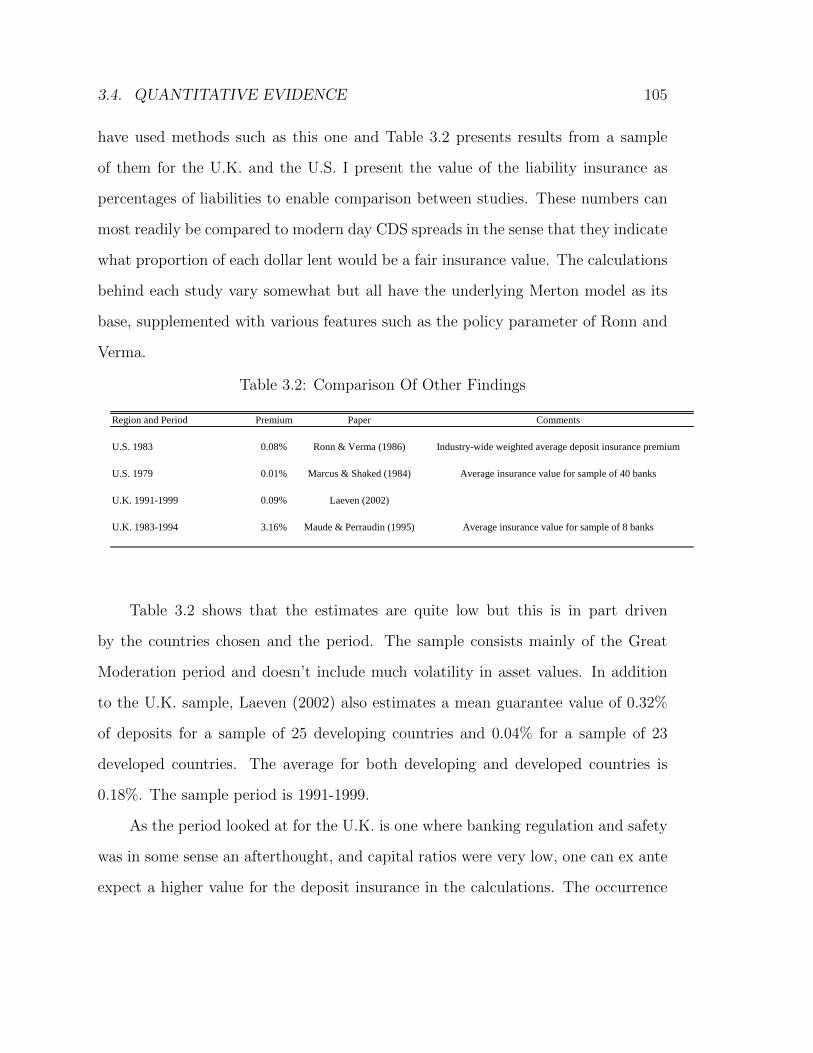
3.4. QUANTITATIVE EVIDENCE 105
have used methods such as this one and Table 3.2 presents results from a sample
of them for the U.K. and the U.S. I present the value of the liability insurance as
percentages of liabilities to enable comparison between studies. These numbers can
most readily be compared to modern day CDS spreads in the sense that they indicate
what proportion of each dollar lent would be a fair insurance value. The calculations
behind each study vary somewhat but all have the underlying Merton model as its
base, supplemented with various features such as the policy parameter of Ronn and
Verma.
Table 3.2: Comparison Of Other Findings
Region and Period Premium Paper Comments
U.S. 1983 0.08% Ronn & Verma (1986) Industry-wide weighted average deposit insurance premium
U.S. 1979 0.01% Marcus & Shaked (1984) Average insurance value for sample of 40 banks
U.K. 1991-1999 0.09% Laeven (2002)
U.K. 1983-1994 3.16% Maude & Perraudin (1995) Average insurance value for sample of 8 banks
Table 3.2 shows that the estimates are quite low but this is in part driven
by the countries chosen and the period. The sample consists mainly of the Great
Moderation period and doesn’t include much volatility in asset values. In addition
to the U.K. sample, Laeven (2002) also estimates a mean guarantee value of 0.32%
of deposits for a sample of 25 developing countries and 0.04% for a sample of 23
developed countries. The average for both developing and developed countries is
0.18%. The sample period is 1991-1999.
As the period looked at for the U.K. is one where banking regulation and safety
was in some sense an afterthought, and capital ratios were very low, one can ex ante
expect a higher value for the deposit insurance in the calculations. The occurrence
106 CHAPTER 3. SUBSIDIES AND STABILITY
of the secondary crisis during the middle of the period will also increase the value
of insurance due to heightened realized market volatility. Whether one considers the
period in question as one that has an upward bias due to the crisis or whether the
calm periods of the studies in Table 3.2 are considered to have a downward bias is
a matter of opinion. This opinion must take into consideration what one considers
the long-run fundamental distribution of asset returns and whether mass volatility is
something that periodically arises or whether times of calm should be the base case.
Another issue is whether heightened measured volatility reflects bank specific
developments, unrelated market trends or a bit of both. It is impossible to determine
the extent to which each of the three scenarios apply, however. Looking at the
sample period in question, volatility of bank stocks was on average approximately
80% greater than that of the FTSE (with the figure reaching 250% during the crisis).
As previously mentioned, the extent to which general market volatility affects the
banks is unknowable although the feedback effects from market conditions to bank
specific conditions can be expected to be complex and recursive. All that can be said
is that the extent to which market volatility affects banks lies somewhere between
0 and 1 although this relationship should be kept in mind in the following sections.
For reasons of brevity, I omit further such discussions and turn instead to estimates
of liability insurance using the above model and their implications for public policy.
3.4.3 Empirical Results
Table 3.3 presents the baseline results for each of the Big Four according to this
model. The parameter values chosen are as stated above and additionally I choose
r = 1%. This is the real risk-free rate and is chosen as the inflation-adjusted average
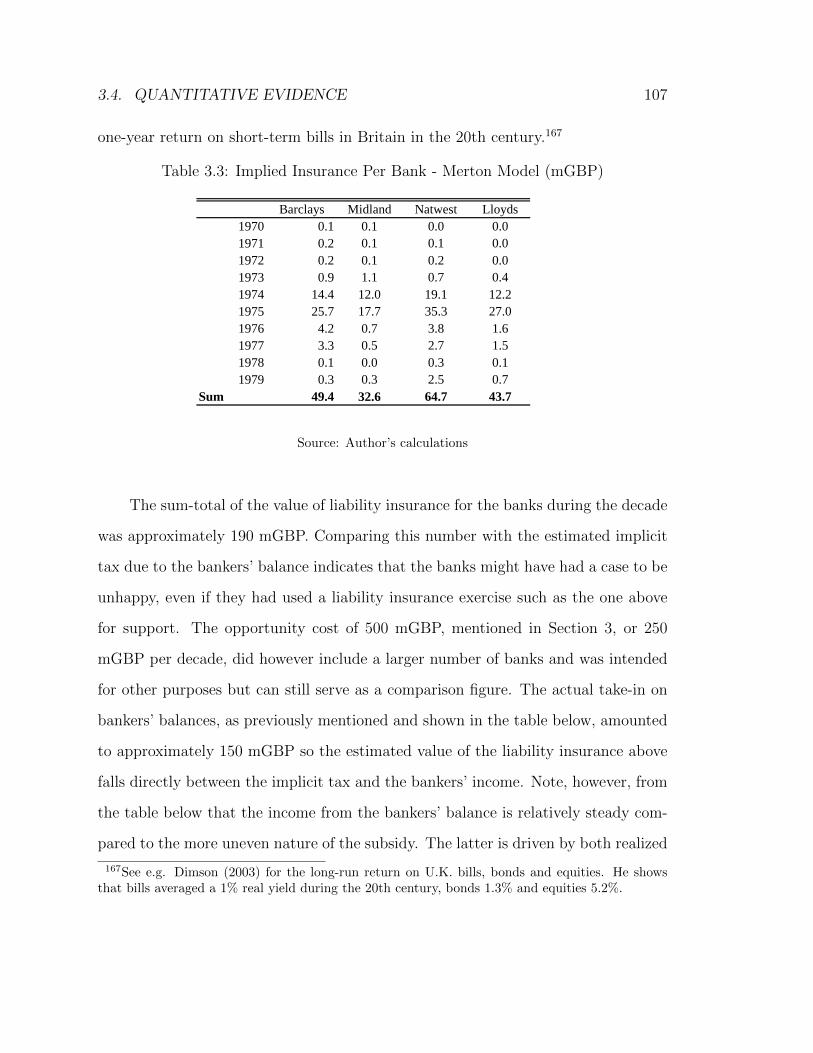
3.4. QUANTITATIVE EVIDENCE 107
one-year return on short-term bills in Britain in the 20th century.167
Table 3.3: Implied Insurance Per Bank - Merton Model (mGBP)
Barclays Midland Natwest Lloyds
1970 0.1 0.1 0.0 0.0
1971 0.2 0.1 0.1 0.0
1972 0.2 0.1 0.2 0.0
1973 0.9 1.1 0.7 0.4
1974 14.4 12.0 19.1 12.2
1975 25.7 17.7 35.3 27.0
1976 4.2 0.7 3.8 1.6
1977 3.3 0.5 2.7 1.5
1978 0.1 0.0 0.3 0.1
1979 0.3 0.3 2.5 0.7
Sum 49.4 32.6 64.7 43.7
Source: Author’s calculations
The sum-total of the value of liability insurance for the banks during the decade
was approximately 190 mGBP. Comparing this number with the estimated implicit
tax due to the bankers’ balance indicates that the banks might have had a case to be
unhappy, even if they had used a liability insurance exercise such as the one above
for support. The opportunity cost of 500 mGBP, mentioned in Section 3, or 250
mGBP per decade, did however include a larger number of banks and was intended
for other purposes but can still serve as a comparison figure. The actual take-in on
bankers’ balances, as previously mentioned and shown in the table below, amounted
to approximately 150 mGBP so the estimated value of the liability insurance above
falls directly between the implicit tax and the bankers’ income. Note, however, from
the table below that the income from the bankers’ balance is relatively steady com-
pared to the more uneven nature of the subsidy. The latter is driven by both realized
167See e.g. Dimson (2003) for the long-run return on U.K. bills, bonds and equities. He showsthat bills averaged a 1% real yield during the 20th century, bonds 1.3% and equities 5.2%.
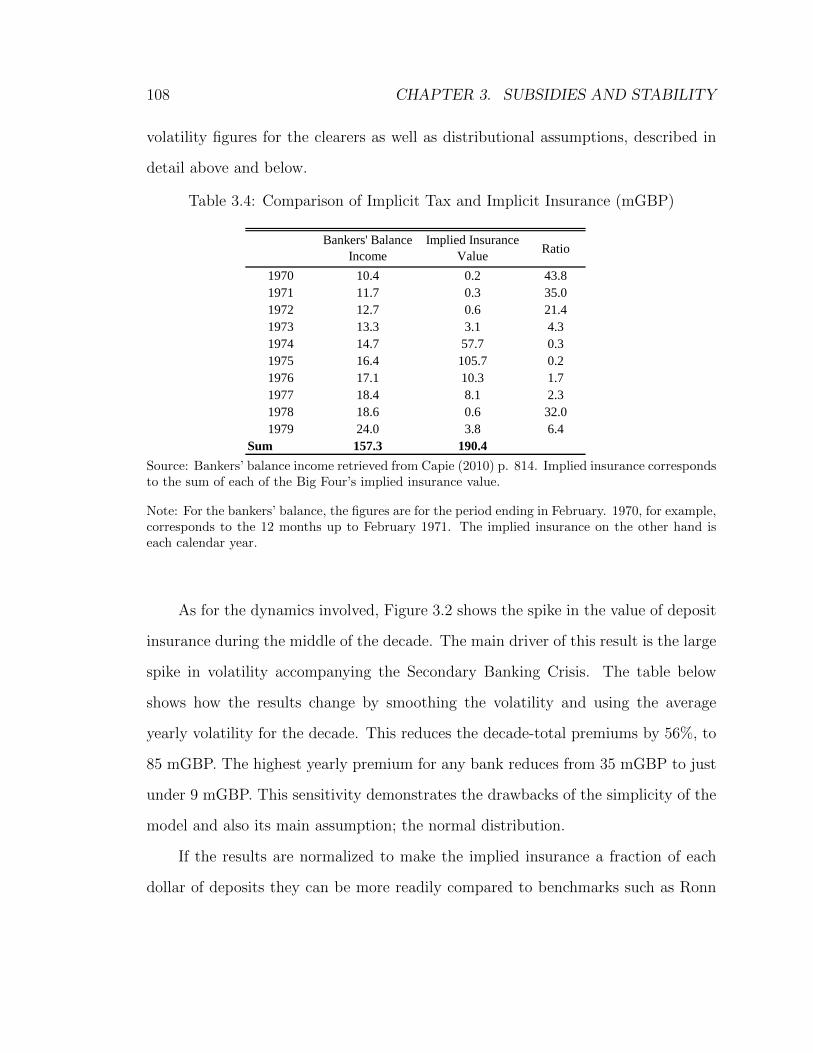
108 CHAPTER 3. SUBSIDIES AND STABILITY
volatility figures for the clearers as well as distributional assumptions, described in
detail above and below.
Table 3.4: Comparison of Implicit Tax and Implicit Insurance (mGBP)
Ratio
1970 43.8
1971 35.0
1972 21.4
1973 4.3
1974 0.3
1975 0.2
1976 1.7
1977 2.3
1978 32.0
1979 6.4
Sum 157.3 190.4
57.7
105.7
10.3
8.1
0.6
3.8
14.7
16.4
17.1
18.4
18.6
24.0
Bankers' Balance
Income
Implied Insurance
Value
10.4
11.7
12.7
13.3
0.2
0.3
0.6
3.1
Source: Bankers’ balance income retrieved from Capie (2010) p. 814. Implied insurance correspondsto the sum of each of the Big Four’s implied insurance value.
Note: For the bankers’ balance, the figures are for the period ending in February. 1970, for example,corresponds to the 12 months up to February 1971. The implied insurance on the other hand iseach calendar year.
As for the dynamics involved, Figure 3.2 shows the spike in the value of deposit
insurance during the middle of the decade. The main driver of this result is the large
spike in volatility accompanying the Secondary Banking Crisis. The table below
shows how the results change by smoothing the volatility and using the average
yearly volatility for the decade. This reduces the decade-total premiums by 56%, to
85 mGBP. The highest yearly premium for any bank reduces from 35 mGBP to just
under 9 mGBP. This sensitivity demonstrates the drawbacks of the simplicity of the
model and also its main assumption; the normal distribution.
If the results are normalized to make the implied insurance a fraction of each
dollar of deposits they can be more readily compared to benchmarks such as Ronn
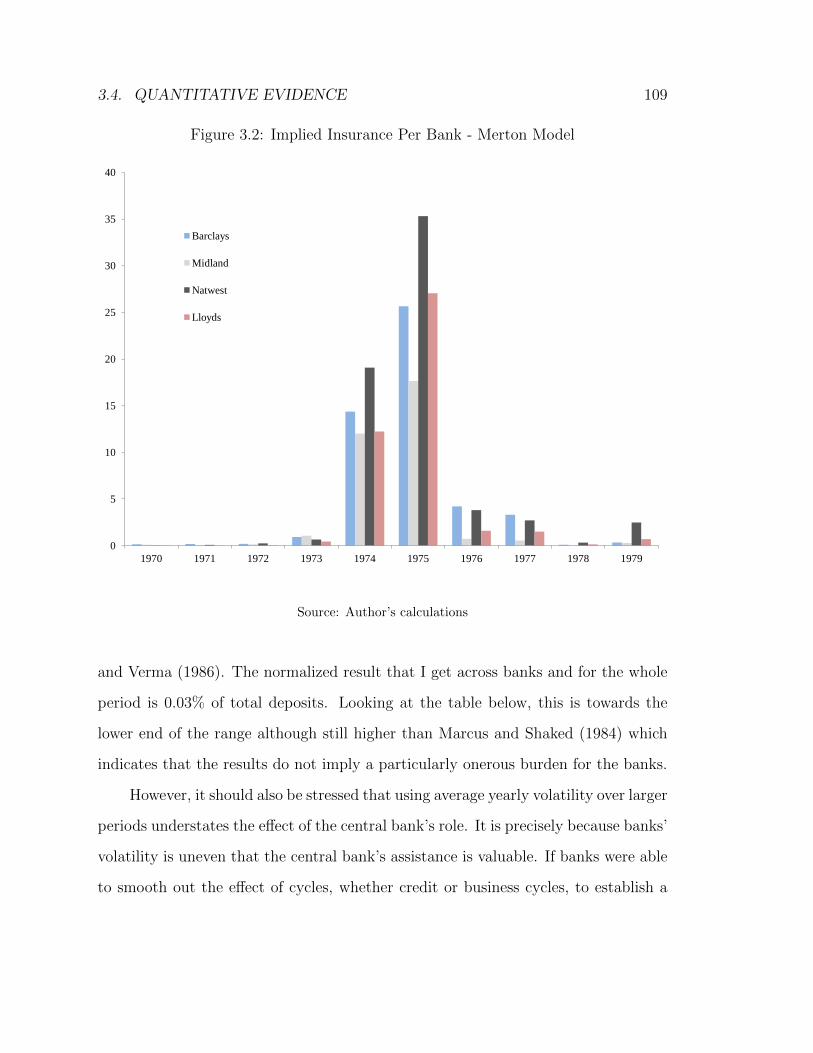
3.4. QUANTITATIVE EVIDENCE 109
Figure 3.2: Implied Insurance Per Bank - Merton Model
0
5
10
15
20
25
30
35
40
1970 1971 1972 1973 1974 1975 1976 1977 1978 1979
Barclays
Midland
Natwest
Lloyds
Source: Author’s calculations
and Verma (1986). The normalized result that I get across banks and for the whole
period is 0.03% of total deposits. Looking at the table below, this is towards the
lower end of the range although still higher than Marcus and Shaked (1984) which
indicates that the results do not imply a particularly onerous burden for the banks.
However, it should also be stressed that using average yearly volatility over larger
periods understates the effect of the central bank’s role. It is precisely because banks’
volatility is uneven that the central bank’s assistance is valuable. If banks were able
to smooth out the effect of cycles, whether credit or business cycles, to establish a
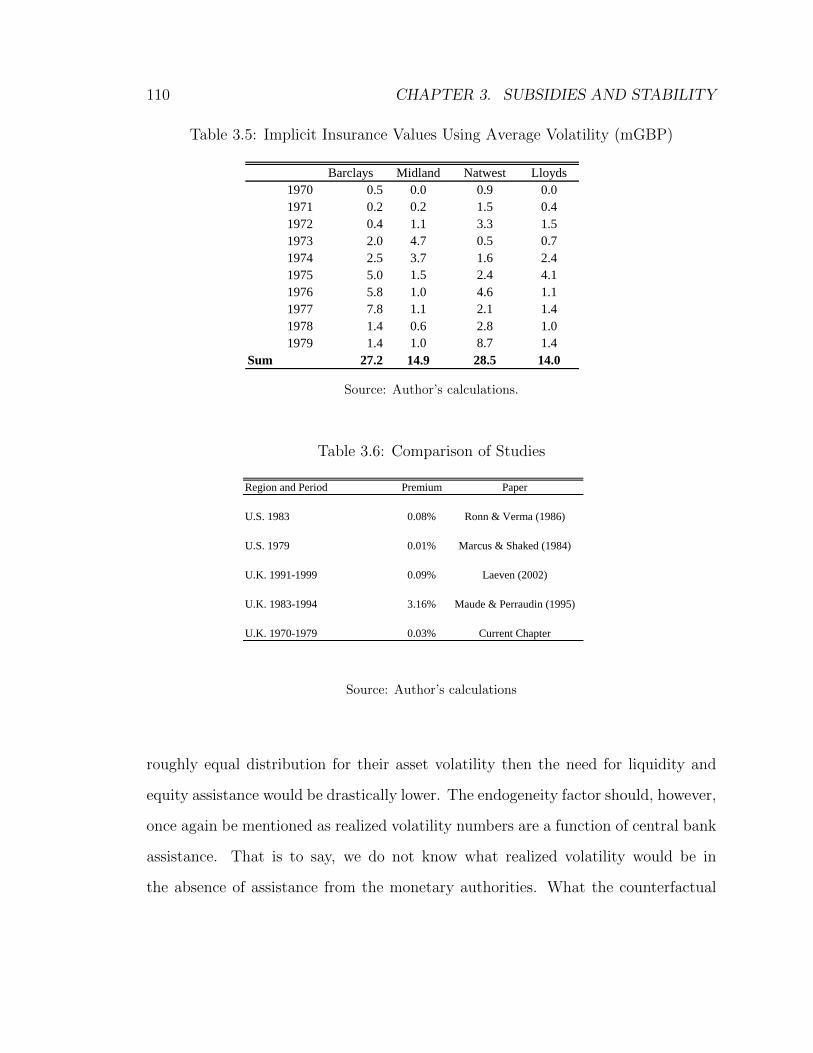
110 CHAPTER 3. SUBSIDIES AND STABILITY
Table 3.5: Implicit Insurance Values Using Average Volatility (mGBP)
Barclays Midland Natwest Lloyds
1970 0.5 0.0 0.9 0.0
1971 0.2 0.2 1.5 0.4
1972 0.4 1.1 3.3 1.5
1973 2.0 4.7 0.5 0.7
1974 2.5 3.7 1.6 2.4
1975 5.0 1.5 2.4 4.1
1976 5.8 1.0 4.6 1.1
1977 7.8 1.1 2.1 1.4
1978 1.4 0.6 2.8 1.0
1979 1.4 1.0 8.7 1.4
Sum 27.2 14.9 28.5 14.0
Source: Author’s calculations.
Table 3.6: Comparison of Studies
Region and Period Premium Paper
U.S. 1983 0.08% Ronn & Verma (1986)
U.S. 1979 0.01% Marcus & Shaked (1984)
U.K. 1991-1999 0.09% Laeven (2002)
U.K. 1983-1994 3.16% Maude & Perraudin (1995)
U.K. 1970-1979 0.03% Current Chapter
Source: Author’s calculations
roughly equal distribution for their asset volatility then the need for liquidity and
equity assistance would be drastically lower. The endogeneity factor should, however,
once again be mentioned as realized volatility numbers are a function of central bank
assistance. That is to say, we do not know what realized volatility would be in
the absence of assistance from the monetary authorities. What the counterfactual
3.4. QUANTITATIVE EVIDENCE 111
crisis-year volatility without central bank assistance were to be is hence unknown,
although it is relatively safe to presume that it would be substantially higher.
More concretely, in constructing a policy at time t, at(), the policymakers looks
to past, realized volatility at time t− 1, in addition to the bank’s fundamentals, ft,
and general liquidity conditions, lt, so that at(σt−1, ft, lt). However, σt−1 is itself a
function of past assistance so that σt−1(ft−1, at−1, lt−1) with δσt−1
δat−1< 0. This leads to
the endogeneity problem whereas what policymakers would optimally want to use
for designing at() would be the underlying σt−1 without the presence of at−1(). This
would in turn relegate the problem to distinguishing which part of σt were due to
fundamentals, f , and which part due to general liquidity conditions, l.
The distribution assumption also has the effect of all but eliminating the pos-
sibility of large, predominantly negative, swings in asset and equity values, which
contradicts the observed realities of historical prices. This ties into the institutional
memory factor mentioned in Sections 1 and 3 whereby recent experience of small
and relatively symmetric asset returns leads policymakers to dismiss the rarer, but
still periodic, episodes of greater turbulance which leads to the need for central bank
assistance. Sticking with normality obviously underestimates the value of a back-
stop/guarantee in cases of panic and the interpretation of the Secondary Banking
Crisis, in probabilistic terms, becomes that of an event that happens less than once
in an average lifetime. I relax this assumption in the next section and look at pricing
with the presence of crisis allowance. Before doing so however it is useful to take a
look at what the above model can tell us, despite its limitations.
First of all, it can inform us about the relative stature of the Big Four banks.
The figure shows that National Westminster had the highest overall premium during
the crisis years. This is despite the fact that Natwest had a smaller balance sheet than
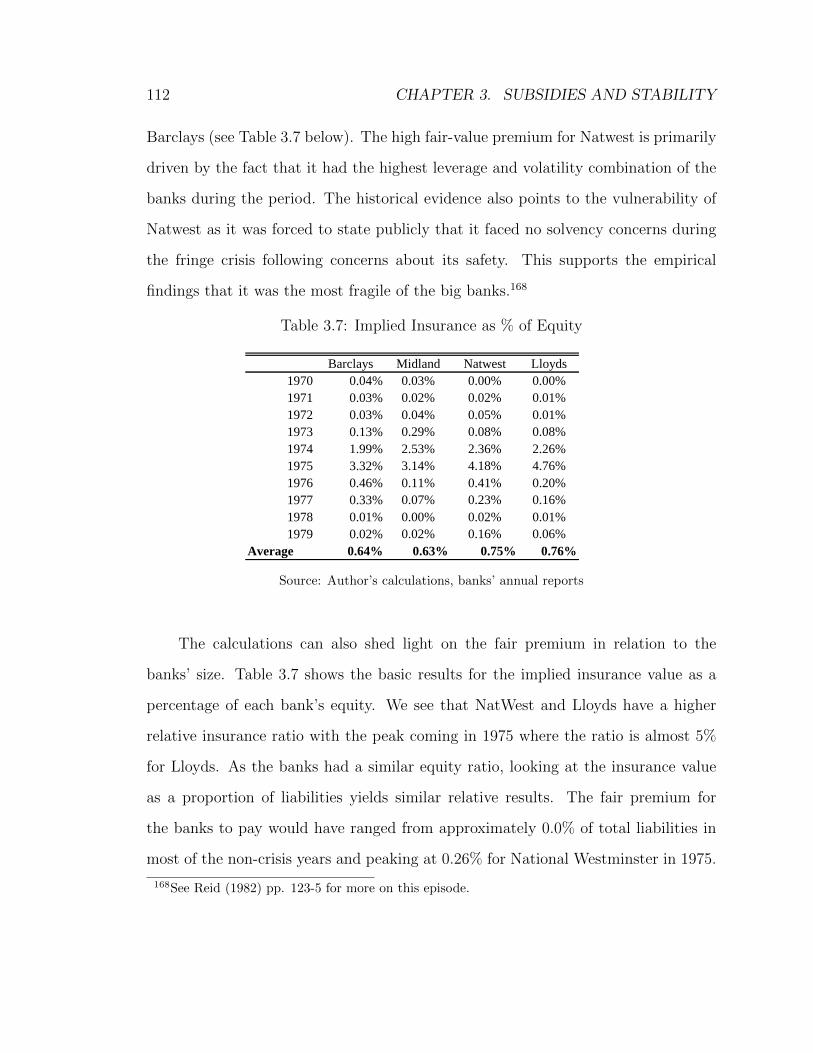
112 CHAPTER 3. SUBSIDIES AND STABILITY
Barclays (see Table 3.7 below). The high fair-value premium for Natwest is primarily
driven by the fact that it had the highest leverage and volatility combination of the
banks during the period. The historical evidence also points to the vulnerability of
Natwest as it was forced to state publicly that it faced no solvency concerns during
the fringe crisis following concerns about its safety. This supports the empirical
findings that it was the most fragile of the big banks.168
Table 3.7: Implied Insurance as % of Equity
Barclays Midland Natwest Lloyds
1970 0.04% 0.03% 0.00% 0.00%
1971 0.03% 0.02% 0.02% 0.01%
1972 0.03% 0.04% 0.05% 0.01%
1973 0.13% 0.29% 0.08% 0.08%
1974 1.99% 2.53% 2.36% 2.26%
1975 3.32% 3.14% 4.18% 4.76%
1976 0.46% 0.11% 0.41% 0.20%
1977 0.33% 0.07% 0.23% 0.16%
1978 0.01% 0.00% 0.02% 0.01%
1979 0.02% 0.02% 0.16% 0.06%
Average 0.64% 0.63% 0.75% 0.76%
Source: Author’s calculations, banks’ annual reports
The calculations can also shed light on the fair premium in relation to the
banks’ size. Table 3.7 shows the basic results for the implied insurance value as a
percentage of each bank’s equity. We see that NatWest and Lloyds have a higher
relative insurance ratio with the peak coming in 1975 where the ratio is almost 5%
for Lloyds. As the banks had a similar equity ratio, looking at the insurance value
as a proportion of liabilities yields similar relative results. The fair premium for
the banks to pay would have ranged from approximately 0.0% of total liabilities in
most of the non-crisis years and peaking at 0.26% for National Westminster in 1975.
168See Reid (1982) pp. 123-5 for more on this episode.
3.4. QUANTITATIVE EVIDENCE 113
Comparing this to the numbers from other studies in Table 3.6, we again see that
they are in a similar range.
More crucially than the relative state of the banks is the absolute result. Using
the baseline model, and thus almost ruling out the possibility of a crisis, still serves up
a figure that would exceed the implicit tax collected by the Bank of England. These
results support the historical evidence from the previous section whereby the banks
were happy to play along with the Bank’s meddling, despite its lack of authority, due
to the fact that the Bank provided this valuable, albeit implicit, safety net. While
the banks certainly did not estimate a model such as the above, they valued the
service provided by the Bank on a more general level.
Before moving on to the Jump Diffusion model, which relaxes the assumption
of normally distributed asset returns, the lack of robustness of the model should
be stressed by a simple sensitivity analysis. As noted above, using the decade-
average volatility numbers instead of the yearly volatility greatly reduces the fair
value premium. This fact demonstrates the importance of the assumption of a fixed
and known volatility number and its effect on a normally distributed normal. The
same fact however applies to the risk-free rate parameter which shows how difficult
it is to decide upon an actual pound-value to charge according to these option-based
models.
Using the largest bank, Barclays, as an example - although the same applies
to the other banks - if a risk-free rate of zero is chosen instead of 1% the decade-
long fair value premium increases from 49 mGBP to 134 mGBP. This is obviously a
tremendous difference and demonstrates the sensitivity of the model. The risk-free
rate is used as a benchmark investment and comparison to which an investor would
look when deciding whether to invest in a risky asset. If the investor can only get
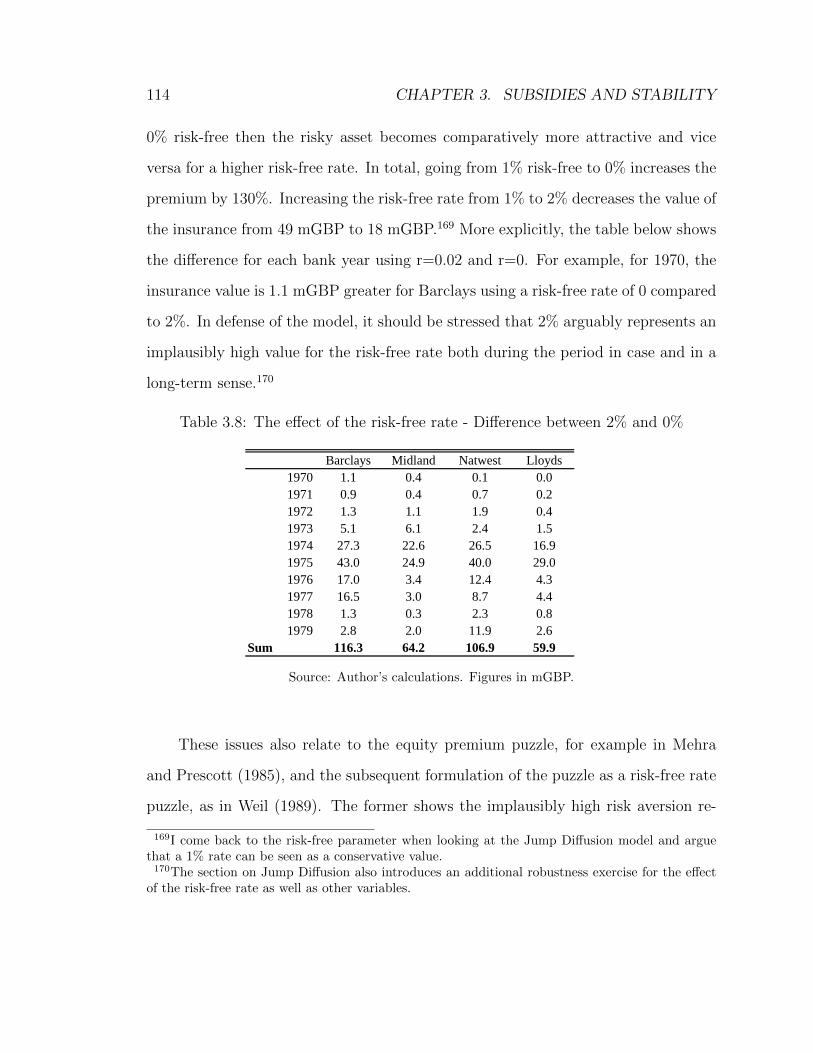
114 CHAPTER 3. SUBSIDIES AND STABILITY
0% risk-free then the risky asset becomes comparatively more attractive and vice
versa for a higher risk-free rate. In total, going from 1% risk-free to 0% increases the
premium by 130%. Increasing the risk-free rate from 1% to 2% decreases the value of
the insurance from 49 mGBP to 18 mGBP.169 More explicitly, the table below shows
the difference for each bank year using r=0.02 and r=0. For example, for 1970, the
insurance value is 1.1 mGBP greater for Barclays using a risk-free rate of 0 compared
to 2%. In defense of the model, it should be stressed that 2% arguably represents an
implausibly high value for the risk-free rate both during the period in case and in a
long-term sense.170
Table 3.8: The effect of the risk-free rate - Difference between 2% and 0%
Barclays Midland Natwest Lloyds
1970 1.1 0.4 0.1 0.0
1971 0.9 0.4 0.7 0.2
1972 1.3 1.1 1.9 0.4
1973 5.1 6.1 2.4 1.5
1974 27.3 22.6 26.5 16.9
1975 43.0 24.9 40.0 29.0
1976 17.0 3.4 12.4 4.3
1977 16.5 3.0 8.7 4.4
1978 1.3 0.3 2.3 0.8
1979 2.8 2.0 11.9 2.6
Sum 116.3 64.2 106.9 59.9
Source: Author’s calculations. Figures in mGBP.
These issues also relate to the equity premium puzzle, for example in Mehra
and Prescott (1985), and the subsequent formulation of the puzzle as a risk-free rate
puzzle, as in Weil (1989). The former shows the implausibly high risk aversion re-
169I come back to the risk-free parameter when looking at the Jump Diffusion model and arguethat a 1% rate can be seen as a conservative value.170The section on Jump Diffusion also introduces an additional robustness exercise for the effect
of the risk-free rate as well as other variables.
3.4. QUANTITATIVE EVIDENCE 115
quired to reconcile the empirically realized risk premium. The latter, and extensions
thereof, look at the inverse of the puzzle by positing the question in terms of why
the risk-free rate is so low.
Weil hypothesizes that the puzzle - whether framed in terms of equity or risk-free
misalignment - is due to simplifying assumptions including the representative agent
and Arrow-Debreu markets. Furthermore, the low risk-free rate can be explained
to a large extent by introducing heterogeneity between agents and differentiation
between individual and aggregate consumption. The puzzle has not yet been fully
resolved, however, and for our purposes here it is arguably best to keep the risk-free
rate at empirically observed long-term values with added robustness checks to follow.
While complications such as this may result in additional doubts regarding the
applicability of the model for the valuation of the Bank’s services to the Big Four, it
also highlights the complexity of the problem itself and demonstrates the importance
of thinking how to price these and other financial stability instruments. Any private
institution would think long and hard before insuring such an uncertain, but po-
tentially extremely costly, service and would in all likelihood charge an uncertainty
premium and prudential fees before doing so. While a public institution such as the
Bank of England might want to provide the service on other terms than a private
party would, it should be as wary about the costs as the private party would be
before pricing and providing it.
3.4.4 A Jump Diffusion Model of Liability Insurance
I now alter the distribution assumption of the Merton model to allow for the empir-
ically observed, periodic downward jumps in asset prices. For this purpose I use a
so called Jump-Diffusion model which combines the Brownian motion specification
116 CHAPTER 3. SUBSIDIES AND STABILITY
of the Merton model with a Poisson process that specifies the probability of a large
decrease in asset value at any given time.
Jump diffusion models have in recent years become an increasingly popular
way to deal with the fact that asset returns are non-continuous and non-normal.
Again the framework was put in place by Merton (1976) in order to relax the prior
assumption that trading was continuous and that ”the price dynamics of the stock
have a continuous sample path with probability one”. The following model builds
on Merton’s paper as well as Dahlfors and Jansson (1994).171 For the purposes of
this chapter, the jump diffusion approach can be thought of as a two-fold state.
In the ”normal” state we witness the same distribution of asset returns as in the
previous section where returns are symmetrically located around the regular mean
and large deviations are extremely rare. The second possible state is the jump-
state as returns exhibit a Poisson distribution with a non-zero probability of a large
negative return.172 The model thus entails a combination of the two possible states.173
Re-writing the equation above from the Merton model174, we have
G = Be−rΦ(x2)− V Φ(x1) (3.9)
With x1 =ln(B/V )−(r+σ2
2)
σand x2 = x1 + σ.
171Kou (2002) is also a popular reference point for Jump Diffusion models.172I exclude the possibility of a large positive return in the model. This corresponds to empiri-
cal evidence whereby large ”jumps” are negative and sudden while positive developments happengradually.173In addition to the work mentioned and built on here, Barro (2005) represents another attempt to
include low-probability disasters, albeit in a macroeconomic framework. Barro shows that allowanceof such disasters can help explain a lot of so-called puzzles in the literature, including the equity(or risk-free) puzzle mentioned earlier.174For clarity, I use the pre-forbearance model to derive the Jump Diffusion model. The Jump
Diffusion model is however calibrated to include the regulatory forbearance parameter at 0.97, asper the Merton model.
3.4. QUANTITATIVE EVIDENCE 117
Where, again, r represents the risk-free rate, Φ is the cumulative standard nor-
mal distribution and B and V denote liabilities and asset value respectively.
We now want to add the jump component of the model, in addition to the
diffusion part represented above. As the simplified version of the model is presented,
we omit time parameters, as before, as well as using a range of the crisis parameter,
λ (explained below), which all but excludes multiple crises in a given time period, I
can write down a simplified version of a standard Jump Diffusion model with easier
notation.175 The result is as follows
JD =1∑
n=0
e−λ · λn · [e−r · Φ(y2)− V · e−λ·k(1 + k)n · Φ(y1)] (3.10)
Where y2 =lnBV−(r−λ·k−σ
2
2)−n·ln(1+k)
σand y1 = y2 − σ
The main additions here are three variables; λ, n and k.176 The first one, λ,
represents the annual probability of a large, negative jump in asset values - i.e. a
financial crisis or other unexpected shock that negatively affects the banks’ balance
sheets. Intuitively, setting λ = 0 reduces the model to that of the original Merton
case where prices simply follow a Normal distribution.177
The term not in brackets can be thought of as the possibility of a crisis or no-
crisis, given λ. Calibrating the crisis probability, λ, to match empirical evidence is
quite tricky, however, to say the least. One could take the approach of counting
the number of past financial crises and thereby matching λ to the data. This can
175This is similar to Barro(2005), mentioned above, where the probability of multiple disasters inany period is assumed to be small enough to neglect (p.5).176What follows is a discussion of the new variables and their effect. A robustness exercise is
presented in the next subsection.177Another way of seeing that the Merton model can be seen as a specific case of the Jump
Diffusion model is by looking at what happens to the model itself in the cases where crises do notoccur. By excluding any setting where there is a positive number of crisis, i.e. n = 0, and thensetting λ = k = 0 as well, we end up with the original Merton setting from the previous section.
118 CHAPTER 3. SUBSIDIES AND STABILITY
be thought of as a Reinhart-Rogoff-esque approach. The fact that crisis parameters
vary substantially and that the loss conditional of crisis is a constant in the model
makes this approach problematic, however.
Furthermore, there exist few attempts of empirical application of the above
model, as opposed to numerous such cases with the Merton model. Cummins (1988)
provides some numerical applications but does not calibrate the model to realized
data. Haldane (2011) does try to contextualize the model towards the recent crisis
but uses the model more as a side-note than a full exercise. Additionally, and more
generally than in the Merton model, there is also an endogeneity problem to think of
as governments’ past involvement and presence has reduced the number of full-blown
crises and dampened those that did happen.
Counting the number of crises and their severity thus does not represent an esti-
mate of crisis probabilities and costs without government assistance. Hence I adopt
a simpler approach here of choosing λ = 0.001. This represents a 0.1% annual prob-
ability of a severe crisis. This value is very conservative and certainly underestimates
the historical rate of crises. This can, however, be considered a sensible first approach
as the model is very sensitive to changes in λ. The initial exercise thus relates to
seeing whether despite this massive uncertainty regarding crisis occurrences even a
very small probability of crisis presents a large expected cost to the guarantor, i.e.
the government.
For further comparison, in formulating his rare-event macro framework, Barro
(2005) calibrates the baseline probability of the event at 1% before showing the
effect of moving it to 0.5%. While Barro’s rare-event is different in nature to the
one studied here, i.e. macroeconomic versus loss on securities, it is useful to keep
this calibration in mind and the fact that Barro’s higher probability of the rare-event
3.4. QUANTITATIVE EVIDENCE 119
renders the λ chosen here relatively more conservative.
The second main addition that the model presents, n, is the number of such
large shocks each year. This means that we have not just a probability that a single
negative shock will happen within the time period but also that multiple shocks will
happen. As the λ I use here is so low that the probability of multiple-crisis per year
is infinitesimal, the summation through n goes from 0 (no crisis) to 1 (crisis). I also
exclude multiple crisis on the general grounds that the time period is one year and
examples of multiple crises within a year are hard to find. I can therefore separate
the part of the insurance that is due to normal market fluctuations (n = 0) and the
part that arises because of the possibility of a deep crisis (n = 1).
The third new variable which is of quite some significance is k. This variable
represents the percentage loss in the event of a crisis. A k value of 0.3 would, for
example, mean that in the event of a crisis, assuming the government does not step
in to help, the bank would experience a 30% decline in value of its assets. This
parameter is evidently quite problematic for a number of reasons. Firstly, there are
the normal reservations that the value of k is neither known nor constant through
time. Moreover, on a more philosophical note, absent government intervention, the
bank does not get assistance, subsequently defaults and the loss then hinges on the
recovery rate of creditors which in turn goes back to the cost of bankruptcy as well
as the time consistency dilemma, both discussed earlier.
This rate is generally quite low and in most cases hovers around the 50% rate.178
Should one interpret this as the government providing an safety net that leads to a
k of 0.5, despite the fact that the government’s actions don’t cost it 50% of the bank
178Empirical evidence on recovery rates, as well as complications in calibrating such rates for large,systemic banks, is covered in Section 2 of this chapter.
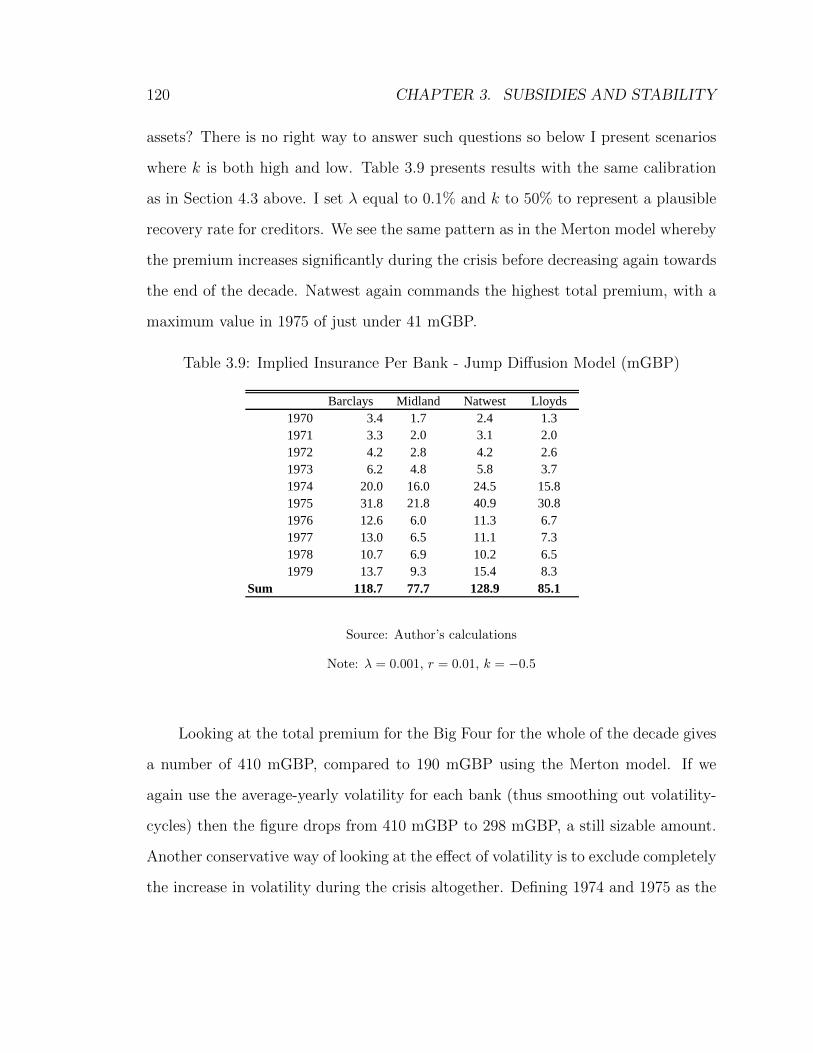
120 CHAPTER 3. SUBSIDIES AND STABILITY
assets? There is no right way to answer such questions so below I present scenarios
where k is both high and low. Table 3.9 presents results with the same calibration
as in Section 4.3 above. I set λ equal to 0.1% and k to 50% to represent a plausible
recovery rate for creditors. We see the same pattern as in the Merton model whereby
the premium increases significantly during the crisis before decreasing again towards
the end of the decade. Natwest again commands the highest total premium, with a
maximum value in 1975 of just under 41 mGBP.
Table 3.9: Implied Insurance Per Bank - Jump Diffusion Model (mGBP)
Barclays Midland Natwest Lloyds
1970 3.4 1.7 2.4 1.3
1971 3.3 2.0 3.1 2.0
1972 4.2 2.8 4.2 2.6
1973 6.2 4.8 5.8 3.7
1974 20.0 16.0 24.5 15.8
1975 31.8 21.8 40.9 30.8
1976 12.6 6.0 11.3 6.7
1977 13.0 6.5 11.1 7.3
1978 10.7 6.9 10.2 6.5
1979 13.7 9.3 15.4 8.3
Sum 118.7 77.7 128.9 85.1
Source: Author’s calculations
Note: λ = 0.001, r = 0.01, k = −0.5
Looking at the total premium for the Big Four for the whole of the decade gives
a number of 410 mGBP, compared to 190 mGBP using the Merton model. If we
again use the average-yearly volatility for each bank (thus smoothing out volatility-
cycles) then the figure drops from 410 mGBP to 298 mGBP, a still sizable amount.
Another conservative way of looking at the effect of volatility is to exclude completely
the increase in volatility during the crisis altogether. Defining 1974 and 1975 as the
3.4. QUANTITATIVE EVIDENCE 121
crisis years, the average volatility for the remaining years is used for these years.179
This reduces the baseline amount from 410 mGBP to 261 mGBP which is, again,
a substantial reduction but still leaves what is by no means a trivial amount. The
aforementioned reservations from the Merton model regarding such smoothing are
applicable for both of these checks.
If we change the risk-free rate from 1% to 0%, as above, there is also a substantial
increase in the premium: from 410 mGBP to 646 mGBP. The fact that the risk-free
rate is a real rate should be stressed and during times of high and variable inflation,
average depositors may consider it acceptable for their savings to do no more than
maintain their real worth which corresponds to r = 0.180
An additional check on robustness that was not possible in the Merton model
is to alter the probability of crisis, λ, and the loss given default parameter, k. I
deliberately chose a conservative λ initially of 0.1%. Again, this means that there is
only a very slight chance of a full-blown crisis and well below the number observed
in any advanced economy during the past century or two. Increasing λ to anything
approaching the actual number of crisis observed in the long-run leads to a gigantic
increase in the value of liability insurance. Setting λ equal to 0.01, for example,
which means (assuming iid shocks) a crisis every 100 years or so, raises the value
from 410 mGBP to almost 2.4 bnGBPn. Likewise, as previously mentioned, if we
eliminate crises completely (λ = 0), we end up with the same result as in the Merton
model of 190 mGBP.
179These two years were indeed in all cases the years with highest volatility180In fact, this was especially the case during the 1970s when inflation was high and variable.
The real interest rate on British government bonds, for example, was often in negative territoryduring the period. For example, the real rate, measured by the gross redemption yield on 10-yeargilts subtracted by the 12-month change in the RPI, was negative in almost half of months duringthe decade. Taking the forward looking measure of RPI, which corresponds to the actualized realreturn, gives an even higher proportion of real negative rates.
122 CHAPTER 3. SUBSIDIES AND STABILITY
As mentioned above, an extremely important caveat to these figures is the afore-
mentioned assumption that absent government intervention, default will occur and
the recovery rate of assets will equal 50%. One can obviously hypothesize that ab-
sent central bank stability measures, banks would take it on themselves to save the
system from falling, akin to 19th century United States banking, although this was
riddled with imperfections as well. If we keep λ at 0.1% but reduce the loss given
default parameter from 50% to 20%, the total premium reduces from 410 mGBP to
267 mGBP - still a sizable figure.
Finally, I try looking at a ”best-case scenario” whereby the model is calibrated
so as to see what the minimum premium, in some sense, could be. I raise the real
risk-free rate to 2%, lower the LGD to 20% and keep the crisis probability unchanged
at a low value of 0.1%. This results in a total premium of just under 160 mGBP which
indicates that even a highly favourable scenario implies that maintaining financial
stability involves substantial costs.
The obvious conclusion here - as has also been argued in other similar research
- is that option-pricing models, even with more empirically realistic distribution
assumptions than the Black-Scholes model, need to be interpreted with care and used
as supporting evidence and not to serve as the sole determinant for fair insurance-
premia.181
181Ronn and Verma (1986) argue that they are better served to look at which banks are under-paying the most, i.e. as a relative guide. While it is true that this is an easier question to answer,the models can also serve as a more general guide regarding the amounts involved given certainassumptions.
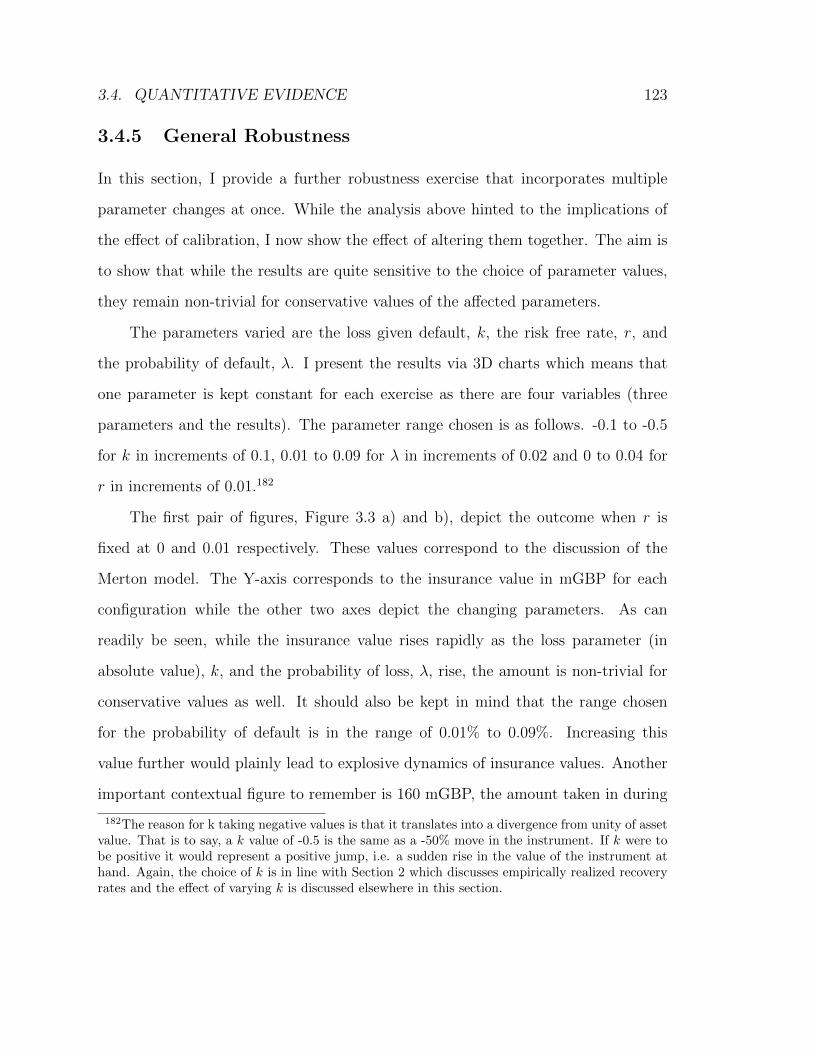
3.4. QUANTITATIVE EVIDENCE 123
3.4.5 General Robustness
In this section, I provide a further robustness exercise that incorporates multiple
parameter changes at once. While the analysis above hinted to the implications of
the effect of calibration, I now show the effect of altering them together. The aim is
to show that while the results are quite sensitive to the choice of parameter values,
they remain non-trivial for conservative values of the affected parameters.
The parameters varied are the loss given default, k, the risk free rate, r, and
the probability of default, λ. I present the results via 3D charts which means that
one parameter is kept constant for each exercise as there are four variables (three
parameters and the results). The parameter range chosen is as follows. -0.1 to -0.5
for k in increments of 0.1, 0.01 to 0.09 for λ in increments of 0.02 and 0 to 0.04 for
r in increments of 0.01.182
The first pair of figures, Figure 3.3 a) and b), depict the outcome when r is
fixed at 0 and 0.01 respectively. These values correspond to the discussion of the
Merton model. The Y-axis corresponds to the insurance value in mGBP for each
configuration while the other two axes depict the changing parameters. As can
readily be seen, while the insurance value rises rapidly as the loss parameter (in
absolute value), k, and the probability of loss, λ, rise, the amount is non-trivial for
conservative values as well. It should also be kept in mind that the range chosen
for the probability of default is in the range of 0.01% to 0.09%. Increasing this
value further would plainly lead to explosive dynamics of insurance values. Another
important contextual figure to remember is 160 mGBP, the amount taken in during
182The reason for k taking negative values is that it translates into a divergence from unity of assetvalue. That is to say, a k value of -0.5 is the same as a -50% move in the instrument. If k were tobe positive it would represent a positive jump, i.e. a sudden rise in the value of the instrument athand. Again, the choice of k is in line with Section 2 which discusses empirically realized recoveryrates and the effect of varying k is discussed elsewhere in this section.
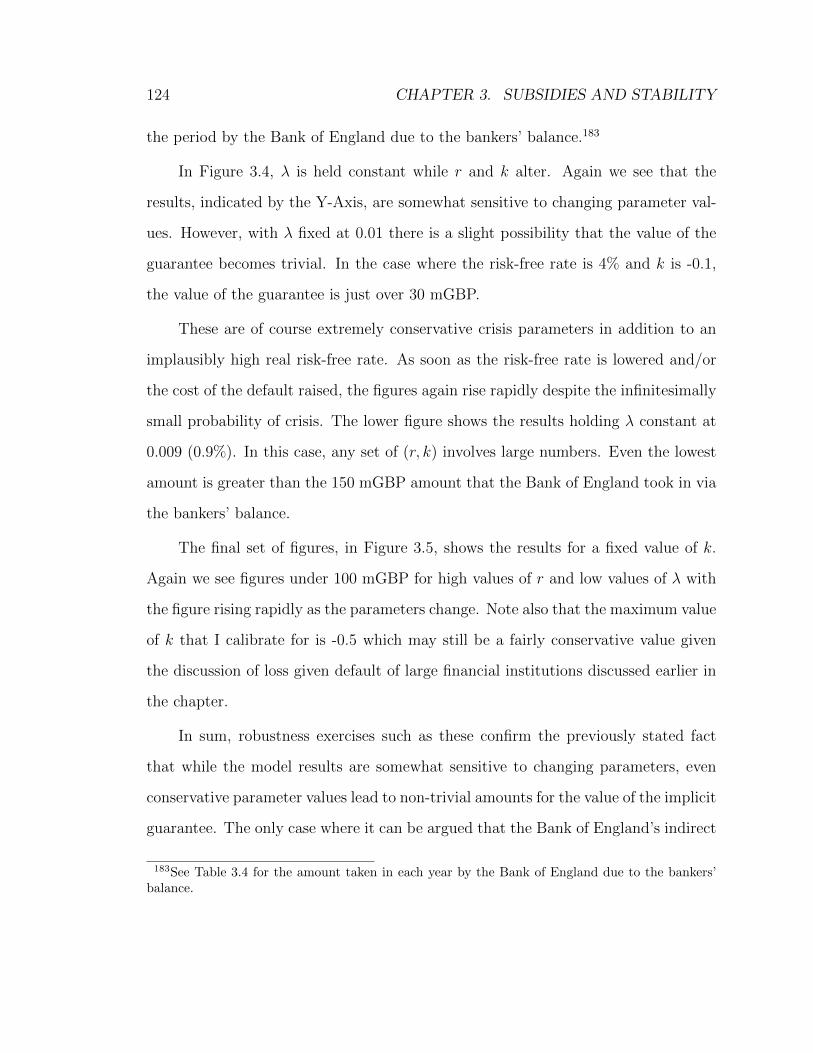
124 CHAPTER 3. SUBSIDIES AND STABILITY
the period by the Bank of England due to the bankers’ balance.183
In Figure 3.4, λ is held constant while r and k alter. Again we see that the
results, indicated by the Y-Axis, are somewhat sensitive to changing parameter val-
ues. However, with λ fixed at 0.01 there is a slight possibility that the value of the
guarantee becomes trivial. In the case where the risk-free rate is 4% and k is -0.1,
the value of the guarantee is just over 30 mGBP.
These are of course extremely conservative crisis parameters in addition to an
implausibly high real risk-free rate. As soon as the risk-free rate is lowered and/or
the cost of the default raised, the figures again rise rapidly despite the infinitesimally
small probability of crisis. The lower figure shows the results holding λ constant at
0.009 (0.9%). In this case, any set of (r, k) involves large numbers. Even the lowest
amount is greater than the 150 mGBP amount that the Bank of England took in via
the bankers’ balance.
The final set of figures, in Figure 3.5, shows the results for a fixed value of k.
Again we see figures under 100 mGBP for high values of r and low values of λ with
the figure rising rapidly as the parameters change. Note also that the maximum value
of k that I calibrate for is -0.5 which may still be a fairly conservative value given
the discussion of loss given default of large financial institutions discussed earlier in
the chapter.
In sum, robustness exercises such as these confirm the previously stated fact
that while the model results are somewhat sensitive to changing parameters, even
conservative parameter values lead to non-trivial amounts for the value of the implicit
guarantee. The only case where it can be argued that the Bank of England’s indirect
183See Table 3.4 for the amount taken in each year by the Bank of England due to the bankers’balance.
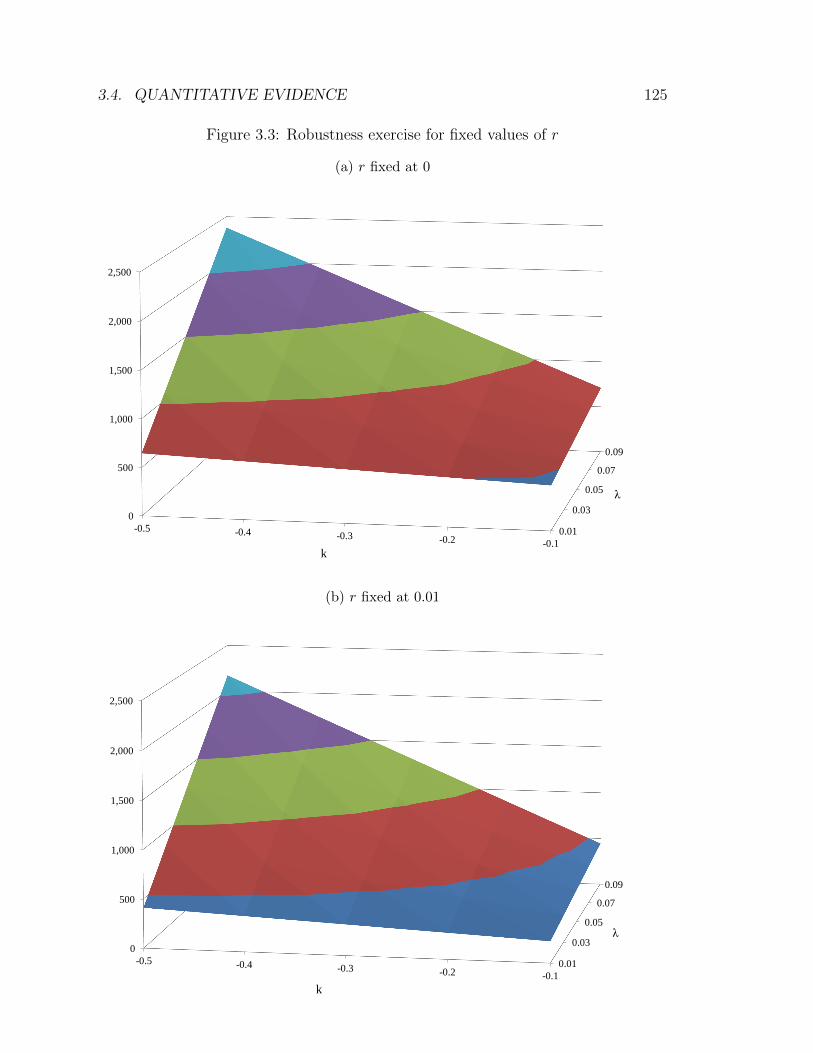
3.4. QUANTITATIVE EVIDENCE 125
Figure 3.3: Robustness exercise for fixed values of r
(a) r fixed at 0
0.01
0.03
0.05
0.07
0.09
0
500
1,000
1,500
2,000
2,500
-0.5 -0.4 -0.3 -0.2 -0.1 k
λ
(b) r fixed at 0.01
0.01
0.03
0.05
0.07
0.09
0
500
1,000
1,500
2,000
2,500
-0.5 -0.4 -0.3 -0.2 -0.1
k
λ
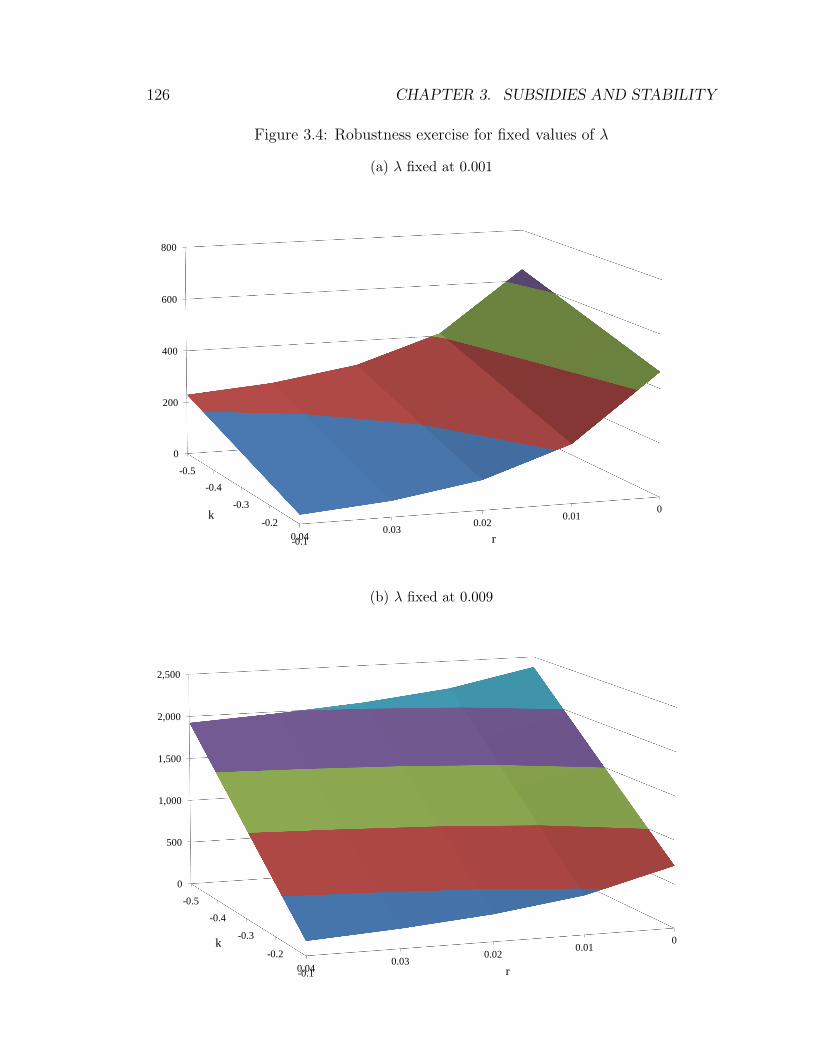
126 CHAPTER 3. SUBSIDIES AND STABILITY
Figure 3.4: Robustness exercise for fixed values of λ
(a) λ fixed at 0.001
0.04 0.03
0.02 0.01
0
0
200
400
600
800
-0.5
-0.4
-0.3
-0.2
-0.1
k
r
(b) λ fixed at 0.009
0.04 0.03
0.02 0.01
0
0
500
1,000
1,500
2,000
2,500
-0.5
-0.4
-0.3
-0.2
-0.1
k
r
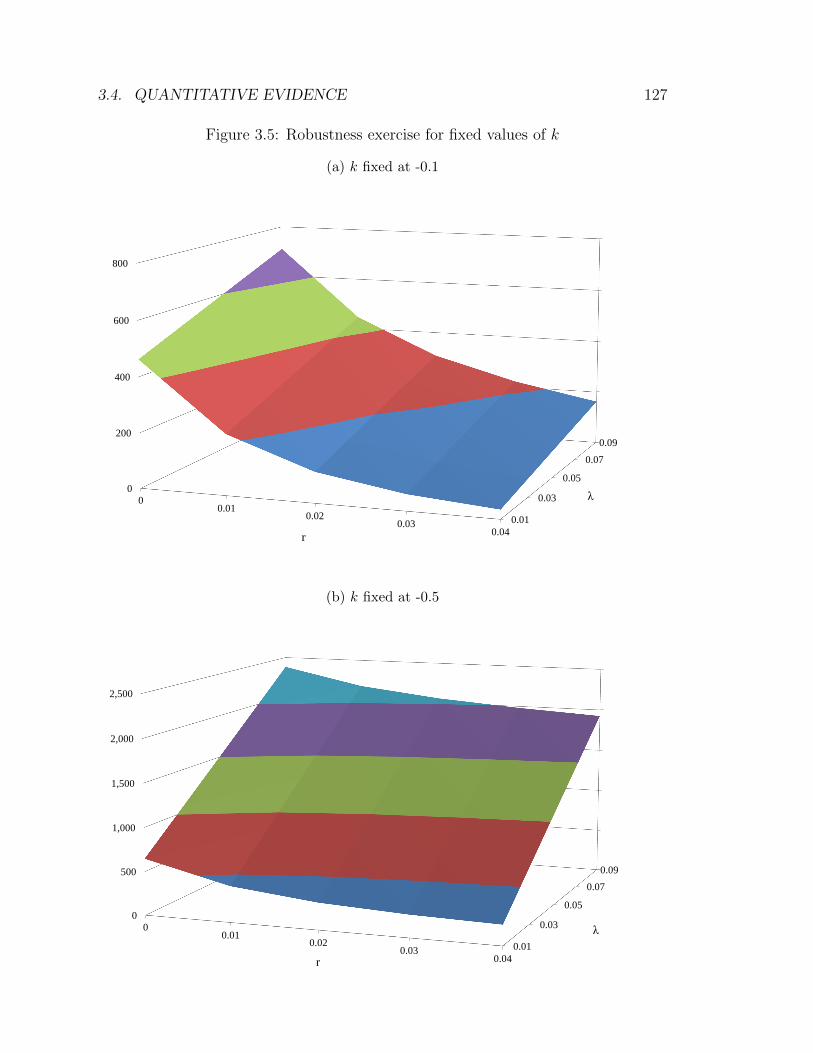
3.4. QUANTITATIVE EVIDENCE 127
Figure 3.5: Robustness exercise for fixed values of k
(a) k fixed at -0.1
0 0.01
0.02 0.03
0.04
0
200
400
600
800
0.09
0.07
0.05
0.03
0.01
λ
r
(b) k fixed at -0.5
0 0.01
0.02 0.03
0.04
0
500
1,000
1,500
2,000
2,500
0.09
0.07
0.05
0.03
0.01
λ
r
128 CHAPTER 3. SUBSIDIES AND STABILITY
taxation of the commercial banks was an adequate price to pay for the services
provided is when one almost excludes the possibility of a crisis and assumes that
crises aren’t costly.184 Note that it is not enough for one of these conditions to be
fulfilled; they are individually non-sufficient but very necessary.
3.5 Conclusions
The goal of this chapter has been to shed light on the Bank of England’s policy
regarding financial stability in the run-up to the radical changes of the financial
system during the 1980s. I have focused on the effects of the Bank’s policy on the
Big Four banks of the time and whether the banks possibly received an implicit
subsidy as a result of the Bank of England’s presence.
I argued that the Bank’s policies in the 1970s were characterized by a lack of a
systematic framework regarding financial stability and that its stance regarding safe-
guarding the City did not consist of a systematic framework of checks and balances.
Furthermore, the response to the periodic crises of the time - which were of various
nature - remained ad hoc and reactionary with little thought given to the systemic
implications of the Bank’s interventions.
Muddying the Bank’s stated goals and actual policies even more was the friendly
and informal relationship that the Bank had with the privately owned clearers. While
this structure most likely led to increased financial stability it had the side effect
of distorting market incentives. In the second half of the chapter, I thus tried to
establish a market-price for the Bank’s presence as guardian of the City.
The main results were twofold: Firstly, the estimates for the price of the Bank’s
184In fact, a real risk-free rate of over 2%, which has previously been mentioned as implausiblyhigh, is also required to arrive at a small estimate of the value.
3.5. CONCLUSIONS 129
service to the large banks are very sensitive to the models’ parameters which con-
sequently makes them hard to use as a pricing method. Secondly, however, even
conservative parameter values show that the Bank could be expected, by its actions,
to provide the Big Four banks with a tremendously valuable service under the pretext
of financial stability concerns without collecting a corresponding fee.
What should the policy implications of a study such as this then be? It is
patently unwise to demand that central banks and regulators use models such as this
one as sole determinants of pricing for their services - especially for 1970s Britain
where the models didn’t even exist. Furthermore, the limitations of such approaches
render them imprecise for taxation purposes no matter how well they are calibrated.
Nonetheless, this does not mean that the conclusions of the Merton and Jump
Diffusion models have no informational value. When thinking about how to price
the services it provides, the government should have as a comparison guide the
methods that private actors would use in providing such services. Whether this be a
Jump Diffusion model of option pricing in current times or more of a rule-of-thumb
method of pricing for loan guarantees in the 1970s, comparison must be made to
what compensation would be reasonable for taking on the risk that is forthcoming
to the government agency due to the services provided.
Of course, the reason for the government’s intervention in the financial markets
at times of crisis is exactly the fact that other market participants are not willing to
provide the services needed at a market-clearing price. This necessarily means that
the government must act in a manner different to that of private investors. However,
for this not to constitute a pure subsidy to the governments’ counterparties, the long
run inflows to the government must compensate for the short-term outflows.
One could perhaps argue that a cost-benefit analysis at the time of intervention
130 CHAPTER 3. SUBSIDIES AND STABILITY
would conclude that action was necessary as the potential of lost output dwarfs any
fiscal cost of intervention. Setting this low hurdle would, however, render intervention
as the best policy during almost any episode that has the possibility of affecting the
real economy. Assistance to institutions guided by financial stability goals should
ultimately be assessed by looking through the cycle and subsequently judged not
only on a cost-benefit analysis at times of crisis but additionally with a revenue
neutrality requirement whereby institutions are forced to internalize their potential
externalities on the economy as a whole.
Furthermore, even if a subsidy via intervention were to be considered desirable,
it should be provided in a transparent manner with the approval of those who provide
the subsidy. The evidence provided in Section 3 indicates that a subsidy was not
considered desirable and, in fact, not thought to be in existence in the first place.
The fact that the costs that arise from the services provided are both intangible
and near impossible to estimate precisely makes them easy to neglect from a policy
perspective. They are nonetheless very real and work in precisely the same manner
as liabilities of insurance companies, which are ultimately paid for by premiums
received. The results of the option pricing framework indicate a very conservative
estimate of the fair value at 410 mGBP for the Big Four during the 1970s. This
is considerably higher than the Bank of England’s intake on the banker balances
which where themselves considered too high at the time. Furthermore, increasing
the estimated likelihood of a crisis increases the 410 mGBP figure and shows the size
and scope of the Bank’s task of keeping the core of the system safe.
The robustness exercise furthermore laid out the scenario required for the sums
involved to become trivial. This is only the case if one all but excludes the possibility
of a crisis and also assumes that the almost impossible crisis scenario would not be
3.5. CONCLUSIONS 131
costly in terms of losses. Once one allows for the scenario of either a slight probability
of a crisis or that they could be costly, the sums involved rise rapidly and become
very significant very quickly.
Put another way, to avoid implicit subsidies, the substantial costs that gov-
ernment agencies have to bear in times of crisis must be collected from financial
institutions when times are good. If it is thought that these costs are too high for
financial institutions to bear, even in the good years, the conclusion must be that the
institutions in question do not work economically as a going concern. This would be
akin to an industrial pollutant that inflicts more social costs with its CO2 emissions
than it takes in profits.
There is consequently no avoiding the fact that the government has to think
of itself as an insurance company when fulfilling its goal of financial stability. By
declaring that financial stability will be preserved necessarily contains the declaration
that systemic financial institutions will not fail and market participants in turn act
accordingly.
The qualitative evidence presented in Section 3 supported the above reasoning
and pointed out the inefficiencies of policies at the time. While internal letters
within the Bank of England show that senior staff was aware of these issues to
some extent, the discussion never reached the policy-making level and ended up
as unanswered philosophical debates in response to crises that had, as ever, been
unforeseen. While such discussions demonstrate the fact that certain Bank employees
(at least belatedly) became aware of the issues, recent events indicate that these issues
are still with us and an adequate framework for thinking about how the financial
sector gains - or should gain - from government involvement remains elusive.
Chapter 4
Simplistic Approaches to
Regulation
There have been success stories in the City before and will be again, but
never has there been anything quite so big, so successful, and so singular
as the growth of SWS.”185
The Financial Times, April 1973.
4.1 Introduction
What motivates central banks and regulators when faced with a widespread financial
crisis? Are they concerned with the protection of ”unsophisticated” depositors or
185McLachlan (1973). SWS stands for Slater Walker Securities. The Slater Walker group, formallytitled Slater Walker Securities, is generally referred to as SW in the text. It is occasionally referredto as SWS when being compared to Slater Walker Ltd, SWL, which is the banking side of thegroup. The Bank of England is referred to either by full name or by the common parlance of ”theBank”.
132
4.1. INTRODUCTION 133
is it rather a case of preventing contagion from spreading throughout the system?
How is the decision made whether to intervene or let market forces play their role?
And if policymakers do decide to intervene, how are the specifics of the intervention
determined?
Questions such as these have come back to the forefront following the global
financial crisis of 2008. Yet concrete answers continue to elude researchers and many
contradicting solutions to the problems that arise during financial crises have been
put forward. In this chapter, I try to shed light on the practical matters faced
by policymakers in their roles as financial crisis managers by looking at the largest
fallout of the secondary banking crisis in Britain; Slater Walker (SW).
Slater Walker was the embodiment of the new type of financial institution in
1960s Britain. Exhibiting massive growth and ever-increasing influence, it gained a
strong foothold within the financial system by riding the easy money environment of
the period before collapsing dramatically and ending up in the arms of the Bank of
England in 1975. The group’s development from a tiny shell company to Britain’s
most exciting firm and then through to public ownership contains all the aspects
of typical bank failures including contagion, regulatory problems and the question
of public deposit safeguarding. In fact, Reid (1982) concludes that the portrayal of
Slater Walker’s position is ”essential to the study of the crisis and of lessons to be
learned from it.” 186
An attempt to deal with these issues in the literature typically starts with the
motivation for financial regulation, which generally comes in the form of external-
ities and information asymmetries. Once this rationale for regulation has been es-
tablished, thoughts usually turn to policymakers’ perceived inability to construct a
186Reid (1982) p. 184.
134 CHAPTER 4. SIMPLISTIC APPROACHES TO REGULATION
framework to address these issues in an efficient way, i.e. an optimal policy. Despite
the aforementioned theoretical considerations, as argued for example by Goodhart
(2010), the application of financial regulation has generally been atheoretical.187 Re-
form efforts have thus tended to focus on dealing with past crises in a patchwork
manner in an effort to make up for previous mistakes, such as allowing too much
leverage, asset price bubbles and undesirable financial innovation.
The secondary banking crisis in Britain was a case in point of the inability of
policymakers to keep up with, and respond to, financial innovation - a reoccurring
theme of financial crises.188 The popular name of the crisis even takes its name from
the new type of bank that emerged in the build-up to the crisis.
These so-called secondary banks shared several characteristics that are indeed
widely held to have contributed to the imbalances leading up to the crisis. These
characteristics include reliance on money market funding, funding for property devel-
opment and the fact that they were not subject to controls that the more traditional
banks had to obey.189 Many of these institutions held the so-called 123 certificate
which meant that they were positioned on the fringes of the banking system. Cru-
cially, however, they were still classified as banks and were allowed to accept deposits
which would prove to be an important factor when the Bank of England had to decide
whether to save these fringe banks or not.190
187This has changed to a certain extent recently, e.g. with the introduction of internal risk-basedmodels and the unifying of risk management and regulation. Relatedly, Clement (2010) presentsinsight into the development of regulation at the period studied in this thesis by looking at theorigins of the term macroprudential. He traces it back to the late 1970s amidst concerns overinternational lending.188Mishkin (2009) mentions financial innovation as one of three common precipitating crisis factors
(alongside asset price bubbles and deterioration of financial institution balance sheets). Gennaioliet al (2012) represents a recent attempt to formalize innovation as a source of instability. Van Horne(1985) gives a more casual overview between financial innovation and the potential for excess.189Other chapters of this thesis provide additional coverage of the secondary banks.190As noted by Geddes (1987), section 123 licenses were ”an immiediate target: the implication of
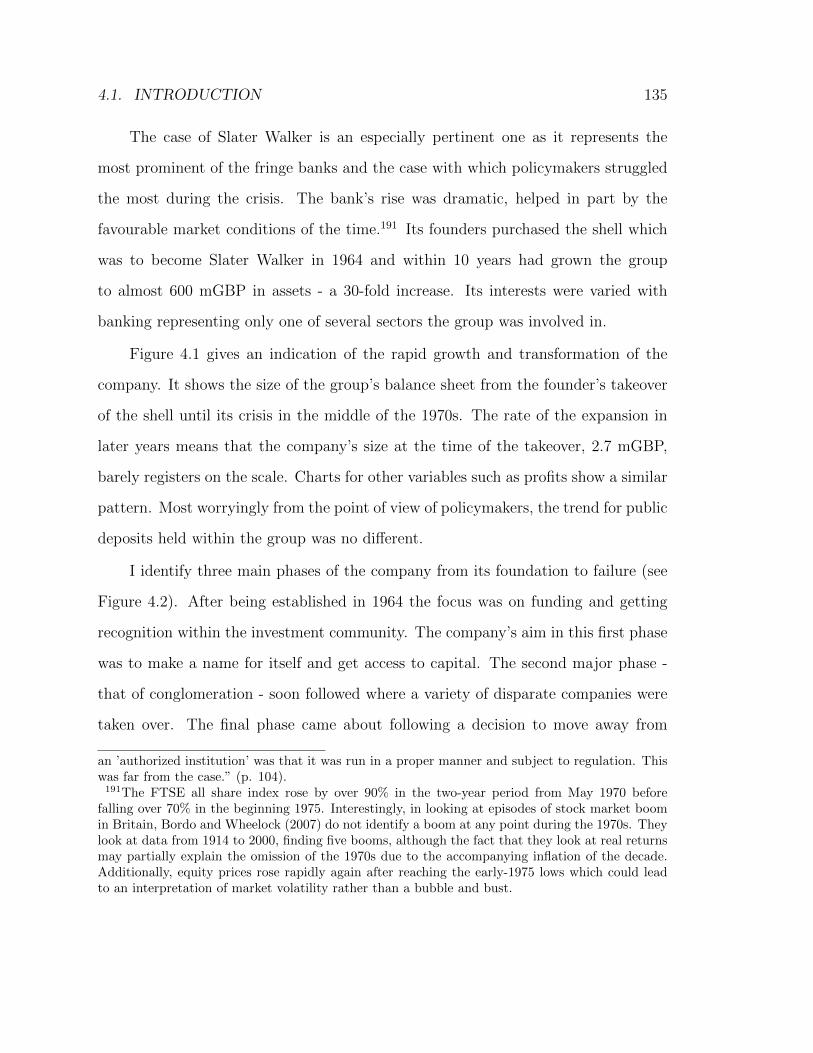
4.1. INTRODUCTION 135
The case of Slater Walker is an especially pertinent one as it represents the
most prominent of the fringe banks and the case with which policymakers struggled
the most during the crisis. The bank’s rise was dramatic, helped in part by the
favourable market conditions of the time.191 Its founders purchased the shell which
was to become Slater Walker in 1964 and within 10 years had grown the group
to almost 600 mGBP in assets - a 30-fold increase. Its interests were varied with
banking representing only one of several sectors the group was involved in.
Figure 4.1 gives an indication of the rapid growth and transformation of the
company. It shows the size of the group’s balance sheet from the founder’s takeover
of the shell until its crisis in the middle of the 1970s. The rate of the expansion in
later years means that the company’s size at the time of the takeover, 2.7 mGBP,
barely registers on the scale. Charts for other variables such as profits show a similar
pattern. Most worryingly from the point of view of policymakers, the trend for public
deposits held within the group was no different.
I identify three main phases of the company from its foundation to failure (see
Figure 4.2). After being established in 1964 the focus was on funding and getting
recognition within the investment community. The company’s aim in this first phase
was to make a name for itself and get access to capital. The second major phase -
that of conglomeration - soon followed where a variety of disparate companies were
taken over. The final phase came about following a decision to move away from
an ’authorized institution’ was that it was run in a proper manner and subject to regulation. Thiswas far from the case.” (p. 104).191The FTSE all share index rose by over 90% in the two-year period from May 1970 before
falling over 70% in the beginning 1975. Interestingly, in looking at episodes of stock market boomin Britain, Bordo and Wheelock (2007) do not identify a boom at any point during the 1970s. Theylook at data from 1914 to 2000, finding five booms, although the fact that they look at real returnsmay partially explain the omission of the 1970s due to the accompanying inflation of the decade.Additionally, equity prices rose rapidly again after reaching the early-1975 lows which could leadto an interpretation of market volatility rather than a bubble and bust.
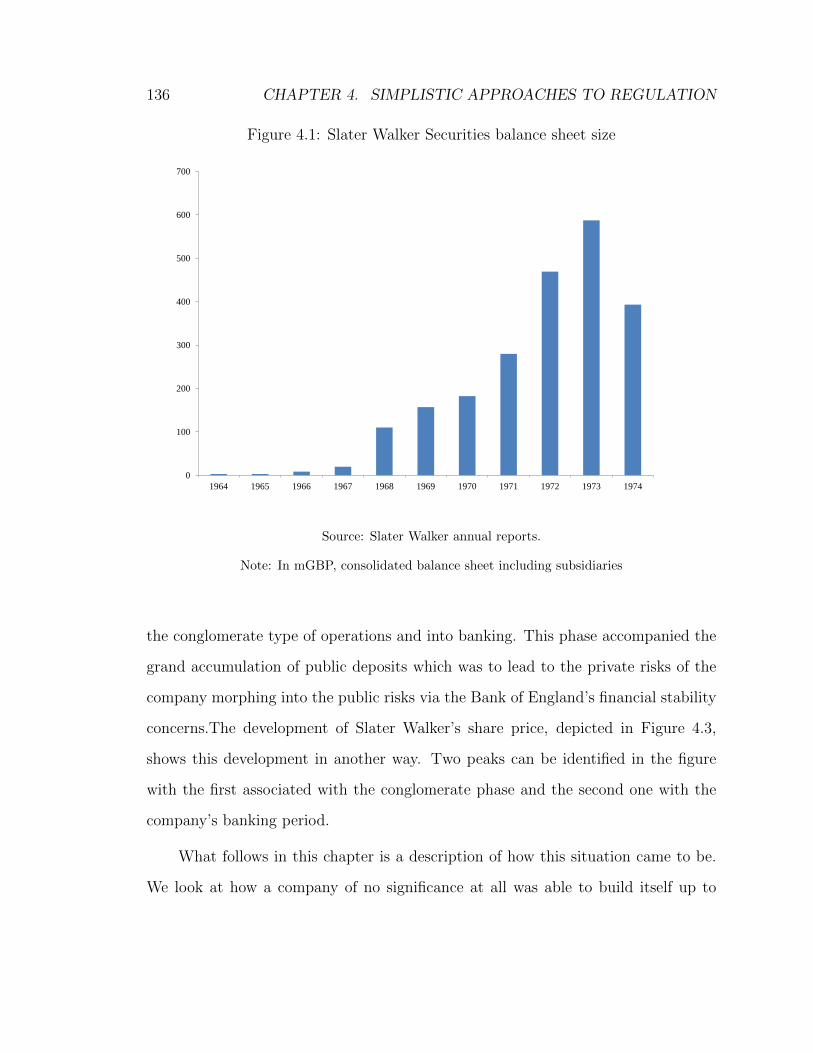
136 CHAPTER 4. SIMPLISTIC APPROACHES TO REGULATION
Figure 4.1: Slater Walker Securities balance sheet size
0
100
200
300
400
500
600
700
1964 1965 1966 1967 1968 1969 1970 1971 1972 1973 1974
Source: Slater Walker annual reports.
Note: In mGBP, consolidated balance sheet including subsidiaries
the conglomerate type of operations and into banking. This phase accompanied the
grand accumulation of public deposits which was to lead to the private risks of the
company morphing into the public risks via the Bank of England’s financial stability
concerns.The development of Slater Walker’s share price, depicted in Figure 4.3,
shows this development in another way. Two peaks can be identified in the figure
with the first associated with the conglomerate phase and the second one with the
company’s banking period.
What follows in this chapter is a description of how this situation came to be.
We look at how a company of no significance at all was able to build itself up to
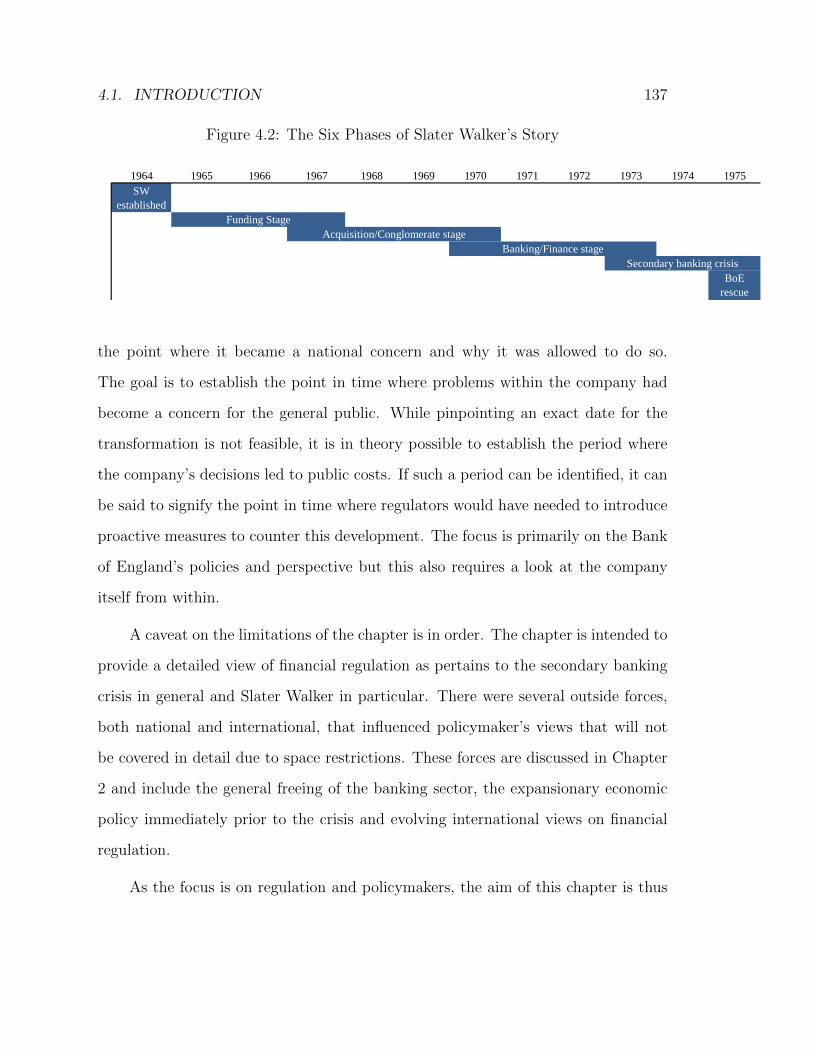
4.1. INTRODUCTION 137
Figure 4.2: The Six Phases of Slater Walker’s Story
1964 1965 1966 1967 1968 1969 1970 1971 1972 1973 1974 1975
BoE
rescue
SW
established
Funding Stage
Acquisition/Conglomerate stage
Banking/Finance stage
Secondary banking crisis
the point where it became a national concern and why it was allowed to do so.
The goal is to establish the point in time where problems within the company had
become a concern for the general public. While pinpointing an exact date for the
transformation is not feasible, it is in theory possible to establish the period where
the company’s decisions led to public costs. If such a period can be identified, it can
be said to signify the point in time where regulators would have needed to introduce
proactive measures to counter this development. The focus is primarily on the Bank
of England’s policies and perspective but this also requires a look at the company
itself from within.
A caveat on the limitations of the chapter is in order. The chapter is intended to
provide a detailed view of financial regulation as pertains to the secondary banking
crisis in general and Slater Walker in particular. There were several outside forces,
both national and international, that influenced policymaker’s views that will not
be covered in detail due to space restrictions. These forces are discussed in Chapter
2 and include the general freeing of the banking sector, the expansionary economic
policy immediately prior to the crisis and evolving international views on financial
regulation.
As the focus is on regulation and policymakers, the aim of this chapter is thus
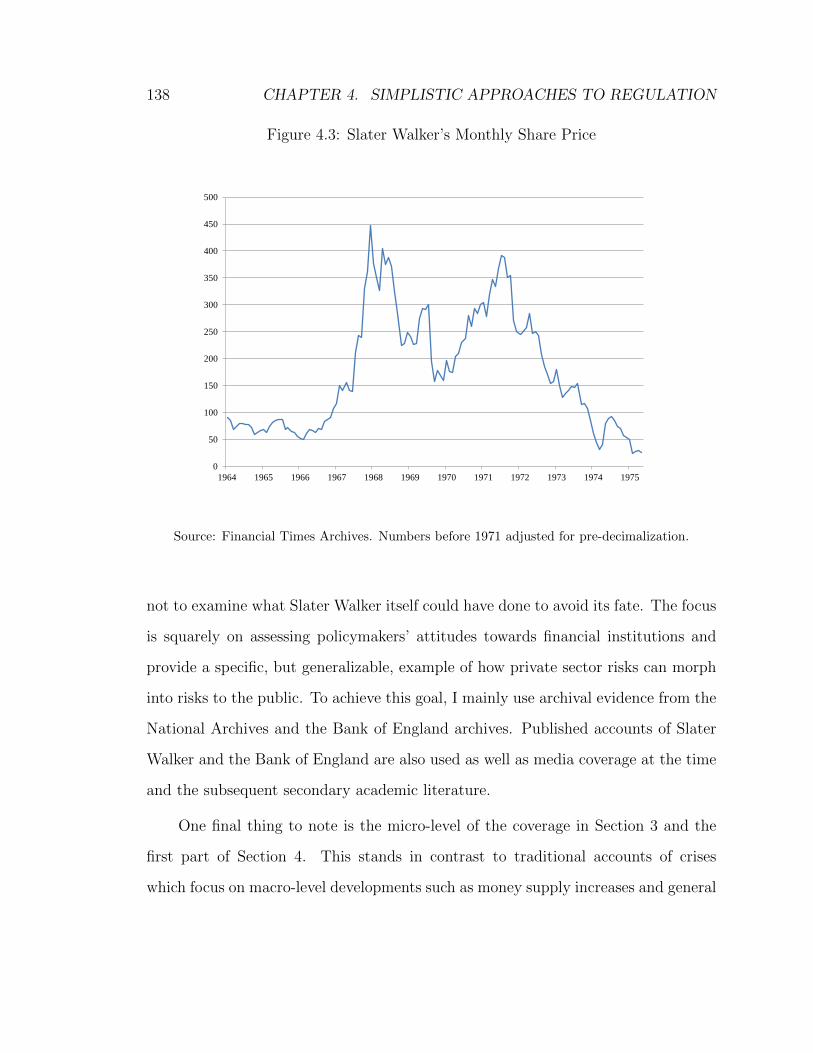
138 CHAPTER 4. SIMPLISTIC APPROACHES TO REGULATION
Figure 4.3: Slater Walker’s Monthly Share Price
0
50
100
150
200
250
300
350
400
450
500
1964 1965 1966 1967 1968 1969 1970 1971 1972 1973 1974 1975
Source: Financial Times Archives. Numbers before 1971 adjusted for pre-decimalization.
not to examine what Slater Walker itself could have done to avoid its fate. The focus
is squarely on assessing policymakers’ attitudes towards financial institutions and
provide a specific, but generalizable, example of how private sector risks can morph
into risks to the public. To achieve this goal, I mainly use archival evidence from the
National Archives and the Bank of England archives. Published accounts of Slater
Walker and the Bank of England are also used as well as media coverage at the time
and the subsequent secondary academic literature.
One final thing to note is the micro-level of the coverage in Section 3 and the
first part of Section 4. This stands in contrast to traditional accounts of crises
which focus on macro-level developments such as money supply increases and general
4.1. INTRODUCTION 139
indebtedness within economies. As such, the chapter describes the rise of SW in
considerable detail as well as how it came to be in the position of being saved by
the Bank of England. This is due to the enormous growth of the company and the
practical details needed to have in mind to understand how a small shell company
could morph into an entity deemed too systemic to be allowed to fail. While certain
minute details may seem irrelevant to the subsequent story of the crisis and the
bailout, they help to shed light on the complex issues faced by the Bank of England
in trying to assess the financial health of such an intricate business.
The chapter proceeds as follows. Section 2 lays out the motivation for the
chapter and describes the sources and data used. Section 3 lays out the Slater
Walker business narrative and documents the rise and prominence of the company.
This is done via archival material, the secondary literature, contemporary media
coverage and various correspondence. The goal is hence to assess whether it was
possible for policymakers to see, ex ante, the build up of specific risks and prevent
a public rescue of the company. Section 4 covers the demise of the company, the
rescue operations and the accompanying fallout. Looking at the actual measures
taken is only a secondary objective, as they have been documented before, and the
focus instead is on how the Bank of England acted while the risks were building up as
that would have been the time to provide preventive measures. The range of policy
options are also examined, apart from those actually taken, and how the ultimate
decisions were made within the Bank. Section 5 concludes.
140 CHAPTER 4. SIMPLISTIC APPROACHES TO REGULATION
4.2 Sources and data
The main archival sources used in the chapter are Treasury material, via the National
Archives, and Bank of England material from the Bank’s archive. A lot of this ma-
terial was released following a freedom of information request in 2005 and consists of
memoranda and correspondence, mainly with the Bank, on the assistance provided.
The Treasury information is clustered around three periods between 1975 and 1977
and thus does not cover material prior to the crisis.192 There is no suggestion that
the Treasury was involved with any work - regulatory or other - regarding Slater
Walker prior to the crisis. There is, however, no mention made as to whether any
Slater Walker related material has been deemed confidential and will not be made
available.193
Some weeding of the Bank archives was performed in the 1980s although much
of the discarded material will have been routine papers and non-informative letters.
There is thus the possibility of selection bias due to omitted documents. For general
material, the incompleteness of the archives stems from removal of standard docu-
ments and not systematic removal of certain important material which, means that
the likelihood of this is low. Documents that were retained are a mixture of high-level
and low-level material and provide a relatively thorough narrative of the episodes
under consideration in this chapter.194 It is, however, difficult to certify on what
192The three periods are during the original Bank assistance to Slater Walker, when the company’saccounts were published and when the decision was made by the Bank to acquire the banking armof SW.193As for the Bank of England, its archives contain a vast amount of documents for all branches
of the Bank, including both internal communication as well as the Bank’s dealings with the privatesector and other parts of the public sector. In total, it contains over 80,000 documents dating fromthe Bank’s foundation in 1694 to the present. Further information is provided in Chapter 1 of thethesis.194This information is also provided in Chapter 3.
4.2. SOURCES AND DATA 141
grounds omissions were made and, as discussed below, there are certain suggestions
that survivor and selection bias may play a part.
The reference numbers of each entry generally refer to the department from
where the file is taken. For example, files stored under the ADM section in the
archives originate in the Administration Department and the Economic Intelligence
Department files are stored under the EID section. There are 16 categories in to-
tal and each category consists of several subcategories called classes which contain
related material. Finally, each class usually has several individual files. The end re-
sult is therefore a threefold categorization. One example would be ADM35/6 which
would be file 6, class 35 in the Administration Department. This particular class
represents the 6th file of the papers of John Fforde, the Bank’s former chief cashier,
executive director and official historian.
For this chapter, the bulk of the evidence comes from material released following
the aforementioned freedom of information request which also pertained to the Bank.
While this includes a vast amount of material, the filing system indicates that a large
amount of material has not been released.195 Furthermore, the method with which
the material was categorized is unknown, as is the decision making process regarding
omitted material, so it is hard to gauge how representative the available archival
material is. According to Capie (2010), the bulk of the Bank’s material on the
secondary crisis was destroyed. Capie does not provide the reason for this which
means that whether the destroyed material was superfluous or simply destroyed
because it portrayed the Bank in a negative fashion is unknown. As will be seen
195The Slater Walker files in the Bank’s archives are filed under 6A70. The available sub-filesunder 6A70 are 6A70/1 to 6A70/4 and 6A70/18, thus excluding sub-files 5 to 17. Capie (2010) hadaccess to additional Bank material, including the missing files under 6A70, 5-17. The contents ofthese closed files are unknown.
142 CHAPTER 4. SIMPLISTIC APPROACHES TO REGULATION
below, however, enough material survived to piece together a coherent story of the
Bank’s operations and not necessarily in a positive manner.
The remaining Slater Walker files at the Bank’s archives are of various nature.
They include both internal and external correspondence, memoranda and minutes
of meetings. They also include the Bank’s analysis of Slater Walker’s performance
from 1968 onwards which covers most of the group’s banking period. This material,
used extensively in the chapter, is extremely relevant as it sheds light on the Bank’s
regulatory function before the onset of the crisis. It can thus help gain insight
into whether it performed its role adequately, rendering the crisis unpreventable, or
whether intervention was warranted earlier on behalf of the Bank.196
In addition to the archival material, extensive use is also made of media coverage
during the period. This includes newspaper articles, and interviews as well as trade
and professional magazines. The coverage not only provides key insights into Slater
Walker’s development but also forms an integral part of its history. A major factor
in SW’s ability to attract funding - both from professional investors and the public -
was the positive publicity and widespread interest in the firm. The intense coverage
is therefore itself a piece of evidence and helps shed light on the firms history.
4.3 The Rise of Slater Walker
In this section the Slater Walker narrative is laid out along with an explanation of
how the company came to prominence. I start by charting the rise of its founders and
the circumstances whereby they were able to acquire a publicly listed company. The
focus then moves to the means by which the firm could grow exponentially and how
196There are, of course, additional possibilities that fall in between these two categories, such asadequate crisis management without being able to prevent the crisis altogether.
4.3. THE RISE OF SLATER WALKER 143
its funding was the key to its early success. The role that positive media attention
played in the company’s growth is also emphasised.
4.3.1 Foundation and Funding
Slater Walker was founded by Jim Slater and Peter Walker in 1964. The former,
born in 1929, was a chartered accountant and held several industry jobs before
founding SW.197 He quickly gained a reputation as a shrewd manager with a keen
eye for company financials and was held in high esteem by his employers. Walker,
meanwhile, was a rising star in politics; A MP for the Conservatives and a prominent
member of the up and coming generation of the more business savvy Tories. The pair
first met in the autumn of 1963 and hit it off right away with Walker immediately
noticing Slater’s nous for business.
The two men soon started SW at Slater’s initiative. While Slater was still
working in industry, Walker had remarked that if ever Slater wanted to go it alone,
that is start an independent business, then Walker himself would fully support him
- not only financially but also with introductions to the right people as Walker was
quite well connected in City circles.
Slater and Walker’s early connection helps explain how an outsider such as Slater
was able to penetrate the famously closed gentleman’s club that was London finance
and Slater was, in some sense, an example of the changing times therein. The
pair’s relationship and initial business dealings are an integral part in explaining
the transition from the son of a salesman with no history in finance to becoming
a symbol of new financial times and ultimately the head of a financial firm that
hadn’t previously existed but came to be considered too important to fail during the
197See Slater (1977), especially pp. 15-26.
144 CHAPTER 4. SIMPLISTIC APPROACHES TO REGULATION
secondary crisis.
Slater’s first step in becoming an independent businessman was taken in 1963
when he acquired, alongside his business partner Kenneth Meyer, a 25% stake in a
company called Productofoam. According to Raw (1977), Slater’s main interest in
the company was due to the fact that it was one of the smallest quoted companies on
the London Stock Exchange. Raw provides no evidence for this motivation although
Slater’s initial focus on small companies was definitely in accordance with his limited
means at the time.
Productofoam’s main operations were in laminating as well as rubber and glove
manufacturing. Slater’s intentions were however only very partially based on the
existing operations of the firm. He did in fact intend to increase Productofoam’s
laminating efficiency by purchasing a rival firm but his main intention was to set
up a share dealing and investment advisory business which was to increase profits
greatly.198
To obtain the shares needed, and hence set his plan in motion, Slater needed
roughly £50,000. He paid half of the amount with his own money that he had
amassed in share dealing and the other half was borrowed from Lombard. This
holding, along with Meyer’s stake which was roughly half of what Slater held, gave
Slater control of approximately a quarter of Productofoam’s outstanding shares.
However, he did in fact control a substantially larger portion of the shares as friends
and acquaintances had been encouraged to buy shares for themselves. This control
of shares, coupled with the fact that the company’s chairman, Freddie Cheshire, and
the largest shareholder, Jan Rabl, were sympathetic to Slater’s plan, allowed Slater
to put his plan into motion. This resourcefulness in leveraging his connections was
198Raw (1977) p.103.
4.3. THE RISE OF SLATER WALKER 145
a key characteristic of Slater’s operations.
In this early example one can see how little skin in the game was required to
get a foothold in the financial services industry. Slater had needed merely £25,000
of his own capital to gain control in a public, albeit small, company.199 The rest of
his control came through borrowing, control of his friends shares and the trust of
the chairman and largest shareholder. The £25,000 alone would have meant direct
control of 10% of outstanding shares, before the shares started to rise. The other
factors were therefore of huge significance in gaining control of the company.
As fate would have it, Productofoam did not turn out to be the platform by
which Slater was to establish his empire. A series of unfortunate incidents including
factory fires led to decreasing interest in the firm by Slater. Luckily for Slater,
Cheshire knew of another company that could be used as a shell to carry out his
plans.
This company was initially registered in 1935 as H.Lotery Co. Ltd. Its history
lay in the manufacturing of uniforms but had recently been more of a property
investment firm.200 The firms heady days came during World War One when it was
a supplier to the Army and other official organizations. At year end 1962 its balance
sheet stood at £662,510, with almost no debt, and in 1964 the only remaining asset
was Beaufort House, a large office block. H.Lotery’s purpose for being a publicly
listed company had therefore declined considerably but its balance sheet suited Slater
well.
Amid political uncertainty and the possibility of adverse effects on property
prices following a Labour victory in the general elections, the largest shareholders of
199This amounts to roughly £450,000 in current terms.200Rixson (1969).
146 CHAPTER 4. SIMPLISTIC APPROACHES TO REGULATION
H.Lotery were looking for a way out. Cheshire had alerted Slater to this development
and Slater quickly made a bid for the want-away shares. Slater’s bid valued the
company a little higher than the valuation of Beaufort House; 1.5 mGBP against
approximately 1.35 mGBP. This premium was presumably primarily due to the value
of the control of capital to Slater. His interest in the company, according to the Bank
of England, also stemmed from the fact that ”its public quotation would enable him
to capitalise his income and give a market value to his consultancy business”.201
However, Slater had nowhere near the amount of money required to complete
the takeover himself. The stake he wanted to acquire amounted to 48% of the
company, translating to a need for £720,000. Table 4.1 lays out how Slater obtained
the required capital.
Table 4.1: Financing of H. Lotery by Jim Slater
Own money 25,000
Borrowed 325,000
Walker 50,000
Walker-Young (Walker's insurance brokerage) 45,000
Meyer 88,000
Placed 188,000
Source: Raw (1977) pp. 110-114.
This structure of funds shows a similar pattern to the Productofoam transaction
whereby a large proportion of the stake that Slater ended up controlling came from
either borrowed funds or Slater acting as agent for other people’s principal. Slater
thus ends up gaining control of a publicly listed company, through a 48% stake that
was funded less than 3.5% by his own capital, or just over 1.5% of the company’s
market capitalization.
The fact that he was able to obtain the amount of borrowings that he did is
201BEA 6A70/2, P.J. Keogh, d.d. 13/12/71.
4.3. THE RISE OF SLATER WALKER 147
testament to Slater’s resolve and the trust with which those he encountered bestowed
upon him. His connections with Walker, Cheshire and other well connected individ-
uals, who were more on the inside than he, were invaluable in starting out the Slater
Walker business.
As soon as the deal was completed, the name of the company was changed to
Slater Walker & Co. The company’s stock, which had been illiquid and stable for a
long time, started rising rapidly as soon as Slater’s started showing interest in the
firm. Slater’s offer for the 48% stake was 10s per share but jumped to 17s 6d. within
a month - a 75% increase.202
It is hard to distinguish what fraction of the share price development was due
to Slater’s buying and his associates and what was due to either fundamentals or
interest from unrelated parties. One of the main themes in Raw (1977) is that
many of Slater’s dealings led to a higher share price due to his own transactions
as opposed to general price discovery. Some of Raw’s examples are convincing and
others less so but the purpose here is not to establish the mechanics behind share
price developments. Suffice it to say that due to the fact that Slater often dealt with
small, quoted companies there was the potential for his own dealings and those of
related parties to materially and permanently affect the price of these illiquid equities
but the extent of this mechanism will not be estimated here.
Having secured control, if not ownership, of the company - now known as Slater
Walker - Slater set about pursuing his strategy. He started by taking out an £850,000
mortgage on the previously debt-free Beaufort House and managed to acquire another
1.5 mGBP from general investors. According to Slater himself, half of the mortgage
202The offer price of 10s amounted to 0.5 pounds which indicates how illiquid and small the stockwas.
148 CHAPTER 4. SIMPLISTIC APPROACHES TO REGULATION
money was used for undefined ”special situations” and the rest for general equities.
The 1.5 mGBP were raised to start a subsidiary of Slater Walker called Slater
Walker Industrial Group (SWIG). This was to become the vehicle through which
large shareholdings were held and used to influence boards and companies - active
shareholding in the modern parlance. There was considerable and widespread inter-
est from the investment community with regard to SWIG and the group found great
success in its early days. This interest was partly a function of the positive atmo-
sphere towards such ventures at the time but also the charisma and persuasiveness
of Slater himself. With these two efforts - the mortgage and SWIG - Slater thus
found himself with almost 2.5 mGBP to invest despite only having had £25,000 of
his own money to start the venture.
The effect of Slater’s newfound connections and trust cannot be overestimated
with regard to Slater Walker in general and particularly SWIG. Slater was able to
use a highly successful public relations strategy to attract smaller investors and his
relationships with individuals such as Peter Walker and Cheshire to attract larger
investors and the backing of respected financial institutions. It should also be noted
that at this point in time, the Bank of England understandably paid no attention
to Slater’s dealings as they had not yet entered the Bank’s vicinity. Regarding the
public relations strategy, Slater had hired a consultant who was quite successful in
securing media interest - primarily in the Evening Standard. Articles that depicted
Slater’s rapid rise and the impressive capital appreciation he had attained led to
increased business which Slater used primarily for further share dealings. Slater’s own
charm was another factor that helped create favourable coverage and his mantra that
companies such as his performed the social good of increasing efficiency in Britain’s
industries were favourably received within publications such as the Daily Telegraph.
4.3. THE RISE OF SLATER WALKER 149
Slater was thus seen by many as a new breed of capitalist who saw room for
drastically increased efficiency throughout the economy and was able to dramatically
reorganize companies in disparate industries despite no prior association with the
industry. On a macro level, this increased efficiency was thought to be able to
catapult Britain back to the forefront of European business and signal a new period
of prosperity.
As for his relationships, Walker in particular presented a way into circles that
Slater would have found hard to enter on his own. Walker’s formal role within Slater
Walker was that of non-executive board member but his main advantage was in
introducing Slater to important bankers and stockbrokers. Lord Black, whom Slater
had first met during his industrial days at a company called Park Royal, was also
instrumental in introducing Slater to the right people and his connections secured a
hefty chunk of SWIG’s funding. The people introduced by Walker and Lord Black in
turn helped Slater gain further backing where needed and helped in those early years
secure funding from reputable institutions such as Schroders, Lazard and Lombard
Banking.
The investment climate during these formative years must also be put into
perspective when assessing Slater’s achievement in attracting funds. As previously
noted, there was substantial uncertainty regarding the financial outlook during the
summer of 1964 as fears of a Labour government mounted.203 Investors were unsure
what measures such a government would take regarding both finance and property
which meant that funding was not particularly easy to come by during the period.
Slater’s financing is thus more impressive as the funds indicate a genuine belief in his
203See e.g. Burk and Cairncross (1992) for a discussion on the political environment of the timeas it related to subsequent financial instability.
150 CHAPTER 4. SIMPLISTIC APPROACHES TO REGULATION
plans and acumen from well established brands with a long and conservative history
when it came to backing new ventures.
While SWIG was initially a standalone venture, standing outside of Slater
Walker itself, towards the end of 1964 it was decided to place the investments made
with the £850,000 mortgage within SWIG in exchange for a 40% share in the latter.
Regarding this transaction, Raw notes that ”[t]he fact that the august institutions
which Slater had persuaded to invest in SWIG were prepared to accept this arrange-
ment is a tribute to Slater’s salesmanship.”204
With this transaction, the initial form of Slater Walker itself was taking form and
the company was renamed Slater Walker Securities Ltd in November of the following
year. The two main subsidiaries were to be SWIG, which held industrial side of the
business, and Slater Walker Ltd which was to be - in various forms in following years
- the banking side of the company. The final piece of the setup was completed when
ownership was secured for the SW shares that had only temporarily been placed
during the initial takeover (Table 4.1). The stake was bought by a company called
Great Portland Estates (GPE) which had great belief in the SW project. GPE was
a property group which had initially signed up for 13%, or £200,000, of SWIG’s
funding but now decided to take up 240,000 shares in SW itself.
SW’s good fortune continued in early 1965 when it was announced that the
main tenant of Beaufort House was to buy the property for 1.85 mGBP. Not only
was this £500,000 above the valuation of the property when Slater had taken over
the company, but it was also £350,000 higher than the price he had paid for it.
Following this, Slater was ready to unveil his strategy for the firm as it stood then.
The strategy consisted of seven seemingly distinct fields although the operational
204Raw (1977) p.118.
4.3. THE RISE OF SLATER WALKER 151
distinction was more blurry. The seven fields were property, investment, trading,
investment management, management services, industrial group and general. These
fields can roughly be re-categorized into proprietary trading, private equity and asset
management. The property portfolio was a legacy unit and it was not thought to be
the case that property speculation would form a large part of the company. While
the strategy wasn’t executed in full, and was to change considerably several times,
the initial plan for the firm shows the tremendous ambition right from the start.
The Bank of England had not shown any interest in SW at this point. This is
to be expected as SW hadn’t yet delved in any meaningful sense into its banking
activities and its position could at best be of informational use to the Bank of Eng-
land as indicative of more widespread changes within the financial system including
aggressive takeovers and wholesale funding. Another key attribute of Slater’s early
success was his short-lived, anonymous career in journalism. Slater had contributed
regular columns to the Daily Telegraph from early 1963 where, under the pseudonym
Capitalist, he recommended various stocks to the public and had been quite success-
ful at this stock picking. In early 1965 Slater’s identity was revealed which led to
another surge in inflow to his advisory business, which was now managed inside
Slater Walker. Whether intentional or not, the journalism angle can be categorized
as another successful part of the PR strategy which helped attract funds and thus
facilitated further growth of Slater Walker’s business.
In this early stage, SW was able to fill a gap in the investor market by accepting
smaller fees than most traditional advisers - as small as £5,000. The group’s pub-
lished results and media coverage served as a signal of high expected returns to many
investors and SW was able to attract large amounts of funds. This could also have
been taken as a sign that the firm was taking advantage of less sophisticated actors
152 CHAPTER 4. SIMPLISTIC APPROACHES TO REGULATION
in the market but this does not seem to be the case. First of all, SW’s reputation was
also positive within professional, experienced circles. Secondly, it is hard to argue
that the group’s earnings and performance were purely noise related with no signal
involved.
SW had now constructed the funding platform on which it could build its empire
on. This initial platform - i.e. constructing the liability side of the balance sheet -
was the biggest obstacle and with funding secured, Slater and his colleagues could
focus on the asset side of the balance sheet. As far as any overall strategy regarding
deals and sectors was concerned there didn’t seem to be one. During the acquisition
phase of 1965-1970, SW invested heavily in sectors as disparate as slipper makers
and gas ovens.
One early acquisition, noticeable for our purposes, was A. Rosenthal & Partners
which was bought in the summer of 1966. This was a small banking business with
approximately 1.4 mGBP of deposits.205 There is no indication that this takeover
warranted any discussion or attention within the Bank of England which had not
started to monitor the SW group at all at this point. A. Rosenthal was sold on only
three years later but signalled SW’s first venture into banking.
4.3.2 Conglomeration
As reported in a detailed Accountancy article, aptly named The Sky’s The Limit,
SW’s pace of acquisitions began to increase from 1966 onwards.206 According to Raw,
during the following three years, between 1967 and 1970, SW acquired seventeen
companies and approximately twelve private firms. This is the period that I classify
205See Raw (1977) p.186.206Rixson (1969).
4.3. THE RISE OF SLATER WALKER 153
as the conglomerate phase where large stakes in various unrelated industries were
acquired. The firm’s balance sheet grew from just under 20 mGBP at year end 1967
to 182 mGBP at the end of 1970. In the same period profits went from roughly
£650,000 to 7.4 mGBP. The group’s market capitalization showed a similar trend,
rising by a factor of 33 over a three year period. The astronomical growth in assets
and earnings was allocated quite equally between what was in the annual reports
termed ”financial and investment activities” on the one hand and ”commercial and
industrial activities” on the other.207 This categorization corresponds roughly to the
SW Ltd and SWIG divide mentioned above.
It was the massive share price increase, along with borrowings, that fuelled a
lot of the expansion during this period, which was when the empire ”came of age” as
later described by the Bank of England.208 Slater wasn’t shy in stating publicly that
it had seemed a waste not to take advantage of the share price increase by buying
firms with SW shares.209 It was therefore, in essence, the reputation of Slater and
expectation of his financial prowess that enabled the empire to grow. This is, in
some sense, not that different from funding through deposits as it is the expectation
of wealth preservation and possible capital appreciation of the funders that allows
the company to embark on its expansion.
The pace at which the funds were put to use is noteworthy. The management
team at Slater Walker consisted of young and ambitious men who were all eager to
prove themselves and move on up in the financial world. The group also had a policy
of paying large fees to brokers in an effort to be the first to know if they heard about
207Information on the group’s financials is retreived from the company’s annual reports.208BEA 6A70/2, P.J. Keogh, d.d. 13/12/71.209The Bank later described ”this sudden burst of activity” as having been made possible mainly
because of ”the glamour rating given to Slater, Walker stock, which, sensing the climate, he [Slater]used to the full”. BEA 6A70/2, P.J. Keogh, d.d. 13/12/71.
154 CHAPTER 4. SIMPLISTIC APPROACHES TO REGULATION
any possible deals. The fact that the management team was so aggressive also meant
that shareholders of companies who wanted to arrange a sale of their company often
came to SW first.
This section briefly expands on this conglomerate period of industrial growth,
starting in 1967 with the purchase of a rubber company by the name of Greengate
& Irwell. Greengate was SW’s largest acquisition to date with a purchase price of 3
mGBP, which was funded with SW shares and loan stock. At year end 1966, SW’s
balance sheet had grown to 8.6 mGBP. The largest part of which was attributable
to 2.9 mGBP of advances, quoted investments of 1.6 mGBP and 1.5 mGBP in cash.
Capital and reserves stood at 2.7 mGBP while debt amounted to 5.1 mGBP.210 There
was thus already at this stage a heavy reliance on borrowed money.211
This is also highlighted in the aforementioned Accountancy article, as well as
the opaqueness of the accounts and the speed with which things had begun to move
within the SW group:
Movements between 31 December 1965 and 31 December 1966 are so
complex that it is difficult to get very far in interpreting them, but a
pattern for the future is beginning to emerge: [...] the use of unsecured
loan stock for acquisitions; the rapid growth in creditors and overdrafts.212
The article is written in 1969, well before any dramatic signs of trouble for SW.
The extensive use of debt and the difficulties in trying to assess the position of the
group by using publicly available information was plain to see for the authors of
the article. This is in stark contrast to the view within the Bank of England - the
210Other items on the liability side included minority interests and tax liabilities.211Appendix 1 shows the organizational structure of the company at this point in time.212Rixson (1969) p. 529.
4.3. THE RISE OF SLATER WALKER 155
entity charged with regulating the banking side of the group in its latter years, as
mentioned below.
The Greengate deal was rapidly followed by deals for the office furniture maker
Constructors and the slipper makers Newman’s Holdings. SW paid 1.1 mGBP for
the two companies and the acquisitions were again funded substantially with SW
shares as well as cash. Another deal of some significance was made a few months
later, in early 1968, when SW acquired Keith Blackman, a ventilation and gas oven
manufacturer. Yet again SW used its own shares to fund the 4.3 mGBP deal but
within three months the firm had been resold for 3.7 mGBP. However, the sale was
made through cash which essentially meant that SW was able to raise cash with its
shares in a discreet way, albeit at a slight discount to the prevailing market price.213
Soon afterwards, SW made what was to be its most important industrial move
when it acquired the window maker Crittall-Hope for 18 mGBP - by far the group’s
largest deal to date. SW had no expertise in window making and Hope (1976) argues
that a large part of the rationale for the purchase was the acquired company’s cash
position. Yet another industrial venture was taken over when SW bought the optician
TWW for 6 mGBP. The last large deal of 1968 was, however, a move that restored
the balance somewhat between the industrial and financial sides of SW. This was
the purchase of Drages - a huge deal for SW, worth approximately 33 mGBP, and
an expansion on the banking side which the Bank in hindsight pinpointed as ”the
climax of this series of operations”.214 A third of the funding came via cash and the
213The use of equity to fund acquisitions was quite common in Britain at the time although itwas steadily declining. Franks et al (1988) find that during the period 1955-1985 66% of completedacquisitions used at least some equity. However, deals financed fully by equity amounted to 25%of all deals. Franks et al also group proportions by period which reveals that pure equity financingwas highest in the five year period 1960-1964 (40%) before gradually declining to 17% in 1985.214BEA 6A70/2, P.J. Keogh, d.d. 13/12/71.
156 CHAPTER 4. SIMPLISTIC APPROACHES TO REGULATION
rest by issue of SW shares.
An attractive feature of the deal, as far as SW was concerned, was that Drages
held about 6 mGBP worth of long-term finance on attractive terms. The most
significant factor of the deal, however, was that with Drages, SW acquired 50% of
its banking subsidiary, Ralli Brothers, which held all the necessary banking licenses.
This was the vehicle with which the banking side was to built in the coming years
under Slater Walker Ltd - not to be confused with Slater Walker Securities Ltd, the
holding company itself.
The term conglomerate was, at this point, still considered a positive one both
in the U.S. and the U.K.215 Often stated efficiency gains that could be obtained
by ”revitalizing” staid assets were thought to be a noble cause and a good enough
reason for existence for the conglomerates. Slater himself defined a conglomerate at
the time as a company which was ”very diverse, highly acquisitive and financially
orientated in their approach”.216
At year end 1968, SW’s consolidated balance sheet had grown to 110 mGBP
- up from 20 mGBP a year earlier. At the same time, profits increased by over
300% so it is hard to compare the company over time - even on a year to year basis.
Table 4.2 provides a condensed view of the firm’s operations at the time. While
the plain leverage ratio hadn’t increased dramatically, and was in fact unchanged at
35%, the absolute increase in debt could have given cause for concern.217 Total debt
215Chandler (1994) provides context to how conglomerates fit into the history of U.S. industry inthe post-war period.216Slater (1977) p. 91. See Jones (1997) on the similarities and differences of British and U.S.
business methods during the period. Tiratsoo and Tomlinson (1997) cover the effect of U.S. businessphilosophy on British industry in the post-war period and the British initial reluctance to adoptthe techniques of the former.217As was mentioned in Chapter 3 of this thesis, the Bank of England was quite frank in acknowl-
edging that the only information it had on most institutions were the infrequent reports posted.This is in line with the available records in the Bank’s archives and the discussion within the Bank
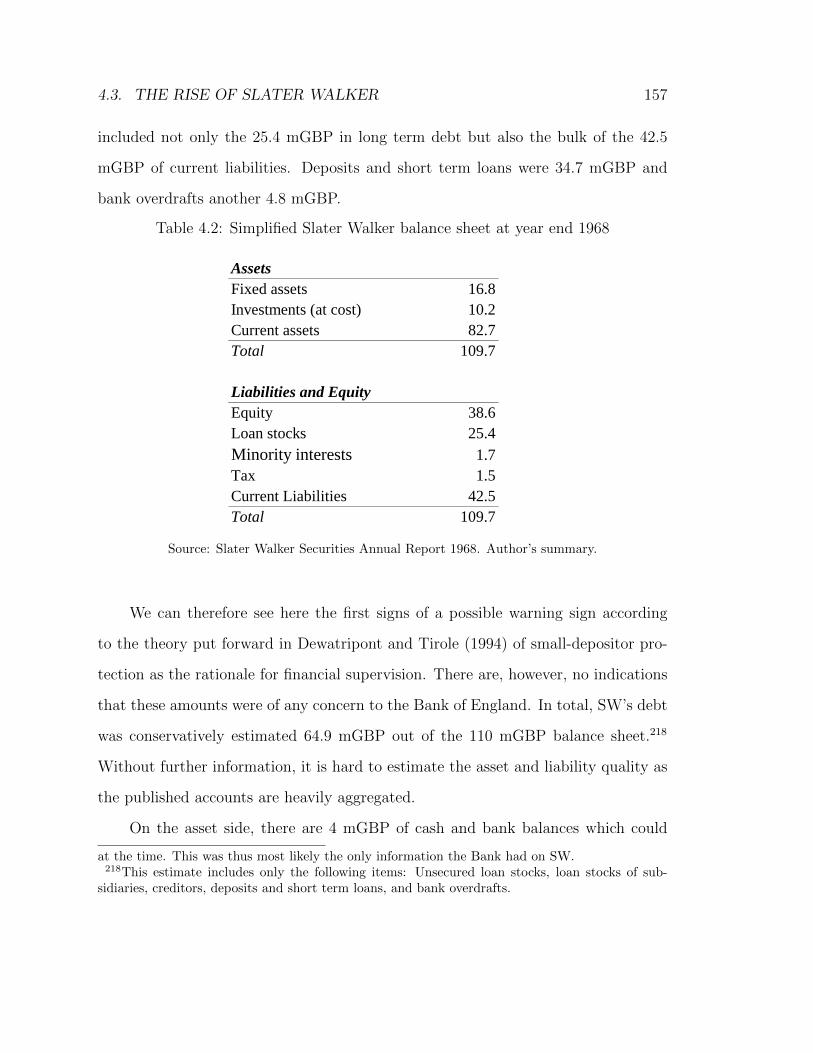
4.3. THE RISE OF SLATER WALKER 157
included not only the 25.4 mGBP in long term debt but also the bulk of the 42.5
mGBP of current liabilities. Deposits and short term loans were 34.7 mGBP and
bank overdrafts another 4.8 mGBP.
Table 4.2: Simplified Slater Walker balance sheet at year end 1968
Assets
Fixed assets 16.8
Investments (at cost) 10.2
Current assets 82.7
Total 109.7
Liabilities and Equity
Equity 38.6
Loan stocks 25.4
Minority interests 1.7
Tax 1.5
Current Liabilities 42.5
Total 109.7
Source: Slater Walker Securities Annual Report 1968. Author’s summary.
We can therefore see here the first signs of a possible warning sign according
to the theory put forward in Dewatripont and Tirole (1994) of small-depositor pro-
tection as the rationale for financial supervision. There are, however, no indications
that these amounts were of any concern to the Bank of England. In total, SW’s debt
was conservatively estimated 64.9 mGBP out of the 110 mGBP balance sheet.218
Without further information, it is hard to estimate the asset and liability quality as
the published accounts are heavily aggregated.
On the asset side, there are 4 mGBP of cash and bank balances which could
at the time. This was thus most likely the only information the Bank had on SW.218This estimate includes only the following items: Unsecured loan stocks, loan stocks of sub-
sidiaries, creditors, deposits and short term loans, and bank overdrafts.
158 CHAPTER 4. SIMPLISTIC APPROACHES TO REGULATION
offset any liquidity need but beyond that it is hard to estimate how readily the firm
could weather investor withdrawal. The bulk of the assets at the time were current
assets but only a small amount therein were listed stocks that could be sold at any
time. Furthermore, the listed positions that the firm generally took were deliberately
small, illiquid stocks which meant that any sudden unwinding could be expected to
come at a substantial loss.
The two largest items under current assets were ”investments” of 19.2 mGBP,
and 50.4 mGBP under ”Debtors, loans and advances”. But as we have seen above,
investments were often majority shareholdings in specific manufacturing companies.
Furthermore, these holdings were frequently purchased above the current market
price in the prospect of increasing the given company’s efficiency which means that
speedy liquidation of assets was again unlikely. The largest item, ”Debtors, loans and
advances” wasn’t itemized but consisted mostly of the banking side of the business
under Slater Walker Ltd. As with any bank, rapid liquidation of the loan book was
nigh on impossible which ultimately gives the final impression that despite SW’s
industrial look, it had enough banking characteristics to make it both vulnerable to
similar kinds of shocks as banks as well as bringing with it the possible threat of
contagion if it were to fail.
However, as discussed in Chapter 3 of this thesis, the Bank of England’s thinking
at the time when it came to regulation was not centred on functions and properties
of specific financial institutions but rather their strict classification, i.e. whether
said institution had the proper licenses.219 In fact, the Bank did not believe that
219In addition to being squarely focused on classification, those institutions which did come underthe radar of the Bank were regulated mainly through qualitative means. As discussed by Row andSaville (1990), supervision placed considerable emphasis on the quality of management. They quotethe Bank of England Quarterly Bulletin saying that interviews with bank management were ”thecornerstone of the Bank’s system of supervision” (Row and Saville (1990) p. 166).
4.3. THE RISE OF SLATER WALKER 159
intervening with and supervising these new, ”fringe” institutions was in any way its
business. Finally, in addition to these warning signs, SW borrowed heavily during
this period not only from domestic investors but abroad as well. This cannot be
confirmed from the published accounts but it was to be a major reason for the
Bank’s later intervention.
As 1969 began, the merger frenzy that accompanied the positive attitude to-
wards conglomerization within the City continued. General market conditions were
relatively favourable at the time with GDP growth gathering pace somewhat al-
though inflation had increased and was hovering around 6%. In February, the Bank
of England increased interest rates by 1% to bring them to 8%, their highest level
for quite some time. SW completed what were to be its last substantial industrial
takeovers later that year; P.B. Cow, another rubber company for 8.5 mGBP, and
Forestal Land Timber & Railway Company for 10.5 mGBP. The year also saw the
takeover of Ralli completed as SW bought the remaining shares in the company.
A big advantage that came with the Ralli acquisition was that it was a ”ready-
made” bank with all the necessary licenses. This included being a so-called ”Schedule
8” bank which placed it quite centrally within the financial system and meant that
it didn’t have to reveal the true extent of its reserves.220 This was a vital point as
”banks which are ”fully authorised” do not grow on trees and are hardly ever for
sale”, as it was put in an Investors’ Chronicle article.221 Indeed, this proved to be
an important point as soon after the Ralli acquisition SW applied for status as an
approved bank by the Building Societies. The application was duly accepted on the
grounds that Ralli had been a ”highly respectable merchant bank” that had retained
220Raw (1977) p.249.221Investors’ Chronicle (1969).
160 CHAPTER 4. SIMPLISTIC APPROACHES TO REGULATION
its ”Schedule 8” status under its former title of Ralli Brothers.222
While generally apprehensive about any takeovers that involved banking li-
censes, the Bank remained passive towards SW’s Ralli takeover. As soon as SW
acquired its main vehicle for accepting traditional public deposits, the only conceiv-
able solution to a potential failure that wouldn’t entail costs for the public was if a
buyer could be found for the bank’s operations. Yet the Bank did not have a certain
framework in mind as to the first response when insolvency loomed. There is indeed
no evidence that contingency planning for a potential failure of the bank formed any
part of the Bank’s framework. Instead, the Bank’s main concern regarding Ralli was
on the monetary policy side and practical issues as to how the Bank should calculate
its lending ceiling from now on.
SW went even further with its plunge into banking a year later when it applied
informally for a Drawing Office, or ”banking account” at the Bank of England.223
This was the next step in moving towards the City’s inner circle but the move was met
with resistance from the Bank. A necessary requirement for approval was not only
that the applicant was to be ”of good repute and that their business was prudently
conducted” but preferably also a member of the Accepting Houses Committee, which
SW was not.224
The fact that SW had acquired banking recognitions ”through the back door”, as
put by the Bank’s staff, also nurtured the Bank’s hesitancy although aforementioned
favourable balance sheet ratios were seen as a positive. In the end, the Bank answered
the informal application with the equally informal reply that SW should delay any
222BEA 6A70/2, R.T.P Hall, d.d. 14/07/70.223Formally, the application was to transfer the dormant banking account that Ralli had held to
the SW banking group which would have the effect of granting SW itself banking status.224BEA 6A70/2, Discount Office, d.d. 11/11/70.
4.3. THE RISE OF SLATER WALKER 161
approach for a ”banking” account for a year or two. Privately, the Bank was of the
opinion that SW would in time be sufficiently established to warrant an account and
the Bank would thus like to be as helpful to them as possible.225
The Ralli acquisition also highlighted another facet of SW’s relationship with
the Bank of England and the extent to which the Bank intervened in the company’s
affairs. SW had intended to drop the Ralli name and incorporate the bank fully
under the SW group. A letter from the Bank of England’s discount office, however,
argued that this would be undesirable and that ”there would be some advantage in
incorporating the name in your own name for a transitional period.” The letter even
goes so far as suggesting a more opportune name which would save SW ”a great deal
of tiresome explanations in the money markets” and be ”highly desirable” from the
Bank’s point of view.
As SW was a fringe bank it was in no position to go against the fatherly figure
of the Bank of England when such a strong opinion was voiced. Indeed, a reply five
days later from Slater himself thanked the Bank for the ”excellent” suggestion which
the company would go by immediately.226 The mere fact that SW representatives
had now opened a dialogue with the Bank of England meant that the group was
slowly but surely becoming an acknowledge brand that would fall within the Bank’s
jurisdiction. The letter also demonstrates the extent to which the Bank was willing
to micromanage the affairs of individual banks if it thought the banks were erring.
225BEA 6A70/2, d.d. 12/2/71.226BEA 6A70/1, d.d. 19/8/69.
162 CHAPTER 4. SIMPLISTIC APPROACHES TO REGULATION
4.3.3 The Move to Banking
The Ralli acquisition had inadvertently provided SW with the opening for the next
phase of the company’s development - the banking phase. Slater had been rethinking
the purpose of the SW group for a while. With conglomerates in the US on the
defensive and SW itself having become very scattered with regard to its holdings,
Slater was ready to alter the company’s strategy.227 The Ralli takeover, which had
been something of a sideshow at the time of the Drages deal, was now seen to be the
vehicle with which to catapult SW into the world of banking. As SW’s share price
had ceased its rapid rise of the prior years, cheap takeovers fuelled by its own shares
also became harder to complete.
The transition to banking from conglomerate was mainly carried out via straight-
forward asset sales and so-called satellites. The latter was a form of asset sale whereby
SW’s holding of a company was sold into a public company in exchange for shares
and/or cash. SW’s stake in many industrial interests thus became indirect with the
appearance of independence. By retaining a significant part of the divested company,
control was still kept and a new CEO was installed - generally a SW man. The affil-
iate would then also become a banking client which further helped the transition to
banking.228 The lines between principal and agent were obviously blurry with such
a structure in place.229
227The Investors’ Chronicle article indeed stated that ”the whole nature of the group has changed,principally because of the acquisition of Drage’s and Ralli. The balance-sheet has become that ofa bank.”228The extent to which the banking side of SW relied on business from satellites and other related
parties could be seen in a piece from the Financial Times on the transition from conglomerate tobanker. The article stated that as Slater realigned himself as a banker, he sought to win business”from any group in need of advice - even if he does not own the company”. The need to state thelatter part of the sentence is telling. Financial Times, ”Men and Matters, Call him banker now”,30/12/69.229As previously stressed, the intention here is not to estimate the extent of potential, and realized,
4.3. THE RISE OF SLATER WALKER 163
The Bank’s absence during this transformation is noticeable. This was in fact
the period whereby SW moved into the Bank’s realm and in some sense became the
Bank’s responsibility. The Bank placed a great deal of emphasis on public deposits,
of which SW now held a considerable amount of, being safe but this did not lead
the Bank to monitor closely new developments or the potential for new parties to
change the existing structure of deposit-taking.
With the withdrawal from industrial holdings underway and a new-found em-
phasis on investment banking, Slater had found what he called the group’s raison
d’etre.230 It was his goal to establish SW as an international investment bank in the
70s and, according to the Financial Times, ”to become to international investing
what he has been to Britain in the 1960s”.231 As Slater himself was quick to point
out, SW ended the sixties as ”the acknowledged growth stock of the decade” and
topped the decade’s ”Growth League” compiled by Management Today.232
Slater’s intention were therefore certainly laid bare for all to see, including the
country’s banking regulator. He mentioned on several occasions the attraction in
Ralli of taking over a bank with all licenses already obtained and his excitement of
escaping the conglomerate tag and replacing it with the banker tag. During this
initial transition, the Bank had become aware of SW and was made fully aware of
these intentions although it did not contemplate the possibility of excluding SW from
banking circles.
A further explanation of the group’s intentions came in a letter sent by Slater
conflict of interest. For a discussion on the extent of such problems see Raw (1977). For our purposeshere, the satellite concepts helps explain the transformation from conglomerate to banking and howbanking clients were attained.230See Slater (1977) p. 119.231Financial Times, ”Men and Matters, Call him banker now”, 30/12/69.232Slater (1977) p.119.
164 CHAPTER 4. SIMPLISTIC APPROACHES TO REGULATION
to the Bank of England in October of that year.233 In the letter, Slater lays out his
intention to grow the banking side after incorporating Ralli into the group and states
four expected developments:
1. To expand positively the existing banking, money market and foreign exchange
activities of Ralli Brothers (Bankers) Limited;
2. to reduce the loans and advances to property companies previously advanced
by Ralli Brothers (Bankers) Limited;
3. to develop the corporate finance activities of the present Slater Walker Limited;
in particular to provide loan facilities to large private and medium size public
companies, especially those companies which look to us for financial advice and
management consultancy services;
4. to continue to develop and expand under the exempt dealership status the
dealing in securities business carried on by the present Slater, Walker Limited
at our Gresham Street office under its Licensed Dealership.
These communications lay bare the extent to which the Bank was made aware
of ongoing and expected developments at individual banks - even fringe banks such
as SW. It was during this time that a line of communication seems to have been
formally opened between the Bank and SW. Several letters were sent back and forth
between the two parties with the purpose of providing the Bank with a thorough
understanding of SW’s intentions regarding its banking business.234
233BEA 6A70/1, J.D. Slater, d.d. 16/10/69.234BEA 6A70/1, letters dated 5/3/69 and onwards.
4.3. THE RISE OF SLATER WALKER 165
The talks had a congenial tone and Bank staff seemed to trust the answers they
got from SW.235 Furthering the positive lines of communication, Slater wrote to the
Bank about his liking the former deputy principal of the Bank’s Discount Office,
John Dudley, and his desire to hire him. Making sure that the formal procedure
was recognized, Slater asked the Bank for permission and to arrange the hire much
like a potential groom to his future father-in-law. During another meeting Keogh
told Slater that he ”thought it was very much in his interest to obtain a named
banker from somewhere.”236 He urged him to ”take nothing but the best” and went
so far as to give examples of specific bankers to hire. On another occasion, the Bank
acted as consultant to SW on the matter of which bank the group should deal with
regarding its own finances. The Bank, again acting as a fatherly adviser, listed the
pros and cons of switching banks as well as what characteristics SW should look for
in a banking partner.237
Another early example of the Bank of England’s interest in and attention to
Slater Walker came earlier in the year following a speech presented by Slater to the
Society of Investment Analysts. The Bank sent three staffers to the event who then
filed a for-the-record retelling of the speech including policy aims, profit sources and
developments of specific SW investments.238 It also listed the entire Q&A session of
the speech and data tables presented by Slater. This part of the Bank’s operations
235At one point, Malcolm Horsman, one of SW’s first hires, thanked James Keogh, principal ofthe Bank’s Discount Office, for sparing the time to have a drink with SW executives following thelatter’s annual general meeting.236BEA 6A70/1, d.d. 12/11/69. These were not the only instances where SW consulted with
the Bank regarding personell issues. At times they even asked whether the Bank thought specificpersons would represent ”a positive step forward in the development of the banking side of ourbusiness”. The Bank thus played a very active role in SW’s business and was kept fully abreast ofminute detail. BEA 6A70/1, J.D. Slater, d.d. 30/10/69.237BEA 6A70/2, d.d. 15/10/70.238BEA 6A70/1, d.d. 3/3/69.
166 CHAPTER 4. SIMPLISTIC APPROACHES TO REGULATION
was thus similar to a modern bank’s research department, gathering and analyzing
public information in an attempt to evaluate the business’s operation.
Amongst the main topics of discussion at the time between SW and the Bank
was the management of the SW subsidiary General Guarantee Corporation which had
recently sold its hire purchase interests. The question was subsequently what lending
ceiling should apply to it and how it should be categorized.239 One possibility was
to remove the corporation’s 123 certificate. This certificate was the official stamp of
approval that allowed companies to act and present themselves as secondary banks.
A reservation was made in discussion within the Bank that it should not allow
the 123 certificate to become a ”marketable asset”. The license had in fact been
estimated to be worth £40,000 which put the Bank in a delicate position whenever
an acquisition of any license holders took place. This put the Bank in the position
of having to judge who was worthy of a license as the license evidently entailed a
substantial advantage in terms of attracting funding.
Coverage in the media was intense as ever and talk had already begun of Slater’s
”empire”. A two part special in the Investor Chronicle opened with the statement
that even if SW were to go into immediate liquidation, Slater’s place in British
business history was already assured due to him ”having regenerated and enhanced
the holding company idea in this country”.240 The gushing profile went on to add
that ” [...] Short of having played World Cup football for England, it is hard to think
where he has ”missed out” en route to the top. It all reads like a tract from Boys’
Own”.
239The lending ceiling was a monetary policy tool used by the Bank of England as an attempt tocontrol credit. At issue was whether to continue with the 98% ceiling or 102%. See Chapter 2 forthe framework of monetary policy during the period.240Investors’ Chronicle (1969).
4.3. THE RISE OF SLATER WALKER 167
When the 1969 results were published in April of 1970, the reception was fairly
positive and focused on the transition to banking. Slater further laid out the future
prospects in the annual report, saying that there was substantial scope for higher
profits on the banking, investment and insurance side. There were, however, no plans
for any major acquisitions. Net profits for the year amounted to 6.2 mGBP while
the balance sheet had grown during the year by some 43%, from 110 mGBP to 157
mGBP. The equity ratio had fallen somewhat, from 35% to 29%, as borrowing had
exceeded the increase in capital with the largest funding increase, by far, coming
from creditors, deposits and short term loans. This was partially offset on the asset
side by an increase in cash but all in all there was still a substantial increase in
maturity transformation.
This maturity transformation further increased the vulnerabilities that the group
faced. A sudden negative shock to the system was liable to induce deposit withdrawal
as short-term funding flew to safety. As SW moved further into banking, the danger
of a bank-like run therefore increased. This was particularly the case for unconven-
tional and new banks, such as SW, since they did not have access to traditional
central bank funding at times of illiquidity.241 SW was thus increasingly vulnerable
on two fronts; creditors, especially depositors, were more likely to withdraw funds
from less traditional banks and when such deposit flight occurred, the probability of
assistance was lower.
While vulnerabilities were increasing somewhat, it can be argued that SW
was doing a relatively better job than others of maintaining liquidity. Indeed, the
241While such funding could possibly be forthcoming in certain instances, it is safe to assume thatthe assurance wasn’t in place. Furthermore, it is highly questionable that institutions exhibitingsuch rapid growth as SW was had developed liquidity management systems to the extent as saythe Big Four had.
168 CHAPTER 4. SIMPLISTIC APPROACHES TO REGULATION
Economist praised the group’s cash position at the time, saying that the ”accounts
[...] reveal the company’s strong liquid position [...] During 1969, Slater Walker’s
talisman was its 25mn cash.”242 The group was thus thought to have a keener eye
on its liquidity position than many others but the coverage at the time did not men-
tion that even greater than the proportional cash increase was the increase in loan
volume.
What was mentioned was by how much current assets exceeded current liabilities
- a common way of looking at ratios at the time. This was considered to be a
barometer of how readily a company, or bank, could tackle a temporary liquidity
dry-up. For SW, current assets did indeed exceed current liabilities by a sizable 42
mGBP but the vast bulk of current assets consisted of debtors, loans and advances.
While these loans must have had a maturity of less than a year to qualify as current
assets, it is completely unclear - even unlikely - whether such assets could be redeemed
with the speed required if deposit withdrawals started gathering pace.
Additionally, it cannot be determined whether these were current assets in the
economic sense. While a loan maturing in under 12 months certainly qualifies as a
current asset in an accounting sense, there could be an implicit agreement between
the lender, SW, and the borrower that the loan will be rolled over when it matures
with little thought given by the lender as to repayment. As mentioned in various
places in this chapter, SW’s closeness to many of its debtors, e.g. through the
satellite concept, increased the likelihood that the debtor’s problems could not be
distinguished from SW’s problems.
Therefore, if any of the satellites were to run into difficulties during a downturn,
it could certainly be argued that since SW had funded a substantial part of the
242The Economist, ”Sold Jim Short?”, 2/5/70.
4.3. THE RISE OF SLATER WALKER 169
satellite’s operations, SW could not easily withdraw its funds as this could prove
lethal to the satellite with potential additional contagion effects to other satellites.
This is an example of problems arising from the so-called entity concept in
accounting whereby the true relationship between two seemingly disparate parties
becomes one of a single party as trouble arises.243 Two well-known examples of
this entity problem can be found during the recent financial crisis. The first is
the use of off balance sheet liabilities, so called SIVs and SPVs, that were taken
onto banks’ balance sheets when the SPVs experienced liquidity and solvency issues.
The seemingly independent entity thus became dependent on the host bank, see
Brunnermeier (2009).244
Another comparable example is the morphing of bank and sovereign risk. This
was for example the case for separate Icelandic banks during the recent crisis whereby
each bank ceased to be a standalone risk and instead there originated an ”Icelandic
risk” as the expectation was that a failure by one bank would through contagion
such as counterparty exposure lead to the collapse of other domestic banks.245 It can
also be argued that this was the case for many periphery European countries during
the Eurozone crisis.246
The SW satellites exhibited this same property of seeming independent while
still being connected to the host. This vulnerability would have been very hard
to gauge in real-time but for anyone tasked with ascertaining the soundness of a
bank’s finances would have needed to look into the genuine, as opposed to stated,
243See Husband (1954) for an early discussion of the concept. For a more recent discussion seeIASB (2010) and FASB (2008).244See also Papanikolaoua and Wolff (2013) who explore the interplay between on- and off-balance
sheet leverage in the recent global financial crisis.245For a more detailed explanation of this process, see Benediksdottir et al (2010) and Danielsson
and Zoega (2009).246On this issue, see e.g. Acharya et al (2011).
170 CHAPTER 4. SIMPLISTIC APPROACHES TO REGULATION
independence of various, related entities.247 In addition to the entity problem, The
Economist went on to reveal an additional, related weakness:
In an active investment group like Slater Walker however it is difficult
to be precise about something like a cash figure. It is entirely possible that
much of the 15m has been invested in short term dealing situations, and
the reassurance, in today’s bear markets, of all that money sitting safely
on deposit cannot necessarily be taken for granted.248,249
Issues such as these did not, however, figure heavily in the media and investor
coverage and issues of liquidity, related parties and potential runs were not a high
priority on Slater’s mind at the time, nor the general investor’s for that matter. The
coverage at the time continued to be more focused on the more general transition from
conglomerate to banking. The Times christened this process ”turning respectable”
while the Economist stated that the role had ”shifted not a little, away from industry,
to finance and investment [...] the 1969 Slater Walker results reflect the changing
emphasis, with 6.1m coming in from investment banking against 4.6m from the
industrial side before head office expenses”.250,251
The Bank of England meanwhile was unsure about the nature of the accounts
and what to make of them. ”At first glance this does not much look like a mer-
chant bank’s balance sheet” was the view offered within the Bank upon seeing the
accounts.252 Despite having established regular dialogue with the company itself, the
247This function is commonly referred to as stress-testing in modern regulation and has come tosignify a large portion of regulators regular investigations.248The Economist, ”Sold Jim Short?”, 2/5/70.249This argument is similar in structure to recent research on safe assets and information sensi-
tivity, see for example Gorton (2010).250The Times, ”Slater’s first half earnings slow”, 8/8/70.251The Economist, ”Changing camps”, 11/4/70.252BEA 6A70/1, d.d. 16/10/69.
4.3. THE RISE OF SLATER WALKER 171
Bank was looking at the holding company’s accounts as it was, remarkably, unaware
at this point of the distinction between the holding company, SWS, and the banking
subsidiary, SW Ltd.
The Bank went on to criticize the accounts, stating that a stock item and over-
drafts were not fitting for a bank’s balance sheet. It was also unhappy with the lack
of detail in the accounts, singling out investments saying they had ”no way of know-
ing the types of securities in the figures”. The analysis concludes with a comparison
of ratios between SW and comparable banks. The ratios calculated were quick assets
to deposits and free resources to total liabilities. SW came in first place in the former
and second place in the latter, out of five allegedly comparable banks.253 The num-
bers, despite being taken from the SWS accounts and thus not at all comparable,
therefore gave the Bank superficial reassurance that the banking business of SW was
not only steady but also, if anything, ahead of its competitors.
Apart from SW’s strategic realignment, much of the attention at the time fo-
cused on the realization that the growth rate of previous years could not continue.
Despite these reservations, the following months featured a sizable increase in the
number of satellites and the banking side also continued to grow as local branches
were set up across the country.
By the end of 1970, the only remaining major industrial interests were the
rubber manufacturer Crittall-Hope and the textile company Phillips Brocklehurst.
Despite the earlier predictions that the group couldn’t keep growing at such a rapid
pace, when the 1970 results came in it turned out that the balance sheet had grown
another 16%. While certainly not as exaggerated as prior growth, this was a non-
253Ibid. The other banks used for the comparison were Hill Samuel, Samuel Montagu, Schroderand Warburg. All banks that were more established and ingrained into the City environment.
172 CHAPTER 4. SIMPLISTIC APPROACHES TO REGULATION
trivial expansion for a company in the transition towards becoming a bank. The
chairman’s statement - always a highlight of the results and covered extensively in
the media - was strictly positive, highlighting the banking side’s contribution to
profits especially in light of the testing market conditions during the year. However,
the growth on the liability side once more came primarily from short term borrowing
while the asset side growth was far less liquid.
In fact, out of a 25 mGBP increase in the balance sheet, short term lending
and deposits accounted for 16 mGBP. As for the assets, half of the increase was
due to loans which were not disaggregated further in the accounts. The bulk of the
remaining growth was in domestic and foreign equities. As previously mentioned,
while equities are a potentially liquid asset category, the specific equities that Slater
preferred were small-cap and generally large holdings. Slater himself said that
it made more sense to build up significant shareholdings than to dis-
sipate funds over a wide range of companies. The underlying principle
was that it would be better to have ten shareholdings of 9 per cent than
ninety shareholdings of 1 per cent. The reason for this wasthat a 9 per
cent shareholding carried with it a measure of influence.254
While this argument certainly has some logic and is not unheard of, this advan-
tage of influence came at the cost of diminished liquidity - especially when dealing
with smaller, listed firms. Slater would later concede to this point having witnessed
first-hand the adverse effects of holding illiquid positions.
Upon receiving the company’s annual report, the Bank’s analysts deemed 1970
to have been a very good year for SW. The balance sheet raised some issues however,
254Slater (1977) p.191.
4.3. THE RISE OF SLATER WALKER 173
especially the liquidity ratios which were satisfactory until one remembers that a
third of total deposits were group deposits. This goes back to the principal-agent
issue mentioned above and was a slight cause of concern for the Bank.255
By early 1971, however, Slater himself had become worried about the number
of satellite companies and how scattered they had become. The satellites are quite
relevant to the purpose of this chapter as their structure represented an indirect and
somewhat contingent liability which seemed separate to the group itself in normal
times but was revealed to be connected to SW when trouble arose. An example of a
somewhat successful satellite, Cornwall Properties, illustrates this effect.
SW had bought a 40% stake in Cornwall in 1970 through the banking sub-
sidiary.256 To spin-off the holding from its balance sheet, SW agreed to lend one of
its own executives personally the amount needed to purchase the shares from SW.
In turn, Cornwall purchased for shares one of SW’s minor subsidiaries. Cornwall
then purchased several other companies in various industries, including fertilizers
and seeds as well as property, with much of the funding being underwritten by SW.
The market capitalization of Cornwall, at the time of the spin-off, was approximately
1 mGBP but its subsequent purchases, and rise in equity prices, led to a market cap
of 30 mGBP by the end of the year.
SW’s direct and indirect exposure to Cornwall at any given point would be hard
to estimate even if the necessary data was available. What can be said however is
that by underwriting purchases that vastly exceeded the borrowing firm’s prior size
as well as lending the equity stake SW had exposed itself further than a traditional
255BEA 6A70/2, d.d. 18/5/71.256The offer, made on May 7th 1970, came amidst a number of similar offers made by SW and
affiliated companies during the period. The Cornwall offer was followed with an offer for anotherproperty company, Sterling Land Co Ltd, three months later, also by the banking subsidiary.Source: London Metropolitan Archives CLC/B/127/MS29333/088.
174 CHAPTER 4. SIMPLISTIC APPROACHES TO REGULATION
bank which partially finances an expansion of an unrelated business. This point
was made clearly in The Sunday Telegraph in late 1971. While noting the apparent
success that the SW satellites had enjoyed thus far, Patrick Hutber, warned that ”It
is also true that Slater is not yet apparently in a position to be able to afford to let
a satellite fail. If one falters [...] there is no alternative but for the head office team
to move in, take over and sort it out.”257
Slater himself seems to have worried more about the satellites in general, as op-
posed to this specific entity aspect, and whether they were too diverse and numerous
to manage. Despite these worries, the SW empire continued to expand rapidly. The
Bank took notice of the fact that deposits from outside the banking group increased
by 143% to 88 mGBP during the year but noted bullishly that the group was still
”very well placed to expand further”.258
Later that year the group announced a new investment trust, appropriately
called Slater Walker Investment Trust (SWIT). The trust had the effect of increasing
the group’s assets under management by 20% in addition to increasing substantially
the group’s management fees. Therefore, while the transition phase was well under
way and there was talk of simplifying and removing industrial interests, there were
no signs of shrinking the group or even consolidating the balance sheet to any extent.
The Bank of England meanwhile continued to monitor SW’s operations closely,
if somewhat informally. A six page biography on Slater was compiled for the Bank
which detailed his education, business ventures and personality. It even goes so far
as to describe in detail his character traits and listing his hobbies and activities.
Slater is for example said to have a ”puckish sense of humour and an apparently
257As quoted by Slater (1977) p.153.258BEA 6A70/2, d.d. 12/5/72.
4.3. THE RISE OF SLATER WALKER 175
easy manner with people in all walks of life”.259
It is hard to establish who the intended reader of the biography is but it reads
as if to serve as a background file for any Bank staffer who was to communicate with
Slater. For example, a copy was to that effect sent to the Governor a couple of years
later, prior to a meeting with Slater.260 It was, according to the biography, too early
to pass judgement on Slater as a merchant banker but he is said to have ”increased
the quality” of Ralli ”out of all recognition” since he took it over. It is hard to see
how such a view was made in light of the limited data that the Bank was working
with.
The assertion was also made that his recent triumphs led to his words and actions
being ”enveloped in a new and well-deserved aura of respectability.” Furthermore,
due to SW’s rapid activity in takeovers and mergers, the ”advice team”, or corporate
finance team, is said to be as good as any in the City. While the language was
more restrained than that of the general media, Slater’s reputation was obviously
rubbing off on people within the Bank who generally had a much more conservative
vocabulary than the media.261
The Bank held regular meetings SW’s executives, mostly with John Ford, SW’s
financial director, following which reports were filed for senior Bank officials. These
reports detailed the amount of deposits that the banking arm of SW held at any
given time and the breakdown of deposits into currencies. The reports also listed
the proportions of the items on the asset side of the balance sheet. These reports
259BEA 6A70/2, P.J. Keogh, d.d. 13/12/71.260BEA 6A70/3, R.D. Galpin, d.d. 27/4/73.261This stands in sharp contrast to the Bank’s thoughts following its rescue program. By then
the mood towards Slater had changed dramatically and the Bank was now of the view that ”underSlater, Slater Walker Securities was a one-man band with its affairs in such a tangled skein thatit was virtually impossible for anyone to tell the true position of the group and of each separatesubsidiary.” BEA 6A70/18, d.d. 4/12/75.
176 CHAPTER 4. SIMPLISTIC APPROACHES TO REGULATION
show no immediate rise of concern during the early 1970s although the analysis was
quite superficial. Little attention was given to asset quality or stress testing of any
form which left the Bank’s overview incomplete and over-reliant on aggregated, low
frequency data on the one hand and the staff’s opinion of SW’s executive team’s
character on the other.
The positive view within the Bank at this point was reflected in October when
SW was officially granted permission by the Bank’s Exchange Control to issue, with-
out limit, negotiable Certificates of Deposit denominated in sterling. The group was
also given permission to issue Certificates of Deposit in U.S. dollars, subject to the
condition that the C.D.s had a maturity of less than five years. This was another
boost to SW’s credibility and a further step towards becoming part of the financial
system proper.
The proceeds of these and other fundraisings in the start of the decade went
primarily towards property developments. The British property market was expe-
riencing the rapid rise which would eventually place it at centre stage during the
secondary banking crisis itself and SW played full part in the housing mania.262 Fig-
ure 4.4 shows that real house prices had been drifting upwards for a long time and
then took of rapidly after 1970 before correcting following the crisis. This dramatic
rise is despite the sizeable rise in inflation, meaning that in nominal terms - which is
of course how banks’ balance sheets are measured - house prices rose astronomically.
Funding for such projects thus came easily at the time and especially so to SW.
As documented by Slater:
Credit was easy to obtain and in particular we could borrow dollars ap-
parently very cheaply on a medium-term basis. Our expansion in property,
262On the property aspect of the secondary banking crisis, see Reid (1982).
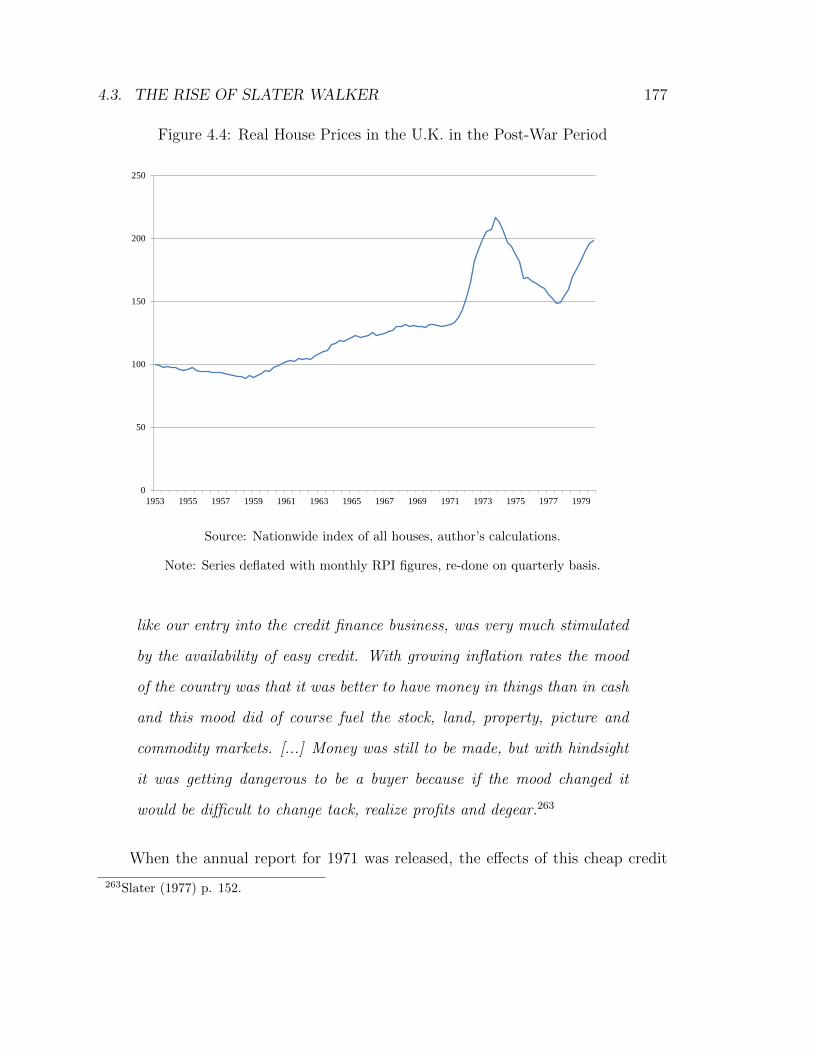
4.3. THE RISE OF SLATER WALKER 177
Figure 4.4: Real House Prices in the U.K. in the Post-War Period
0
50
100
150
200
250
1953 1955 1957 1959 1961 1963 1965 1967 1969 1971 1973 1975 1977 1979
Source: Nationwide index of all houses, author’s calculations.
Note: Series deflated with monthly RPI figures, re-done on quarterly basis.
like our entry into the credit finance business, was very much stimulated
by the availability of easy credit. With growing inflation rates the mood
of the country was that it was better to have money in things than in cash
and this mood did of course fuel the stock, land, property, picture and
commodity markets. [...] Money was still to be made, but with hindsight
it was getting dangerous to be a buyer because if the mood changed it
would be difficult to change tack, realize profits and degear.263
When the annual report for 1971 was released, the effects of this cheap credit
263Slater (1977) p. 152.
178 CHAPTER 4. SIMPLISTIC APPROACHES TO REGULATION
could readily be seen. The group as a whole, SWS Ltd, had grown by over 50%
while growth on the banking side, SW Ltd, was almost 80% with profits well above
prior expectations.264 While the leverage ratio hadn’t increased much, total lending
had.265 The group now had over 200 mGBP of debt and a large part of it arose
from short-term borrowings which bore substantial rollover risk in case of a business
cycle downturn.266 The chairman’s statement was very optimistic, highlighting the
extremely healthy cash position, the strong management team and excellent growth
prospects.267
The transition to banking was also apparent in the accounts as 70% of the
group’s profits were due to the finance, investment and insurance side - the rest from
commercial and industrial holdings. The banking side was now bringing in a profit of
2 mGBP as opposed to just over half a million the year before. With such a rapidly
changing balance sheet, traditional ratios said relatively little about the true state of
the bank. Its return on equity was an astronomical 49% and return on assets were
4%.268 This fact did not go unnoticed at the Bank of England who, as previously
mentioned, looked at these exact ratios when monitoring potential outliers and the
state of various banks.
Another core property of the group is the bank’s dividends which were very high
right up to the crisis, as seen in Figure 4.5. The average yearly payout ratio from
264Slater Walker Limited Report and Accounts 1971.265As there were no share offerings during the year, the increase in equity that accompanied the
increasing debt came purely from undistributed profits. These profits were not itemized fully but asubstantial part of them arose from capital appreciation which awoke questions of earnings quality.266Out of the 97 mGBP increase in the balance sheet, over 50 mGBP was in the ”Creditors,
deposits and short term loans” section. Bank overdrafts and unsecured loan stocks accounted foranother 16 mGBP.267Slater Walker Securities Reports and Accounts 1971; Chairman’s Statement.268It was a marginally lower 45% when using year end equity in the denominator as opposed to
the average during the year.
4.3. THE RISE OF SLATER WALKER 179
1969 to 1974 was 73.6% and never dipped below 60%. The bank’s equity ratio thus
struggled to increase and stood at this point, at year end 1971, at 9% (down from
13.4% a year earlier). Furthermore, there was no oversight regarding the relationship
between earnings quality and dividend payments. The accounts do not detail what
proportion of profits was realized capital gains and what portion was unrealized
increases in asset value. If the latter accounted for more than the retained earnings,
public deposits, and other forms of debt, were in effect being used to pay dividends.
Slater himself held a substantial amount of shares, as mentioned elsewhere. In
1968, his holdings amounted to 800,000 shares and were to reach over 1.3 million
a few years later (although he was quite active in the market for SW shares, both
selling and buying). This amounted to roughly 5% of total shares outstanding with
other directors owning much less. It is, however, impossible to calculate his indirect
holdings, held through companies, as the full list of shareholders is not avalaible.269
Arguably the most important item on the bank’s balance sheet, from the stand-
point of financial stability and the eventual need to provide public assistance, was
the item labelled ”current, deposit and other accounts”. This item was effectively
the part of the balance sheet that the Bank of England sought to safeguard during
the crisis. It included public deposits that the bank had raised and would ultimately
be considered a category that the bank could not be allowed to default on.
The category had grown from 36 mGBP to 86 mGBP during the year but did not
figure exclusively in the Bank of England’s discussions. In fact, SW’s growth during
the year had in some sense exclusively been funded by deposits as their increase
exceeded the balance sheet’s total growth.270 Nonetheless, the Bank continued its
269His personal portion of the 1970 dividend would, for example, have amounted to approximately80,000 GBP according to Raw (1977).270There was a decrease in the item ’group companies’ which meant that deposit growth amounted
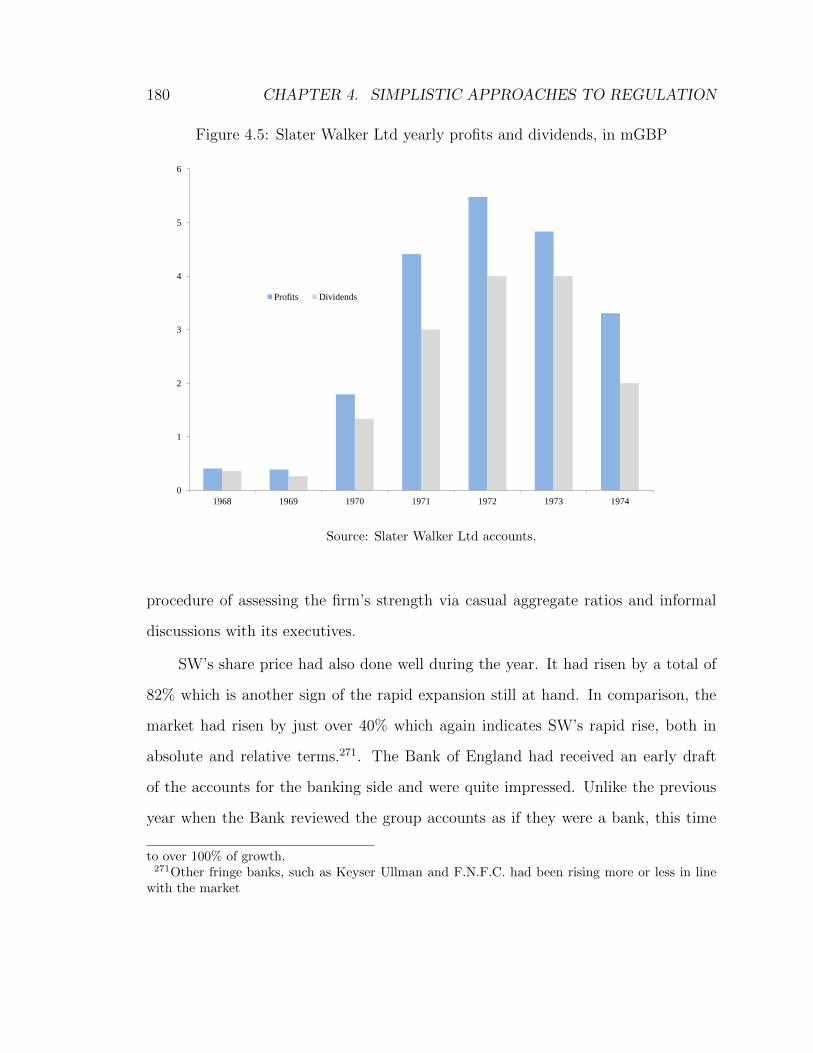
180 CHAPTER 4. SIMPLISTIC APPROACHES TO REGULATION
Figure 4.5: Slater Walker Ltd yearly profits and dividends, in mGBP
0
1
2
3
4
5
6
1968 1969 1970 1971 1972 1973 1974
Profits Dividends
Source: Slater Walker Ltd accounts.
procedure of assessing the firm’s strength via casual aggregate ratios and informal
discussions with its executives.
SW’s share price had also done well during the year. It had risen by a total of
82% which is another sign of the rapid expansion still at hand. In comparison, the
market had risen by just over 40% which again indicates SW’s rapid rise, both in
absolute and relative terms.271. The Bank of England had received an early draft
of the accounts for the banking side and were quite impressed. Unlike the previous
year when the Bank reviewed the group accounts as if they were a bank, this time
to over 100% of growth.271Other fringe banks, such as Keyser Ullman and F.N.F.C. had been rising more or less in line
with the market
4.3. THE RISE OF SLATER WALKER 181
they were relieved to see that the balance sheet had ”as purely a banking look as is
possible”.272
The Bank also approved of the composition of the balance sheet, this time cal-
culating the same ratios as the year before but for the actual banking side. Free
resources to public liabilities and liquid assets to public liabilities revealed a ”pow-
erful” capital position although a slight dig crept in when noting that netting out
intra-group positions made all ratios look better and gave SW the ”appearance of
being less of a group washing machine”.273 In the aftermath of the crisis, these
intra-group positions were to be cited as one of the main factors of SW’s downfall.274
1972 was to be the year in which the SW empire was at its peak. The group’s
share price reached its all time high of 412p on May 1 and funding came with relative
ease.275 It was also at this time that the Telegraph’s City Editor Kenneth Fleet
coined the popular term ”Slater Walker government” which referred to the Heath
government’s approval of the ongoing developments within the financial system in
general and SW in particular.276 The new focus on efficiency and finance within the
British economy was lauded and SW was used as a prime example of the way ahead.
In the first half of the year the growth of the group showed no signs of abating.
10 mGBP was raised in long-term borrowing early in the year and a further 15 mGBP
by issuing Sterling/Deutschemark bonds and convertible dollar loan stock. The latter
272BEA 6A70/1, Discount Office, d.d. 24/4/70.273Ibid.274See especially the discussion of the accountants’ report below.275In its annual City Growth League, which SW topped yet again, Management Today reflected
that the group’s performance ”again confirms the unassailable lead which the Slater operation hasestablished in perfecting its peculiar financial art form”, as quoted by Slater (1977) p. 168.276The context of the term was the developing ’New Toryism’ whereby financiers such as Slater
were seen as the future of the British economy. The term was also a reference to Walker’s dualrole in SW and the Conservative Party. For more on this relationship see Blackhurst (1996) andKynaston (2001) p. 453.
182 CHAPTER 4. SIMPLISTIC APPROACHES TO REGULATION
was raised to finance investments in listed shares in several European countries. The
emphasis on foreign funding continued with a further 50 mCHF and 60 mNLG raised
in July. This was a clear sign that despite worries - both internal and external - about
the feverish investment environment and the need for prudence, SW saw no reason
to slow down at this point. The group also advertised aggressively locally. One
advertisment stated that it didn’t matter whether an investor had £300, £30,000
or £3,000,000 - they could take advantage of the group’s investment management
services.277.
So while Slater reasoned that he had become ”bearish about the market” he
also acknowledged that the group was still ”borrowing money long term to invest in
property and to expand our banking and overseas interests”. To that end, SW was,
according to Slater, ”like everyone else in banking at that time, [...] busy actively
seeking opportunities to lend more money”.278 In fact, Slater envisioned that within
10 years the market capitalization of the group would have grown from the current
200 mGBP to 1,000 mGBP. At this point, Slater believed that SW would own ”a
significant percentage of every major asset situation in Britain” and well on its way
to achieving his ultimate objective of becoming the biggest investment bank in the
world.279,280
By now, the general consensus was that SW’s business was that of an interna-
tional investment bank. This tag did not have a formal definition as in the current
parlance but was considered different than the traditional merchant bank of the
277The Financial Times, 01/24/1972 p.5278Slater (1977) p. 160.279Raw (1977) p.306.280The Sunday Telegraph, ”How Slater Succeeded in Spite of Himself”, January 23rd. Following
this revelation of his ultimate objective, Slater added that ”It’s like a knife and butter, and we’rethe knife.”
4.3. THE RISE OF SLATER WALKER 183
time. It was generally seen as a catchall phrase for a new kind of bank which, in
current terms, can best be seen as a mixture of private equity, proprietary trading
and corporate finance.281
While Slater’s autobiography is written with the benefit of hindsight, his take
on developments during this crucial period is noteworthy. As previously mentioned,
credit remained plentiful but there were problems brewing in the property sector and
the start of the secondary banking crisis was just around the corner. Slater came to
regret SW’s policy during this period:
we had taken on two new senior banking executives to help us extend
the purely commercial side of our banking business: one to concentrate
on building up the branch network and deposit getting, the other to ex-
pand our loan book. This policy was a cardinal error on my part because
the pure lending of money is a highly professional business. It is quite
different in investment banking, where in parallel to a commercial loan
one is also taking an equity stake, on which the upside potential could be
very considerable. In pure lending the upside potential is only the ’turn’
on the interest receivable, less the cost of borrowing plus overheads, which
in our case probably worked out at about 2 per cent per annum. Bearing
in mind that the downside risk on any loan is 100 per cent the odds were
substantially against our being successful, especially as we were going with
the crowd and actively competing for business.282
The passage paints a somewhat naive picture of banking and the structure
of finance. SW was going into banking full steam ahead during these years but
281See Slater (1977) p. 162 and Channon (1977) p. 70. These characteristics are most in line withwhat is now termed a universal bank.282Slater (1977) p.161.
184 CHAPTER 4. SIMPLISTIC APPROACHES TO REGULATION
its architect seems to have only thought about the inner mechanics of commercial
banking following the crisis. The well-known problem of newcomers attracting riskier
customers than traditional, incumbent banks did not register with Slater. The Bank
of England’s stand-off approach during this period is noteworthy, especially in light
of the heavy emphasis the Bank placed on suitable personalities for bank executives
when thinking of its attitude towards individual financial institutions.283
With the rapid growth of the firm and its successful move into banking, SW had
become disinterested in handling individual’s small portfolios. It had instead built
up positions in unit trusts, insurance bonds and investment trusts. It had hence
become, in addition to something close to an investment bank, a traditional asset
manager with some 250 mGBP under management in 1972. An important part of
the asset management side was the so-called annuity business which was linked to
insurance bonds. This vehicle came to be seen as an alternative to building society
deposits which were regarded as a safe place to store ones savings. SW was able to
offer considerably higher interest rates on these bonds, attracting a lot of de facto
deposits, and thus increasing the systemic risk of the group as a whole from the
standpoint of its regulators.
At the same time as these funds were being raised, sentiment was starting to turn
on various aspects of the financial sector that directly related to SW’s operations.
This included criticism of the satellite concept, so-called ”warehousing” where a fee
is paid to an institution for holding one’s assets, as well as the merger and acquisition
frenzy in general. There was also increasing scepticism around the value of many
takeovers and the mantra of increasing efficiency.284 Setting free deadwood industrial
283This point is highlighted in the discussions within the Bank regarding executives of supervisedinstitutions. See for example the description of both Slater and Goldsmith elsewhere in this chapter.284The more cut-throat approach to business which was gradually gaining a foothold in Britain
4.3. THE RISE OF SLATER WALKER 185
companies was no longer considered a sufficient rationale to convince investors and
the media of a deal’s worth.
One of the most scathing criticisms came in a Sunday Times article in the
middle of the year.285 The article lays bare the extent of dealings in the satellites
attributable to SW itself. Concerns were also raised on the price formation of listed
shares whereby a large shareholder is active in dealings of a relatively illiquid stock.
The article caused enough commotion for SW’s Ford to write to the Bank about
it, listing the article’s various shortcomings and misrepresentations.286 No evidence
exists of the Bank either discussing the merits of the article or replying to Ford on
its substance.
Amid the increasing negativity, the 1972 results looked on paper to be business
as usual. While the coverage following the publication of the results focused on the
income statement and the 28% profit increase, the balance sheet showed yet another
year of extraordinary growth. The group’s assets had grown almost 70% during the
year and stood at 469 mGBP at year end. This turned out to be the largest absolute
growth that the group would witness. Once again, the growth was primarily achieved
through short term borrowing and deposit increases which amounted to 92 mGBP.
The banking arm exhibited even more exaggerated growth than the group itself
with the balance sheet ballooning 96%. Short term deposits at the bank doubled
was quite controversial. Some, however, argued for a link between this increased focus on efficiency,primarily via factory closures and layoffs, and the upsurge in productivity in the 1980s. Muellbauer(1986) provides an overview of the competing explanations for the growth in productivity. Oulton(2000), looking at the period from 1973 to 1989, argues that closures of branches or companies werenot the reason for increased productivity. Instead, firms where employment fell were responsiblefor the greatest part of the productivity growth.285Sunday Times, ”Seven Days in the Life of Jim Slater”, 7/5/72.286BEA 6A70/2, J. Ford, d.d. 12/6/72. The article, and others like it, were also seen to be
amongst the reasons for the reorientation of the group and cancellation of certain ventures such asthe Brazilian branch of SW, BEA 6A70/3, W.J. Hall, d.d. 18/7/73.
186 CHAPTER 4. SIMPLISTIC APPROACHES TO REGULATION
as the bank aimed to substantially grow its commercial banking activities and the
equity ratio dropped to 7%.287 Bearing in mind that it was in terms of the absolute
amount of SW liabilities that the Bank of England stood in line to guarantee if
the group needed saving, there was remarkably little discussion within the Bank
on SW’s increased holding of public savings. One of the primary reasons for this
indifference seems to have been the large proportion of funds that went into money-
market investments. This, according to the Bank, kept the group very liquid and
served to subdue concerns about the bank’s operations.
The Bank was, however, a little concerned about profits and the unusually high
profit ratios that the banking side achieved. Bank staff calculated both the return on
capital and the return on total funds to produce the following table of comparison.
Table 4.3: Bank of England Comparison Report - Year End 1972
SW Barings Kleinworts Morgans
Pre-tax profits (mGBP) 11.9 4.6 13.2 3.2
Return on Capital 90% 30% 38% 27%
Return on Total Funds 6% 2% 2% 1%
Source: Bank of England Archives 6A70/3, document dated 4/7/73.
While the disparity is most striking in the return on capital, it was the return on
funds that perplexed the Bank the most. Accompanying this table was the analysis
that
[...] it is virtually unknown for any listed bank to achieve a higher
margin than 2.5% on its total funds (cf. Cedar Holdings which reaches
3.4%). Usually a high figure indicates a large proportion of profits from
287Slater Walker Limited Reports and Accounts 1972; Chairman’s Statement.
4.3. THE RISE OF SLATER WALKER 187
non-banking activities. More than half of Slater, Walker’s funds are in-
vested in money-market assets on which the margins are probably very
slim. How then do they achieve their 5.6% margin? 288
Noting that SW were at the time principal merchant bankers to only 14 compa-
nies, the Bank could think of only two possible origins for the profits; fees from other
companies within the SW empire and dealing in securities. The Bank was evidently
becoming, if not worried, then a tad unsure about SW’s operations. While never
connecting the dots between its own zero-tolerance policy for public deposit losses
on the one hand and the foggy nature of SW’s business on the other, the Bank did
question the published numbers and notice the difference between SW’s ratios and
those of other merchant banks. As the Bank was by nature very conservative and
traditional, it was quite astute at recognizing an upstart that seemed to defy the
perceived laws of nature within the City, but it seemed completely unable to take
any action to prevent the escalation of such developments.
Additionally, and separately from the sheer amounts involved in inflow of funds,
were the multiple channels with which SW was attracting funds. The mainstay
method of bond issuance by SWS and deposit and money market participation by
SW Ltd was thus complemented by the myriad of asset management techniques
mentioned above. The investment trusts, unit trusts, insurance business and various
other vehicles all served to gain funds to acquire and fund further business within
the SW empire. Little resistance was given to this capital vacuum by the Bank
of England as it only considered traditional deposits as its business, as mentioned
elsewhere. The only obstacle that groups such as SW thus had to face in their rush to
growth was presenting investment opportunities that the general public considered
288BEA 6A70/3, d.d. 4/7/73.
188 CHAPTER 4. SIMPLISTIC APPROACHES TO REGULATION
attractive.
The hectic pace of the year is perhaps best exemplified by a year-end article
in the Investors Review which detailed the various SW deals of 1972. In what it
described as coverage of ”only the main events in the calendar” and excluded most
of the major property deals, which was arguably the most active sector of the year,
the article included a list of 62 SW dealings during the year. These included capital
raising, takeover bids and mergers all over the world including the United States,
Germany, Australia and Singapore. The group had truly gained a global, and soon
to be seen as an unmanageable, reach.
4.4 The Fall of Slater Walker
4.4.1 Gradual Decline
1973 marked the beginning of the secondary banking crisis. Continuing on from
1972, investor sentiment and media coverage turned against the high flying methods
and firms of the previous years. SW was particularly vulnerable to such sentiment
changes as it was highly leveraged and its business methods were reliant on the
group’s credibility and reputation towards investors. Indeed, the accountants’ report
into SW’s failure specifically highlighted the group’s maturity mismatch as one of its
main weaknesses.
During this turn to negativity, Slater was busy selling off the few remaining
industrial concerns and building up cash. Media coverage at the time shows that
he had more negative market expectations than most, and in fact came in for some
criticism when he aired the view that share prices were too high. Furthermore, by
his own admission, Slater had become somewhat weary of the go-go environment he
4.4. THE FALL OF SLATER WALKER 189
had created and wasn’t adverse to the possibility of leaving SW. It was amidst this
backdrop that Slater entered into merger negotiations with the commercial banking
traditionalists at Hill Samuel (HS) - a deal that would have created the City’s largest
merchant bank. A merger would enable Slater to place SW inside a more staid firm
and subsequently take a back seat in the combined company.
An additional advantage to the merger from SW’s standpoint was that Hill
Samuel was a member of the Accepting Houses Association. This stamp of approval
gave HS insider status within the financial system or, in the words of Raw (1977),
”the coveted inner ring of banks whose credit is almost underwritten by the Bank of
England”.289 Raw also states the following reason for the attempted merger by SW:
In retrospect it is clear that Slater Walker needed a merger in early
1973; for Slater Walker was then essentially a facade for share dealing,
and with stock markets around the world starting to fall dramatically,
share dealing profits were going to be much harder to make. Indeed it was
soon to be revealed that Slater Walker’s profits were falling, for the first
time ever, at the time the merger was proposed.290
The extent to which SW had become a ”facade for share dealing” is debatable
but it is clear, again in retrospect, that the sprawled out nature of the firm’s oper-
ations were to complicate matters in the following years. Raw furthermore argued
that the merger would provide Slater with much needed respectability and security
as well as power behind the scenes as opposed to his more familiar power based on
289Raw (1977) p.327.290Raw (1977) p. 329. It should be noted that Slater himself disagrees with this argument and
places heavier emphasis on his longing to withdraw from the scene. In hindsight, these opposingviews can perhaps be reconciled by the fact that the deal’s major advantage would have been toattach SW to a traditional bank in light of coming difficulties although this may not have been thereason for entering the negotiations.
190 CHAPTER 4. SIMPLISTIC APPROACHES TO REGULATION
”publicity and charisma”. This power and security was to come mainly from the fact
that HS had 670 mGBP of assets under management compared to SW’s 250 mGBP.
The merger talks attracted significant attention with the most common view
initially being that the deal was a natural one to pursue. SW’s investment banking
operations and HS’s commercial banking were thought to provide good synergy.
According to the Financial Times, the Bank of England supported the deal which
was far from a formality as the Bank took great interest in any merger involving
members of the Accepting Houses Committee.291
The publicity and interest in the deal, however, gradually became the reason
for its cancellation.292 As scrutiny intensified, the deal had given investors and the
media the chance to have a second look at the SW group and this time in a bearish
environment. Several articles started to question the complex business methods of
the firm and criticized both the dealing nature of its profits as well as the potential
conflicts of interest that arose within the group’s structure.
Institutional investors also had concerns which were reflected in a substantial
drop in both companies’ share price following the announcement of the merger.
Amidst this wide-reaching criticism and unwanted attention, the two parties fi-
nally agreed to call the deal off and in a joint statement sent to shareholders stated
that the talks had ”revealed fundamental differences of work-style and personalities,
which both Boards now consider could prejudice the successful implementation of
the merger”.293
Following the breakdown in talks, SW faced something of a existential crisis.
291The Financial Times, ”Slater Walker-Hill Samuel Merger”, 27/4/73.292This view is supported by both Slater (1977), see p. 180, and his main antagonist Raw (1977),
see p.333, as well as in the media coverage at the time.293BEA 6A70/3, d.d. 4/7/73.
4.4. THE FALL OF SLATER WALKER 191
The deteriorating market conditions meant that buyouts, funding and profit oppor-
tunities had become much harder to come by - even for SW - and the criticism that
had come to light during the merger talks did not disappear following the cessation
of talks. A board meeting was held to discuss the situation whereby pressing objec-
tives were decided upon, the most important of which was to simplify the group’s
financial structure and a letter was consequently sent to all shareholders.294
Slater himself had by this point become worried about the general financial
environment as well as SW’s somewhat vulnerable position. Efforts were thus to
be made to start selling sections of the hastily accumulated property portfolio and
liquidate other positions as well. On the banking side, the intention was to gradually
contract the loan book to prepare for trouble ahead.295 While the loan book reduction
never materialized, SW was somewhat successful in selling its property, most notably,
a house in the City which had been acquired for 9 mGBP but was sold at over 22
mGBP.296
By the end of the year, Slater had come to realise that SW’s asset position
looked ”very fragile”. After reviewing the nature of each asset class at a time of
market decline and illiquidity, he came to the conclusion that the group only had 85
mGBP with which to resist ”the coming storm” while consolidated lending totalled
over 450 mGBP.297 Only at this point did the group’s management team start to
294The other objectives were improving the quality of profits by lessening dependence on invest-ment dealing, improve the level of disclosure and improving liquidity.295It should be stressed again here that the stated intentions of Slater come from his own rec-
ollections following the crisis. These intentions are considerably more defensive than the actualmeasures taken. Apart from the well known difficulty of scaling back loan books once a marketdownturn has commenced, SW even continued with expansionary plans such as an offer for FranklinStores which was to signify the group’s move into the U.S. market.296The buyer of the estate was the Singapore Monetary Authority which subsequently came to
regret the purchase. The transaction was to have a significant negative effect in the so-called Spydarcase, discussed below.297The 85 mGBP figure was reached by subtracting cash from gross assets and categorizing the
192 CHAPTER 4. SIMPLISTIC APPROACHES TO REGULATION
realise that properties and loans became vulnerable during downturns - no less than
shares. By Slater’s own admission, looking at the balance sheet in a new ”bearish
light”, he readily saw large vulnerabilities.
While the expected losses were never addressed in the group’s published ac-
counts, SW’s executives were well aware of the potential downside. The property
portfolio was certain to decrease in value and a prudent reserve was estimated as a
20 mGBP loss. Slater also remembered ”with horror how we had been competing
to lend money” and thought another 20 mGBP of losses could easily be seen on the
loan book. The greatest vulnerability however was in listed investments, i.e. share
dealings, where, by Slater’s calculations, 50 mGBP was a conservative loss estimate.
He then compared this 90 mGBP total loss estimate to the equity buffer of 85 mGBP
and came to the conclusion that the company could easily become insolvent.
The annual report for 1973 confirmed this dire outlook while at the same time
the balance sheet was at its all-time largest. Total assets had ballooned again and
now stood at almost 600 mGBP, up by 25%, in comparison to a total of 330 mGBP
of current liabilities. More worryingly, the equity ratio had dropped just below 20%
which was a dangerous prospect for a group that specialized in buying listed shares.
Short term loans and deposits had breached 300 mGBP which was an obvious worry
in a negative sentiment environment. SW had by this point undoubtedly become
close enough to being a bank to be vulnerable to a bank run if sentiment took another
negative turn.
Profits were roughly unchanged from the previous year and were boosted signif-
icantly by the group’s gold holdings - some 6–7 mGBP in profits according to Raw
remaining assets as loans advanced, quoted investments, property, insurance companies and fixedassets. Cash balances were 125 mGBP.
4.4. THE FALL OF SLATER WALKER 193
(1977) - and property deals. The chairman’s statement showed no sign of panic and
focused instead on the continuing expansion of the commercial banking activities on
the one hand and the improved liquidity on the other.298
The banking side had meanwhile seen a 17% growth in deposits which the Bank
thought was minimal and the balance sheet itself had grown by a smaller 10% -
on paper the bank looked to be doing fine.299 This was due to the fact that no
losses of any significance had been taken on the loan book at this point.300 The
decision was, however, taken to re-classify the existing ”inner reserves” as provisions
for doubtful debts. While stressing that the amount far exceeded any foreseeable
doubtful debts this was done due to the ”exceptional conditions prevailing in the
banking sector”.301 The Bank’s internal view on the results was that the year had
been one of consolidation and that SW had endured ”considerable pressures”.302 It
viewed the banking side’s balance sheet as ”markedly less healthy than last year.”
The same pattern continued in the beginning of 1974. Assets were sold off to
the extent possible in light of the secondary crisis being well underway. Amongst the
divestitures was Crittall-Hope which had been the group’s largest industrial takeover
upon its purchase in the heady days of 1968. SW managed to raise a further 50 mGBP
in cash during the first half of the year and by now the outlook had become dire
enough for the group not to use its cash proceedings to expand.
Slater had used the company’s annual meeting in May to articulate his current
298Slater Walker Limited Reports And Accounts 1973; Chairman’s Statement.299BEA 6A70/3, d.d. 29/4/74. The Bank commented that this deposit growth meant it ”had
slowed right down”.300This was also the case with the parent company’s investments. A large portion of them had
fallen well below their book value. These investments were not written down however as, in theopinion of the board, ”these investments are worth more than their market value” (Slater WalkerSecurities Reports And Accounts 1973; Chairman’s Statement).301Slater Walker Securities Reports And Accounts 1973; Chairman’s Statement.302BEA 6A70/3, d.d. 29/4/74.
194 CHAPTER 4. SIMPLISTIC APPROACHES TO REGULATION
views, namely that cash was the optimum investment. The speech, which predictably
drew a lot of attention, focused on the dire economic situation with Slater voicing
the opinion that cash was the best investment no matter what happened to the
economy.303 Apart from cash purchases, the only other position taken by SW at the
time was gold which turned out to be the main profit source during this period. First
half profits totalled 10.1 mGBP, thereof 6 mGBP in dealing profits of which a large
proportion had again come from gold.304
Towards the end of the year, market sentiment had become so negative that
SW saw itself forced to reply to the negative market rumours.305 A company called
Jessel Securities had witnessed a dramatic fall in its share price and since it owned
both an insurance company and a unit trust, worries mounted that SW might be
experiencing similar problems. Fearing contagion, SW put out a statement saying
that all was well, liquidity was ample and that the company’s cash reserves had been
placed with ”leading banks outside the group”. The last point was considered crucial
to stave off worries about counterparty risk.306 The announcement concluded with
the words that while SW ”does not normally comment on stock market rumours,
it felt it advisable in the current exceptional circumstances, to draw shareholders’
attention to the company’s inherent financial strength.”
As the failings of the secondary banks had become widespread, the scramble for
cash became harder still.307 Deposits also became increasingly hard to come by and
303The Times, ”Mr Slater tells his shareholders cash is the optimum investment”, 31/5/74.304According to Raw (1977), gold accounted for half of the year’s profits.305To put it in general context, the equity market declined by 55% in 1974 and had declined in
total by 70% from its peak. While unbeknownst to investors, this was to be the trough of thedecline as the market recovered in 1975.306BEA 6A70/3, Reuters, d.d. 17/10/74.307The fact that Slater had been amongst the first to start moving into cash, and been criticized
in some quarters for it, was not lost on the Bank. It noted that this had been seen by some as a”failure to support British Industry”. BEA 6A70/3, d.d. 30/10/74.
4.4. THE FALL OF SLATER WALKER 195
the money market was drying up. Much of the cash that the group had been able
to raise, by various measures, went into repaying depositors spooked by the fringe
crisis. There was thus a large discrepancy between cash raised, which was a figure
widely reported, and the much lower amounts that were cash on hand, that is after
repayment to fleeing depositors.
These depositors, as mentioned below, were both domestic and foreign. While
SW had initially collected deposits from its London headquarters it had also set up
branches in six major U.K. cities and three off-shore subsidiaries.308 The branches
were tasked with taking ”deposits locally and were a point of contact for people who
wanted to inquire about [...] other services”.309 These other services included the
unit trusts and insurance business, which were cited ex post by the Bank of England
as further reasons why it had been forced to save the company.310
Most financial companies were in distress as their assets were, in Slater’s words,
”literally disintegrating before their eyes”. Share prices consequently plummeted and
the only item on any financial sector firms’ agenda was to stay above water. SW’s
early awareness of the need to preserve and raise cash, as well as the willingness to sell
into a falling market, were key reason for the firm not being forced into the Lifeboat
and managing to stay afloat longer than most fringe banks. Slater’s aforementioned
decision to buy gold, which served as a rare source of profit during the period, was
also instrumental.311 To add to the fringe’s woes, many of them were witnessing
severe contagion as every publicized failure of a secondary bank brought with it
308Financial Times, ”’Weak’ lending policy criticised”, 15/09/76.309Slater (1977) p. 129.310The unit trusts held approximately 250 mGBP from over 300,000 unitholders. The life assurance
arm had 29,000 clients. See Bank of England (1978).311See Reid (1982) p. 138 and Raw (1977) p. 341 who both emphasise early liquidation as a key
reason for SW staying afloat as long as it did.
196 CHAPTER 4. SIMPLISTIC APPROACHES TO REGULATION
redemptions at other banks, including SW.312 Slater had even spoken directly to
the Governor of the Bank of England about the need for rescue operations to avoid
repercussions on his own bank and all the accepting houses.313
The Bank’s attention towards SW intensified further as the banking sector’s
problem intensified. It compiled a large table of data scrutinizing SW’s accounts five
years back and its ratios, summarized in the table below.314 The analysis centred
on three aspects; capital, liquidity and profitability. As the numbers used were
reported numbers, the profitability showed no warning signs except possibly that
the numbers were too good as previously mentioned. The main liquidity ratio used
was quick assets to deposits. Quick assets consisted of ”cash, bank balances, money
at call and very short notice, certificates of deposit, bills, quoted investments.” Note
also that there were no reported loans to the holding company or subsidiaries, even
through 1973. This is despite the fact that inter-company lending was to be a major
point of criticism following SW’s demise.
While the material was thus very specific as to what the calculations contained,
the inclusion of quoted investment in the ratio meant that SW’s small, illiquid hold-
ings made the liquidity position seem better than was perhaps warranted. Further-
more, some of these holdings were held at the parent company level and some at the
banking level, leaving any rough calculation imprecise. The devil was most definitely
in the excluded details.
The same applies for the capital analysis as the ratios calculated included terms
312A simple correlation comparison supports this. Looking at share prices for the period from SW’sflotation until its demise, five fringe banks (including Slater) have a correlation of approximately0.5 with SW itself ranking in the middle. These fringe banks’ correlations with Barclays (or othermembers of the Big Four) are however much smaller and hover around 0. See Chapter 5 for furthersuch analysis.313BEA 6A70/3, d.d. 21/12/73.314BEA 6A70/3, undated document.
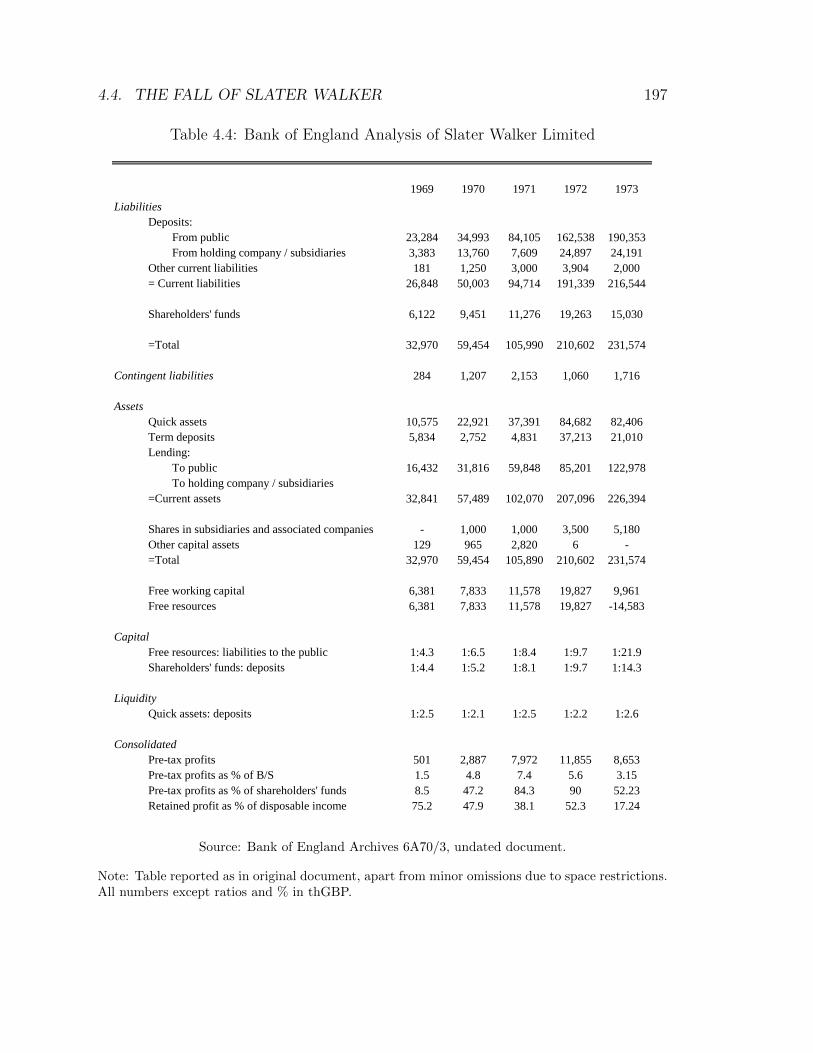
4.4. THE FALL OF SLATER WALKER 197
Table 4.4: Bank of England Analysis of Slater Walker Limited
1969 1970 1971 1972 1973
Liabilities
Deposits:
From public 23,284 34,993 84,105 162,538 190,353
From holding company / subsidiaries 3,383 13,760 7,609 24,897 24,191
Other current liabilities 181 1,250 3,000 3,904 2,000
= Current liabilities 26,848 50,003 94,714 191,339 216,544
Shareholders' funds 6,122 9,451 11,276 19,263 15,030
=Total 32,970 59,454 105,990 210,602 231,574
Contingent liabilities 284 1,207 2,153 1,060 1,716
Assets
Quick assets 10,575 22,921 37,391 84,682 82,406
Term deposits 5,834 2,752 4,831 37,213 21,010
Lending:
To public 16,432 31,816 59,848 85,201 122,978
To holding company / subsidiaries
=Current assets 32,841 57,489 102,070 207,096 226,394
Shares in subsidiaries and associated companies - 1,000 1,000 3,500 5,180
Other capital assets 129 965 2,820 6 -
=Total 32,970 59,454 105,890 210,602 231,574
Free working capital 6,381 7,833 11,578 19,827 9,961
Free resources 6,381 7,833 11,578 19,827 -14,583
Capital
Free resources: liabilities to the public 1:4.3 1:6.5 1:8.4 1:9.7 1:21.9
Shareholders' funds: deposits 1:4.4 1:5.2 1:8.1 1:9.7 1:14.3
Liquidity
Quick assets: deposits 1:2.5 1:2.1 1:2.5 1:2.2 1:2.6
Consolidated
Pre-tax profits 501 2,887 7,972 11,855 8,653
Pre-tax profits as % of B/S 1.5 4.8 7.4 5.6 3.15
Pre-tax profits as % of shareholders' funds 8.5 47.2 84.3 90 52.23
Retained profit as % of disposable income 75.2 47.9 38.1 52.3 17.24
Source: Bank of England Archives 6A70/3, undated document.
Note: Table reported as in original document, apart from minor omissions due to space restrictions.All numbers except ratios and % in thGBP.
198 CHAPTER 4. SIMPLISTIC APPROACHES TO REGULATION
such as free working capital and leased assets. The classification of assets and liabil-
ities within both SWS and SW meant that both the true liquidity and the earnings
quality could not readily be ascertained by looking at aggregated, stated figures.
The Bank took these questionable numbers at face value in all three categories which
made the ratios acceptable and eased concerns. It had thus formally performed a
rudimentary stress test while ignoring the economic dimension of the figures. When
Slater called on the Governor in October, the Bank was of the opinion that SW had
been able to maintain good liquidity.
Two separate issues were now starting to weigh on the banking side of SW
and therefore the group as a whole. These were Cannon Street Acceptances (CNA)
and a deposit held by National Westminster. CNA was one of the casualties of the
secondary banking crisis and SW had been its creditor to the tune of approximately
5 mGBP. In connection to the Bank’s ”Lifeboat” operations, provisions were made
so that unsecured creditors of CNA would not take haircuts.315 SW had, however,
been a secured creditor and now that its collateral looked to be insufficient, it sought
out assistance from the Bank.
SW representatives were of the view that the company had been unfairly pun-
ished for showing the prudence of a collateral request, which CNA’s unsecured cred-
itors had not. When SW director Michael Booth had met with the Bank he had
very clear views about the need for SW to be made whole, and was, according to the
Bank, ”very bitter” about the whole affair. His suggestion amounted to what the
Bank thought to be an ”elaborate scheme for loss sharing on Cannon Street Accep-
tances, involving selling assets and liabilities to us. So far as [the Bank] could make
315BEA 6A70/3, d.d. 8/11/74.
4.4. THE FALL OF SLATER WALKER 199
it out, ’loss sharing’ under this scheme means loss transfers.”316 The Bank ultimately
refused this request and SW was forced to take a loss on its CNA exposure of 1.8
mGBP.
The other issue weighing on the banking side of SW was the National Westmin-
ster case. It concerned a 5 mGBP deposit that NatWest, as SW’s clearer, had lent
to SW but was due to expire at the end of the year. It was, according to the Bank,
of ”vital importance” that it be renewed.317 As mentioned above, much had been
made of SW’s solid liquidity and ample cash. The fact that the 5 mGBP deposit
was of such upmost importance to the firm might therefore have been expected to
ring alarm bells within the Bank as it was intimately involved and up to speed in
the communications between NatWest and SW.
Finally, the Bank seems to have decided to lend SW 10 mGBP to paper over
the issue.318 No background material on the discussion leading to this loan are
available but the loan went through on 31st December and matured eight days later.
The only available clue as to its purpose was during the discussions on the National
Westminster deposit whereby Booth, the SW director, conveyed the vital importance
of the deposit’s renewal. The term ”end-year window dressing” was used by the Bank
and no other conclusion can be drawn than the 10 mGBP loan from the Bank was
designed to make the SW year-end accounts look healthier than they otherwise would
have and possibly artificially easing immediate liquidity pressures.319,320
316Ibid.317Ibid.318BEA 6A70/3, d.d. 30/12/74. and 31/12/74.319BEA 6A70/3, d.d. 8/11/74.320This operation resembles an episode surrounding the infamous Creditanstalt failure documented
in Aguado (2001). Aguado shows that the Austrian central bank used an intricate system of crossdeposits to steer funds to Creditanstalt in attempts to prevent the crisis. The aim of this secretiveuse of financial engineering was ”to provide the Creditanstalt with foreign exchange without havingto reduce the reserves in the Austrian Nationalbank’s published statements. This was done to keep
200 CHAPTER 4. SIMPLISTIC APPROACHES TO REGULATION
The 10 mGBP loan was duly repaid a week after it was made but the secretive
nature of the payment can be seen by a letter from SW’s chief accountant who could
not find confirmation of the loan anywhere. The reply from the Bank’s chief cashier
was that the loan was so secretive in nature that the Bank staff dealing with the
certificate were not even aware that the loan had been made.321 The extent to which
the Bank not only sanctioned but facilitated and funded such window dressing is
striking and cannot be said to classify as coming under the Bank’s insistence on
”proper” banking procedures. The fact that the loan was made so secretive allows
for the possibility that such short-term window-dressing loans were provided to other
institutions in need of a credibility boost.
As it turned out, 1974 was the only year in which SW was able to reduce the
size of its balance sheet. The group managed a 33% reduction in the balance sheet
by selling off industrial assets and using the proceeds to increase the cash buffer and
buy back its own debt. The latter served to improve the appearance of the accounts
as the debt was bought back at a discount, hence boosting net asset value. Short
term debt was for example decreased from 300 mGBP at the beginning of the year
to just under 175 mGBP at the end of it.
However, the income statement was a bigger sign of worry, as seen in the table
below. The figures showed that the company had been forced to take a 30 mGBP
write-down of its industrial assets when they had been sold off. The total amount
of assets sold off during the year was 140 mGBP which meant that the losses taken
were a considerable percentage of the total value of the companies sold. The Sunday
these cross-deposits secret, because, if the published reserves of the Nationalbank had suddenlyfallen by a substantial amount, it would have been impossible to keep the matter secret.”(Aguado(2001) p.202).321BEA 6A70/4, D.A. Clarke, d.d. 28/1/75. and D.H.F. Somerset, d.d. 6/2/75.
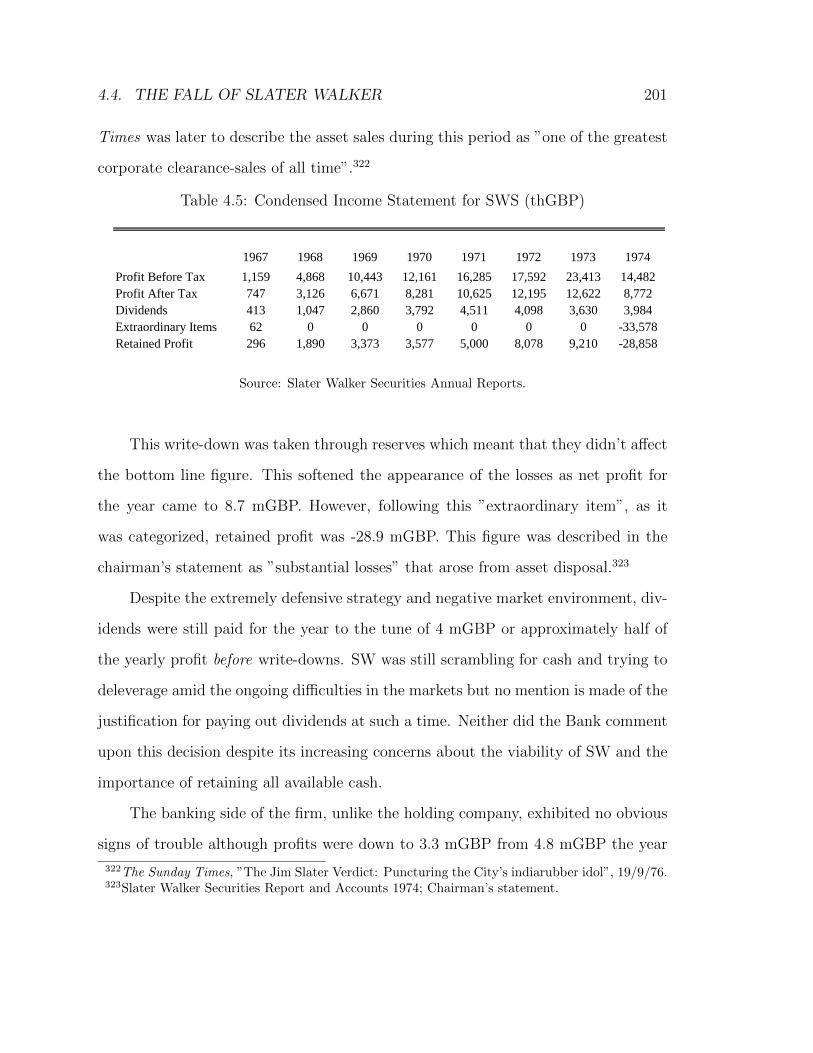
4.4. THE FALL OF SLATER WALKER 201
Times was later to describe the asset sales during this period as ”one of the greatest
corporate clearance-sales of all time”.322
Table 4.5: Condensed Income Statement for SWS (thGBP)
1967 1968 1969 1970 1971 1972 1973 1974
Profit Before Tax 1,159 4,868 10,443 12,161 16,285 17,592 23,413 14,482
Profit After Tax 747 3,126 6,671 8,281 10,625 12,195 12,622 8,772
Dividends 413 1,047 2,860 3,792 4,511 4,098 3,630 3,984
Extraordinary Items 62 0 0 0 0 0 0 -33,578
Retained Profit 296 1,890 3,373 3,577 5,000 8,078 9,210 -28,858
Source: Slater Walker Securities Annual Reports.
This write-down was taken through reserves which meant that they didn’t affect
the bottom line figure. This softened the appearance of the losses as net profit for
the year came to 8.7 mGBP. However, following this ”extraordinary item”, as it
was categorized, retained profit was -28.9 mGBP. This figure was described in the
chairman’s statement as ”substantial losses” that arose from asset disposal.323
Despite the extremely defensive strategy and negative market environment, div-
idends were still paid for the year to the tune of 4 mGBP or approximately half of
the yearly profit before write-downs. SW was still scrambling for cash and trying to
deleverage amid the ongoing difficulties in the markets but no mention is made of the
justification for paying out dividends at such a time. Neither did the Bank comment
upon this decision despite its increasing concerns about the viability of SW and the
importance of retaining all available cash.
The banking side of the firm, unlike the holding company, exhibited no obvious
signs of trouble although profits were down to 3.3 mGBP from 4.8 mGBP the year
322The Sunday Times, ”The Jim Slater Verdict: Puncturing the City’s indiarubber idol”, 19/9/76.323Slater Walker Securities Report and Accounts 1974; Chairman’s statement.
202 CHAPTER 4. SIMPLISTIC APPROACHES TO REGULATION
before. The quality of the results and calculation are hard to scrutinize however as
the bank only released the net profit figure. Presumably, Slater’s aforementioned
view that loans should be written down easily by 20 mGBP did not make its way
into the results. The balance sheet had contracted by 26% to 172 mGBP but current
deposits still amounted to more than 100 mGBP - an obvious concern if the bank,
and group as a whole, were to run into any serious difficulties.324
1975 started with an unexpected rise in share prices in the middle of the ongo-
ing crisis. SW shares almost tripled in value, albeit from a low base, as talk started
of the worst of the crisis being over. The group stayed mostly inactive during this
rise although a significant move was made in January when it acquired the National
group of unit trusts for 1.2 mGBP. While the purchase price was in some sense
miniscule compared to SW’s overall size, the acquisition added 60 mGBP of unit
trust funds to the 80 mGBP already in place, making SW the third largest unit
trust group in the country. This purchase thus had the indirect effect of making any
future collapse of SW more costly and greater in scope. SW continued advertising its
various businesses throughout 1975, further compounding the Bank’s problems when
it came to resolving the group. For example, in April it advertised in The Finan-
cial Times, seeking funds from charities, pension funds, private clients, institutional
clients, investment trusts and unit trusts.325
Slater, having conceded that SW as a whole had lost its raison d’etre, was by
this stage certainly not opposed to selling the company in its entirety. During the
early months of the year, he held talks with various parties about a deal, but nothing
materialized. He continued the asset sales by selling off the credit finance company,
324At the time of collapse, SW held 95 mGBP of deposits ”taken from the public in the UnitedKingdom and abroad”, according to the Bank itself. BEA, 6A70/18 d.d. 14/09/76.325Financial Times, 04/19/75 p.18
4.4. THE FALL OF SLATER WALKER 203
Slater Walker Finance Corporation, amongst other subsidiaries. The sale of SWFC
was a welcome one for SW as it had been hard hit by higher interest rates and in
fact ran up a loss in the first half of 1974.326 Further divestitures followed during
the summer, in addition to a substantial reduction in overhead costs. When the first
half profits were announced in August, the profit for the period showed a dramatic
year-on-year fall of 78% to 2.2 mGBP.
Other adverse issues also started to arise which painted a more negative picture
both of SW’s operations and its current situation. An example of this was when
the American bank Morgan Guaranty had called on the Bank to complain about
the behaviour of SW.327 The despute centered on a five-year, 21 mUSD loan that
Morgan had provided SW with prior to the crisis for the specific task of acquiring the
retail company Franklin Stores. A year later, during SW’s dash for cash, it sold the
company. Both Morgan and Barclays, who had also lent specifically for the purchase,
requested that they be repaid but SW argued that the loan was for five years and
no covenant regarding early repayment had been placed in the loan contract.
While Morgan did not ask the Bank to take any action, the group wanted to
voice its anger as they felt they had been taken advantage of. Internally, the Bank’s
response was sympathetic to Morgan and it decided to raise the matter with SW.
The behaviour on SW’s part was not what the Bank called ”the sort of conduct we
expect of a London bank and it is not conduct which is in their own best interests.”328
Ultimately the dispute could not be settled but the Bank was evidently somewhat
displeased by the way SW had tackled the matter.329 The affair also raised questions
326BEA 6A70/4, d.d. 3/3/75.327BEA 6A70/3, d.d. 4/3/75.328Ibid.329Both parties sent the Bank its correspondence with one another in a bid to convince the Bank
of its argument. The Bank was therefore in some sense in the role of a moral judge, as both parties
204 CHAPTER 4. SIMPLISTIC APPROACHES TO REGULATION
as to whether the way that SW conducted its business in general was ”proper”
by City standards as well as introducing the possibility that it wasn’t as liquid as
publicly stated.
The 1974 annual report, released in April of 1975, was not purely doom and
gloom, however, as the chairman’s statement declared that the board had ”recently
identified some new and attractive investment opportunities and we feel well placed
to come back very strongly as and when general market conditions improve.”330 On
the other hand, during the annual meeting in June, Slater conceded that group profits
would be at a ”very low level indeed” in 1975. He was thus performing a balancing
act of sorts, by both keeping expectations low while maintaining the public image
of a company that was ready to pounce at any time. Slater finally added that
a priority during the rest of the year would be to reduce the group’s substantial
property portfolio which was an ambitious goal during such a severe downturn.331
The problems kept piling up and the bankruptcies of several secondary banks
were starting to affect SW. The effect of the impending collapse of Town and Com-
mercial Properties on SW was a particular worry inside the Bank. SW had indirect
exposure to TCP of roughly 15 mGBP and SW executives were most anxious that
the recovery in its reputation should not be impaired in any way.332,333 Issues such
as these gave the Bank additional cause for concern but still no contingency plan
was drawn up to deal with the possibility of a SW collapse.
agreed that no law had been broken. Ultimately, Morgan had asked for a repayal covenant inthe event of the sale of Franklin but SW had refused. The reason for this refusal and Morgan’sconcession was not established and the Bank thus told both parties that it could not take the matterfurther. BEA 6A70/4, d.d. 27/3/75.330Slater Walker Securities Report and Accounts 1974; Chairman’s statement.331The Guardian, ”Dividend pledge from ebullient Mr Slater”, 6/6/75.332BEA 6A70/4, d.d. 8/5/75.333The recovery relates to the fears in late 1974 that SW was in trouble.
4.4. THE FALL OF SLATER WALKER 205
4.4.2 The Bank of England to the Rescue
It was during the early autumn of 1975 that Slater’s reign was to come to an end.
The catalyst seemed haphazard in nature as it came in the form of a fallout from
an employee incentive scheme in Singapore. Amongst the global outreach programs
by SW, documented above, was its venture to Asia where it had built up substan-
tial holdings with several of its executives stationed in the region. An incentive
programme was subsequently set up whose purpose it was to prevent these execu-
tives from trading on their own behalf in the recently developed stock exchanges of
Hong Kong and Singapore, where insider trading rules were still quite murky. The
programme would also serve traditional incentive purposes by giving the executives
”skin in the game”.
The scheme was constructed by forming a private company called Spydar which
would purchase shares in companies that Haw Par, SW’s subsidiary, was to take
interest in. This operation was in some sense no difference to similar schemes set up
in other countries.334 The importance of Spydar stemmed from the massive trading
gains made and the way in which they were accounted for in Hong Kong. The
matter came to light following an article in the Financial Times in early August
that revealed the investigation by Hong Kong police into Haw Par and Spydar.335
Slater was on vacation at the time but Booth contacted the Bank, knowing
that this would concern them. Slater, via Booth, categorically denied all accusations
levelled at him and the firm. The Spydar affair was to become a very heated interna-
tional dispute which ended in extradition cases for Slater and another SW executive.
The intricacies of the affair are not of direct relevance here but the consequences
334As noted by Raw (1977) p.346.335The Financial Times, ”Haw Par probe by Hong Kong police”, 9/8/75.
206 CHAPTER 4. SIMPLISTIC APPROACHES TO REGULATION
are since the Singapore authorities ultimately refused to release a much needed 29
mUSD payment that was due to SW following its sale of Haw Par.
Up to this point, the funding and liquidity issues facing SW had mostly been
in relation to general market movements and worries about the financial system as
a whole. The Haw Par affair however focused matters more directly on SW and the
potential problems that the non-payment of the 29 mUSD could have on the firm’s
operations. The size of the payment cast serious doubts about the viability of the
banking part of SW and subsequently the group as a whole. Finally the connected
nature of the group was dawning on investors, and more importantly the Bank,
including the drastic consequences that failure of one part of SW would have on the
other parts.
The Bank of England thus followed the Haw Par affair closely as the 29 mGBP
was both an amount that SW could not easily swallow and the intense media scrutiny
could prove troublesome. As the affair gained momentum, the Bank saw only three
possible solutions; that SW be provided a ”bankable”, though less valuable, security
against the 29 mGBP, that part of the loan be converted into equity or that the deal
be in some capacity reversed.336
In late September, there was still no sign of a solution being found to the Spydar
situation. The Bank had internally become increasingly negative and impatient
towards SW and its situation. This was the first time that the Bank was taking
a critical look at SW’s core banking operations and it did not like what it saw.
It was of the view that the banking side looked ”over-lent” and that its maturity
transformation was a major concern; ”whereas half of its sterling deposits are short-
term money market borrowings, about two-thirds of its sterling lending is for periods
336BEA 6A70/4, undated document.
4.4. THE FALL OF SLATER WALKER 207
of over one year.”337
The Bank added that ”stability of the banking company rests heavily, therefore,
on continuing confidence.” This worry, taken at face value, is somewhat perplexing as
the combination of short liabilities and long assets is in some sense the very essence
of banks. The Bank ran through several issues that could adversely affect the SW
group such as the aforementioned Town and Commercial Properties loans and the
fact that ”a significant proportion of the banking company’s lending is to companies
which have recently acquired major assets from Slater Walker Securities.”338 This is
the principal-agent problem mentioned earlier which the Bank seemed to be noticing
for the first time in late 1975.
The Bank was waking up to the unpleasant truth that it did not know a whole
lot about SW apart from the primitive ratios it had calculated throughout the years
following earnings releases. It was thus decided that a primitive form of a stress test
were to be run, or as the Bank put it, ”an attempt [...] to measure the anticipated
liquidity pressure which an intensive run on the bank might produce.” Additionally,
a list of securities owned by SW was put forward in an effort to determine whether
a standby facility could be arranged by the Bank against collateral from SW. The
Bank considered the problem of SW to be a big one and the Governor was advised
to encouraged Slater to sell off his banking interests. The purpose of such a move
would be to subsume SW’s problem into a more stable banking group.
An accompanying document listed the various information that the Bank would
need to fully assess the situation at SW. The information was grouped into eight
categories: group structure, unaudited consolidated balance sheet, analysis of the
337BEA 6A70/18, d.d. 30/10/75.338Ibid. The correspondence went on to say that ”there may be nothing wrong about this, but
such loans may not be as fully at arm’s length as one would wish.”
208 CHAPTER 4. SIMPLISTIC APPROACHES TO REGULATION
balance sheet, analysis of deposits and secured borrowings, loan stock trust deeds,
further details of uncharged assets, analysis of bank lending and finally article of
associations. Under each category was a further description of the precise information
required. This can be said to be the point at which the Bank finally realized the
risks that SW’s operations entailed, the potential fallout of the group’s failure, and
the lack of information required to assess the firm’s true solvency and liquidity.
The Governor spoke with Slater shortly after this and expressed his wish to
make formal arrangements for a standby - i.e. some sort of rescue mechanism.339
Slater also provided the Governor with an update on the Haw Par situation. He
was at this point willing to take a serious discount on the amount owed by Haw
Par and was himself ”appearing rather more nervous about his own and the group’s
vulnerability”, according to the Bank. He also declared his intent to get out of
banking and business altogether.340
Ultimately, it was the Spydar affair that proved to be the tipping point that
convinced Slater to resign from SW.341 As mentioned above, Slater had been open
to the possibility of withdrawing from the company for quite some time but the
Singapore dispute gave him the opportunity to do so. He argued that apart from his
own desire to get out of the business, his removal from the company would clear the
way for the Singapore authorities to reach an agreement with new parties. Slater
was in regular contact with the Bank of England at this point who were similarly
concerned about the adverse effects that a disorderly failure of SW could have. The
339BEA 6A70/18, d.d. 7/10/75.340Ibid. He mentioned to the Governor that he had been hopeful of selling the company to either
American Express or Bank of America but both deals had collapsed.341It should be mentioned that no documentation exists from the Bank between August 28th and
September 30th of 1975. The reason for this is unclear as it was certainly an active period for SWand its relationship with the Bank.
4.4. THE FALL OF SLATER WALKER 209
Governor had at this point brought the Treasury into the discussions and kept the
Chancellor notified of the ongoing developments. The Chancellor in turn briefed
the Prime Minister himself, showing the extent to which SW had become a genuine
public concern.342
Slater announced his resignation on 24th October amidst a predictable media
frenzy. He was replaced by his business associate and SW shareholder Jimmy Gold-
smith who would lead SW through its collapse and Bank of England reorganization.
The Bank had heard about the idea of Goldsmith replacing Slater from Slater himself
before he resigned.343 The Governor had even spoken to Goldsmith prior to Slater’s
resignation about the terms of the replacement. They agreed that Slater should re-
sign and it would be best that he would do so promptly before ”a Press campaign
demanding his departure could be mounted”.344
Goldsmith also confessed to the Governor that following the massive divesti-
tures, there was little remaining of an ongoing business within SWS, apart from
the unit trusts, and it was his intention to run down the group. The Governor told
Goldsmith that a facility would be on offer which provided SW with liquidity against
collateral and the Bank ”would be prepared to make further advances, as necessary,
to enable unconnected deposits to be repaid as soon as satisfactory arrangements
342The National Archives (TNA) T386/293, part 1, page 1 (p1/1). The Governor’s first notificationto the Treasury was given prior to Slater’s resignation and then periodically after that as the rescueoperations further developed.343Slater had also mentioned the possibility that Goldsmith buy the group outright but the Bank
was not fond of this idea. Goldsmith was not considered an ideal candidate to run a bank and hecurrently ownly owned a ”house bank” in France called Banque Occidentale. While the Bank sawa certain attraction in the fact that the SW problem could be shipped abroad to Paris, it was quitecertain that further problems for the group would still have to be dealt in England. A merger withGoldsmith’s bank was judged to be a worse alternative than winding SW up in bankruptcy. BEA6A70/18, d.d. 17/10/75.344BEA 6A70/18, d.d. 21/10/75.
210 CHAPTER 4. SIMPLISTIC APPROACHES TO REGULATION
could be made for further security to be provided.”345 This initial assistance came in
the form of a 70 mGBP standby facility ”designed to provide adequate liquidity to
protect SWL’s depositors while the new board examined the situation.”346
This commitment meant that, in principle, the Bank would follow Bagehot’s
guidelines and was only to provide funding as long as SW was solvent.347 However,
when the Bank came to the realization that there might be inadequate collateral for
the money required it did not consider cancelling assistance. Instead of thinking in
terms of when assistance should be halted, it discussed the matter in terms of the
expected loss to itself, conditional on the fact that unrelated depositors would be
paid back in full.348 Goldsmith’s final request was that the Bank assistance remain
a secret matter which the Governor agreed was prudent.349
Secrecy was in fact a priority for the Bank and the need for it was mentioned
regularly in internal correspondence. A testament to the Bank’s insistence on secrecy
came in a note for the record which urged that the Bank, in its dealings with the
345Ibid.346BEA 6A70/18, d.d. 14/9/75. According to Capie (2010), the maximum drawing of SW was 54.8
mGBP, reached in December 1976. The 70 mGBP facility is arguably a more relevant number forour purposes as it better describes the amount that the Bank stood to lose in an adverse scenario.In fact, it may even understate the potential loss for the Bank as it might have been forced toincrease the facility if needed.347Ackrill and Hannah (2001) note that in establishing the Lifeboat, the Bank of England had
defined it is ”an open-ended (though voluntary and terminable) agreement to support all illiquidbut solvent banks.” (p.207) See Chapter 2 for a discussion of Bagehot’s principles.348The identity of the unrelated depositors is unknown and presumably included a vast number of
the general public. Therer were, however, also larger issuances involved and some were mentionedin the Bank’s dealings with Goldsmith. These included National Westminster, which had served asSW’s primary bank, Midland, Sun Life Canada and Abbey National. An example of the group’sinternational reach can be seen in a document, that lays out the expected cash flow of the company,showing a recurring item paid out to ”Japanese”. Currency bonds, sold to unrelated investors, werealso a substantial amount and stood at 50 mGBP at year end 1975. BEA 6A70/18, d.d. 11/5/76,Appendix IV and d.d. 4/6/76, Appendix B.349When it was decided that the SW problem was big enough to necessitate Treasury involvement,
it was decided that only the Chancellor and two of his staff should be informed of the situation.BEA 6A70/18, d.d. 4/12/75.
4.4. THE FALL OF SLATER WALKER 211
press, stressed that SW had never been a recipient of funds from the Lifeboat and
that the Bank had no money in SW.350 Crucially, it was also stressed that the Bank
say that there had never been, nor was there now any necessity for such support.
In light of the discussions detailed above and below, such statements were highly
misleading and this media strategy was in clear contradiction with the clear need
that the Bank saw for support to SW via its own funds.
The Bank’s staff was also told that if they were to be asked whether the Bank
had ever lent SW any money the answer was to be a ”categorical no”. This was
obviously in contradiction to the 10 mGBP window-dressing loan mentioned earlier
in this chapter which was deposited to SWL’s account at National Westminster. The
”categorical no” related to the holding company, SWS, and was therefore technically
correct although whether the intention of the Bank was to get off on the technicality
is unclear. Certainly if a journalist were to ask whether the Bank had lent money to
SWS, or any of its main subsidiaries, there would have been no wiggle room for the
Bank.
The media strategy notwithstanding, the structure of the decision making pro-
cess during the rescue operations seems to have been relatively simple. It was decided
that due to the complexities of the group, in addition to the uncertainty surrounding
its operations and its international nature, its problems should not be addressed via
the Lifeboat operations which were used for most of the secondary banks.351 In-
stead it should be treated as a separate, standalone issue with more direct Bank
involvement.
Those involved within the Bank were exclusively upper-level staff, especially
350BEA 6A70/18, G.L.B.M., d.d. 24/10/75.351BEA 6A70/18, Q&A drafts, undated.
212 CHAPTER 4. SIMPLISTIC APPROACHES TO REGULATION
during the period where secrecy was of the upmost, and the Governor himself was
personally kept informed on all discussions. Senior staff would hold meetings with
SW executives and report on the outcome to the Governor . He would then frequently
ask for a briefing on a specific issue, such as estimates of the Bank’s loss under various
scenarios and an overview of SW’s operations.
In one instance, the Governor asked for an analysis of ” the likely course of events
if the Bank decided not to help finance further loan redemptions”.352 The staff
involved thus prepared a two page document qualitatively describing the possible
effects of such a decision. These included effects on confidence as well as the reaction
overseas and on the Euromarket if a U.K. borrower were to fail. The conclusion was
that there seemed to be no way for the Bank to stand idly by and it would have
to signal in some way to general creditors that an unorganized fallout would not
follow.353
As per tradition, the Bank wasted no time in compiling a five page biography on
Goldsmith himself, covering the usual traits such as family history, banking experi-
ence and business interests.354 While the Bank had given the go-ahead for Goldsmith
to take over, his reputation in the City was somewhat lacking and he was known as
both a ”whizz-kid” and a gambler - certainly not traits that the Bank looked kindly
upon. He was also said to have a ”propensity to trade companies as if he was playing
Monopoly” and he had been described in the press as both a playboy and a spec-
ulator. The only obvious attraction that SW had to him was its banking licenses -
licenses that the Bank had denied Goldsmith repeatedly before.
352BEA 6A70/18, d.d. 25/5/75.353Ibid. The Euromarket factor is highlighted in Geddes (1987). Davis (1995) also associates the
international aspect to the Bank’s response, stating that ”the Herstatt crisis of 1974 (see below)made the Bank sensitive to avoid any default on euromarket loans.” (p.153).354BEA 6A70/18, ”James Goldsmith”, undated.
4.4. THE FALL OF SLATER WALKER 213
Goldsmith’s reputation as a risk-taker was in many ways similar to that of
Slater himself. The Bank was however satisfied with him taking charge due to his
relationship with Slater and the fact that continuity within the firm was considered
of upmost importance. The Treasury, on the other hand, was not impressed with
the decision and questioned the Bank’s ruling in this case. Describing the Bank as
being ”up to their neck in the Slater Walker affair”, they questioned the extent to
which Goldsmith was adequately reputable to lead a City institution.355
The Bank’s main task in the following weeks was to untangle the SWS balance
sheet and figure out how assistance should be provided and also on what terms. The
aptly named Banking and Money Market Supervision Section compiled a repayment
profile for the consolidated banking side of the group, matching assets and liabil-
ities by maturity which showed that assets were much more back-loaded than the
liabilities.356
According to Table 4.6, the firm seemed solvent at this point in time but it would
take several years to wind it down and this was without analysis of any doubtful
debts. A similar analysis of money market assets and liabilities was more front-
loaded and seemed to show a positive cumulative cash position from day one.
The amount thought to be needed at this point was approximately 40 mGBP,
of which 25-30 mGBP was for the banking side.357 Furthermore, this support would
trigger repayment clauses in the loan stock which would necessitate that they be
repurchased by the group with further funds from the Bank.358 A provisional balance
355TNA T386/293, p1/2.356BEA 6A70/18, Banking and Money Market Supervision Department, d.d. 17/10/75. Revell
(1973) provides a view of maturity mismatch at the time. He puts forward the argument thatsecondary banks should aim for ”matching” of assets and liabilities but does not mention theimmediate danger due to the circumstances at the time.357BEA 6A70/18, d.d. 23/10/75.358At the time of collapse, SW had loan stocks of 100 mGBP outstanding, 75 mGBP of which
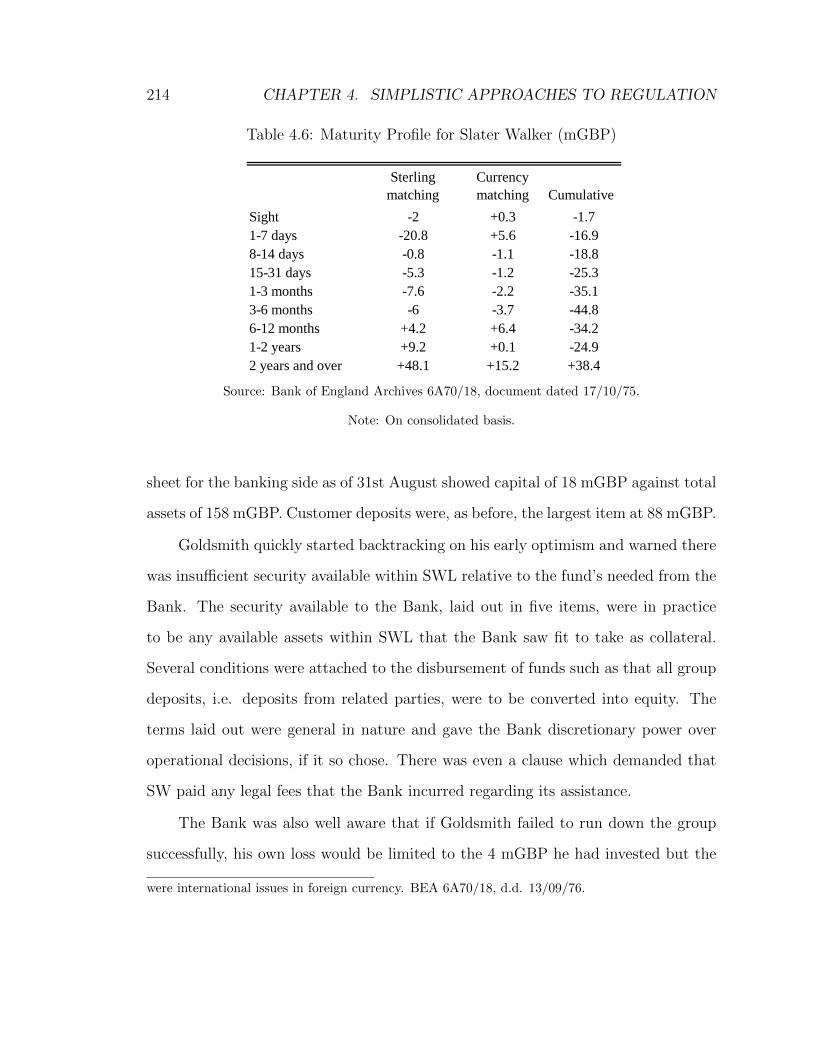
214 CHAPTER 4. SIMPLISTIC APPROACHES TO REGULATION
Table 4.6: Maturity Profile for Slater Walker (mGBP)
Sterling
matching
Currency
matching Cumulative
Sight -2 +0.3 -1.7
1-7 days -20.8 +5.6 -16.9
8-14 days -0.8 -1.1 -18.8
15-31 days -5.3 -1.2 -25.3
1-3 months -7.6 -2.2 -35.1
3-6 months -6 -3.7 -44.8
6-12 months +4.2 +6.4 -34.2
1-2 years +9.2 +0.1 -24.9
2 years and over +48.1 +15.2 +38.4
Source: Bank of England Archives 6A70/18, document dated 17/10/75.
Note: On consolidated basis.
sheet for the banking side as of 31st August showed capital of 18 mGBP against total
assets of 158 mGBP. Customer deposits were, as before, the largest item at 88 mGBP.
Goldsmith quickly started backtracking on his early optimism and warned there
was insufficient security available within SWL relative to the fund’s needed from the
Bank. The security available to the Bank, laid out in five items, were in practice
to be any available assets within SWL that the Bank saw fit to take as collateral.
Several conditions were attached to the disbursement of funds such as that all group
deposits, i.e. deposits from related parties, were to be converted into equity. The
terms laid out were general in nature and gave the Bank discretionary power over
operational decisions, if it so chose. There was even a clause which demanded that
SW paid any legal fees that the Bank incurred regarding its assistance.
The Bank was also well aware that if Goldsmith failed to run down the group
successfully, his own loss would be limited to the 4 mGBP he had invested but the
were international issues in foreign currency. BEA 6A70/18, d.d. 13/09/76.
4.4. THE FALL OF SLATER WALKER 215
Bank’s loss ”might be very much greater”.359 The situation deteriorated further and
the facility provided by the Bank was by the beginning of November estimated at
100 mGBP.360 However, the security available, ”if all goes well”, merely amounted
to 80 mGBP.
It gradually dawned on the Bank that most of both SWL’s and SWS’s assets
were tricky to assess and there were various uncertainty aspects involved with running
a financial institution that the Bank was not used to thinking about. These aspects
included not only the repayment of outstanding loans but also how much money
could be raised by the sale of the bank’s property portfolio, whether the Haw Par
payment would materialize and a myriad of other factors.361 The Bank went through
extensive discussions about possible scenarios and its exposure with good scenarios
ending in minimal direct loss for the Bank while worst case scenarios meant losses
well in excess of 100 mGBP.362 While such a dramatic loss was unlikely, the Bank
could easily see a 50 mGBP loss as necessary and was aware that this could have
severe consequences for the finances of the Banking Department as well as the Bank’s
dividend to the Treasury and payment of tax.363
The plan to buy up outstanding SW debt at a discount was also unravelling
which would make any Bank assistance costlier still. Three options were laid out at
this point, none of which were attractive. The first two involved letting SWS go into
359BEA 6A70/18, d.d. 24/10/75.360BEA 6A70/18, d.d. 6/11/75. The file states that the original facility was for 130 mGBP, of
which 23-30 mGBP was to repurchase the loan stock but the new facility of 100 mGBP was onlyintended to repay deposits, of which the bank had approximately 93 mGBP.361The Haw Par situation was particularly tricky as it was seen as a potential diplomatic dispute.
How it played out in the scheme of SW’s survival was thought to have ” extremely detrimentalconsequences to the U.K.’s relationships with Singapore.” BEA 6A70/18, d.d. 4/12/75.362As discussed in Chapter 2 of this thesis, the indirect costs are much harder to ascertain and
involve implicit subsidies whereby Bank of England support for one institution lowers the fundingcosts for other institutions.363BEA 6A70/18, d.d. 4/12/75.
216 CHAPTER 4. SIMPLISTIC APPROACHES TO REGULATION
liquidation and paying out either small depositors or all depositors and the third to
avoid bankruptcy by paying SWL, saving depositors and recapitalizing SWL.364
The Treasury was kept well abreast of all developments during this period. Its
source of information however was, apart from media reports, mostly Bank officials.
Their scope for independent analysis of the situation and the feasibility and desirabil-
ity of any decisions was therefore very limited.365 In December, with the year-end
deadline for covenant-breaching fast approaching, the Chancellor spoke with the
Governor, the Deputy Governor and Blunden.
After the Bank officials had explained the deteriorating situation to the Chan-
cellor, his staffers came to the realization that there was a non-trivial probability
that the Bank’s capital and reserves were ”seriously at risk”, no matter what policy
was pursued. This meant that a ”heavy loss would not only jeopardise the payment
of future dividends to the Treasury but might force the Governor to ask for an in-
jection by the Government of new capital for the Bank.” Treasury officials were thus
preparing themselves for the very real possibility that the Bank of England itself
would become insolvent following its rescue of SW.366
The Bank eventually agreed to yet another facility of 14 mGBP to enable SW
to repay the loan stocks carrying the most restrictive conditions. This part of the
assistance was swiftly repaid while the agreement for the guarantee to SWL came
364BEA 6A70/18, d.d. 14/11/75.365One example of the Treasury’s role as an inactive, outside observer could be seen following
one of the Chancellor’s meetings with the Bank. After the Bank had explained the importanceof avoiding the covenant breaching, the perplexed Treasury staff commented casually that ”theend of the year was in some unexplained way a big date for this operation” without a request forexplanation by the Bank. TNA T386/293, p1/16.366TNA T386/293, p1/16. The Bank subsequently eased these fears and told the Treasury that
their loss estimate was currently in the 20-40 mGBP range. The upper limit of the range would bereadily absorbed by the Bank’s capital and would result in lower dividends from the Bank to theTreasury but no need for a capital injection. TNA T386/293, p1/18.
4.4. THE FALL OF SLATER WALKER 217
with the requirement that SWL pay the Bank its profits until the company had re-
paid 125% of the amount called. The main advantage of this agreement was that SW
could produce an end-year balance sheet ”unburdened by an obligation to pay the
Bank.”367 The advantage was thus one of financial engineering aimed to alter appear-
ances rather than substance, not dissimilar to the window-dressing loan mentioned
earlier.368
It is helpful at this point to put the magnitude of the Bank’s assistance into
perspective. Provisions were made in the Bank’s accounts for losses arising from
its assistance to financial institutions during the crisis. A breakdown of these pro-
visions were not made public but their approximate amounts were declared to the
Treasury. In early 1976, the provision for losses due to SW assistance was put at 20
mGBP.369 This compares to an accumulated provision for the Lifeboat operations
of 30 mGBP.370 The Lifeboat was obviously a general operation which ended up
supporting several institutions with the maximum amount drawn at 1,200 mGBP.
It should be noted that the 1,200 mGBP figure was the aggregated amount lent by
the clearers as well as the Bank. Nevertheless, the amount lent via the Lifeboat was
vastly higher than that lent to SW but the expected loss due to the Lifeboat as a
whole was only 50% more than that of SW.
It is clear that the Bank’s main rationale for interference in SW specifically was
the protection of unconnected depositors, i.e. those of non-related parties. A second
367BEA 6A70/18, d.d. 14/9/76.368When the Bank conveyed this arrangement to the Treasury, it seems to have been the under-
standing of the Treasury that the 125% clause guaranteed that the Bank were to get its moneyback as well as compensation for the risk taken. The possibility of insolvency did not seem to bethought of. TNA T386/293, p2/1.369TNA T386/293, p2/9.370A clear distinction is made between provisions, which was the estimated amount to be written
off, and the total amount lent in each case. The provisions are therefore the amount of the loanthat is thought to be lost.
218 CHAPTER 4. SIMPLISTIC APPROACHES TO REGULATION
main concern was that of contagion, whereby allowing a recognized bank, in the form
of SWL, to go into liquidation could have serious consequences on other authorized
banks and even on confidence in the British financial system.371 The extent to which
depositors should be protected in fact went so far that the Bank had endorsed a
paper earlier in the year with the clearing banks that suggested that ”deposits with
listed banks were free of credit risk.”372
Another sign of the Bank’s intended support of the financial system in general
came in an internal Q&A briefing of the SW situation. The question posed was ”The
Bank has committed substantial public funds to prevent the failure of an authorised
bank. Is it a matter of policy that an authorised bank should not fail?” The answer
to which was ”The failure of an authorised bank cannot lightly be contemplated and
the Bank would, of course, normally examine all possibilities of avoiding such an
eventuality.”373
This confession, along with the claim that deposits bore no credit risk, can ulti-
mately be construed to mean that the Bank would contribute to loss sharing arriving
from sub-optimal performance of banks. It had by this point become all too clear
to the Bank that it had not been able to supervise the banking system to an extent
where credit risk was eliminated. Several secondary banks had failed or received
assistance at the time of the above question being posed and the intrinsic contagion
within the system had clearly dawned on the Bank. In effect, the combination of
stating that deposits bore no credit risk on the one hand and the ongoing troubles
371Moran (1984) states that SW was rescued because it was authorised to deal in foreign exchangeand its default on Eurocurrency dealings would have ”damaged London’s standing as a financialcentre” (p 92). We do not find evidence of this here, certainly not as a primary motive, althoughthis reasoning will have featured in general discussions on the repercussion of SW’s bankruptcy.372BEA 6A70/18, d.d. 14/11/75. In relation to this, any non-payment of deposits by SW would
cause ”a grave risk of a crisis of confidence affecting other Authorised Banks.”373BEA 6A70/18, Q&A drafts, undated.
4.4. THE FALL OF SLATER WALKER 219
of the banking sector on the other meant that the Bank was not eliminating the
inherent risk of bank operations but merely transferring it from depositors towards
itself.
The Bank didn’t stop to contemplate the wider implications of this policy, in
part because it was still in full-blown crisis mode and was forced to focus on pressing
matters regarding SW’s rescue. The Bank was in close and continuous contact with
Goldsmith and the other new executives at SW. In fact, Goldsmith’s stock within
the Bank had already risen since taking over SW. In correspondence with the Trea-
sury, the Bank had aired their satisfaction as to the way Goldsmith was handling
the rundown of the company and it was ”apparently the Governor’s view that Mr
Goldsmith has reached the stage in his career at which he now wishes to become a
respectable City figure, rather than a financial ”whizz-kid”: the Governor regards
this as a powerful motivating force.”374
Various proposals and scenarios were put forth as to the best solution for the
Bank and Goldsmith was generally helpful. In late March of 1976, a report that
Goldsmith had commissioned the accountants Peat Marwick Mitchell and Price Wa-
terhouse to write was near completion.375 The Bank was to receive an early copy of
the eagerly awaited report which purpose it was to investigate the causes of the SW’s
demise and whether any illegalities had occurred. Goldsmith told the Bank that the
part which pertained to the banking side, SWL, was the most controversial but the
report did not identify many illegalities. He added that ”Basically the S.W.L. story
is [...] one of horrible management.”376
374TNA T386/293, p2/4.375The full report was never made public. Apart from the Goldsmith commissioned report, a De-
partment of Trade investigation was carried out as to the possibility of a ”Section 54” infringement.Section 54 covered rules regarding providance of financing for own shares.376BEA 6A70/18, W.P.C., d.d. 23/3/76.
220 CHAPTER 4. SIMPLISTIC APPROACHES TO REGULATION
This verdict, while absolving SW management of financial fraud in the main,
painted a damning picture of the Bank’s indifference towards SW prior to the crisis.
The dramatic build-up in public deposits within the group caused no concern as
simplified, aggregated ratios that were calculated using published figures did not
raise any alarm bells. The accountants’ report, taken as a whole, was, however, not
as damning a verdict as many had expected.
Apart from the banking issues mentioned above and problems with the insurance
operations, many aspects of the business were deemed by the authors of the report
to have been run professionally, including the property division and investment man-
agement.377 The report estimated that ignoring the Bank’s support, provisions of
66.1 mGBP should have been made in total. This sum was broken down as follows:
29.2 mGBP for the banking side, 14.8 mGBP for the property portfolio, 8.8 mGBP
for the insurance operations and 13.3 mGBP for general investments and associated
companies.378,379 The main criticism was thus reserved for the part of the business
that was supposedly the most regulated, the banking side. It should however be
stressed that the report did not look into the circumstances of past transactions
which was the focus in Raw (1977).
As discussions dragged on regarding the myriad of possible ways to structure the
Bank’s bailout of SW, it became clear that the Bank could not ring-fence SWL and
disregard the holding company, SWS, due to the complex interconnections of the two.
Any rescue of SWL would therefore have to be performed with the secondary task of
keeping SWS solvent. To prevent covenants in SWS contracts being breached, SWL
377The insurance arm criticism centered around three factors; it was said to have been too liquid,hold too many assets of questionable value and too much property content.378Of this 29.2 mGBP, an astonishing 15.5 mGBP was a recommended provision due to a single
situation.379For the Treasury’s view of the report and these matters, see TNA T386/293, p3/5.
4.4. THE FALL OF SLATER WALKER 221
would have to be bought out at close to its book value of 23 mGBP.380 All parties
involved were in no doubt that this price was well above any market value of the
banking subsidiary but the effect of the Bank buying it for under book value would
most likely lead to the downfall of SWS which in turn meant indefensible losses for
SWL itself. Even if SWL could withstand the losses, a liquidator for SWS might
try to include SWL in the liquidation opening up the possibility of litigation - and
major losses - for the Bank.381
There was also the additional issue of secrecy being difficult to maintain for such
a long period of time. The Bank admitted that ”Within the City it must be clear to
all but the most blinkered that the group is being run down.”382 Outside the City,
knowledge of SW’s state of affairs was partial and it was considered ”clear therefore
that the full extent of the group’s problems is not universally appreciated.”
On 15th September 1976 SWS released its annual report and accounts for the
year ending 31st December 1975. This was known by those in the know to be the
event that would place the full extent of the Bank’s involvement, and the amounts
in play, in the public domain. There was therefore considerable preparation involved
within the Bank and Treasury regarding best responses to media coverage. Amongst
the positions prepared was that it be stated openly that the SW operation had
involved no public expenditures but rather only indirect involvement through the
government’s ownership of the Bank.
This argument of only indirect exposure was made to counter the criticism that
public funds were used to prop up a private bank. In the words of the Treasury, the
”Government’s financial concern only arises because it is the shareholder, so that any
380BEA 6A70/18, d.d. 4/6/76.381Capie (2010) p. 563.382BEA 6A70/18, d.d. 25/5/76.
222 CHAPTER 4. SIMPLISTIC APPROACHES TO REGULATION
losses incurred on operations of this kind may effect in due course payments which
the Bank makes to us ”in lieu of dividend”.”383 The extent to which this indirect
exposure is in some way less regrettable than a direct expenditure is arguable.
In case of a loss due to SW, direct exposure would have involved a fiscal outlay
to cover the loss whereas the indirect exposure - the one that was used - manifested
itself as foregone dividends or a lower fair value for the asset at hand, in this case the
government’s ownership of the Bank. The Treasury defence thus involves arguing
about the way the payment, or loss, entered the books - not the amount or ultimate
bearer of loss. But since this defence was to be used against the charge that public
funds were used, they can only be seen as an attempt to muddle the issue and
indirectly argue that any loss would in any case not ultimately borne by taxpayers -
without saying it in those exact words.
The publication of the accounts ultimately carried with it the expected media
firestorm. In the chairman’s statement, Goldsmith briefly summarized the chain of
events starting from Slater’s resignation through to the restructuring of the company.
The tone of the statement was inevitably different to that of the Bank’s comments
and focused on how common it had become for commercial banks to fail. SW’s
demise was thus to be seen as part of a larger problem and not an indictment of
the individuals involved. It’s unlikely that the Bank would ever emphasise how
widespread problems in the City were when explaining its course of action.384
The numbers showed that after provisions of almost 32 mGBP, the net loss for
the year of 1975 had been 42 mGBP. This took the cumulative loss for the previous
two years to 72 mGBP. In explaining the weakness of the banking side’s performance,
383TNA T386/293, p2/13.384Slater Walker Securities, Explanatory Circular, Directors’ Reports and Accounts 1975; Chair-
man’s statement.
4.4. THE FALL OF SLATER WALKER 223
three factors, quoted in full, were emphasised, all of which could have readily been
spotted by Bank officials if a rudimentary analysis of the balance sheet had been
performed prior to the crisis:
1. The small number of very large loans, whose size appeared out of
proportion to the resources of SWL. The four largest loans (ranging
from £5 million to almost £18 million) accounted for 51 per cent
of the portfolio. There were a further 16 loans of over £1 million
which accounted for 31 per cent of the portfolio. Therefore, of the
150 loans, 13 per cent of the total number accounted for 82 per cent
of the total value of the portfolio.
2. The terms on which some £36 million of the loans were granted
included provision for the rolling up of interest.
3. The mismatching of the maturity dates of assets and liabilities due
within 3 months amounted to £57 million, whereas assets realisable
within 3 months were £22 million. The loan portfolio included some
£62 million of loans (before provisions) with an expected repayment
date of over two years.385
As for the balance sheet, it had shrunk to 160 mGBP by the end of the year. This
was however not comparable to earlier years as there was substantial reclassification
of the figures, resulting in total assets for year-end 1974 now being reported as 238
mGBP (down from 393 mGBP). Out of the 238 mGBP, 80 mGBP was said to be
capital and reserves although the arrangement with the Bank of England meant that
the quality of the equity was severely impaired.
385Ibid.
224 CHAPTER 4. SIMPLISTIC APPROACHES TO REGULATION
The coverage of the accounts was understandably widespread, given the fact that
the Bank had managed to keep its assistance a secret for almost a year. Most major
outlets focused on details of the Bank’s assistance, notably on the guarantee and the
loan facility. Much was also made of the accountant’s report with the most quotable
parts drawn out, such as the ”inherent weaknesses” in the group’s lending policy and
the concentration in the loan book. The ”in-house” nature, or interconnectedness,
of SWL also drew a lot of attention. The Financial Times focused on the fact that
the loan book had shrunk from 90 mGBP to 51 mGBP, of which up to 40 mGBP
were bad debts covered by the Bank guarantee.386
All in all, however, the media reaction was not overly critical of the Bank. Most
of the criticism centred on SW executives while the fact that the Bank had put up
unprecedented amounts to rescue the group caused little outrage. While a more
radical rethink of financial regulation and stability was to follow during the end of
the decade and onwards, little reflection was to be found at this stage on what the
Bank’s role in the financial system should be. The implications of the SW rescue
on future crisis episodes were not discussed and neither was the effect of the Bank’s
insistence on viewing deposits as an instrument that was free of credit risk.
As the story was now out, the political pressure intensified with requests for
information being sought from the Chancellor. He addressed parliament and assured
MPs that he had been ”aware of the general approach” adopted by the Bank and
accepted the Governor’s assessment. He further clarified that the total support was
the 70 mGBP standby loan facility and the 40 mGBP guarantee before stressing
that the two were not additive.387 By this he meant that if the guarantee were to
386The Financial Times, ”Slater Walker’s narrow escape”, 15/9/76.387Despite this clarification, and many others, it was regularly reported that they were indeed
additive. Grady and Weale (1986) talk of the Bank being responsible for SWL ”at a cost to the
4.4. THE FALL OF SLATER WALKER 225
be drawn upon, the loans under the facility would be repaid. In a nod to central
bank independence, he admitted that his specific approval of both facilities had been
neither sought nor required.388
A particularly scathing letter was written by the Labour M.P. Frank Hooley to
the Chancellor, in which he denounces the SW rescue operation. The line of criticism
is certainly familiar to anyone loosely acquainted with coverage of any financial crisis
in recent decades:
How is it that £70 million of public money can be used to prop up
the activities of a shoddy swindler like Jim Slater, while the NEB [note:
National Enterprise Board] is having to make do with quite inadequate
resources. Why is it that the Bank of England can rescue any lousy City
twister while manufacturing companies in difficulties have to beg and plead
and argue for the old couple of million to help them out - which is then
made available if at all on the most stringent terms.389
In the following months the asset realisation programme continued within both
SWS and SWL, with Goldsmith assuring the Bank that the group ”was now reduced
almost to a shell”, thus returning it to its initial state when Slater had taken over H.
Lotery in 1964.390 The cash received from asset sales and wind-downs was used to
buy in loan stocks with no new business being sought out. By the end of 1976, 15.5
mGBP of both foreign and domestic loan stock had been bought in at 8.7 mGBP,
Bank of a £70 million loan and a £40 million guarantee” (p.152). Geddes (1987) reports similarlyadditive numbers.388BEA 6A70/18, House of Commons transcript from 13th October 1976. The forthcoming ques-
tion regarding the Chancellor’s involvement had been known beforehand. Much care was taken inconstructing the answers with drafts going back and forth between the Bank and the Treasury asevery sentence was scrutinized.389TNA T386/293, p2/23.390BEA 6A70/18, d.d. 20/12/76.
226 CHAPTER 4. SIMPLISTIC APPROACHES TO REGULATION
giving a discount of 44%.391 This ”profit” on the buyback gave a clue to the extent
of the hole which market participants saw in SW’s balance sheet. Additionally, the
rundown of SWL’s loan book had been outsourced to Hambros.
Another move designed to run down the balance sheet came when the group
moved to smaller premises. Having previously occupied the grand premises next
to St. Paul’s Cathedral that previously belonged to Ralli, the group now took up
residence at the more humble Old Change Court. These moves seem to have pleased
the Bank and there was general agreement that most of the moves being taken by
SW executives were the right ones for all parties involved.
Not everything was rosy however. For one, the group’s insurance operation
seemed ”unsaleable” which lead to uncertain recovery aspects. More crucially, the
Bank estimated the group’s ongoing operations to be yielding a yearly loss of 5-6
mGBP. The disposal of the property portfolio was going according to plan although
a hoped for recovery in property prices which would strengthen the balance sheet
didn’t seem to be forthcoming and interest rate increases had not helped in this
respect. Due to these developments, SWL’s board were considering whether to make
use of the Bank guarantee which lead the Bank to question Goldsmith’s willingness
to remain as chairman.
In a late December meeting with the Governor, Goldsmith reported that the
group was now ”as clean as he could get it.”392 The bad news was that it wasn’t
structurally profitable. The damage could be contained in the short term but losses
would gradually mount. Goldsmith’s favoured solution was to find a bidder for
the company who could take it forward and provide fresh capital to invest in new
391BEA 6A70/18, d.d. 14/12/76.392BEA 6A70/18, d.d. 20/12/76.
4.4. THE FALL OF SLATER WALKER 227
ventures. The major impediments to this plan were the insurance business and the
Bank’s involvement but Goldsmith saw the possibility of an acceptable deal with all
parties and even had a specific buyer in mind.
No such deal materialized, however, and the months passed without any decisive
decisions being taken. Any immediate threat to either SWS or SWL was treated with
urgency, primarily to avoid liquidation but a permanent solution for the group was
not forthcoming. As time went by, the ongoing losses gradually became more of a
concern. A suggestion, refused at first, was finally made by Goldsmith in June of
1977 that the Bank simply buy SWL from the group for a nominal price.
Upon hearing about the refusal, SW representatives threatened that the only
available move at this point was liquidation. The Bank was as ever opposed to
such a move due to several reasons. Among them was not only the financial fallout
- liquidation was estimated to entail 20 mGBP more in losses to the Bank than
restructuring - but also the unwanted media attention and the very real possibility
that SWL would be dragged into it. On another sour note, SW’s advisers notified
the Bank that in the event of liquidation, the group’s board would have no other
choice but to publicly criticize the Bank and blame it for the bankruptcy. It is not
possible to put separate weights on the legal, publicity and financial repercussions
that the Bank faced but the publicity aspect was undoubtedly something that was
not taken lightly.
The Bank thus reconsidered the option of buying SWL out and thus severing
all ties with SWS. The possible net loss scenarios for the Bank now ranged from 29
mGBP to 49 mGBP. Having looked over the options and the estimated losses involved
with each one it was finally decided that the reconstruction option, whereby the Bank
bought SWL for a fee in the region of 1.5 mGBP, was the least costly option, both
228 CHAPTER 4. SIMPLISTIC APPROACHES TO REGULATION
in financial and other terms.393 A sub-committee within the Bank, including the
Governor and Fforde, was subsequently appointed to complete the deal on behalf of
the Bank.394
The Bank also consulted with the Treasury regarding the this option. Treasury
thought it best, for the most part, that decisions regarding how to minimize ultimate
loss due to the SW rescue operations were made by the Bank. In that sense, whether
assistance was to continue in the form of provisions or an outright purchase of SWL
was left to the Bank. The Treasury’s main concerns were however the status of SWL
as a Bank of England subsidiary and, more importantly, whether the acquisition
would be categorized as a public expenditure as this would have an effect on the
highly sensitive fiscal budget and deficit.395
This latter point relates to the urgency placed on the fact, discussed above,
that the SW rescue operations had so far not been seen as a public expenditure
but instead came in the form of lower future dividend payments from the Bank.396
Treasury was thus very much concerned about the categorization of the proposed
takeover of SWL, and less about the real effects. Direct public expenditures were
guarded safely as they had to be accounted for in the budget while indirect expenses
could circumvent the budgetary process. Treasury consequently emphasised the fact
that if the purchase were carried out through the Issue Department of the Bank
393The proposal included various nuances such as a group relief payment from SWL to SWS of 3mGBP in respect of tax losses and the purchase of several properties by the Bank from SWS.394An interesting sidenote came up during the negotiations as it came to light that the structure
as it had been decided entailed a 1.8 mGBP tax charge. It was thus agreed that the transaction bedelayed to prevent this tax charge. It must surely be considered a rarity that the Bank of Englandconduct its business in a way that reduces tax revenue for its colleagues at the Treasury. BEA6A70/18, R.D. Galpin, d.d. 27/6/77.395TNA T386/293, p4/12.396This dividend shortfall was at one point estimated to amount to 3-4 mGBP a year, if the
purchase went through. See TNA T386/293, p4/15.
4.4. THE FALL OF SLATER WALKER 229
it would count as public expenditure while a Banking department purchase would
avoid this.
While the Treasury was not averse to the acquisition and focused mostly on the
budgetary effects of the deal, the possibility of vetoing the Bank’s deal was addressed
in a staffer letter to the Chancellor:
Formally the Treasury has power to give a direction to the Bank on
most things, including over-ruling their assessment in a case like this.
But it would be very out of the ordinary to do so and there are in any
case advantages in letting the Governor act independently and flexibly
in rescue cases. But the corollary of this, which he seems to accept and
which you may wish to confirm with him, is that the responsibility is his
alone.397
This goes back to the Bank Act of 1946, discussed in Chapter 3 of this thesis,
which formalized the ownership and governance issues of the Bank vis--vis the Trea-
sury. While the relationship had been formalized with the act, it had yet to be tested
in practice and this was one of the first instances where Treasury’s power over the
Bank was put to the test. In fact, while the Bank did indeed consult with Treasury
on the matter and indirectly asked if they had any objections, this was more of a
courtesy gesture aimed to keep Treasury in the loop.
Having gone through the formalities with Treasury and ironed out the details,
it was announced on 4th July 1977 that under the reconstruction proposals being
put forward by SWS, the Bank of England would purchase the group’s banking
subsidiary, SWL, for 3.5 mGBP. This was to be the final chapter in the Bank of
397TNA T386/293, p4/16.
230 CHAPTER 4. SIMPLISTIC APPROACHES TO REGULATION
England’s long-winded and complex involvement with the Slater Walker group. In
addition to SWL, the Bank would also purchase two properties for 6.5 mGBP and
SWL would itself buy a 10 mUSD convertible loan note. These purchases were agreed
upon by the Bank in order to provide SWS with necessary liquidity that staved off
default. In an accompanying background briefing for the press, the Bank claimed
that the ”original objective of the Bank’s intervention - namely the protection of
depositors - has now been achieved.”398
The restructuring in general, and the Bank’s purchase of SWL in particular,
inevitably opened up the possibility of some further unwanted media attention on
the Bank. Serious efforts were made to predict the line of questioning from the press
and dossiers of acceptable answers prepared. The tried and tested Bank line was to
be taken, namely that the decisions made were the best possible and other actions
would have lead to greater losses. The protection of general depositors was, as usual,
to be stressed while no precise numbers should be mentioned regarding the estimated
eventual losses but instead the Bank should cite the large uncertainties involved.399
To the relief of the Bank, the intensity of the media attention on SW had mostly
withered away at this point. The post-mortems had come flying in following the
release of the 1975 accounts when the Bank’s involvement became public knowledge.
Most major outlets had used the opportunity to put out reflective articles, focusing
on the rise and fall of the company and, as mentioned above, explaining rather than
criticizing the Bank’s eventual involvement.400 These articles symbolized the end of
398BEA 6A70/18, Background Press Briefing, undated.399BEA 6A70/18, Press Briefing, undated.400Many of these reflective articles also reevaluated the media’s role in hyping up the SW machine.
Many within the profession deemed the media to have been too complicit in the whole affair andnot delved deep enough to properly cover the issue. One of the most detailed reviews came in theSunday Times and went so far as to quote several eulogies from other newspapers, including a 1974quote from the Financial Times, obviously wrong in hindsight, that Slater Walker as a bank was
4.4. THE FALL OF SLATER WALKER 231
the media frenzy accompanying the SW group as there was not much to report on -
at least as far as publicly available information was concerned.
The decrease in media attention gave both the Bank and Treasury space to
evaluate the actions taken during the whirlwind crisis. In one of Fforde’s ”weekly
chats” with the Treasury, during the summer of 1977, he relayed that from the
Bank’s point of view, its actions regarding SW could justifiably be criticized, both
with regard to the ”overall extent of assistance” as well as the methods chosen.
They would however, according to Fforde, ”probably not have to face that criticism,
because there would be few who had the knowledge and expertise to formulate it,
and many of those who might be qualified were wrong-footed because of previous
public support of Slater Walker.”401
This proved to be the case as general interest in the SW affair, both from the
public and by the press, quickly subsided as time passed. The name of SWS was
changed to Britannia Arrows Holding Ltd at the end of 1977 and the group ultimately
merged with Invesco in 1988. No inquest was made into the whole affair and there
was little urgency in increasing the Bank’s responsibility when it came to rescue
operations. The interest had in fact decreased to such an extent that the Bank was
never forced to publish its true loss resulting from the SW rescue operations.
No mention was even made of SW in the Bank’s published accounts until the
takeover had been completed. A note accompanied the Bank’s accounts following
the crisis which revealed the amount of provisions needed due to ”advances made,
and guarantees entered into, in connection with the Bank’s involvement in support
at the time ”underlent, and what doubtful debts there are, are well covered by the reclassificationof inner reserves” The Observer received the same treatment with a 1972 quote: ”When the nextbear market comes, Slater, at least, is not going to be caught napping.” Sunday Times, ”The JimSlater Verdict: Puncturing the City’s indiarubber idol”, 19/9/76.401TNA T386/293, p5/15.
232 CHAPTER 4. SIMPLISTIC APPROACHES TO REGULATION
operations.” The figure for the 1978 accounts is 10.2 mGBP although this is after
allowances for provision reductions due to Gilts. Capie (2010) says that the true
1978 amount was 25.6 mGBP.402 No further details are given in the public accounts
although a further note regarding ”investments in subsidiaries” states that during the
year the Bank had purchased 100,000 ordinary shares of SW and 10m deferred shares.
It is furthermore mentioned that consolidating SW into the banking department’s
accounts would have been ”misleading” in the view of the Directors.
Even the Bank’s aggregate losses due to the secondary banking crisis remain
elusive. According to Capie (2010), an internal note written in 1984 estimated that
the total losses would be approximately 80–90 mGBP.403 Reid (1982) p. 190 estimates
the losses at 100 mGBP while Grady and Weale (1986) counter that Reid’s figure
excludes 200 mGBP of losses due to the Crown Agents scandal which they argue was
”effectively a loss to the taxpayer as shareholder in this public corporation”.404
Capie (2010), with access to classified material, finds that 38 mGBP of provisions
were made due to SW through to 1980 and 7.8 mGBP, subsequently written off,
thereafter. The proportion of the 38 mGBP provisions that were written off is not
mentioned although a significant part of it is likely to have been lost. If the total
amount was written off, that would put the total losses at 46 mGBP, compared to
Bank total capital at year end 1976 of 121 mGBP. This accounting loss obviously
does not take into account the foregone interest that went along with the Bank’s use
of funds. Ultimately, calculating the precise extent of the final losses is impossible.
Moran (1984), writing nine years after the end of the immediate secondary crisis,
402See Capie (2010) p. 582 for a discussion on the costs to the Bank. While he mentions thatin 1994 the provision for support given in the 1970s stood at 55 mGBP, Capie concludes that itappears impossible to calculate definitively losses to the Bank from the secondary crisis.403Capie (2010) p.581.404Grady and Weale (1986) p. 152.
4.4. THE FALL OF SLATER WALKER 233
puts it as follows:
Any narrative of the rescue might reasonably conclude with an esti-
mate of these costs. The task is impossible: the monetary costs have been
hidden, the other costs are literally incalculable. It is the last great tri-
umph of esoteric politics that the Bank has without difficulty declined to
reveal the full size of its involvement. [...] The refusal to reveal true costs
was entirely in keeping with the tradition of banking politics in Britain.
The Bank took the view that the money used was from its own resources,
and that details about losses were sensitive banking issues best dealt with
confidentially.”405
In addition to these very real direct costs, the implicit costs, covered extensively
in Chapter 3, need to be added to the total tally. The Bank, in safeguarding deposits
by any means necessary, explicitly and implicitly removed credit risk from deposits
leaving any dangers due to commercial banks’ operations to be dealt with via the
Bank’s own balance sheet. As seen in Chapter 3, these costs are by no means easier
to calculate than the direct costs discussed above but remain very real in terms of
burden allocation in response to crises such as that of Slater Walker.
Finally, Table 4.7 shows Slater Walker’s role in comparison to other rescue
operations during the crisis. The Support Group consists of the so-called lifeboat
operations which was taken on by the Bank in collaboration with the main clearing
banks. The unilateral operations were taken on at the Bank’s own risk, after the
clearers had announced that they wouldn’t partake in further rescues. As can be
seen, Slater Walker, along with Edward Bates, represent the largest rescues by far
405Moran (1984) pp. 111-112.
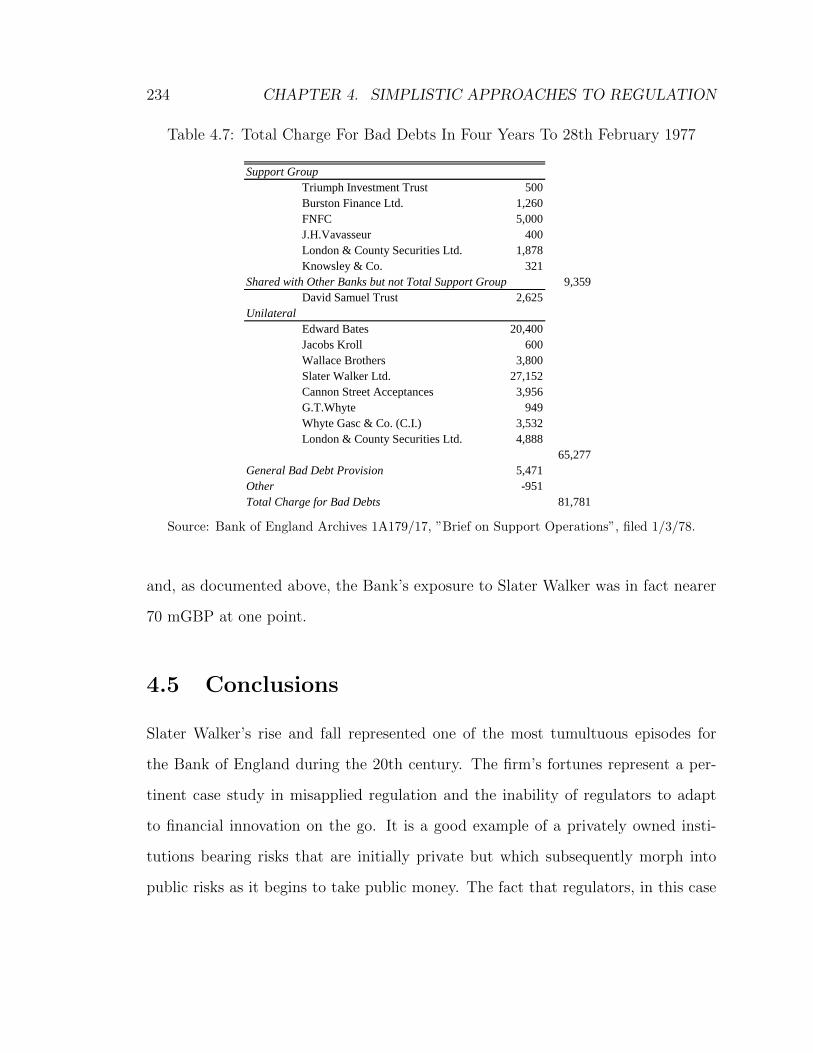
234 CHAPTER 4. SIMPLISTIC APPROACHES TO REGULATION
Table 4.7: Total Charge For Bad Debts In Four Years To 28th February 1977
Support Group
Triumph Investment Trust 500
Burston Finance Ltd. 1,260
FNFC 5,000
J.H.Vavasseur 400
London & County Securities Ltd. 1,878
Knowsley & Co. 321
Shared with Other Banks but not Total Support Group 9,359
David Samuel Trust 2,625
Unilateral
Edward Bates 20,400
Jacobs Kroll 600
Wallace Brothers 3,800
Slater Walker Ltd. 27,152
Cannon Street Acceptances 3,956
G.T.Whyte 949
Whyte Gasc & Co. (C.I.) 3,532
London & County Securities Ltd. 4,888
65,277
General Bad Debt Provision 5,471
Other -951
Total Charge for Bad Debts 81,781
Source: Bank of England Archives 1A179/17, ”Brief on Support Operations”, filed 1/3/78.
and, as documented above, the Bank’s exposure to Slater Walker was in fact nearer
70 mGBP at one point.
4.5 Conclusions
Slater Walker’s rise and fall represented one of the most tumultuous episodes for
the Bank of England during the 20th century. The firm’s fortunes represent a per-
tinent case study in misapplied regulation and the inability of regulators to adapt
to financial innovation on the go. It is a good example of a privately owned insti-
tutions bearing risks that are initially private but which subsequently morph into
public risks as it begins to take public money. The fact that regulators, in this case
4.5. CONCLUSIONS 235
primarily the Bank of England, are not aware of these developments as they happen
ultimately lead to realized burden-shifting when the firm fails. Pinpointing the ex-
act date where the private risks on SW’s balance sheet morphed into risks for the
Bank, and thereby the public, is impossible. However, it is unlikely that the risks
would have been allowed to remain private ones once the takeover of Ralli had been
completed in 1969.
As covered in this chapter, the Bank of England became aware of Slater Walker
and its operations when it acquired licensed banks and thus came under regulatory
scrutiny. The time to prevent later problems within SW would thus have been the
point in time when the company acquired its banking business. Only by taking a
close look at the company’s accounts would the Bank have been in possession of
the information necessary to see the true state of Slater Walker. Instead it relied on
sporadic and simple ratios from the aggregated annual accounts to assure themselves
that the business was sound. Drawing a line between these ratios and the true
economic state of the company involved several assumptions which ultimately meant
that the Bank was oblivious to any mounting problems.
Finally, how representative was Slater Walker in comparison to the demise of
other secondary banks during the period? While the goal of this chapter hasn’t
been to use the company as an analogy for the crisis as a whole, it is worthwhile to
consider how it compares to other failures and rescues at the time. In terms of size,
SW was amongst the biggest secondary banks, although it was not much larger than
other notable cases such as First National Finance Corporation or Keyser Ullman.
As for the rescue by the Bank, it stood out from many of the typical secondary
banks as it was not orchestrated through the Lifeboat. This was primarily due to
the fact that the cap of 1200 mGBP had by then been breached and the Bank had
236 CHAPTER 4. SIMPLISTIC APPROACHES TO REGULATION
to schedule subsequent failures on its own, without the clearers.406,407 SW’s troubles
were however, as we have seen, symptomatic to that of the secondary banks in
general, with the rapid growth, property exposure and lack of market disciplining all
present. In that sense, the chapter’s analysis and narrative can be seen to apply to
the crisis in general and the problems faced.
Turning to the various participants involved, there was considerable weariness
towards the crisis at the time of the rescue. The Bank felt that the situation had
stabilized somewhat and that it was better able to deal with issues that came up
than at the onset of the crisis. Its insistence on as much secrecy as possible also
contributed to a somewhat subdued atmosphere. Under different circumstances, an
isolated failure of Slater Walker could have caused greater commotion. Below we
look at the role played by each of the actors that can loosely be seen as serving the
role of public guardian.
The Press
In retrospect, was the press oblivious to the forthcoming problems and if so,
were they all equally oblivious? As the various instances of the coverage above
indicate, the media took what can be described as a pro-cyclical stance towards
Slater Walker. During the company’s growth years, coverage was near-unanimously
positive and, although the effects are not quantifiable, this positive coverage helped
create the public profile of the company and especially Slater himself which facilitated
increased funding opportunities from the public.
Given the dearth of information at the time, it can be argued that the press was
lacking the means to evaluate the performance of both the banks and the Bank of
406See Reid (1982) p. 138.407Slater Walker was one of three large unilateral rescues by the Bank of England, the other two
being Edward Bates and Wallace Brothers. See Capie (2010) p. 556.
4.5. CONCLUSIONS 237
England. There was, for example, no Freedom of Information channel that the Bank
had to adhere to until 2005 (when the FOI act of 2000 came into effect).408 However,
there is no indication, neither in the mainstream nor investigave reporting of the
time, that the press felt it needed greater information to assess the performance of
the banks or the vigour of the Bank of England. Statements were generally taken at
face value.
The turn-around in press sentiment was also in line with the turn of the economic
and financial cycle. As soon as equity prices started their decline the coverage towards
companies such as Slater Walker turned negative. The press started to question the
value of various financial operations and the criticism increased as the credit cycle
worsened further. The case could certainly be made that the coverage overshot in
both directions.
The uncritical praise heaped on companies such as Slater Walker in the late
1960s and early 1970s was facilitated by journalists that didn’t seem to put much ef-
fort into understanding the figures or the business itself. The coverage was frequently
based on quotes from company executives and what numerical coverage there was
centred on headline numbers, as presented by the company. Likewise, the criticism
during the downturn reflected the sentiment of the time and did not seem to be based
on any newfound understanding of the company’s business.409
Regarding the second part of the question, most of the largest outlets were guilty
of this, including the Telegraph, Observer, Financial Times, and the Economist. A
notable exception was The Sunday Times, although their coverage often suffered
408For a recent evaluation of how such channels can work, see Karlson (2010) who covers the recentFOI requests in the U.S. following the global financial crisis.409This relates to the recent increase in quantitative methods in the media, for example in political
coverage. See Silver (2012).
238 CHAPTER 4. SIMPLISTIC APPROACHES TO REGULATION
from these cyclical stances as well. One big reason for the Times’ more nuanced
coverage of SW was the efforts of Charles Raw, the same Raw who later wrote the
book on SW. In sum, however, it is difficult to see signs of the press providing
checks and balances for investors and the general public during the SW story or
for the secondary banks in general. Determining whether this was due to a lack of
resources, misaligned incentives or other issues is beyond the scope of this thesis but
less pro-cyclicality in the investigative press’s coverage could certainly have helped
with regards to market discipline.
The Treasury
Treasury served a very indirect role as public guardian during the Slater Walker
episode and the secondary banking crisis. It relied almost solely on the Bank to
carry out government’s involvement in the financial sector. This was despite the
fact that the Bank was somewhat uneasy in viewing itself as a branch of the public
sector as well as the fact that it only reluctantly shared information with Treasury.410
While there was some tension between Treasury and the Bank regarding leniency and
terms of assistance, the only concrete decision made by the former was to trust the
judgement of the latter in matters of assistance. This passivity can be seen as being
driven by the fact that Treasury was almost solely concerned about items that were to
fall under the budget. As the Bank’s losses didn’t reach a level that meant a capital
injection from Treasury was required, the latter didn’t feel the need to concern itself
with the Bank’s minutiae.
The Bank of England
As for the Bank of England’s role, several items stand out regarding its handling
of the SW affair. First of all, its attempts at regulating SW during the firm’s lifetime
410See Chapter 3 for a discussion on how the Bank viewed itself.
4.5. CONCLUSIONS 239
were nothing short of naive. By relying on aggregated ratios and casual chats with
the firm’s management, the Bank completely missed the interconnectedness of the
group and the complications involved with trying to separate the banking side from
the group. The Bank was also completely unaware of the illiquidity of the balance
sheet and the concentration of its loan book.
Finally, the Bank never owned up to the problems with viewing public deposits
as bearing no credit risk. The fact that the operations undertaken by banks are
inherently risky means that for the liability side of their business - i.e. deposits - to
be risk-free there must be a risk-transfer of some sort. The Bank may possibly have
had the view that it could foresee any upcoming problems and take action to prevent
any fallout but the experience of 1973-1975 should have laid any such ideas to rest.
The fact that they did not meant that the crisis management facilities became a tool
of risk-transferring, no less than stability providing.
What did the Bank think of its own supervisory performance in hindsight? A
clue came in the previously mentioned internal Q&A brief where several aspects of the
SW rescue came up. Under the heading ”Supervision Arrangements”, the question
was posed whether the Bank thought it had obtained ”adequate information” from
SW in the period from September 1974. The reason for focusing on this date seems to
have been the increased supervisory procedures announced by the Bank at that time.
The constructed answer didn’t address the question directly and focused instead on
the complicated structure of the SW group. The Bank did however recognize that
the ”in-house nature” of the banking subsidiary was not adequately recognized.411
In response to similar questions the Bank placed similar emphasis on the renewed
vigour of supervisory activities following the September 1974 changes. It thus neither
411BEA 6A70/18, Q&A drafts, undated.
240 CHAPTER 4. SIMPLISTIC APPROACHES TO REGULATION
addressed the issue of information adequacy in relation to supervision of deposit
taking institution nor indeed the fact that the Bank, by viewing deposits as bearing
something close to zero credit risk, was in the business of guaranteeing deposits in
the event of commercial bank difficulties.
The official Bank-approved view was finally revealed in its June 1978 Quarterly
Bulletin in an article titled ”The secondary banking crisis and the Bank of England’s
support operations”.412 The article states explicitly that depositor protection was
the Bank’s main concern and that avoiding disturbance in other related financial
fields was an added benefit. Apart from that, the article only mentions the whole
SW affair in terms of retelling the story and provides little in the way of potential
lessons learned. As for the crisis in general, it is emphasised that changes were at this
point in time underway with regard to supervision and regulation. Finally, the view
is given that the proposed arrangements, which were to culminate in the Banking
Act of 1979, would ”go far to reduce the risks of major difficulties arising and [...]
provide a satisfactory basis for dealing with any which do occur.”413
The official view can thus be summarized as stating that the Bank’s main goal
had been achieved and that any losses were unpreventable. Furthermore, any flaws in
the system would be addressed in the upcoming reforms. There was therefore very
little introspection as to removal of depositors credit-risks, the costs of achieving
depositor protection or explicit figures as to losses due to SW or other rescues of the
time. Furthermore, by the time the article was published, memories of the crises had
already faded considerably and attention had moved on to more recent and pressing
412Bank of England (1978). The general tone of the article is covered in Chapter 3.413Bank of England (1978) p. 236. The Banker, commenting on the act, was of the opinion that it
would be seen by the bankers as ” a necessary inconvenience. Some might even regret that the UKsfirst banking Bill is so evidently not momentous.” (The Banker, ”Britain’s Banking Bill: Umbrellaor Safety Net?”, Vol 128 pp. 23-27.)
4.5. CONCLUSIONS 241
matters.
This also goes back to the time inconsistency discussion in Chapter 3, especially
the simplified game presented there. Put in that context, one can argue that the
Bank’s decision to intervene in Slater Walker once the crisis started was a prudent
one as forcing losses on depositors would have invited contagion. This argument is
addressed in greater detail in the next chapter. However, it is also easy to argue
that the Bank could have done more to prevent this scenario from arising at the
time when it was mostly concerned with comparing standard ratios across banks.
The Quarterly Bulletin article contains very little in terms of lessons for future crises
and how the Bank intended to change its regulatory policies following the secondary
crisis.
As for assessments of the Bank’s crisis management performance from the out-
side, the most direct discussion of the lack of information sought by the Bank and
its stand-off approach possibly came in a Slater Walker obituary in the Economist,
under the heading ”The Bank learns”:
Why was the Bank of England taken by surprise by the size of the
doubtful debts in the Slater, Walker banking subsidiary? They were ap-
parent to the new board as soon as MR Slater quit. The Bank’s new
system of bank supervision had begun a full year earlier in September,
1974. So three, and possibly four, of the quarterly returns now made
would have reached the Bank.
Answers: the Bank’s supervisors were impressed by the size of Slater’s
cash balances and by the fact that it had not needed lifeboat funds. The
degree of inter-group business did not show up on the returns. The su-
pervisors paid insufficient attention to the equity stakes in banking clients
242 CHAPTER 4. SIMPLISTIC APPROACHES TO REGULATION
held by other Slater companies and so did not ask the right questions.
Says a spokesman for the Bank: ”we live and learn.”414
414The Economist, ”The Bank learns”, 18/9/76.
4.A. SLATER WALKER DIRECTORS AND ORGANIZATIONAL CHART 243
Appendix
4.A Slater Walker Directors and Organizational
Chart
Directors as of year-end 1967
J. D. Slater - Chairman and Managing Director
P. E. Walker - Deputy Chairman
M. Horsman - Director
A. J. H. Buckley - Director
J. Ford - Director
A. J. H. Buckley - Secretary
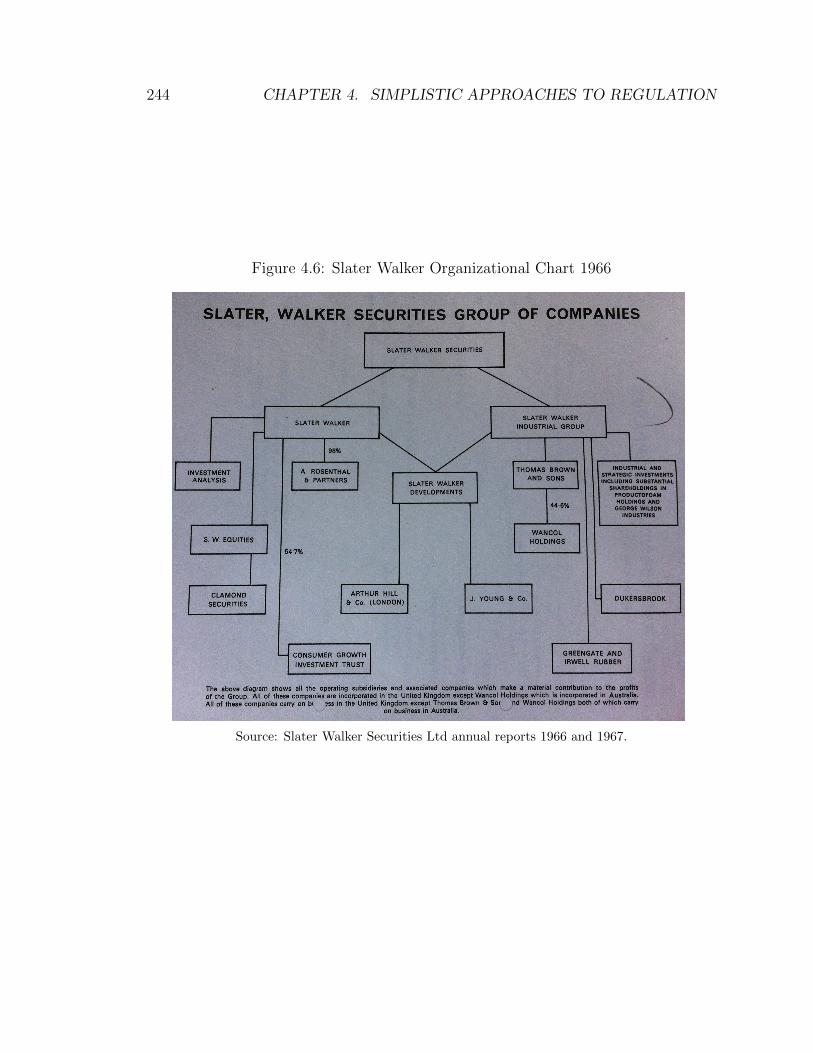
244 CHAPTER 4. SIMPLISTIC APPROACHES TO REGULATION
Figure 4.6: Slater Walker Organizational Chart 1966
Source: Slater Walker Securities Ltd annual reports 1966 and 1967.
Chapter 5
Interdependence and Contagion
5.1 Introduction
As mentioned in previous chapters, contagion within the financial system was - along-
side the protection of small depositors - the primary motivation given by policymakers
for intervention during the secondary banking crisis of 1973-1975. In this chapter,
use is made of previously confidential data to shed light on these issues and also
try to establish how crisis episodes, such as during the secondary crisis, differ from
more normal market conditions. In so doing, an attempt is made to answer a general
question, applied to the subject matter at hand: To what extent do banks face the
same liquidity problems during crises and to what extent do creditors differentiate
between banks when withdrawing funds? Furthermore, how do banks themselves
react to and experience such episodes?
To help shed light on this matter, the empirical section of the chapter looks at
both developments within the core and the reaction of the core to the problems of the
fringe. For the former, a new data set is constructed, consisting primarily of monthly
245
246 CHAPTER 5. INTERDEPENDENCE AND CONTAGION
balance sheets for the bulk of the 20th century for the Big Four banks in Britain.
This data recently became available under the 30-year rule and gives a more nuanced
view of balance sheet developments during the sample period than could previously
be achieved.415 This data can help shed light on several aspects of the question at
hand. Firstly, the data allows us to determine to what extent the biggest banks of
the period witnessed depositor withdrawal at the height of crisis episodes or whether
they were able to elude the panic that was wreaking havoc on other institutions.
While the banks’ official accounts show no signs of panicked withdrawal during the
period, this could be due to the fact that the accounts are of a low frequency and
only reveal a glimpse at one point in time that also happens to be pre-approved by
management. On a related note, we can look at periods of calm and see whether
there is a marked difference in depositor - and bank behaviour - during times of
tranquillity as opposed to marked volatility.
Secondly, the data can help with analysis of how closely figures such as deposits
and cash co-moved between the banks throughout the period. If it is the case that
there is heightened interdependence of deposit flows amongst banks during crises
it is easier to make the case that a true lender of last resort should take steps to
negate a general run on the system.416 This is the so-called contagion argument.
By looking at the co-movement between banks we can see both whether there is
general correlation between them as well as whether any general co-movement found
is heightened during crises.417
415The 30-year rule and its recent changes are explained in greater detail in Chapter 1 of thisthesis.416See Chapter 1 on the distinction between a lender of last resort and crisis management more
broadly.417The extent to which the plotting of these co-movements can determine actual contagion is
debatable and is covered further below. In the chapter, the term contagion is generally not usedfor the empirical exercise and instead restricted to policymakers’ and banks’ own discussions.
5.1. INTRODUCTION 247
It should also be stressed that while we know that the secondary crisis did not
lead to the demise of the largest banks, it has not been established whether there
were any less-dramatic effects of the crisis on the core of the system. This applies
to both the developments for individual banks as well as the relationship within the
system. The former would, for example, include a possible drain of deposit at the
onset of the crisis which was reversed following the Lifeboat operations. The latter,
could be in the form of heightened or decreased correlation between banks during
the crisis. The data presented in this chapter can help shed light on these matters.
Furthermore, previous studies have focused on market prices when estimating
interdependence due to lack of availability of other, more relevant, high frequency
data. Using the data set employed in this chapter, comparisons can be made as to
the extent to which equity holders and deposit holders reacted differently in response
to the crisis and whether there was greater co-movement in one market or the other.
As for the second part of the empirical section, that of the effect of the fringe’s
problem, use is made of equity price data of several of the banks that failed dur-
ing the period, obtained from the Financial Times archives. Following up on the
interconnectedness exercises described above, adding data on the fringe banks can
help show to what degree they affected the core and whether the fringe’s problems
contain predictive power for the Big Four. The results from this exercise can also
be put into the context of the policy response to the problems, most notably the
Lifeboat, as well as any possible discrepancy between equity and deposit reactions
to the crisis.
The overarching goal of this chapter is, however, to look in greater detail at
the Bank of England’s contagion rationale for intervention during the secondary
banking crisis. This is done quantitatively, as described above, but also qualitatively
248 CHAPTER 5. INTERDEPENDENCE AND CONTAGION
in Section 2. The emphasis there is on using archival data to document the banks’
decision making process, their communications with the Bank and their response
to the crisis. In addition to providing support to the quantitative sections, the
qualitative section tries to shed light on how the Bank devised its crisis management
strategy as the crisis wore on. How the Bank attempted to maintain market discipline
while supporting the banks figures heavily as well as its collegial spirit towards the
banks.
The underlying assumption behind any intervention on behalf of a public entity,
such as a central bank, in financial markets is to correct some market failure and
adjust the market mechanism so as to ensure a healthy market environment. Another
underlying assumption is that this market adjustment is revenue neutral, in the sense
that the undertaken adjustment does not involve a redistribution of funds towards -
or from - the institutions involved.418 It is merely enacted to correct a market failure
and to enable private institutions to function as if the market worked without these
frictions.
In the case of financial market contagion, and banking contagion specifically,
irrational creditor withdrawal from solvent banks due to informational imperfections
leads to a sub-optimal solution which could be mitigated by public support. This
support, in the form of replacing private credit with public, would thus help solvent
but illiquid institutions ride out the withdrawal period until private credit returns and
the situation normalizes. For this mechanism to work as envisioned, three conditions
must be fulfilled.
418We omit the case here whereby a bank is insolvent and is judged to be too systemically importantto fail. In such a case, there may be an argument for subsidizing the entity involved, although theargument for nationalization is stronger in this case. This was not the scenario during the secondarycrisis, however, so we focus on the general case as in the literature.
5.1. INTRODUCTION 249
First of all, the supported bank must in fact be solvent and not be suffering
from illiquidity because its liabilities exceed assets. Second of all, the public entity -
generally the central bank - needs to have superior information to private creditors
if it is to correctly counter any perceived informational market failure with regard
to solvency of banks.419 Thirdly, the public entity must price the credit provided in
a manner so as to emulate as exactly as possible the way in which private creditors
would provide credit if they had the same information as the public entity. If the
public credit is provided at a discount to the price of private credit, the facility would
represent a subsidy from the public entity to the bank.
A counterargument to this formulation is that the market failure is on the supply
side rather than the demand side. That is to say, creditors are not withdrawing
funds and squeezing banks due to concerns of insolvency but rather due to a recently
heightened liquidity premium and a need for cash. In this case, the banks in trouble
could call on the central bank to provide the funds needed. However, in order to
correct this type of market failure, the same requirements of distinguishing between
illiquid and insolvent institutions and pricing the assistance correctly are required in
order for the principle of revenue neutrality to be upheld and the assistance to be a
clear case of correcting a market failure.
Before proceeding, one might find it helpful to pin down exactly the terms used
in the literature. This is difficult, however, as several definitions have been made
for most of the terms at hand. Even the term contagion itself is not homogenous
419On this second point, see for example Myerson (2014) who argues that ”To do its job, then,the central bank needs more than just a deep ability to issue more money when necessary; it alsoneeds some basic expertise in evaluating financial investments, so that it can identify when a bank’sinvestments can be taken as good collateral. In this sense, a lender of last resort may be betterunderstood as a monitor of last resort, and its bold lending then serves as public signal that theborrowing banks have been found creditworthy by the experts at the central bank.” (p. 202)
250 CHAPTER 5. INTERDEPENDENCE AND CONTAGION
as it can occur between institutions, countries and currencies giving rise to different
definitions in each case. One example is Forbes and Rigobon (2002) who look at the
emerging market crises of the 1990s and define contagion as ”significant increases
in cross-market linkages after a shock to one country (or group of countries)”.420
While pointing to other definitions, they note that this definition has been used
substantially in the literature.
This definition has in fact come under some criticism for the fact that it does
not specify any causal linkage but rather rests upon a statistical development found
in specific time series. The counterargument would, however, be that specifying a
single channel as the true definition of contagion would limit the term and force it to
become too narrow. For the purposes here, I simply refer to interconnectedness or
interdependence to avoid the ongoing debate on the correct usage of the contagion
term.421 The empirical exercises can thus be seen as an attempt to measure the
degree of comovement and correlation while not necessarily implying a shock to a
single institution which subsequently spread throughout the system (as the term
contagion could be interpreted).422
A brief mention should be made of some institutional factors to keep in mind in
the specific case of interdependence under consideration here. One can think of the
British banking system at the time as a two-tier system; the secondary banks and
420Forbes and Rigobon (2002) p.1. Among others to use the exact same definition is Claessens etal (2000) who also summarize the recent findings in the literature at the time of writing. In a morerecent review, Claessens and Forbes (2004) discuss the difficulties of definitions and different typesof contagion in more detail.421For more on these debates, see Billio and Pelizzon (2003) as well as Corsetti et al (2005).422See Forbes and Rigobon (2002) who focus on the the distinction between contagion and co-
movement.
5.1. INTRODUCTION 251
the clearers.423,424 As discussed in Chapter 2 of this thesis, the secondary banks, as
fairly new institutions, pursued aggressive lending growth in the years leading up to
the crisis and were thus particularly vulnerable to the dry-up in liquidity and housing
slowdown that accompanied the crisis.
The decision that policymakers then faced was whether to intervene or let the
institutions that lost access to funding fail. The decision was taken to try to dis-
tinguish between solvent and insolvent banks, along the lines of the mechanism de-
scribed above. As mentioned above, the two reasons for doing so were protection
of small depositors and the threat of contagion towards larger and more established
institutions, including the Big Four.
These actions have a big effect on the study in this chapter as there is no
counterfactual. The realized developments of cash and deposits of the big banks
will not shed light on the interdependence effect that could have materialized if
policymakers would not have intervened in the secondary banks and safeguarded the
rest of the system. What can be done, however, is threefold: Firstly, to see whether
in the long-run there are signs that the liquidity patterns between the banks are the
same. Secondly, whether there is a heightened volatility of the time series during the
crisis, and, finally, whether policymakers can reasonably be thought to have based
the contagion argument on what they were actually seeing in the data or whether
423In fact, the system was multi-layered with merchant banks, accepting houses, clearing banksand secondary banks (and some interlap between categories). Griffiths(1973) and Rowan(1973)describe the system of the time in its connection to monetary policy. Grady and Weale (1986)provide a more general overview. For our illustrative purposes here, a two tier description is moreappropriate.424This classification is somewhat similar to that used by Upper and Worms (2004) in describing
the German banking system. They specify an ”upper tier” which consists primarily of commercialbanks, and a ”lower tier” which includes savings banks and cooperative banks. Figure 4 in theirpaper (p.837) describes a mechanism similar to that of the British system at the time, more fullydescribed in previous chapters of this thesis.
252 CHAPTER 5. INTERDEPENDENCE AND CONTAGION
the moves taken were motivated either as a pre-emptive course of action or due to
more anecdotal evidence of contagion elsewhere in the system.
The most common method of looking at contagion episodes is by analyzing
dynamics in co-movements of readily available market data. Such studies gained
in popularity following the Asian crisis of the 1990s.425 A multitude of papers were
published, using readily available data such as equity prices to look at whether differ-
ent countries that experienced crisis during the late 1990s also experienced increased
co-movement leading up to, and during, the crisis. The methodology in such papers
is often to look at development of cross country correlation and analyze whether
an increase takes place during crisis episodes. Other popular methods include time
series techniques such as cointegration and error correction models, as well as cross
country regressions which focus on ”excess” returns influenced by external events.
Such methods have also been popular in analyzing the Great Depression along
both internal and external channels. This has involved looking at contagion between
countries during the depression as well as amongst institutions within specific coun-
tries that were hit by the crisis. This latter approach is similar to the one taken here
as the focus is on the dynamics between specific institutions within a single country.
The novelty of this chapter lies in the choice of data as described later in the chapter.
The chapter proceeds as follow. Section 2 provides the historical background of
the topic at hand. The section introduces new material on the secondary banking
crisis and adds to the narrative of previous chapters. Specifically, we look at the
response to the crisis from the point of view of the banks themselves, as opposed to
425The discussion here is intended to give a sense of how the topic is tackled to provide perspectivefor this chapter. However, Goodhart and Illing (2002) represents a fine report on the stance of theliterature, especially following the Asian crises. Allen and Gale (2000) also represents a focal pointin the literature.
5.2. THE BIG FOUR’S REACTION TO THE CRISIS 253
a greater focus on the Bank of England in previous chapters. Therefore, while the
role of the Bank of England is discussed in this chapter, it is focused on the reaction
to the banks’ actions and the developing relationship between the two. Section
3 describes the data used, its origins and also provides some summary statistics.
Section 4 presents the empirical methodology for the interconnectedness study and
results. Section 5 expands on these exercises by looking at the effect of the secondary
banks on the core of the system. Section 5 concludes.
5.2 The Big Four’s Reaction to the Crisis
In this section the environment of the institutions under consideration is described
- most notably the same ”Big Four” as in previous chapters - and how they viewed
the looming difficulties surrounding the secondary crisis. However, the goal is not to
go through the rescue measures taken in detail or build a narrative of how the crisis
was dealt with in general as these issues are covered in other chapters of this thesis.
Instead, we look at previously unused archival material on the crisis reaction as it
related to the Big Four, try to put it in the context of contagion and by extension
the possible knock-on effects of the secondary banks on the clearers.426 The Bank of
England and its role is thus viewed through the lens of the clearers and the Bank’s
relationship with them.
As discussed in greater detail in Chapter 2 and Chapter 3, the Bank of England’s
426A disproportionate amount of the primary sources used in this section comes from the Lloydsarchives, despite the general coverage consisting of the Big Four. This is due to the fact that theLloyds archives store a large amount of information pertaining to the Big Four in general, such asCLCB minutes and material passed on to all of the Big Four from the Bank of England. This isalso the case for much of the quantitative data in later sections which are stored by Lloyds butcome from the CLCB. Furthermore, Eric Faulkner, Chairman of Lloyds, served as chairman of theCLCB for a large part of the secondary crisis and thus recorded large amounts of the Big Fourcommunications.
254 CHAPTER 5. INTERDEPENDENCE AND CONTAGION
focus during the period was very much on the monetary policy side and as Rowan
(1973) notes, ”the volume of bank deposits [..] was unimportant in the transmission
process” as it was thought of at the time.427 The greater emphasis on competition
in policy circles in the 1960s changed this somewhat, however, particularly with the
introduction of the Competition and Credit Control policy.428 However, the onset of
the secondary crisis, starting in 1973, led to a sudden slowdown - if not rethink - of
such policies being implemented and the competition for deposits did not completely
reach into the clearing bank tier of the system until after the sample period.
Looking further back, Griffiths (1973) in fact argued that the policies of the Bank
of England, which had historical roots through the latter half of the 19th century and
onwards, actively sought to encourage ”restrictive agreements” within the banking
system and subsequently increased concentration and cartel like behaviour. Griffiths
mentions two major reasons for seeking out such policies. Firstly, that monetary
aggregates can be controlled much more effectively within a concentrated system
and, secondly, that cartelling and decreased competition would lessen the probability
of bank failure. This latter reason is of greater concern for our purposes here as
the concentration of the sector and ”tiering” that emerged following the rise of the
secondary banks gave rise to wildly divergent paths for the two groups.
The secondary banks did not manage to establish themselves fully in the inner
circle of the system that Griffiths talks about and were thus more susceptible to the
risk of failure - or at best be restructured - when problems arose. The banks within
427Rowan (1973) p. 23. The lack of interest in banking matters, especially crises, is furtherdiscussed in Chapters 2 and 3 of this thesis. One telling fact is that in Ackrill and Hannah (2001),which serves as Barclays official history, a total of three pages, out of 400, are given to the secondarycrisis.428See Chapter 2 for a discussion on CCC. Rowan (1973) includes a narrative of the case for
increasing ”price competition” between banks during the period.
5.2. THE BIG FOUR’S REACTION TO THE CRISIS 255
the core of the system - most prominently the Big Four - were on the other hand not
only sheltered by the Bank of England but also formed a team with the Bank that
performed the rescue operations.
While the narrative of the secondary crisis itself is covered in more detail in
Chapters 2 and 3, here some primary data from the archives is introduced along
with a timeline. This timeline can help put the quantitative data in context and
establish both the onset of the crisis as well as its different stages. To summarize
briefly, Table 5.1 shows the size and composition of the problem as it was seen at the
onset of the crisis at year-end 1972. Note that the situation was to get considerably
worse than it was perceived at this point in time.429
Examination of the figure reveals that the acceptable risk was purely a function
of each banks reserves - 20% in each case - while the limit on a single exposure
was set to 5% of capital and the bad debt ceiling to 2.5%. The banks had the
luxury of putting such stringent ceilings at this point in time whereas when the
situation worsened they were forced to increase their exposure and ultimately offload
a substantial part of the risk onto the Bank of England. Note also that the total
acceptable risk of the five banks in Table 5.1 was 360 mGBP while the size of the
so-called Lifeboat would eventually max out at 1,200 mGBP.
A year later, in December 1973, this proved to be the case as the situation had
deteriorated considerably along with the amounts required from each party. This
was in some sense the pinnacle of the crisis where, according to Capie (2010), it
429Note also that there are five banks in Table 5.1 but four banks in our sample later in thechapter. The difference is William & Glyn’s which took part in the Lifeboat operations but was nota part of the core, Big Four banks and hence data for it was not included in the CLCB database.William & Glyn’s was formed in 1970 with the merger of the Royal Bank of Scotland’s subsidiariesin England and Wales. Technically, it was thus an English based bank like the Big Four but ownedby a Scottish clearer.
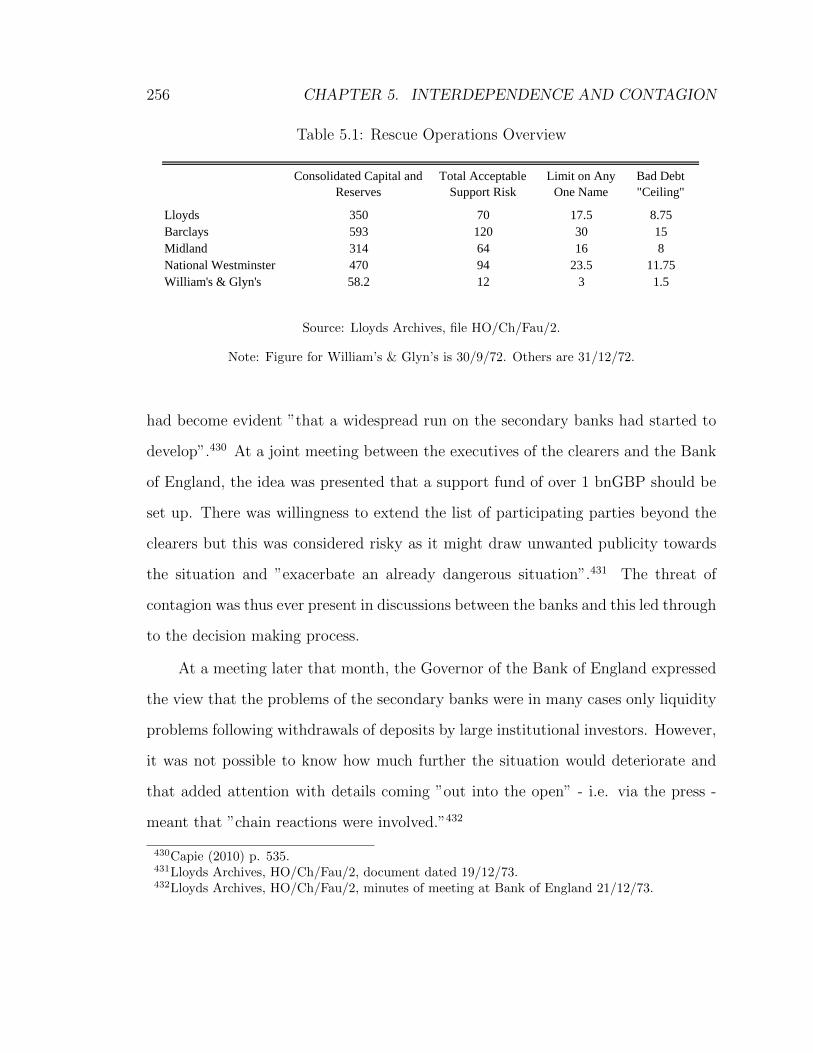
256 CHAPTER 5. INTERDEPENDENCE AND CONTAGION
Table 5.1: Rescue Operations Overview
Consolidated Capital and
Reserves
Total Acceptable
Support Risk
Limit on Any
One Name
Bad Debt
"Ceiling"
Lloyds 350 70 17.5 8.75
Barclays 593 120 30 15
Midland 314 64 16 8
National Westminster 470 94 23.5 11.75
William's & Glyn's 58.2 12 3 1.5
Source: Lloyds Archives, file HO/Ch/Fau/2.
Note: Figure for William’s & Glyn’s is 30/9/72. Others are 31/12/72.
had become evident ”that a widespread run on the secondary banks had started to
develop”.430 At a joint meeting between the executives of the clearers and the Bank
of England, the idea was presented that a support fund of over 1 bnGBP should be
set up. There was willingness to extend the list of participating parties beyond the
clearers but this was considered risky as it might draw unwanted publicity towards
the situation and ”exacerbate an already dangerous situation”.431 The threat of
contagion was thus ever present in discussions between the banks and this led through
to the decision making process.
At a meeting later that month, the Governor of the Bank of England expressed
the view that the problems of the secondary banks were in many cases only liquidity
problems following withdrawals of deposits by large institutional investors. However,
it was not possible to know how much further the situation would deteriorate and
that added attention with details coming ”out into the open” - i.e. via the press -
meant that ”chain reactions were involved.”432
430Capie (2010) p. 535.431Lloyds Archives, HO/Ch/Fau/2, document dated 19/12/73.432Lloyds Archives, HO/Ch/Fau/2, minutes of meeting at Bank of England 21/12/73.
5.2. THE BIG FOUR’S REACTION TO THE CRISIS 257
During the whole operations of this group, or control committee as it was called,
there was a sense of collegiality between the clearers and the Bank. The group
members, having all committed themselves to financially supporting the mission,
held daily meetings at the height of the crisis and discussed in earnest who should
decide upon which secondary banks should receive support and which should be
allowed to fail. The formal ”Heads of Agreement” document which laid out the
mechanics, pricing and setup of the rescue operations even formally stated that these
specific entities, the London and Scottish clearers, would ”work together” with the
Bank of England ”in closest co-operation”.433 This differs considerably from more
recent crisis whereby functions are more clearly defined with central banks uniquely
commanding the role of crisis manager with private institutions on the other side of
the table, at least nominally.
During the group’s meetings, the Governor also took it upon himself to try to
ease concerns of the banks and, for example, expressed his view that it was likely
that the deposits withdrawn from the secondary banks would find their way to the
clearers. The cause and consequences of this expected ”flight to safety” were not
considered, further underlining the two tier system and leaving the lines between the
clearers and the Bank of England well and truly blurred.434
In total, 26 companies were supported by the control committee. Five of those
were authorized banks, i.e. Section 127, and 18 were Section 123 (secondary banks).
18 of the 26 continued trading following their bailouts and 8 were either placed in
receivership or liquidation. Figure 5.1 shows the total amount of Lifeboat support at
shared risk during the height of the crisis. As the figure shows, considerable support
433Lloyds Archives, HO/Ch/Fau/2, document dated 27/12/73.434Lloyds Archives, HO/Ch/Fau/2, minutes of meeting at Bank of England 21/12/73.
258 CHAPTER 5. INTERDEPENDENCE AND CONTAGION
remained outstanding long after the immediate crisis had subsided. Table 5.2, on
the other hand, shows the summary of shared risk in late 1975. The amount of
risk undertaken by each bank is somewhat different as National Westminster has the
greatest number of names under its lead. However, the largest single risk at the time,
that of U.D.T. at 450 mGBP, was the responsibility of Barclays.435
Figure 5.2, in turn, shows the Bank of England’s own risk. In contrast to the
Lifeboat itself, the Bank’s funds at risk continued rising following the crisis. This is
due to the clearers’ demand that their exposure be capped and that the Bank would
have to undertake risk on its own beyond that point. The increase in the Bank’s
exposure during 1976 is also due to large individual rescues such as Slater Walker,
discussed in detail in Chapter 4.
By early 1974, following the collapse of London & County Securities, it became
clear that not only was a number of fringe banks in danger but the situation had
begun to ”affect even major companies who suffered a temporary illiquidity and
began to have to pay extravagant ”over the market” rates for money.”436,437 While
the empirical exercise presented below represents an attempt to establish whether
this interconnectedness can be seen in the data for the Big Four, it is clear that
certain interconnectedness, could be seen on a more cursory level, first amongst
the fringe and subsequently leading to ”major companies”. This is consistent with
other accounts in the sense that when citing the possibility or threat of contagion,
the Bank of England relied on verbal descriptions by market participants, general
435As the table shows, the terms on funds provided were in the range of 1.75% to 3% over LIBOR.This contrasts with Ackrill and Hannah (2001), however, who state that the Lifeboat loans wereprovided at 1.5% over LIBOR (p. 207).436Lloyds Archives, HO/Ch/Fau/2, document dated 04/01/74.437The failure of London & County is by many considered to signal the beginning of the crisis.
See e.g. Metcalfe (1982) p. 79.
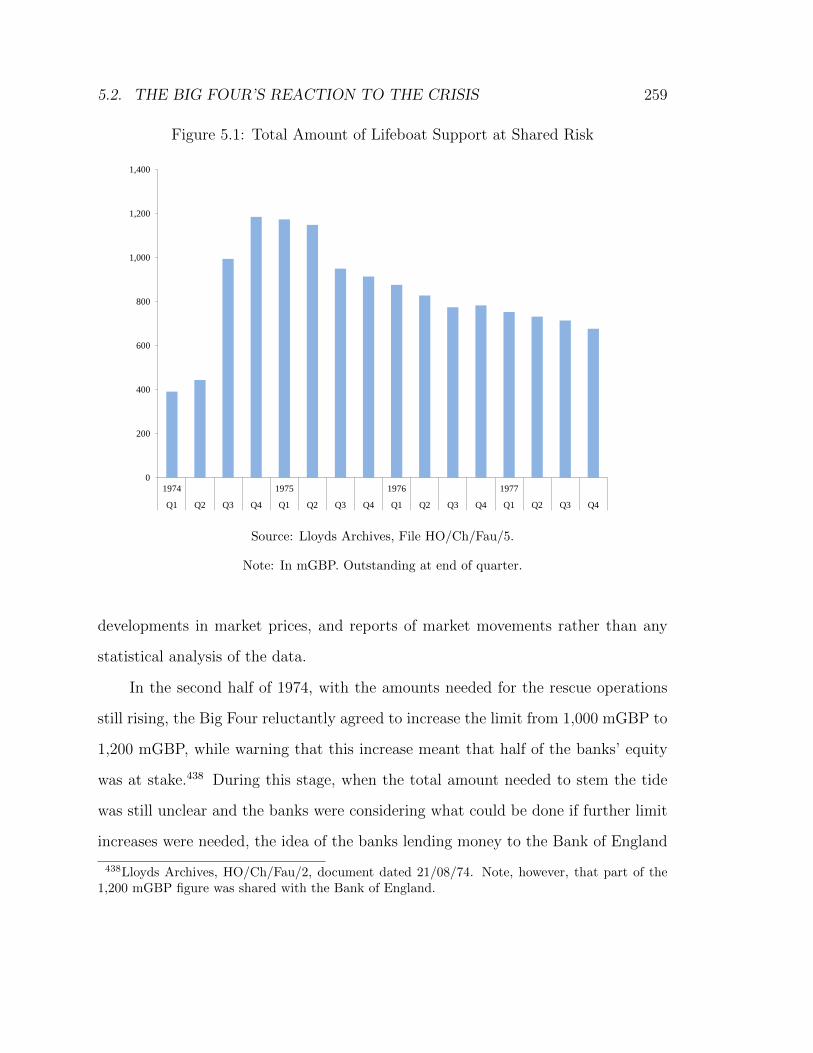
5.2. THE BIG FOUR’S REACTION TO THE CRISIS 259
Figure 5.1: Total Amount of Lifeboat Support at Shared Risk
0
200
400
600
800
1,000
1,200
1,400
1974 1975 1976 1977
Q1 Q2 Q3 Q4 Q1 Q2 Q3 Q4 Q1 Q2 Q3 Q4 Q1 Q2 Q3 Q4
Source: Lloyds Archives, File HO/Ch/Fau/5.
Note: In mGBP. Outstanding at end of quarter.
developments in market prices, and reports of market movements rather than any
statistical analysis of the data.
In the second half of 1974, with the amounts needed for the rescue operations
still rising, the Big Four reluctantly agreed to increase the limit from 1,000 mGBP to
1,200 mGBP, while warning that this increase meant that half of the banks’ equity
was at stake.438 During this stage, when the total amount needed to stem the tide
was still unclear and the banks were considering what could be done if further limit
increases were needed, the idea of the banks lending money to the Bank of England
438Lloyds Archives, HO/Ch/Fau/2, document dated 21/08/74. Note, however, that part of the1,200 mGBP figure was shared with the Bank of England.
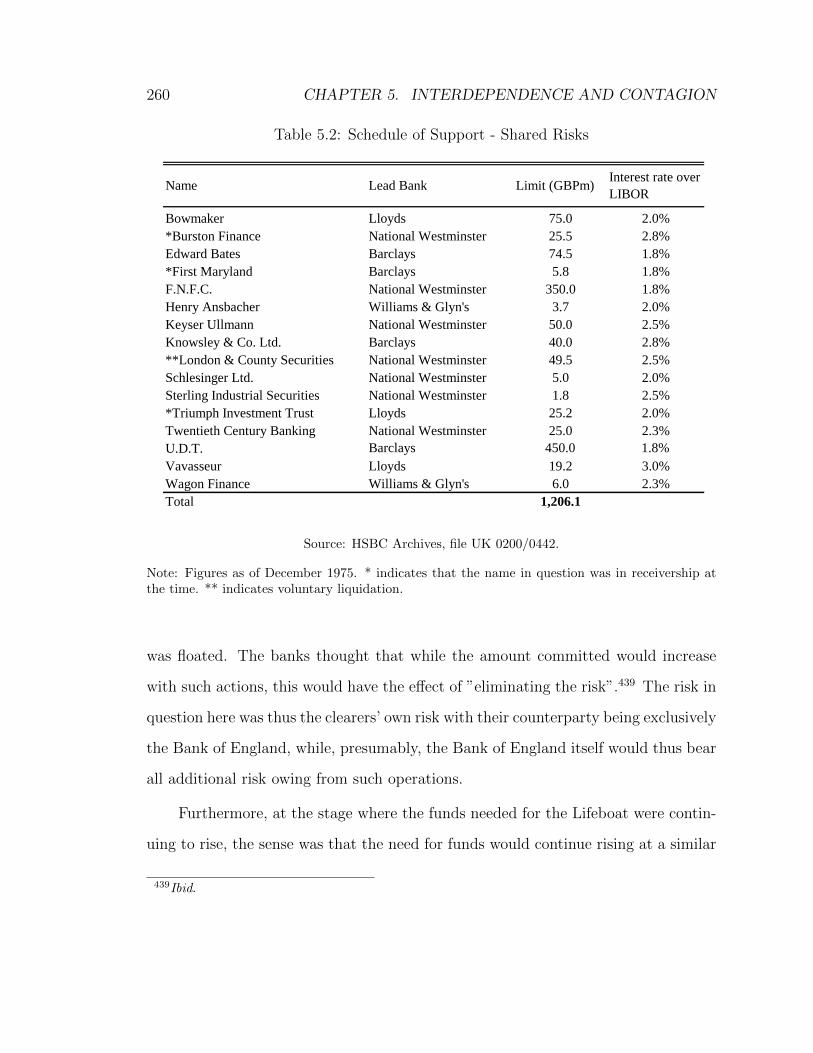
260 CHAPTER 5. INTERDEPENDENCE AND CONTAGION
Table 5.2: Schedule of Support - Shared Risks
Name Lead Bank Limit (GBPm)Interest rate over
LIBOR
Bowmaker Lloyds 75.0 2.0%
*Burston Finance National Westminster 25.5 2.8%
Edward Bates Barclays 74.5 1.8%
*First Maryland Barclays 5.8 1.8%
F.N.F.C. National Westminster 350.0 1.8%
Henry Ansbacher Williams & Glyn's 3.7 2.0%
Keyser Ullmann National Westminster 50.0 2.5%
Knowsley & Co. Ltd. Barclays 40.0 2.8%
**London & County Securities National Westminster 49.5 2.5%
Schlesinger Ltd. National Westminster 5.0 2.0%
Sterling Industrial Securities National Westminster 1.8 2.5%
*Triumph Investment Trust Lloyds 25.2 2.0%
Twentieth Century Banking National Westminster 25.0 2.3%
U.D.T. Barclays 450.0 1.8%
Vavasseur Lloyds 19.2 3.0%
Wagon Finance Williams & Glyn's 6.0 2.3%
Total 1,206.1
Source: HSBC Archives, file UK 0200/0442.
Note: Figures as of December 1975. * indicates that the name in question was in receivership atthe time. ** indicates voluntary liquidation.
was floated. The banks thought that while the amount committed would increase
with such actions, this would have the effect of ”eliminating the risk”.439 The risk in
question here was thus the clearers’ own risk with their counterparty being exclusively
the Bank of England, while, presumably, the Bank of England itself would thus bear
all additional risk owing from such operations.
Furthermore, at the stage where the funds needed for the Lifeboat were contin-
uing to rise, the sense was that the need for funds would continue rising at a similar
439Ibid.
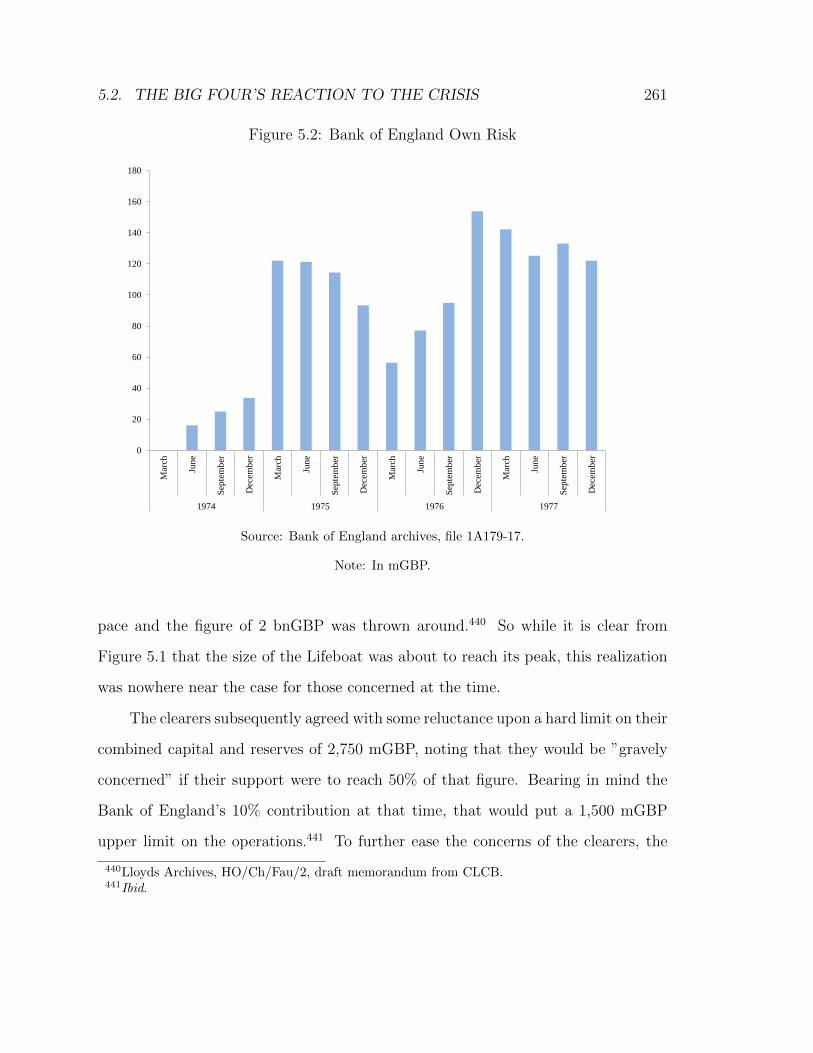
5.2. THE BIG FOUR’S REACTION TO THE CRISIS 261
Figure 5.2: Bank of England Own Risk
0
20
40
60
80
100
120
140
160
180 M
arch
Jun
e
Sep
tem
ber
Dec
emb
er
Mar
ch
Jun
e
Sep
tem
ber
Dec
emb
er
Mar
ch
Jun
e
Sep
tem
ber
Dec
emb
er
Mar
ch
Jun
e
Sep
tem
ber
Dec
emb
er
1974 1975 1976 1977
Source: Bank of England archives, file 1A179-17.
Note: In mGBP.
pace and the figure of 2 bnGBP was thrown around.440 So while it is clear from
Figure 5.1 that the size of the Lifeboat was about to reach its peak, this realization
was nowhere near the case for those concerned at the time.
The clearers subsequently agreed with some reluctance upon a hard limit on their
combined capital and reserves of 2,750 mGBP, noting that they would be ”gravely
concerned” if their support were to reach 50% of that figure. Bearing in mind the
Bank of England’s 10% contribution at that time, that would put a 1,500 mGBP
upper limit on the operations.441 To further ease the concerns of the clearers, the
440Lloyds Archives, HO/Ch/Fau/2, draft memorandum from CLCB.441Ibid.
262 CHAPTER 5. INTERDEPENDENCE AND CONTAGION
Bank of England reiterated its support along several channels. These included con-
firmation of several principles that had been agreed earlier but one particular line
stuck out for the purposes of this chapter. This was that the Bank confirmed the
principle that ” it was imperative that the integrity of the inner core of the City [...]
should not come into question in any one’s mind in the U.K. or overseas.”442 The
Governor then went on to state that there was ”no question of a Clearing or Scottish
Bank, or an Accepting House coming into jeopardy.”443
As concerns continued to mount regarding the extent of support required, the
group was continually forced to reconsider how far its members were willing to go
and under what conditions. In addition to applying ”commercial considerations”
and examining each case on its merits, it was accepted by all concerned that there
were certain institutions which the Bank of England would regard as ”essential to
support”. While this list is not available, and it remains unclear whether there was
a specific list that was considered definitive at the time, it was known to include all
the clearers and ”thought to number about fifty”. Any loans made by the clearers,
under the guise of the support group, to banks on the list could be regarded as ”risk
free if the Bank of England would agree to take responsibility in respect of support
given to names on that list”.444
While the general tone of the meetings was congenial, there remained some
disagreement, both between individual banks as well as the Bank of England, about
the best way to proceed. Those bank representatives that had pushed the Bank to
442Lloyds Archives, HO/Ch/Fau/2, document dated 16/08/74.443Ibid.444Lloyds Archives, HO/Ch/Fau/2, CLCB minutes of meeting 10/01/74. This is presumably the
same list, or along the same lines, as the one mentioned in Chapter 3 of this thesis. As discussedthere, the Bank ultimately refused the clearers’ request to publish a list of institutions that wouldnot be allowed to fail. However, there does not seem to have been any doubt that certain importantinstitutions - including the clearers - were not to be allowed by the Bank to default on their deposits.
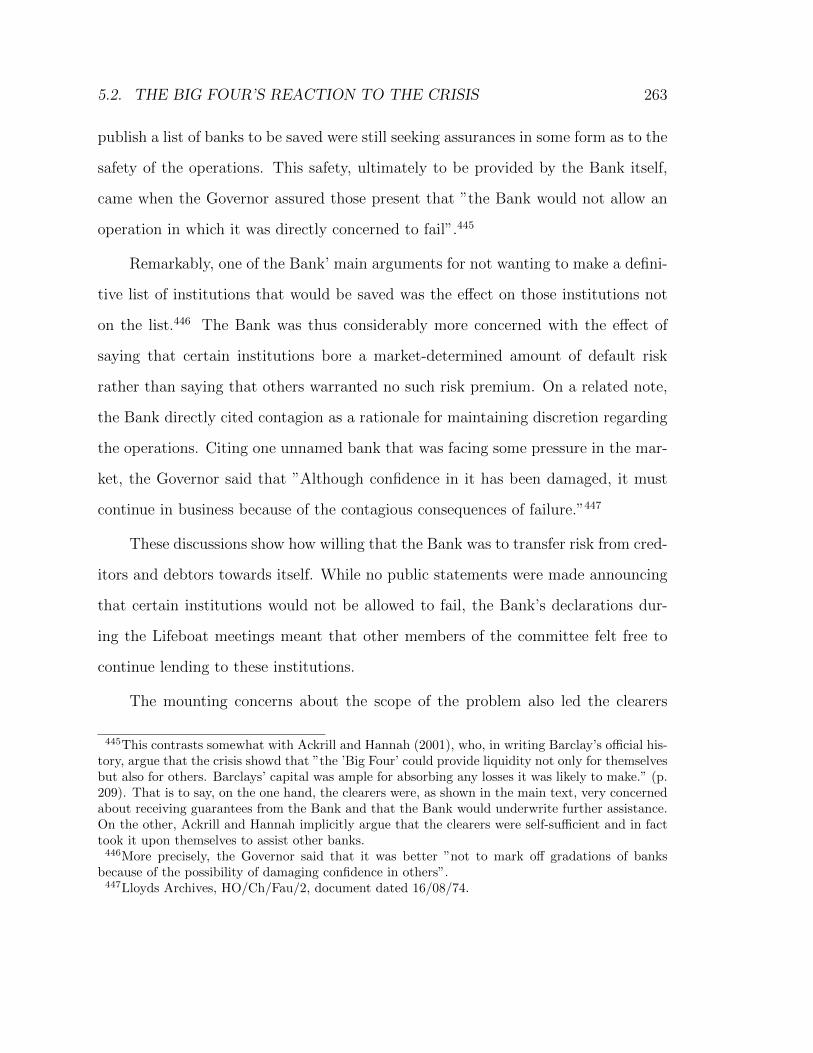
5.2. THE BIG FOUR’S REACTION TO THE CRISIS 263
publish a list of banks to be saved were still seeking assurances in some form as to the
safety of the operations. This safety, ultimately to be provided by the Bank itself,
came when the Governor assured those present that ”the Bank would not allow an
operation in which it was directly concerned to fail”.445
Remarkably, one of the Bank’ main arguments for not wanting to make a defini-
tive list of institutions that would be saved was the effect on those institutions not
on the list.446 The Bank was thus considerably more concerned with the effect of
saying that certain institutions bore a market-determined amount of default risk
rather than saying that others warranted no such risk premium. On a related note,
the Bank directly cited contagion as a rationale for maintaining discretion regarding
the operations. Citing one unnamed bank that was facing some pressure in the mar-
ket, the Governor said that ”Although confidence in it has been damaged, it must
continue in business because of the contagious consequences of failure.”447
These discussions show how willing that the Bank was to transfer risk from cred-
itors and debtors towards itself. While no public statements were made announcing
that certain institutions would not be allowed to fail, the Bank’s declarations dur-
ing the Lifeboat meetings meant that other members of the committee felt free to
continue lending to these institutions.
The mounting concerns about the scope of the problem also led the clearers
445This contrasts somewhat with Ackrill and Hannah (2001), who, in writing Barclay’s official his-tory, argue that the crisis showd that ”the ’Big Four’ could provide liquidity not only for themselvesbut also for others. Barclays’ capital was ample for absorbing any losses it was likely to make.” (p.209). That is to say, on the one hand, the clearers were, as shown in the main text, very concernedabout receiving guarantees from the Bank and that the Bank would underwrite further assistance.On the other, Ackrill and Hannah implicitly argue that the clearers were self-sufficient and in facttook it upon themselves to assist other banks.446More precisely, the Governor said that it was better ”not to mark off gradations of banks
because of the possibility of damaging confidence in others”.447Lloyds Archives, HO/Ch/Fau/2, document dated 16/08/74.
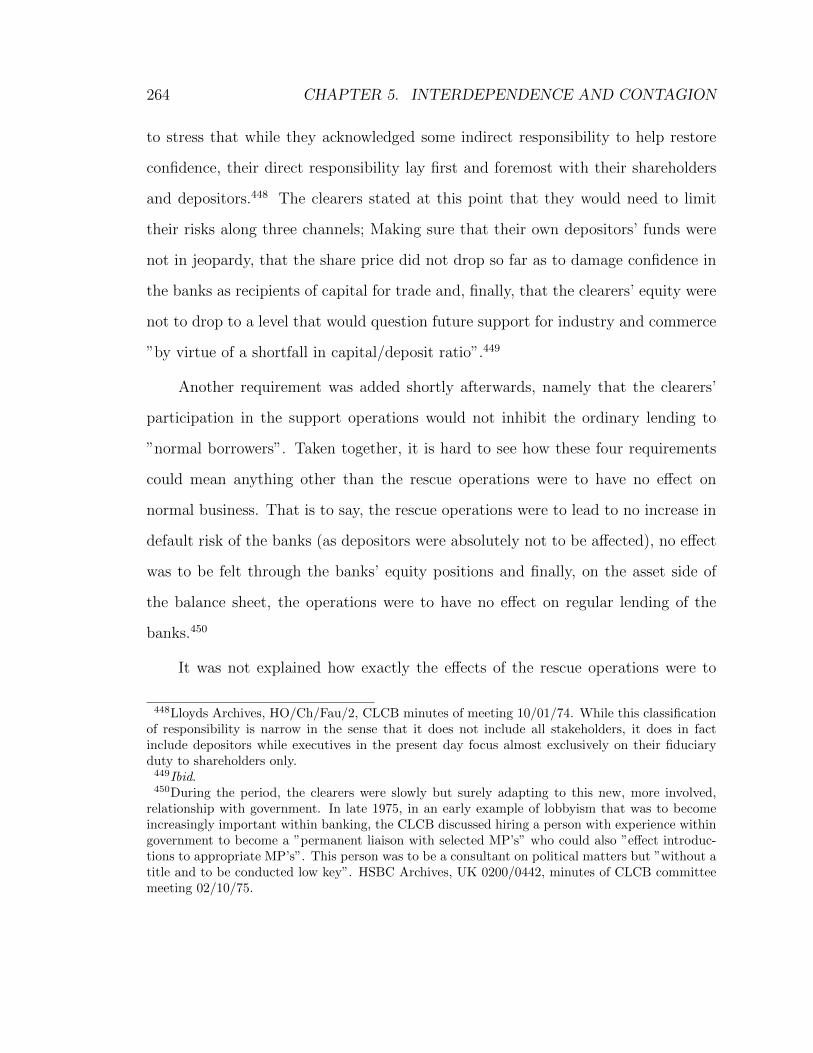
264 CHAPTER 5. INTERDEPENDENCE AND CONTAGION
to stress that while they acknowledged some indirect responsibility to help restore
confidence, their direct responsibility lay first and foremost with their shareholders
and depositors.448 The clearers stated at this point that they would need to limit
their risks along three channels; Making sure that their own depositors’ funds were
not in jeopardy, that the share price did not drop so far as to damage confidence in
the banks as recipients of capital for trade and, finally, that the clearers’ equity were
not to drop to a level that would question future support for industry and commerce
”by virtue of a shortfall in capital/deposit ratio”.449
Another requirement was added shortly afterwards, namely that the clearers’
participation in the support operations would not inhibit the ordinary lending to
”normal borrowers”. Taken together, it is hard to see how these four requirements
could mean anything other than the rescue operations were to have no effect on
normal business. That is to say, the rescue operations were to lead to no increase in
default risk of the banks (as depositors were absolutely not to be affected), no effect
was to be felt through the banks’ equity positions and finally, on the asset side of
the balance sheet, the operations were to have no effect on regular lending of the
banks.450
It was not explained how exactly the effects of the rescue operations were to
448Lloyds Archives, HO/Ch/Fau/2, CLCB minutes of meeting 10/01/74. While this classificationof responsibility is narrow in the sense that it does not include all stakeholders, it does in factinclude depositors while executives in the present day focus almost exclusively on their fiduciaryduty to shareholders only.449Ibid.450During the period, the clearers were slowly but surely adapting to this new, more involved,
relationship with government. In late 1975, in an early example of lobbyism that was to becomeincreasingly important within banking, the CLCB discussed hiring a person with experience withingovernment to become a ”permanent liaison with selected MP’s” who could also ”effect introduc-tions to appropriate MP’s”. This person was to be a consultant on political matters but ”without atitle and to be conducted low key”. HSBC Archives, UK 0200/0442, minutes of CLCB committeemeeting 02/10/75.
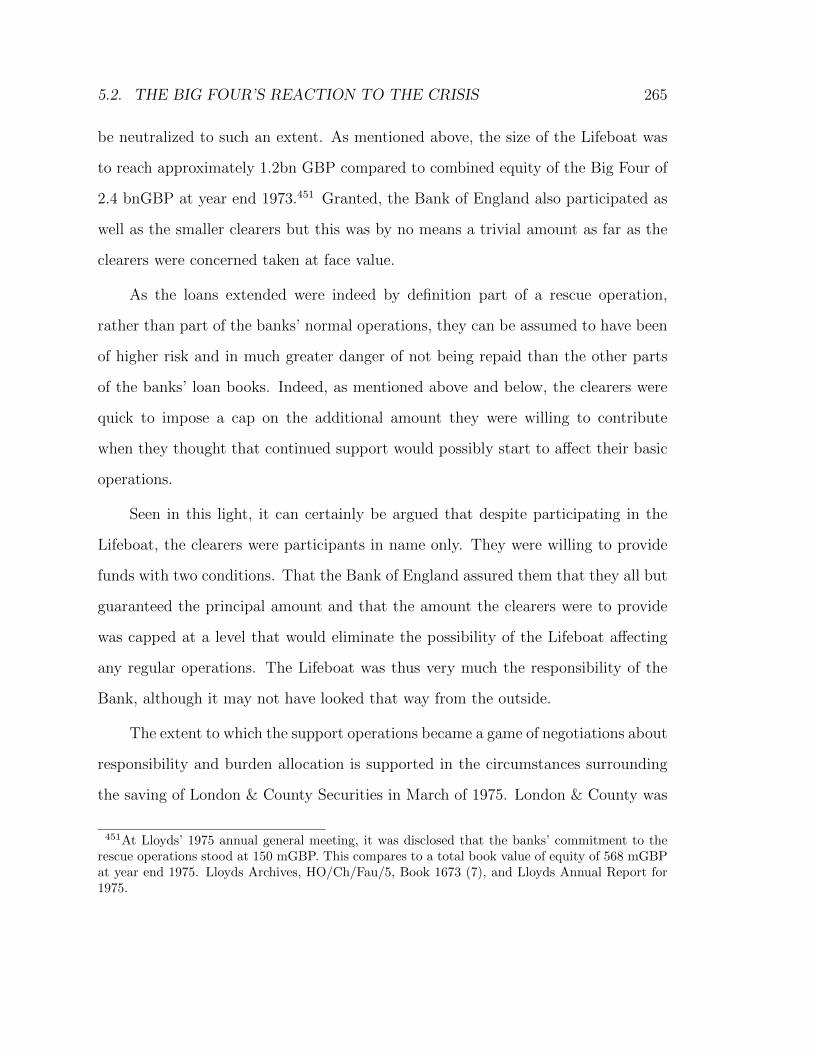
5.2. THE BIG FOUR’S REACTION TO THE CRISIS 265
be neutralized to such an extent. As mentioned above, the size of the Lifeboat was
to reach approximately 1.2bn GBP compared to combined equity of the Big Four of
2.4 bnGBP at year end 1973.451 Granted, the Bank of England also participated as
well as the smaller clearers but this was by no means a trivial amount as far as the
clearers were concerned taken at face value.
As the loans extended were indeed by definition part of a rescue operation,
rather than part of the banks’ normal operations, they can be assumed to have been
of higher risk and in much greater danger of not being repaid than the other parts
of the banks’ loan books. Indeed, as mentioned above and below, the clearers were
quick to impose a cap on the additional amount they were willing to contribute
when they thought that continued support would possibly start to affect their basic
operations.
Seen in this light, it can certainly be argued that despite participating in the
Lifeboat, the clearers were participants in name only. They were willing to provide
funds with two conditions. That the Bank of England assured them that they all but
guaranteed the principal amount and that the amount the clearers were to provide
was capped at a level that would eliminate the possibility of the Lifeboat affecting
any regular operations. The Lifeboat was thus very much the responsibility of the
Bank, although it may not have looked that way from the outside.
The extent to which the support operations became a game of negotiations about
responsibility and burden allocation is supported in the circumstances surrounding
the saving of London & County Securities in March of 1975. London & County was
451At Lloyds’ 1975 annual general meeting, it was disclosed that the banks’ commitment to therescue operations stood at 150 mGBP. This compares to a total book value of equity of 568 mGBPat year end 1975. Lloyds Archives, HO/Ch/Fau/5, Book 1673 (7), and Lloyds Annual Report for1975.
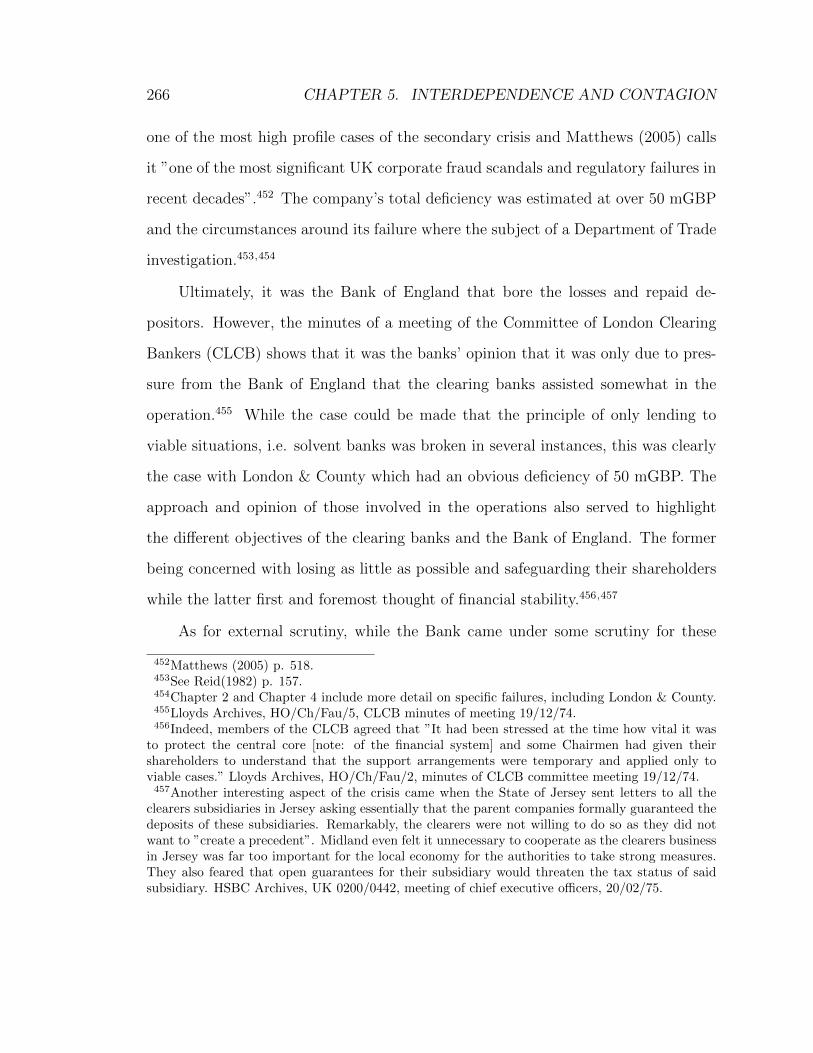
266 CHAPTER 5. INTERDEPENDENCE AND CONTAGION
one of the most high profile cases of the secondary crisis and Matthews (2005) calls
it ”one of the most significant UK corporate fraud scandals and regulatory failures in
recent decades”.452 The company’s total deficiency was estimated at over 50 mGBP
and the circumstances around its failure where the subject of a Department of Trade
investigation.453,454
Ultimately, it was the Bank of England that bore the losses and repaid de-
positors. However, the minutes of a meeting of the Committee of London Clearing
Bankers (CLCB) shows that it was the banks’ opinion that it was only due to pres-
sure from the Bank of England that the clearing banks assisted somewhat in the
operation.455 While the case could be made that the principle of only lending to
viable situations, i.e. solvent banks was broken in several instances, this was clearly
the case with London & County which had an obvious deficiency of 50 mGBP. The
approach and opinion of those involved in the operations also served to highlight
the different objectives of the clearing banks and the Bank of England. The former
being concerned with losing as little as possible and safeguarding their shareholders
while the latter first and foremost thought of financial stability.456,457
As for external scrutiny, while the Bank came under some scrutiny for these
452Matthews (2005) p. 518.453See Reid(1982) p. 157.454Chapter 2 and Chapter 4 include more detail on specific failures, including London & County.455Lloyds Archives, HO/Ch/Fau/5, CLCB minutes of meeting 19/12/74.456Indeed, members of the CLCB agreed that ”It had been stressed at the time how vital it was
to protect the central core [note: of the financial system] and some Chairmen had given theirshareholders to understand that the support arrangements were temporary and applied only toviable cases.” Lloyds Archives, HO/Ch/Fau/2, minutes of CLCB committee meeting 19/12/74.457Another interesting aspect of the crisis came when the State of Jersey sent letters to all the
clearers subsidiaries in Jersey asking essentially that the parent companies formally guaranteed thedeposits of these subsidiaries. Remarkably, the clearers were not willing to do so as they did notwant to ”create a precedent”. Midland even felt it unnecessary to cooperate as the clearers businessin Jersey was far too important for the local economy for the authorities to take strong measures.They also feared that open guarantees for their subsidiary would threaten the tax status of saidsubsidiary. HSBC Archives, UK 0200/0442, meeting of chief executive officers, 20/02/75.
5.2. THE BIG FOUR’S REACTION TO THE CRISIS 267
rescue operations in the press, most of the pressures that the clearers faced came
from their own shareholders. In a Q&A session at Lloyds’ 1974 annual meeting, Eric
Faulkner, Lloyd’s chairman faced several general questions on the rescue operations
that were known to be unfolding although the specifics were kept strictly confiden-
tial.458 The chairman’s tone was somewhat different when facing shareholders than
in conversations within the control committee. He took the opportunity to reveal
that in conversation with several overseas bankers, they had expressed the opinion
that ”they did not believe there is anywhere else in the world than London that a
rescue operation of that magnitude could be mounted”.
The chairman assured those in attendance that utmost care was being taken
with regard to reimbursement from the support group and in each case where the
support group felt it necessary, ”security has been taken”, by which he meant col-
lateral. Barclays’ chairman, Anthony Tuke, had similarly reassuring words for his
shareholders, declaring that he expected that the banks’ losses on its 300 mGBP
commitment to the Lifeboat would effectively be covered by the interest received
on these loans.459 The banks’ were thus able to present a fearful view to the Bank,
in order to prevent their own losses, while exuding calm towards shareholders and
downplaying the significance of their participation in the Lifeboat.
A year later at the same event, the Lloyds Chairman ran through some numbers
considered important, which were usually not revealed but due to the extraordinary
conditions were deemed important to sooth shareholders. These numbers included
the share of advances that went to property companies (4%), as well as a vague
458Lloyds archive, Ho/Ch/Fau/5. File titled ”Statements made by Chairman to Shareholders onthe Lifeboat operation at Annual General Meetings in 1974, 1975 and 1976”.459Tuke also announced that provisions already made had been covered by profits. (Financial
Times, ”Barclays U.K. profits could fall this year”, 15.3.75).
268 CHAPTER 5. INTERDEPENDENCE AND CONTAGION
measure of capitalization. The chairman, acknowledging similar coverage in the
press, said that the ratio of capital to deposits stood at 7% (compared to 5.9-6.9%
at the other Big Four) which he interpreted as meaning that the ”gearing” didn’t
seem of immediate concern.460
When explaining the approach taken by Lloyds and others involved with the
rescue operations, the Chairman stated that they were ”faced at that time with
a complete collapse of confidence by small and even professional depositors in the
British banking system” and that the steps taken were taken to stop the rot and
restore confidence. Mentioning specifically the threat of contagion, he said that ”this
lack of confidence could in fact spread to the inner core of the British banking system
- who I suppose you could broadly classify as the London Clearing and Scottish
Clearing Banks, the Acceptance Houses and the Discount Houses.”
During the 1976 annual meeting, with the crisis behind him, the Chairman
highlighted the fact that Lloyds free capital ratio was better than that of its main
rivals.461 The figures themselves would have given creditors a greater rise of concern,
however, as they were in the range of 2.4% to 3.2% for the Big Four and had been
falling. This shows even better how thin the buffer was between the bank and its
creditors. In fact, the Bank of England was later to use the free capital ratio as a
regulatory tool and introduce a minimum ratio of 4%.
460The description by the Chairman indicated that such measures were not routinely considered indiscussions of banking operations. The calculation made was equity plus subordinated loan stock,minority interest and reserves minus goodwill and adjusted for the market value of investments.This leverage ratio is fairly simple compared to modern measures but again shows the small bufferwith which to absorb losses, especially considering the growth and volatility of loans advanceddescribed in Section 4.461This ratio, which the Economist was to call ”the ratio most closely scrutinised by the Bank of
England in judging whether a bank is backed by sufficient capital”, measured capitalization in amanner similar to the leverage ratio mentioned above. (”Rights Angle”, The Economist, October13th 1984, 7363 (293) p. 82)
5.2. THE BIG FOUR’S REACTION TO THE CRISIS 269
It is important to keep in mind the external conditions of the time when attempt-
ing to understand the nature of the banks’ capital levels. Firstly, the measurement
of ”capital” is not necessarily a straightforward exercise. Capie and Billings (2001)
provide various measurements of capital and find that ”true” capital, which includes
”hidden reserves”, as a percentage of assets was in the 6-9% range at the end of the
1960s. This was a significant improvement from previous decades as capital levels
had taken a long time to recover following war. At the same time, the discrep-
ancy between published and ”true” capital had been falling towards the point when
disclosure started in 1969.462
Another important and related factor was that in the post-war period British
banks were forced to maintain lower levels of capital than they would have wanted.
This was due to the economy-wide scarcity of capital following the war and the need
to prioritize the government’s financing requirements. Billings and Capie (2007) show
that the Bank of England was itself concerned with the banks having too much capital
and it was important that capital levels not be ”excessive”, while acknowledging that
it, the Bank, didn’t have information on true capital levels.
The authorities did not seem overly concerned with the amount of deposits at
stake in the Big Four in relation to the banks’ capital levels and did not put much
weight on such developments. There is little direct evidence of the Bank discussing
deposit increases and withdrawals at the clearers, either internally or in its discussion
with the clearers themselves. This supports the evidence put forward in Chapter 3
regarding the Bank’s general stand-off approach regarding regulation and how little
concern was given to issues of financial stability.
462Maintaining ”hidden” reserves was a prevalent procedure in British banking, starting in the19th century, with Bank officials having to guess as to the extent of them (see Billings and Capie(2007) p. 144)
270 CHAPTER 5. INTERDEPENDENCE AND CONTAGION
In conclusion, what does the historical evidence tell us about the fear of conta-
gion, the rescue operations and the Bank? Firstly, the Bank and the clearers worked
together more as equals than as a regulator and its counterparts. All involved con-
sidered it their duty to prevent a crisis of confidence although that involved pooling
together public and private money and deciding on a case-by-case basis which insti-
tutions were to survive.
Secondly, both the clearers and the Bank regularly cited contagion as the con-
sequence of inaction although not in those words. The implicit view was that if the
liquidity dry-up in the secondary banks was allowed to unfold without action, the
panic would spread systematically throughout the system and finally reach the clear-
ers themselves. It was this domino-effect that spurred both the Bank and the clearers
on as a pre-emptive measure.463 In the next section we turn to the new dataset and
its characteristics before attempting to shed greater light on any possible effects or
manifestations of the crisis and rescue operations in the empirical section.
Finally, despite the operations being conducted under the aura of collegiality de-
scribed above, there was substantial pressure on the Bank to commit to the clearers
that it would prevent severe losses and in fact all but negate any negative effect on
the clearers. This power struggle and subsequent pressure on the Bank to underwrite
the operations has been underreported in the literature. Metcalfe (1982) is amongst
the few to highlight it, noting that the clearing banks ”limited their financial com-
mitments to the lifeboat, so the Bank of England was left with residual responsibility
463The extent to which this domino effect would have been bourne out is hard to estimate andoutside the scope of this thesis. Saunders and Ward (1976) use a CAPM approach to look at theperformance of the Big Four during the period and argue that ”the fear, prevalent at the time,of a ’domino effect’ of secondary bank failures on the clearing banks was exaggerated.” (p. 153).However, it is hard to judge whether this result stems directly from the effect of the Lifeboat.
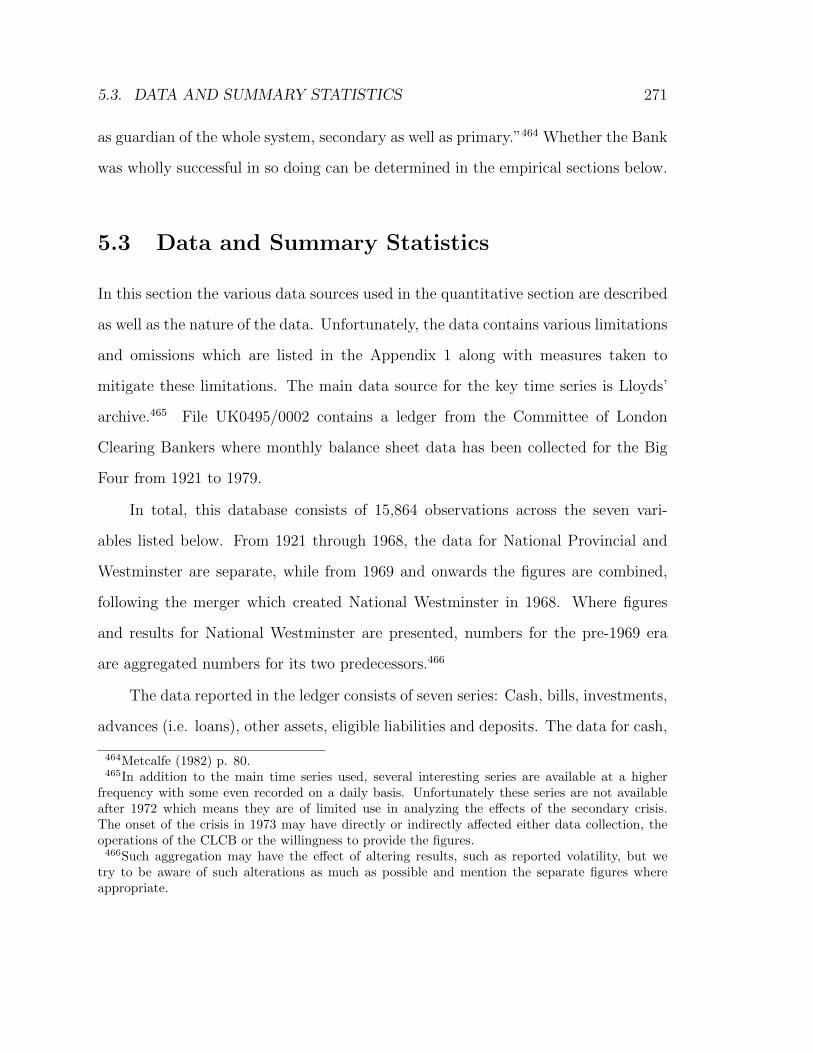
5.3. DATA AND SUMMARY STATISTICS 271
as guardian of the whole system, secondary as well as primary.”464 Whether the Bank
was wholly successful in so doing can be determined in the empirical sections below.
5.3 Data and Summary Statistics
In this section the various data sources used in the quantitative section are described
as well as the nature of the data. Unfortunately, the data contains various limitations
and omissions which are listed in the Appendix 1 along with measures taken to
mitigate these limitations. The main data source for the key time series is Lloyds’
archive.465 File UK0495/0002 contains a ledger from the Committee of London
Clearing Bankers where monthly balance sheet data has been collected for the Big
Four from 1921 to 1979.
In total, this database consists of 15,864 observations across the seven vari-
ables listed below. From 1921 through 1968, the data for National Provincial and
Westminster are separate, while from 1969 and onwards the figures are combined,
following the merger which created National Westminster in 1968. Where figures
and results for National Westminster are presented, numbers for the pre-1969 era
are aggregated numbers for its two predecessors.466
The data reported in the ledger consists of seven series: Cash, bills, investments,
advances (i.e. loans), other assets, eligible liabilities and deposits. The data for cash,
464Metcalfe (1982) p. 80.465In addition to the main time series used, several interesting series are available at a higher
frequency with some even recorded on a daily basis. Unfortunately these series are not availableafter 1972 which means they are of limited use in analyzing the effects of the secondary crisis.The onset of the crisis in 1973 may have directly or indirectly affected either data collection, theoperations of the CLCB or the willingness to provide the figures.466Such aggregation may have the effect of altering results, such as reported volatility, but we
try to be aware of such alterations as much as possible and mention the separate figures whereappropriate.
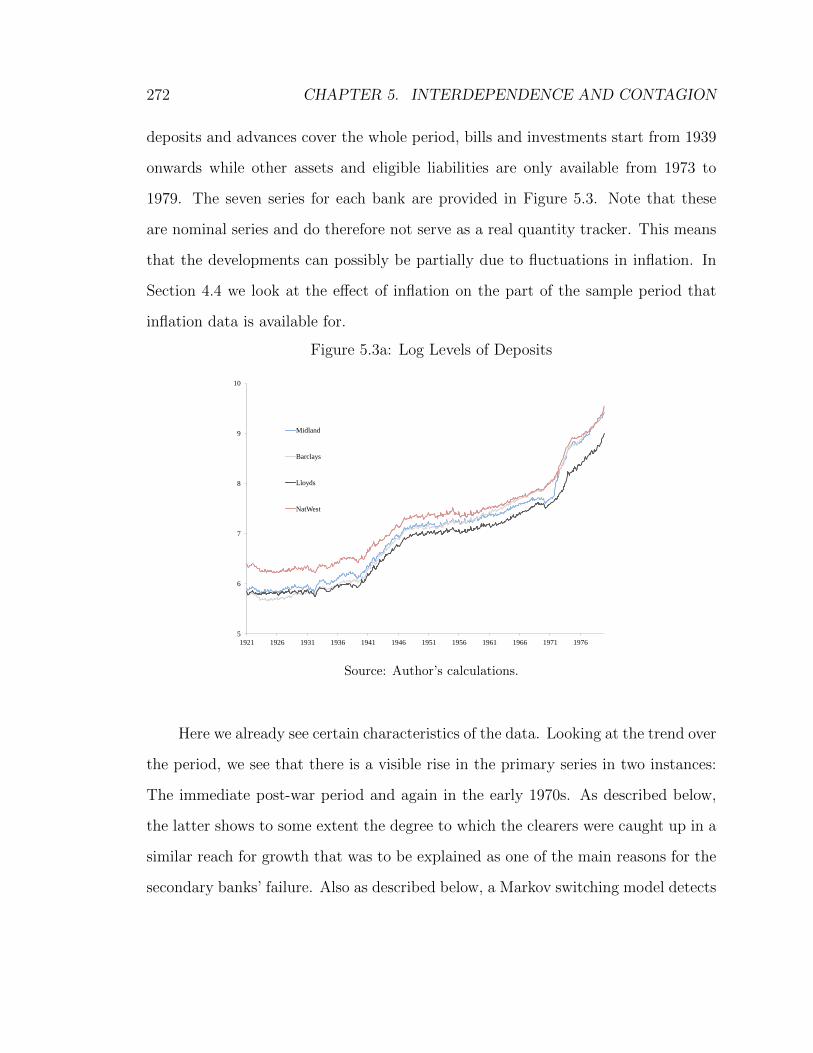
272 CHAPTER 5. INTERDEPENDENCE AND CONTAGION
deposits and advances cover the whole period, bills and investments start from 1939
onwards while other assets and eligible liabilities are only available from 1973 to
1979. The seven series for each bank are provided in Figure 5.3. Note that these
are nominal series and do therefore not serve as a real quantity tracker. This means
that the developments can possibly be partially due to fluctuations in inflation. In
Section 4.4 we look at the effect of inflation on the part of the sample period that
inflation data is available for.
Figure 5.3a: Log Levels of Deposits
5
6
7
8
9
10
1921 1926 1931 1936 1941 1946 1951 1956 1961 1966 1971 1976
Midland
Barclays
Lloyds
NatWest
Source: Author’s calculations.
Here we already see certain characteristics of the data. Looking at the trend over
the period, we see that there is a visible rise in the primary series in two instances:
The immediate post-war period and again in the early 1970s. As described below,
the latter shows to some extent the degree to which the clearers were caught up in a
similar reach for growth that was to be explained as one of the main reasons for the
secondary banks’ failure. Also as described below, a Markov switching model detects
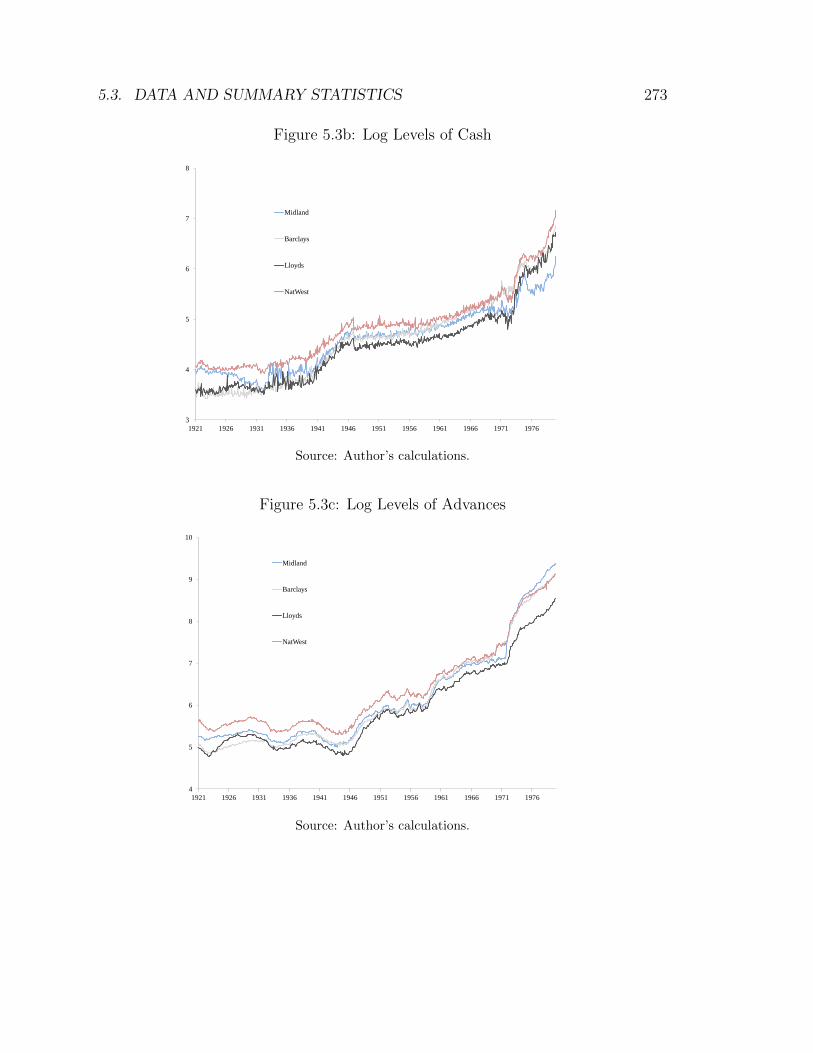
5.3. DATA AND SUMMARY STATISTICS 273
Figure 5.3b: Log Levels of Cash
3
4
5
6
7
8
1921 1926 1931 1936 1941 1946 1951 1956 1961 1966 1971 1976
Midland
Barclays
Lloyds
NatWest
Source: Author’s calculations.
Figure 5.3c: Log Levels of Advances
4
5
6
7
8
9
10
1921 1926 1931 1936 1941 1946 1951 1956 1961 1966 1971 1976
Midland
Barclays
Lloyds
NatWest
Source: Author’s calculations.
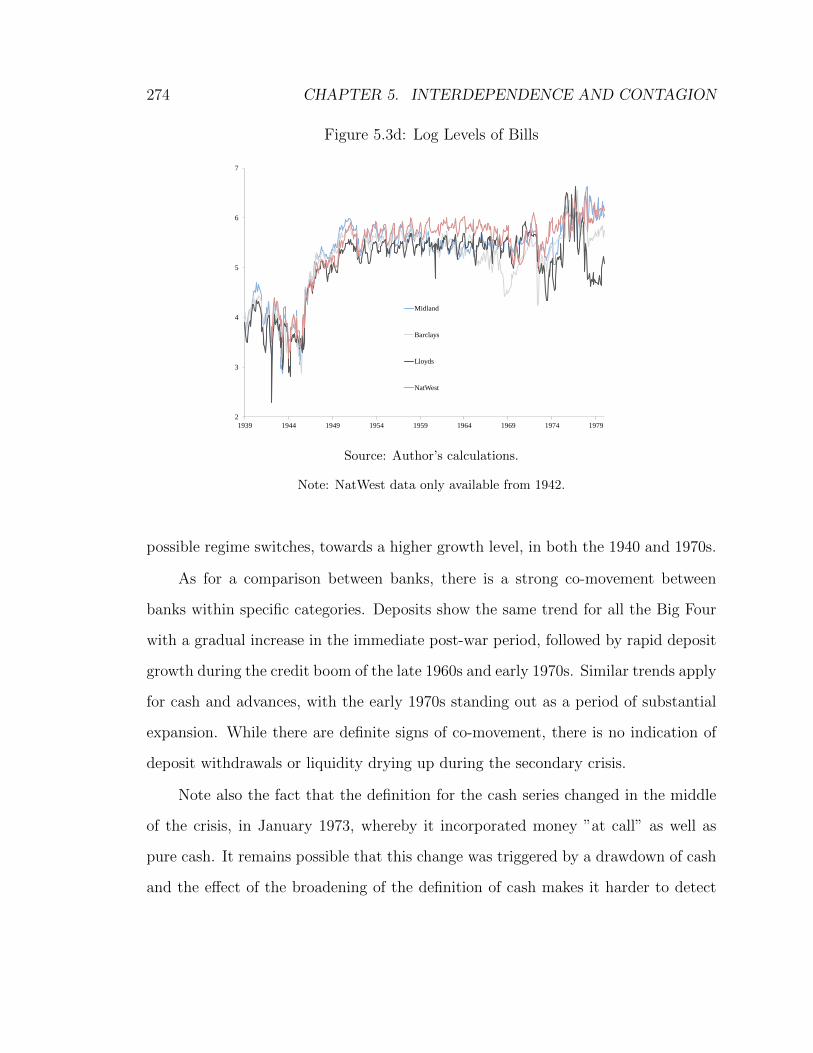
274 CHAPTER 5. INTERDEPENDENCE AND CONTAGION
Figure 5.3d: Log Levels of Bills
2
3
4
5
6
7
1939 1944 1949 1954 1959 1964 1969 1974 1979
Midland
Barclays
Lloyds
NatWest
Source: Author’s calculations.
Note: NatWest data only available from 1942.
possible regime switches, towards a higher growth level, in both the 1940 and 1970s.
As for a comparison between banks, there is a strong co-movement between
banks within specific categories. Deposits show the same trend for all the Big Four
with a gradual increase in the immediate post-war period, followed by rapid deposit
growth during the credit boom of the late 1960s and early 1970s. Similar trends apply
for cash and advances, with the early 1970s standing out as a period of substantial
expansion. While there are definite signs of co-movement, there is no indication of
deposit withdrawals or liquidity drying up during the secondary crisis.
Note also the fact that the definition for the cash series changed in the middle
of the crisis, in January 1973, whereby it incorporated money ”at call” as well as
pure cash. It remains possible that this change was triggered by a drawdown of cash
and the effect of the broadening of the definition of cash makes it harder to detect
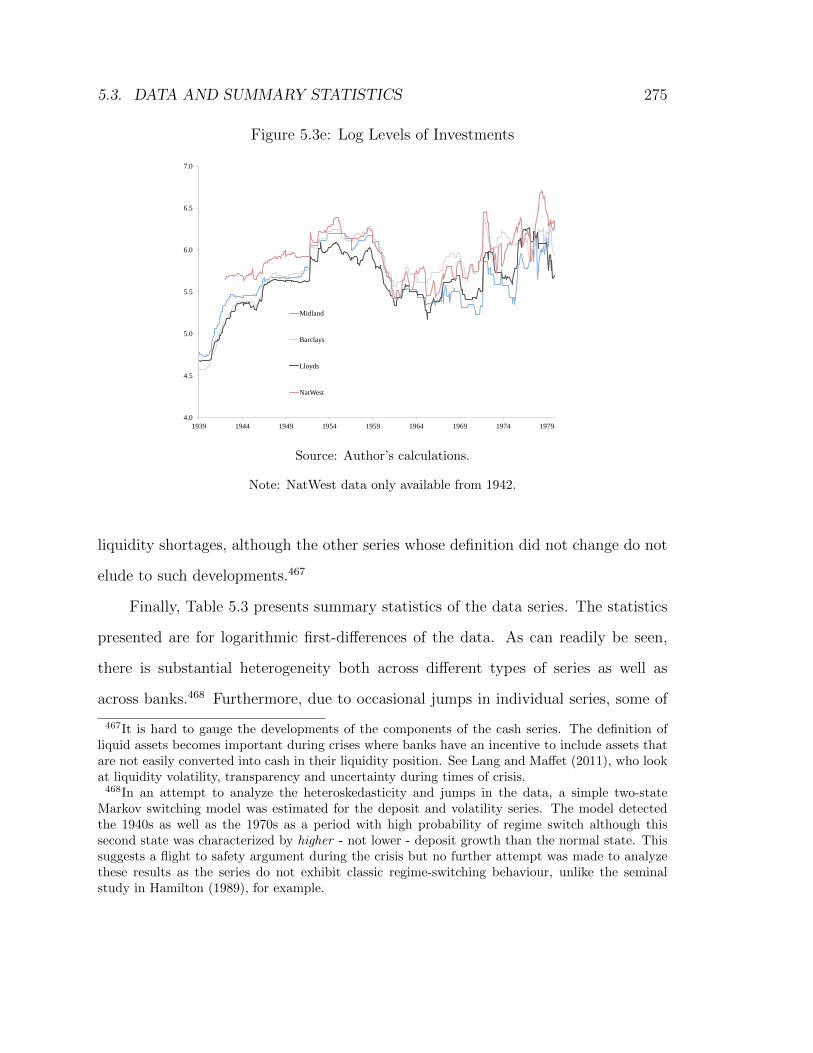
5.3. DATA AND SUMMARY STATISTICS 275
Figure 5.3e: Log Levels of Investments
4.0
4.5
5.0
5.5
6.0
6.5
7.0
1939 1944 1949 1954 1959 1964 1969 1974 1979
Midland
Barclays
Lloyds
NatWest
Source: Author’s calculations.
Note: NatWest data only available from 1942.
liquidity shortages, although the other series whose definition did not change do not
elude to such developments.467
Finally, Table 5.3 presents summary statistics of the data series. The statistics
presented are for logarithmic first-differences of the data. As can readily be seen,
there is substantial heterogeneity both across different types of series as well as
across banks.468 Furthermore, due to occasional jumps in individual series, some of
467It is hard to gauge the developments of the components of the cash series. The definition ofliquid assets becomes important during crises where banks have an incentive to include assets thatare not easily converted into cash in their liquidity position. See Lang and Maffet (2011), who lookat liquidity volatility, transparency and uncertainty during times of crisis.468In an attempt to analyze the heteroskedasticity and jumps in the data, a simple two-state
Markov switching model was estimated for the deposit and volatility series. The model detectedthe 1940s as well as the 1970s as a period with high probability of regime switch although thissecond state was characterized by higher - not lower - deposit growth than the normal state. Thissuggests a flight to safety argument during the crisis but no further attempt was made to analyzethese results as the series do not exhibit classic regime-switching behaviour, unlike the seminalstudy in Hamilton (1989), for example.
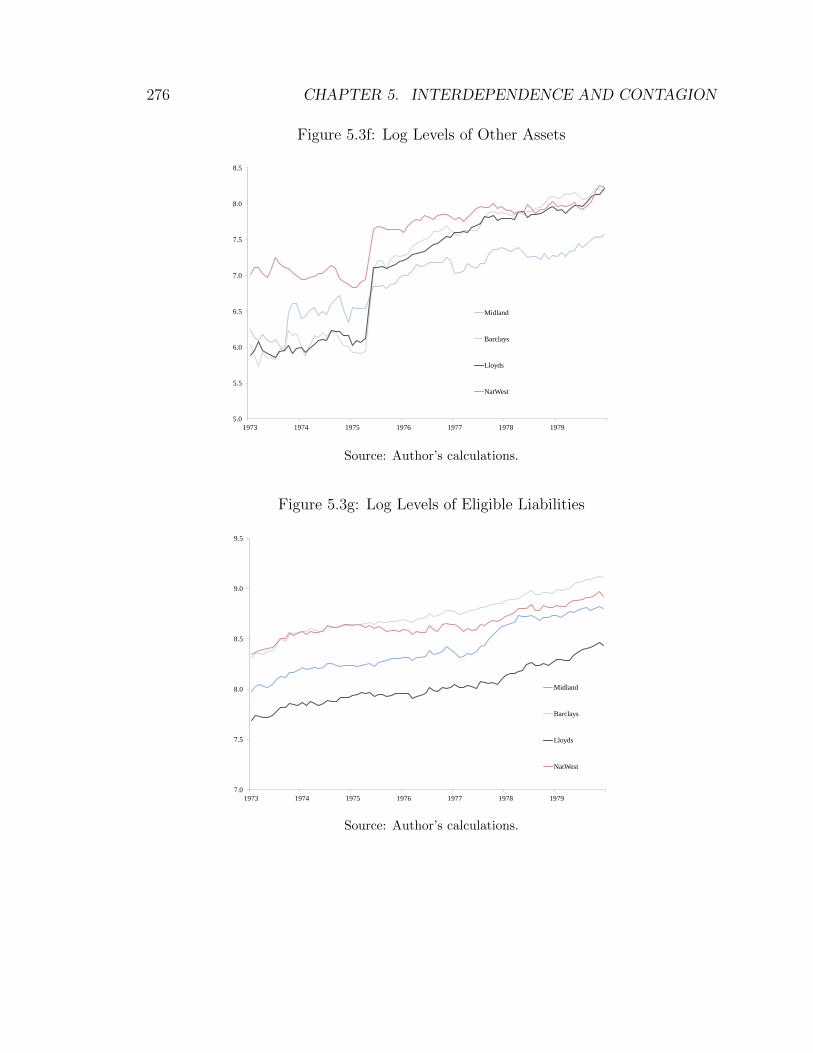
276 CHAPTER 5. INTERDEPENDENCE AND CONTAGION
Figure 5.3f: Log Levels of Other Assets
5.0
5.5
6.0
6.5
7.0
7.5
8.0
8.5
1973 1974 1975 1976 1977 1978 1979
Midland
Barclays
Lloyds
NatWest
Source: Author’s calculations.
Figure 5.3g: Log Levels of Eligible Liabilities
7.0
7.5
8.0
8.5
9.0
9.5
1973 1974 1975 1976 1977 1978 1979
Midland
Barclays
Lloyds
NatWest
Source: Author’s calculations.
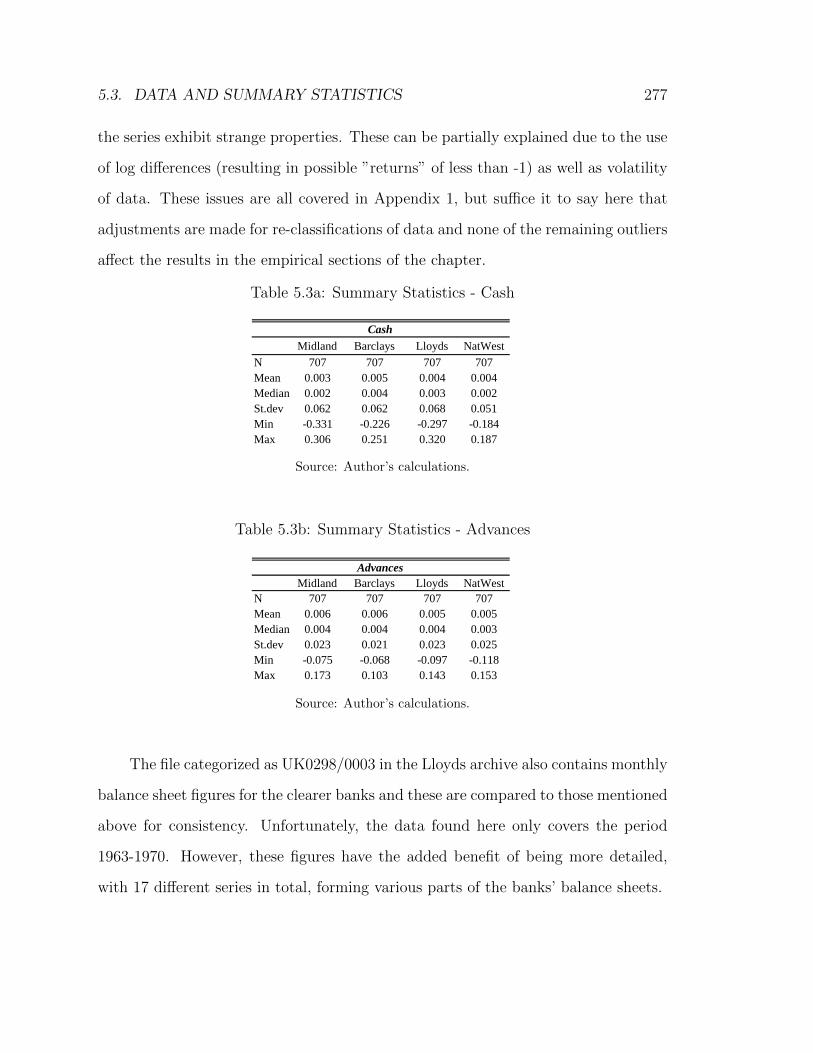
5.3. DATA AND SUMMARY STATISTICS 277
the series exhibit strange properties. These can be partially explained due to the use
of log differences (resulting in possible ”returns” of less than -1) as well as volatility
of data. These issues are all covered in Appendix 1, but suffice it to say here that
adjustments are made for re-classifications of data and none of the remaining outliers
affect the results in the empirical sections of the chapter.
Table 5.3a: Summary Statistics - Cash
Midland Barclays Lloyds NatWest
N 707 707 707 707
Mean 0.003 0.005 0.004 0.004
Median 0.002 0.004 0.003 0.002
St.dev 0.062 0.062 0.068 0.051
Min -0.331 -0.226 -0.297 -0.184
Max 0.306 0.251 0.320 0.187
Cash
Source: Author’s calculations.
Table 5.3b: Summary Statistics - Advances
Midland Barclays Lloyds NatWest
N 707 707 707 707
Mean 0.006 0.006 0.005 0.005
Median 0.004 0.004 0.004 0.003
St.dev 0.023 0.021 0.023 0.025
Min -0.075 -0.068 -0.097 -0.118
Max 0.173 0.103 0.143 0.153
Advances
Source: Author’s calculations.
The file categorized as UK0298/0003 in the Lloyds archive also contains monthly
balance sheet figures for the clearer banks and these are compared to those mentioned
above for consistency. Unfortunately, the data found here only covers the period
1963-1970. However, these figures have the added benefit of being more detailed,
with 17 different series in total, forming various parts of the banks’ balance sheets.
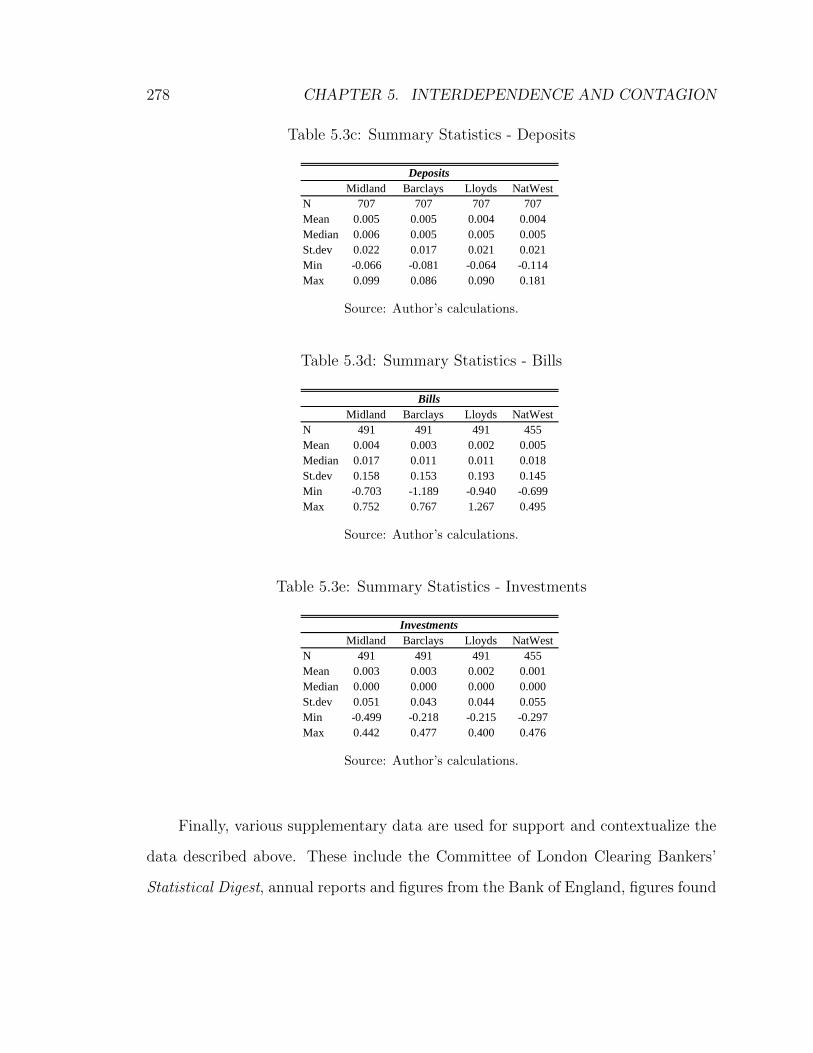
278 CHAPTER 5. INTERDEPENDENCE AND CONTAGION
Table 5.3c: Summary Statistics - Deposits
Midland Barclays Lloyds NatWest
N 707 707 707 707
Mean 0.005 0.005 0.004 0.004
Median 0.006 0.005 0.005 0.005
St.dev 0.022 0.017 0.021 0.021
Min -0.066 -0.081 -0.064 -0.114
Max 0.099 0.086 0.090 0.181
Deposits
Source: Author’s calculations.
Table 5.3d: Summary Statistics - Bills
Midland Barclays Lloyds NatWest
N 491 491 491 455
Mean 0.004 0.003 0.002 0.005
Median 0.017 0.011 0.011 0.018
St.dev 0.158 0.153 0.193 0.145
Min -0.703 -1.189 -0.940 -0.699
Max 0.752 0.767 1.267 0.495
Bills
Source: Author’s calculations.
Table 5.3e: Summary Statistics - Investments
Midland Barclays Lloyds NatWest
N 491 491 491 455
Mean 0.003 0.003 0.002 0.001
Median 0.000 0.000 0.000 0.000
St.dev 0.051 0.043 0.044 0.055
Min -0.499 -0.218 -0.215 -0.297
Max 0.442 0.477 0.400 0.476
Investments
Source: Author’s calculations.
Finally, various supplementary data are used for support and contextualize the
data described above. These include the Committee of London Clearing Bankers’
Statistical Digest, annual reports and figures from the Bank of England, figures found
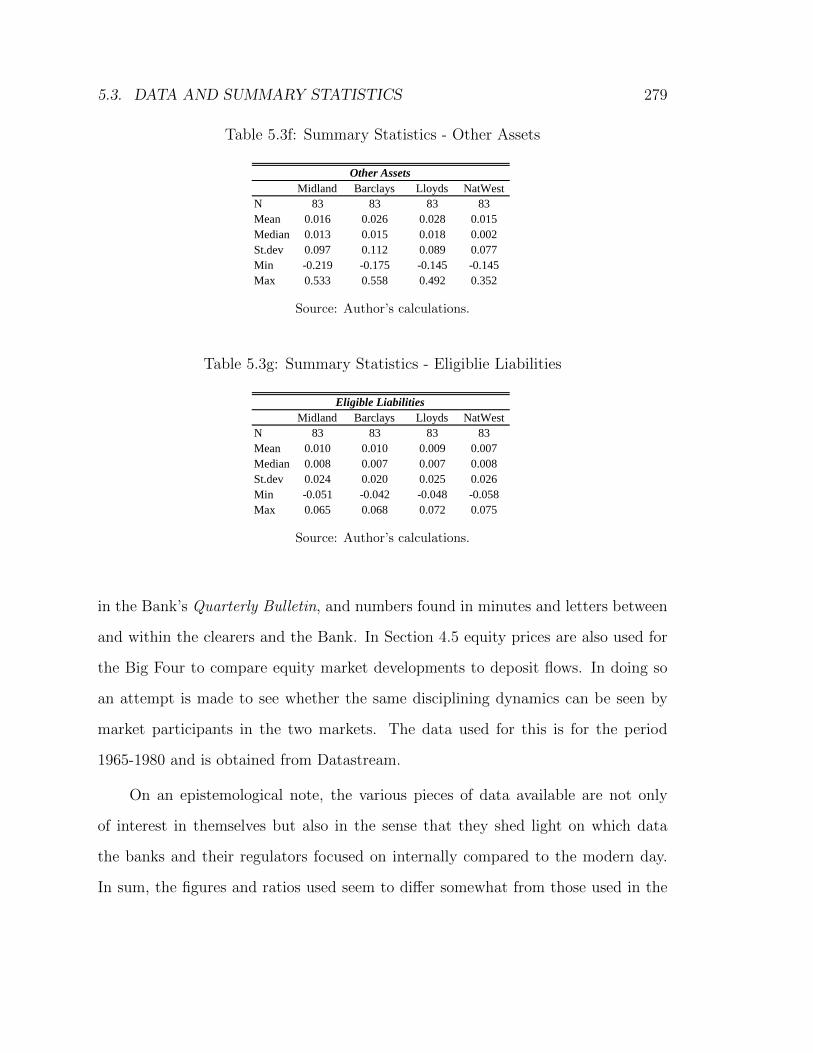
5.3. DATA AND SUMMARY STATISTICS 279
Table 5.3f: Summary Statistics - Other Assets
Midland Barclays Lloyds NatWest
N 83 83 83 83
Mean 0.016 0.026 0.028 0.015
Median 0.013 0.015 0.018 0.002
St.dev 0.097 0.112 0.089 0.077
Min -0.219 -0.175 -0.145 -0.145
Max 0.533 0.558 0.492 0.352
Other Assets
Source: Author’s calculations.
Table 5.3g: Summary Statistics - Eligiblie Liabilities
Midland Barclays Lloyds NatWest
N 83 83 83 83
Mean 0.010 0.010 0.009 0.007
Median 0.008 0.007 0.007 0.008
St.dev 0.024 0.020 0.025 0.026
Min -0.051 -0.042 -0.048 -0.058
Max 0.065 0.068 0.072 0.075
Eligible Liabilities
Source: Author’s calculations.
in the Bank’s Quarterly Bulletin, and numbers found in minutes and letters between
and within the clearers and the Bank. In Section 4.5 equity prices are also used for
the Big Four to compare equity market developments to deposit flows. In doing so
an attempt is made to see whether the same disciplining dynamics can be seen by
market participants in the two markets. The data used for this is for the period
1965-1980 and is obtained from Datastream.
On an epistemological note, the various pieces of data available are not only
of interest in themselves but also in the sense that they shed light on which data
the banks and their regulators focused on internally compared to the modern day.
In sum, the figures and ratios used seem to differ somewhat from those used in the
280 CHAPTER 5. INTERDEPENDENCE AND CONTAGION
modern day although the underlying focus - i.e. of capital and liquidity - is very
much the same.
Finally, it should be mentioned that the empirical part of this chapter - unlike
many previous interconnectedness studies - consists of quantity variables and not
prices.469 There is theoretically, of course, the possibility that developments and
dynamics that occurred when the banks altered the price paid for deposits are not
being captured. One such scenario would be that a looming run was staved off by
increasing the interest rate paid on deposits.
Relying on quantity data would in this case not capture this response. However,
as mentioned above, it has been documented in the literature that competition for
deposits amongst the clearers was very limited during the time and interest rates
were seldom changed in response to the business cycle.470 In fact, the banks had an
agreement on interest rates on both sides of the balance sheet which prevented them
from using rates as a mechanism to stave off runs.471
5.4 Empirical Evidence
In this section the new dataset, described in the previous section, is analyzed and
an attempt made to see whether it provides any sign of interconnectedness between
469See for example Aharony and Swary (1983), Kaufman (1994) and Mahate (1994). Amongstexceptions are Degryse and Nguyen (2007) and Upper and Worms (2004). Allen and Gale (2007)present a broad overview of the literature.470See e.g. the aforementioned Rowan (1973) and Griffiths (1973). Capie (2010) and Kynaston
(2002) also provide detailed discussion on the arrangements of the time.471One rate channel that may have still affected deposit quantities is that secondary banks were
free to pay the interest rate they wanted. This meant that deposit withdrawals from clearers couldbe triggered by savers being attracted by better rates elsewhere. However, this channel is not theone we are looking at here as it does not directly affect the contagion argument. The fact thatdeposit rates were stable throughout the period and not a part of the banks’ toolbox renders thefocus on quantities acceptable.
5.4. EMPIRICAL EVIDENCE 281
banks or early warning signs. Several methods of summarizing the data are used,
starting from simple correlations and volatility exercises before using a VAR model
and cointegration tests to approach the same questions from a different angle. We
also look at possible interconnectedness between secondary banks and the Big Four
in the equity market. This multi-method approach is taken for sake of robustness as
well as minimizing the risk of bias that may arise due to any single method.
Figures 5.3a to 5.3c in the previous section show the main series used; the
deposits, cash and advances for the Big Four. This section concentrates on these
series and use the other series for support purposes. This is due to the fact that
these are the three series that are available for the whole sample period. A better
understanding of certain long-term characteristics of these series can thus be provided
as well as these properties. Additionally, these are the three variables - out of the
seven in total - that are of greatest interest for the purposes here.
5.4.1 Correlation
Table 5.4 shows the correlation matrix for log-differences of the cash series for all
of the banks.472 The series are positively correlated across all banks, indicating
a certain, although not overwhelming, degree of co-movement between the liquidity
positions of the banks. This would suggest that developments in liquidity were driven
by system-wide shocks and adjustments as well as idiosyncratic ones.
Correlation coefficients obviously represent a very imperfect measure of co-
movement, and several papers deal with these issues (such as omitted variable bias,
472Unless otherwise indicated, in all the below work on the balance sheet data we use first log-differences. This ensures stationarity - which was confirmed with an Augmented Dickey-Fuller test- and facilitates more readily cross-section comparisons.
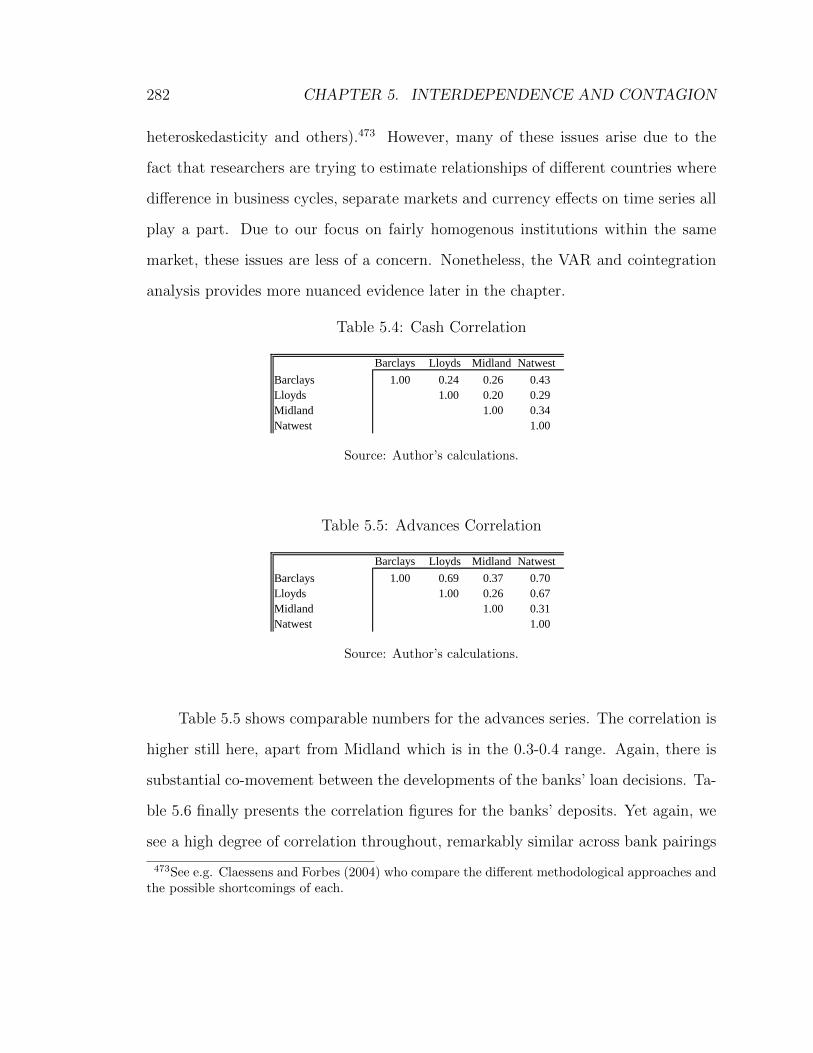
282 CHAPTER 5. INTERDEPENDENCE AND CONTAGION
heteroskedasticity and others).473 However, many of these issues arise due to the
fact that researchers are trying to estimate relationships of different countries where
difference in business cycles, separate markets and currency effects on time series all
play a part. Due to our focus on fairly homogenous institutions within the same
market, these issues are less of a concern. Nonetheless, the VAR and cointegration
analysis provides more nuanced evidence later in the chapter.
Table 5.4: Cash Correlation
Barclays Lloyds Midland Natwest
Barclays 1.00 0.24 0.26 0.43
Lloyds 1.00 0.20 0.29
Midland 1.00 0.34
Natwest 1.00
Source: Author’s calculations.
Table 5.5: Advances Correlation
Barclays Lloyds Midland Natwest
Barclays 1.00 0.69 0.37 0.70
Lloyds 1.00 0.26 0.67
Midland 1.00 0.31
Natwest 1.00
Source: Author’s calculations.
Table 5.5 shows comparable numbers for the advances series. The correlation is
higher still here, apart from Midland which is in the 0.3-0.4 range. Again, there is
substantial co-movement between the developments of the banks’ loan decisions. Ta-
ble 5.6 finally presents the correlation figures for the banks’ deposits. Yet again, we
see a high degree of correlation throughout, remarkably similar across bank pairings
473See e.g. Claessens and Forbes (2004) who compare the different methodological approaches andthe possible shortcomings of each.
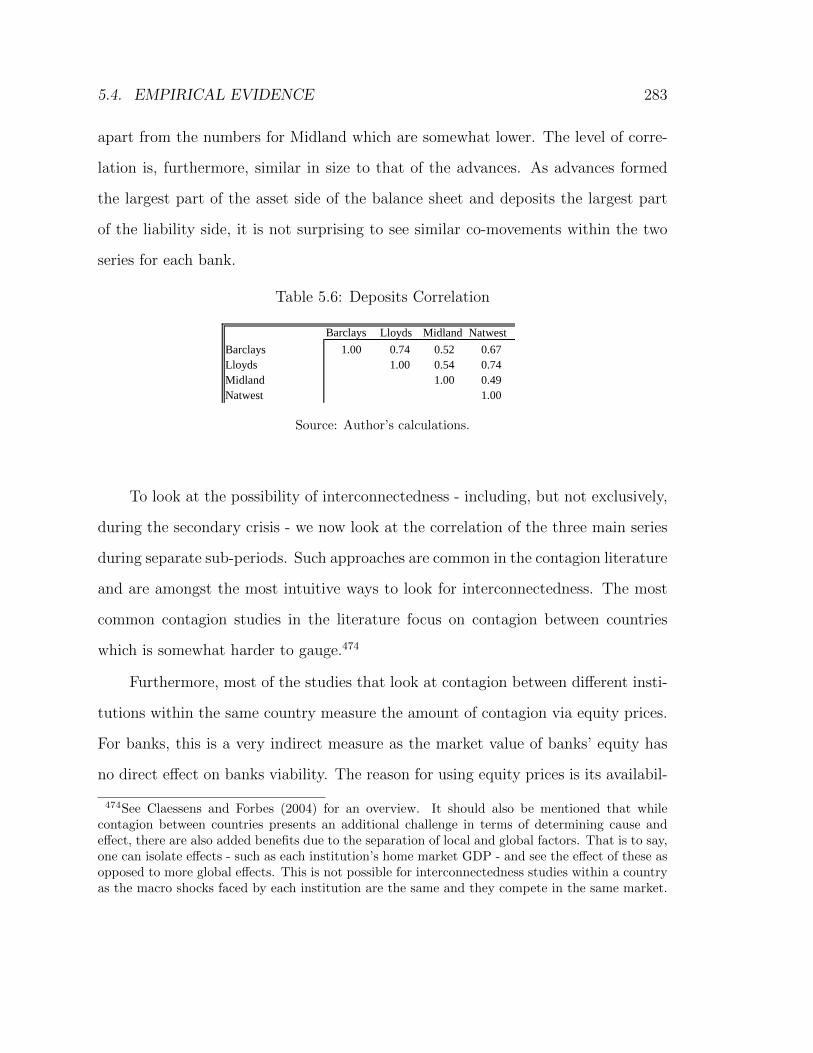
5.4. EMPIRICAL EVIDENCE 283
apart from the numbers for Midland which are somewhat lower. The level of corre-
lation is, furthermore, similar in size to that of the advances. As advances formed
the largest part of the asset side of the balance sheet and deposits the largest part
of the liability side, it is not surprising to see similar co-movements within the two
series for each bank.
Table 5.6: Deposits Correlation
Barclays Lloyds Midland Natwest
Barclays 1.00 0.74 0.52 0.67
Lloyds 1.00 0.54 0.74
Midland 1.00 0.49
Natwest 1.00
Source: Author’s calculations.
To look at the possibility of interconnectedness - including, but not exclusively,
during the secondary crisis - we now look at the correlation of the three main series
during separate sub-periods. Such approaches are common in the contagion literature
and are amongst the most intuitive ways to look for interconnectedness. The most
common contagion studies in the literature focus on contagion between countries
which is somewhat harder to gauge.474
Furthermore, most of the studies that look at contagion between different insti-
tutions within the same country measure the amount of contagion via equity prices.
For banks, this is a very indirect measure as the market value of banks’ equity has
no direct effect on banks viability. The reason for using equity prices is its availabil-
474See Claessens and Forbes (2004) for an overview. It should also be mentioned that whilecontagion between countries presents an additional challenge in terms of determining cause andeffect, there are also added benefits due to the separation of local and global factors. That is to say,one can isolate effects - such as each institution’s home market GDP - and see the effect of these asopposed to more global effects. This is not possible for interconnectedness studies within a countryas the macro shocks faced by each institution are the same and they compete in the same market.
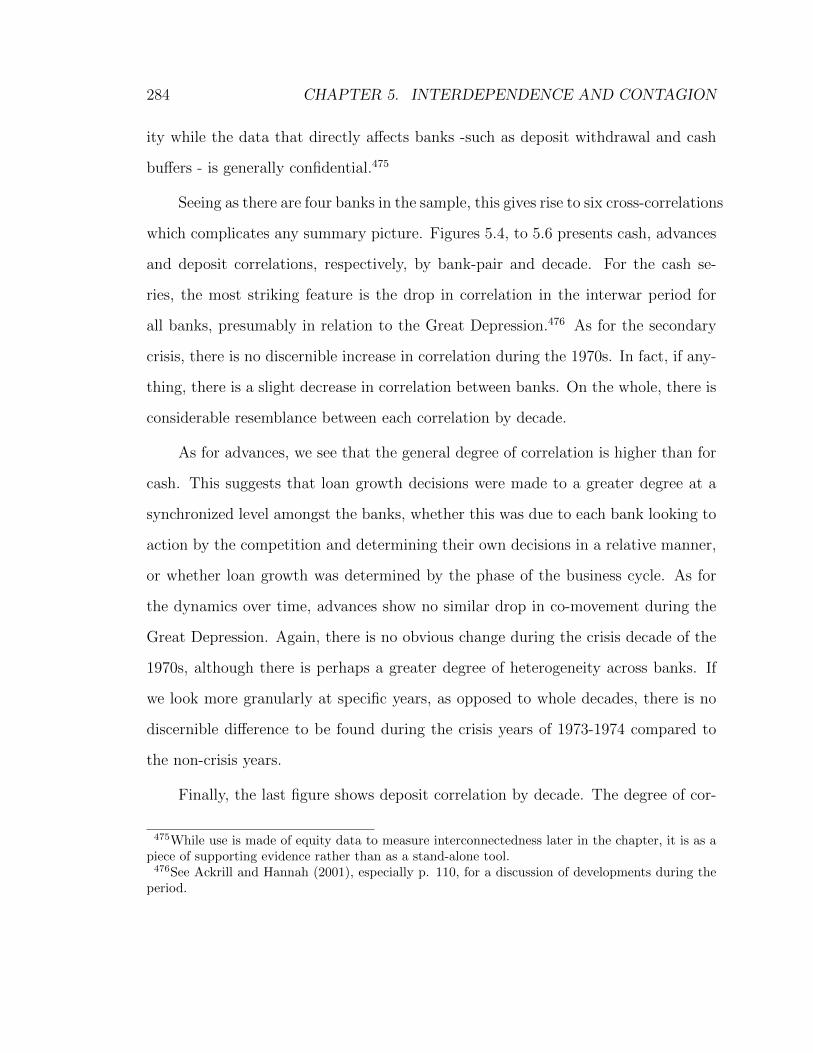
284 CHAPTER 5. INTERDEPENDENCE AND CONTAGION
ity while the data that directly affects banks -such as deposit withdrawal and cash
buffers - is generally confidential.475
Seeing as there are four banks in the sample, this gives rise to six cross-correlations
which complicates any summary picture. Figures 5.4, to 5.6 presents cash, advances
and deposit correlations, respectively, by bank-pair and decade. For the cash se-
ries, the most striking feature is the drop in correlation in the interwar period for
all banks, presumably in relation to the Great Depression.476 As for the secondary
crisis, there is no discernible increase in correlation during the 1970s. In fact, if any-
thing, there is a slight decrease in correlation between banks. On the whole, there is
considerable resemblance between each correlation by decade.
As for advances, we see that the general degree of correlation is higher than for
cash. This suggests that loan growth decisions were made to a greater degree at a
synchronized level amongst the banks, whether this was due to each bank looking to
action by the competition and determining their own decisions in a relative manner,
or whether loan growth was determined by the phase of the business cycle. As for
the dynamics over time, advances show no similar drop in co-movement during the
Great Depression. Again, there is no obvious change during the crisis decade of the
1970s, although there is perhaps a greater degree of heterogeneity across banks. If
we look more granularly at specific years, as opposed to whole decades, there is no
discernible difference to be found during the crisis years of 1973-1974 compared to
the non-crisis years.
Finally, the last figure shows deposit correlation by decade. The degree of cor-
475While use is made of equity data to measure interconnectedness later in the chapter, it is as apiece of supporting evidence rather than as a stand-alone tool.476See Ackrill and Hannah (2001), especially p. 110, for a discussion of developments during the
period.

5.4. EMPIRICAL EVIDENCE 285
Figure 5.4: Cash Correlation by Decade
-0.2
-0.1
0.0
0.1
0.2
0.3
0.4
0.5
0.6
0.7
1920s 1930s 1940s 1950s 1960s 1970s
MB ML MN BL BN LN
Source: Author’s calculations.
relation - while high - is remarkably persistent by decade and also by bank up until
the 1970s. During the last decade - the decade of the height of the property boom
and subsequent crisis - there is a sharp drop-off in correlation across all banks. It
is unclear why this is the case. One possibility is that the substantial spike in infla-
tion during the decade distorted the numbers. However, re-running the calculations
using real data (i.e. adjusted for inflation) does not change this finding.477 Another
possibility would be a downward bias due to outliers but omitting the largest jumps
in the series does not change the result and the fact that this behaviour is in place
for all pairs suggests that this is not driven by some anomaly in one of the banks.
477The process of deflating the data is described more fully in Section 4.4.
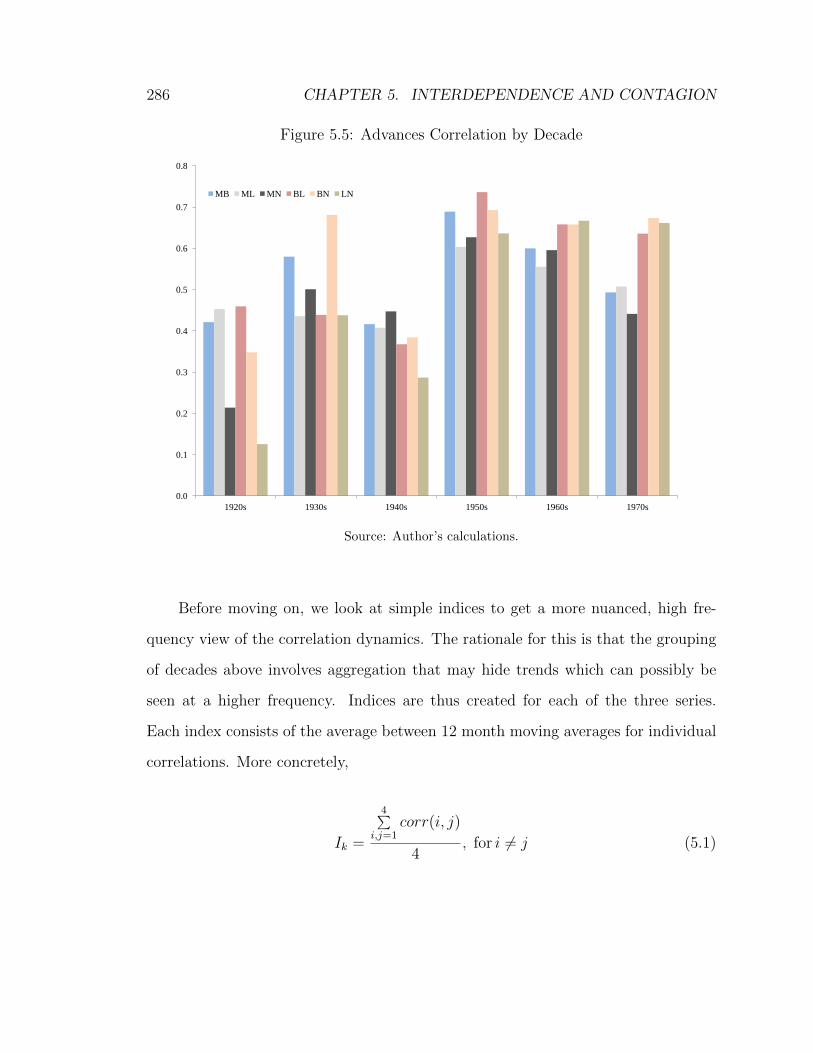
286 CHAPTER 5. INTERDEPENDENCE AND CONTAGION
Figure 5.5: Advances Correlation by Decade
0.0
0.1
0.2
0.3
0.4
0.5
0.6
0.7
0.8
1920s 1930s 1940s 1950s 1960s 1970s
MB ML MN BL BN LN
Source: Author’s calculations.
Before moving on, we look at simple indices to get a more nuanced, high fre-
quency view of the correlation dynamics. The rationale for this is that the grouping
of decades above involves aggregation that may hide trends which can possibly be
seen at a higher frequency. Indices are thus created for each of the three series.
Each index consists of the average between 12 month moving averages for individual
correlations. More concretely,
Ik =
4∑i,j=1
corr(i, j)
4, for i 6= j (5.1)
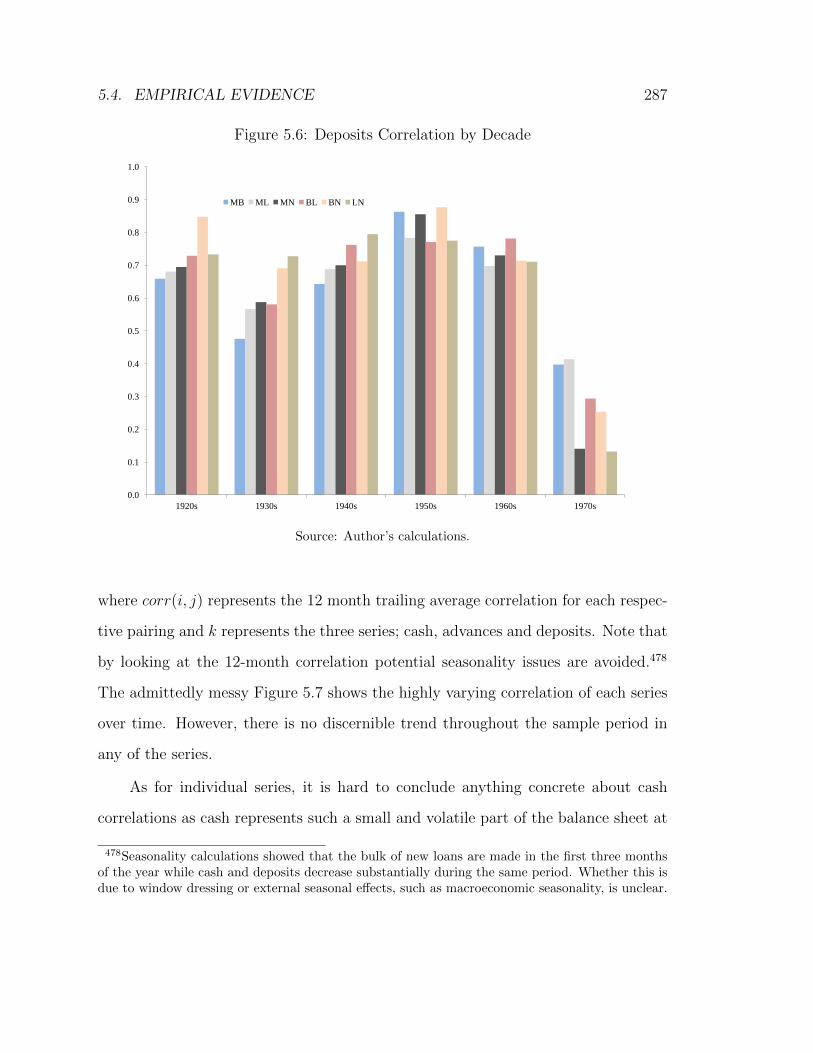
5.4. EMPIRICAL EVIDENCE 287
Figure 5.6: Deposits Correlation by Decade
0.0
0.1
0.2
0.3
0.4
0.5
0.6
0.7
0.8
0.9
1.0
1920s 1930s 1940s 1950s 1960s 1970s
MB ML MN BL BN LN
Source: Author’s calculations.
where corr(i, j) represents the 12 month trailing average correlation for each respec-
tive pairing and k represents the three series; cash, advances and deposits. Note that
by looking at the 12-month correlation potential seasonality issues are avoided.478
The admittedly messy Figure 5.7 shows the highly varying correlation of each series
over time. However, there is no discernible trend throughout the sample period in
any of the series.
As for individual series, it is hard to conclude anything concrete about cash
correlations as cash represents such a small and volatile part of the balance sheet at
478Seasonality calculations showed that the bulk of new loans are made in the first three monthsof the year while cash and deposits decrease substantially during the same period. Whether this isdue to window dressing or external seasonal effects, such as macroeconomic seasonality, is unclear.
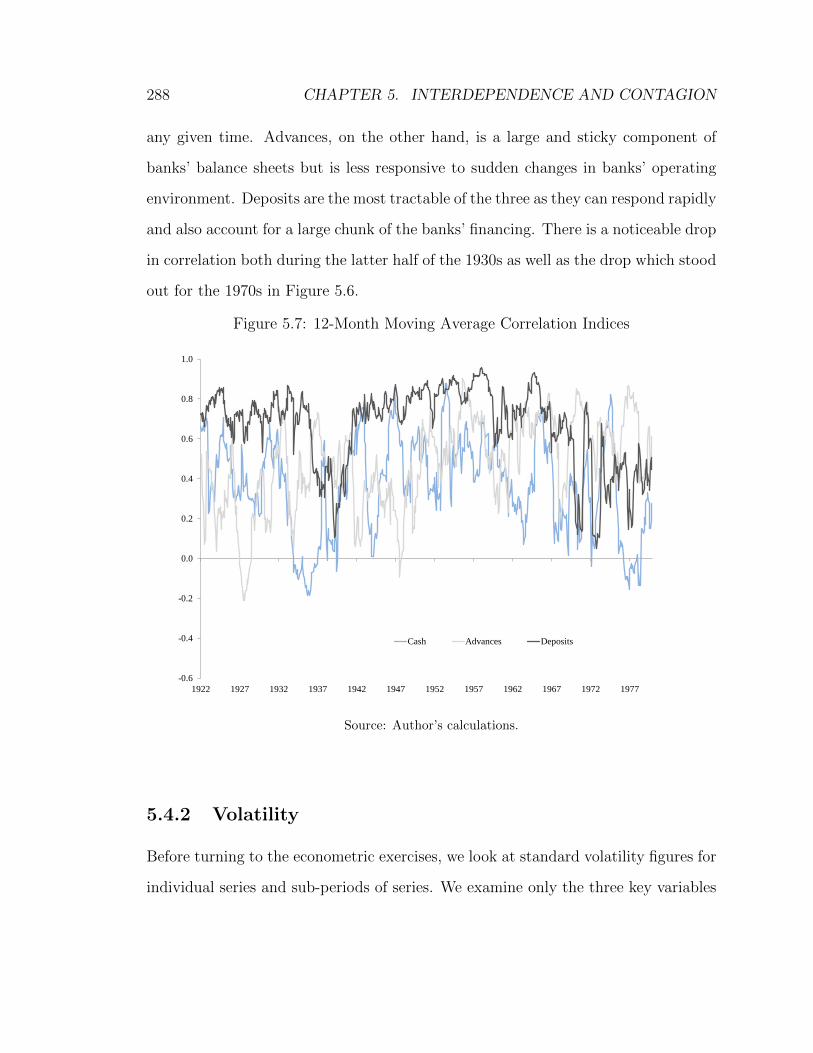
288 CHAPTER 5. INTERDEPENDENCE AND CONTAGION
any given time. Advances, on the other hand, is a large and sticky component of
banks’ balance sheets but is less responsive to sudden changes in banks’ operating
environment. Deposits are the most tractable of the three as they can respond rapidly
and also account for a large chunk of the banks’ financing. There is a noticeable drop
in correlation both during the latter half of the 1930s as well as the drop which stood
out for the 1970s in Figure 5.6.
Figure 5.7: 12-Month Moving Average Correlation Indices
-0.6
-0.4
-0.2
0.0
0.2
0.4
0.6
0.8
1.0
1922 1927 1932 1937 1942 1947 1952 1957 1962 1967 1972 1977
Cash Advances Deposits
Source: Author’s calculations.
5.4.2 Volatility
Before turning to the econometric exercises, we look at standard volatility figures for
individual series and sub-periods of series. We examine only the three key variables
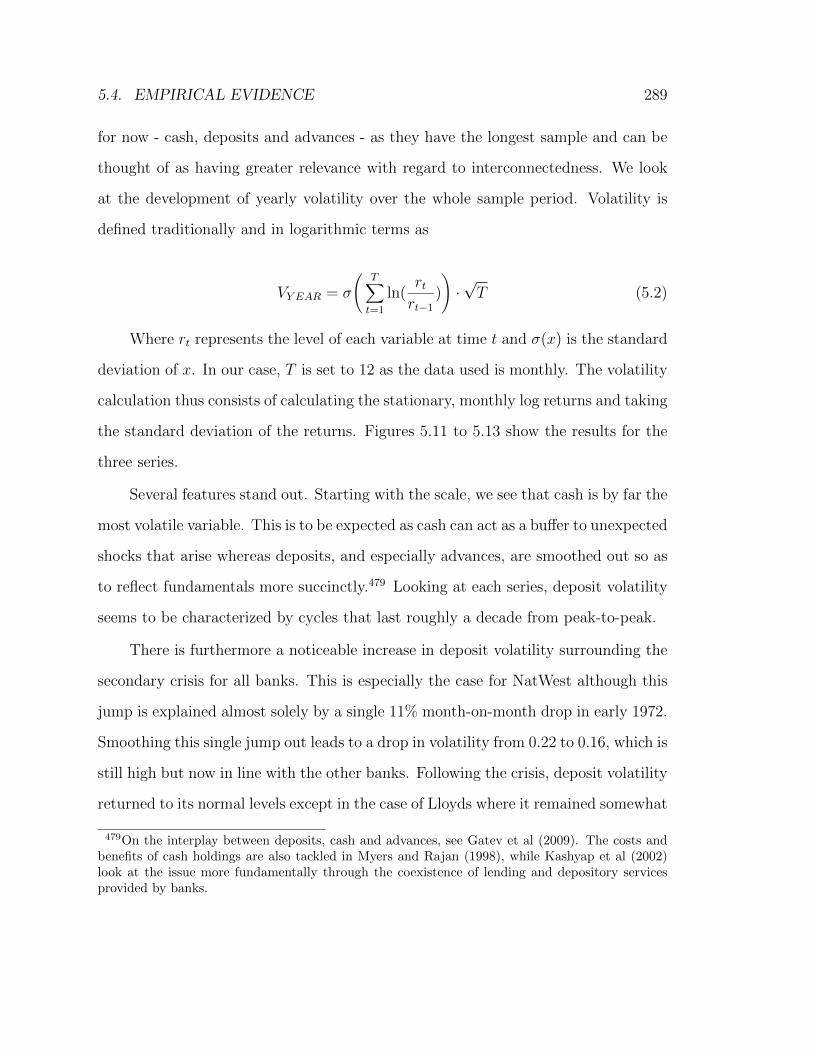
5.4. EMPIRICAL EVIDENCE 289
for now - cash, deposits and advances - as they have the longest sample and can be
thought of as having greater relevance with regard to interconnectedness. We look
at the development of yearly volatility over the whole sample period. Volatility is
defined traditionally and in logarithmic terms as
VY EAR = σ
(T∑t=1
ln(rtrt−1
)
)·√T (5.2)
Where rt represents the level of each variable at time t and σ(x) is the standard
deviation of x. In our case, T is set to 12 as the data used is monthly. The volatility
calculation thus consists of calculating the stationary, monthly log returns and taking
the standard deviation of the returns. Figures 5.11 to 5.13 show the results for the
three series.
Several features stand out. Starting with the scale, we see that cash is by far the
most volatile variable. This is to be expected as cash can act as a buffer to unexpected
shocks that arise whereas deposits, and especially advances, are smoothed out so as
to reflect fundamentals more succinctly.479 Looking at each series, deposit volatility
seems to be characterized by cycles that last roughly a decade from peak-to-peak.
There is furthermore a noticeable increase in deposit volatility surrounding the
secondary crisis for all banks. This is especially the case for NatWest although this
jump is explained almost solely by a single 11% month-on-month drop in early 1972.
Smoothing this single jump out leads to a drop in volatility from 0.22 to 0.16, which is
still high but now in line with the other banks. Following the crisis, deposit volatility
returned to its normal levels except in the case of Lloyds where it remained somewhat
479On the interplay between deposits, cash and advances, see Gatev et al (2009). The costs andbenefits of cash holdings are also tackled in Myers and Rajan (1998), while Kashyap et al (2002)look at the issue more fundamentally through the coexistence of lending and depository servicesprovided by banks.
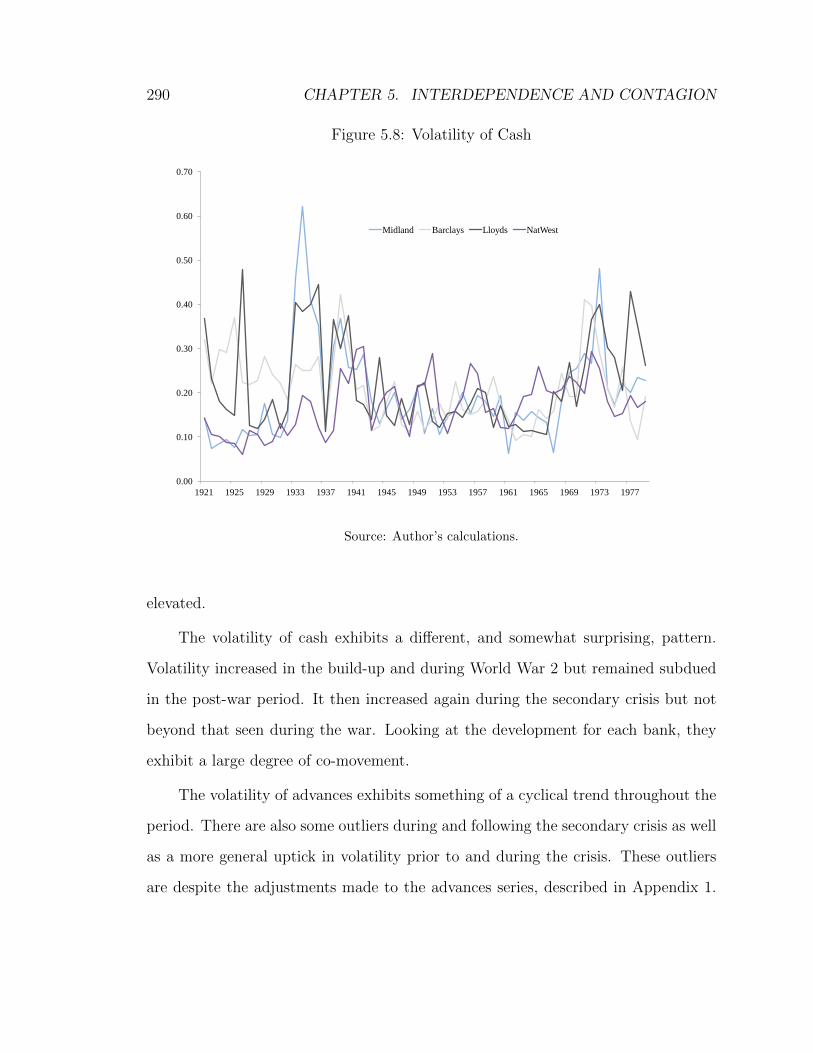
290 CHAPTER 5. INTERDEPENDENCE AND CONTAGION
Figure 5.8: Volatility of Cash
0.00
0.10
0.20
0.30
0.40
0.50
0.60
0.70
1921 1925 1929 1933 1937 1941 1945 1949 1953 1957 1961 1965 1969 1973 1977
Midland Barclays Lloyds NatWest
Source: Author’s calculations.
elevated.
The volatility of cash exhibits a different, and somewhat surprising, pattern.
Volatility increased in the build-up and during World War 2 but remained subdued
in the post-war period. It then increased again during the secondary crisis but not
beyond that seen during the war. Looking at the development for each bank, they
exhibit a large degree of co-movement.
The volatility of advances exhibits something of a cyclical trend throughout the
period. There are also some outliers during and following the secondary crisis as well
as a more general uptick in volatility prior to and during the crisis. These outliers
are despite the adjustments made to the advances series, described in Appendix 1.
5.4. EMPIRICAL EVIDENCE 291
Figure 5.9: Volatility of Deposits
0.00
0.05
0.10
0.15
0.20
0.25
1921 1925 1929 1933 1937 1941 1945 1949 1953 1957 1961 1965 1969 1973 1977
Midland Barclays Lloyds NatWest
Source: Author’s calculations.
Without these adjustments, the increase in volatility leading up to the crisis would
have been even more pronounced. It is interesting that this increase happens for all
banks and well before the crisis, showing the extent to which the clearers participated
in the lending boom that precipitated the crisis.
We can look closer at these developments of the loan book by calculating the
year-over-year loan growth for all banks. These figures do indeed confirm the above
with substantial increases as loan growth increased a lot in the late 1960s and early
1970s. In fact, lending growth was especially high in the years immediately prior
to the crisis - from 1971 to 1973. These dynamics persist when using the inflation-
adjusted figures.
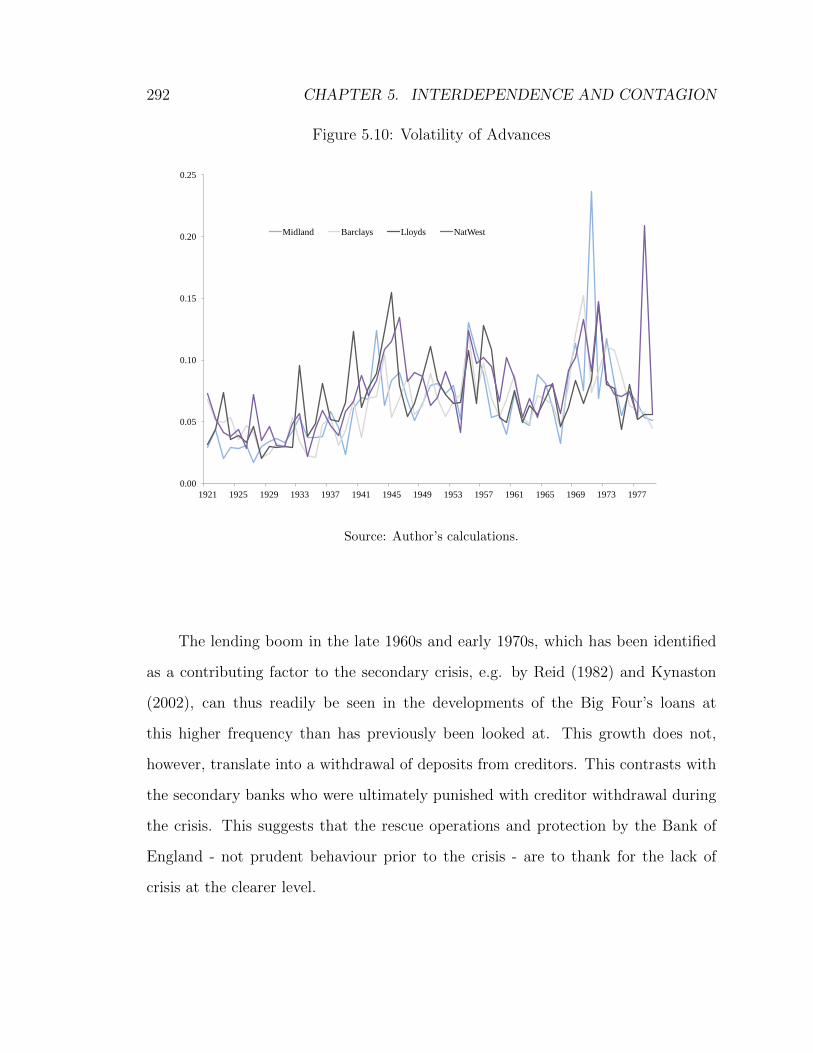
292 CHAPTER 5. INTERDEPENDENCE AND CONTAGION
Figure 5.10: Volatility of Advances
0.00
0.05
0.10
0.15
0.20
0.25
1921 1925 1929 1933 1937 1941 1945 1949 1953 1957 1961 1965 1969 1973 1977
Midland Barclays Lloyds NatWest
Source: Author’s calculations.
The lending boom in the late 1960s and early 1970s, which has been identified
as a contributing factor to the secondary crisis, e.g. by Reid (1982) and Kynaston
(2002), can thus readily be seen in the developments of the Big Four’s loans at
this higher frequency than has previously been looked at. This growth does not,
however, translate into a withdrawal of deposits from creditors. This contrasts with
the secondary banks who were ultimately punished with creditor withdrawal during
the crisis. This suggests that the rescue operations and protection by the Bank of
England - not prudent behaviour prior to the crisis - are to thank for the lack of
crisis at the clearer level.
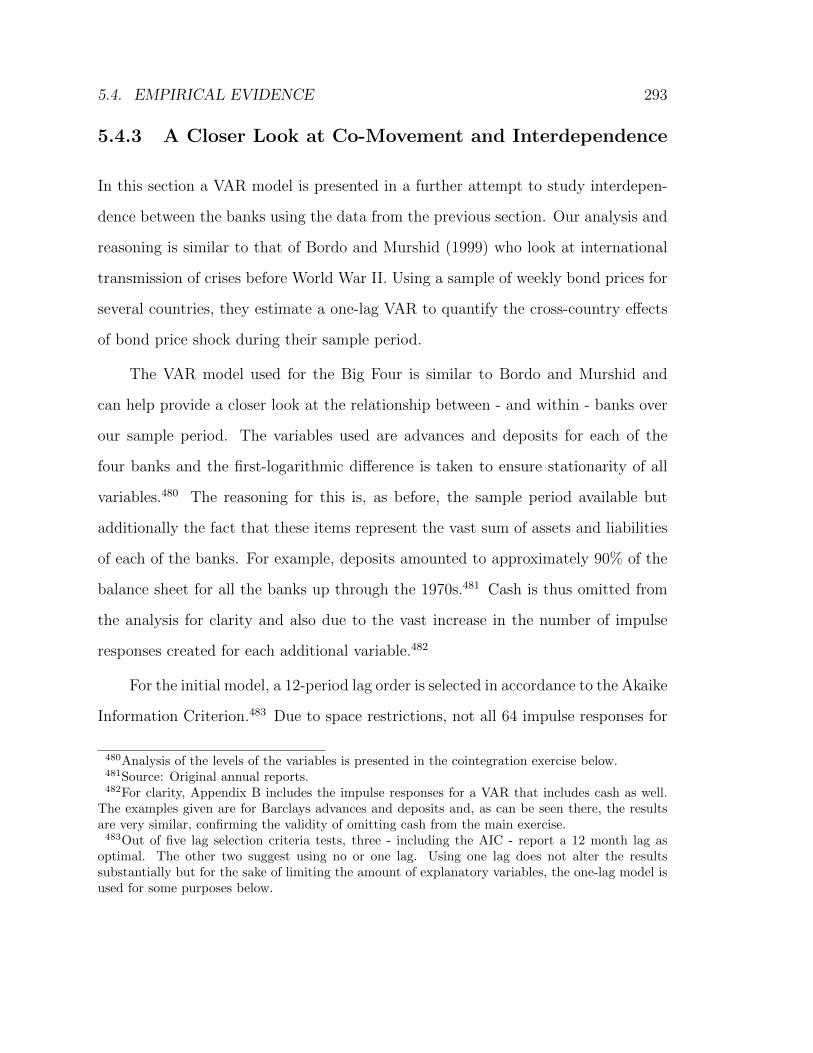
5.4. EMPIRICAL EVIDENCE 293
5.4.3 A Closer Look at Co-Movement and Interdependence
In this section a VAR model is presented in a further attempt to study interdepen-
dence between the banks using the data from the previous section. Our analysis and
reasoning is similar to that of Bordo and Murshid (1999) who look at international
transmission of crises before World War II. Using a sample of weekly bond prices for
several countries, they estimate a one-lag VAR to quantify the cross-country effects
of bond price shock during their sample period.
The VAR model used for the Big Four is similar to Bordo and Murshid and
can help provide a closer look at the relationship between - and within - banks over
our sample period. The variables used are advances and deposits for each of the
four banks and the first-logarithmic difference is taken to ensure stationarity of all
variables.480 The reasoning for this is, as before, the sample period available but
additionally the fact that these items represent the vast sum of assets and liabilities
of each of the banks. For example, deposits amounted to approximately 90% of the
balance sheet for all the banks up through the 1970s.481 Cash is thus omitted from
the analysis for clarity and also due to the vast increase in the number of impulse
responses created for each additional variable.482
For the initial model, a 12-period lag order is selected in accordance to the Akaike
Information Criterion.483 Due to space restrictions, not all 64 impulse responses for
480Analysis of the levels of the variables is presented in the cointegration exercise below.481Source: Original annual reports.482For clarity, Appendix B includes the impulse responses for a VAR that includes cash as well.
The examples given are for Barclays advances and deposits and, as can be seen there, the resultsare very similar, confirming the validity of omitting cash from the main exercise.483Out of five lag selection criteria tests, three - including the AIC - report a 12 month lag as
optimal. The other two suggest using no or one lag. Using one lag does not alter the resultssubstantially but for the sake of limiting the amount of explanatory variables, the one-lag model isused for some purposes below.
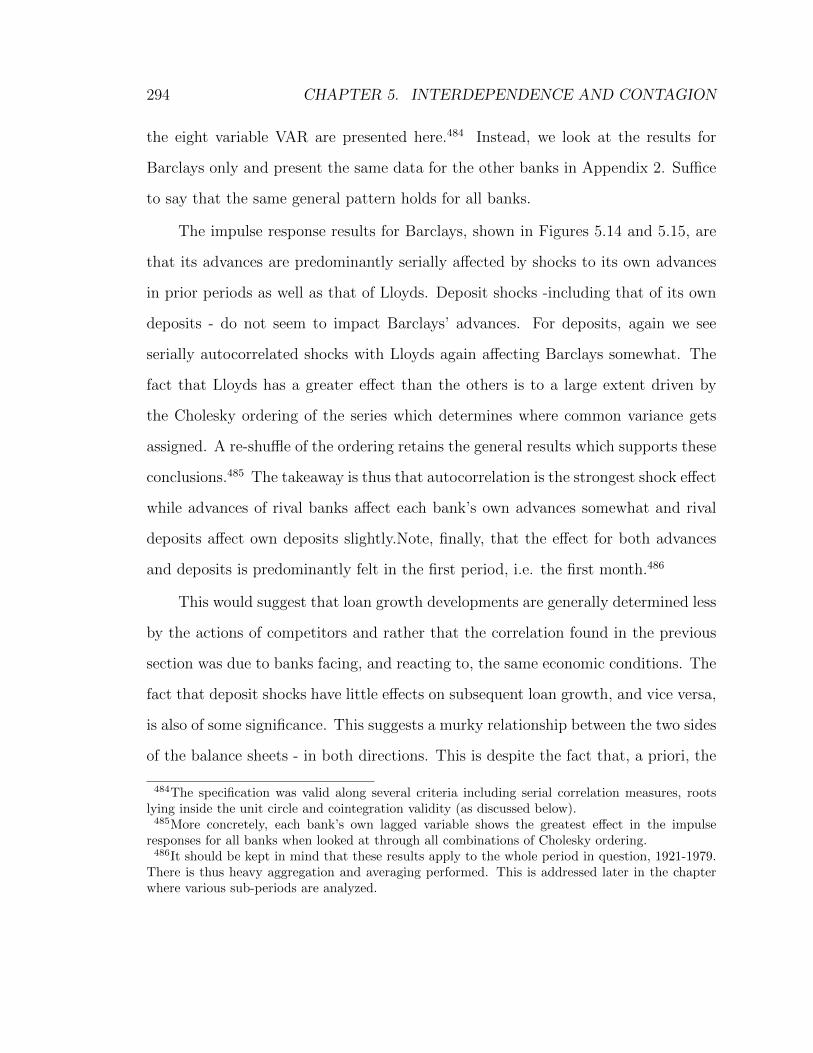
294 CHAPTER 5. INTERDEPENDENCE AND CONTAGION
the eight variable VAR are presented here.484 Instead, we look at the results for
Barclays only and present the same data for the other banks in Appendix 2. Suffice
to say that the same general pattern holds for all banks.
The impulse response results for Barclays, shown in Figures 5.14 and 5.15, are
that its advances are predominantly serially affected by shocks to its own advances
in prior periods as well as that of Lloyds. Deposit shocks -including that of its own
deposits - do not seem to impact Barclays’ advances. For deposits, again we see
serially autocorrelated shocks with Lloyds again affecting Barclays somewhat. The
fact that Lloyds has a greater effect than the others is to a large extent driven by
the Cholesky ordering of the series which determines where common variance gets
assigned. A re-shuffle of the ordering retains the general results which supports these
conclusions.485 The takeaway is thus that autocorrelation is the strongest shock effect
while advances of rival banks affect each bank’s own advances somewhat and rival
deposits affect own deposits slightly.Note, finally, that the effect for both advances
and deposits is predominantly felt in the first period, i.e. the first month.486
This would suggest that loan growth developments are generally determined less
by the actions of competitors and rather that the correlation found in the previous
section was due to banks facing, and reacting to, the same economic conditions. The
fact that deposit shocks have little effects on subsequent loan growth, and vice versa,
is also of some significance. This suggests a murky relationship between the two sides
of the balance sheets - in both directions. This is despite the fact that, a priori, the
484The specification was valid along several criteria including serial correlation measures, rootslying inside the unit circle and cointegration validity (as discussed below).485More concretely, each bank’s own lagged variable shows the greatest effect in the impulse
responses for all banks when looked at through all combinations of Cholesky ordering.486It should be kept in mind that these results apply to the whole period in question, 1921-1979.
There is thus heavy aggregation and averaging performed. This is addressed later in the chapterwhere various sub-periods are analyzed.
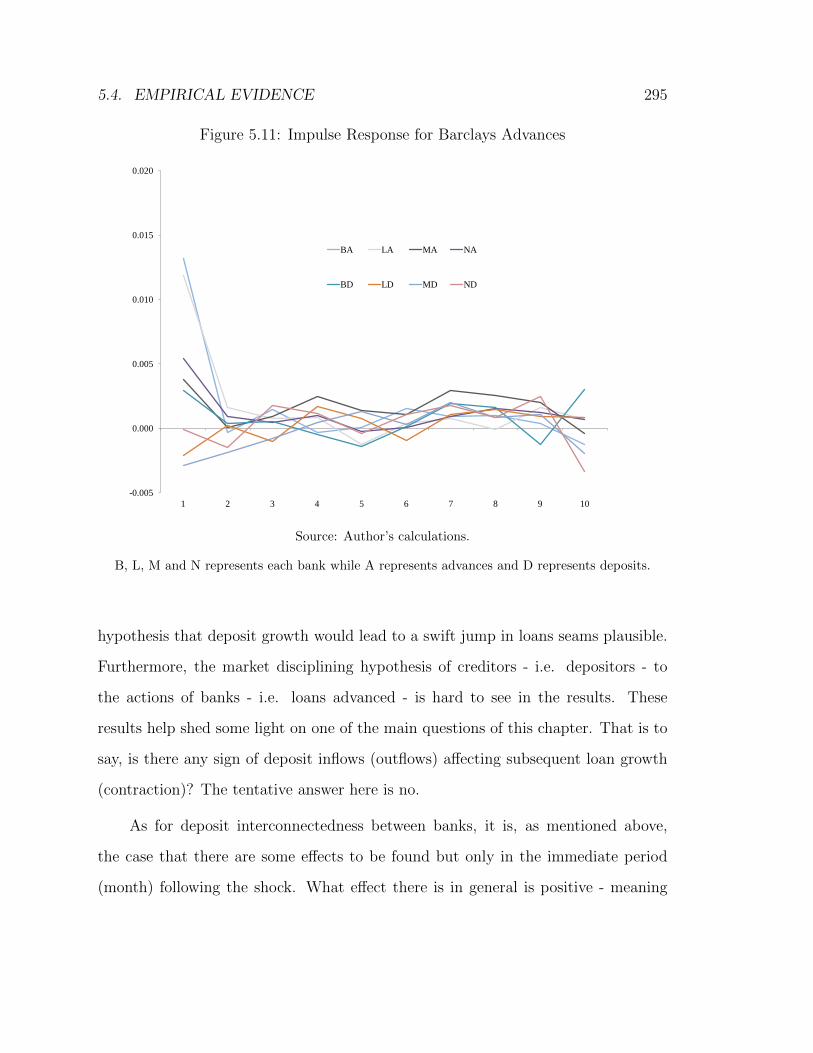
5.4. EMPIRICAL EVIDENCE 295
Figure 5.11: Impulse Response for Barclays Advances
-0.005
0.000
0.005
0.010
0.015
0.020
1 2 3 4 5 6 7 8 9 10
BA LA MA NA
BD LD MD ND
Source: Author’s calculations.
B, L, M and N represents each bank while A represents advances and D represents deposits.
hypothesis that deposit growth would lead to a swift jump in loans seams plausible.
Furthermore, the market disciplining hypothesis of creditors - i.e. depositors - to
the actions of banks - i.e. loans advanced - is hard to see in the results. These
results help shed some light on one of the main questions of this chapter. That is to
say, is there any sign of deposit inflows (outflows) affecting subsequent loan growth
(contraction)? The tentative answer here is no.
As for deposit interconnectedness between banks, it is, as mentioned above,
the case that there are some effects to be found but only in the immediate period
(month) following the shock. What effect there is in general is positive - meaning
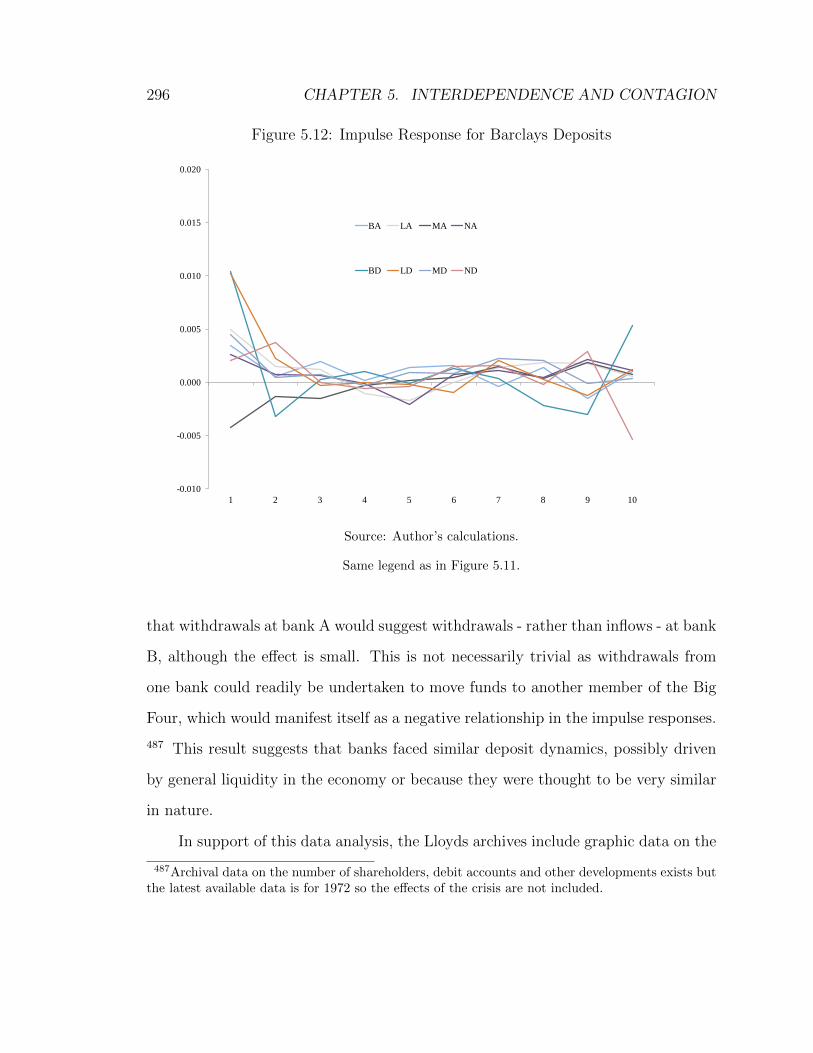
296 CHAPTER 5. INTERDEPENDENCE AND CONTAGION
Figure 5.12: Impulse Response for Barclays Deposits
-0.010
-0.005
0.000
0.005
0.010
0.015
0.020
1 2 3 4 5 6 7 8 9 10
BA LA MA NA
BD LD MD ND
Source: Author’s calculations.
Same legend as in Figure 5.11.
that withdrawals at bank A would suggest withdrawals - rather than inflows - at bank
B, although the effect is small. This is not necessarily trivial as withdrawals from
one bank could readily be undertaken to move funds to another member of the Big
Four, which would manifest itself as a negative relationship in the impulse responses.
487 This result suggests that banks faced similar deposit dynamics, possibly driven
by general liquidity in the economy or because they were thought to be very similar
in nature.
In support of this data analysis, the Lloyds archives include graphic data on the
487Archival data on the number of shareholders, debit accounts and other developments exists butthe latest available data is for 1972 so the effects of the crisis are not included.
5.4. EMPIRICAL EVIDENCE 297
number of new accounts by area during the latter stages of the property bubble and
through the secondary crisis. There is a marked increase in the number of current
accounts open in the run-up to the crisis and a slight decrease during it. In late 1975,
as the crisis was almost over, there is again an increase in accounts. Furthermore,
similar graphs show bilateral deposit withdrawals and inflows between Lloyds on the
one hand and the other Big Four on the other. These support the results from the
impulse response, namely a positive association of deposit flows between banks.488
Before looking at possible differences between subsamples of the data, Granger
causality tests are performed between each pair of variables in the VAR(12) model
containing the necessary series. This is done to gain an additional look at the in-
terplay between balance sheet variables on the one hand and different banks on the
other. Granger causality tests have been widely used for various purposes in the lit-
erature, although the non-trivial distinction between genuine causality and Granger
causality has often been highlighted.489,490 Nonetheless, such tests can help support
the analysis and serve as part of the puzzle when looking at the interaction of distinct
variables.
The Granger tests are performed for each of the eight variables (deposits and
advances for each bank) in addition to simple pair wise Granger tests outside of
the model for the sake of robustness. The full results of the tests can be found in
Appendix 2 but here the main conclusions are sketched. As above, there are two main
hypotheses to consider in these tests. The first is: how do the different sides of the
balance sheets interact? As such, how do assets and liabilities interact and is there
488Lloyds Archives, HO/CA/Ana/54, data on cross-bank comparisons.489See e.g. Sander and Kleimeier (2003) for use of Granger causality in a contagion study and
Hiemstra and Jones (1994) for an equity market application.490The approach taken here is similar to that of Lutkepohl and Reimers (1992) and also somewhat
similar to measures taken in Campbell and Shiller (1987).
298 CHAPTER 5. INTERDEPENDENCE AND CONTAGION
stronger explanatory power from one side to the other?491 The second hypothesis
centres on the core of this chapter; interconnectedness and interdependence. Are
changes in deposits and advances at Bank A driven (in a statistical sense) by changes
in deposits and advances at Bank B? This can be seen as a different presentation of
the same question asked in previous sections.492
For the VAR Granger tests, we are able to reject at the 95% level, for all banks
except Midland, the first hypothesis mentioned - the null being that deposits do
not Granger cause the same banks’ advances - and vice versa. The more interesting
connection, especially for our purposes here, is that of possible deposit relationship
between banks. For this, the 12-lag VAR is re-run using only deposits of the four
banks.493
For each bank, three Granger results are obtained - one for each of the other
banks - giving a total of 12 results. For 10 out of the 12 cases, we are able to reject
the hypothesis that deposit movements in Bank A do not Granger cause deposit
movements in Bank B.494 We therefore see a strong interconnectedness of deposits,
although the dynamics behind this co-movement can not readily be determined.495
Nonetheless, the results add weight to the simple correlation analysis of the previous
491This question also relates to the age-old ”chicken and egg” story of money creation and thepossible endogeneity of money. While not central to this chapter, a test can help shed light on thedetermination of deposits which is central to interdependence and the optimal design of lender oflast resort policies.492It should be noted that, as is the case in other empirical studies of interconnectedness, there
is little structural analysis that can be made and also that the various methods of estimation usedcan be seen as an attempt to suggest and strengthen priors rather than genuinely authenticate theunderlying structure.493The impulse responses are relegated to Appendix B. Suffice to say that they show very similar
patterns to the eight variable VAR from above.494The two pairs that cannot be rejected are that Midland funding causes Barclays deposits and
that NatWest deposits cause Midland deposits. There is thus lesser evidence of a relationshipbetween Midland and the other banks.495These results agree with the Bank’s intuition, mentioned in Section 2, that there was a certain
degree of coupling between banks, although the evidence then was informal.
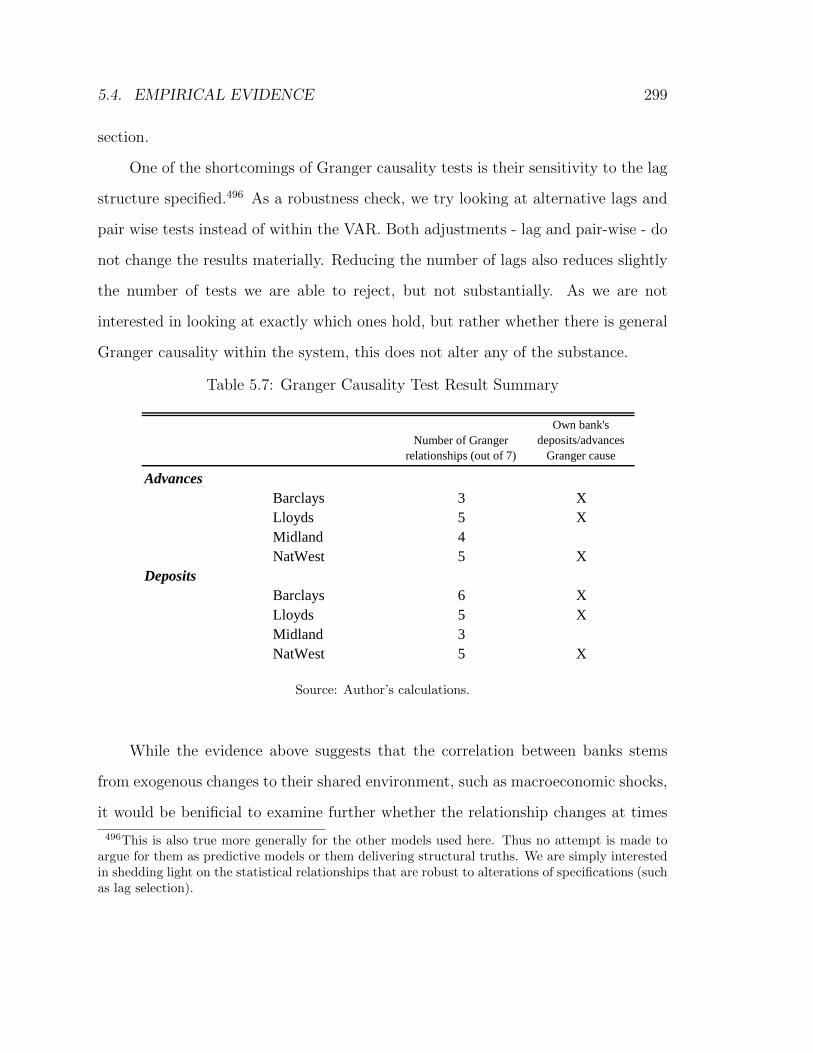
5.4. EMPIRICAL EVIDENCE 299
section.
One of the shortcomings of Granger causality tests is their sensitivity to the lag
structure specified.496 As a robustness check, we try looking at alternative lags and
pair wise tests instead of within the VAR. Both adjustments - lag and pair-wise - do
not change the results materially. Reducing the number of lags also reduces slightly
the number of tests we are able to reject, but not substantially. As we are not
interested in looking at exactly which ones hold, but rather whether there is general
Granger causality within the system, this does not alter any of the substance.
Table 5.7: Granger Causality Test Result Summary
Number of Granger
relationships (out of 7)
Own bank's
deposits/advances
Granger cause
Advances
Barclays 3 X
Lloyds 5 X
Midland 4
NatWest 5 X
Deposits
Barclays 6 X
Lloyds 5 X
Midland 3
NatWest 5 X
Source: Author’s calculations.
While the evidence above suggests that the correlation between banks stems
from exogenous changes to their shared environment, such as macroeconomic shocks,
it would be benificial to examine further whether the relationship changes at times
496This is also true more generally for the other models used here. Thus no attempt is made toargue for them as predictive models or them delivering structural truths. We are simply interestedin shedding light on the statistical relationships that are robust to alterations of specifications (suchas lag selection).
300 CHAPTER 5. INTERDEPENDENCE AND CONTAGION
of crisis and volatility. The sample is thus split into two periods to see whether
the more tranquil period exhibits less interdependence than at times of crisis. 1921-
1966 is chosen as the tranquil period as this roughly corresponds to the monotonous
development of volatility for both deposits and advances shown in Section 4.2 above.
The volatility exercise also strengthens our choice of deposits and advances since
these series show similar volatility, with a spike during the property bubble and
subsequent crisis towards the end of the period, while cash volatility is muddied by
the behaviour during the Great Depression.
Table 5.8 shows the sub-sample results for the Granger causality tests.497 R
indicates rejection of the null hypothesis of no Granger causality. In other words, R
suggests a relationship between the two banks in question. As can readily be seen,
there is much greater evidence of pair-wise relationships between banks deposits
before the bubble and subsequent crisis of the 1970s.498
Another approach used in the contagion and co-movement literature is estima-
tion of a Vector Error Correction Model (VECM) to account for possible cointe-
grating relationships between variables. Our approach here follows Johansen (1988)
and Johansen and Juselius (1990) which has the advantage over the conventional
Engle-Granger approach that it incorporates short-term and long-run dynamics. For
simplicity and clarity, we stick to the deposits of the sample banks and omit the
advances series from the previous exercise.499 The initial cointegration tests are
497In addition to Granger tests for the sub-samples, the same VAR models as above were runusing the two periods. They confirm the same general results as in the Granger tests. The impulseresponses from these sub-sample VARs are not printed for sake of brevity.498To adjust for the fact that the normal period is substantially longer than the bubble and
crisis period, the tests are run for both the full normal period as well as periods as long as thebubble/crisis period. The shorter samples allow for marginally less rejections of the null of nocausality, but nowhere near that of the bubble/crisis period.499The liability side of the balance sheet is generally where panic manifests itself and the effects
are felt, through both customer deposits and more recently inter-bank deposits. See e.g. Demirguc-
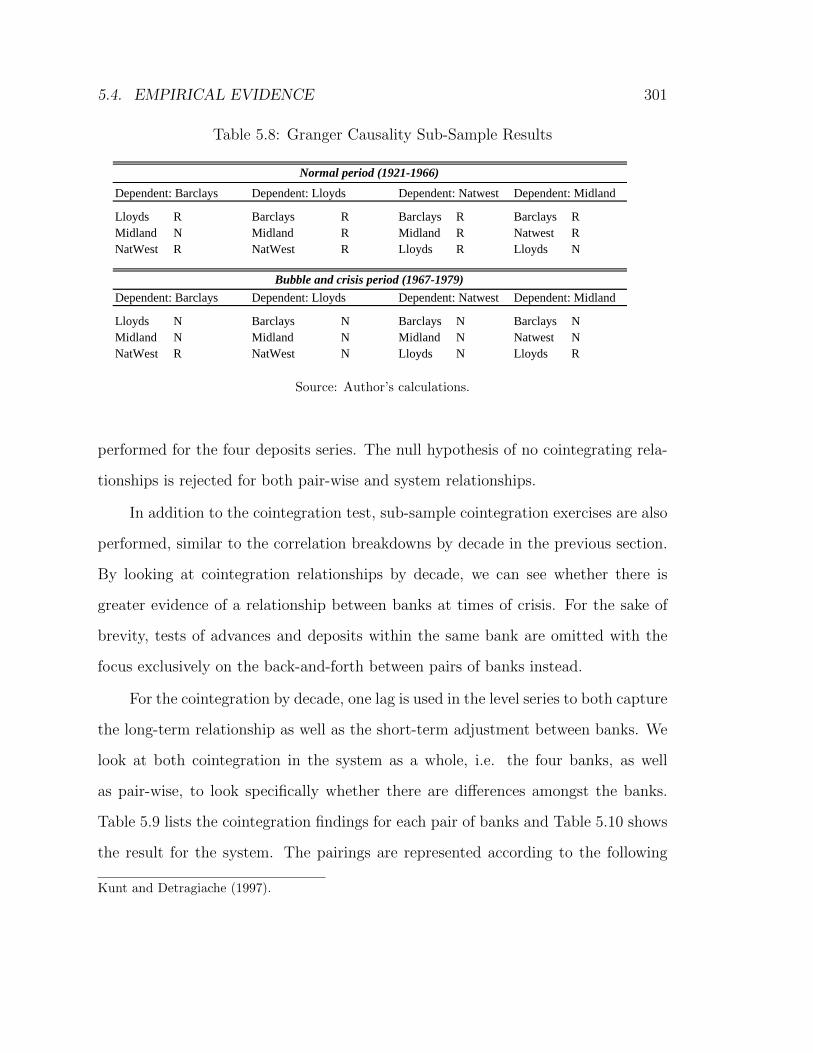
5.4. EMPIRICAL EVIDENCE 301
Table 5.8: Granger Causality Sub-Sample Results
Dependent: Barclays Dependent: Lloyds Dependent: Natwest Dependent: Midland
Lloyds R Barclays R Barclays R Barclays R
Midland N Midland R Midland R Natwest R
NatWest R NatWest R Lloyds R Lloyds N
Dependent: Barclays Dependent: Lloyds Dependent: Natwest Dependent: Midland
Lloyds N Barclays N Barclays N Barclays N
Midland N Midland N Midland N Natwest N
NatWest R NatWest N Lloyds N Lloyds R
Bubble and crisis period (1967-1979)
Normal period (1921-1966)
Source: Author’s calculations.
performed for the four deposits series. The null hypothesis of no cointegrating rela-
tionships is rejected for both pair-wise and system relationships.
In addition to the cointegration test, sub-sample cointegration exercises are also
performed, similar to the correlation breakdowns by decade in the previous section.
By looking at cointegration relationships by decade, we can see whether there is
greater evidence of a relationship between banks at times of crisis. For the sake of
brevity, tests of advances and deposits within the same bank are omitted with the
focus exclusively on the back-and-forth between pairs of banks instead.
For the cointegration by decade, one lag is used in the level series to both capture
the long-term relationship as well as the short-term adjustment between banks. We
look at both cointegration in the system as a whole, i.e. the four banks, as well
as pair-wise, to look specifically whether there are differences amongst the banks.
Table 5.9 lists the cointegration findings for each pair of banks and Table 5.10 shows
the result for the system. The pairings are represented according to the following
Kunt and Detragiache (1997).
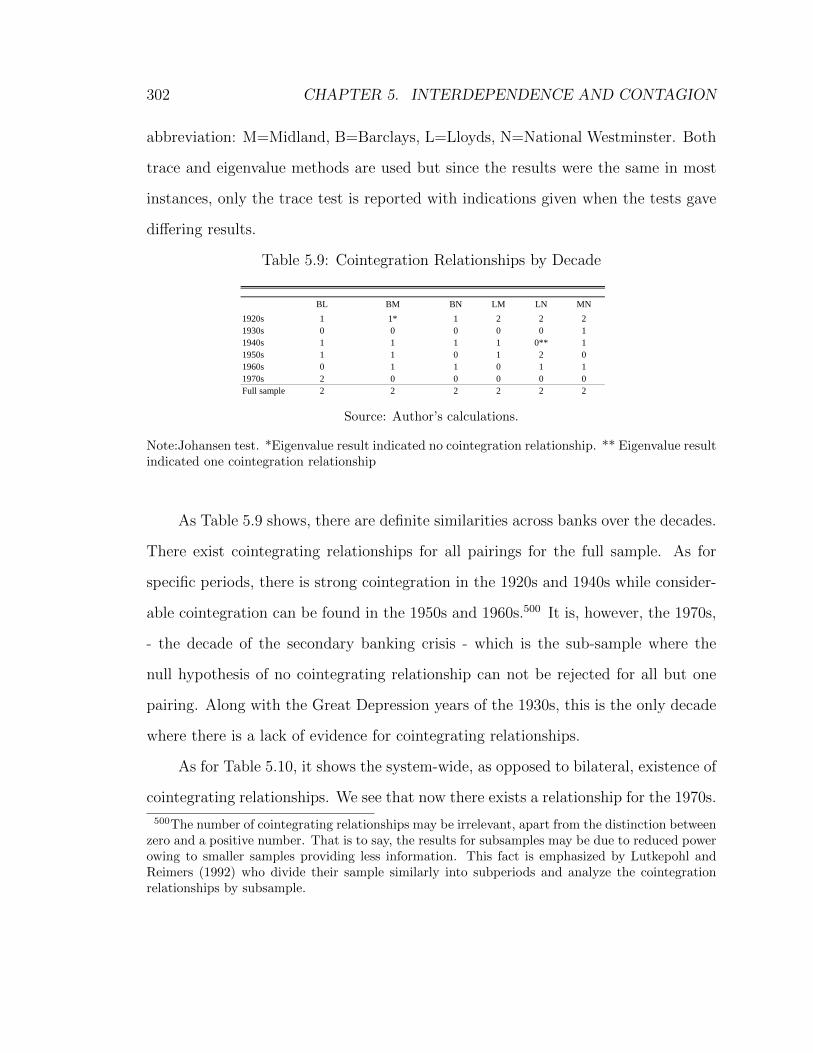
302 CHAPTER 5. INTERDEPENDENCE AND CONTAGION
abbreviation: M=Midland, B=Barclays, L=Lloyds, N=National Westminster. Both
trace and eigenvalue methods are used but since the results were the same in most
instances, only the trace test is reported with indications given when the tests gave
differing results.
Table 5.9: Cointegration Relationships by Decade
BL BM BN LM LN MN
1920s 1 1* 1 2 2 2
1930s 0 0 0 0 0 1
1940s 1 1 1 1 0** 1
1950s 1 1 0 1 2 0
1960s 0 1 1 0 1 1
1970s 2 0 0 0 0 0
Full sample 2 2 2 2 2 2
Source: Author’s calculations.
Note:Johansen test. *Eigenvalue result indicated no cointegration relationship. ** Eigenvalue resultindicated one cointegration relationship
As Table 5.9 shows, there are definite similarities across banks over the decades.
There exist cointegrating relationships for all pairings for the full sample. As for
specific periods, there is strong cointegration in the 1920s and 1940s while consider-
able cointegration can be found in the 1950s and 1960s.500 It is, however, the 1970s,
- the decade of the secondary banking crisis - which is the sub-sample where the
null hypothesis of no cointegrating relationship can not be rejected for all but one
pairing. Along with the Great Depression years of the 1930s, this is the only decade
where there is a lack of evidence for cointegrating relationships.
As for Table 5.10, it shows the system-wide, as opposed to bilateral, existence of
cointegrating relationships. We see that now there exists a relationship for the 1970s.
500The number of cointegrating relationships may be irrelevant, apart from the distinction betweenzero and a positive number. That is to say, the results for subsamples may be due to reduced powerowing to smaller samples providing less information. This fact is emphasized by Lutkepohl andReimers (1992) who divide their sample similarly into subperiods and analyze the cointegrationrelationships by subsample.
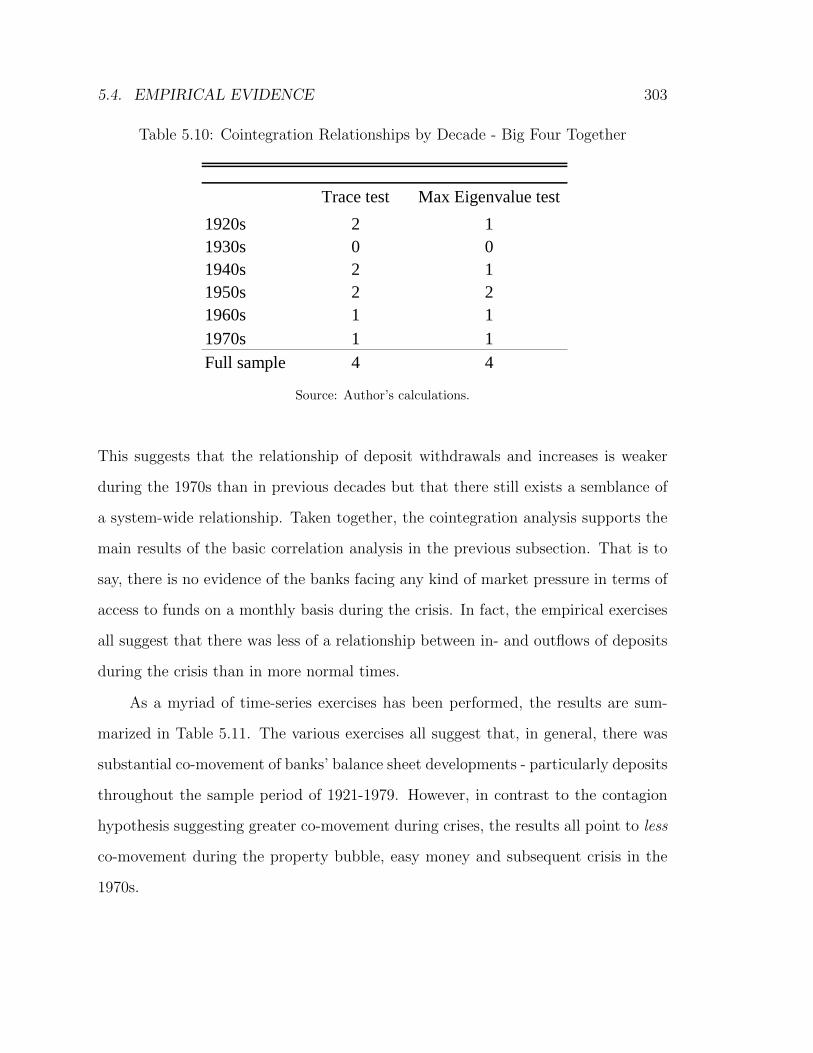
5.4. EMPIRICAL EVIDENCE 303
Table 5.10: Cointegration Relationships by Decade - Big Four Together
Trace test Max Eigenvalue test
1920s 2 1
1930s 0 0
1940s 2 1
1950s 2 2
1960s 1 1
1970s 1 1
Full sample 4 4
Source: Author’s calculations.
This suggests that the relationship of deposit withdrawals and increases is weaker
during the 1970s than in previous decades but that there still exists a semblance of
a system-wide relationship. Taken together, the cointegration analysis supports the
main results of the basic correlation analysis in the previous subsection. That is to
say, there is no evidence of the banks facing any kind of market pressure in terms of
access to funds on a monthly basis during the crisis. In fact, the empirical exercises
all suggest that there was less of a relationship between in- and outflows of deposits
during the crisis than in more normal times.
As a myriad of time-series exercises has been performed, the results are sum-
marized in Table 5.11. The various exercises all suggest that, in general, there was
substantial co-movement of banks’ balance sheet developments - particularly deposits
throughout the sample period of 1921-1979. However, in contrast to the contagion
hypothesis suggesting greater co-movement during crises, the results all point to less
co-movement during the property bubble, easy money and subsequent crisis in the
1970s.
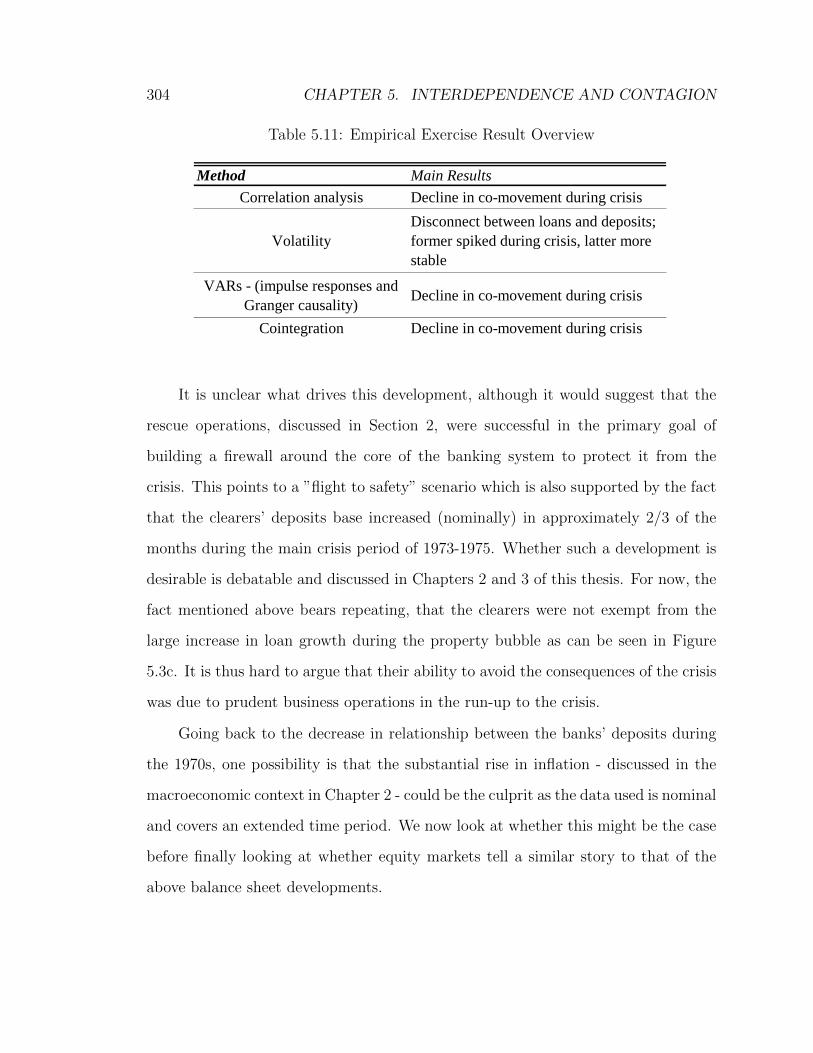
304 CHAPTER 5. INTERDEPENDENCE AND CONTAGION
Table 5.11: Empirical Exercise Result Overview
Method Main Results
Correlation analysis Decline in co-movement during crisis
Volatility
Disconnect between loans and deposits;
former spiked during crisis, latter more
stable
VARs - (impulse responses and
Granger causality)Decline in co-movement during crisis
Cointegration Decline in co-movement during crisis
It is unclear what drives this development, although it would suggest that the
rescue operations, discussed in Section 2, were successful in the primary goal of
building a firewall around the core of the banking system to protect it from the
crisis. This points to a ”flight to safety” scenario which is also supported by the fact
that the clearers’ deposits base increased (nominally) in approximately 2/3 of the
months during the main crisis period of 1973-1975. Whether such a development is
desirable is debatable and discussed in Chapters 2 and 3 of this thesis. For now, the
fact mentioned above bears repeating, that the clearers were not exempt from the
large increase in loan growth during the property bubble as can be seen in Figure
5.3c. It is thus hard to argue that their ability to avoid the consequences of the crisis
was due to prudent business operations in the run-up to the crisis.
Going back to the decrease in relationship between the banks’ deposits during
the 1970s, one possibility is that the substantial rise in inflation - discussed in the
macroeconomic context in Chapter 2 - could be the culprit as the data used is nominal
and covers an extended time period. We now look at whether this might be the case
before finally looking at whether equity markets tell a similar story to that of the
above balance sheet developments.
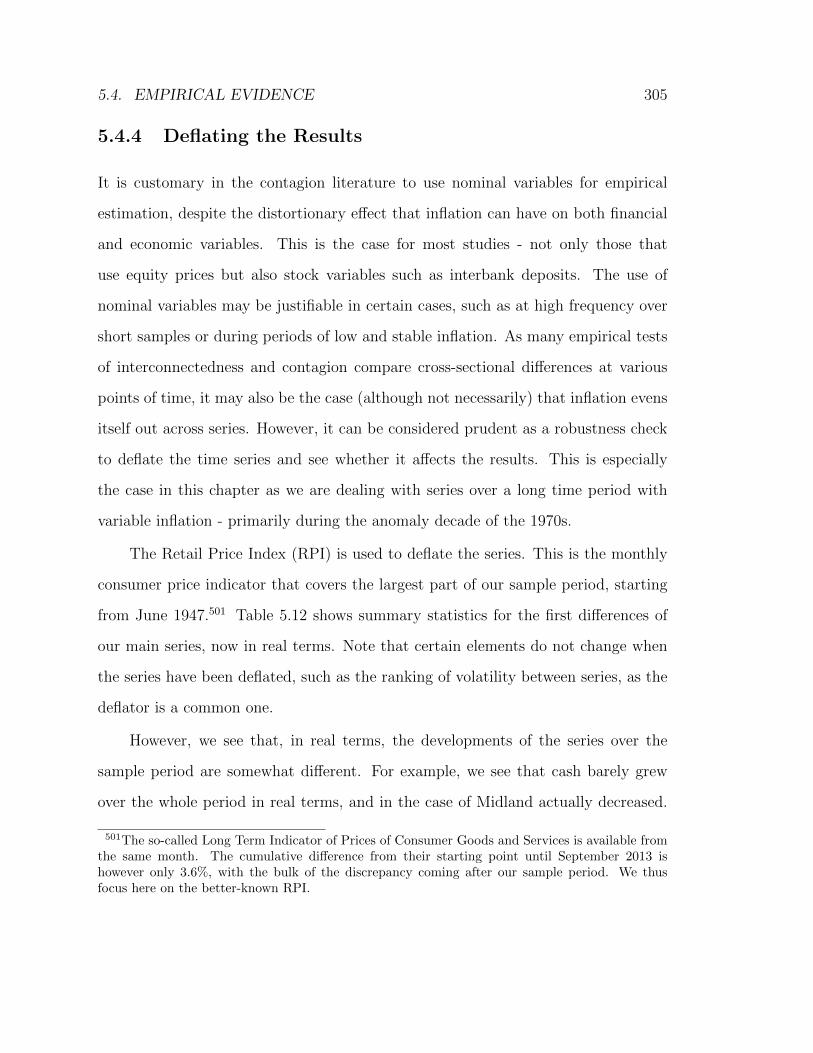
5.4. EMPIRICAL EVIDENCE 305
5.4.4 Deflating the Results
It is customary in the contagion literature to use nominal variables for empirical
estimation, despite the distortionary effect that inflation can have on both financial
and economic variables. This is the case for most studies - not only those that
use equity prices but also stock variables such as interbank deposits. The use of
nominal variables may be justifiable in certain cases, such as at high frequency over
short samples or during periods of low and stable inflation. As many empirical tests
of interconnectedness and contagion compare cross-sectional differences at various
points of time, it may also be the case (although not necessarily) that inflation evens
itself out across series. However, it can be considered prudent as a robustness check
to deflate the time series and see whether it affects the results. This is especially
the case in this chapter as we are dealing with series over a long time period with
variable inflation - primarily during the anomaly decade of the 1970s.
The Retail Price Index (RPI) is used to deflate the series. This is the monthly
consumer price indicator that covers the largest part of our sample period, starting
from June 1947.501 Table 5.12 shows summary statistics for the first differences of
our main series, now in real terms. Note that certain elements do not change when
the series have been deflated, such as the ranking of volatility between series, as the
deflator is a common one.
However, we see that, in real terms, the developments of the series over the
sample period are somewhat different. For example, we see that cash barely grew
over the whole period in real terms, and in the case of Midland actually decreased.
501The so-called Long Term Indicator of Prices of Consumer Goods and Services is available fromthe same month. The cumulative difference from their starting point until September 2013 ishowever only 3.6%, with the bulk of the discrepancy coming after our sample period. We thusfocus here on the better-known RPI.
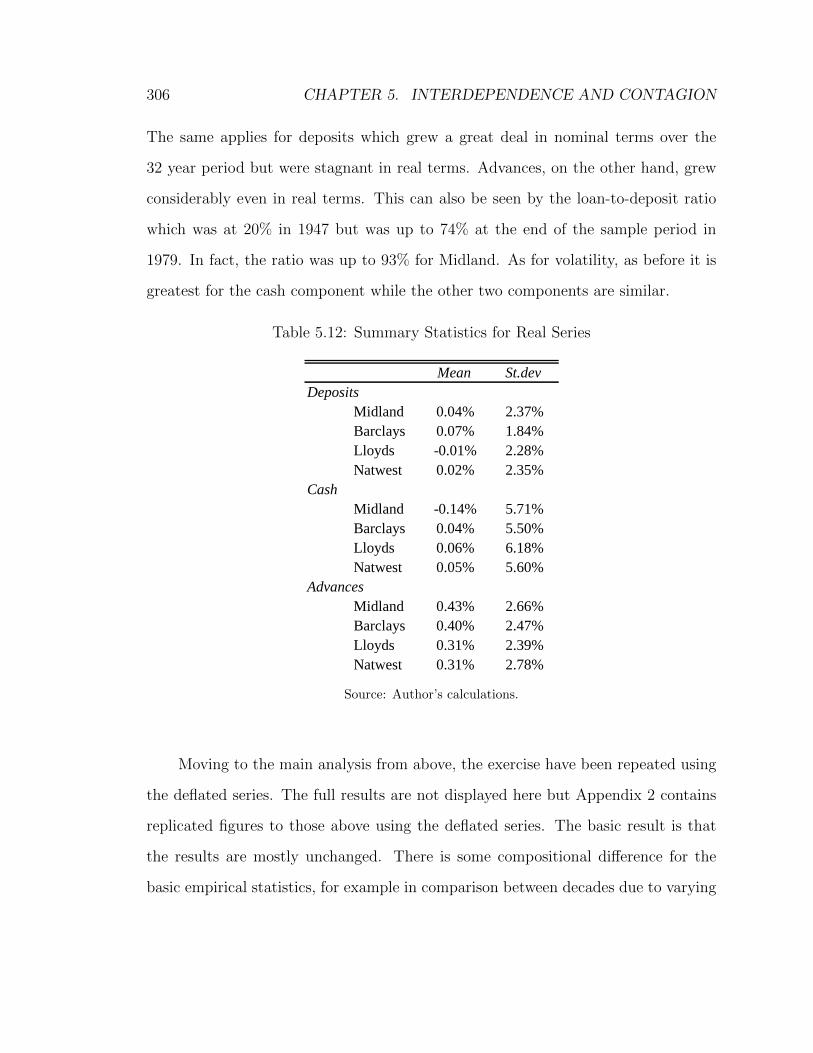
306 CHAPTER 5. INTERDEPENDENCE AND CONTAGION
The same applies for deposits which grew a great deal in nominal terms over the
32 year period but were stagnant in real terms. Advances, on the other hand, grew
considerably even in real terms. This can also be seen by the loan-to-deposit ratio
which was at 20% in 1947 but was up to 74% at the end of the sample period in
1979. In fact, the ratio was up to 93% for Midland. As for volatility, as before it is
greatest for the cash component while the other two components are similar.
Table 5.12: Summary Statistics for Real Series
Mean St.dev
Deposits
Midland 0.04% 2.37%
Barclays 0.07% 1.84%
Lloyds -0.01% 2.28%
Natwest 0.02% 2.35%
Cash
Midland -0.14% 5.71%
Barclays 0.04% 5.50%
Lloyds 0.06% 6.18%
Natwest 0.05% 5.60%
Advances
Midland 0.43% 2.66%
Barclays 0.40% 2.47%
Lloyds 0.31% 2.39%
Natwest 0.31% 2.78%
Source: Author’s calculations.
Moving to the main analysis from above, the exercise have been repeated using
the deflated series. The full results are not displayed here but Appendix 2 contains
replicated figures to those above using the deflated series. The basic result is that
the results are mostly unchanged. There is some compositional difference for the
basic empirical statistics, for example in comparison between decades due to varying
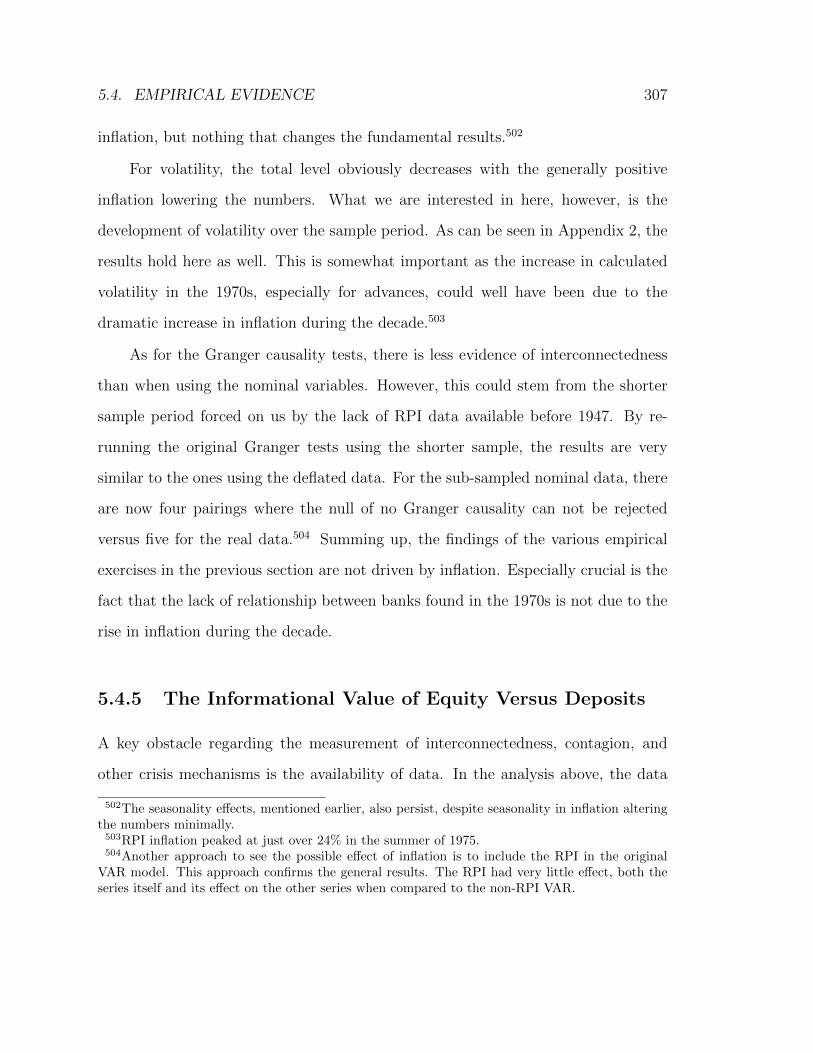
5.4. EMPIRICAL EVIDENCE 307
inflation, but nothing that changes the fundamental results.502
For volatility, the total level obviously decreases with the generally positive
inflation lowering the numbers. What we are interested in here, however, is the
development of volatility over the sample period. As can be seen in Appendix 2, the
results hold here as well. This is somewhat important as the increase in calculated
volatility in the 1970s, especially for advances, could well have been due to the
dramatic increase in inflation during the decade.503
As for the Granger causality tests, there is less evidence of interconnectedness
than when using the nominal variables. However, this could stem from the shorter
sample period forced on us by the lack of RPI data available before 1947. By re-
running the original Granger tests using the shorter sample, the results are very
similar to the ones using the deflated data. For the sub-sampled nominal data, there
are now four pairings where the null of no Granger causality can not be rejected
versus five for the real data.504 Summing up, the findings of the various empirical
exercises in the previous section are not driven by inflation. Especially crucial is the
fact that the lack of relationship between banks found in the 1970s is not due to the
rise in inflation during the decade.
5.4.5 The Informational Value of Equity Versus Deposits
A key obstacle regarding the measurement of interconnectedness, contagion, and
other crisis mechanisms is the availability of data. In the analysis above, the data
502The seasonality effects, mentioned earlier, also persist, despite seasonality in inflation alteringthe numbers minimally.503RPI inflation peaked at just over 24% in the summer of 1975.504Another approach to see the possible effect of inflation is to include the RPI in the original
VAR model. This approach confirms the general results. The RPI had very little effect, both theseries itself and its effect on the other series when compared to the non-RPI VAR.
308 CHAPTER 5. INTERDEPENDENCE AND CONTAGION
used was not readily available in real-time and not even after each crisis had subsided.
As mentioned above, many other attempts to measure interconnectedness have relied
on publicly available data, primarily equity data. This might be problematic. Equity
returns measure the market’s perception of the value of the given bank’s capital, and
while this indicator is an important one, its fluctuations do not directly lead to banks
experiencing problems during a panic.
It may thus well be the case that the value of a bank’s equity on the secondary
market drops during market turbulence but recovers fully once the panic has sub-
sided. If this is the case, the bank is only very indirectly affected. The reason
that equity returns are considered a reasonable tool for measuring the seriousness of
bank troubles is that they are implicitly assumed to be a good proxy for other vari-
ables, including general creditor unease. The argument goes that if there is unease
amongst equity holders, leading to substantially lower equity valuation, then this un-
ease would apply to other stakeholders as well, namely depositors and bondholders,
who may cause bank panics by withdrawing funds from the bank and threatening
their creditworthiness.
In this section, this assumption is tested by comparing the publicly available
equity data of the time with our previously confidential bank deposit data. We look
at the development of equity returns amongst the Big Four and study how closely
the returns mirror that of bank deposits. We look at both the relative increase in
volatility during the secondary crisis as well as the potential increase in co-movement
between banks during the crisis. One possibility is that equity returns become more
volatile (i.e. are less sticky) than deposits at times of crisis and that there is greater
co-movement for equities as the public availability of equity data leads to greater
awareness of equity holders in other banks. This latter possibility is similar in func-
5.4. EMPIRICAL EVIDENCE 309
tion to the classic Diamond and Dybvig (1983) mechanism.
The equity data used is daily closing prices from Datastream covering the period
1965 to 1980. This is the same data as used for the option pricing framework in
Chapter 3 of this thesis. Although Datastream covers a greater period than most
other databases, 1965 is as far back as the series go. These 15 years are however a
long enough time for our purposes. In fact, many similar studies use a sample period
of only 1-2 years.505 Figure 5.13 shows the simple average yearly rise in equity prices
for the Big Four. The rise during the property bubble, the subsequent drop during
the secondary crisis and rapid recovery after it are all clearly visible in the equity
data. Note that the rise in the early 1970s coincides with the large loan growth
documented above. The subsequent drop does not look too dramatic due to the
scale but the 12-month decline reached 68% in November of 1974.
We start the interdependence analysis by looking at simple cross-bank corre-
lations of equity returns. As daily data is available, correlations are calculated for
both daily and monthly returns. Comparing the two can indicate whether the use
of monthly data for balance sheet data might bias those results. These series can
in turn together give us a first approximation to the degree of co-movement be-
tween banks and whether looking at equity correlation may lead to overestimation
of interconnectedness.
Figures 5.17 and 5.18 show a similar trailing 12-month average correlation for
each of the pair wise correlations. The monthly index is calculated in the same way
as the index in Figure 5.7 while the daily one is similarly constructed. Looking at the
daily index first, we can see that there is a sharp drop in correlation in the beginning
505This was indeed the case for most studies of between-country contagion following the Asiacrises, see for example Baur and Fry (2011).
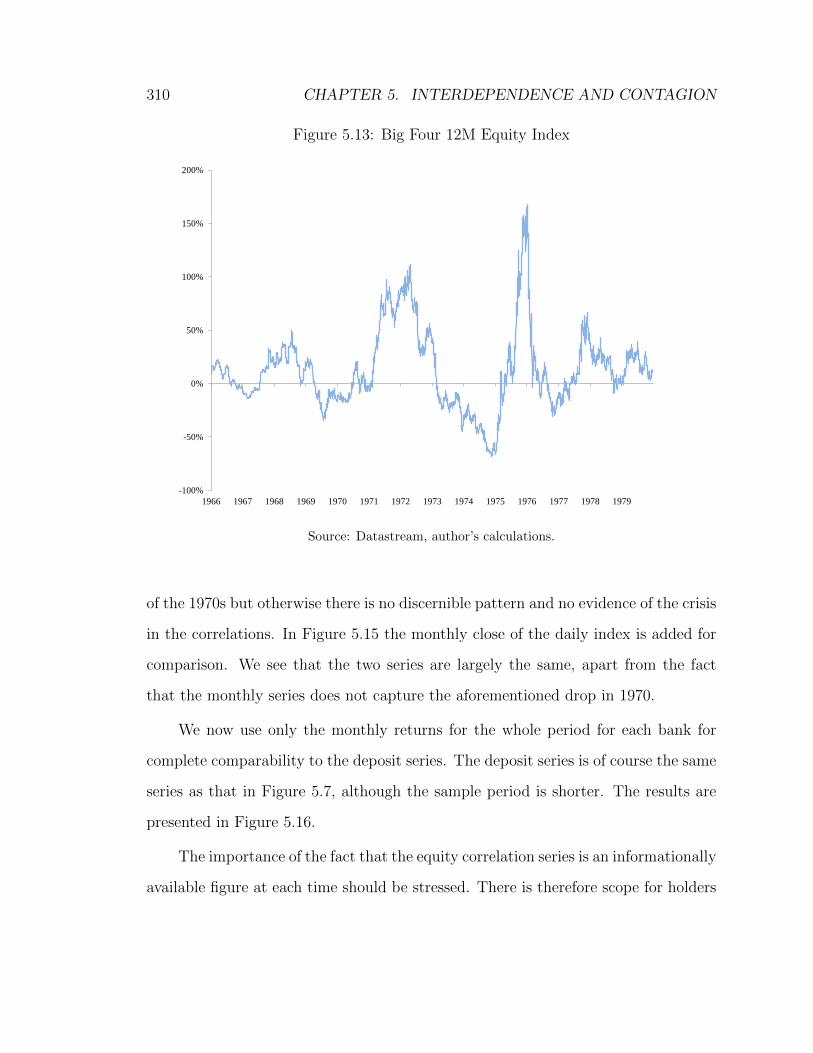
310 CHAPTER 5. INTERDEPENDENCE AND CONTAGION
Figure 5.13: Big Four 12M Equity Index
-100%
-50%
0%
50%
100%
150%
200%
1966 1967 1968 1969 1970 1971 1972 1973 1974 1975 1976 1977 1978 1979
Source: Datastream, author’s calculations.
of the 1970s but otherwise there is no discernible pattern and no evidence of the crisis
in the correlations. In Figure 5.15 the monthly close of the daily index is added for
comparison. We see that the two series are largely the same, apart from the fact
that the monthly series does not capture the aforementioned drop in 1970.
We now use only the monthly returns for the whole period for each bank for
complete comparability to the deposit series. The deposit series is of course the same
series as that in Figure 5.7, although the sample period is shorter. The results are
presented in Figure 5.16.
The importance of the fact that the equity correlation series is an informationally
available figure at each time should be stressed. There is therefore scope for holders
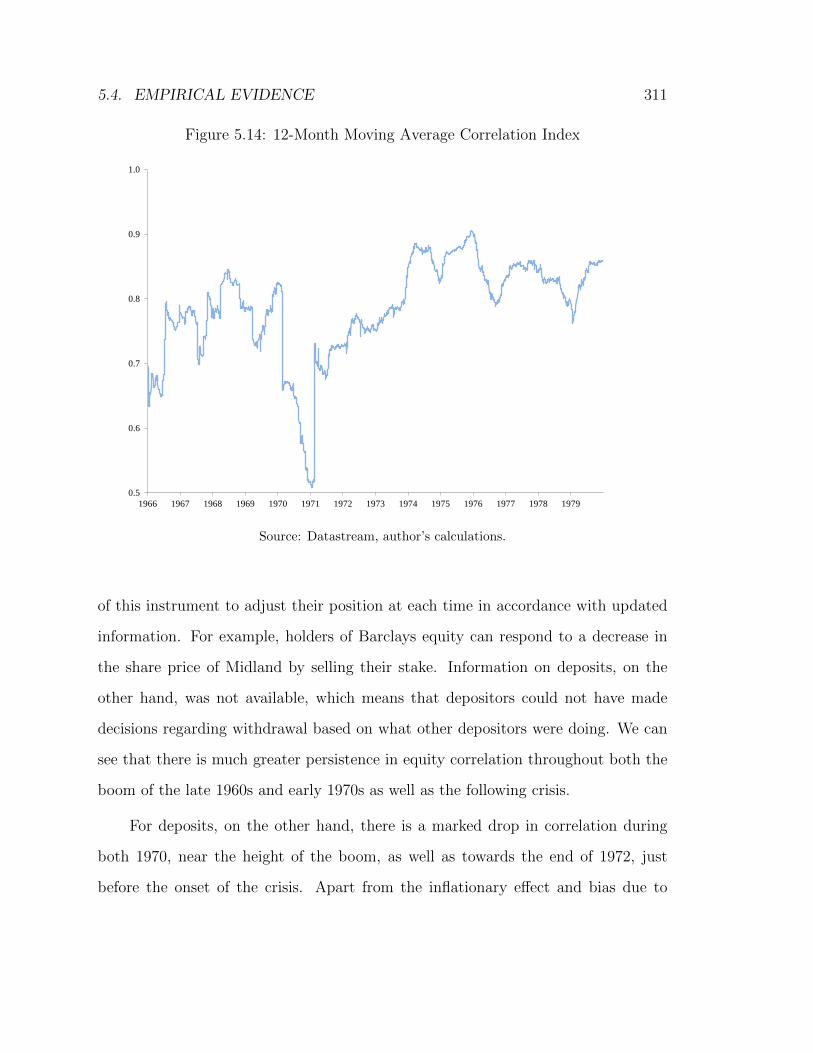
5.4. EMPIRICAL EVIDENCE 311
Figure 5.14: 12-Month Moving Average Correlation Index
0.5
0.6
0.7
0.8
0.9
1.0
1966 1967 1968 1969 1970 1971 1972 1973 1974 1975 1976 1977 1978 1979
Source: Datastream, author’s calculations.
of this instrument to adjust their position at each time in accordance with updated
information. For example, holders of Barclays equity can respond to a decrease in
the share price of Midland by selling their stake. Information on deposits, on the
other hand, was not available, which means that depositors could not have made
decisions regarding withdrawal based on what other depositors were doing. We can
see that there is much greater persistence in equity correlation throughout both the
boom of the late 1960s and early 1970s as well as the following crisis.
For deposits, on the other hand, there is a marked drop in correlation during
both 1970, near the height of the boom, as well as towards the end of 1972, just
before the onset of the crisis. Apart from the inflationary effect and bias due to
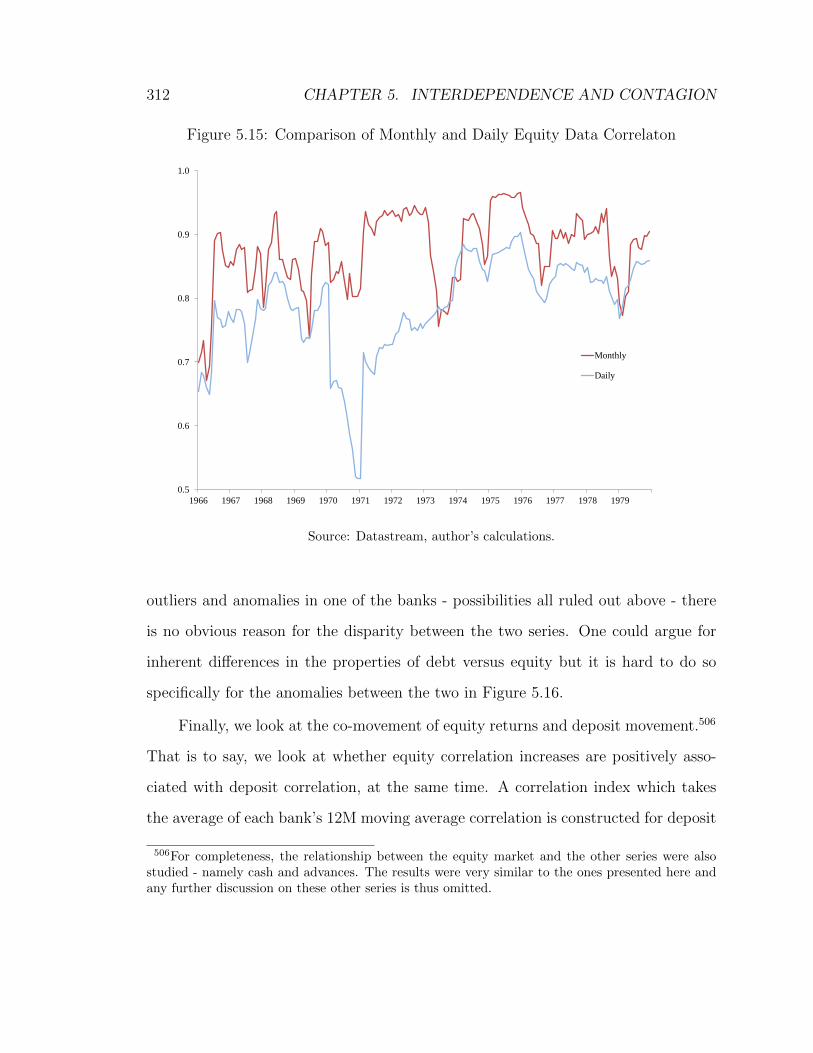
312 CHAPTER 5. INTERDEPENDENCE AND CONTAGION
Figure 5.15: Comparison of Monthly and Daily Equity Data Correlaton
0.5
0.6
0.7
0.8
0.9
1.0
1966 1967 1968 1969 1970 1971 1972 1973 1974 1975 1976 1977 1978 1979
Monthly
Daily
Source: Datastream, author’s calculations.
outliers and anomalies in one of the banks - possibilities all ruled out above - there
is no obvious reason for the disparity between the two series. One could argue for
inherent differences in the properties of debt versus equity but it is hard to do so
specifically for the anomalies between the two in Figure 5.16.
Finally, we look at the co-movement of equity returns and deposit movement.506
That is to say, we look at whether equity correlation increases are positively asso-
ciated with deposit correlation, at the same time. A correlation index which takes
the average of each bank’s 12M moving average correlation is constructed for deposit
506For completeness, the relationship between the equity market and the other series were alsostudied - namely cash and advances. The results were very similar to the ones presented here andany further discussion on these other series is thus omitted.
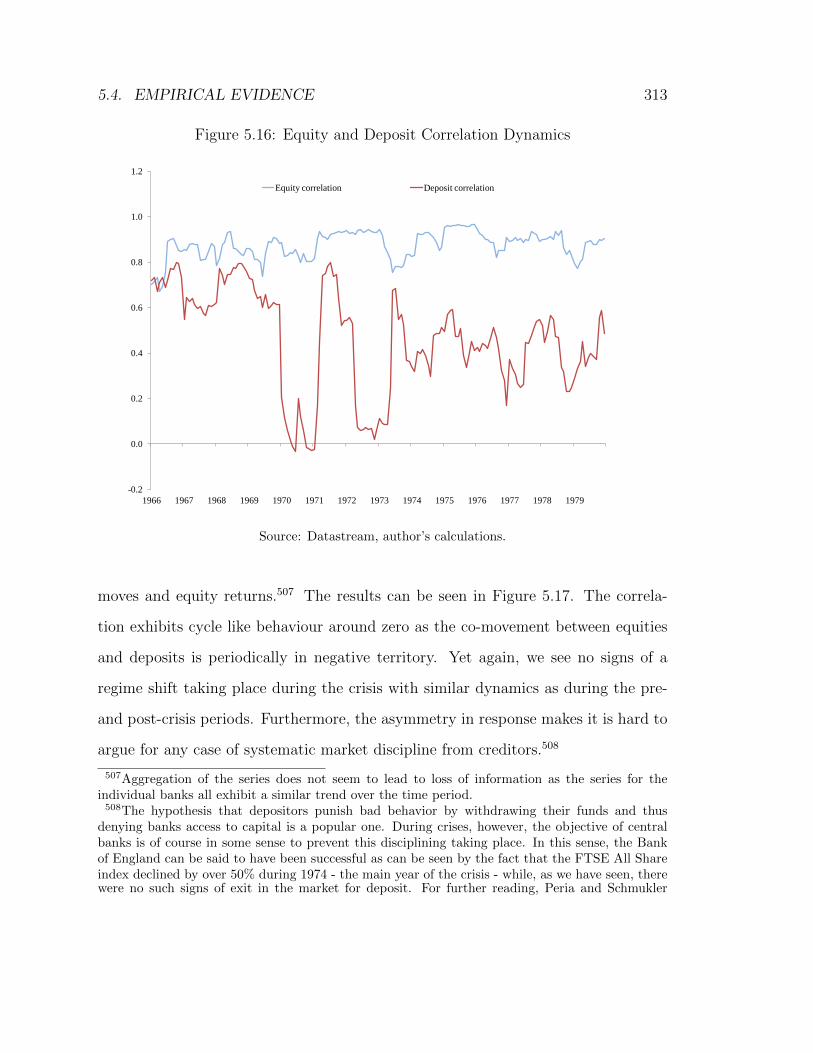
5.4. EMPIRICAL EVIDENCE 313
Figure 5.16: Equity and Deposit Correlation Dynamics
-0.2
0.0
0.2
0.4
0.6
0.8
1.0
1.2
1966 1967 1968 1969 1970 1971 1972 1973 1974 1975 1976 1977 1978 1979
Equity correlation Deposit correlation
Source: Datastream, author’s calculations.
moves and equity returns.507 The results can be seen in Figure 5.17. The correla-
tion exhibits cycle like behaviour around zero as the co-movement between equities
and deposits is periodically in negative territory. Yet again, we see no signs of a
regime shift taking place during the crisis with similar dynamics as during the pre-
and post-crisis periods. Furthermore, the asymmetry in response makes it is hard to
argue for any case of systematic market discipline from creditors.508
507Aggregation of the series does not seem to lead to loss of information as the series for theindividual banks all exhibit a similar trend over the time period.508The hypothesis that depositors punish bad behavior by withdrawing their funds and thus
denying banks access to capital is a popular one. During crises, however, the objective of centralbanks is of course in some sense to prevent this disciplining taking place. In this sense, the Bankof England can be said to have been successful as can be seen by the fact that the FTSE All Shareindex declined by over 50% during 1974 - the main year of the crisis - while, as we have seen, therewere no such signs of exit in the market for deposit. For further reading, Peria and Schmukler
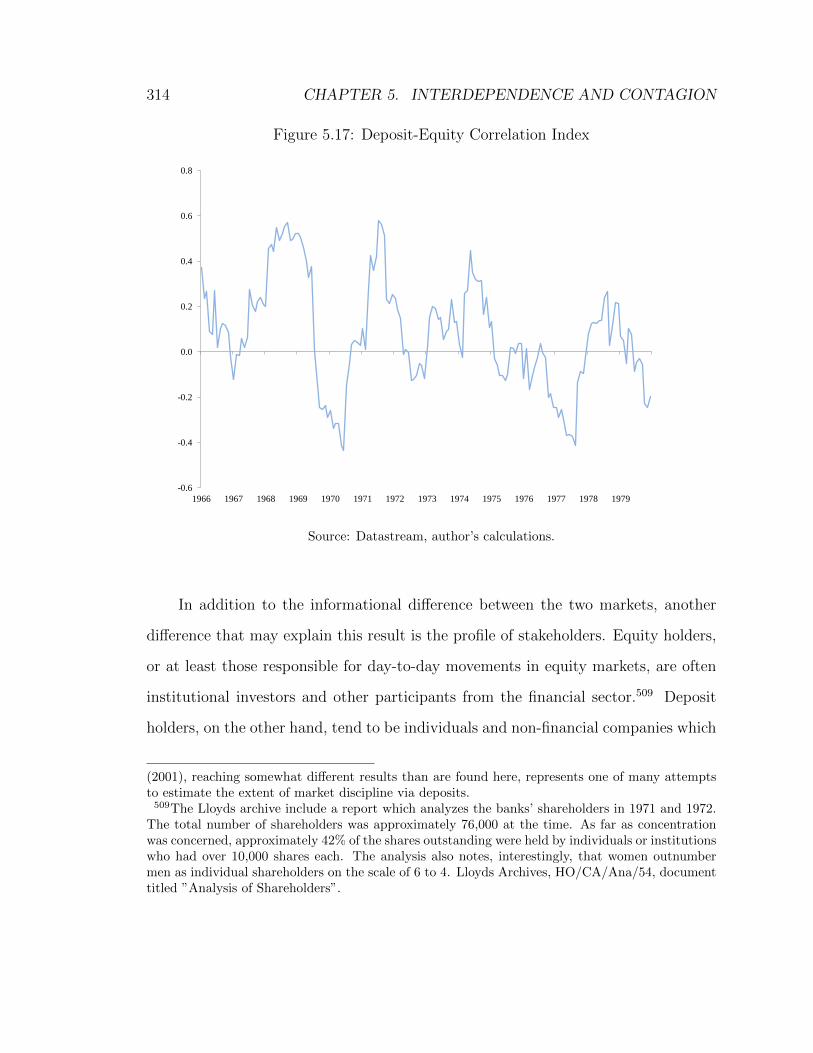
314 CHAPTER 5. INTERDEPENDENCE AND CONTAGION
Figure 5.17: Deposit-Equity Correlation Index
-0.6
-0.4
-0.2
0.0
0.2
0.4
0.6
0.8
1966 1967 1968 1969 1970 1971 1972 1973 1974 1975 1976 1977 1978 1979
Source: Datastream, author’s calculations.
In addition to the informational difference between the two markets, another
difference that may explain this result is the profile of stakeholders. Equity holders,
or at least those responsible for day-to-day movements in equity markets, are often
institutional investors and other participants from the financial sector.509 Deposit
holders, on the other hand, tend to be individuals and non-financial companies which
(2001), reaching somewhat different results than are found here, represents one of many attemptsto estimate the extent of market discipline via deposits.509The Lloyds archive include a report which analyzes the banks’ shareholders in 1971 and 1972.
The total number of shareholders was approximately 76,000 at the time. As far as concentrationwas concerned, approximately 42% of the shares outstanding were held by individuals or institutionswho had over 10,000 shares each. The analysis also notes, interestingly, that women outnumbermen as individual shareholders on the scale of 6 to 4. Lloyds Archives, HO/CA/Ana/54, documenttitled ”Analysis of Shareholders”.
5.5. THE INTERPLAY BETWEEN SECONDARY BANKS AND THE BIG FOUR315
may be less inclined to remove their funds during market volatility. This may explain
part of the reason for the difference in Figures 5.16 and 5.17.
From this subsection, we can conclude that there is no indication of heightened
equity market interdependence between banks during the crisis. Furthermore, the
level of interdependence is substantially greater amongst equity holders than deposit
holders. Finally, it does not seem to be the case that depositors behaved similarly
to equity holders - either in normal times or during the secondary crisis.
5.5 The Interplay between Secondary Banks and
the Big Four
How are the results from the previous section altered when data on the secondary
banks themselves is added? While there is little data available on the secondary
banks, and particularly high-level data such as that used in previous sections, in this
section we try to see whether there is evidence of any interconnectedness, or possible
contagion, between the secondary banks on the one hand and the Big Four on the
other. The data for the former comes in the form of monthly equity prices, obtained
from the Financial Times archives, for the period 1965 to 1975 while the latter is
from Datastream.
The banks in question are Bowmaker, Cedar Holdings, First National Finance
Corporation, Keyser Ullmann, Slater Walker and U.D.T.510 These banks were chosen
due to data availability and the fact that they were both prevalent in the secondary
banking scheme as well as in need of assistance during the crisis. We look at sim-
510Data for Bowmaker is only available up until June of 1969, when it was acquired by C.T.Bowring, while Cedar data starts in April of 1971.
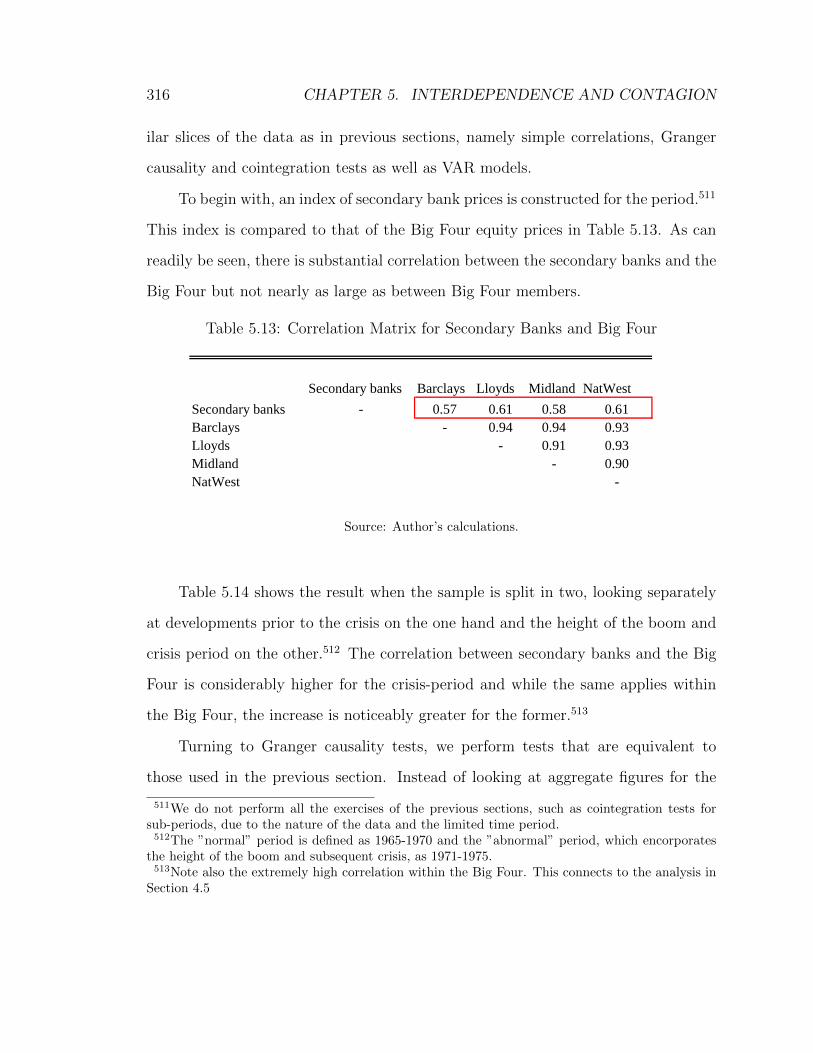
316 CHAPTER 5. INTERDEPENDENCE AND CONTAGION
ilar slices of the data as in previous sections, namely simple correlations, Granger
causality and cointegration tests as well as VAR models.
To begin with, an index of secondary bank prices is constructed for the period.511
This index is compared to that of the Big Four equity prices in Table 5.13. As can
readily be seen, there is substantial correlation between the secondary banks and the
Big Four but not nearly as large as between Big Four members.
Table 5.13: Correlation Matrix for Secondary Banks and Big Four
Secondary banks Barclays Lloyds Midland NatWest
Secondary banks - 0.57 0.61 0.58 0.61
Barclays - 0.94 0.94 0.93
Lloyds - 0.91 0.93
Midland - 0.90
NatWest -
Source: Author’s calculations.
Table 5.14 shows the result when the sample is split in two, looking separately
at developments prior to the crisis on the one hand and the height of the boom and
crisis period on the other.512 The correlation between secondary banks and the Big
Four is considerably higher for the crisis-period and while the same applies within
the Big Four, the increase is noticeably greater for the former.513
Turning to Granger causality tests, we perform tests that are equivalent to
those used in the previous section. Instead of looking at aggregate figures for the
511We do not perform all the exercises of the previous sections, such as cointegration tests forsub-periods, due to the nature of the data and the limited time period.512The ”normal” period is defined as 1965-1970 and the ”abnormal” period, which encorporates
the height of the boom and subsequent crisis, as 1971-1975.513Note also the extremely high correlation within the Big Four. This connects to the analysis in
Section 4.5
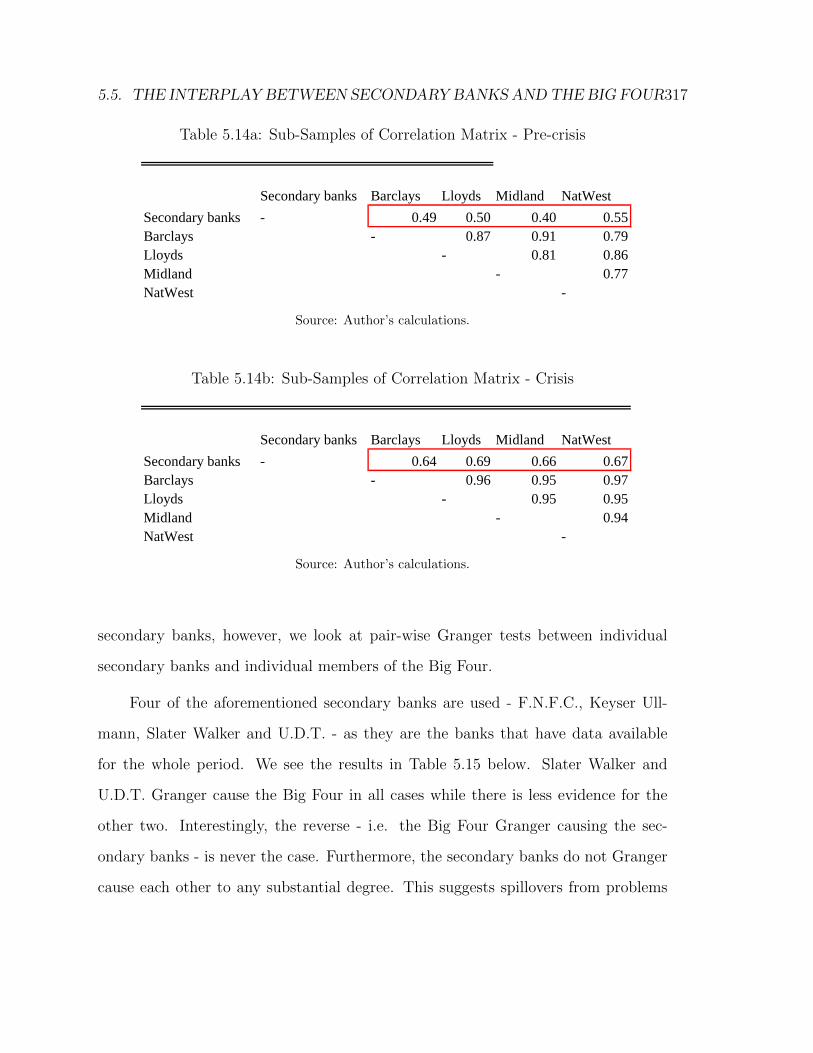
5.5. THE INTERPLAY BETWEEN SECONDARY BANKS AND THE BIG FOUR317
Table 5.14a: Sub-Samples of Correlation Matrix - Pre-crisis
Secondary banks Barclays Lloyds Midland NatWest
Secondary banks - 0.49 0.50 0.40 0.55
Barclays - 0.87 0.91 0.79
Lloyds - 0.81 0.86
Midland - 0.77
NatWest -
Source: Author’s calculations.
Table 5.14b: Sub-Samples of Correlation Matrix - Crisis
Secondary banks Barclays Lloyds Midland NatWest
Secondary banks - 0.64 0.69 0.66 0.67
Barclays - 0.96 0.95 0.97
Lloyds - 0.95 0.95
Midland - 0.94
NatWest -
Source: Author’s calculations.
secondary banks, however, we look at pair-wise Granger tests between individual
secondary banks and individual members of the Big Four.
Four of the aforementioned secondary banks are used - F.N.F.C., Keyser Ull-
mann, Slater Walker and U.D.T. - as they are the banks that have data available
for the whole period. We see the results in Table 5.15 below. Slater Walker and
U.D.T. Granger cause the Big Four in all cases while there is less evidence for the
other two. Interestingly, the reverse - i.e. the Big Four Granger causing the sec-
ondary banks - is never the case. Furthermore, the secondary banks do not Granger
cause each other to any substantial degree. This suggests spillovers from problems
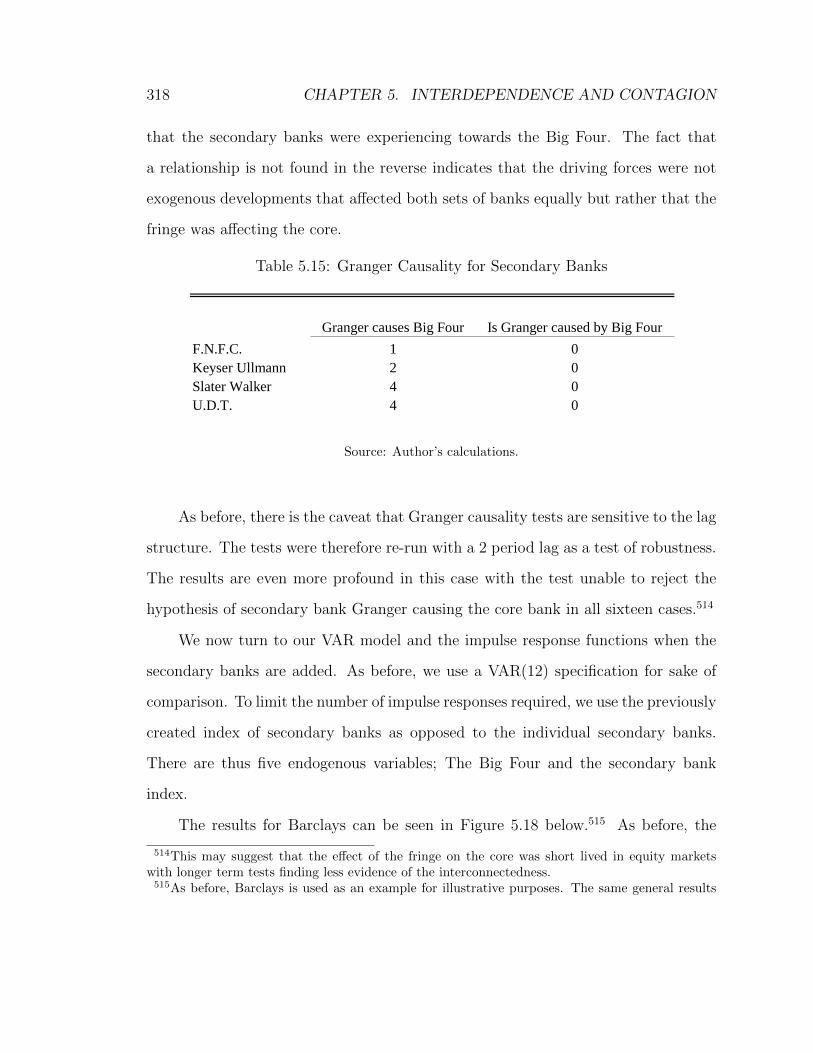
318 CHAPTER 5. INTERDEPENDENCE AND CONTAGION
that the secondary banks were experiencing towards the Big Four. The fact that
a relationship is not found in the reverse indicates that the driving forces were not
exogenous developments that affected both sets of banks equally but rather that the
fringe was affecting the core.
Table 5.15: Granger Causality for Secondary Banks
Granger causes Big Four Is Granger caused by Big Four
F.N.F.C. 1 0
Keyser Ullmann 2 0
Slater Walker 4 0
U.D.T. 4 0
Source: Author’s calculations.
As before, there is the caveat that Granger causality tests are sensitive to the lag
structure. The tests were therefore re-run with a 2 period lag as a test of robustness.
The results are even more profound in this case with the test unable to reject the
hypothesis of secondary bank Granger causing the core bank in all sixteen cases.514
We now turn to our VAR model and the impulse response functions when the
secondary banks are added. As before, we use a VAR(12) specification for sake of
comparison. To limit the number of impulse responses required, we use the previously
created index of secondary banks as opposed to the individual secondary banks.
There are thus five endogenous variables; The Big Four and the secondary bank
index.
The results for Barclays can be seen in Figure 5.18 below.515 As before, the
514This may suggest that the effect of the fringe on the core was short lived in equity marketswith longer term tests finding less evidence of the interconnectedness.515As before, Barclays is used as an example for illustrative purposes. The same general results
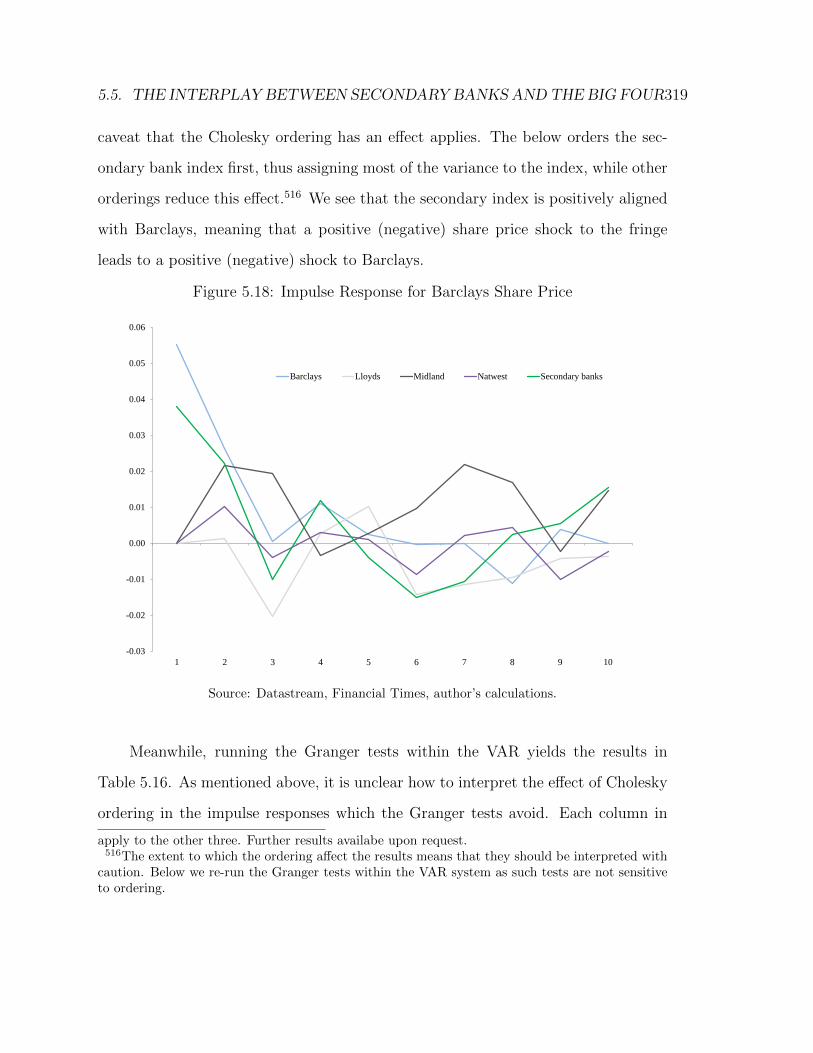
5.5. THE INTERPLAY BETWEEN SECONDARY BANKS AND THE BIG FOUR319
caveat that the Cholesky ordering has an effect applies. The below orders the sec-
ondary bank index first, thus assigning most of the variance to the index, while other
orderings reduce this effect.516 We see that the secondary index is positively aligned
with Barclays, meaning that a positive (negative) share price shock to the fringe
leads to a positive (negative) shock to Barclays.
Figure 5.18: Impulse Response for Barclays Share Price
-0.03
-0.02
-0.01
0.00
0.01
0.02
0.03
0.04
0.05
0.06
1 2 3 4 5 6 7 8 9 10
Barclays Lloyds Midland Natwest Secondary banks
Source: Datastream, Financial Times, author’s calculations.
Meanwhile, running the Granger tests within the VAR yields the results in
Table 5.16. As mentioned above, it is unclear how to interpret the effect of Cholesky
ordering in the impulse responses which the Granger tests avoid. Each column in
apply to the other three. Further results availabe upon request.516The extent to which the ordering affect the results means that they should be interpreted with
caution. Below we re-run the Granger tests within the VAR system as such tests are not sensitiveto ordering.
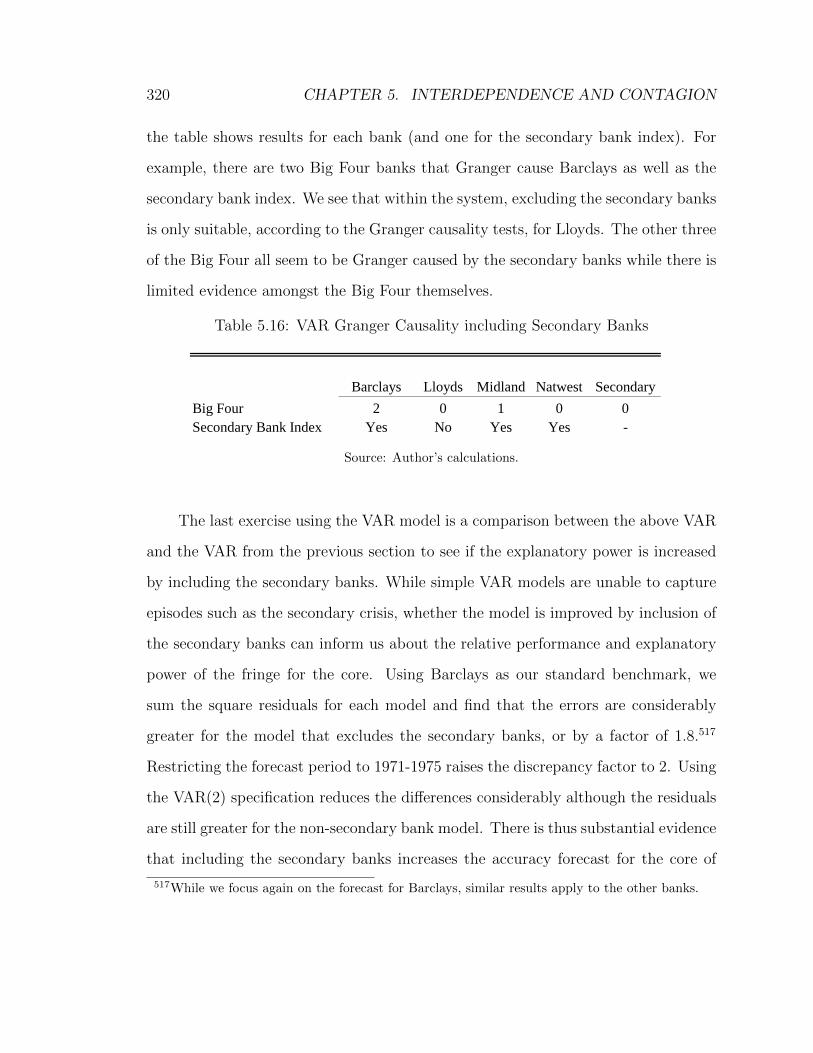
320 CHAPTER 5. INTERDEPENDENCE AND CONTAGION
the table shows results for each bank (and one for the secondary bank index). For
example, there are two Big Four banks that Granger cause Barclays as well as the
secondary bank index. We see that within the system, excluding the secondary banks
is only suitable, according to the Granger causality tests, for Lloyds. The other three
of the Big Four all seem to be Granger caused by the secondary banks while there is
limited evidence amongst the Big Four themselves.
Table 5.16: VAR Granger Causality including Secondary Banks
Barclays Lloyds Midland Natwest Secondary
Big Four 2 0 1 0 0
Secondary Bank Index Yes No Yes Yes -
Source: Author’s calculations.
The last exercise using the VAR model is a comparison between the above VAR
and the VAR from the previous section to see if the explanatory power is increased
by including the secondary banks. While simple VAR models are unable to capture
episodes such as the secondary crisis, whether the model is improved by inclusion of
the secondary banks can inform us about the relative performance and explanatory
power of the fringe for the core. Using Barclays as our standard benchmark, we
sum the square residuals for each model and find that the errors are considerably
greater for the model that excludes the secondary banks, or by a factor of 1.8.517
Restricting the forecast period to 1971-1975 raises the discrepancy factor to 2. Using
the VAR(2) specification reduces the differences considerably although the residuals
are still greater for the non-secondary bank model. There is thus substantial evidence
that including the secondary banks increases the accuracy forecast for the core of
517While we focus again on the forecast for Barclays, similar results apply to the other banks.
5.5. THE INTERPLAY BETWEEN SECONDARY BANKS AND THE BIG FOUR321
the system, supporting the evidence above.
Finally, we construct a simple Johansen cointegration model. This model differs
significantly to the previous cointegration exercises as it uses, by necessity, equity
data and only has data for approximately 10 years.518 The sample thus most closely
resembles the cointegration by decade section which found little evidence of cointe-
gration for the 1970s. The first cointegration test is a system-wide test for the Big
Four and the secondary bank index. This test indicates no cointegration relationship
using the trace test and one using the eigenvalue test. If the tests are re-run with the
secondary banks excluded, however, there is no cointegration found using either test.
As for pairwise tests, there is little evidence to be found either for the secondary
banks and the Big Four or within the Big Four with the latter resembling the results
for the 1970s in the previous section. It should be noted that the short sample and
the tumultuous period can pose problems for cointegration tests which are after all
intended to detect long-term relationships between non-stationary series.
All in all, the results of this section confirm the evidence from Section 2 on
both policymakers’ and banks’ concerns over the problems of the fringe. However,
the results also highlight the importance of the analysis in Section 4.5. Namely
that equity markets reacted very differently to credit markets, most notably that
of deposits. While the problems of the fringe were echoed by concerns of both the
management of the Big Four as well as their shareholders, Section 4.5 shows that
this was definitely not the case for the debtholders.
Due to the short period available for the secondary banks, which was partly due
to their short existance, and the fact that we only have equity price data means that
518Note that above we have used first differences while for the cointegration levels of the data areused, as required.
322 CHAPTER 5. INTERDEPENDENCE AND CONTAGION
a more thorough quantitative look at the relationship between the secondary banks
and the Big Four, such as high frequency developments of the balance sheets, is not
possible. The above results do, however, complement the analysis in other sections
and chapters. That is to say, the concerns that led to the Lifeboat, documented in
Section 2, as well as the discussion in Chapter 3 on the distinction between accepted
institutions that were deemed central to the system and those fringe institutions that
ultimately failed.
5.6 Conclusions
In this chapter, a closer look has been taken at the rationale for the rescue operations
performed during the secondary banking crisis. The Bank of England, in collabora-
tion with the clearers, decided that support to struggling institutions was required
due to the effect the crisis could have on small, unprotected depositors as well as the
possibility that the panic would spread to more healthy - or at least more important
- parts of the banking system.
The evidence provided in this chapter points to the fact that these support
operations were wholly successful in its primary goal: To safeguard the core of the
banking system from the difficulties faced by the second tier of the system. Using
data of a higher frequency than has been available thus far, we find no evidence of
either monthly deposit withdrawal for the core of the system or an increased fragility,
via interdependence or funding volatility, during the period. Two methods in the
chapter are used to analyze these issues: Historical evidence and empirical methods
using, firstly, the banks’ balance sheets and, secondly, equity data for the same banks
as well as selected secondary banks.
5.6. CONCLUSIONS 323
The historical evidence suggests that while the funds used for these rescue op-
erations were only very partially provided by the Bank of England, the group of
clearers considered the Bank’s stamp of approval and guarantee during the opera-
tions all important. This is in contrast to some previous studies, including Ackrill
and Hannah (2001), who concluded that the clearers took it upon themselves to
rescue the system and that they were self sufficient in doing so. Our evidence shows
that the clearers were adamant that the Bank of England provided assurances that
it would provide a ceiling for the clearers’ losses, and that the Bank would also pro-
vide the funds needed beyond some pre-defined maximum. The Lifeboat operations
can thus readily be seen less as a project undertaken by the clearers, with nominal
assistance from the Bank, but rather as an operation run by the Bank of England
with contribution from the clearers which were in turn largely underwritten by the
Bank.
Moving to the empirical study, no increase was found in co-movements of bank
funding during the crisis. In fact, there was a decrease in co-movement between banks
during the crisis period. This is confirmed by correlation analysis, VAR models and
cointegration tests. The reason for this detachment is unclear although we are able
to rule out the possibility that the substantial increase in inflation during the period
is to blame. The fact that the clearers’ deposits rose in 2/3 of the months during
the crisis while the secondary banks suffered large withdrawals suggests a ”flight
to safety” scenario. Whether this was due to underlying soundness of the clearers’
operations or due to their proximity to the Bank of England is unclear although the
evidence in Chapter 3 would support the latter hypothesis.
Another slice of the data that supports this latter hypothesis is the clear evidence
of a change in lending patterns in the late 1960s and early 1970s. This can be seen
324 CHAPTER 5. INTERDEPENDENCE AND CONTAGION
in the data on advances in Sections 3 and 4. The clearers can thus be seen to have
participated in the lending boom which accompanied the property bubble and easy
credit environment. However, while such lending practices were cited as a core reason
for the secondary bank’s subsequent demise, a similar jump in lending growth by the
clearers did not similarly lead to edginess amongst their creditors, as the data on
deposits and cash shows. Furthermore, the analysis in Section 5 shows an increase
in interdependence between the share prices of secondary banks and the Big Four
during the crisis. There also seems evidence that the travails of the former affected
the latter as far as share prices were concerned. The successful combating of this
trend goes back to the historical evidence and the successful erosion of a firewall
between the fringe and the core.
Finally, a wedge in behaviour between equity holders and deposit holders was
documented. There was a substantial sell-off in the shares of the Big Four during
the crisis with the average year-on-year decline reaching almost 70%. A similar
sell-off is nowhere to be seen in the data on deposits, however - not even on a
monthly basis. The correlation between the equity of banks is also much higher
and more persistent than that of deposit holders. Two possible explanations for
this difference were mentioned: Firstly, the availability of equity data leading to a
self-reinforcing feedback process in the shares of the banks, which is not the case for
deposits. Secondly, the fact that equity holders are often financial sector institutions
and employees whereas deposit holders are generally individuals and non-financial
companies that are less prone to react to the whims of markets.
The question remains however, that if interconnectedness was not present within
the core of the system, and there were no signs of depositor withdrawal, how was
contagion determined as a rationale to undertake drastic rescue operations of the
5.6. CONCLUSIONS 325
banking system? The historical evidence suggests that the build-up of interdepen-
dencies within the system was monitored on a casual basis. Liquidity dry-up was
seen as affecting an increasing amount of firms and it was believed by both the Bank
of England and the clearers that this domino effect would continue in the absence of
action. As noted above, this was successfully managed via the Lifeboat although the
secondary effects on the sector and the effect of the Bank’s proximity to the clearers
were neglected.
326 CHAPTER 5. INTERDEPENDENCE AND CONTAGION
Appendices
5.A Data Corrections
In this appendix the limitations of the main data series are detailed and how they
were overcome. In some cases these were in the form of missing data for individual
months and sometimes a re-classification of the data led to very large one-off jumps.
When such re-classification seemed to be the case, the general rule used was to
extrapolate historical growth to that single observation and then proceed with growth
rates as before. This thus entails shifting the level of the series following the jump
but sticking with the same growth developments as before. As levels of the series
are not interpreted at any point in time, this method does not present any obvious
additional problems.
Figure 5.19 exhibits an example of this level shift. The series depicted is ad-
vances for Midland from 1970 to the end of the sample, December 1979. The ad-
justment made, described below, is a jump that takes place in January 1973 where
there is a large downwards jump in advances for all banks. For Midland, the original
number would suggest a 22% drop in the level of advances between months but using
the trailing 5-year average for January changes, which comes to 2.1%, results in the
adjusted series in Figure 5.19. As noted above, the same dynamics of each series are
kept at each time but adjustments are made for the large jumps as described below
in each case.
In isolated cases, there was a large jump in single series but not across the board.
This was only the case for the shorter series which are used much less in the empirical
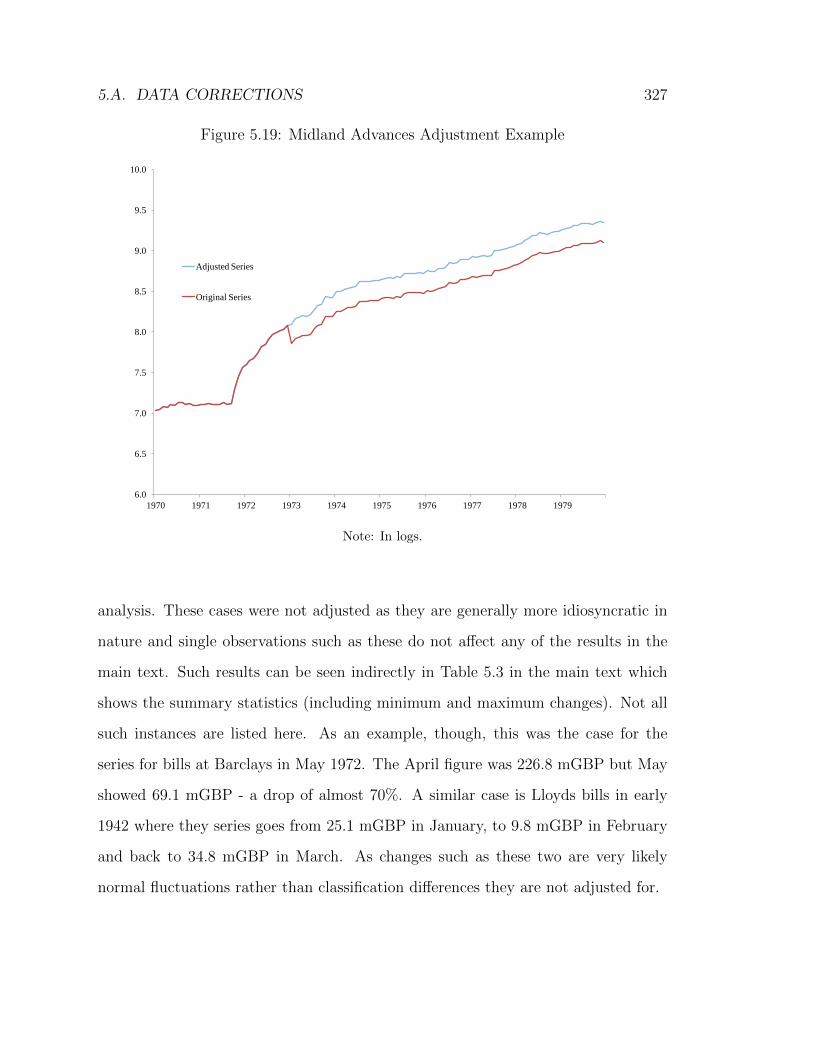
5.A. DATA CORRECTIONS 327
Figure 5.19: Midland Advances Adjustment Example
6.0
6.5
7.0
7.5
8.0
8.5
9.0
9.5
10.0
1970 1971 1972 1973 1974 1975 1976 1977 1978 1979
Adjusted Series
Original Series
Note: In logs.
analysis. These cases were not adjusted as they are generally more idiosyncratic in
nature and single observations such as these do not affect any of the results in the
main text. Such results can be seen indirectly in Table 5.3 in the main text which
shows the summary statistics (including minimum and maximum changes). Not all
such instances are listed here. As an example, though, this was the case for the
series for bills at Barclays in May 1972. The April figure was 226.8 mGBP but May
showed 69.1 mGBP - a drop of almost 70%. A similar case is Lloyds bills in early
1942 where they series goes from 25.1 mGBP in January, to 9.8 mGBP in February
and back to 34.8 mGBP in March. As changes such as these two are very likely
normal fluctuations rather than classification differences they are not adjusted for.
328 CHAPTER 5. INTERDEPENDENCE AND CONTAGION
Data for the categories ”Bills” and ”Investments” started in 1939. Data for
”Other assets” and ”Eligible Liabilities” started in 1973. The other three categories
- deposits, cash and advances - are available for the whole period, excluding the
omissions mentioned above. Below each case of what was determined as data incom-
pleteness is listed as well as what was done to adjust it.
No data was available for January 1971. Mid-point between December 1970 and
February 1971 used.
No data was available for January 1972. Mid-point between December 1971 and
February 1972 used.
The category ”Other Assets” was missing for May 1975. Mid-point between
April and June used.
Only Midland figures available for January and February 1970. Linear growth
extrapolated between the figures available for other banks.
When using the whole time period, the cash series is adjusted to account for
the change in classification starting in 1973. The series that was before the change
called ”Cash”, exhibits a large one-time rise when it changes to ”Cash and call”. To
negate this, the post-change series is normalized towards the pre-change series.
The average month-on-month change in the five previous January figures was
taken and extrapolated to January 1973 due to the reclassification. Following that,
the month-on-month change in the series is used, as opposed to the level of the series
to preserve the trend while keeping the levels at the normalized level. This method
is chosen to adjust the January 1973 figure, as opposed to for example using the
12 month average month-on-month change, due to the seasonality results described
earlier.
The same procedure was applied for advances in June 1975. Again the average
5.B. TIME SERIES METHODS AND RESULTS 329
for the five previous figures for the month (June) is used. The original figures resulted
in a 20-30% drop in advances for each bank in a single month. The smoothed series
assumes historical growth in this one month.
5.B Time Series Methods and Results
This Appendix presents a rough outline of the time-series methodology from Section
4.3 as well as the full results of the impulse responses and Granger causality tests.
The methodology discussion is very brief and follows that of Greene (2008) and Tsay
(2005) in emphasis and notation.
Granger Causality
Granger causality is in a sense analogous to exogeneity conditions and is determined
by using F-tests to test for explanatory power. To see if x is Granger caused by y,
we start by determining the lag length of a univariate AR model,
yt = α + β1yt−1 + β2yt−2 + ...+ βnyt−n + εt
We then perform the same regression except we now include lagged values of x
yt = δ + γ1yt−1 + ...+ γmyt−m + θpxt−p + ...+ θqxt−q + ζt
where significant lags of x are included. The null hypothesis of no Granger causality
from x to y is rejected if these lagged values of x are retained according to F-tests.
For further details, see Granger (1969).
VAR model
The VAR models used in Section 4.3 are of a standard nature. Bayesian VAR models
were also tested but provided neither superior or vastly different results.
330 CHAPTER 5. INTERDEPENDENCE AND CONTAGION
The general VAR(p) specification, with k variables and p lags, can be defined
as
xt = θ0 + θ1xt−1 + θ2xt−2 + ...+ θpxt−p + εt, p > 0
Where xt is a multivariate time series, θ0 is a k-dimensional vector, θ1, ..., θp are k
x k matrices and εt is a serially uncorrelated random vector with mean zero and a
positive-definite covariance matrix.
This can also be written in compact form as
θ(L)xt = θ0 + εt
Where L is the lag operator and θ(L) = I − θ1B− ...− θpBp is a matrix polynomial.
The impulse responses then follow as functions of past error terms where Cholesky
decompositions are used for transformation to remove correlation.For further details,
see the seminal Sims (1980) which represents an intuitive and early adoption of VAR
models.
Cointegration
The intution between cointegration tests is to check for linear relationships between
non-stationary variables which result in a stationarity process. If such a stationary
relationship is found then the variables in question are said to be cointegrated. The
Johansen approach to cointegration is used, as opposed to the original Engle-Granger,
as the former facilitates better treatment of short- and long-term effects as well as
allowing for more than one cointegrating relationship.
The Johansen approach consists of formulating the VAR(p) with k variables,
and testing the rank of the parameter of lagged values. For this, a trace test statistic
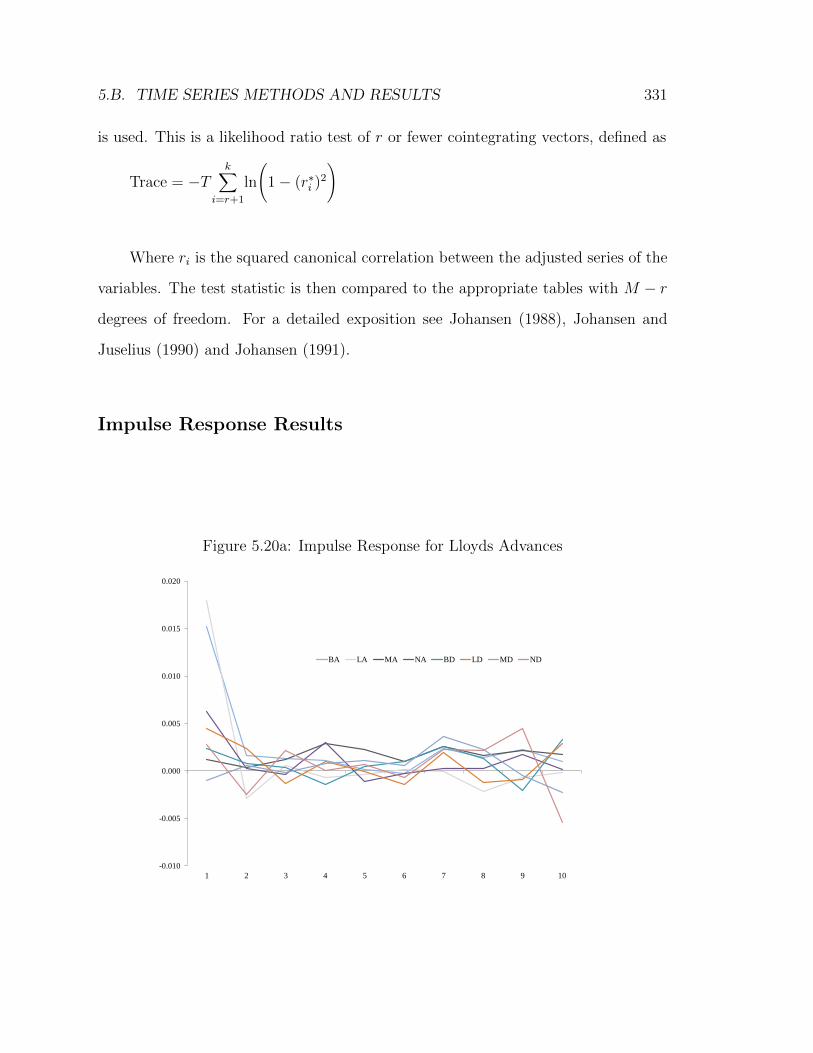
5.B. TIME SERIES METHODS AND RESULTS 331
is used. This is a likelihood ratio test of r or fewer cointegrating vectors, defined as
Trace = −Tk∑
i=r+1
ln
(1− (r∗i )
2
)
Where ri is the squared canonical correlation between the adjusted series of the
variables. The test statistic is then compared to the appropriate tables with M − r
degrees of freedom. For a detailed exposition see Johansen (1988), Johansen and
Juselius (1990) and Johansen (1991).
Impulse Response Results
Figure 5.20a: Impulse Response for Lloyds Advances
-0.010
-0.005
0.000
0.005
0.010
0.015
0.020
1 2 3 4 5 6 7 8 9 10
BA LA MA NA BD LD MD ND
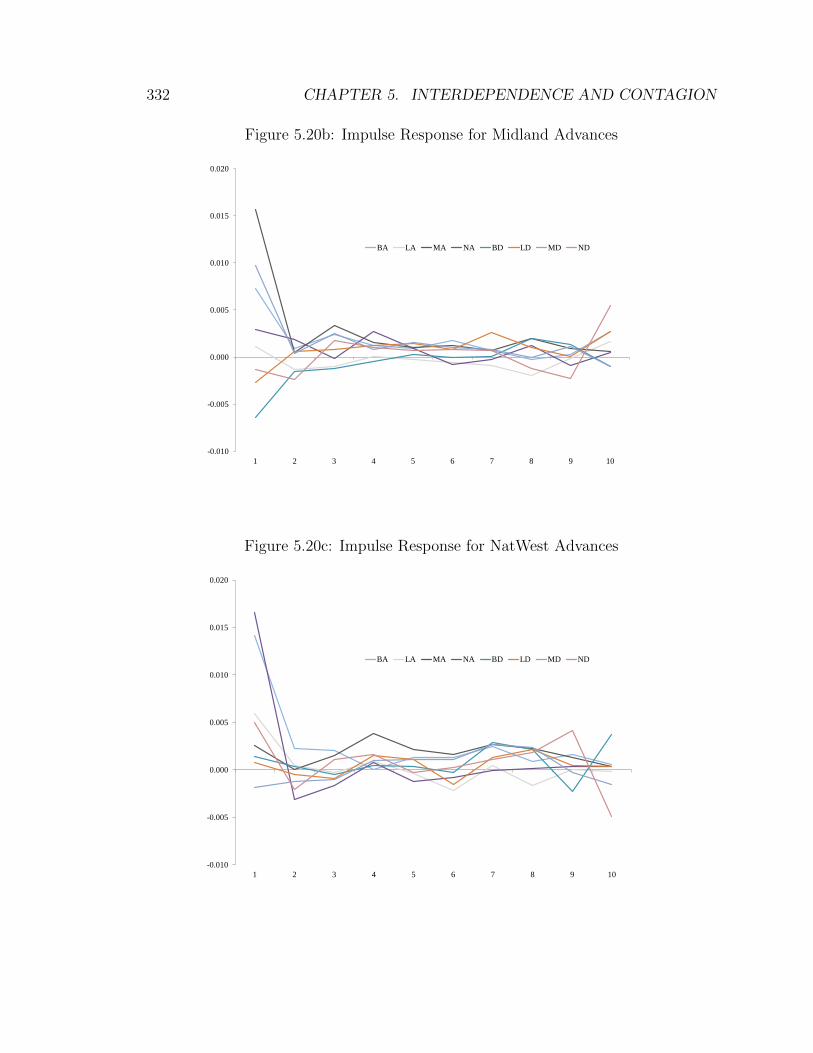
332 CHAPTER 5. INTERDEPENDENCE AND CONTAGION
Figure 5.20b: Impulse Response for Midland Advances
-0.010
-0.005
0.000
0.005
0.010
0.015
0.020
1 2 3 4 5 6 7 8 9 10
BA LA MA NA BD LD MD ND
Figure 5.20c: Impulse Response for NatWest Advances
-0.010
-0.005
0.000
0.005
0.010
0.015
0.020
1 2 3 4 5 6 7 8 9 10
BA LA MA NA BD LD MD ND
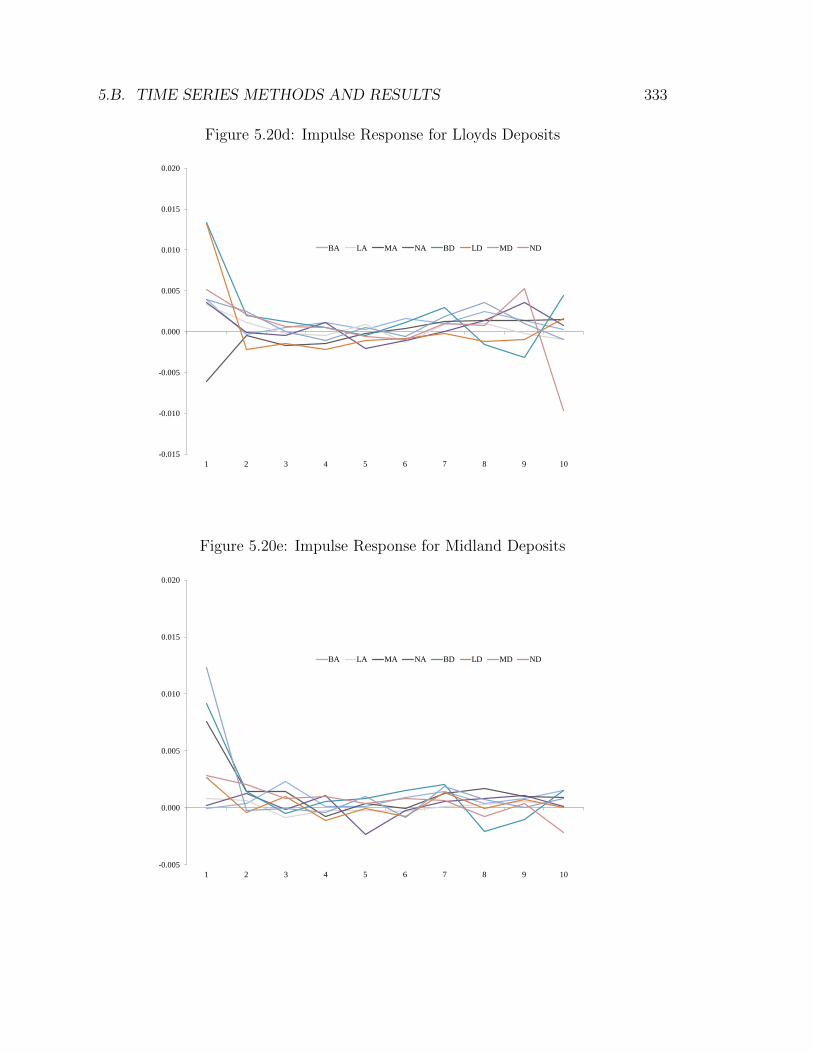
5.B. TIME SERIES METHODS AND RESULTS 333
Figure 5.20d: Impulse Response for Lloyds Deposits
-0.015
-0.010
-0.005
0.000
0.005
0.010
0.015
0.020
1 2 3 4 5 6 7 8 9 10
BA LA MA NA BD LD MD ND
Figure 5.20e: Impulse Response for Midland Deposits
-0.005
0.000
0.005
0.010
0.015
0.020
1 2 3 4 5 6 7 8 9 10
BA LA MA NA BD LD MD ND
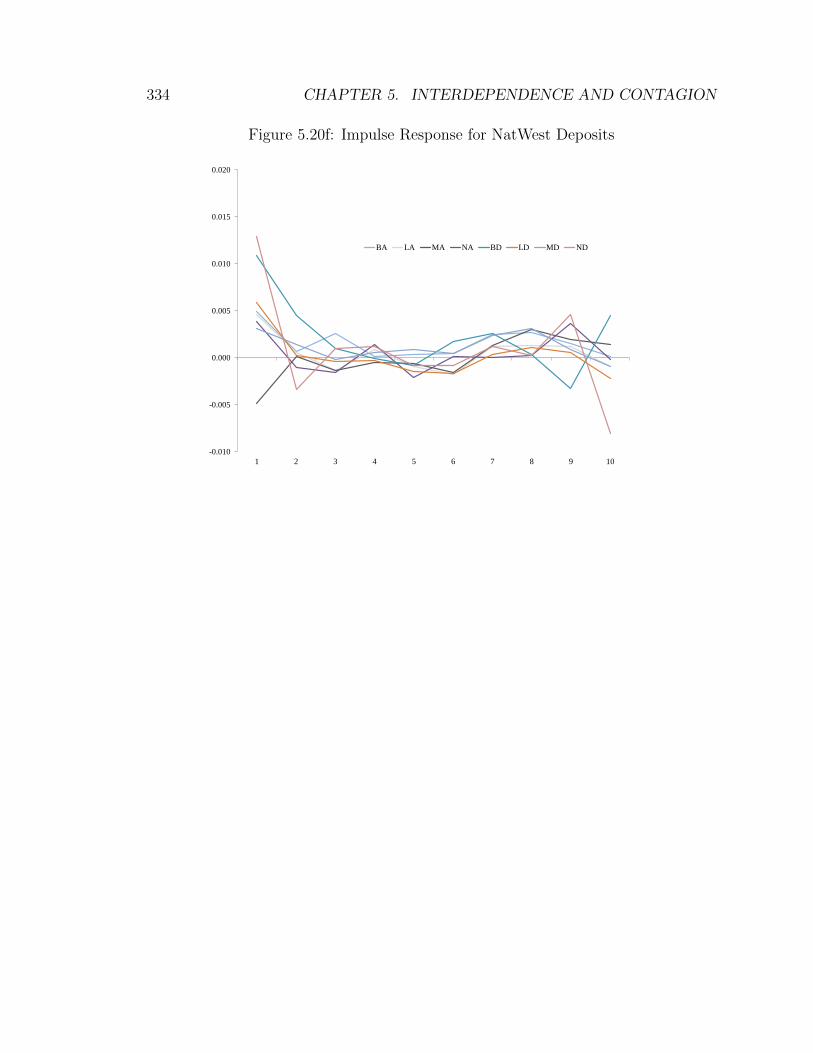
334 CHAPTER 5. INTERDEPENDENCE AND CONTAGION
Figure 5.20f: Impulse Response for NatWest Deposits
-0.010
-0.005
0.000
0.005
0.010
0.015
0.020
1 2 3 4 5 6 7 8 9 10
BA LA MA NA BD LD MD ND
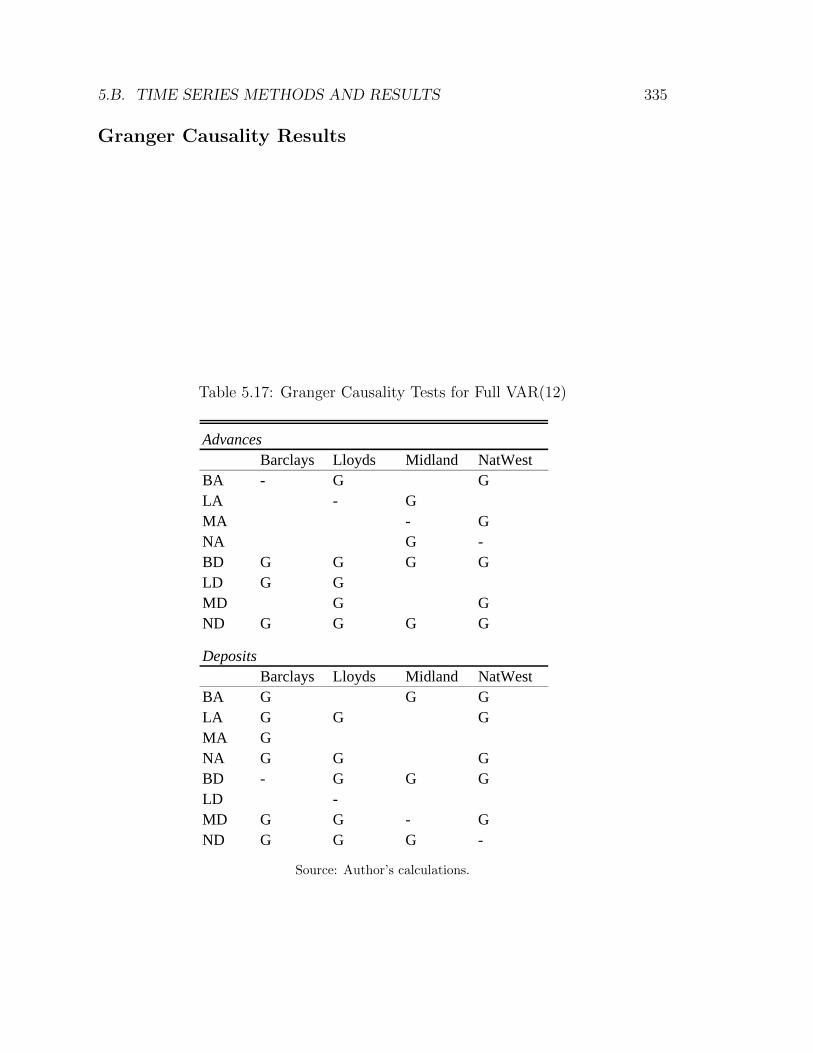
5.B. TIME SERIES METHODS AND RESULTS 335
Granger Causality Results
Table 5.17: Granger Causality Tests for Full VAR(12)
Advances
Barclays Lloyds Midland NatWest
BA - G G
LA - G
MA - G
NA G -
BD G G G G
LD G G
MD G G
ND G G G G
Deposits
Barclays Lloyds Midland NatWest
BA G G G
LA G G G
MA G
NA G G G
BD - G G G
LD -
MD G G - G
ND G G G -
Source: Author’s calculations.
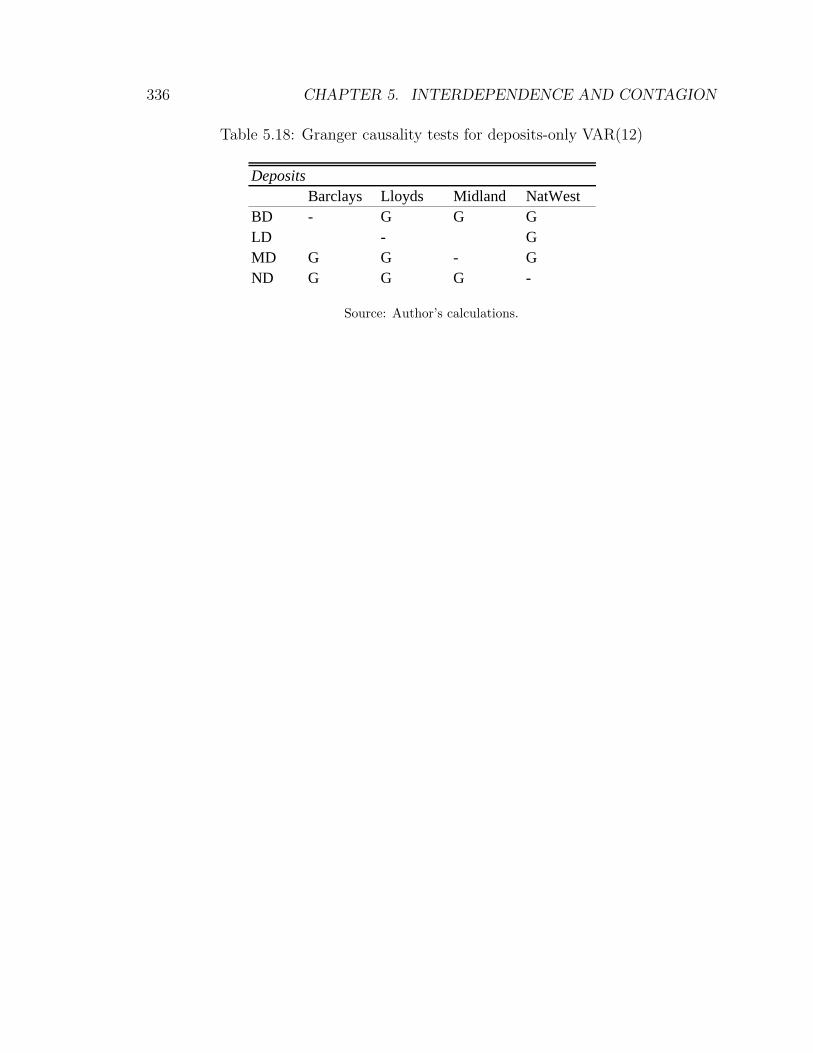
336 CHAPTER 5. INTERDEPENDENCE AND CONTAGION
Table 5.18: Granger causality tests for deposits-only VAR(12)
Deposits
Barclays Lloyds Midland NatWest
BD - G G G
LD - G
MD G G - G
ND G G G -
Source: Author’s calculations.
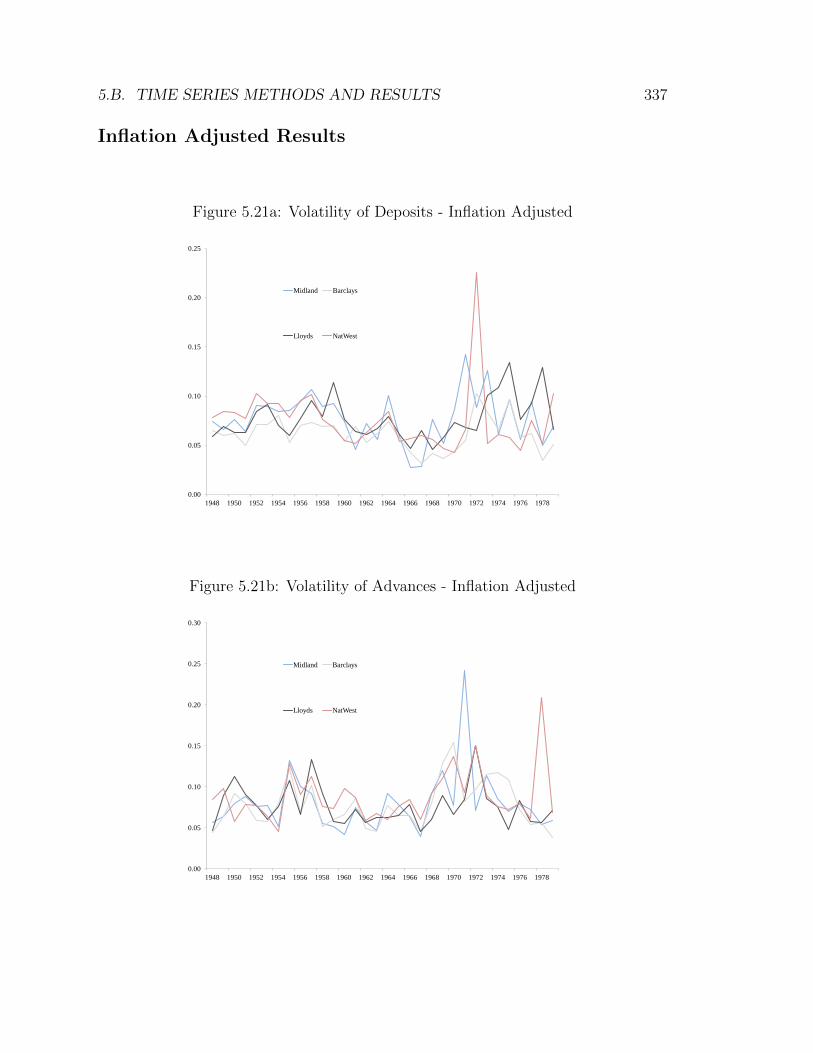
5.B. TIME SERIES METHODS AND RESULTS 337
Inflation Adjusted Results
Figure 5.21a: Volatility of Deposits - Inflation Adjusted
0.00
0.05
0.10
0.15
0.20
0.25
1948 1950 1952 1954 1956 1958 1960 1962 1964 1966 1968 1970 1972 1974 1976 1978
Midland Barclays
Lloyds NatWest
Figure 5.21b: Volatility of Advances - Inflation Adjusted
0.00
0.05
0.10
0.15
0.20
0.25
0.30
1948 1950 1952 1954 1956 1958 1960 1962 1964 1966 1968 1970 1972 1974 1976 1978
Midland Barclays
Lloyds NatWest
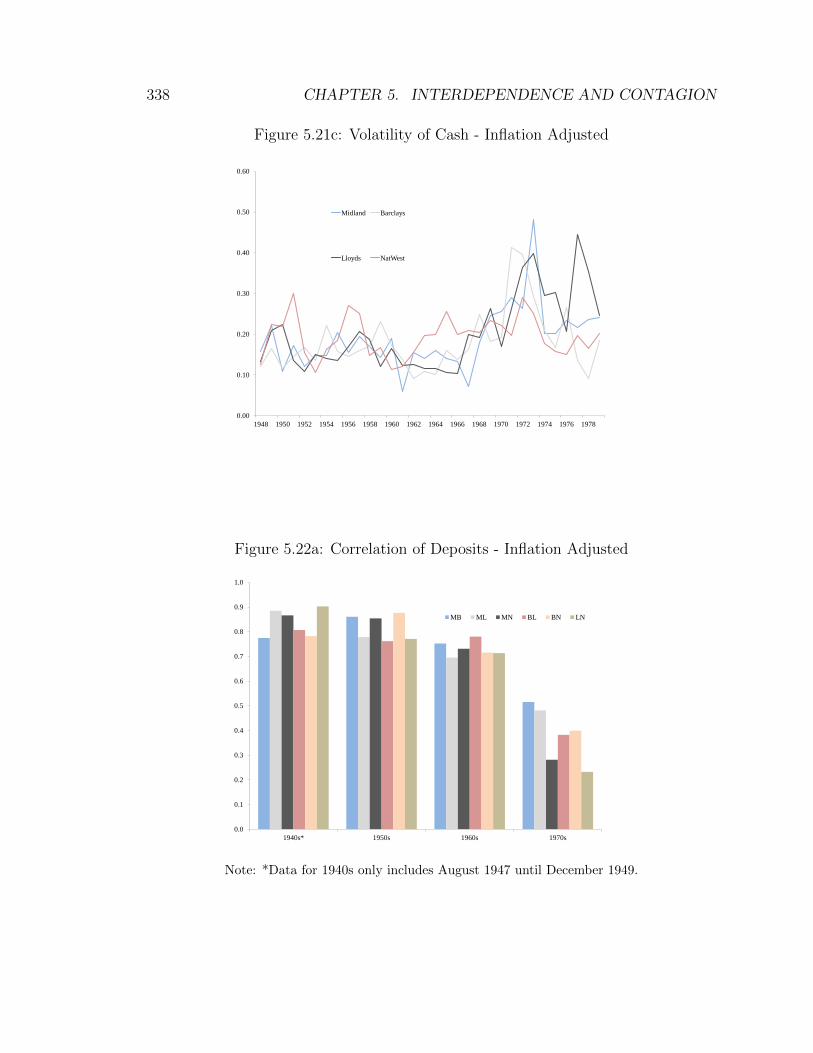
338 CHAPTER 5. INTERDEPENDENCE AND CONTAGION
Figure 5.21c: Volatility of Cash - Inflation Adjusted
0.00
0.10
0.20
0.30
0.40
0.50
0.60
1948 1950 1952 1954 1956 1958 1960 1962 1964 1966 1968 1970 1972 1974 1976 1978
Midland Barclays
Lloyds NatWest
Figure 5.22a: Correlation of Deposits - Inflation Adjusted
0.0
0.1
0.2
0.3
0.4
0.5
0.6
0.7
0.8
0.9
1.0
1940s* 1950s 1960s 1970s
MB ML MN BL BN LN
Note: *Data for 1940s only includes August 1947 until December 1949.
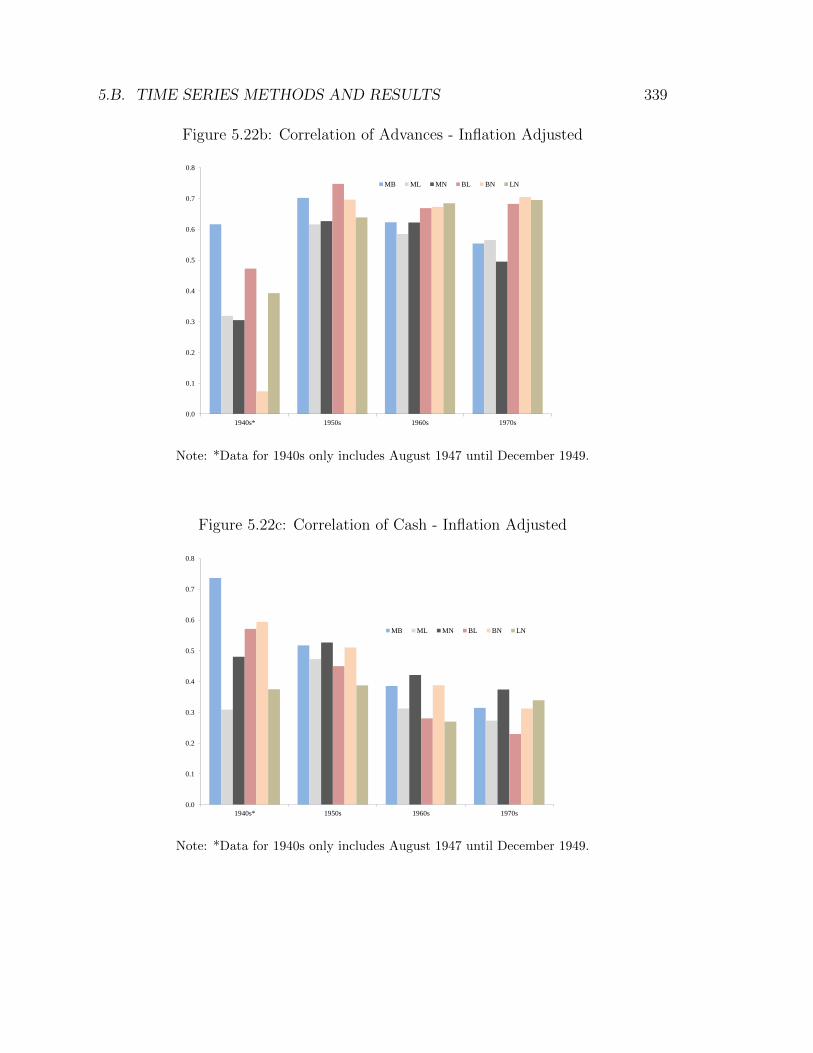
5.B. TIME SERIES METHODS AND RESULTS 339
Figure 5.22b: Correlation of Advances - Inflation Adjusted
0.0
0.1
0.2
0.3
0.4
0.5
0.6
0.7
0.8
1940s* 1950s 1960s 1970s
MB ML MN BL BN LN
Note: *Data for 1940s only includes August 1947 until December 1949.
Figure 5.22c: Correlation of Cash - Inflation Adjusted
0.0
0.1
0.2
0.3
0.4
0.5
0.6
0.7
0.8
1940s* 1950s 1960s 1970s
MB ML MN BL BN LN
Note: *Data for 1940s only includes August 1947 until December 1949.
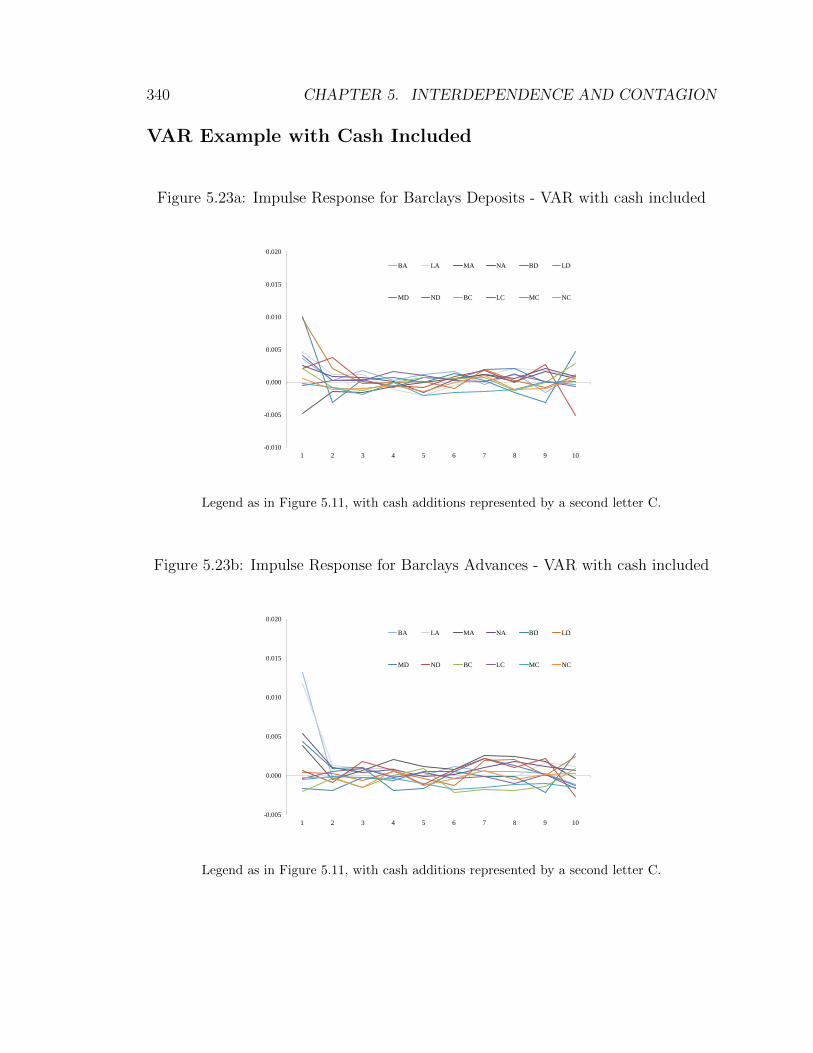
340 CHAPTER 5. INTERDEPENDENCE AND CONTAGION
VAR Example with Cash Included
Figure 5.23a: Impulse Response for Barclays Deposits - VAR with cash included
-0.010
-0.005
0.000
0.005
0.010
0.015
0.020
1 2 3 4 5 6 7 8 9 10
BA LA MA NA BD LD
MD ND BC LC MC NC
Legend as in Figure 5.11, with cash additions represented by a second letter C.
Figure 5.23b: Impulse Response for Barclays Advances - VAR with cash included
-0.005
0.000
0.005
0.010
0.015
0.020
1 2 3 4 5 6 7 8 9 10
BA LA MA NA BD LD
MD ND BC LC MC NC
Legend as in Figure 5.11, with cash additions represented by a second letter C.
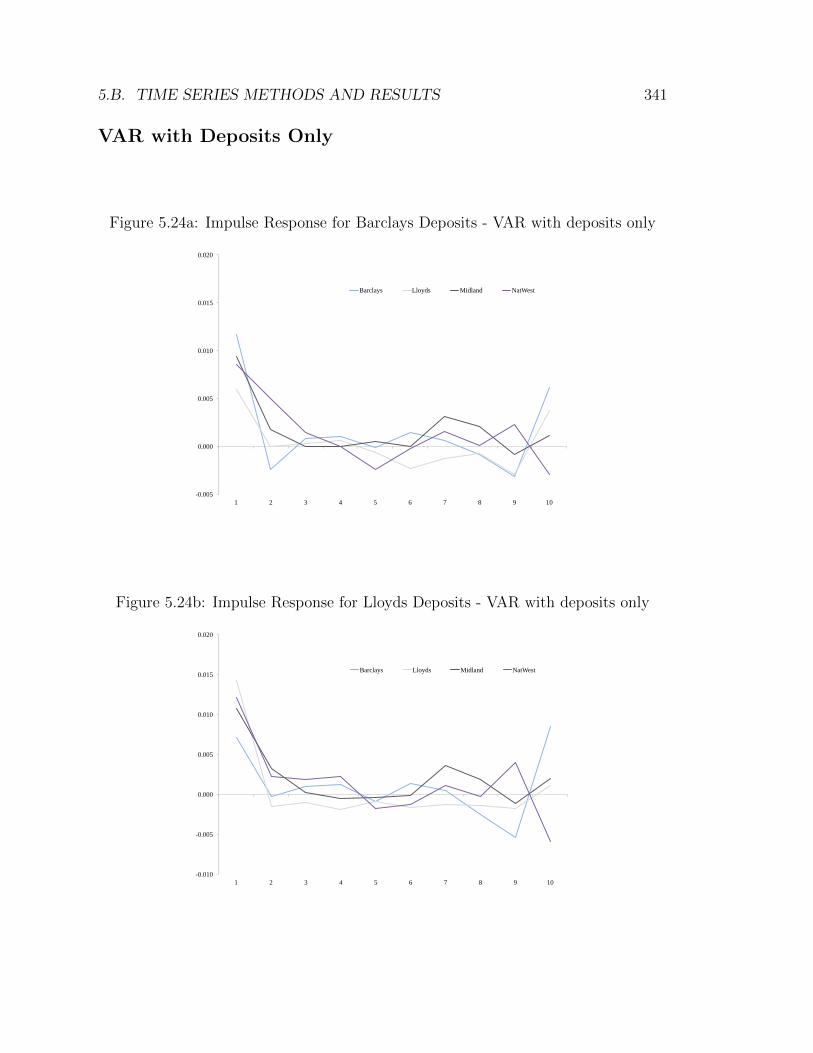
5.B. TIME SERIES METHODS AND RESULTS 341
VAR with Deposits Only
Figure 5.24a: Impulse Response for Barclays Deposits - VAR with deposits only
-0.005
0.000
0.005
0.010
0.015
0.020
1 2 3 4 5 6 7 8 9 10
Barclays Lloyds Midland NatWest
Figure 5.24b: Impulse Response for Lloyds Deposits - VAR with deposits only
-0.010
-0.005
0.000
0.005
0.010
0.015
0.020
1 2 3 4 5 6 7 8 9 10
Barclays Lloyds Midland NatWest
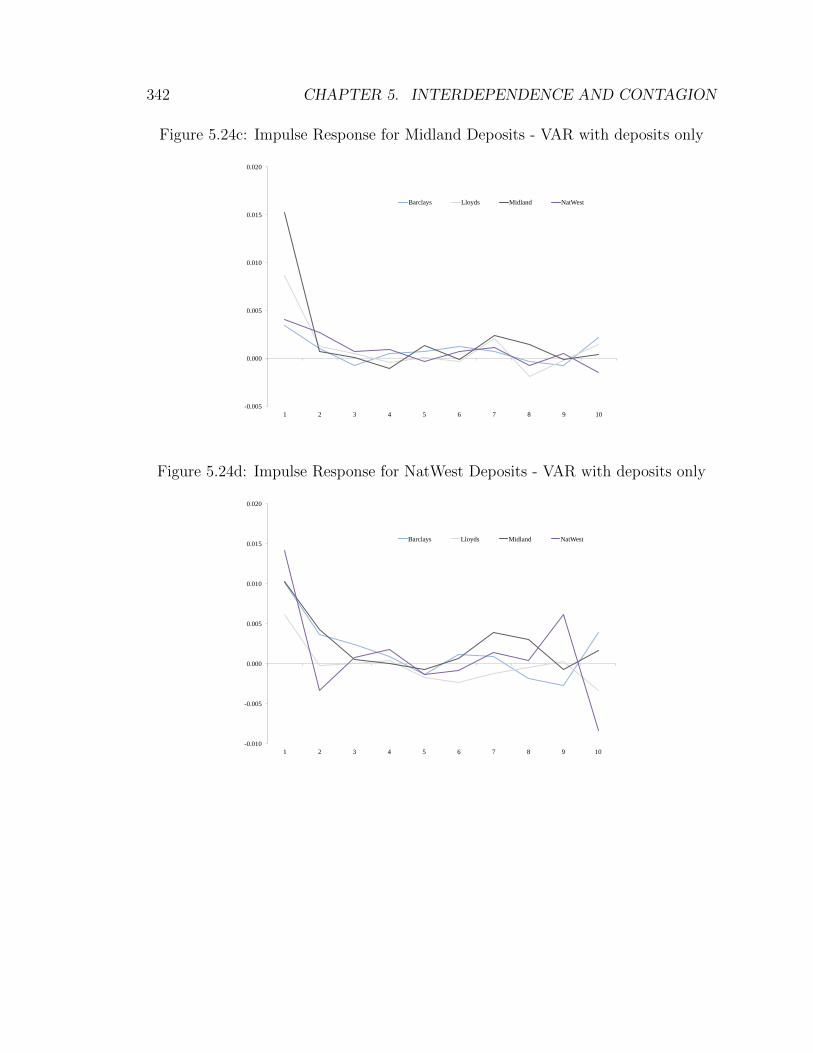
342 CHAPTER 5. INTERDEPENDENCE AND CONTAGION
Figure 5.24c: Impulse Response for Midland Deposits - VAR with deposits only
-0.005
0.000
0.005
0.010
0.015
0.020
1 2 3 4 5 6 7 8 9 10
Barclays Lloyds Midland NatWest
Figure 5.24d: Impulse Response for NatWest Deposits - VAR with deposits only
-0.010
-0.005
0.000
0.005
0.010
0.015
0.020
1 2 3 4 5 6 7 8 9 10
Barclays Lloyds Midland NatWest
Chapter 6
Conclusions
The aim of this thesis has been to shed light on the role, implementation and effect
of the financial crisis management measures performed by central banks. This has
been done through the lens of British banking in the 1970s which signified the return
to financial volatility, culminating in the so-called secondary banking crisis during
the middle of the decade. Before synthesizing the findings and drawing conclusions,
the results from each chapter are briefly summarized. Each chapter is also put in
the context of the three aforementioned properties regarding the crisis management
role - its role, implementation and effect - so as to facilitate better consolidation of
individual chapters.
6.1 Chapter Summaries
6.1.1 Chapter 4 - Simplistic Approaches to Regulation
In a break from the traditional approach taken in the literature, when dealing with
the implementation of the crisis management policies the emphasis was not primarily
343
344 CHAPTER 6. CONCLUSIONS
on possible early crisis indicators or first-best policies. Instead, I have tried to an-
swer the following question: Given the Bank of England’s revealed goal of shielding
depositors from losses, how different would its behaviour had to have been prior to
the crisis if it were also to shield itself from losses stemming from the crisis? That
is to say, how could it achieve its goal of protecting depositors without it involving
a risk transfer from private to public parties.
One objection to this approach might be that shielding depositor is not, or
should not be, the goal of central banks. Whether this goal should be pursued is
a valid question but the historical experience - not just of the secondary crisis but
also more generally in most recent banking crises - shows that this goal has in fact
often been pursued to a great extent by central banks. Furthermore, the extent of
protection of depositors is also to some extent unavoidably a political question and
the desirability of this goal was therefore taken as a given. Instead I looked at how
it could be achieved without risk transferring performed under severe time pressure
during a crisis.
To tackle this issue, the Bank of England’s actions and thinking were docu-
mented both before and during the secondary crisis in perhaps greater detail than
is required to gain an understanding of the dynamics of the story. The reason for
taking this granular approach, however, was to understand how the Bank slowly
came to realize that private risks taken by private institutions and individuals had
morphed into what was decided had to be public risks to be underwritten by the
Bank. I then tried to answer the question of what the Bank would have to have done
differently for Slater Walker’s liabilities to be both safe and not guaranteed by the
Bank of England itself.
A key result from Chapter 4 was that the extent to which the framework that
6.1. CHAPTER SUMMARIES 345
central banks operate under is discretionary cannot be overestimated. To paraphrase
this slightly, despite its best intentions, the things a central bank says during non-
crisis times can be vastly different to what a central bank does during a crisis.
Therefore, while policymakers may in normal times lay out honest intentions of
allowing market forces to allocate capital to those banks that can make best use
of it, it is not until a crisis breaks that it becomes clear what the true response to
instability is.
The details of the rescue of Slater Walker, laid out in Chapter 4, show the
extraordinary lengths that the Bank of England went to in order to prevent depositors
from experiencing losses during the crisis. If this actual crisis-contingent policy
would have been communicated before the crisis, it would have amounted to the
Bank publicly stating that depositors need not worry about certain risks as the
Bank itself would guarantee their deposits. Such an announcement was of course
completely unacceptable to the Bank and didn’t even occur to it but given the
rescue operations later undertaken, it would have been the logically consistent policy
communication.519
As for what the Bank would have needed to do differently, I documented in detail
how minutely the Bank was forced to manage Slater Walker’s balance sheet after
having assumed responsibility for it. Only after Slater’s collapse did the Bank realize
the practical complexities involved with running a commercial banking operation,
such as managing a diverse loan book and dealing with maturity transformation
on a daily basis. Upon taking responsibility for the operations, the Bank realized
quickly that it knew very little about what the firm had been doing prior to the crisis
519How unnacceptable such a statement was can for example be seen in Chapter 3 where the Bankresponds to similar requests by the clearers in a very decisive manner.
346 CHAPTER 6. CONCLUSIONS
and how solid - or not - its operations were.
In what little monitoring the Bank had performed of firms such as Slater Walker
prior to the crisis, it had relied exclusively on a handful of ratios to evaluate the
strength of these firms. To the extent that the Bank realized that this was not
sufficient to gain a deep understanding of the firm’s strength, it rationalized this lack
of understanding by the fact that this was a private firm with private creditors. The
crisis demolished this argument.
It was concluded in the chapter that in order to prevent excessive risk taking,
which was ultimately to become public risk, the Bank would have needed to have
as deep an understanding of the day-to-day operations as it was later to gain once
the balance sheet had been taken over by the Bank. Additionally, it would have
needed to be willing and able to limit these risks as they mounted. Such interference
was unprecedented and it is very questionable whether the Bank would ever have
sought, or gotten permission for, such measures. While such a granular analysis of the
accounts, and subsequent actions, can be considered drastic for a public institution
to undertake, it is unavoidable if said institution is adamant that the credit risk of
the liabilities of banks such as Slater Walker be minimized, if not eliminated, during
a crisis.
6.1.2 Chapter 3 - Subsidies and Stability
When looking at the effect of the crisis management policies, the traditional approach
of measuring cumulative macroeconomic effects due to the crisis, such as output losses
and employment figures, has not been taken in this thesis. Instead, the goal has been
to measure whether the Bank of England’s policies, by shielding creditors, had the
effect of redistributing funds from private to public parties. In Chapter 3, an option
6.1. CHAPTER SUMMARIES 347
pricing model was developed which served to estimate how much a deposit guarantee
was worth in light of the riskiness of the underlying business of the Big Four banks
during the decade of the crisis.
Most previous attempts to measure the value of such guarantees via option
pricing have used a standard Black-Scholes framework which assumes that the dis-
tribution of asset returns seldom deviates far from zero. This assumption, in addition
to being in contradiction with empirically realized time series, means that financial
crises are all but impossible, rendering the guarantee worth very little. In Chapter 3
this assumption was relaxed and instead a model introduced that states that, with
a small possibility in each period, prices will drop substantially, rendering the bank
in hand insolvent.
It was shown that even an extremely low, but positive, probability of such a
scenario is worth a lot to the guaranteed party. For the guarantee to be rendered
trivial, the robustness analysis showed, it is necessary that both the probability of
crisis as well as the cost of crisis be all but eliminated. As this guarantee is not a
risk-free provision, I concluded that it entails an implicit subsidy to the banks from
the Bank of England. In other words, risky operations on the lending side of the
balance sheet can only result in truly riskless funding on the liability side through
implicit third-party guarantees on behalf of the central bank.520
Alongside the empirical analysis, the Bank’s changing viewpoint on these issues
before and during the crisis was also documented as it reluctantly took on the role
of the financial system’s saviour. The new evidence used in the chapter showed that
the Bank devoted very little time to this function in the period before the secondary
520Here the reference to risky operations on the lending side is in relative terms. That is to say,while assets on banks’ balance sheets can be judged low risk they are not risk-free and are thusrisky in comparison to any instrument that is considered risk-free.
348 CHAPTER 6. CONCLUSIONS
crisis. Furthermore, as the crisis intensified, there were only glimpses of fundamental
re-thinking as to what effect the rescue operations might have on prices, risk-taking
and the structure of the financial sector.
Only on rare occasions were discussions started inside the Bank on a similar level
as that taken in the chapter. This included the consequences of accepted institutions,
by being part of the inner core of the financial system, being shielded from loss to
some extent and how such a system could work. However, going through with such
analysis of underlying fundamentals would ultimately have led to a radical re-think
on the viability and consequences of the Bank’s crisis management operations. Such
questions therefore petered out quickly with no solutions found. The debate was in
turn replaced by more practical and more manageable reform of the Bank’s policies.
6.1.3 Chapter 5 - Interdependence and Contagion
In Chapter 5, the focus switched to analyzing the recipient of the crisis management
assistance, as opposed to the provider. We thus looked at the largest banks, in
particular the so-called Big Four, and tried to shed light on why there is a need for the
facilities and how strong the argument is. This chapter thus represents a look at the
role of the facilities. While the first main role, that of whether to protect depositors,
is a subjective, political one, the second role, contagion detection and prevention,
requires an understanding of the co-movements of creditors and subsequent effects.
Deciding to use public institutions, such as the Bank of England, to intervene
with normal market processes is a big decision which can have drastic effects on real
and contingent balance sheet of public accounts, as seen in Chapter 3. The aim
of this chapter was thus to document the Bank’s developing relationship with the
Big Four as the crisis unwound and how decisions were made regarding provision of
6.1. CHAPTER SUMMARIES 349
funds. One striking finding is that the common narrative in the literature - that the
Bank acted as coordinator of the operations with the bulk of the financing coming
from the clearers - is not wholly correct.
While the clearers did indeed provide a large part of the funds used, they put
a lot of pressure on the Bank of England to limit - if not guarantee - the exposure
they faced. Furthermore, multiple conversations took place where the clearers stated
that there had to be a pre-determined cap on the funds extended by the banks
and that the Bank would have to provide any additional funds needed. The Bank,
while never committing to an explicit arrangement along those lines, was nonetheless
wholly sympathetic to the argument. It was thus more financially exposed to the
operations than the literature indicates when the figures involved are taken at face
value.
To complement this analysis, high frequency financial data was also obtained
and a new dataset constructed for the Big Four’s balance sheet throughout a large
part of the 20th century on a monthly basis. The properties of these time series
could then be connected to the historical record to see how well the fundamentals
tied in with the decision making. Several cuts of the data were presented, looking
at, amongst other things, the co-movement between banks, the developments during
the crisis and volatility properties of the series.
No increase was found in co-movement of deposits - measured and supported
in various ways - during the crisis and if anything there was less co-movement than
during other periods. This could most plausibly be attributed to either better man-
agement of the clearers, compared to the secondary banks, or the success of the
Lifeboat operations.
To shed light on these distinct hypotheses, another interesting finding was doc-
350 CHAPTER 6. CONCLUSIONS
umented, that of a certain structural break in lending by the Big Four during the run
up to the crisis, even when taking account of inflation. Yearly increases in lending
which had averaged approximately 3-4% in the post-war period through to the 1960s,
started to take off at the same time as the secondary banks experienced their rapid
growth. As one would expect, the effect of this rapid growth was felt through the
share price which rose rapidly during the growth period and then fell sharply during
the crisis.
This effect, however, was not felt within the deposit base, which represented
by far the largest part of the liability side of the balance sheet. In the chapter, I
compared not only the level changes in deposits to the banks’ share prices, but also
the co-movement between the two instruments and also between banks. The effects
of so-called market discipline are almost solely to be seen on the equity side, while
the debt, or deposit, side shows little response to the banks’ operations.
The reason for this discrepancy between the two stakeholders is hard to establish
from the available data but its existence shows that the dynamics at play are far from
the same for the two instruments. One hypothesis that immediately springs to mind
is that creditors, as opposed to equityholders, do not foresee any losses by the bank
being forced onto them. This should also raise scepticism regarding the common
procedure of drawing conclusions about the funding pressures felt by banks during
crises by looking at equity prices. That is to say, a rapid decline in the share price
won’t necessarily materially affect a banks’ operations unless it is accompanied by a
similar response by debt holders.
Finally, to complement the balance sheet analysis, another data set was con-
structed consisting of equity prices for the Big Four and selected fringe banks. This
analysis pointed to fairly strong evidence of interconnectedness between the core of
6.2. CONCLUSIONS, CONTEXT AND IMPLICATIONS 351
the fringe. This relationship was not symmetric, however, as the fringe was statisti-
cally far more significant for the core than vice versa. To paraphrase, the problems
of the fringe were felt in the equity price of the core although, as mentioned above,
these problems did not spread to other instruments such as deposits. Again, this dis-
connect is not easy to explain and may possibly point to an area of concern regarding
market discipline and crisis management.
6.2 Conclusions, Context and Implications
Taken together, what do these three chapters, and the thesis as a whole, have to
say about the policies undertaken during the secondary crisis and the theory of
the central bank as crisis manager in general? Going back to the most renowned
anchor in the LOLR literature, this thesis does nothing to downplay the sensibility
of Bagehot’s dictum of lending freely to illiquid but solvent institutions, against good
collateral at an appropriate interest rate. However, the conclusions point to the fact
that in practicality, crisis management can easily involve taking only the first two
words of that dictum - lending freely - to heart.
While the organizers of the Lifeboat approached each rescue on a case by case
basis under the guise of adhering to Bagehot’s ”illiquid but solvent” criteria, it was
clear in each instance that maintaining stability and confidence was a greater re-
quirement than avoiding individual losses. The participants were thus well aware
that funds committed were very much at risk and that a sizeable proportion of them
would not be repaid. This can also be seen by the pressure put on the Bank of
England by the clearers with regard to the former underwriting potential losses.
As for taking good collateral and lending at an appropriately high rate, the
352 CHAPTER 6. CONCLUSIONS
same bending of Bagehot’s rule applied. The Lifeboat organizers thus took what
collateral they could find and it was very much a case of making do with resources
available. Furthermore, the price of these loans was set in the region of 2-3% over
the participants own funding costs (LIBOR), as laid out in Chapter 5. This rate can
hardly be considered exorbitant, especially given that the high inflation rate of the
period meant that the price represented a negative real interest rate.
Turning to the context of the thesis, how do these findings contrast with the pre-
vious literature on the secondary banking crisis? Firstly, it should be reemphasized
that the secondary crisis is an understudied one. There are very few scholarly treat-
ments of the crisis and the main writings come either as narratives from journalists
or as one component of a larger look at some broader topic.521
The material that does exist is, however, in general agreement about the causes,
consequences and effect of the crisis.522 The loosening of restrictions and emergence
of new, relatively unregulated, institutions, coupled with easy access to funding, led
to a sharp rise in credit and subsequently property prices which affected balance
sheets negatively when reversed. The threat of panic amongst depositors spreading
from these new institutions towards the core of the banking system in turn required
assistance which was provided by the clearer banks in collaboration with the Bank
of England. This assistance involved some losses, borne by the banks and the Bank,
but ultimately lower than would have been the case if the crisis had spread to the
core.
521The journalist Margret Reid provided the most detailed analysis of the crisis, in a book pub-lished over thirty years ago. Capie (2010) is an example of the latter type of coverage of thesecondary crisis as it features as a subplot within a larger look at the Bank of England during along period.522The synthesis provided here is a condensed overview of the findings of the main works on the
crisis, such as Reid (1982), Capie (2010) and Kynaston (2002). The reader is referred back toChapter 2 for a more thorough overview of the literature.
6.2. CONCLUSIONS, CONTEXT AND IMPLICATIONS 353
Taken at face value, this narrative does not seem to differ substantially from the
results of this thesis, or in fact many other narratives of banking crises. However,
the main goal of this thesis was not to necessarily challenge these main points but
to dig deeper through to the fundamentals. This has led to some challenges to the
popular narrative.
Firstly, while the exact amount of losses borne by the Bank of England is hard
to estimate, the literature states that they were in some sense small and in any case
smaller than under the plausible alternatives. The thesis challenges this assertion on
the grounds that it doesn’t deal with the implicit subsidy involved with providing
assurances to the core of the system. In fact, the evidence in Chapter 3 indicated
that the effect of making bank deposits of the Big Four in effect risk free, the Bank of
England provided an option-like guarantee worth considerably more than any direct
loss of the Lifeboat operations.
On a related note, Chapter 5 showed that there was a rapid increase in the
provision of credit by the Big Four during the build up to the crisis. As such rapid
lending is a primary culprit in the literature for the fall of the secondary banks, one
could assume that the fact that the Big Four took part in this lending boom would
lead to a similar demise for them. This was of course not the case, as the Big Four
went through the crisis without any real disruption felt on the liability side of their
balance sheets as laid out in the same chapter. The natural development of a lending
boom leading to a funding crisis when the business cycle turned was therefore only
evident for the secondary banks themselves, while the Big Four’s lending boom did
not result in the same market disciplining or scepticism by creditors.
This difference in fate between the Big Four and the secondary banks is at-
tributed in the literature by the implicit interpretation that the secondary banks
354 CHAPTER 6. CONCLUSIONS
pursued more reckless lending than the large, established banks which ultimately led
to the formers’ downfall. The discussion in Chapter 3 thus contradicted this expla-
nation and puts greater weight on the big banks’ position at the core of the system
and their relationship with the Bank of England.
This, in turn, relates to the findings of Chapter 4. The Bank, as self-proclaimed
guardian of the financial system, enforced its role very differently during the crisis
than it had in previous decades. The episode of Slater Walker was a high-profile
version of a general phenomena whereby the Bank came to the conclusion that the
company’s liabilities had ceased to be a private concern of the borrower and the
lender. This gradual realization was documented in the chapter as well as how
the Bank took it upon itself to ensure that all credit risk was removed from SW’s
liabilities. The actual information the Bank would have needed prior to the crisis
to prevent this de facto nationalization of losses was also highlighted. In effect, the
Bank would have required to have the same information and manpower at its disposal
as the management team of SW itself.
Another part of the narrative in the literature that does not stand up to great
scrutiny is the way in which the Lifeboat was implemented. It is generally concluded
that the Lifeboat was a joint operation with the commercial banks and the Bank of
England acting as peers, driven by the same motivation and collaborating to achieve
that end. In addition to the principal-agent problems such a partnership would
introduce, the thesis has also cast doubt as to the accuracy of this view as the Bank
was under great pressure to minimize the extent of losses faced by the clearers on
funds provided and also, no less crucially, to take on any additional exposure and
subsequent losses by itself. The Bank’s proportion of the total exposure to the crisis,
and especially the tail effects of it, are thus argued to be greater than has generally
6.2. CONCLUSIONS, CONTEXT AND IMPLICATIONS 355
been the case in the previous literature.
Finally, what subsequent policy lessons can be drawn from the above conclu-
sions? Most prominently, a better weighing of sticks and carrots is required during
crisis management. Setting aside the questionable premise that a central bank is
better able than market participants to separate cases of insolvency and illiquidity
at times of crisis, the need to take adequate collateral and charge adequate compen-
sation needs to be highlighted.
Secondly, financial stability policies should be managed through the cycle and
not reinvented at times of stress. In the case studied in this thesis, this would have
meant a disciplining session of soul searching by the Bank of England well before
the crisis as to what the tolerance rate for depositor losses was to be in an adverse
scenario. With such a truthful re-think, the Bank could have better understood that
much of the funding of both secondary and primary banks was in fact of a nature
that would prevent any losses to be taken by the holder of the debt. This would
in turn have had a serious effect on policy as the activities that these funds were
allowed to support would have been much more limited.
Finally, the disconnect between the thought process of savers and the business of
regulation must be confronted. During the period studied in this thesis, as is the case
now, a general depositor of any recognized banking institution thought of his funds
as literally ”money in the bank”. He did not analyze - and re-analyze throughout
the lifetime of his investment- the extent of the bank’s solvency, its liquidity or the
state of the loan book at the arrival of new information. The effect of this can be
seen in the required rate of return of depositors and how they reacted at signs of
trouble, as documented in Chapter 5.
Policymakers thus faced (and face) a very real but daunting trade-off. They
356 CHAPTER 6. CONCLUSIONS
can maintain the public perception of a deposit being risk-free and sitting on the
balance sheet as cash to be withdrawn at any time, at the expense of taking on
the risk themselves at times of crisis. Or deposits can be treated in a novel way,
as an investment product with a risk-return trade-off like any other where the state
contingent payoffs are a bargaining matter between the borrower and the lender.
This latter scenario may not be deemed feasible but reaching such a conclusion only
serves to highlight the inherent problems - which can’t be ignored - of deposits being
risk-free in the minds of the lenders.
Appendix A
List of Relevant Public Sector
Officials
Bank of England
Governors
Sir Leslie O’Brien - 1966–1973
Gordon Richardson - 1973–1983
Deputy Governors
Sir Maurice Henry Parsons - 1966–1970
Jasper Quintus Hollom - 1970–1980
Chief Cashiers
Jasper Hollom - 1962–1966
John Standish Fforde - 1966–170
John Page - 1970–1980
357
358 APPENDIX A. LIST OF RELEVANT PUBLIC SECTOR OFFICIALS
Government Officials
Prime Ministers
Harold Wilson - 1964–1970
Edward Heath - 1970–1974
Harold Wilson - 1974–1976
James Callaghan - 1976–1979
Chancellors of the Exchequer
Anthony Barber - 1970–1974
Denis Healy - 1974–1979

Bibliography
Primary Sources
Archives. The archival material used comes from various files in each archive.
Each file is referenced in the main text where it is used.
• Bank of England Archives
• Lloyds Archives
• HSBC Archives
• London Metropolitan Archives
• National Archives
Annual reports. Chapters 3, 4 and 5 make use of annual reports of the following
institutions, for the years 1970-1980.
• Bank of England
• Barclays
• Lloyds
• Midland
359
360 BIBLIOGRAPHY
• National Westminster
• Slater Walker
Newspapers. Archived articles from the following newspapers were used for the
analysis in Chapter 4.
• Accountancy
• The Economist
• The Evening Standard
• The Financial Times
• Investors Chronicle
• Investors Review
• The Observer
• The Sunday Times
• The Telegraph
Secondary Sources
Acharya, V.V., Drechsler, I. and Schnabl, P. (2011): ”A Pyrrhic Victory? - Bank
Bailouts And Sovereign Credit Risk”, NBER Working Papers, No. 17136.
Ackrill, M. and Hannah, L. (2001): Barclays: The Business Of Banking
1690-1996, Cambridge University Press.
BIBLIOGRAPHY 361
Aguado, I.G. (2001): ”The Creditanstalt Crisis Of 1931 And The Failure Of The
Austro-German Customs Union Project”, The Historical Journal, 44(1), 199-221.
Aharony, J. and Swary, I. (1983): ”Contagion Effects Of Bank Failures: Evidence
From Capital Markets”, Journal of Business, 56(3), 305-322.
Allen, F. and Gale, D. (2000): ”Financial Contagion”, Journal of Political
Economy, 108(1), 1-33.
Altman, E.I. (1984): ”A Further Empirical Investigation Of The Bankruptcy Cost
Question”, The Journal of Finance, 39, 1067-1089.
Altman, E.I., Brady, B., Resti, A. and Sironi, A. (2005): ”The Link Between
Default And Recovery Rates: Theory, Empirical Evidence, And Implications”,
The Journal of Business, 78(6), 2203-2228.
Alvarez-Cuadrado, F. and Pintea, M.I. (2009): ”A Quantitative Exploration Of
The Golden Age Of European Growth”, Journal of Economic Dynamics &
Control, 33(7), 1437-1450.
Anginer, D., de la Torre, A. and Ize, A. (2014): ”Risk-Bearing By The State:
When Is It Good Public Policy?”, Journal of Financial Stability, 10(1), 76-86.
Arrow, K.J. (1962): ”Economic Welfare and the Allocation of Resources for
Invention”, in Nelson R. ed., The Rate and Direction of Inventive Activity,
609-626, Princeton University Press.
Arrow, K.J. (1963): ”Uncertainty and the Welfare Economics of Medical Care”,
American Economic Review, 53(5), 941-973.
362 BIBLIOGRAPHY
Bagehot, W. (1873): Lombard Street: A Description Of The Money Market, Henry
S. King and Co.
Baker, M. and Collins, M. (2005): ”London As An International Banking Centre,
1958-1980”, in Cassis, Y. and Bussiere, E. eds., London and Paris as International
Financial Centres in the Twentieth Century, 247-264, Oxford University Press.
Bank of England (1978): ”The secondary banking crisis and the Bank of
England’s support operations”, Bank Quarterly Bulletin, 18(2), 230-240.
Barro, R.J. (1986): ”Recent Developments In The Theory Of Rules Versus
Discretion”, The Economic Journal, 96, 23-37.
Barro, R.J. (2005): ”Rare Events and the Equity Premium”, NBER Working
Papers, No. 11310.
Barth, J.R, Caprio Jr., G. and Levine, R. (2004): ”Bank Regulation And
Supervision: What Works Best?”, Journal of Financial Intermediation, 13(2),
205-248.
Baur, D.G. and Fry, R.A. (2009): ”Multivariate Contagion And Interdependence”,
Journal of Asian Economics, 20, 353-366.
Benediktsdottir, S. Danielsson. J, and Zoega, G. (2011): ”Lessons From A
Collapse Of A Financial System”, Economic Policy, 26(66), 183-235.
Berger, A.N. and Udell, G.F. (2004): ”The Institutional Memory Hypothesis And
The Procyclicality Of Bank Lending Behavior”, Journal of Financial
Intermediation, 13(4), 458-495.
BIBLIOGRAPHY 363
Bernanke, B.S. (2007): Central Banking And Bank Supervision In The United
States, speech given at the Allied Social Science Association Annual Meeting,
Chicago, January 5th.
Bernanke, B.S., Gertler, M.L. and Gilchrist, S. (1996): ”The Financial Accelerator
And The Flight To Quality”, Review of Economics and Statistics, 78(1), 1-15.
Bignon, V., Flandreau, M. and Ugolini, S. (2012): ”Bagehot For Beginners: The
Making Of Lender-Of-Last-Resort Operations In The Mid-Nineteenth Century”,
Economic History Review, 65(2), 580-608.
Billings, M. and Capie, F. (2007): ”Capital in British Banking 1920-1970”, in
Business History, 49(2), 139-162.
Billio, M. and Pelizzon, L. (2003): ”Contagion and Interdependence in Stock
Markets: Have They Been Misdiagnosed?”, in Journal of Economics and
Business, 55(5-6), 405-426.
Black, F. and Scholes, M. (1973): ”The Pricing Of Options And Corporate
Liabilities”, Journal of Political Economy, 81(3), 637-654.
Blackhurst, C. (1996): ”Fast-Buck Fraternity”, in Management Today, June, 40.
Booth, A. (1983): ””The Keynesian Revolution” In Economic Policy Making”,
Economic History Review, 36(1), 103-123.
Booth, A. (2001): The British Economy In The Twentieth Century, Palgrave
Macmillan.
364 BIBLIOGRAPHY
Booth, A. (2003): ”The Manufacturing Failure Hypothesis And The Performance
Of British Industry During The Long Boom”, Economic History Review, 56(1),
1-33.
Booth, A. (2003a): ”The Broadberry-Crafts View And The Evidence: A Reply”,
Economic History Review, 56(4), 736-742.
Bordo, M.D. (1989): ”The Lender of Last Resort: Alternative Views and
Historical Experience”, Economic Review, Federal Reserve Bank of Richmond,
18-29.
Bordo, M. (1993): ”The Bretton Woods International Monetary System: A
Historical Overview”, in Bordo, M. and Eichengreen, B., A Retrospective on the
Bretton Woods System: Lessons for International Monetary Reform, 3-108,
University of Chicago Press.
Bordo, M. and Eichengreen, B. (1993): A Retrospective On The Bretton Woods
System: Lessons For International Monetary Reform, University of Chicago Press.
Bordo, M. and Eichengreen, B. (2002): ”Crises Now And Then: What Lessons
From The Last Era Of Financial Globalization?”, NBER Working Papers, No.
8716.
Bordo, M., Eichengreen, B., Klingebiel, D. and Martinez-Peria, M.S. (2001): ”Is
the Crisis Problem Growing More Severe?”, Economic Policy, 16(32), 53-82.
Bordo, M., Mizrach, B. and Schwartz, A.J. (1995): ”Real Versus
Pseudo-International Systemic Risk: Some Lessons From History”, NBER
Working Papers, No. 5371.
BIBLIOGRAPHY 365
Bordo, M.D. and Wheelock, D.C. (2007): ”Stock Market Booms And Monetary
Policy In The Twentieth Century”, Federal Reserve Bank of St. Louis Review,
89(2), 91-122.
Bordo, M.D., Macdonald, R. and Oliver, M.J. (2009): ”Sterling In Crisis,
1964-1967”, European Review of Economic History, 13, 437-459.
Bowden, S. (1997): ”Competition And Collusion In The Finance Sector In The
Postwar Period”, Financial History Review, 4(2), 161-179.
Britton, A. (1991): Macroeconomic Policy In Britain, Cambridge University Press.
Broadberry, S. (1994): ”Why Was Unemployment In Postwar Britain So Low?”,
Bulletin of Economic Research, 46(3), 241-261.
Broadberry, S. (2004): ”Explaining Anglo-German Productivity Differences In
Services Since 1870”, European Review of Economic History, 8, 229-262.
Broadberry, S. and Crafts, N. (2011): ”Openness, Protectionism And Britain’s
Productivity Performance Over The Long Run”, in Wood, G., Mills, T.C. and
Crafts, N. eds., Monetary and Banking History: Essays in Honour of Forrest
Capie, 254-286, Routledge London.
Brunnermeier, M., Crocket, A., Goodhart, C., Hellwig, M., Persaud, A.D., and
Shin, H. (2009): The Fundamental Principles Of Financial Regulation, Centre for
Economic Policy Research.
Brunnermeier, M.K. (2009): ”Deciphering The Liquidity And Credit Crunch
2007-2008”, Journal of Economic Perspectives, 23(1), 77-100.
366 BIBLIOGRAPHY
Bruno, M. and Sachs, J. (1985): The Economics Of Worldwide Stagflation,
Harvard University Press.
Burk, K. and Cairncross, A. (1992): Good-Bye Great Britain: The 1976 IMF
Crisis, Yale University Press.
Busch, A. (2004): ”National Filters: Europeanisation, Institutions, And Discourse
In The Case Of Banking Regulation”, in Schmidt, V.A. and Radaelli, C. eds.,
Opening the Black Box: Europeanisation, Discourse, and Policy Change, Special
issue of West European Politics 1/2004.
Buser, S.A., Chen, A.H. and Kane, E.J. (1981): ”Federal Deposit Insurance,
Regulatory Policy, and Optimal Bank Capital”, Journal of Finance, 36(1), 51-60.
Cairncross, A. (1992): The British Economy Since 1945: Economic Policy And
Performance, Wiley-Blackwell.
Cairncross, A. (1996): Economic Ideas and Government Policy, Routledge
London.
Calomiris, C. (1999): ”Building An Incentive-Compatible Safety Net”, Journal of
Banking and Finance, 23, 1499-1519.
Calomiris, C. (2009): ”Banking Crises And The Rules Of The Game”, NBER
Working Paper, No. 15403.
Calomiris, C. and Kahn, C.M. (1991): ”The Role of Demandable Debt in
Structuring Optimal Banking Arrangements”, American Economic Review, 81(3),
497-513.
BIBLIOGRAPHY 367
Campbell, A., LaBrosse, J.R., Mayes, D.G. and Singh, D. eds. (2007): Deposit
Insurance, Palgrave Macmillan, 1st edition.
Campbell, J.Y. and Shiller, R.J. (1987): ”Cointegration And Tests Of Present
Value Models”, Journal of Political Economy, 95(5), 1062-1088.
Capie, F. (2010): The Bank Of England: 1950s To 1979, Cambridge University
Press.
Capie, F. (2014): ”British Financial Crises in the Nineteenth and Twentieth
Centuries”, in Dimsdale, N. And Hotson, A. (eds), British Financial Crises since
1825, Oxford University Press.
Capie, F. and Billings, M. (2001): ”Accounting Issues And The Measurement Of
Profits - English Banks 1920-1968”, Accounting, Business & Financial History,
11(2), 225-251.
Capie, F. and Billings, M. (2001): ”Profitability In English Banking In The
Twentieth Century”, European Review of Economic History, 5(3), 367-401.
Capie, F. and Billings, M. (2004): ”Evidence On Competition In English
Commercial Banking, 1920-1970”, Financial History Review, 11(1), 69-103.
Capie, F. and Goodhart, C. (1995): ”Central Banks, Macro Policy, And The
Financial System; The Nineteenth And Twentieth Centuries”, Financial History
Review, 2, 145-161.
Capie, F. and Webber, A. (1985): A Monetary History Of The United Kingdom:
1870-1982, Routledge.
368 BIBLIOGRAPHY
Capie, F., Goodhart, C. and Schnadt, N. (1994): ”The Development Of Central
Banking”, in Capie, F. Fisher, S., Goodhart, C. and Schnadt, N. eds., The Future
of Central Banking: the Tercentenary Symposium of the Bank of England 1-92,
Cambridge University Press.
Cassis, Y. (2006): Capitals Of Capital: A History Of International Financial
Centres, 1780-2005, Cambridge University Press.
Cassis, Y. and Bussiere, E. (2005): London And Paris As International Financial
Centres In The Twentieth Century, Oxford University Press.
Chabot, B. (2011): ”The Cost Of Banking Panics In An Age Before ’Too Big To
Fail”’, Federal Reserve of Chicago Working Papers, No. 15/2011.
Chabot, B. and Moul, C.C. (2013): ”Bank Panics, Government Guarantees, And
The Long-Run Size Of The Financial Sector: Evidence From Free-Banking
America”, Federal Reserve of Chicago Working Papers, No. 03/2013.
Chandler, A.D. (1994): ”The Competitive Performance Of U.S. Industrial
Enterprises Since The Second World War”, Business History Review, 68(1), 1-72.
Channon, D.F. (1977): British Banking Strategy And The International Challenge,
Palgrave Macmillan.
Chrystal, A. and Mizen, P. (2011): ”Monetary Aggregates Restored? Capie And
Webber Revisited”, in Wood, G., Mills, T.C. and Crafts, N. eds., Monetary and
Banking History: Essays in honour of Forrest Capie 178-192, Routledge
International Studies in Money and Banking.
BIBLIOGRAPHY 369
Cihak, M., Demirguc-Kunt, A., Martinez Peria, M.S. and Mohseni-Cheraghlou, A.
(2012): ”Bank Regulation And Supervision Around The World”, World Bank
Policy Research Working Papers, no. 6286.
Claessens, S. and Forbes, K. (2004): ”International Financial Contagion: The
Theory, Evidence And Policy Implications”, for the Conference The IMF’s Role in
Emerging Market Economies: Reassessing the Adequacy of its Resources organized
by RBWC, DNB and WEF in Amsterdam on November 18-19.
Clement, P. (2010): ”The Term ”Macroprudential”: Origins and Evolution”, BIS
Quarterly Review, March edition, 59-67.
Cobham, D. (2002): The Making Of Monetary Policy In The Uk, 1975-2000, John
Wiley & Sons Ltd.
Committee of London Clearing Bankers (1977), Evidence to the Committee to
Review the Functioning of Financial Institutions.
Crafts, N. (2012): ”British Relative Economic Decline Revisited: The Role Of
Competition”, Explorations in Economic History, 49(1), 17-29.
Crafts, N. (2011a): ”Competition Cured The ’British Disease”, Vox EU,
http://www.voxeu.org/article/competition-cured-british-disease.
Crafts, N. (2011b): ”Economic History Matters”, CAGE Oline Working Paper
Series, no. 57.
Cron, W.R. and Hayes, R.B. (2007): ”Valuation of Stock Options of Non-Publicly
Traded Companies”, in American Journal of Business, 22(1).
370 BIBLIOGRAPHY
Corsetti, G., Pericoli, M. and Sbracia, M. (2005): ”’Some Contagion, Some
Interdependence’: More Pitfalls in Tests of Financial Contagion”, in Journal of
International Money and Finance, 24(8), 1177-1199.
Cubillas, E., Fonseca, A.R. and Gonzalez, F. (2012): ”Banking Crises and Market
Discipline: International Evidence”, Journal of Banking and Finance, 36(8),
2285-2298.
Dahlfors, G. and Jansson, P. (1994): Essays In Financial Guarantees And Risky
Debt, Unpublished PhD thesis at the Stockholm School of Economics.
Danielsson, J. and Zoega, G. (2009): ”The Collapse Of A Country”, IOES
Working Paper Series, No. 09:03.
Davis, E.P. (1995): Debt, Financial Fragility, And Systemic Risk, Clarendon Press.
Degryse, H. and Nguyen, G. (2007): ”Interbank Exposures: An Empirical
Examination Of Contagion Risk In The Belgian Banking System”, International
Journal of Central Banking, 3(2), 123-171.
Demirguc-Kunt, A. and Detragiache, E. (1997): ”The Determinants Of Banking
Crises: Evidence From Industrial And Developing Countries”, The World Bank
Development Research Group and International Monetary Fund Research
Department Policy Research Working Paper, No. 1828.
Demirguc-Kunt, A., Kane, E. and Laeven, L. eds. (2008): Deposit Insurance
Around The World, MIT Press, 1st edition.
Dewatripont, M. and Tirole, J. (1993): The Prudential Regulation Of Banks,
Editions Payot Lausanne.
BIBLIOGRAPHY 371
Dewatripont, M., Rochet, J.C. and Tirole, J. (2010): Balancing The Banks:
Global Lessons From The Financial Crisis, Princeton University Press.
Diamond, D.W. and Dybvig P.H. (1983): ”Bank Runs, Deposit Insurance, And
Liquidity”, Journal of Political Economy, 91(3), 401-419.
Dimson, E. (2003): ”Triumph Of The Optimists”, unpublished Arrowstreet Capital
note.
Ding, C.G., Wu, C. and Chang, P. (2013): ”The Influence Of Government
Intervention On The Trajectory Of Bank Performance During The Global
Financial Crisis: A Comparative Study Among Asian Economies”, Journal of
Financial Stability, 9(4), 556-564.
Duffie, D., Jarrow, R., Purnanandam, A. and Yang, W. (2003): ”Market Pricing
Of Deposit Insurance”, Journal of Financial Services Research, 24(2), 93-119.
Eichengreen, B. (1993): ”Epilogue: Three Perspectives On The Bretton Woods
System”, in Bordo, M. and Eichengreen, B. eds., A Retrospective on the Bretton
Woods System: Lessons for International Monetary Reform, 621-658, University
Of Chicago Press.
Eichengreen, B. (1996): ”Explaining Britain’S Economic Performance: A Critical
Note”, The Economic Journal, 106(434), 213-218.
Eichengreen, B. (2007): The European Economy Since 1945, Princeton University
Press.
372 BIBLIOGRAPHY
Eichengreen, B. (2011): ”The new monetary and financial history”, in Wood, G.,
Mills, T.C. and Crafts, N. eds, Monetary and Banking History: Essays in honour
of Forrest Capie, 27-48, Routledge London.
Enflo, K. (2011): ”The Institutional Roots Of Post-War European Economic
Underperformance: A Regional Approach”, European Review of Economic
History, 15(2), 329-355.
Enoch, C., Stella, P. and Khamis M. (1997): ”Transparency And Ambiguity In
Central Bank Safety Net Operations”, IMF Working Paper, 97/138.
FASB (2008): ”Conceptual Framework For Financial Reporting: The Reporting
Entity”, Preliminary Views, 1580-100.
Fisher, C. and Kent, C. (1999): ”Two Depressions, One Banking Collapse”,
Reserve Bank of Australia Research Discussion Papers, 1999/06.
Flandreau, M. and Ugolini, S. (2011): ”Where It All Began: Lending Of Last
Resort And The Bank Of England During The Overend, Gurney Panic Of 1866”,
Graduate Institute of International and Development Studies Working Paper, No.
04/2011.
Floud, R. and Johnson, P. (eds.) (2008): The Cambridge Economic History Of
Modern Britain: Volume 3, Cambridge University Press.
Franks, J.R., Harris, R.S. and Mayer, C. (1988): ”Means of Payment in Takeovers:
Results for the United Kingdom and the United States”, in Corporate Takeovers:
Causes and Consequences, 221-264, National Bureau of Economic Research.
BIBLIOGRAPHY 373
Freixas, X., Giannini, C., Hoggarth, G. and Soussa, F. (2000): ”Lender of Last
Resort: What Have We Learned Since Bagehot?”, Journal of Financial Services
Research, 18(1), 63-84.
Freixas, X., Giannini, C., Hoggarth, G. and Soussa, F. (2002): ”Lender of Last
Resort: A Review of the Literature”, in Goodhart, C. And Illing, G. (eds),
Financial Crises, Contagion, and the Lender of Last Resort: A Reader, 27-56,
Oxford University Press.
Friedman, M. (1968): ”The Role Of Monetary Policy”, American Economic
Review, 58(1), 1-17.
Friedman, M. and Schwartz, A.J. (1963): A Monetary History of the United States
1867-1960, Princeton University Press.
Gandhi, P. and Lustig, H. (2010): ”Size Anomalies In U.S. Bank Stock Returns:
A Fiscal Explanation”, NBER Working Paper, No. 16553.
Gatev, E., Schuermann, T. and Strahan, P.E. (2009): ”Managing Bank Liquidity
Risk: How Deposit-Loan Synergies Vary With Market Conditions”, The Review of
Financial Studies, 22(3), 995-1020.
Geanakoplos, J. (2010): ”The Leverage Cycle”, NBER Macroeconomic Annual
2009, vol. 24, 1-65.
Geddes, P. (1987): Inside The Bank Of England, Boxtree Ltd, 1st edition.
Gennaioli, N., Shleifer, A. and Vishny, R. (2012): ”Neglected Risks, Financial
Innovation, And Financial Fragility”, Journal of Financial Economics, 104(3),
452-468.
374 BIBLIOGRAPHY
Gertler, M. (1988): ”Financial Structure and Aggregate Economic Activity: An
Overview”, Journal of Money, Credit and Banking, 20(2), 559-588.
Gola, C. and Roselli, A. (2009): The UK Banking System And Its Regulatory And
Supervisory Framework, Palgrave Macmillan, 1st edition.
Goodhart, C. (1986): ”Financial Innovation And Monetary Control”, Oxford
Review of Economic Policy, 2(4), 79-102.
Goodhart, C. (1989): ”The Conduct Of Monetary Policy”, The Economic
Journal, 99(396), 293-346.
Goodhart, C. (1998): The Evolution Of Central Banks, MIT Press.
Goodhart, C. (2002): ”Myths About The Lender Of Last Resort”, in Goodhart,
C. and Illing, G. eds., Financial Crises, Contagion, and the Lender of Last Resort:
A Reader, 227-248, Oxford University Press.
Goodhart, C. (2010): ”How Should We Regulate The Financial Sector?”, in
several eds., The Future of Finance, 153-176, LSE and the London Publishing
Partnership.
Goodhart, C. and Illing, G. (2002): Financial Crises, Contagion, And The Lender
Of Last Resort: A Reader, Oxford University Press.
Goodhart, C. and Schoenmaker D. (1995): ”Should The Functions Of Monetary
Policy And Banking Supervision Be Separated?”, Oxford Economic Papers, 47(4),
539-560.
Goodhart, C.A.E. (2001): ”The Changing Role of Central Banks”, Financial
History Review, 18(2), 135-154.
BIBLIOGRAPHY 375
Gormley, T.A., Johnson, S. and Rhee, C. (2011): ”Ending Too Big To Fail:
Government Promises Vs. Investor Perceptions”, NBER Working Paper, No.
17518.
Gorton, G.B. (2010): Slapped By The Invisible Hand, Oxford University Press.
Gorton, G.B. (2012): Misunderstanding Financial Crises: Why We Don’t See
Them Coming, Oxford University Press.
Grady, J. and Weale, M. (1986): British Banking, 1960-85, The MacMillan Press
Ltd.
Granger, C.W.J. (1969): ”Investigating Causal Relations by Econometric Models
and Cross-Spectral Methods”, Econometrica, 37(3), 424-438.
Greene, W.H. (2008): Econometric Analysis, Pearson Education Inc, 6th edition.
Griffiths, B. (1973): ”Resource Efficiency, Monetary Policy And The Reform Of
The U. K. Banking System”, Journal of Money, Credit and Banking, 5(1), 61-77.
Griffiths, B. (1973): ”The Development Of Restrictive Practices In The U. K.
Monetary System”, The Manchester School, 41(1), 3-18.
Grossman, R.S. (2010): Unsettled Account: The Evolution Of Banking In The
Industrialized World Since 1800, Princeton University Press.
Grossman, R.S. (2011): ”The Economic History Of Banking”, Wesleyan
Economics Working Papers, no. 2011-4.
Gruber, M.J. and Warner, J.B. (1977): ”Bankruptcy Costs: Some Evidence”, The
Journal of Finance, 32, 337-347.
376 BIBLIOGRAPHY
Haldane, A. (2011): ”Control Rights (And Wrongs)”, Speech given at the Wincott
Annual Memorial Lecture.
Haldane, A., Brennan, S. and Madouros, V. (2010): ”What is the Contribution of
the Financial Sector: Miracle or Mirage?”, in several eds., The Future of Finance,
64-105, LSE and the London Publishing Partnership.
Hamilton, J.D. (1989): ”A New Approach To The Economic Analysis Of
Nonstationary Time Series And The Business Cycle”, Econometrica, 57(2),
357-384.
Hatton, T.J. (1988): ”Institutional Change And Wage Rigidity In The UK,
1880-1985”, Oxford Review of Economic Policy, 4(1), 74-86.
Hatton, T.J. and Boyer, G.R. (2005): ”Unemployment And The UK Labour
Market Before, During And After The Golden Age”, European Review of
Economic History, 9(1), 35-60.
Hett, F. and Schmidt, A. (2011): ”Do Bank Bail-Outs Hurt Market Discipline?
Evidence From The Subprime Crisis”, Unpublished Working Paper.
Hiemstra, C. and Jones, J.D. (1994): ”Testing For Linear And Nonlinear Granger
Causality In The Stock Price-Volume Relation”, Journal of Finance, 49(5),
1639-1664.
Hirsch, F. (1977): ”The Bagehot Problem”, The Manchester School of Economic
& Social Studies, 45(3), 241-257.
Hope, M. (1976): ”On Being Taken Over By Slater Walker”, The Journal of
Industrial Economics, 24(3), 163-179.
BIBLIOGRAPHY 377
Hovakimian, A. , Kane, E. and Laeven, L. (2011): ”Systemic Risk In Us Banks,
1974-2010”, Unpublished Working Paper.
Howson, S. (2008): ”Money And Monetary Policy Since 1945”, in Floud, R. and
Johnson, P. eds., The Cambridge Economic History of Modern Britain: Volume 3,
134-166, Cambridge University Press.
Humphrey, T.M. (1989): ”Lender of Last Resort: The Concept in History”,
Economic Review, Federal Reserve Bank of Richmond, 8-16.
Humphrey, T.M. and Keleher, R.E. (1984): ”The Lender of Last Resort: A
Historical Perspective”, Cato Journal, 4, 275-317.
Husband, G.R. (1954): ”The Entity Concept In Accounting”, The Accounting
Review, 29(4), 552-563.
Huynh, H.T. , Lai, V.S. and Soumar, I. (2008): Stochastic Simulation And
Applications In Finance With MATLAB Programs, Wiley, 1st edition.
IASB (2010): ”Conceptual Framework For Financial Reporting: The Reporting
Entity”, Exposure Draft, ED/2010/2.
International Monetary Fund (2014): ”How Big is the Implicit Subsidy for Banks
Considered Too Important to Fail?”, Global Financial Stability Report, 2014(1),
101-132.
Janssen, S. (2009): British And German Banking Strategies, Palgrave MacMillan.
Johansen, S. (1988): ”Statistical Analysis Of Cointegration Vectors”, Journal of
Economic Dynamics and Control, 12, 231-254.
378 BIBLIOGRAPHY
Johansen, S. (1991): ”Estimation And Hypothesis Testing Of Cointegration
Vectors In Gaussian Vector Autoregressive Models”, Econometrica, 59, 1551-1580.
Johansen, S. and Juselius, K. (1990): ”Maximum Likelihood Estimation And
Inference On Cointegration - With Applications To The Demand For Money”,
Oxford Bulletin of Economics and Statistics, 52, 169-210.
Jones, G. (1997): ”Global Perspectives And British Paradoxes”, Business History
Review, 71(2), 291-298.
Karlson, K. (2010): ”Checks and Balances: Using the Freedom of Information Act
to Evaluate the Federal Reserve Banks”, in American University Law Review,
60(1), 213-272.
Kashyap, A.K., Rajan, R.G. and Stein, J.C. (2002): ”Banks As Liquidity
Providers: An Explanation For The Co-Existence Of Lending And
Deposit-Taking”, Journal of Finance, 57, 33-74.
Kaufman, G.G. (1994): ”Bank Contagion: A Review Of The Theory And
Evidence”, Journal of Financial Services Research, 8(2), 123-150.
Kendall, S.B. (1992): ”A Note on the Existence and Characteristics of Fair
Deposit Insurance Premia”, in Journal of Banking and Finance, 16, 289-297.
Kindleberger, C.P. (1984): A Financial History Of Western Europe, George Allen
& Unwin Ltd.
Kitson, M. (2008): ”Failure Followed By Success Or Success Followed By Failure?
A Re-Examination Of British Economic Growth Since 1949”, in Floud, R. and
BIBLIOGRAPHY 379
Johnson, P. eds., The Cambridge Economic History of Modern Britain: Volume 3,
27-56, Cambridge University Press.
Kitson, M. and Michie, J. (1996): ”Britain’s Industrial Performance Since 1960:
Underinvestment And Relative Decline”, The Economic Journal, 106(434),
196-212.
Kiyotaki, N. and Moore, J. (1997): ”Credit Cycles”, Journal of Political Economy,
105(2), 211-248.
Kosmetatos, P. (2014): ”Financial Contagion and Market Intervention in the
1772-3 Credit Crisis”, Cambridge Working Papers in Economic and Social
History, 21(2014).
Kou, S.G. (2002): ”A Jump-Diffusion Model For Option Pricing”, Management
Science, 48(8), 1086-1101.
Kydland, F.E. and Prescott, E.C. (1977): ”Rules Rather Than Discretion: The
Inconsistency Of Optimal Plans”, Journal of Political Economy, 85(3), 473-492.
Kynaston, D. (2002): The City Of London: Volume IV - A Club No More
1945-2000, Pimlico.
Laeven, L. (2002): ”International Evidence On The Value Of Deposit Insurance”,
The Quarterly Review of Economics and Finance, 42(4), 721-732.
Laeven, L. (2002): ”Pricing Of Deposit Insurance”, World Bank Policy Research
Working Paper, No. 2871.
Laidler, D. (2003): ”Two Views Of The Lender Of Last Resort: Thornton And
Bagehot”, Papers in Political Economy, 45, 61-78.
380 BIBLIOGRAPHY
Lang, M. and Maffett, M. (2011): ”Transparency And Liquidity Uncertainty In
Crisis Periods”, Journal of Accounting and Economics, 52(2), 101-125.
Lucas, D. and Phaup, M. (2010): ”The Cost Of Risk To The Government And Its
Implications For Federal Budgeting”, in Lucas, D. ed., Measuring and Managing
Federal Financial Risk, 29-54, University of Chicago Press.
Lucas, D., Phaup, M. and Prasad, R. (2004): ”Valuing Federal Loans And Loan
Guarantees Using Options-Pricing Methods”, Technical Paper Series
Congressional Budget Office, 12/2004.
Mahate, A.A. (1994): ”Contagion Effects Of Three Late Nineteenth Century
British Bank Failures”, Business and Economic History, 23(1), 102-115.
Marcus, A. and Shaked, J. (1984): ”The Valuation of FDIC Deposit Insurance
Using Option-pricing Estimates”, Journal of Money, Credit and Banking, 16(4),
446-460.
Matthews, D. (2005): ”London And County Securities: A Case Study In Audit
And Regulatory Failure”, Accounting, Auditing & Accountability Journal, 18(4),
518-536.
Maude, D. and Perraudin, W. (1995): ”Pricing Deposit Insurance In The United
Kingdom”, Bank of England Working Paper Series, No. 29.
McLachlan, S. (1973): ”A Merger To Mark A New Kind Of Banking”, in The
Financial Times, April 27th, 22.
Mehra, R. and Prescott, E.C. (1985): ”The Equity Premium: A Puzzle”, Journal
of Monetary Economics, 15, 145-161.
BIBLIOGRAPHY 381
Meltzer, A. (2009): A History of the Federal Reserve: Volume II, Book Two,
1970-1986, University of Chicago Press Ltd.
Merton, R.C. (1976): ”Option Pricing When Underlying Stock Returns Are
Discontinuous”, Journal of Financial Economics, 3, 125-144.
Merton, R.C. (1977): ”An Analytic Derivation Of The Cost Of Deposit Insurance
And Loan Guarantees”, Journal of Banking and Finance, 1, 3-11.
Metcalfe, J.L. (1982): ”Self Regulation, Crisis Management And Preventive
Medicine. The Evolution Of U.K. Bank Supervision”, Journal of Management
Studies, 19(1), 75-90.
Michie, R.C. (2004): ”The City Of London And The British Government: The
Changing Relationship”, in Michie, R.C. and Williamson, P. eds., The British
Government and the City of London in the Twentieth Century, 31-58, Cambridge
University Press.
Michie, R.C. and Williamson, P. eds. (2004): The British Government And The
City Of London In The Twentieth Century, Cambridge University Press.
Mishkin, F.S. (2009): ”Is Monetary Policy Effective During Financial Crises?”,
NBER Working Papers, No. 14678.
Moore, P.G. (1981): ”The Wilson Committee Review Of The Functioning Of
Financial Institutions- Some Statistical Aspects”, Journal of the Royal Statistical
Society, 144(1), 32-65.
Moran, M. (1984): The Politics Of Banking, St. Martin’s Press Inc.
382 BIBLIOGRAPHY
Moran, M. (1984b): ”Politics, Banks And Markets: An Anglo-American
Comparison”, Political Studies, 32, 173-189.
Morris, S., Shin, H.S. (1998): ”Unique Equilibrium In A Model Of Self-Fulfilling
Currency Attacks”, The American Economic Review, 88(3), 587-597.
Muellbauer, J. (1986): ”Productivity And Competitiveness In British
Manufacturing”, Oxford Review of Economic Policy, 2(3), 1-31.
Myers, S.C. and Rajan, R.G. (1998): ”The Paradox Of Liquidity”, Quarterly
Journal of Economics, 113, 733-777.
Myerson, R.B. (2014): ”Rethinking The Principles Of Bank Regulation: A Review
Of Admati And Hellwig’s The Bankers’ New Clothes”, Journal of Economic
Literature, 52(1), 197-210.
Needham, D. (2012): ”Britain’s Money Supply Experiment, 1971-73”, Department
of Economic and Social History at the University of Cambridge Working Papers,
no. 10.
Newton, S. (2009): ”The Two Sterling Crises Of 1964 And The Decision Not To
Devalue”, Economic History Review, 62(1), 73-98.
Oliver, M.J., and Hamilton, A. (2007): ”Downhill From Devaluation: The Battle
For Sterling, 1968-1972”, Economic History Review, 60(3), 486-512.
Oulton, N. (2000): ”A Tale Of Two Cycles: Closure, Downsizing And
Productivity Growth In UK Manufacturing, 1973-89”, National Institute
Economic Review, 173, 66-79.
BIBLIOGRAPHY 383
Papanikolaou, N. I and Wolff, C.C.P (2014): ”The Role Of On- And
Off-Balance-Sheet Leverage Of Banks In The Late 2000s Crisis”, Journal of
Financial Stability, Forthcoming.
Peria, M.S.M. and Schmukler, S.L. (2001): ”Do Depositors Punish Banks For Bad
Behavior? Market Discipline, Deposit Insurance, And Banking Crises”, Journal of
Finance, 56(3), 1029-1051.
Phelps, E. (1967): ”Phillips Curves, Expectations Of Inflation And Optimal
Unemployment Over Time”, Economica, 34(135), 254-281.
”Prospect Undimmed”, in Investors Chronicle, May 9th 1969, 580-582.
Raw, C. (1977): Slater Walker: An Investigation Of A Financial Phenomenon,
Andre Deutsch Limited.
Redish, A. (2001): ”Lender Of Last Resort Policies: From Bagehot To Bailout”,
University of British Columbia Working Paper.
Reid, M. (1982): The Secondary Banking Crisis 1973-75, 2nd ed Hindsight Books
Ltd. 2003.
Reinhart, C.M. and Rogoff, K.S. (2009): This Time Is Different, Eight Centuries
Of Financial Folly, Princeton University Press.
Revell, J. (1973): The British Financial System, MacMillan Press Ltd.
Richardson, G. (2001): ”Reflections On The Conduct Of Monetary Policy”, in
Capie, F.H. and Wood, G.E. eds., Policy Makers on Policy, 19-32, Routledge
London.
384 BIBLIOGRAPHY
Rime, B. (2005): ”Do Too Big To Fail Expectations Boost Large Banks Issuer
Ratings?”, paper presented at the Workshop of the Research Task Force of the
Basel Committee in Vienna.
Rixson, S.M. (1969): ”The Sky’s The Limit”, in Accountancy, 80, 528-532.
Ronn, E.I. and Verma, A.K. (1984): ”Pricing Risk-Adjusted Deposit Insurance:
An Option-Based Model”, Journal of Finance, 41(4), 871-895.
Ronn, E.I. and Verma, A.K. (1986): ”Pricing Risk-Adjusted Deposit Insurance:
An Option-Based Model”, Journal of Finance, 41(4), 871-895.
Row, J.C.R. and Saville, I.D. (1990): A Critique Of Monetary Policy: Theory And
British Experience, Clarendon Press.
Rowan, D.C. (1973): ”The Monetary System In The Fifties And Sixties”, The
Manchester School, 41(1), 19-42.
Sander, H. and Kleimeier, S. (2003): ”Contagion And Causality: An Empirical
Investigation Of Four Asian Crisis Episodes”, Journal of International Financial
Markets, Institutions and Money, 13(2), 171-186.
Saunders, A. and Ward, C. (1976): ”Regulation, Risk And Performance Of U.K.
Clearing Banks 1965-75”, Journal of Industrial Economics, 25(2), 143-159.
Schenk, C.R. (2005): ”Crisis And Opportunity: The Policy Environment Of
International Banking In The City Of London, 1958-1980”, in Cassis, Y. and
Bussiere, E. eds., London and Paris as International Financial Centres in the
Twentieth Century.
BIBLIOGRAPHY 385
Schwartz, A.J. (2002): ”Earmarks Of A Lender Of Last Resort”, in Goodhart, C.
and Illing, G. eds., Financial Crises, Contagion, and the Lender of Last Resort: A
Reader, 449-460, Oxford University Press.
Schweikhard, F. and Tsesmelidakis, Z. (2011): ”The Impact Of Government
Interventions On CDS And Equity Markets”, AFA 2012 Chicago Meetings;
Finance Meeting EUROFIDAI - AFFI, Paris.
Scott P. (1974): ”The New Alchemy: Veblen’s Theory Of Crisis And The 1974
British Property And Secondary Banking Crisis”, Journal of Economic Issues,
30(1), 1-11.
Silver, N. (2012): The Signal And The Noise: The Art And Science Of Prediction,
Allen Lane.
Sims, C. (1980): ”Macroeconomics and Reality”, Econometrica, 48(1), 1-48.
Slater, J.D. (1977): Return To Go - My Autobiography, Morrison & Gibb Ltd.
Solow, R.M. (1985): ”Economic History and Economics”, American Economic
Review P&P, 75(2), 328-331.
Solow, R.M. (2002): ”On The Lender Of Last Resort”, in Goodhart, C. and Illing,
G. eds., Financial Crises, Contagion, and the Lender of Last Resort: A Reader,
201-212, Oxford University Press.
Sorkin, A.R. (2010): Too Big To Fail: Inside The Battle To Save Wall Street,
Penguin.
Stiglitz, J.E. (1994): ”The Role of the State in Financial Markets”, Proceedings of
the World Bank Annual Conference on Development Economics, 19-61.
386 BIBLIOGRAPHY
Stiglitz, J.E., and Weiss, A. (1981): ”Credit Rationing With Imperfect
Information”, American Economic Review, 71(3), 393-410.
Summers, L. H. (2013): ”Economic Possibilities for Our Children”, NBER
Reporter, 2013(4).
Supple, B. (1994): ”Fear Of Failing: Economic History And The Decline Of
Britain”, Economic History Review, 47(3), 441-458.
Temin, P. (2002): ”The Golden Age Of European Growth Reconsidered”,
European Review of Economic History, 6(1), 3-22.
Tempest, P. (2011): The Future of the Bank of England: A Silver Lining, Medina
Publishing Ltd.
The Bank of England (1978), Quarterly Bulletin, 18(3).
Thompson, P. (1997): ”The Pyrrhic Victory Of Gentlemanly Capitalism: The
Financial Elite Of The City Of London, 1945-90”, Journal of Contemporary
History, 32(3), 283-304.
Thornton, H. (1802): An Inquiry Into The Nature And Effects Of The Paper
Credit Of Great Britain, Kessinger Publishing, LLC.
Tiratsoo, N. and Tomlinson, J. (1997): ”Exporting The ”Gospel Of Productivity”:
United States Technical Assistance And British Industry 1945-1960”, Business
History Review, 71(1), 41-81.
Tomlinson, J. (1984): ”A ”Keynesian Revolution” In Economic Policy-Making?”,
Economic History Review, 37(2), 258-262.
BIBLIOGRAPHY 387
Tomlinson, J. (2008): ”Economic Policy”, in Floud, R. and Johnson, P. eds., The
Cambridge Economic History of Modern Britain: Volume 3, 189-212, Cambridge
University Press.
Tsay, R.S. (2005): Analysis Of Financial Time Series, John Wiley & Sons Inc.,
2nd edition.
Turner, A. (2010): ”What Do Banks Do? Why Do Credit Booms and Busts
Occur? What Can Public Policy Do About It?”, in several eds., The Future of
Finance, 3-63, LSE and the London Publishing Partnership.
Turner, J.D. (2012): ”British Banking Stability and Bank Capital in the Long
Run”, Bankhistorisches Archiv, 38(1), 35-57.
Upper, C. and Worms, A. (2004): ”Estimating Bilateral Exposures In The
German Interbank Market: Is There A Danger Of Contagion?”, European
Economic Review, 48, 827-849.
Van Horne, J.C. (1985): ”Of Financial Innovation And Excesses”, The Journal of
Finance, 40(3), 620-631.
Vonyo, T. (2008): ”Post-War Reconstruction And The Golden Age Of Economic
Growth”, European Review of Economic History, 12(2), 221-241.
Wass, D. (2008): Decline To Fall: The Making Of British Macro-Economic Policy
And The 1976 IMF Crisis, Oxford University Press.
Watson, K. (2008): ”The Financial Services Sector Since 1945”, in Floud, R. and
Johnson, P. eds., The Cambridge Economic History of Modern Britain: Volume 3,
167-188, Cambridge University Press.
388 BIBLIOGRAPHY
Weil, P. (1989): ”The Equity Premium Puzzle and the Risk-Free Rate Puzzle”,
Journal of Monetary Economics, 24, 401-421.
Wesson, B. (1985): Bank Capital And Risk : A Survey Of The London Clearing
Banks Groups 1976-1983, London Institute of Bankers.
Williamson, J. (1973): ”Surveys In Applied Economics: International Liquidity”,
The Economic Journal, 83(331), 685-746.
Yellen, J.L. (2013): Interconnectedness And Systemic Risk: Lessons From The
Financial Crisis And Policy Implications, speech given at the American Economic
Association/American Finance Association Joint Luncheon, San Diego, California,
January 4th.