Embed Size (px)
Citation preview

5 Material-Removal Mechanisms in Abrasive Water-Jet Machining
5.1 Erosion by Single Solid-Particle Impact
5.1.1 General Aspects of Solid-Particle Impact
The impact of single solid-particles is the basic event in the material removal by abrasive water jets. Therefore, a compressed review on the material erosion by solid-particle is given in this paragraph.
The literature about solid-particle erosion is extensive. Engel [149], Adler [150], and Preece [151] present general reviews about earlier investigations. More recently, Elleerma [152] and Meng and Ludema [153] analyze the state-of-the-art modeling of the solid-particle erosion.
Figure 5.1 Mechanisms of material-removal by solid-particle erosion [153 J
Meng and Ludema [153] define four sub-mechanisms by which solid-particles separate material from a target surface (Figure 5.1). These mechanisms are cutting, fatigue, melting, and brittle fracture. Clearly, these mechanisms generally do not act separately, but in combination. Their importance for the particular erosion process depends on several factors, such as the impact angle, the particle kinetic energy, the particle shape, target-material properties, and environmental conditions. Nevertheless, all four mechanisms are observed during the abrasive water-jet cutting and at least three of them are applied for the material removal modeling of the abrasive water-jet machining process (chapters 6 and 9).
The solid-particle erosion process is generally characterized by a non-dimensional erosion-number, EN,
A. W. Momber et al., Principles of Abrasive Water Jet Machining© Springer-Verlag London Limited 1998
90 5. Material-Removal Mechanisms in Abrasive Water-Jet Machining
E =mM N • (5.1)
mp
Thus, the removed volume per solid particle is
(5.2)
The following sections briefly review selected solutions for Eq. (5.2) for ductile as well as brittle-behaving materials are.
5.1.2 Erosion of Ductile-Behaving Materials
5.1.2.1 Generalized Erosion Equation
Magnee [154] suggests a generalization of solid-particle erosion models for ductilebehaving materials as
(5.3)
This equation is illustrated on two examples that playa role in chapter 6 where the abrasive water-jet cutting models are discussed.
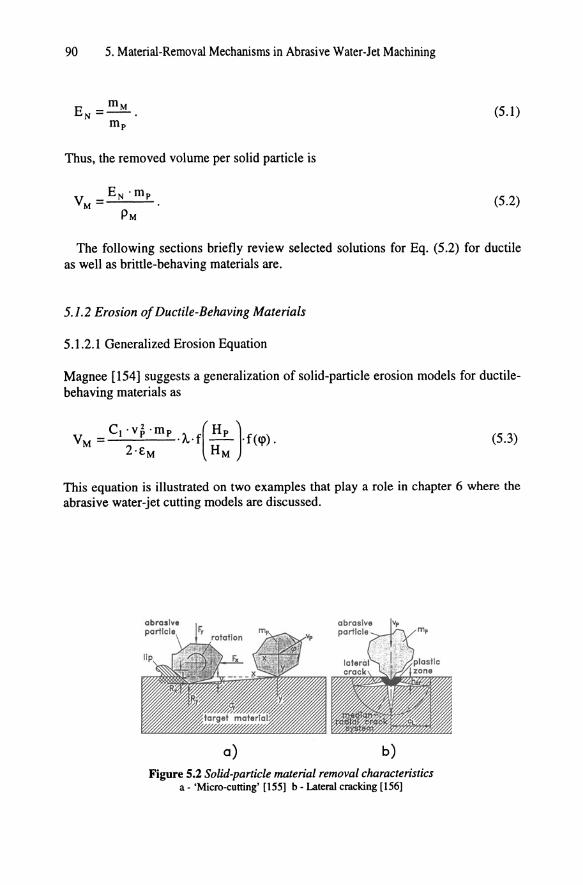
a) b) Figure 5.2 Solid-particle material removal characteristics
a - 'Micro-cutting' [155] b - Lateral cracking [156]
5.1 Erosion by Single Solid-Particle Impact 91
5.1.2.2 'Micro-Cutting' Model
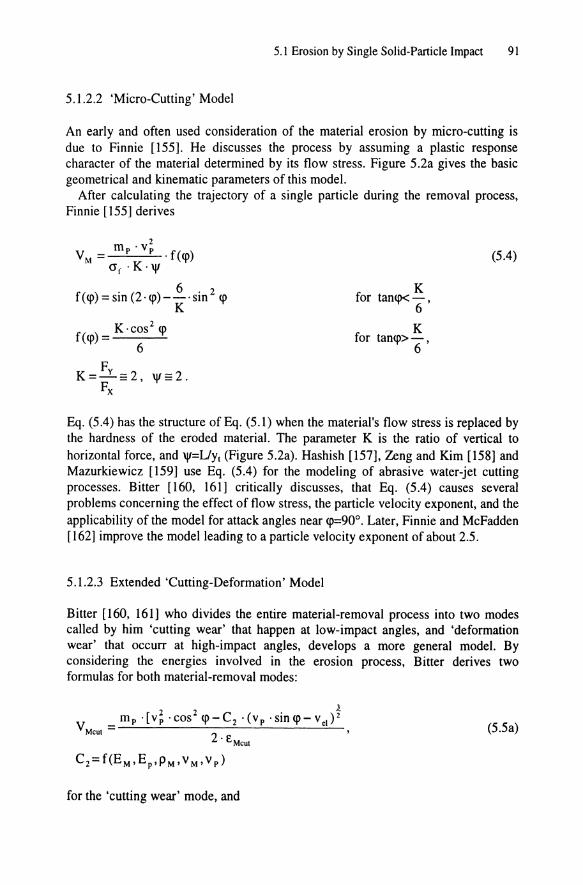
An early and often used consideration of the material erosion by micro-cutting is due to Finnie [155]. He discusses the process by assuming a plastic response character of the material determined by its flow stress. Figure 5.2a gives the basic geometrical and kinematic parameters of this model.
After calculating the trajectory of a single particle during the removal process, Finnie [155] derives
2 VM = mp .v p .f(<p)
crf·K·\jI
f(<p) = sin (2· <p) -~. sin 2 <p K
f ( <p) = K· cos 2 <p 6
F K=~=2, \jI=2.
Fx
K for tan<p< - ,
6
K for tan<p> - ,
6
(5.4)
Eq. (5.4) has the structure of Eq. (5.1) when the material's flow stress is replaced by the hardness of the eroded material. The parameter K is the ratio of vertical to horizontal force, and \jI=UYI (Figure 5.2a). Hashish [157], Zeng and Kim [158] and Mazurkiewicz [159] use Eq. (5.4) for the modeling of abrasive water-jet cutting processes. Bitter [160, 161] critically discusses, that Eq. (5.4) causes several problems concerning the effect of flow stress, the particle velocity exponent, and the applicability of the model for attack angles near <p=90°. Later, Finnie and McFadden [162] improve the model leading to a particle velocity exponent of about 2.5.
5.1.2.3 Extended 'Cutting-Deformation' Model
Bitter [160, 161] who divides the entire material-removal process into two modes called by him 'cutting wear' that happen at low-impact angles, and 'deformation wear' that occurr at high-impact angles, develops a more general model. By considering the energies involved in the erosion process, Bitter derives two formulas for both material-removal modes:
221 m . [v . cos in - C . (v . sin in - v ) 2 V -p P 'I' 2 P 'I" el Melli - 2
• tMelll
C 2 = f(E M , Ep,PM' V M , V p)
for the 'cutting wear' mode, and
(5.5a)

92 5. Material-Removal Mechanisms in Abrasive Water-let Machining
(5.5b)
for the 'deformation wear' mode. For certain conditions, Eq. (5.5a) is identical to Eq. (5.4). Neilson and Gilchrist [163] simplify this model. The disadvantage of the model is that it requires experimentally determined parameters for a complete application.
5.1.2.4 'Ploughing-Deformation' -Model
Hutchings [164] introduces an alternative discussion of the micro-cutting processes during the solid-particle erosion. Based on high-speed photographs and SEMobservations, he defines two modes of material-removal due to micro-cutting, such as cutting-deformation and ploughing-deformation (Figure 5.3). The ploughingdeformation mode dominates the material removal by spherical particles; whereas, cutting-deformation is significant for sharp-edged, angular particles. Hutchings [164] makes a further subdivision of the cutting deformation into Type I cuttingdeformation and Type II cutting-deformation, depending on the direction of the particle rotation (see Figure 5.3). For forward rotating particles Type I is dominant, and for backward rotation Type II is valid.
~ ploughing deformation
cutting deformation
type I ----'-D-~\/7--:;:O---type 11 __ --===============;0--
Figure: 5.3 'Cutting' and 'ploughing' by solid particles at oblique impact angles {J64, 165J
5.1 Erosion by Single Solid-Particle Impact 93
5.1.2.5 Low-Cycle Fatigue and Thermal Effects
Hutchings [166] developed a solid-particle erosion model for normal impact that is based on low-cycle fatigue; although earlier attempts are made by Edington and Wright [167].
The plastic work associated with the deformation of a material around the impact site largely degrades into heat. Hutchings and Levy [168] give a recent review about the thermal effects in solid-particle erosion of ductile materials. It appears from their discussion that thermally determined features of the solid-particle erosion process are not a necessary assumption under all impact conditions. With smaller particles at low impact velocities, thermal effects are not important.
5.1.2.6 Comparison of Models for Ductile-Behaving Materials
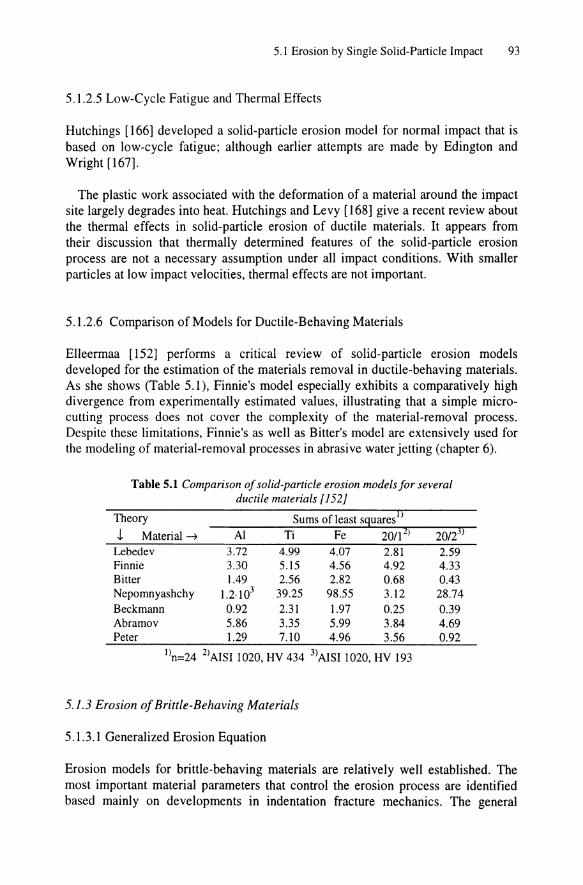
Elleermaa [152] performs a critical review of solid-particle erosion models developed for the estimation of the materials removal in ductile-behaving materials. As she shows (Table 5.1), Finnie's model especially exhibits a comparatively high divergence from experimentally estimated values, illustrating that a simple microcutting process does not cover the complexity of the material-removal process. Despite these limitations, Finnie's as well as Bitter's model are extensively used for the modeling of material-removal processes in abrasive water jetting (chapter 6).
Table 5.1 Comparison of solid-particle erosion models for several ductile materials [152J
Theory Sums of least squares I) J, Material ~ Al Ti Fe 2011 2) 20/23)
Lebedev 3.72 4.99 4.07 2.81 2.59 Finnie 3.30 5.15 4.56 4.92 4.33 Bitter l.49 2.56 2.82 0.68 0.43 Nepomnyashchy l.2·103 39.25 98.55 3.12 28.74 Beckmann 0.92 2.31 1.97 0.25 0.39 Abramov 5.86 3.35 5.99 3.84 4.69 Peter 1.29 7.10 4.96 3.56 0.92
l)n=24 2)AISI 1020, HV 434 3)AISI 1020, HV 193
5.1.3 Erosion of Brittle-Behaving Materials
5.1.3.1 Generalized Erosion Equation
Erosion models for brittle-behaving materials are relatively well established. The most important material parameters that control the erosion process are identified based mainly on developments in indentation fracture mechanics. The general
94 5. Material-Removal Mechanisms in Abrasive Water-Jet Machining
equation for the material removal in brittle-behaving materials, especially in
ceramics, by an impacting solid particle is
(5.6)
The schematics in Figure 5.2b illustrates the essential features of Eq. (5.6). Eq. (5.6) can be solved by finding relations between the crack-formation geometry and the main process parameters of the erosion process.
5.1.3.2 Elastic Model
Sheldon and Finnie [169] propose a purely elastic model and assume that erosion occurs entirely by crack propagation and chipping as a result of contact stresses during impact. These stresses cause cracks to growth from pre-existing cracks in the material surface. Nevertheless, the model neglects the lateral crack formation which is the main cause of material removal during solid-particle erosion.
5.1.3.3 Elastic-Plastic Models
The erosion model developed by Evans et al. [170], and the elastic-plastic theory of Wiederhorn and Lawn [171] calculate the volume loss from the depth of particle penetration and the maximum size of the lateral cracks that forms during impact (Figure 5 .2b). They assume that the depth of the lateral cracks is proportional to the radial-crack size.
5.1.3.4 Grain-Ejection Model
Ritter [172] notices on polycrystalline alumina ceramics a material removal by individual grain ejection from the surface. This process is modeled by arguing that a fraction of the solid-particle kinetic energy is used in grain-boundary cracking.
5.1.3.5 Comparison of Models for Brittle-Behaving Materials
Most of the models developed for the erosion by brittle fracture follow the general relation,
(5.7)
Table 5.2 lists the power exponents of the different models related to Eq. (5.7)

5.2 Micro-Mechanisms of Abrasive-Particle Material Removal 95
Table 5.2 Dry solid particle erosion models for brittle-behaving materials, Eq. (5.7)
Basic Reference C2 C3 C4 C5 C6
Elastic model Sheldon and Finnie f(M) f(M) [169]
Quasi-static lateral Wiederhom and 3.67 2.45 0.11 -1.33 crack model Lawn [171] Dynamic lateral Evans et al. [170] 3.67 3.17 -0.25 -1.33 crack model Modified lateral Marshall et al. 3.50 2.33 -1.42 -1.00 1.25 crack model [173] Grain ejection Ritter [172] 3.00 2.00 -2.00 1.00 model Indentation model Buijs [156] -1.42 -1.00 1.25
Whereas, the elastic theory of Sheldon and Finnie assumes that the power exponents are functions of the target-material properties (especially of the Weibull-distribution parameters), the elastic-plastic models treat the power exponents independently of the target material. The models listed in Table 5.2 are directly valid for the case of normal impact of the solid particles.
5.2 Micro-Mechanisms of Abrasive-Particle Material Removal in Abrasive Water Jet Machining
5.2.1 Observations on Ductile-Behaving Materials
5.2.1.1 SEM-Observations
Kovacevic et al. [174], Webb and Rajukar [174], Kovacevic [176], and Arola and Ramulu [177] perform systematic SEM-observations for ductile-behaving materials. In stainless steel, Kovacevic et al. [174] and Kovacevic [176] detect separated wear tracks plowed by single abrasive grains due to scratching and scooping. The widths of these tracks are related to the size of the abrasive particles but non-uniform. This non-uniformity attributes to the particle-size distribution of the abrasives as they leave the focus and hit the material surface. The tracks are vertical on the top region of the cut but start to incline at deeper locations. Webb and Rajukar [174] make the same observations in an inconel cut by an abrasive water jet. Arola and Ramulu [177] detect chip formation and plowing as important material-removal mechanisms in a titanium cut by an abrasive water jet. Also, they find that the length of the path of the single abrasive particles in the workpiece decreases, and the randomness of the path orientation increases as the depth of cut increases. Ramulu et al. [126] observe in an aluminum cut by an abrasive water jet under shallow impact angles ( <p=5°-200) that abrasive-particle impacts are randomly oriented and appear to have different impact angles.

96 5. Material-Removal Mechanisms in Abrasive Water-let Machining
E E It) II r.
0-S! . I'CI
Figure 5.4 SEM-images from different locations of the cutting front [180 J
E E It) (\I II r.
"
E E I/) ... II r.
IJ

5.2 Micro-Mechanisms of Abrasive-Particle Material-Removal
E E II) II
..c:
.c
Q.
S
Figure 5.5 SEM-images from different locations of the cutting surface [180 J
97
E E II)
c;r ..c:
E E
10-;
II ..c: (.)

98 5. Material-Removal Mechanisms in Abrasive Water-Jet Machining
Zeng and Kim [178] observe material removal by a fully plastic flow in stainless steel subjected to an abrasive water jet at low (<p=200) impact angles. Also, they notice smaller craters distributed around the major crater that are produced by fractured abrasive particles. Summers et al. [179] indicate clear evidence of microcutting and shearing in ductile metals eroded by a suspension-abrasive water jet.
Guo [180] uses SEM-microscopy to intensively examine the erosion sites in several metals, such as aluminum-alloy, titanium alloy, and ferrite steel, on the cutting front as well as on the generated kerf wall. Figure 5.4 shows the results from the cutting-front observations. In the very immediate top zone (Figure 5.4a), up to a depth of 300 Jlm to 400 Jlm, the wear tracks are comparatively bright, short and deep. Very clearly, the formation of material lips is noticed at the end of the tracks. In the second stage (Figure 5.4b), the tracks are longer and shallower and do show a uniform orientation, preferably in the jet direction. As the jet moves forward into the material (Figure 5.4c,d), the general micro-mechanism does not change, but the orientation of the wear tracks becomes non-regular. Even if the tracks are deeper and lip formation can be observed again, micro-cutting is still the dominating material-removal process. The photographs taken from the kerf wall of the same specimens (Figure 5.5) exhibit identical characteristics.
Figure 5.6 that shows a polished cross section of a steel specimen subjected to an abrasive water jet, supports the assumption of a micro-machining process in the abrasive water jet cutting of ductile-behaving materials as described previously for dry solid-particle erosion. The damage profile is very similar to that for microploughing shown in Figure 5.3. The marked lip on the left side of the crater is later removed by other impacting particles. In the result, a chip is generated. The summary of all generated microchips determines the removed material mass.
Figure 5.6 Polished cross section of a steel specimen indicating micro-ploughing (Univ. Hannover, IW)
5.2 Micro-Mechanisms of Abrasive-Particle Material-Removal 99
5.2.1.2 Stress Measurements
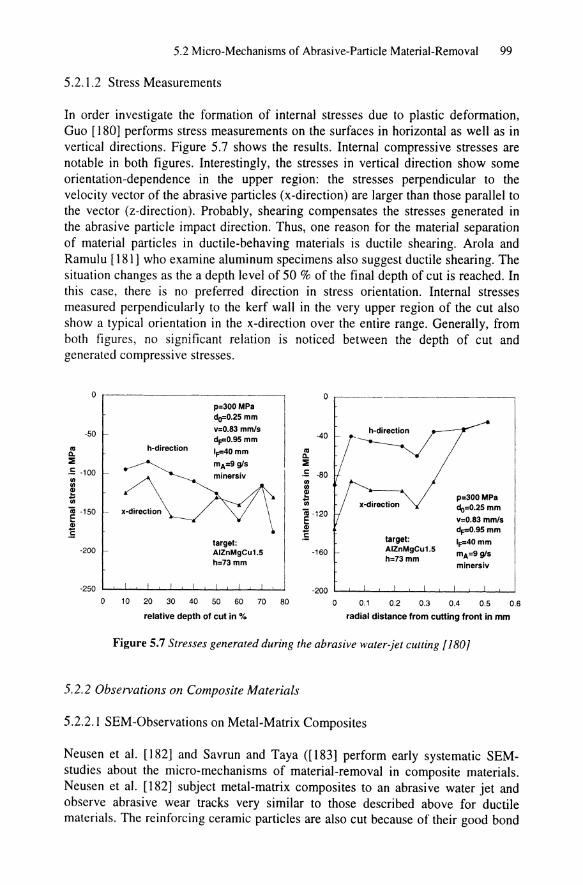
In order investigate the formation of internal stresses due to plastic deformation, Guo [180] performs stress measurements on the surfaces in horizontal as well as in vertical directions. Figure 5.7 shows the results. Internal compressive stresses are notable in both figures. Interestingly, the stresses in vertical direction show some orientation-dependence in the upper region: the stresses perpendicular to the velocity vector of the abrasive particles (x-direction) are larger than those parallel to the vector (z-direction). Probably, shearing compensates the stresses generated in the abrasive particle impact direction. Thus, one reason for the material separation of material particles in ductile-behaving materials is ductile shearing. Arola and Ramulu [181] who examine aluminum specimens also suggest ductile shearing. The situation changes as the a depth level of 50 % of the final depth of cut is reached. In this case, there is no preferred direction in stress orientation. Internal stresses measured perpendicularly to the kerf wall in the very upper region of the cut also show a typical orientation in the x-direction over the entire range. Generally, from both figures, no significant relation is noticed between the depth of cut and generated compressive stresses.
0,-------------,
-50
~ :; .5 -100 III III ~ r;; iij -150 E ~
-200
h-direction
x-direction
p=300 MPa do=0.25 mm
v=0.83 mm/s d""O.95 mm 1",,40 mm
mA=9 g/s minersiv
target: AIZnMgCu1.5 h=73mm
o 10 20 30 40 50 60 70 80
relative depth of cut in %
.. Q. :;
o
-40
.5 -80 .. ~ r;;
1-120
-160
o 0.1
target: AIZnMgCu1.5 h=73mm
p=300 MPa 110=0-25 mm
v=0.83 mm/s d",,0.95 mm
1.-40mm
mA=9 g/s minersiv
0.2 0.3 0.4 0.5 0.6
radial distance from cutting front in mm
Figure 5.7 Stresses generated during the abrasive water-jet cutting { 180]
5.2.2 Observations on Composite Materials
5.2.2.1 SEM-Observations on Metal-Matrix Composites
Neusen et al. [182] and Savrun and Taya ([183] perform early systematic SEMstudies about the micro-mechanisms of material-removal in composite materials. Neusen et al. [182] subject metal-matrix composites to an abrasive water jet and observe abrasive wear tracks very similar to those described above for ductile materials. The reinforcing ceramic particles are also cut because of their good bond
100 5. Material-Removal Mechanisms in Abrasive Water-Jet Machining
to the matrix. Savrun and Taya [183] and Ramulu et al. [126] detect an erosion of the matrix material by micro-cutting, but the ceramic grains are pulled out rather than cut. Savrun and Taya additionally observe micro-melting in some areas of the metal-matrix material. Hamatani and Ramulu [184] detect scooping and ploughing even at the bottom of metal-matrix composites. This result indicates that these mechanisms dictates the material-removal process over the entire cutting front.
Investigations by Schwetz et al. [113] on boron-carbide ceramics and metalmatrix composites show that the micro-damage in a particular material depends mainly on its microstructure. In a tungsten-carbide composite, for example, the cobalt binder is removed; then, the tungsten-carbide grains are plucked out in a grain-by-grain mode. Neither plastic deformation nor cracking is observed. In contrast, in fine grained boron-carbide, a brittle fracture is noticed. The predominant features of this failure mode are local pits formed from lateral cracking. In a typical matrix-grain compound, such asa boron-carbide reinforced by titanium-boride, the material is eroded by a mixed inter-/trans-granular mechanism. Because of the weak interfaces, the grains are separated from the matrix. Then, the boron-carbide matrix trans-granularly cracks.
5.2.2.2 SEM-Observations on Fiber-Reinforced Composites
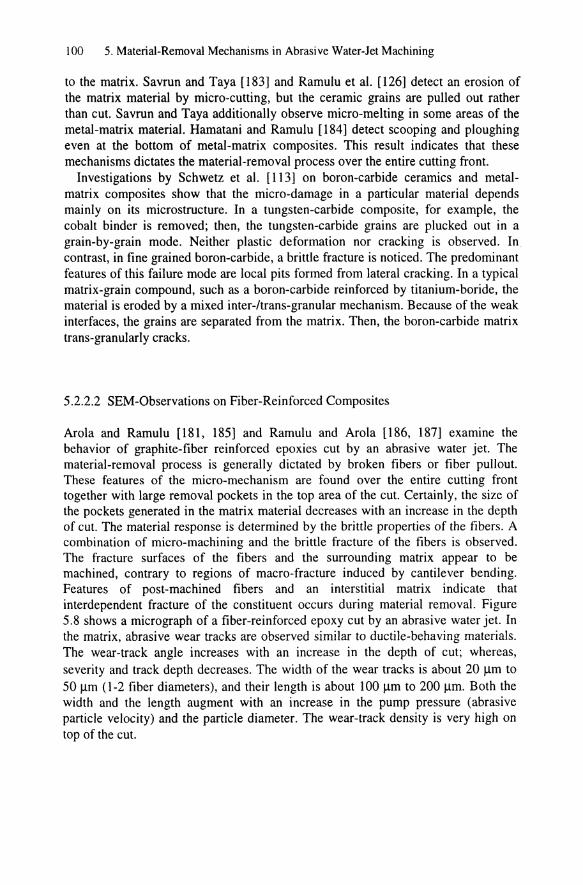
Arola and Ramulu [181, 185] and Ramulu and Arola [186, 187] examine the behavior of graphite-fiber reinforced epoxies cut by an abrasive water jet. The material-removal process is generally dictated by broken fibers or fiber pullout. These features of the micro-mechanism are found over the entire cutting front together with large removal pockets in the top area of the cut. Certainly, the size of the pockets generated in the matrix material decreases with an increase in the depth of cut. The material response is determined by the brittle properties of the fibers. A combination of micro-machining and the brittle fracture of the fibers is observed. The fracture surfaces of the fibers and the surrounding matrix appear to be machined, contrary to regions of macro-fracture induced by cantilever bending. Features of post-machined fibers and an interstitial matrix indicate that interdependent fracture of the constituent occurs during material removal. Figure 5.8 shows a micrograph of a fiber-reinforced epoxy cut by an abrasive water jet. In the matrix, abrasive wear tracks are observed similar to ductile-behaving materials. The wear-track angle increases with an increase in the depth of cut; whereas, severity and track depth decreases. The width of the wear tracks is about 20 /lm to 50 /lm (1-2 fiber diameters), and their length is about 100 /lm to 200 /lm. Both the width and the length augment with an increase in the pump pressure (abrasive particle velocity) and the particle diameter. The wear-track density is very high on top of the cut.

5.2 Micro-Mechanisms of Abrasive-Particle Material-Removal 101
Figure 5.8 Material-removal characteristics in afiber-reinforced epoxy (Univ. of Washington, Seattle)
5.2.3 Observations on Brittle-Behaving Materials
5.2.3.1 SEM-Observations on Polycrystalline Ceramics
Zeng and Kim [158, 178] conduct an extensive SEM-study into the behavior of polycrystalline (aluminum oxide) ceramic. Through grooving experiments, sweeping experiments, and cutting experiments by an abrasive water jet under low (<p=200) and perpendicular impact angles, they identify a mixed material-removal mode that consists of brittle-fracture phenomena and plastic deformation. For the low impact angle, they mainly indicate scratching marks by single abrasive grains but also some inter-granular cracking. In contrast, inter-granular fracture dominates the material removal at perpendicular impact angles. Under this condition, it is observed that some material grains undergo densification that indicate the effects of plastic deformation. Traces of plastic flow are present, but considerably smaller and shorter than those for low impact angles.
102 5. Material-Removal Mechanisms in Abrasive Water-Jet Machining
5.2.3.2 SEM-Observations on Refractory Ceramics
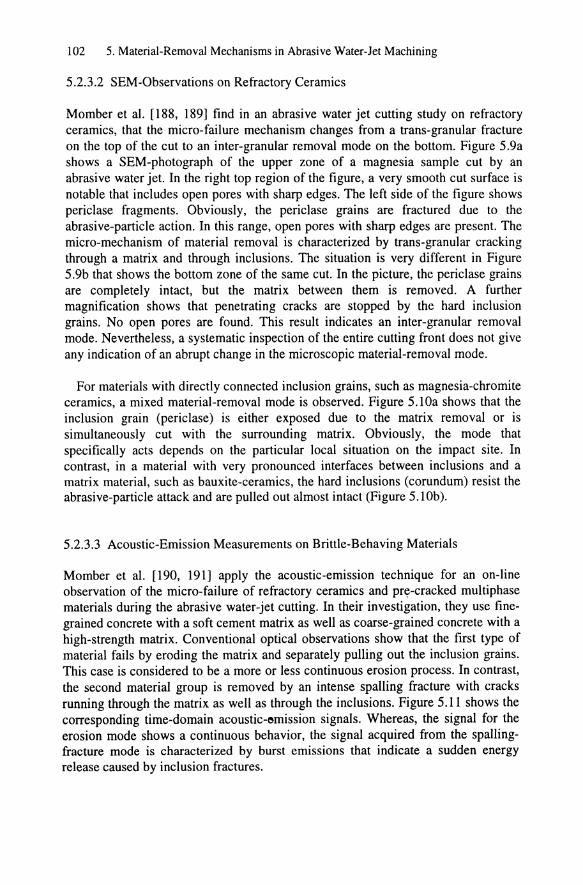
Momber et al. [188, 189] find in an abrasive water jet cutting study on refractory ceramics, that the micro-failure mechanism changes from a trans-granular fracture on the top of the cut to an inter-granular removal mode on the bottom. Figure 5.9a shows a SEM-photograph of the upper zone of a magnesia sample cut by an abrasive water jet. In the right top region of the figure, a very smooth cut surface is notable that includes open pores with sharp edges. The left side of the figure shows periclase fragments. Obviously, the periclase grains are fractured due to the abrasive-particle action. In this range, open pores with sharp edges are present. The micro-mechanism of material removal is characterized by trans-granular cracking through a matrix and through inclusions. The situation is very different in Figure 5.9b that shows the bottom zone of the same cut. In the picture, the periclase grains are completely intact, but the matrix between them is removed. A further magnification shows that penetrating cracks are stopped by the hard inclusion grains. No open pores are found. This result indicates an inter-granular removal mode. Nevertheless, a systematic inspection of the entire cutting front does not give any indication of an abrupt change in the microscopic material-removal mode.
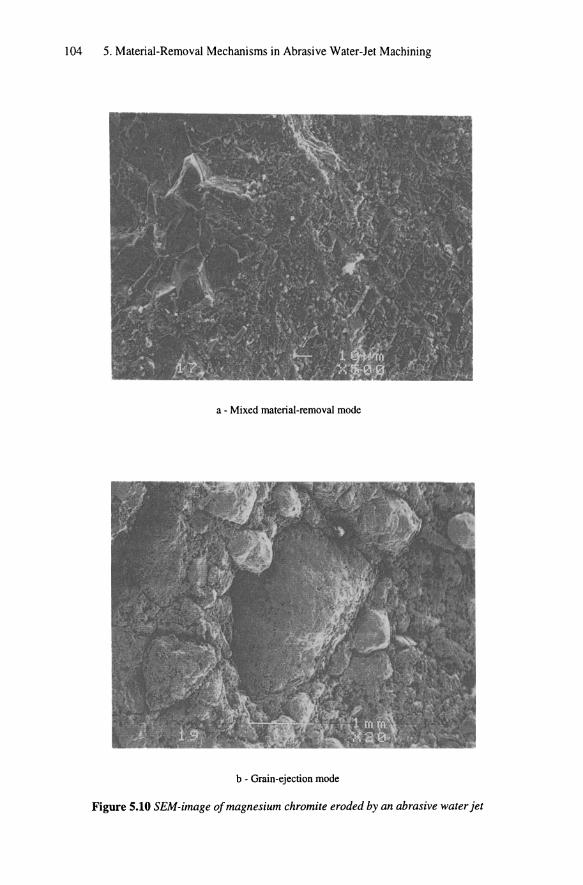
For materials with directly connected inclusion grains, such as magnesia-chromite ceramics, a mixed material-removal mode is observed. Figure 5.lOa shows that the inclusion grain (periclase) is either exposed due to the matrix removal or is simultaneously cut with the surrounding matrix. Obviously, the mode that specifically acts depends on the particular local situation on the impact site. In contrast, in a material with very pronounced interfaces between inclusions and a matrix material, such as bauxite-ceramics, the hard inclusions (corundum) resist the abrasive-particle attack and are pulled out almost intact (Figure 5.lOb).
5.2.3.3 Acoustic-Emission Measurements on Brittle-Behaving Materials
Momber et al. [190, 191] apply the acoustic-emission technique for an on-line observation of the micro-failure of refractory ceramics and pry-cracked multiphase materials during the abrasive water-jet cutting. In their investigation, they use finegrained concrete with a soft cement matrix as well as coarse-grained concrete with a high-strength matrix. Conventional optical observations show that the first type of material fails by eroding the matrix and separately pulling out the inclusion grains. This case is considered to be a more or less continuous erosion process. In contrast, the second material group is removed by an intense spalling fracture with cracks running through the matrix as well as through the inclusions. Figure 5.11 shows the corresponding time-domain acoustic-emission signals. Whereas, the signal for the erosion mode shows a continuous behavior, the signal acquired from the spallingfracture mode is characterized by burst emissions that indicate a sudden energy release caused by inclusion fractures.

5.2 Micro-Mechanisms of Abrasive-Particle Material-Removal 103
a - Top region
b - Bottom region
Figure 5.9 SEM-images of a sintered-magnesia specimen cut by an abrasive water jet
104 5. Material-Removal Mechanisms in Abrasive Water-let Machining
a - Mixed material-removal mode
b - Grain-ejection mode
Figure 5.10 SEM-image o/magnesium chromite eroded by an abrasive water jet

> .:: ii c: en 'iii W <{ ., £ a ., .., .~ Q. E
'"
4 3
2 1 o
-1 -2 -3
5.2 Micro-Mechanisms of Abrasive-Particle Material-Removal 105
: ... ..... . .... : ~ erosion mode
. . . -4 ................ .. .......... . , .... ... . . . . .. ... .... ... ... .
8
4 2 o
-2 -4 -8 -8 ow • • •••••••••• w·o •• •• •••• • ••• ~ •••••• • • •••• • •••••• • ••••• • • \
0.00 0.26 0.61 0.77 1.02
exposure time in ms
Figure 5.11 Acoustic-emission signals, acquired in pre-cracked multiphase materials during the cuttting by an abrasive water jet [190J
5.2.3.4 Photoelasticity Investigations on Brittle-Behaving Materials
Ramulu [192] who carries out photoelastic studies on materials subjected to an abrasive water-jet impact, supposes a different concept for the material removal in brittle materials. During piercing experiments in polycarbonate specimens, he detects stress-wave propagation immediately after the jet impact (Figure 5.12). These stress waves are probably due to the impact of the water phase. Cracks that are generated during this event are eroded by the abrasive particles that follow the water impact with a short delay.
5.2.3.5 Microboiling in Ceramics and Metal-Matrix Composites
Kahlmann et al. [193] who find molten garnet smeared over the surfaces of materials cut by an abrasive water jet, discusses an alternative material-removal mechanism for metal-matrix composites and ceramics. The smeared garnet that follows the direction of the jet flow, contains small holes with diameters <1.0 mm as a result of micro-boiling. The iron distribution, measured by dispersive spectrometry-mapping, increases with an increase of the slope of the cutting front. Because garnet melts at very high temperatures (=1,280 0q, the authors assume the existence of a high, localized temperature that is generated by friction between the abrasive particles and the cutting front. This heated zone suddenly cools down by the following excess water-flow that creates fracture due to thermal spalling. It is

106 5. Material-Removal Mechanisms in Abrasive Water-let Machining
observed that whisker-reinforced ceramics are more resistant against this damage mode. Because of their high thermal conductivity, the whiskers act as microscale heat sinks that draw heat away from the surface into the specimen.
0.075 sec
0.275 sec
0.475 sec
0.675 sec
Figure 5.12 Photoelastic records 0/ a polyethylene specimen impacted by an abrasive water jet (Univ. o/Washington, Seattle)

5.2 Micro-Mechanisms of Abrasive-Particle Material-Removal 107
5.2.3.6 Observations on Glass
For homogeneous brittle materials, such as glass, no systematic inspection of the micro-mechanisms involved in the material-removal is yet performed. Figure 5.13a shows a micrograph of an abrasive-particle impact on a glass surface. This figure illustrates that lateral cracking is one possible material-removal mechanism. Acoustic-emission signals from glass show comparatively continuous structures (Figure 5.13b) illustrating the generation of a continuously growing microcrack network.
a - Optical micrograph of a crater created in glass
3C f 2Q
glass
> : .0 E .. ."
a 0.0 Q. E .. ti -: .0 c
'" Ii
-: j l I
-3 .) 0.00 0.50 i .ec
exposing time In ms
b - Time-domain acoustic-emission signal
Figure 5.13 Micromechanisms of material removal in glass (UK, CRMS, Lexington)
108 5. Material-Removal Mechanisms in Abrasive Water-Jet Machining
5.3 Material Removal by the High-Speed Water Flow
5.3.1 General Observations
The role of the high-speed water flow during the material removal by an abrasive water jet is a phenomenon that is not yet completely understood. Some authors consider the water to be a carrier-and-acceleration medium for the entrained abrasive particles [157]. A wide range of metallic materials that can not be cut by plain water jets proves this assumption.
Nevertheless, several authors present experimental evidence for a direct contribution of the water flow on the material-removal process in ductile-behaving as well as in brittle-behaving materials. Summers et al. [179] impact steel samples with jets of plain water at high pump pressure (p=210 MPa). Through SEMobservation, the authors find a clear track across the sample with pittings at the surface and water-jet penetration along the crystal boundaries. Ramulu [192] suggest a combined action of the abrasive particles and a 'water wedge' during the piercing of brittle compound materials by an abrasive water jet. Whereas the impacting abrasive particles create micro-cracking, the high-speed water enters these cracks and wides them due to hydrostatic forces.
5.3.2 Observations on Pre-Cracked Materials
5.3.2.1 Effect of 'Water Wedging'
Pre-cracked materials and materials containing a certain degree of instabilities, such as micro-cracks and pores, can be cut effectively with plain water jets at commercial pressure ranges [194, 195]. In a classical experiment, it is shown that a pre-cracked material can not be damaged by a plain water jet if the surface is covered by a very thin metal layer that prevents the high-velocity water flow from entering the cracks and pores. If the layer is removed, the material fails by internal stresses that are created in the material by the penetrating water stream [196].
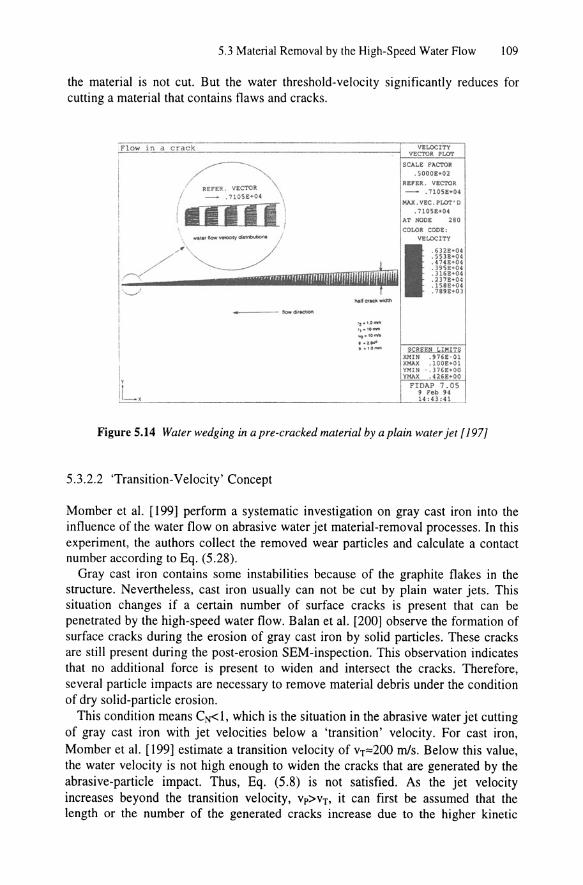
Momber and Kovacevic [195, 198] and Momber et al. [197] suggest that the water enters a crack with high velocities and generates stresses on the crack walls. As far as the intensity of these stresses exceeds the critical local material-resistance parameters, such as the fracture toughness, the crack grows. An intersection of several cracks forms a micro-crack network and wear particles. Figure 5.14 illustrates this mechanism. Wiedemeier [3] and Momber and Kovacevic [195] show for the water-jet cutting of brittle materials that
(5.8)
In the equation, VOCr is the critical threshold velocity of the water flow. For an undamaged material with lCFO, the threshold water-jet velocity, VOcn is infinite and
5.3 Material Removal by the High-Speed Water Flow 109
the material is not cut. But the water threshold-velocity significantly reduces for cutting a material that contains flaws and cracks.
IFlow in d crack
I (
I
! //'~' 1
18 T "IIW1WlUIWIJIUWIQWUwW$iIIil
tt.aJfCfIdl...m'l
- -- -"'"""'" I
I I Iv
IL.
'1,1.0-t ,~ 'It_
"'(1,'0-t . t. .... ,,1'0_
VEt..OCITY VECTOR PLOT
SCAt.E FACTOR
. SOOO£·02 R!:fER . VECTOR
- .1105£·04
KAlL VEe. PL01" 0
. 110SE*04 AT NODE 280
COLOR CODE: VEL.OCITY
SC REeN LIMITS X.rHN ."6E,01 XI".AX .1 00£.01 YM1N -. J1'£.00 YMAX .426£"00
FIDAP 7.05 j F'ecb 94 U:41:H
Figure 5.14 Water wedging in a pre-cracked material by a plain water jet [197)
5.3.2.2 'Transition-Velocity' Concept
Momber et al. [199] perform a systematic investigation on gray cast iron into the influence of the water flow on abrasive water jet material-removal processes. In this experiment, the authors collect the removed wear particles and calculate a contact number according to Eq. (5.28).
Gray cast iron contains some instabilities because of the graphite flakes in the structure. Nevertheless, cast iron usually can not be cut by plain water jets. This situation changes if a certain number of surface cracks is present that can be penetrated by the high-speed water flow. Balan et al. [200] observe the formation of surface cracks during the erosion of gray cast iron by solid particles. These cracks are still present during the post-erosion SEM-inspection. This observation indicates that no additional force is present to widen and intersect the cracks. Therefore, several particle impacts are necessary to remove material debris under the condition of dry solid-particle erosion.
This condition means CNd, which is the situation in the abrasive water jet cutting of gray cast iron with jet velocities below a 'transition' velocity. For cast iron, Momber et al. [199] estimate a transition velocity of vT",,200 mls. Below this value, the water velocity is not high enough to widen the cracks that are generated by the abrasive-particle impact. Thus, Eq. (5.8) is not satisfied. As the jet velocity increases beyond the transition velocity, Vp>VT, it can first be assumed that the length or the number of the generated cracks increase due to the higher kinetic

110 5. Material-Removal Mechanisms in Abrasive Water-Jet Machining
energy of the impacting abrasive particles. Additionally, the water-flow velocity increases. A certain combination of both effects fulfills Eq. (5.8) that allows the water flow to directly contribute to the material-removal process. The water opens isolated cracks and creates a crack network. Okada et al. [201] shows for the cavitation erosion of cast iron that the embedded graphite flakes support this process. Assuming dynamic fragmentation, the average fragment size reduces with an increase in the loading intensity [101] (Table 3.3). With an increase in the material-removal rate and a decrease in the average wear-particle size, the number of removed target particles increase. Figure 5.15 shows that this increase yields larger contact numbers for higher pump pressures.
5.3.2.3 Pocket Formation in Soft Materials
Momber et al. [190, 191] observe a reduction of damping effects as well as the formation of extremely large pockets in the very lower region of the cuts in soft concrete materials subjected to an abrasive water jet (Figure 5.16). The authors suppose that the matrix material is washed away by the high-speed water flow.
Nevertheless, the influence of the water flow in the course of abrasive water jet cutting is still an unsolved problem and further work is required to clarify this problem.
12 do=O.33 mm v=4.2 mmls
10 dF=1.02mm IF=76.2mm
8 m A =4.3 g/s
a; gametl/36 .0 E ::I target: c 6 gray cast Iron U ~ 0 I.) 4
2 eN=1 transition pressure
0
0 50 100 150 200 250 300 350
pump pressure in MPa
Figure 5.15 Relation between the pump pressure and contact number for cast iron [199 J

5.4 Macro-Mechanisms of Abrasive Water-let Material Removal III
Fig. 5.16 Pocketfonnation in soft concrete [190J
5.4 Macro-Mechanisms of Abrasive Water-Jet Material Removal
5.4.1 Some Observations of the Surface Topography
5.4.1.1 General Statement
The geometry of the generated cutting front that is generally curved as shown in Figure 5.17, and the topography of the generated surface are two major features of the macroscopic, abrasive water jet material-removal regime. Thus, insight into the character of at least the macroscopic, material-removal process is obtained from analysis of the surface structures of the abrasive water jet cut specimens. The next section discusses aspects of cutting front inspections.
Figure 5.17 Geometry of the cutting front generated during abrasive water-jet cutting (Univ. Hannover, IW)

112 5. Material-Removal Mechanisms in Abrasive Water-Jet Machining
5.4.1.2 Surface-Profile Inspections
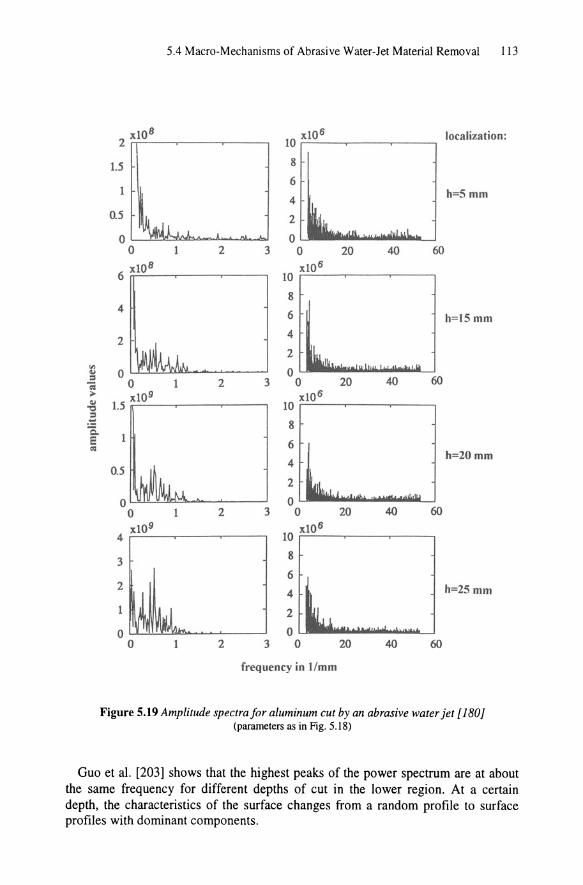
Despite the surface topography, Figure 5.17 shows surface profiles of an aluminum sample. From the first view, the most striking feature is the existence of two different regions. One region, covering the upper part of the specimen, shows a smooth surface; whereas, the second region, located in the lower part, exhibits some regularly-appearing surface marks. Figures 5.18 and 5.19 show surface profiles measured at different depths, and the corresponding power spectra. Especially the power spectra plots clearly represents the surface characteristics. In the upper part, the spectrum distributes in a wide range of frequencies and does not show preferred frequency peaks. Therefore, the surface profile is almost random and does not possess a characteristic wavelength. With increasing depth of cut, the spectral distribution concentrates in a narrow range of frequency that demonstrates a dominant harmonic component in the surface profile.
200r-------~----~----~--~----,
100
o ~~~~~~~~~~~~~ h=5mm
-100 ~OO L-__ ~ ____ ~ ____ ~ ____ ~ ____ ~ __ ~
o 10 20 30 40 50 60
l :~t~~~ I h-15mm
o ill W ~ ~ ~ 60
~ 50 60
200 r---~----~----------~----~--~
100
o -100
~OO ~--~----~----~----~----~--~ o ill W ~ ~ ~ 60
length of measurement in mm
h=25mm,
Figure 5.18 Time-domain signals of the suiface profile for aluminum [J 80 J p=240 MPa, do=O.25 mm, v=1.67 rnmls, dp=O.9 rnrn,lp=40 rnrn, rnA=8 gis, rninersiv
5.4 Macro-Mechanisms of Abrasive Water-let Material Removal 113
xlOB 2;:':":~----.-----r--~
1.5
0.5
OL~~"::Jz:..<.-..A.......-GLo....w
o 2 3
10 x10 6
8
6
4
2
20 40 60
6 x~I~O~B_~ __ ~ __ ~ x10 6 10 ;:="::'~~--~----,
4
2
8
6
4
2
~ OU:'!:'!'~llIQ!.."""""""",,--_.....-J 0 ~ 0 2 3 0 20 40 60
~ x10 9 xl0 6 "'=' 1.5 10 F=----~--.---__, .; ~ 8
~ 6
0.5 4
2
o l...!!.Jl.!L..l!...!U:l~"""""---o. __ ---l 0 o 2 3 0 20 40 60
xl09 xl06 4 1O;':';;";'---~-~.-----,
3 8 6
2 4
2
2
o 3 0
frequency in I/mm
20 40 60
localization:
h=5mm
h=15mm
h=20mm
h=25 mm
Figure 5.19 Amplitude spectraJor aluminum cut by an abrasive water jet [180J (parameters as in Fig. 5.18)
Guo et al. [203] shows that the highest peaks of the power spectrum are at about the same frequency for different depths of cut in the lower region. At a certain depth, the characteristics of the surface changes from a random profile to surface profiles with dominant components.
114 5. Material-Removal Mechanisms in Abrasive Water-let Machining
5.4.1.3 Wavelength-Decomposition
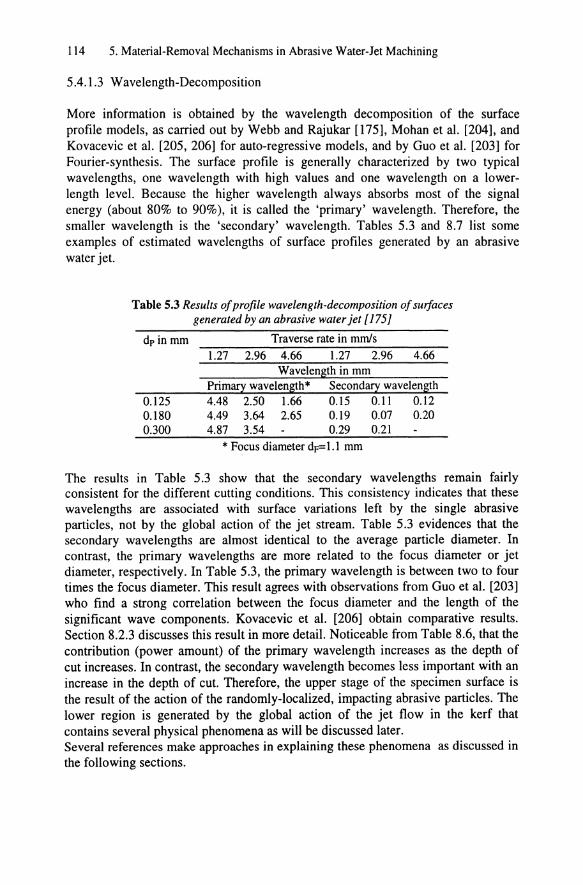
More information is obtained by the wavelength decomposition of the surface profile models, as carried out by Webb and Rajukar [175], Mohan et al. [204], and Kovacevic et al. [205, 206] for auto-regressive models, and by Guo et al. [203] for Fourier-synthesis. The surface profile is generally characterized by two typical wavelengths, one wavelength with high values and one wavelength on a lowerlength level. Because the higher wavelength always absorbs most of the signal energy (about 80% to 90%), it is called the 'primary' wavelength. Therefore, the smaller wavelength is the 'secondary' wavelength. Tables 5.3 and 8.7 list some examples of estimated wavelengths of surface profiles generated by an abrasive water jet.
Table 5.3 Results of profile wavelength-decomposition of surfaces generated by an abrasive water jet [175]
dp in mm Traverse rate in mmls 1.27 2.96 4.66 1.27 2.96 4.66
Wavelength in mm Primary wavelength* Secondary wavelength
0.125 4.48 2.50 1.66 0.15 0.11 0.12 0.180 4.49 3.64 2.65 0.19 0.07 0.20 0.300 4.87 3.54 0.29 0.21
* Focus diameter dF= 1.1 mm
The results in Table 5.3 show that the secondary wavelengths remain fairly consistent for the different cutting conditions. This consistency indicates that these wavelengths are associated with surface variations left by the single abrasive particles, not by the global action of the jet stream. Table 5.3 evidences that the secondary wavelengths are almost identical to the average particle diameter. In contrast, the primary wavelengths are more related to the focus diameter or jet diameter, respectively. In Table 5.3, the primary wavelength is between two to four times the focus diameter. This result agrees with observations from Guo et al. [203] who find a strong correlation between the focus diameter and the length of the significant wave components. Kovacevic et al. [206] obtain comparative results. Section 8.2.3 discusses this result in more detail. Noticeable from Table 8.6, that the contribution (power amount) of the primary wavelength increases as the depth of cut increases. In contrast, the secondary wavelength becomes less important with an increase in the depth of cut. Therefore, the upper stage of the specimen surface is the result of the action of the randomly-localized, impacting abrasive particles. The lower region is generated by the global action of the jet flow in the kerf that contains several physical phenomena as will be discussed later. Several references make approaches in explaining these phenomena as discussed in the following sections.
5.4 Macro-Mechanisms of Abrasive Water-let Material Removal 115
5.4.2 Two-Dimensional Model of the Integral Material Removal
5.4.2.1 Traverse-Direction Stages
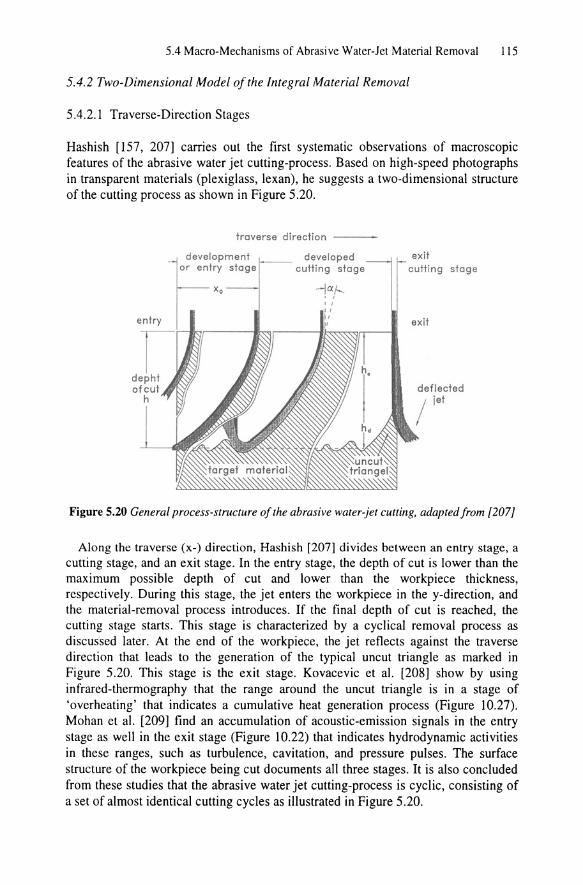
Hashish [157, 207] carries out the first systematic observations of macroscopic features of the abrasive water jet cutting-process. Based on high-speed photographs in transparent materials (plexiglass, lexan), he suggests a two-dimensional structure of the cutting process as shown in Figure 5.20.
entry
traverse direction
development or entry stage
developed cutting stage
-jaI-I, , ,
exit cutting stage
exit
Figure 5.20 General process-structure a/the abrasive water-jet cutting, adapted/rom [207J
Along the traverse (x-) direction, Hashish [207] divides between an entry stage, a cutting stage, and an exit stage. In the entry stage, the depth of cut is lower than the maximum possible depth of cut and lower than the workpiece thickness, respectively. During this stage, the jet enters the workpiece in the y-direction, and the material-removal process introduces. If the final depth of cut is reached, the cutting stage starts. This stage is characterized by a cyclical removal process as discussed later. At the end of the workpiece, the jet reflects against the traverse direction that leads to the generation of the typical uncut triangle as marked in Figure 5.20. This stage is the exit stage. Kovacevic et al. [208] show by using infrared-thermography that the range around the uncut triangle is in a stage of 'overheating' that indicates a cumulative heat generation process (Figure 10.27). Mohan et al. [209] find an accumulation of acoustic-emission signals in the entry stage as well in the exit stage (Figure 10.22) that indicates hydrodynamic activities in these ranges, such as turbulence, cavitation, and pressure pulses. The surface structure of the workpiece being cut documents all three stages. It is also concluded from these studies that the abrasive water jet cutting-process is cyclic, consisting of a set of almost identical cutting cycles as illustrated in Figure 5.20.

116 5. Material-Removal Mechanisms in Abrasive Water-Jet Machining
5.4.2.2 Penetration-Direction Stages
In the penetration (y-) direction, a single, complete cutting cycle (Figure 5.20) also divides into several different stages. Hashish [207] adapts the solid-particle erosion concept developed by Bitter [160, 161] and divides one cutting cycle into two distinctive stages. Hashish calls this first stage the 'cutting-wear zone'. This stage is marked as he in Figure 5.20. According to Hashish [207] and Blickwedel [69] the stage is characterized by material removal due to individual abrasive particles hitting the surface at small impact angles (section 5.1). The material is removed by micro-cutting. This performance is assumed to be a steady-stage process where the material-removal rate is equal to the material-displacement rate. A geometrical expression of this zone is the roughness of the cut-wall surface (section 8.2).
If a certain impact angle is reached, the material-removal regime changes to a 'deformation wear', (called by Hashish) that is characterized by particles impacting at large angles. This stage is marked as hd in Figure 5.20. In this stage, the abrasive water jet penetrates the material at a decreasing rate as the depth of cut increases. The material is removed by a different erosion mode that is associated with multipass particle bombardment, surface hardening by plastic deformation, and crack formation. The so-called 'striations marks', or waviness zone, geometrically characterizes this zone. Section 8.2 discusses this aspect of the cutting front. In a final stage, near the bottom of the cut, the cutting process turns into a 'drilling' process with an impact angle of cp=90°.
Nevertheless, Hashish [207] does not give an explanation about what physical phenomena causes the existence of two different material-removal regimes. Also, as discussed in section 5.2, there is no experimental evidence for a change in the general microscopic material-removal mode with the depth of the cut neither in ductile-behaving nor in brittle-behaving materials.
5.4.2.3 Further Development ofthe Model
Blickwedel [69] who uses sloped specimens to simulate the different process conditions on the cutting front, further developes Hashish's two-stage model. Using a high-speed camera, Blickwedel observes the existence of more than one step on the cutting front as shown in Figure 5.21. He localizes the beginning of the step formation (the beginning of the 'deformation-wear' zone) at 30%-40% of the maximum depth of cut. Later, Ohlsson et al. [210] rediscover the phenomenon of multiple-step formation. Based on force measurements in the traverse direction as well as in the penetration direction, these authors develop a phenomenological model of striation formation based on variations in the geometry of the cutting front.

5.4 Macro-Mechanisms of Abrasive Water-Jet Material Removal 117
Figure 5.21 Multiple step-formation (arrowed) in abrasive water-jet cutting of PMMA; distance between the pictures is ca. 50 ms (Univ. Hannover, IW)
5.4.2.4 Step Formation at the Cutting Front
Mohaupt and Burns [211] first notice the step-formation phenomena during cutting plastics by a plain water jet. Based on the investigations of Hashish and Blickwedel, the general physics of the two-dimensional cut-generation process in abrasive water jetting is described as follows.
In the beginning of the material-removal process, the jet hits the surface parallel to its axis. With an increase in the depth of cut, the local impact angle increases, too.

118 5. Material-Removal Mechanisms in Abrasive Water-let Machining
Because of their high body-force, the abrasive particles can not follow the abrupt change in the flow direction, and a de-mixing process occurs. This process leads to a local accumulation of particle impacts. The removal process now restricts to a smaII portion of the cutting front. The result of this process is the formation of a local step. Using high-speed photography, the steps are observed in transparent materials (Figure 5.21). Typical step speeds are between 45 mls and 200 mls. The speed seems to be higher for brittle materials than for ductile materials [209]. In opaque materials, there is the possibility to suddenly interrupt the removal process. Then, the step is clearly seen. Additional experimental evidence for an unsteady removal process gives the impact force, measure after the abrasive water jet exits the workpiece. Figure 10.34 shows that the force signal of an exjting abrasive water jet exhibits a high-dynamic component compared to the signal of a non-working abrasive water jet.
The shape of the step changes as the material removal progresses until it reaches a critical shape. This critical shape is characterized by a 90°-impact angle. The material-removal process changes into a drilling process. The abrasive particles can not remove more material and the final stage of the cutting process is reached.
5.4.3 Three-Dimensional Model a/the Integral Material Removal
5.4.3.1 Three-Dimensional Step Formation
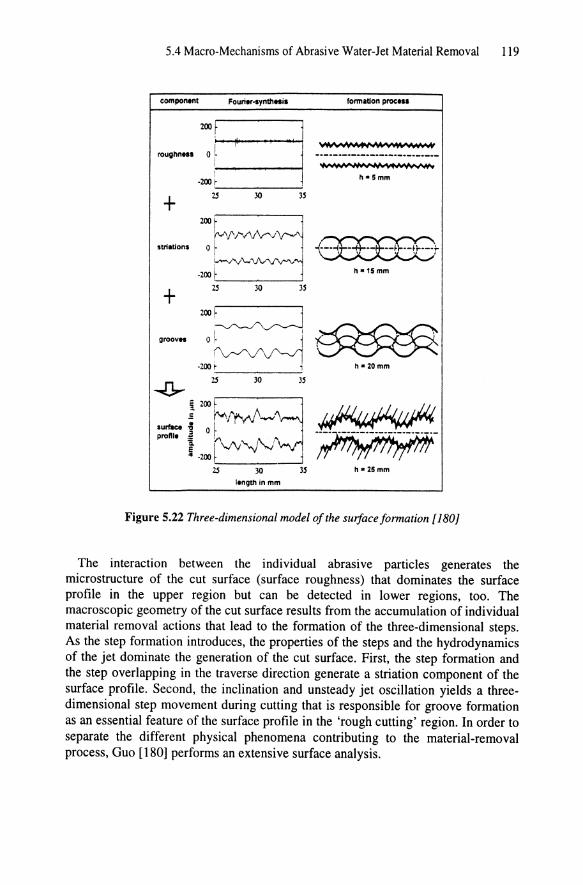
Guo [180] developed a three-dimensional integral abrasive water jet cutting-model (see also [203]). Figure 5.22 presents the structure of the model.
Figure 5.23 illustrates the three-dimensional aspect of step formation: the movement of the step occurs in the direction of the traverse as weII as perpendicular to it. This phenomena is observed in different materials, such as aluminum alloy, titanium aIIOY, steel, and ceramics [203]. Figure 5.23 additionaIIy shows traces of material removal in a steel sample. These traces are caused by an abrasive water jet after cutting another sample. The traces appear as a series of dents that demonstrates an unsteady oscillation. This oscillation of the traces is observed only when striation formation is involved.
Thus, four major mechanisms play a significant role in the material removal process:
• individual abrasive-particle impact • step formation in cutting direction • jet oscillation perpendicular to the
cutting direction • oscillations of the guiding system
-7 roughness formation, -7 striation formation, -7 groove formation,
-? external effects.
5.4 Macro-Mechanisms of Abrasive Water-Jet Material Removal 119
component
+ striltions
+ grooves
Fouri ..... ynth .. i.
2.S JO
2.S 30
35
35
tonnollon proc ...
~..
h-Smm
~~TC:,X:'Y::,:x::;x::;;:::;/ h -15 mm
200~ I •. I,,~ o.~~
-200 ~ l' h • 20 mm
:i:~~8 pronle i ~\,,/'y ~ I
" -200 ~ -.---J 2.S 30 35 h· 25 mm
length in mm
Figure 5.22 Three-dimensional model of the surface formation [180J
The interaction between the individual abrasive particles generates the microstructure of the cut surface (surface roughness) that dominates the surface profile in the upper region but can be detected in lower regions, too. The macroscopic geometry of the cut surface results from the accumulation of individual material removal actions that lead to the formation of the three-dimensional steps. As the step formation introduces, the properties of the steps and the hydrodynamics of the jet dominate the generation of the cut surface. First, the step formation and the step overlapping in the traverse direction generate a striation component of the surface profile. Second, the inclination and unsteady jet oscillation yields a threedimensional step movement during cutting that is responsible for groove formation as an essential feature of the surface profile in the 'rough cutting' region. In order to separate the different physical phenomena contributing to the material-removal process, Guo [180] performs an extensive surface analysis.
120 5. Material-Removal Mechanisms in Abrasive Water-let Machining
Traverse direction Traverse direction
•
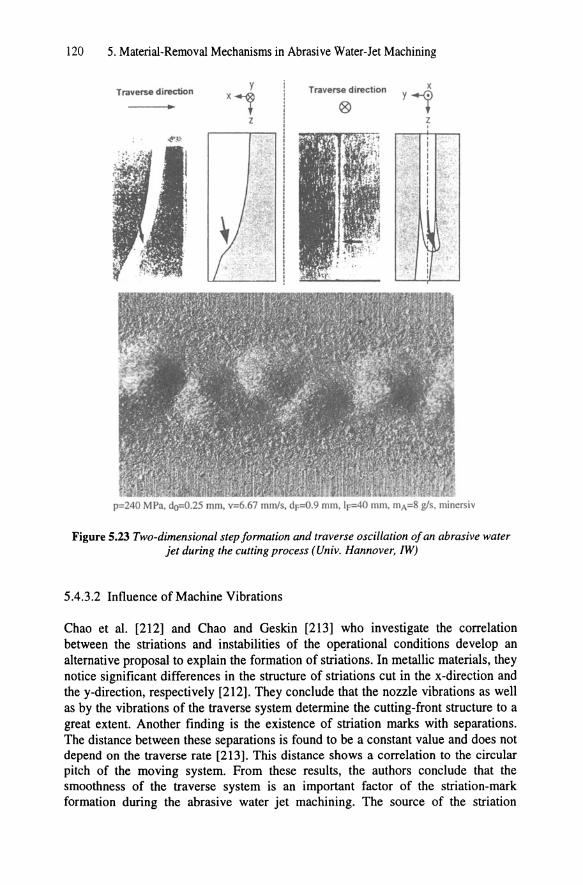
p=240 MPa. do=O.25 mm. v=6.67 mmls. dF=O.9 mm. 1r--40 mm. mA=8 gis, mincrsiv
Figure 5.23 Two-dimensional step formation and traverse oscillation of an abrasive water jet during the cutting process (Univ. Hannover, IW)
5.4.3.2 Influence of Machine Vibrations
Chao et al. [212] and Chao and Geskin [213] who investigate the correlation between the striations and instabilities of the operational conditions develop an alternative proposal to explain the formation of striations. In metallic materials, they notice significant differences in the structure of striations cut in the x-direction and the y-direction, respectively [212]. They conclude that the nozzle vibrations as well as by the vibrations of the traverse system determine the cutting-front structure to a great extent. Another finding is the existence of striation marks with separations. The distance between these separations is found to be a constant value and does not depend on the traverse rate [213]. This distance shows a correlation to the circular pitch of the moving system. From these results, the authors conclude that the smoothness of the traverse system is an important factor of the striation-mark formation during the abrasive water jet machining. The source of the striation

5.4 Macro-Mechanisms of Abrasive Water-Jet Material Removal 121
formation is assumed to be the vibration of the cutting nozzle perpendicular to the cutting direction. If the cut in the material is deep enough, the spent water flows back along the already-cut channel. In case of vibrations, there is a radial velocity component added to the moving jet. Thus, the spent water has a sideways component that cuts into the wall and generates the typical striation structure. Nevertheless, this suggestion does not really explain the striation formation in the case of cutting through where no back flow of the spent water exists. Moreover, Guo [180] does not find any relation between the spectrum of surface-profiles and the spectrum of machine-oscillations, and concludes that machine oscillations influence the surface structure secondarily but are not a physical source of striation formation (Figure 5.24). Also, Hashish [214] shows that the regularity of the striations depends on the machinability of the materials. For hard-to-machine materials, such as ceramics, the striations are very regular; whereas, easy-to-cut materials show non-regular striation structures. As Hashish suggests, external effects, such as pressure fluctuations and vibrations, are excluded in the hard materials. These materials show the result of the plain, high-precise cutting cycles. In soft materials, the ideal removal process is randomly interrupted by external effects.
1 I 1 1 c
0.8
0.6
0.4
0.2
o o
1 \ ~ "~
aurr.ee profile, b=15 DIM
.-
A" 0.6 1.2 1.8 24 3
IIUIdUne vihrations = 0.75 ......................... ( ........................ + .......................... l .... ······· ................ :--............ ·············,········· ............. .
002·S5 ..................... T .. ········ ...... ·· .... ·· r .... ·· .. · .. ········ .. ·T .. · .. ·················_···· • . ................ ···~···························t······················ ...... , ........................... ~ ...... .
1 ! ! ' OL-~~LL~~~~~~~--~~~----~----~
o 0.5 1.5 2 2.5 3
frequency in lImm
Figure 5.24 Suiface profiles and machine-vibration signals [180}
122 5. Material-Removal Mechanisms in Abrasive Water-Jet Machining
5.4.4 Alternative Models o/the Integral Material Removal
5.4.4.1 General Comments
The suggestion that the cutting front is divided into the different material-removal mechanisms is controversially discussed. As already pointed out in section 5.2, several investigators observe a constant material-removal mechanism on the entire cutting front which is in contrast to the two different material-removal modes assumed by Hashish and Blickwedel. Another related problem is that a curved cutting front is an essential feature of all stream-like cutting tools, such as lasers and electron beams [215]. For this reason, it is possible to assume a more general source of striation formation.
5.4.4.2 Two-Stage Impact Zone Model
Zeng and Kim [158] critizise the underlying concept in Hashish's model, that the particle impact angle changes with an increase in the depth of cut, and developed a two-stage model illustrated in Figure 5.25a. In a first stage, called the 'direct impact zone', the abrasive particles directly impact the entire cutting front. As the jet moves further into the material, the area behind the back side of the abrasive water jet is exposed to a 'secondary impact' by deflected abrasive particles that results in a sudden change of the cutting-front curvature. The entire cutting front consists of several cycles of step formation. The most important conclusion from the model of Zeng and Kim [158] is that the entire cutting process is associated with abrasive particle impacts at glancing angles, regardless of the type of target material. This idea gets some support from Ohlssen et al. [209] who measures cyclic fluctuations in the cutting forces exerted on the cutting front in both the vertical and the horizontal directions. From these measurements, they conclude a change in the geometry of the step on the cutting front as the step progresses downward. As the source of the frequencies, they assume the step generation process as well as mechanical vibrations set up in the cutting equipment (5 Hz - 20 Hz).
5.4.4.3 'Three-Zone' Cutting Front Model
Arola and Ramulu [181, 185] and Ramulu and Arola [187] develop an alternative 'three-zone' cutting-front model as illustrated in Figure 5.25b.
These authors introduce a 'top-entrance zone', or 'damage zone' that is characterized by a plastic deformation due to the almost perpendicular impacting abrasive particles in ductile materials. Earlier, Kovacevic et al. [174] discover and describe, but not name this zone. Guo [180] also discusses this zone. The size of this zone mainly depends on the standoff distance (chapter 8).
Arola and Ramulu [181, 185] call the following ranges the 'smooth-cutting zone' and the 'rough-cutting zone', respectively. These names indicate that rather the structure of the generated surface changes with the depth of cut but not the micro-

5.4 Macro-Mechanisms of Abrasive Water-let Material Removal 123
removal regime. Arola and Ramulu [181] observe that the wear tracks on the individual impact sites and their severity decrease with an increase in the depth of cut. The authors discuss this observations in terms of a loss of kinetic energy of the single abrasive particles involved in the material-removal process at greater depths. Section 5.5 addresses this aspect.
r trav,,.., dlrectlon--
direct Impact zone
a)
abralive partlcl. tralectorl ..
trave,... dlr.ctlon
b)
abrastve partlcl. tralectorle.
Figure 5.25 Alternative cuttingjront models for the abrasive water-jet cutting a - 'Two-stage' impact zone model (158)
b - 'Three-zone' cutting front model (181)
As discussed in chapter 10, several authors find an increase in the absolute value as well as in the dynamics of the workpiece reaction force with an increase in the depth of cut (Figure 10.32). Following the ideas introduced by Arola and Ramulu [181], these measurements are an indication of the decelerated material removal in the lower part of the cut. Due to energy losses in the upper part of the cut, the loading intensity of the single abrasive particles reduces. In brittle materials, the reduced stress intensity leads to less crack initiation and to slower crack growth. In ductile materials, the smaller kinetic energy of the abrasive particles leads to an accumulation of particle impacts at a given area that introduces higher cutting forces. Raju and Ramulu [216, 217] extend this phenomenological idea to a mechanistic model of the cutting-front formation process. Assuming steady cutting conditions, these authors develop governing equations for the depth of the 'smoothcutting' zone as well as for the 'rough-cutting' zone. Section 6.2 discusses the basic relations of this model in detail.
5.4.4.4 'Energetic' Cutting Front Model
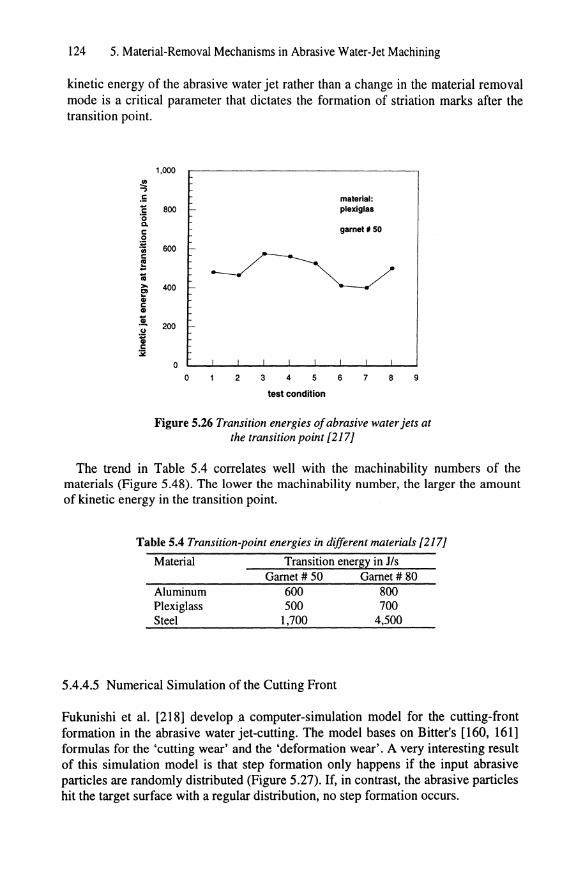
Raju and Ramulu [217] suggest that the kinetic energy of the abrasive-water slurry at the transition point between the 'smooth-cutting' zone and the 'rough-cutting' zone (hsc~hRc) is a more-or-less constant value for a given material (Figure 5.26). Table 5.4 lists typical values for this transition-energy. These results suggest that the
124 5. Material-Removal Mechanisms in Abrasive Water-Jet Machining
kinetic energy of the abrasive water jet rather than a change in the material removal mode is a critical parameter that dictates the formation of striation marks after the transition point.
.!!! ...,
.5 C '0 Q.
c: 0 :e .. c: ~ 1U ,.. '" ~ c: .. . !. u i c: :il
1.000
800
600
400
200
0
0 2 3 4 5
test condition
material: plexiglas
garnet. 50
6 7 8 9
Figure 5.26 Transition energies of abrasive water jets at the transition point [217J
The trend in Table 5.4 correlates well with the machinability numbers of the materials (Figure 5.48). The lower the machinability number, the larger the amount of kinetic energy in the transition point.
Table 5.4 Transition-point energies in different materials [217J
Material
Aluminum Plexiglass Steel
Transition energy in Jls Gamet # 50 Gamet # 80
600 800 500 700
1,700 4,500
5.4.4.5 Numerical Simulation ofthe Cutting Front
Fukunishi et al. [218] develop a computer-simulation model for the cutting-front formation in the abrasive water jet-cutting. The model bases on Bitter's [160, 161] formulas for the 'cutting wear' and the 'deformation wear'. A very interesting result of this simulation model is that step formation only happens if the input abrasive particles are randomly distributed (Figure 5.27). If, in contrast, the abrasive particles hit the target surface with a regular distribution, no step formation occurs.
5.5 Energy Balance of Abrasive Water-Jet Material Removal 125
Traverse direction
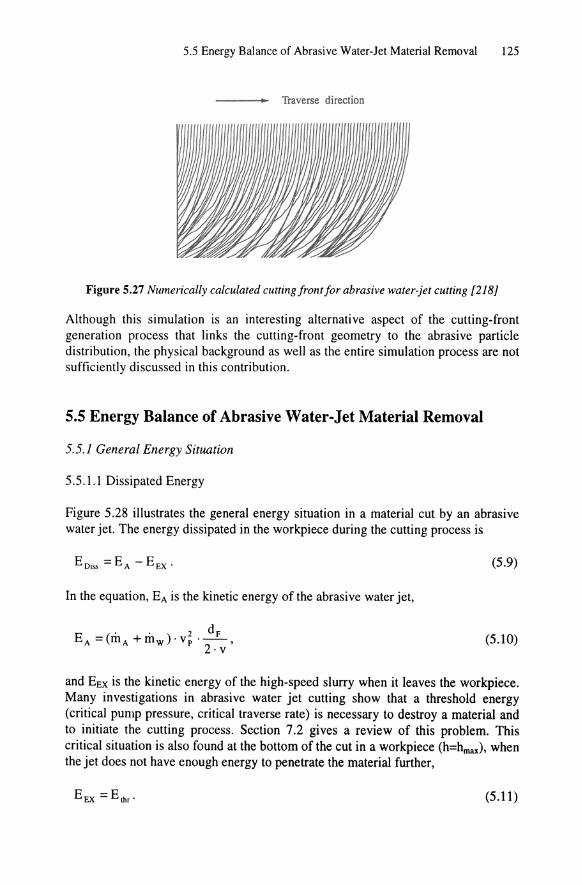
Figure 5.27 Numerically calculated cutting front for abrasive water-jet cutting [218 J
Although this simulation is an interesting alternative aspect of the cutting-front generation process that links the cutting-front geometry to the abrasive particle distribution, the physical background as well as the entire simulation process are not sufficiently discussed in this contribution.
5.5 Energy Balance of Abrasive Water-Jet Material Removal
5.5.1 General Energy Situation
5.5 .1.1 Dissipated Energy
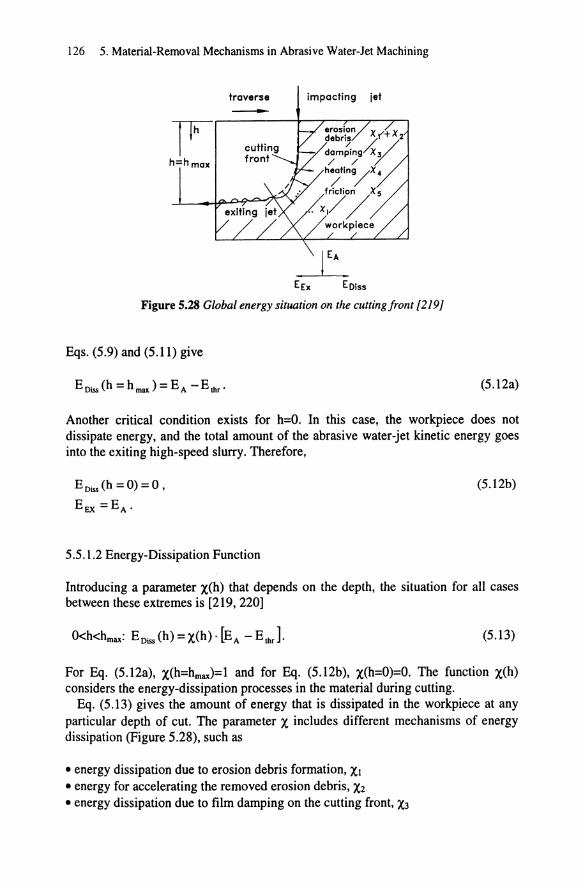
Figure 5.28 illustrates the general energy situation in a material cut by an abrasive water jet. The energy dissipated in the workpiece during the cutting process is
(5.9)
In the equation, EA is the kinetic energy of the abrasive water jet,
(5.10)
and EEx is the kinetic energy of the high-speed slurry when it leaves the workpiece. Many investigations in abrasive water jet cutting show that a threshold energy (critical pump pressure, critical traverse rate) is necessary to destroy a material and to initiate the cutting process. Section 7.2 gives a review of this problem. This critical situation is also found at the bottom of the cut in a workpiece (h=hmax), when the jet does not have enough energy to penetrate the material further,
(5.11)
126 5. Material-Removal Mechanisms in Abrasive Water-Jet Machining
traverse impacting jet
T h=h max
EEx EOiss
Figure 5.28 Global energy situation on the cutting front {219}
Eqs. (S.9) and (S.I1) give
(S.12a)
Another critical condition exists for h=O. In this case, the workpiece does not dissipate energy, and the total amount of the abrasive water-jet kinetic energy goes into the exiting high-speed slurry. Therefore,
E Diss (h = 0) = 0,
EEl{ =E A •
5.5 .1.2 Energy-Dissipation Function
(S.12b)
Introducing a parameter X(h) that depends on the depth, the situation for all cases between these extremes is [219,220]
(S.13)
For Eq. (S.12a), X(h=hmax)=1 and for Eq. (S.l2b), X(h=O)=O. The function X(h) considers the energy-dissipation processes in the material during cutting.
Eq. (5.13) gives the amount of energy that is dissipated in the workpiece at any particular depth of cut. The parameter X includes different mechanisms of energy dissipation (Figure 5.28), such as
• energy dissipation due to erosion debris formation, Xl • energy for accelerating the removed erosion debris, X2 • energy dissipation due to film damping on the cutting front, X3

5.5 Energy Balance of Abrasive Water-Jet Material Removal 127
• energy dissipated in heating the workpiece, X4 • energy dissipation due to friction on the cutting front, Xs • other energy dissipative processes, Xi
Thus, X(h) writes
N
X(h) = LXi(h), or (5.14a) i=l
N
X(<I» = LXi (<I» . (5.14b) i=l
In Eq. (5.14b), <I> is the relative depth of cut, <I>=hlhmax that is useful to unify the results.
5.5.2 Geometrical Energy-Dissipation Model
5.5.2.1 Special Solutions of the Energy-Dissipation Function
Mohan et al. [221, 222] derive a solution of Eq. (5.13) for the special case h=hmax (X=I, <1>=1),
2 2 . . E. =u .~ ·Lh·(mW+mA),r __ ]
Dlss ~ rnA) LP Pthr . v·p ·1+-.-w ffiW
(5.15)
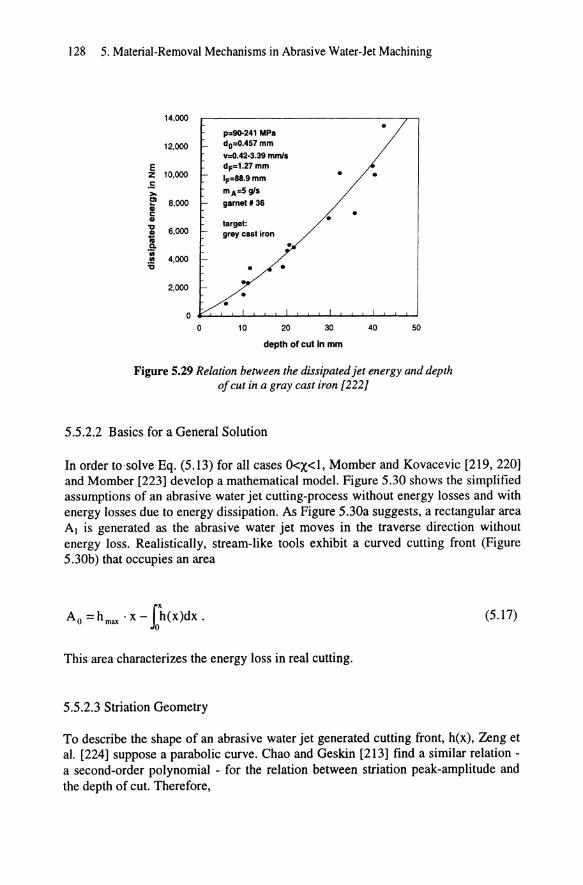
Figure 5.30 shows results of Eq. (5.15). The energy dissipated in the material is between 60% and 90% of the abrasive water jet input-energy. These values are valid for kerfing a material. For a cutting-through process, the ratio between the dissipated energy and the abrasive water-jet kinetic energy is considerably lower. Also, these values depend on the depth of cut and available abrasive water jet inputenergy, respectively. For lower abrasive water jet-energies and shallower depths, the relative amount of dissipated energy decreases.
The function in Figure 5.29 reasonably fits into a second-order equation,
E Diss (h max ) = a 1 • h ~ax + b 1 . h max + c 1 '
Cl=O.
A further special solution is Ediss=O for h=O (X=O, <1>=0).
(5.16)
128 5. Material-Removal Mechanisms in Abrasive Water-Jet Machining
14,000
12,000
E Z 10,000 .5 >-!!' 8,000 .. 51 "D 6,000 i ..
4,000 .. '6
2,000
0
0
p:!IO-241 MPa do,.O.457mm
v=D.42-3.39 mmls dF .. 1.27mm
IF=88.9mm
mA=5 gl8 garnet It 36
largel: gray casl iron
• • •
10 20
•
•
30
depth of cut In mm
•
•
•
40 50
Figure 5.29 Relation between the dissipated jet energy and depth of cut in a gray cast iron [222J
5.5.2.2 Basics for a General Solution
In order to-solve Eq. (5.13) for all cases O<X<l, Momber and Kovacevic [219, 220] and Momber [223] develop a mathematical model. Figure 5.30 shows the simplified assumptions of an abrasive water jet cutting-process without energy losses and with energy losses due to energy dissipation. As Figure 5.30a suggests, a rectangular area Al is generated as the abrasive water jet moves in the traverse direction without energy loss. Realistically, stream-like tools exhibit a curved cutting front (Figure 5 .30b) that occupies an area
(5.17)
This area characterizes the energy loss in real cutting.
5.5.2.3 Striation Geometry
To describe the shape of an abrasive water jet generated cutting front, h(x), Zeng et al. [224] suppose a parabolic curve. Chao and Geskin [213] find a similar relation -a second-order polynomial - for the relation between striation peak-amplitude and the depth of cut. Therefore,

5.5 Energy Balance of Abrasive Water-let Material Removal 129
h(x)=a·(x-b)2 +c. (5.18)
In the equation, a, b, and c are constants that are evaluated by measurements of the cutting front. Approximations for c=hmax and b=xmax are
(5.19)
The parameters Xmax and hmax are easily estimated for every full-cut surface. Figure 5.31b gives some modeled shapes of cutting fronts generated by abrasive water jets. Table 5.5 lists the corresponding regression parameters.
traverse
(a) (b)
Figure 5.30 Comparative schematics of an ideal (a) and a real (b) abrasive water jet cutting- process {219]
Table 5.5 Regression parameters of the parabola cuttingjront [223]
Specimen Material Parameter a b c
#1 aluminum -0.337 8.3 22.0 #2 aluminum -0.336 8.0 20.8 #3 ceramic -0.200 15.0 45.0 #4 concrete -0.221 25.0 75.0 #5 cast iron -0173 13.4 41.6
130 5. Material-Removal Mechanisms in Abrasive Water-let Machining
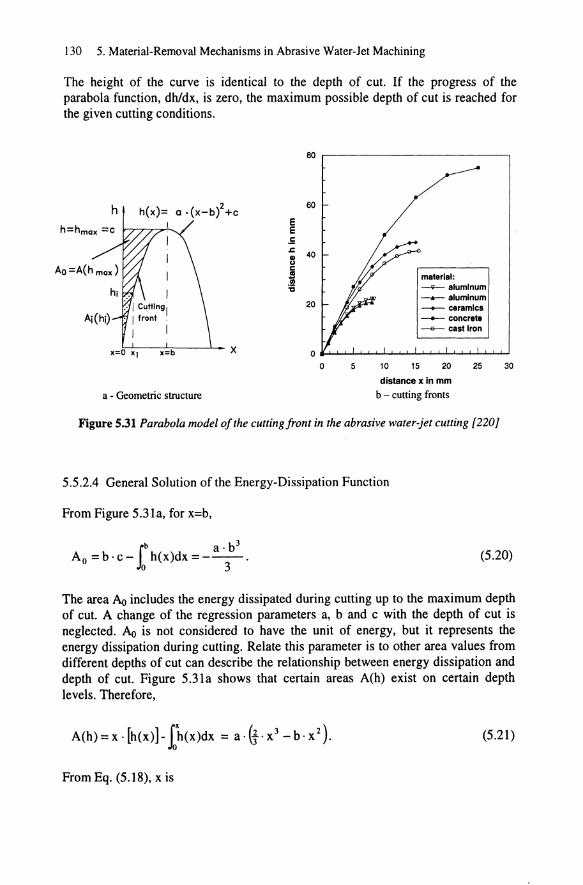
The height of the curve is identical to the depth of cut. If the progress of the parabola function, dh/dx, is zero, the maximum possible depth of cut is reached for the given cutting conditions.
h h(x)= 2 a .(x-b) +c E E .5 J:
8 c .. 'iii '6
);--':---~--'--x
a - Geometric structure
80 ,.---------------,
60
40
20
o 5
material: ~alumlnum
--.-- aluminum -+-- ceramics -+- concrete ~ cast Iron
10 15 20 25
distance x In mm
b - cutting fronts
30
Figure 5.31 Parabola model of the cutting front in the abrasive water-jet cutting [220J
5.5.2.4 General Solution of the Energy-Dissipation Function
From Figure 5.31a, for x=b,
Ib a· b3
Ao =b·c- h(x)dx =---. o 3
(5.20)
The area Ao includes the energy dissipated during cutting up to the maximum depth of cut. A change of the regression parameters a, band c with the depth of cut is neglected. Ao is not considered to have the unit of energy, but it represents the energy dissipation during cutting. Relate this parameter is to other area values from different depths of cut can describe the relationship between energy dissipation and depth of cut. Figure 5.31a shows that certain areas A(h) exist on certain depth levels. Therefore,
(5.21)
From Eq. (5.18), x is

5.5 Energy Balance of Abrasive Water-let Material Removal
[h=-z x =V-;;--a-+b.
The dissipation function, X(h), is
X(h) = A(h) = A(h) Ao A(h max)
2·x 3 -3·b·x 2
(_b)3
131
(5.22)
(5.23)
For x=b and h=hmax> X=l, and Eqs. (5.21) and (5.20) are equal. Also, X=O for x=O (h=O).
Figure 5.32 shows calculations based on Eq. (5.23). The dissipation parameter is X=O for non-cutting, and X= 1 for the maximum depth of cut. Between these extremes, the function is non-linear and very reasonably approximates a secondorder equation,
(5.24)
Chao and Geskin [213] find a similar relation between the depth of cut and striation peak-amplitude. Also, Eq. (5.16) is a second-order polynomial, too. These results support the validity ofEq. (5.24).
Table 5.6 gives some regression parameters of Eq. (5.24). Notice that the functions for the concrete and the ceramic material are relatively straight lines. Because both these materials are brittle and multiphase, there is a relation between the material structure and mode of energy dissipation. A systematic study of this effect is still missing.
material: aluminum
'E 0.8 'E .!!! CD <.> 'u := ~ CD 0 0 <.> 0.6 <.> I: I: 0 i ; Q. Q.
'iii 0.4 'iii
III .!II '6 material: 'tI
0.8 • aluminum ... ceramic :g concrete
cast iron 0.6 -- Output
linear
>- -4j-- aluminum >-Ol
----...-..- aluminum e' ~ CD I: 0.2 -----+-- ceramic I: CD Q>
-+--- concrete ---e----- cast iron
0
0 20 40 60 80
depth of cut in mm relative depth of cut
a - Absolute depth of cut b - Relative depth of cut
Figure 5.32 Energy-dissipation/unctions X(h) and X(CP) [223]

132 5. Material-Removal Mechanisms in Abrasive Water-let Machining
From Eqs. (5.13) and (5.24), the absolute value of the dissipated energy is
(5.25)
For h=hmax, Eq. (5.25) and Eq. (5.16) deliver identical results.
Table 5.6 Regression parameters for the dissipation functions [223]
Specimen AI BI CI R2
#1 0.0023 -0.0069 0.0138 #2 0.0026 -0.0076 0.0121 #3 0.0060 -0.0050 0.Ql18 0.999 #4 0.0020 -0.0028 0.0063 #5 0.0070 -0.0050 0.0125
Average A2 B2 C2 0.999
Relative depth l.226 -0.277 0.037 0.999 of cut ~(4))
5.5.2.5 Solution for the Relative Depth of Cut
Figure 5.32b plots the energy dissipation against the relative depth of cut for different cutting conditions. All plotted points fit into the same regression line
(5.26)
Table 5.6 gives the regression parameters. In contrast to Figure 5.32a, the regression parameters are independent of the cutting conditions as well as the investigated materials. Although Capello and Gropetti [225] obtain a similar result in their cutting model (Table 6.7), this phenomena is not yet clarified.
5.5.2.6 Local Energy-Dissipation Intensity
Figure 5.32b exhibits a second line that characterizes how the intensity of the energy absorption is independent on the cutting depth. This function is simply a straight line, Xs(<P)=<P. Momber and Kovacevic [220] show that the difference ~=(Xs-X) characterizes the local energy-dissipation intensity
(5.27)
The point of maximum energy-dissipation intensity is calculated by differentiating Eq. (5.27). For d1;!d<P=O,
5.6 Erosion-Debris Generation and Acceleration 133
B -I (11)) = 2 (5 28)
s;max _ 2. A . 2
From the regression parameters listed in Table 5.6, a point of maximum energydissipation intensity exists at a depth of cut of h=0.52·hmax• At this relative depth of cut, Ohadi et al. [226] find a maximum in the cutting front temperature (section 5.8.2). This point is related to a critical striation angle
_ {d[-a'(X-b)2+ C]} a cr - arctan .
dx (5.29)
For h=0.52·hmax> the critical striation angle varies in a very narrow range between 73° and 78° for all materials and all cutting conditions [220]. This result needs further discussion.
5.6 Erosion-Debris Generation and Acceleration
5.6.1 Properties o/Generated Erosion Debris
5.6.1.1 Structure, Size and Shape of Erosion Debris
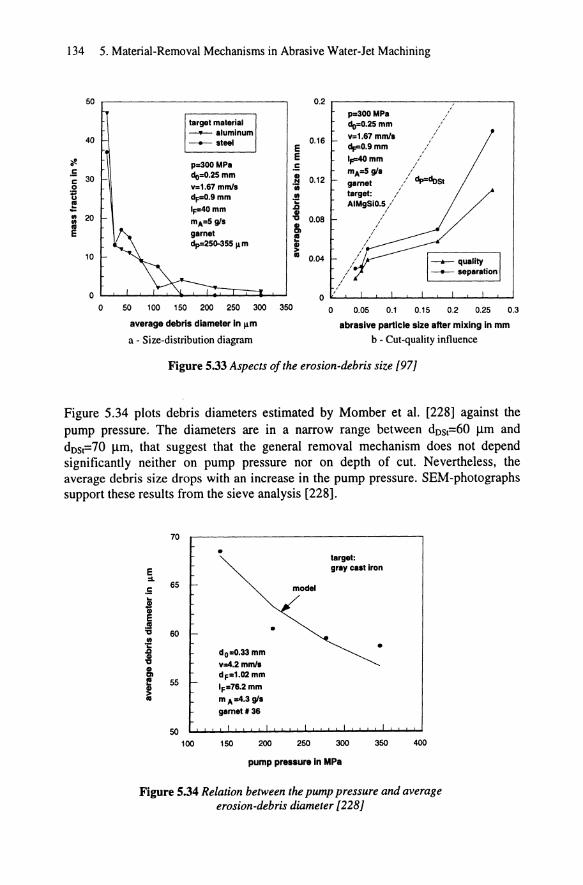
Louis et al. [227], Momber et al. [228] and Ohlsen [97] carry out experimental studies into the generation of erosion debris due to the abrasive water jet-erosion. Based on sieve analysis of debris samples, these authors draw several conclusions related to the erosion-debris generation process. Figure 5.33a gives a typical erosion-debris size-distribution diagram. The average diameter of the debris collection, dDst> is estimated by Eq. (2.10). Louis et al. [227] find that the amount of removed material debris is between I-mass-% and 5-mass-% of the abrasive material involved in cutting. Ohlsen [97] reports values of about 3.5-mass-%. The size of the debris is a little bit smaller than the size of the impacting abrasive particles, sometimes even larger. For chip-like debris, Ohlsen finds that the chip width is about 50 % of the abrasive particle diameter. Typical average debris diameters are dDsl=42 11m for steel and dosl=62 11m for aluminum. The higher value for aluminum suggests a more efficient material-removal performance due to a higher amount of micro-cutting.
Figure 5.33b shows the influence of the cut quality on the debris size.; Highquality cutting generates smaller erosion debris than rough cutting. This effect appears especially if large abrasive particles are used. Nevertheless, a workpiece thickness variation of 800 % leads to a variation in the average debris diameter of only about 20 %.
134 5. Material-Removal Mechanisms in Abrasive Water-Jet Machining
50 0.2 ;
p=300MPa ;
cio=O.25mm ; ,
v=1.67 mmla ,
40 0.16 E ~O.9mm
~ E 1,.=40 mm ,
.5 p=300 MPa .5 mA=5g1a
/
c 30 cio=O.25 mm .~ 0.12 / dp="oSt
0 v=1.67 mmls III garnet
~ df'=O.9 mm .! target: /
~ 1f'=40 mm ,Q AIMgSiO.5/ II III 20 mA=5 gls "tI 0.08 ,
III III 8, , E garnet ! , /
dp=250-355 11m ,
II , , > 10 II 0.04 ;
/ /
/ /
;
0 0 ,
0 50 100 150 200 250 300 350 0 0.05 0.1 0.15 0.2 0.25 0.3
average debris diameter In 11m abrasive particle size after mixing In mm
a - Size-distribution diagram b - Cut-quality influence
Figure 5.33 Aspects o/the erosion-debris size [97J
Figure 5.34 plots debris diameters estimated by Momber et al. [228] against the pump pressure. The diameters are in a narrow range between dDst==60 f..lm and dDst==70 f..lm, that suggest that the general removal mechanism does not depend significantly neither on pump pressure nor on depth of cut. Nevertheless, the average debris size drops with an increase in the pump pressure. SEM-photographs support these results from the sieve analysis [228].
E ::I.
70
50 100
•
dO =0.33 mm v=4.2mmls dF=l.02mm IF=76.2mm
m A =4.3 gla
garnet II 36
•
150 200
target: gray caat Iron
model
•
250 300 350
pump pressure in MPa
400
Figure 5.34 Relation between the pump pressure and average erosion-debris diameter [228J

5.6 Erosion-Debris Generation and Acceleration 135
Momber et al. [228] combine a model for dynamic fragmentation of brittle solids [101] with elements of contact mechanics [229] and derive a semi-empirical relation between the average debris diameter and pump pressure,
I
d OSI (p) = a I . P -5 (5.30)
The constant al includes material parameters from the specimens as well as from the abrasives. Figure 5.34 shows that the results of Eq. (5.30) are in good agreement with experimentally-estimated values.
Regular shape Long Flat Irregular shape
(length/windth> 3) (length/width-I
~ 0 ~ Figure 5.35 Systematization of the erosion-debris shape [227]
Louis et al. [227] and Ohlsen [97] perform a preliminary classification of debris shapes (Figure 5.35). They find for steel as well as for aluminum that about 40 % to 50 % of all debris show regular shapes, among them 15 % to 30 % a long-structure. The amount of long-structure debris increases as the abrasive-particle diameter increases. This result indicates a more pronounced micro-cutting mode for the larger abrasives.
5.6.1.2 Contact-Number Estimation
Based on the average debris-particle diameter and on known process parameters, Momber et al. [199] introduce a contact-number that gives the ratio between the number of removed target-material debris to the number of abrasive particles involved in the material-removal process
(5.31)
Figure 5.15 shows results ofEq. (5.31). The range of the estimated contact-numbers is between CN=3 and CN=II, which is surprisingly high and exceeds values reported from dry solid-particle erosion experiments (that are between CN=O.1 and CN=l). Momber et al. explain this phenomenon by the contribution of the high-speed water

136 5. Material-Removal Mechanisms in Abrasive Water-let Machining
flow to the material-removal process at high pump pressures (section 5.3). The estimated contact-numbers as well as the assumed water-flow action are restricted to the material (brittle gray cast iron) and the process conditions applied by these authors. Nevertheless, Figure 6.10, published by Zeng and Kim [230] to illustrate their abrasive water jet cutting-model for brittle materials (section 6.2), suggests contact-number higher than eN =1 at least for this material group.
5.6.1.3 Erosion-Debris Size Distribution Function
Momber et al. [228] find that a Rosin-Rammler-Sperling (RRSB) grain-size distribution according to Eq. (2.9b) describes the distribution of brittle debris separated by an abrasive water jet (section 2.3). Figure 5.36a shows an example. Interestingly, the experimental results obtained from aluminum and steel (taken from [97]) do not fit into a straight line. This result indicates a different materialremoval mode for these conventionally ductile-behaving materials. The values for the reference diameter for the cast iron are between d*=99 Ilm and d*=11O Ilm and decrease with an increase in the pump pressure (Figure 5.37b). These results agree with Figure 5.34.
2 ,-------------------------,
<t-.!: !!!.
~ 0
=. .s .s .,
largel malerial __ sleel
.2 L...J......L-.I..-"-..l-.J.....L ........ ..L....1.....1.....J.......I......I.....J.......&-'--'-'-'
2 3 4 5
In do (debris diameter in I'm)
a . RRSB·distribution
6
i: :;; ;; E ..
7
6
[ 4 c o S 3
~ II)
'6 2 :!l 'iii
o
Iheorelicallimil
1 -multiple comminution 2 - abrasivo water let 3 - torsion bar 4· spall 5· bomb casing
AWJ -2 3
type of loading
4
b . Poisson dislribution [231 J
Figure 5.36 Grain-size distributions for erosion debris
5
The value for the distribution modulus of a grain-size distribution is infinite if the grain sample consists of grains with identical diameters (section 2.3). Related to the abrasive water jet material-removal process, this result is valid in an idealized, homogeneous removal process. Therefore, the distribution modulus characterizes the machining regime. Figure 5.37a shows that the values of n depend on the pump pressure. The values lie between n=1.9 and n=2.6, and exhibit a minimum at a pump pressure of about p=200 MPa. These values are slightly higher than the
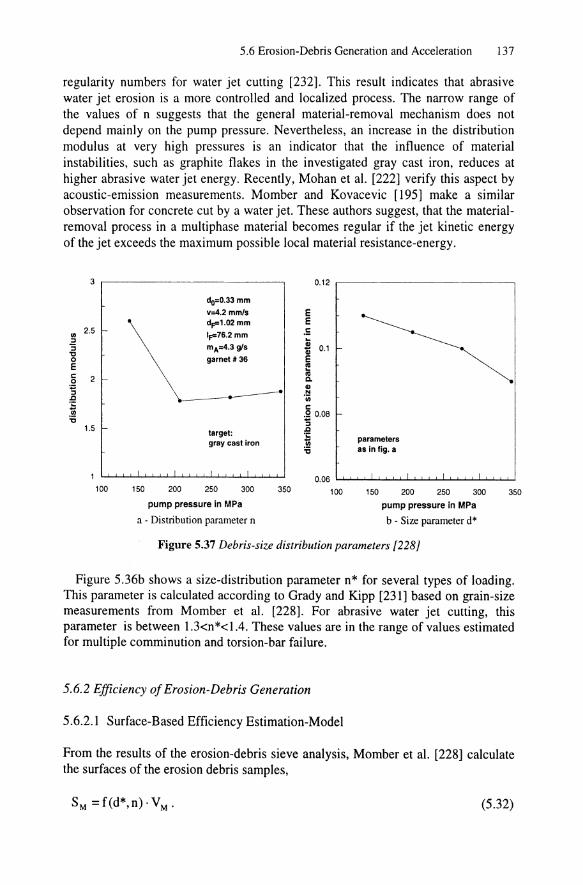
5.6 Erosion-Debris Generation and Acceleration 137
regularity numbers for water jet cutting [232]. This result indicates that abrasive water jet erosion is a more controlled and localized process. The narrow range of the values of n suggests that the general material-removal mechanism does not depend mainly on the pump pressure. Nevertheless, an increase in the distribution modulus at very high pressures is an indicator that the influence of material instabilities, such as graphite flakes in the investigated gray cast iron, reduces at higher abrasive water jet energy. Recently, Mohan et al. [222] verify this aspect by acoustic-emission measurements. Momber and Kovacevic [195] make a similar observation for concrete cut by a water jet. These authors suggest, that the materialremoval process in a multi phase material becomes regular if the jet kinetic energy of the jet exceeds the maximum possible local material resistance-energy.
3
!II 2.5
" :; .., 0 E c: 2 .2 :; ~ 0; 'ii
1.5
1
100
do=O.33 mm
v=4.2 mm/s dp=l.02 mm
1p=76.2 mm
mA=4.3 gls
garnet il36
..------target: gray cast iron
150 200 250 300 350
pump pressure in MPa
a - Distribution parameter n
0.12 ,-----------------,
E E .5 ~
i 0.1 E .. l;j c.
.~ !II c: .20.08 :; .c ~ parameters 'ii as in fig. a
100 150 200 250 300
pump pressure in MPa
b - Size parameter d*
350
Figure 5.37 Debris-size distribution parameters [228]
Figure 5.36b shows a size-distribution parameter n* for several types of loading. This parameter is calculated according to Grady and Kipp [231] based on grain-size measurements from Momber et al. [228]. For abrasive water jet cutting, this parameter is between 1.3<n*<lA. These values are in the range of values estimated for multiple comminution and torsion-bar failure.
5.6.2 Efficiency of Erosion-Debris Generation
5.6.2.1 Surface-Based Efficiency Estimation-Model
From the results of the erosion-debris sieve analysis, Momber et al. [228] calculate the surfaces of the erosion debris samples,
(5.32)

138 5. Material-Removal Mechanisms in Abrasive Water-let Machining
Figure 5.38 plots the surface values against the pump pressure. The surface increases with a rise in the pump pressure. This result explaines due to the smaller average particle-diameter and the higher fineness of the debris samples, and the larger number of removed grains for higher pump pressures. Interestingly, the function drops at a pump pressure of about p=300 MPa.
A certain amount of abrasive water jet-energy contributes to the generation of a certain number of erosion debris
(5.33)
With a known surface of the erosion-debris sample is, this energy approximates
Therefore,
2·r ·S X - M M l-
EA -Ethr
(5.34)
(5.35)
Momber et al. [228] apply Eq. (5.35) to calculate the relation between the pump pressure and XI. The estimated values are between XI=0.017 and XI=0.024 for gray cast iron. The results indicate that about 2.0 % of the abrasive water jet input-energy dissipate during the generation of wear-particle surfaces. These dissipation values are in the range of efficiency values for the impact comminution [43] and single particle-abrasion [233]. As Figure 5.39a shows, the dissipation parameter exhibits a maximum at a pump pressure of about p=180 MPa. This result agrees with Eq. (7.6).
30
N < E 25 E 0 0 o.
20 .. . 5 II IJ
~ 15 :s 1/1 II ii 10 E :I .!! .Q 5 II "tI
0
50
d O=O.33mm
v=4.2 mmls dF=1.02mm
IF=76.2mm
m A =4.3 gl5
garnet II 36
target: gray cast iron
100 150
threshold pressure
200 250
pump pressure in MPa
300 350
Figure 5.38 Pump-pressure influence on the erosion-debris surface [228]

5.6 Erosion-Debris Generation and Acceleration 139
5.6.2.2 Fracture-Based Efficiency Estimation-Model
An alternative experimental procedure to solve Eq. (5.30) bases on the idea that the energy dissipated during the removal of a certain material volume is identical to the dynamic energy, EAbsD, that is absorbed during the compression test of the material (section 6.2). The energy EAbsD is the area under the stress-strain curve of the given material under compression, multiplied by a dynamic parameter (Figure 5.53c). In the engineering literature, a similar parameter is known as the strain energy, that is the area under the tensile stress-strain curve. The strain energy is related to solidparticle erosion processes [234,235]. Thus,
(5.36)
A combination with Eq. (5.33) gives
(5.37)
The stress-strain curves of engineering materials even under compression are complex. Abrasive water jet-experiments on rocks show, that a simplification of the curves yields unsatisfactory results [236]. Momber and Kovacevic [237] perform a study on concrete samples. The absorbed compression fracture energies of these materials, EAbsD , is estimated by integrating the stress-strain curves up to the ultimate strains (Figure 5.53c). The parameter Xl is calculated by Eq. (5.37). Figure 5.39b shows some results. The estimated values are between XI=0.0005 and XI=0.0045, and depend on the material properties as well as on process parameters. These values are one order of magnitude lower than the values calculated with Eq. (5.31). This difference is attributed to the action of the high-speed water flow that contributes to the material removal and is not considered when the absorbed fracture energy is estimated.
5.6.2.3 Parameter Influence on the Efficiency
Figure 5.39b shows that the dissipation parameter Xl almost linearly increases as the material's compressive-strength increases. This result occurs especially for highenergy jets (high pressure, low traverse rate). For low-energy jets, the progress starts to drop at a certain strength value. To further illuminate the material influence on the efficiency of the erosion-debris generation, the estimated dissipation parameters are compared to the machinability-numbers of the investigated materials calculated from Eq. (5.55). A significant reduction of the abrasive water-jet energy involved in the erosion-debris formation is noticed for high machinability-numbers. The more resistant the machined material, the greater percent of the available jet energy is involved in the erosion-debris generation. Thus, from the point of view of the material-removal efficiency, abrasive water jet is more efficient in machine

140 5. Material-Removal Mechanisms in Abrasive Water-Jet Machining
high-resistant materials. It is further noticed that XI decreases with an increase in the pump pressure and a decrease in the traverse rate. Obviously, higher abrasive water jet-energy leads to worse erosion-debris formation efficiency. This trend agrees with the results in Figure 5.39a at least for very high pump pressures.
0.025
0.02 ! >- optimum u c pressure .!!! u
~ 0.015 110=0.33 mm iii > v=4.2 mmls 0 E ¥1.02mm I!! 0.01 mA=4.3 gls 1! garnet 1136
~ target: E 0.005 gray cast iron
50 100 150 200 250 300 350
pump pressure in MPa
a - Target: cast iron [228]
0.0015
>-u c ell ... 0.001 ;: ell
iii > 0 E I!!
~ 0.0005 ell 1;j E
o
__ p=200MPa ___ p=100 MPa
-..-- v=2 mmls ----- v=12 mmls
110=0.457 mm
¥1.27mm
mA=7.41 gls garnet 1136
10 20 30 40
compressive strength in MPa
b - Target: concrete [237]
Figure 5.39 Efficiency of the erosion-debris generation
5.6.3 Erosion-Debris Acceleration
50
After they are separated, the erosion debris undergo an acceleration by the highspeed abrasive-water slurry. This aspect is investigated by Momber [238]. The kinetic energy of the removed wear particles as they leave the cutting site is equal to a certain portion of the kinetic energy of the high-speed slurry
(5.38)
Also, the removed wear particles leave the workpiece with the same velocity as the abrasive-water mixture. Thus,
(5.39)
For straight kerfs, the mass of the removed wear particles is
(5.40)
To solve Eq. (5.37), the velocity of the removed wear particles, VM=VEX, is estimated. Physically, the velocity of a moving slurry is related to its impulse flow,

5.6 Erosion-Debris Generation and Acceleration 141
that is given by Eq. (3.3). Since the mass of the removed wear particles is very small compared to the mass of the abrasive-water slurry (typical values are between 1 % and 5 % [227]).
(5.41)
Therefore,
(5.42)
Momber [238] shows that the impact force of the abrasive water jet significantly drops after the jet leaves the material. This result is due to the energy loss of the jet during the material-erosion process. Additionally, the dynamics of the force signal increases during cutting. This increase is a good indicator for the unsteady materialremoval process in the abrasive water-jet cutting.
Figure 5.40a shows the relation between the workpiece thickness and velocity of the removed wear particles. The velocity decreases as the specimen thickness increases. This decrease is first due to the energy loss of the abrasive water jet during the penetration process. As the penetration depth increases, the amount of dissipated jet energy increases. Secondly, as the workpiece thickness increases, the mass of the wear particles that are accelerated by a given abrasive water-jet kinetic energy also increases. Figure 5.40b illustrates the influence of the workpiece thickness on the kinetic energy of the removed wear particles. The kinetic energy of tbe removed wear particles increases almost linearly as the specimen thickness increases.
185 r-----------------,
175
~ .5 ~ ~ 165
~ .!! .Q
-ll 155
145
o
p=200 MPa do=O.2S4mm
v=2.0mmls d.-O.S mm
mA=12.S gls
garnet 1136
target: aluminum
5 10 15 20 25
workpiece thickness in mm
a - Erosion-debris velocity
0.5
'o'l. .5 0.4 >-E' .. c: .. Qi 0.3
'" >-CI ~ c: .. 0.2 . !! li .. " 0 0.1
!
o
parameters as In fig. a
5 10 15 20
workpiece thickness in mm b - Erosion-debris energy
Figure 5.40 Influence of the workpiece-thickness on the erosion-debris acceleration [238J
25
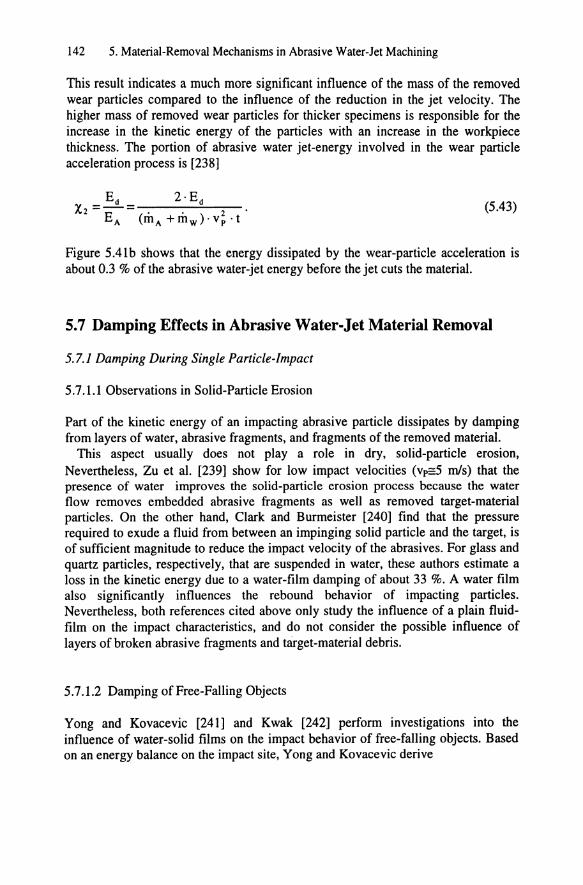
142 5. Material-Removal Mechanisms in Abrasive Water-Jet Machining
This result indicates a much more significant influence of the mass of the removed wear particles compared to the influence of the reduction in the jet velocity. The higher mass of removed wear particles for thicker specimens is responsible for the increase in the kinetic energy of the particles with an increase in the workpiece thickness. The portion of abrasive water jet-energy involved in the wear particle acceleration process is [238]
Ed 2· Ed X2=EA =(mA+mW).V~.t· (5.43)
Figure 5.41b shows that the energy dissipated by the wear-particle acceleration is about 0.3 % of the abrasive water-jet energy before the jet cuts the material.
5.7 Damping Effects in Abrasive Water-Jet Material Removal
5.7.1 Damping During Single Particle-Impact
5.7.1.1 Observations in Solid-Particle Erosion
Part of the kinetic energy of an impacting abrasive particle dissipates by damping from layers of water, abrasive fragments, and fragments of the removed material.
This aspect usually does not play a role in dry, solid-particle erosion, Nevertheless, Zu et al. [239] show for low impact velocities (vp:::5 mls) that the presence of water improves the solid-particle erosion process because the water flow removes embedded abrasive fragments as well as removed target-material particles. On the other hand, Clark and Burmeister [240] find that the pressure required to exude a fluid from between an impinging solid particle and the target, is of sufficient magnitude to reduce the impact velocity of the abrasives. For glass and quartz particles, respectively, that are suspended in water, these authors estimate a loss in the kinetic energy due to a water-film damping of about 33 %. A water film also significantly influences the rebound behavior of impacting particles. Nevertheless, both references cited above only study the influence of a plain fluidfilm on the impact characteristics, and do not consider the possible influence of layers of broken abrasive fragments and target-material debris.
5.7.1.2 Damping of Free-Falling Objects
Yong and Kovacevic [241] and Kwak [242] perform investigations into the influence of water-solid films on the impact behavior of free-falling objects. Based on an energy balance on the impact site, Yong and Kovacevic derive

5.7 Damping Effects in Abrasive Water-let Material Removal 143
2 [ [ ff.Ij l~::~ 5+., 5 + a3 a 3 ·1 F (I h ) = K '. --' M - a . - . h . g p 'F 0 2 'h'2 F
F
(5.44 )
In this equation, I is the film thickness. For uncovered surfaces, a3=0. The accuracy ofEq. (5.44) decreases if notable plastic deformations occur on the impact site. This fact is a serious limitation because plastic deformation is a major feature of solidparticle erosion at high impact velocities even in very brittle materials. The unknown parameters a, to a3 in Eq. (5.44) are approximated from the experimental results. Table 5.7 gives some values for different film mixtures. The force ratio between dry and damped impact is
KJ (0) . [~ . M . h F . g]t R _ Fp (1 = 0, a 3 = 0) _______ =-2 ___ --= __ --::_
F - Fp(l,h F ) - 2 [ [ ff.Ij l~::: . K 5+a3 • _5_+_a_3 . M _ a . _a 3_._1 . h . g
o 2 'h'2 F F
(5.45)
The larger the parameter RF, the more serious the film effects become. Figure 5.41a plots the force ratio for the two different film mixtures that are given in Table 5.7, versus the abrasive velocity (calculated from Eq. (5.46». Notice that the effect of water-mixture film varies greatly with the particle impact-velocity. However, the damping rapidly reaches a stable value and becomes less noticeable. Also, the damping is more serious in the case of a water/abrasive-film.
Table 5.7 Experimentally estimated damping parameters [241 J Film materials Film thickness (I) a, a2 a3 steel powder and water 356.5 11m 0.96 0.22 0.08 garnet and water 1.25 0.16 0.07
Kwak [242] carries out damping experiments with impact bodies of different shapes. Figure 5.41b shows some experimental results of these impact studies. The figure exhibits two remarkable features. First, the influence of the damping effect significantly reduces at high impact velocities. The functions show a saturation behavior similar to that shown in Figure 5.41a. Secondly, the intensity of film damping depends on the shape of the impacting particles.
5.7.1.3 Critical Particle Velocities for Damping
The transition point between the unstable and the stable damping range (Figure 5.41a) is used to calculate a critical abrasive-particle velocity that is required to overcome serious damping effects. This critical velocity is [241]

144 5. Material-Removal Mechanisms in Abrasive Water-let Machining
(5.46)
This purely energetic balance does not consider the influence of the abrasiveparticle size, the abrasive-particle shape, and the abrasive-particle velocity on the certain impact regime and material-removal process. Smaller and sharper particles bring plastic deformations in front. Neglecting this effect, for a spherical garnet abrasive particle with the size mesh # 60, the critical velocity is about vpcr=370 mls. Beyond this abrasive-particle velocity, damping effects on the material-removal mechanism become stable. In Figure 5.41b, a transition impact velocity is noticed, too. This velocity is vpcr=350 mls. Beyond this limit, conical particles are more sensitive to damping effects. A discussion of these effects has not happened.
15 4
film composition: top angle in degree --A-- _tar/steet powder 3.5 --30
_____ 60
~ -- _ter/abrasive ~ __ 45
--ball - -c 10 assumed abrasive: :i 3 S garnet '60 Q, Q,
0 0
! ! 2.5
~ II
stable ! .2 5 range 2 1> limit 1> object ma .. : 5.5 9 tD tD material: carbon steel Q, Q,
.§ S 1.5 a .. umed abrasive:
garnet, ~OO 11 m
0 150 250 350 450 550 650 150 250 350 450 550
abrasive velocity In mls abrasive particle velocity In mls
a - Film composition [241] b - Abrasive-particle shape [242]
Figure 5.41 Influences on the damping10rce ratio
The single-particle impact experiments discussed above enable the estimation of the damping parameter, X3, at a given depth of cut that is characterized by a certain film composition and thickness. Globally, the film thickness increases with an increase in the depth of cut. However, the complete damping function, X3(h), cannot be evaluated by these experiments.

5.7 Damping Effects in Abrasive Water-let Material Removal 145
5.7.2 Damping During Abrasive Water-let Penetration
5.7.2.1 Concept of Force Measurement for Damping Estimation
In the case of cutting-through (characterized here by the symbol 'T') of a specimen by an abrasive water jet, damping effects due to a water-solid film are neglected because the abrasive water jet can leave the workpiece at the bottom exit. The ratio between the energy of the exiting suspension and the energy of the incoming abrasive water jet is the summary of the energies dissipated due to wall friction, heating, and erosion-debris generation and acceleration. Therefore,
(5.47)
Thus,
(5.48)
Consider that the abrasive-mass flow rate is constant during the cutting process (the mass flow of the removed material is neglected). In this case, the ratio between the exit energy and the input energy is the ratio of the square velocities and the ratio of the squares of the measured impact forces, respectively. Thus,
(5.49)
5.7.2.2 Results of Force Measurements
Momber et a1. [237] and Momber and Kovacevic [243] perform experiments to solve Eq. (5.49). Figure 10.40 shows a typical plot of a measured impact force generated by an abrasive water jet during the cutting-through process. The maximum possible depth of cut is estimated by an additional kerfing test under the given process conditions. Figure 5.42 exhibits some results of the experiments. The results approximate a second-order polynomial,
(5.50)
The value for X3(h=hmax) is obtained by using the regression parameters A3 to C3.
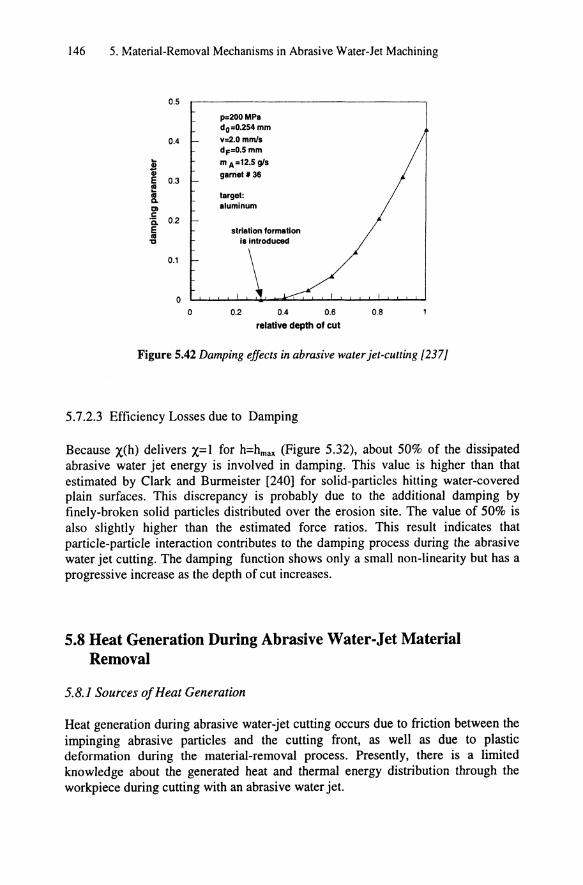
146 5. Material-Removal Mechanisms in Abrasive Water-let Machining
0.5
p=200MPa dO=0.254 mm
0.4 v=2.0 mmls dF=O.5 mm
~ m A =12.5 g/s
E 0.3 gametl36
!!! 01 target: Co
aluminum DI c 'il. 0.2 E striation formation 01
is introduced "0
0.1 \ 0
0 0.2 0.4 0.6 0.8
relative depth of cut
Figure 5.42 Damping effects in abrasive water jet-cutting [237J
5.7.2.3 Efficiency Losses due to Damping
Because X(h) delivers X=l for h=hmax (Figure 5.32), about 50% of the dissipated abrasive water jet energy is involved in damping. This value is higher than that estimated by Clark and Burmeister [240] for solid-particles hitting water-covered plain surfaces. This discrepancy is probably due to the additional damping by finely-broken solid particles distributed over the erosion site. The value of 50% is also slightly higher than the estimated force ratios. This result indicates that particle-particle interaction contributes to the damping process during the abrasive water jet cutting. The damping function shows only a small non-linearity but has a progressive increase as the depth of cut increases.
5.8 Heat Generation During Abrasive Water-Jet Material Removal
5.B.1 Sources of Heat Generation
Heat generation during abrasive water-jet cutting occurs due to friction between the impinging abrasive particles and the cutting front, as well as due to plastic deformation during the material-removal process. Presently, there is a limited knowledge about the generated heat and thermal energy distribution through the workpiece during cutting with an abrasive water jet.

5.8 Heat Generation During Abrasive Water-let Material Removal 147
5.8.2 Results from Thermocouple Measurements
5.8.2.1 General Results
Ohadi et al. [226] and Ohadi and Whipple [244] perform preliminary experimental studies into the thermal energy distribution in a specimen cut by an abrasive water jet. In these investigations, the authors use thermocouples for measuring the temperature at several locations in the workpiece. The maximum developed temperature is T-To=75°C, where To is the room temperature.
5.8.2.2 Process-Parameter Influence
Figure 5.43a shows that the temperature, especially directly on the cutting front, remarkably depends on the pump pressure. The higher the pump pressure, the higher the specimen temperature. This result is probably due to the higher abrasive particle impact-velocities that increase frictional forces and the amount of plastic deformation in the ductile material. Nevertheless, at locations far from the cutting front, the pump pressure influence is not that significant.
Ohadi and Cheng [245] investigate the influence of the traverse rate on the heat development. Figure 5.44 illustrates that a lower traverse rate results in a higher heat input. This increase is attributed to the larger number of abrasive particle-cut surface contacts [see Eg. (2.13)] per unit traverse length at a lower traverse rate. A second striking feature of Figure 5.44 is that at the immediate vicinity of the abrasive water jet, the temperature contours approach the contour of the heat wave for a stationary jet that is a family of circles. With an increase in the distance from the abrasive water jet, the temperature contours approach a family of ellipses.
ao
t7 I-
60 CI>
" " CI> Q; : <5 40
:!! ::J e ., c. E 20 !
o 5
locations: 1-6: l.t 'ow (closest to the cutting !,ont) 7-12: 2nd 'ow 13-18: 3,d 'ow
10 15 20
number of thermocouple
a - Pump pressure
25
~ ~--~-~~---------------, 0 - ':'.-: . • 7
~ : ~:~: :~ ~ : ~:~: : i~ o· i .t. - :"
0.0 20.0 iO.O 6C.0 eo.o
time in s
b - Time of exposure
Figure 5.43 Parameter influence on the workpiece temperature [226]
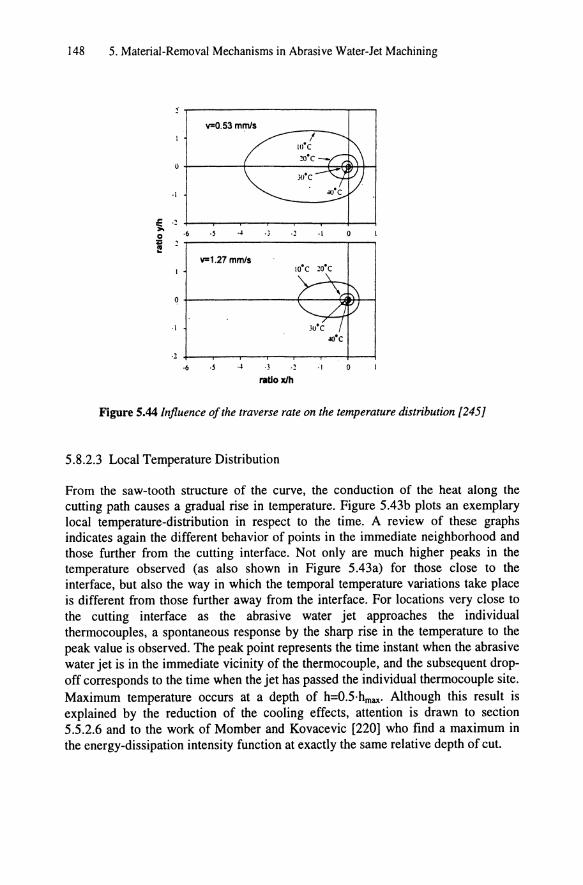
148 5. Material-Removal Mechanisms in Abrasive Water-Jet Machining
~.
V=O.53mmls I
w·e
J(tc
·1
t ·1
0 ·6 ·5 .~ .J ·1 , v=1.27 mmls
IO·C 10·C
0
·1
·2
·6 ·5 .~ .J ·1 0
ratloxlh
Figure 5.44 Influence of the traverse rate on the temperature distribution f245I
5.8.2.3 Local Temperature Distribution
From the saw-tooth structure of the curve, the conduction of the heat along the cutting path causes a gradual rise in temperature. Figure 5.43b plots an exemplary local temperature-distribution in respect to the time. A review of these graphs indicates again the different behavior of points in the immediate neighborhood and those further from the cutting interface. Not only are much higher peaks in the temperature observed (as also shown in Figure 5.43a) for those close to the interface, but also the way in which the temporal temperature variations take place is different from those further away from the interface. For locations very close to the cutting interface as the abrasive water jet approaches the individual thermocouples, a spontaneous response by the sharp rise in the temperature to the peak value is observed. The peak point represents the time instant when the abrasive water jet is in the immediate vicinity of the thermocouple, and the subsequent dropoff corresponds to the time when the jet has passed the individual thermocouple site. Maximum temperature occurs at a depth of h=O.5·hmax• Although this result is explained by the reduction of the cooling effects, attention is drawn to section 5.5.2.6 and to the work of Momber and Kovacevic [220] who find a maximum in the energy-dissipation intensity function at exactly the same relative depth of cut.

5.8 Heat Generation During Abrasive Water-let Material Removal 149
5.8.3 Results from Infra red-Thermography Measurements
5.8.3.1 General Remarks
Using infrared-thermography, Kovacevic et al. [208] and Mohan et al. [246] conduct an alternative systematic study in the temperature generation in workpieces cut by an abrasive water jet. The results of the infrared measurements are presented by two methods, namely isotherms and linescans. Isotherms are the loci of points of equivalent temperatures; whereas, linescans are thermal profiles along selected lines. Several process parameters, such as pump pressure, traverse rate, and the distance between the coated and cut surface, are varied in order to analyze their influence on the generated thermal energy.
5.8.3.2 Process-Parameter Influence on Linescans
Figure 5.45a plots the linescans along the middle of the coated surface with a change in the pump pressure. These linescans indicate that with an increase in the pump pressure, the workpiece temperature increases. This result is in agreement with Figure 5.43a and is explained by similar arguments as for this figure. Figure 5.46a shows the variation of the estimated heat flux with change in the pump pressure. From this figure, with an increase in the pump pressure, the heat flux at the kerf increases linearly and causes the workpiece temperature to increase.
Figure 5.45b shows the linescans for different traverse rates. With the increase in the traverse rate, there is a marginal increase in peak temperatures. This result is consistent with Figure 5.44. The heat-flux graph in Figure 5.46b reflects the same trend.
!;l 1: 1: f a I! X. E S
811
80
IS6
150
46
40 . 3Ii
30
25
... cut direction ",,1.06 mm/ • d.~0.2Mmm
d,-G.162mm rnA-S.l g/s gamet.80
workpiece: aluminum
.-------- ps 241 MPa -_ p-276MPI ------. 1"'310 MP.
~~~~~~~~~~~~~ o 10 ro 30 40 150
workpiece length In mm
a - Pump pressure
!;l .: .: f
i • Q.
E S
611
... cut direction p~276 MP.
80 parameters .s ng .•
55 fA .. , .-
,~~\ 150 ".. .. ~,
'\
46 '\ ," '\
40 '",'-, ,,~:~, .. <'f\
35 .... _",\
workpiece: aluminum 30
25 --------- v~O.85 mm/. --- v~I.06mm/. ------- v~I.27 mm/.
ro~~~~~~~~~Tr~~ o 10 20 30 40 150
workpiece length In mm
b - Traverse rate
Figure 5.45 Infrared-thermography linescans for different cutting conditions {20S J
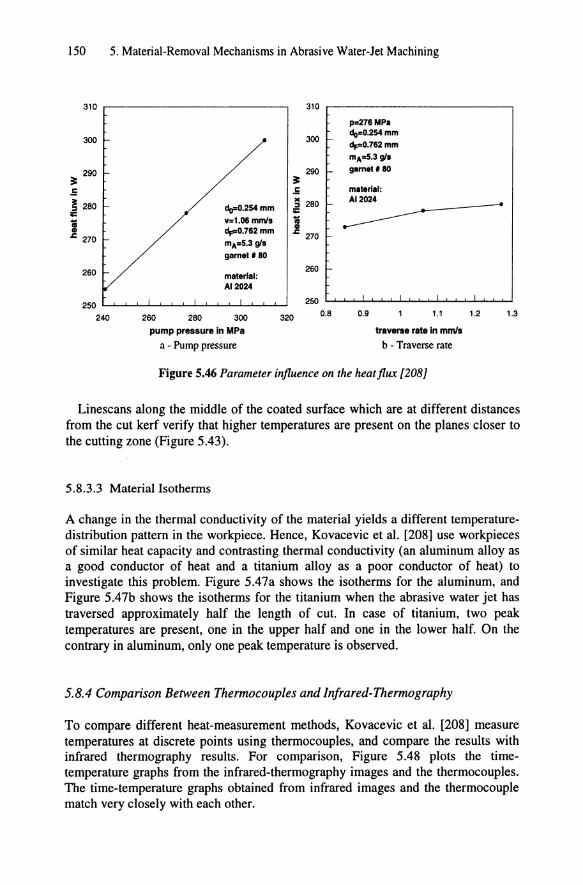
150 5. Material-Removal Mechanisms in Abrasive Water-Jet Machining
310 ,----------------,
300
290 ~ .5
~ .5
310
300
290
p=276MPa dg=0.254mm ¥0.762mm mA=5.3 gI_ garnet' 80
mlterial:
~ 280 ;:
i do=O.254mm v=I.06 mml8 ¥0.762mm
~ 280
'Iii CD ::------
~ 270 mA=5.3 gl8
~ 270
garnet' 80
260 material: 260
AI 2024
250 L.......i.--'--'--'-J........J--I.-'--'--I--I--J,--'--'-............ 250
240 260 280 300
pump pressure In MPa
a - Pump pressure
320
I-
r--
I
0.8 0.9
I I
1.1
traverse rate in mmls
b - Traverse rate
Figure 5.46 Parameter influence on the heatflux {20B]
I
1.2 1.3
Linescans along the middle of the coated surface which are at different distances from the cut kerf verify that higher temperatures are present on the planes closer to the cutting zone (Figure 5.43).
5.8.3.3 Material Isotherms
A change in the thermal conductivity of the material yields a different temperaturedistribution pattern in the workpiece. Hence, Kovacevic et al. [208] use workpieces of similar heat capacity and contrasting thermal conductivity (an aluminum alloy as a good conductor of heat and a titanium alloy as a poor conductor of heat) to investigate this problem. Figure 5.47a shows the isotherms for the aluminum, and Figure 5.47b shows the isotherms for the titanium when the abrasive water jet has traversed approximately half the length of cut. In case of titanium, two peak temperatures are present, one in the upper half and one in the lower half. On the contrary in aluminum, only one peak temperature is observed.
5.8.4 Comparison Between Thermocouples and Infrared-Thermography
To compare different heat-measurement methods, Kovacevic et al. [208] measure temperatures at discrete points using thermocouples, and compare the results with infrared thermography results. For comparison, Figure 5.48 plots the timetemperature graphs from the infrared-thermography images and the thermocouples. The time-temperature graphs obtained from infrared images and the thermocouple match very closely with each other.

5.8 Heat Generation During Abrasive Water-Jet Material Removal 151
The overall workpiece temperature increases as time progresses, indicated by the slightly higher peak temperature towards the end of the cut. The temperature plots in Figure 5.48 show that the lower thermocouple (as well as the corresponding pixel) reaches its peak temperature slightly later than the upper thermocouple (corresponding pixel). This occurrence is due to the deflection of the abrasive water jet away from the direction of cut. Also, the peak temperature of the bottom thermocouple is marginally higher than the top one. This trend is due to the higher frictional forces in the lower cutting zone.
(a)
+ Position of the Nozzle
Figure 5.47 Isotherms acquired during the abrasive wate- jet cutting [208J a - Aluminum, b -Titanium
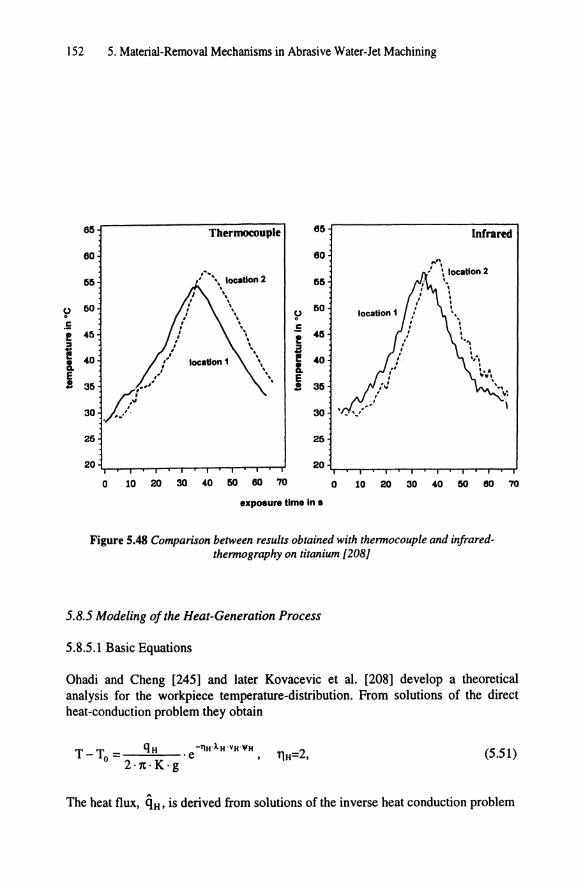
152 5. Material-Removal Mechanisms in Abrasive Water-let Machining
65 Thermocouple 65 Infrared
60 60 ... "
,'. 1 \ location 2 55 I' '\ location 2 55 . , ... , • , • , · ~ 50 " 0 50 location 1 \ , . , . -. .5 " , .5 .
! 45 . ! 45 . ,
t"'t :! , " ! .
I! , • 40 40 '"., !. \\ !. . E ' ..
E -.. J!
, 35 J! 35
30 30 . 25 25
20 20
0 10 20 30 40 50 60 70 0 10 20 30 40 110 60
exposure time In IS
Figure 5.48 Comparison between results obtained with thermocouple and infraredthermography on titanium [208]
5.8.5 Modeling of the Heat-Generation Process
5.S.5.1 Basic Equations
. .. ~:
70
Ohadi and Cheng [245] and later Kovacevic et al. [20S] develop a theoretical analysis for the workpiece temperature-distribution. From solutions of the direct heat-conduction problem they obtain
(5.51)
The heat flux, qH' is derived from solutions of the inverse heat conduction problem

5.8 Heat Generation During Abrasive Water-let Material Removal 153
m n (5.52)
LLG(i,j)2 i=l j=l
The complete deviations are given in the original papers.
5.8.5.2 Results of the Modeling
Ohadi and Cheng's model delivers satisfactory agreements with the experiments for the locations close to the interface. With an increase in the distance from the cutting interface, the model accuracy drops. Also, the model does not hold for the entry and the exit zone of the abrasive water jet in the workpiece.
~ .5 ! a I! !. E !
16
cul direction - » 10
116
110
•• .0
36
3Ot~ ____ ~ -- Mod"P-~H'MPa ------- ModelP-216WPa
2ti --- Mod" P-J'OtWa ••• IA P-241WPa
v-1.06 mmll distance: 2.11' mm
+ ... t IR P-216MPa ••• IR P-l101.1Pa
oo~~~~~~~~~~~~~~~~~~~~~~ 10 30 .0 60
workpiece length In mm
Figure 5.49 Comparison between calculated workpiece temperatures and experimental results [208J
Figure 5.49 plots temperature distributions calculated by Kovacevic et al. for various pump pressures. The model and the experimental data have a very close correlation with an RMS-error <1.5°C. This accuracy indicates that Eq. (5.51) is fairly accurate. The model and the infrared measurements results match very closely as the heat source approaches the point of observation and after it leaves. The predicted temperature of the model is higher than the infrared-thermography results when the heat source is farther behind the point of observation. This result is because the specimen has a finite length; whereas, the model is derived for the general case of a workpiece of infinite length. However, as the primary objective of

154 5. Material-Removal Mechanisms in Abrasive Water-let Machining
a thermal analysis in abrasive water-jet cutting is to predict/measure the maximum temperature at the cutting zone so as to avoid material failure, these discrepancies can be ignored.
5.9 Target-Material Property Influence on Material Removal
5.9.1 Hardness and Modulus of Fracture
5.9.1.1 General Observations
Hunt et al. [247] perform an early investigation that relates the mechanical material properties to the abrasive water-jet cutting process. Using an abrasive water jet for piercing, these authors investigate the influence of the material's Brinell-hardness as well as the modulus of fracture on the piercing time. The modulus of fracture is (Figure 5.50)
(5.53)
Figure 5.51 shows results of this study. The general trend in Figure 5.51a is that the piercing time increases as the material hardness increases. However, two materials do not exactly fit into the linear relationship. For ceramics, high hardness is often combined with a low modulus of fracture. Figure 5.51b shows that the relation between this property and the piercing time is approximately linear for all materials, except the ceramics.
Matsui et al. [236] conduct very similar experiments and find that the hardness (Vickers) alone is not a suitable property to describe the resistance of a ductilebehaving as well as a brittle-behaving material against abrasive water-jet cutting (Figure 5.52a).
(a) Brittle Material (b) Ouctile Material
ecr
Mr,dyn= koja(e) da o
kO >1
(c) Pre-cracked Quasi-brittle
Material
Figure 5.50 Modulus of fracture of different types of materials
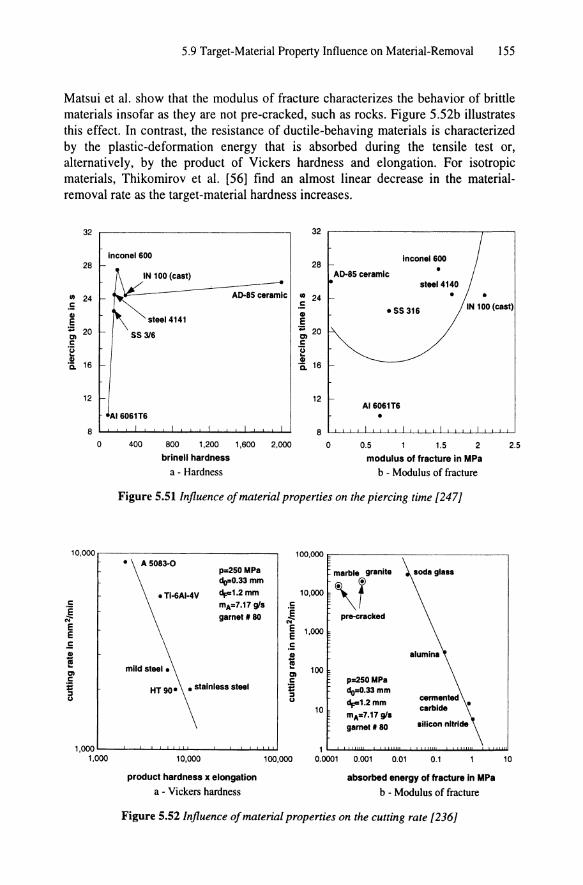
5.9 Target-Material Property Influence on Material-Removal 155
Matsui et aJ. show that the modulus of fracture characterizes the behavior of brittle materials insofar as they are not pre-cracked, such as rocks. Figure 5.52b illustrates this effect. In contrast, the resistance of ductile-behaving materials is characterized by the plastic-deformation energy that is absorbed during the tensile test or, alternatively, by the product of Vickers hardness and elongation. For isotropic materials, Thikomirov et al. [56] find an almost linear decrease in the materialremoval rate as the target-material hardness increases.
32 32
Inconel600 Inconel600 28 28
IN 100 (cast) AD-8S ceramic ..... steel 4140 III 24 AD-8S ceramic .. 24 .5 .5 • SS 316 IN 100 (cast) ell ell
,g steel 4141 E C)
20 SS 3/6 ~ 20 c c 't; ~ .! ell Co 16 'Q. 16
12 12 AI6061T6
A16061T6 • 8 8
0 400 800 1.200 1.600 2.000 0 0.5 1.5 2 2.5
brinell hardness modulus of fracture in MPa
a - Hardness b - Modulus of fracture
Figure 5.51 Influence of material properties on the piercing time [247]
10,000 100,000 A 5083-0
p=2S0 MPa marble granite soda glass 110--0.33 mm
" o TI-6AI-4V 4=1.2 mm 10,000 c mA=7.17 gl5 c 'E ~ ... garnet 1180 pre-cracked E E 1,000 E E .5 .5
! ell alumina
mild steel 0 e 100 C) C) c c p=2S0MPa E HT90° o stainless steel E dg=0.33mm ::I ::I cennented ... ... 4=1.2mm
10 carbide mA=7.17 gls garnet 1180 silicon nitride
1,000 1 1,000 10,000 100,000 0.0001 0.001 0.01 0.1 10
product hardness x elongation absorbed energy of fracture in MPa
a - Vickers hardness b - Modulus offracture
Figure 5.52 Influence of material properties on the cutting rate [236]

156 5. Material-Removal Mechanisms in Abrasive Water-let Machining
Miranda et al. [248] find during rock cutting experiments that the exit angle of an abrasive water jet increases with an increase in the micro-hardness of the rocks. Because the exit angle expresses the energy absorbed in the material during abrasive water-jet cutting [224], harder rocks dissipate more abrasive water-jet energy during the cutting process.
5.9.1.2 'Two-Stage' Resistance Approach
Hashish [249], who does not consider these early investigations suggests, based on his two-zone cutting model, a combination of mechanical properties to describe the materials resistance against the 'cutting wear' and the 'deformation wear'. According to this model (chapter 6), the entire depth of cut is
(5.54)
Hashish assumes that the 'cutting-wear' depth depends on the Vickers hardness of the material; whereas, the 'deformation-wear' depth is a function of the Young's modulus. Thus,
A B h=--+-.
..jH; EM (5.55)
These relations are well known from solid-particle erosion. For example, Eyres [250] points out that the material hardness determines the erosion resistance under shallow angles; whereas, the volume removal due to large angles depends on the Young's modulus.
5.9.2 Concepts of Material Machinability
5.9.2.1 The 'Machinability Number'
Zeng et al. [251] develop the machinability number (section 6.2) to define the material resistance in the abrasive water-jet cutting. Table 5.8 lists machinability numbers of several engineering materials. Considering only 'classical' mechanical parameters, this number is
(5.56)
Because the flow stress is often proportional to the hardness for ductile-behaving materials [32] and Nmoch,

5.9 Target-Material Property Influence on Material-Removal 157
This equation has a very similar structure as Eq. (5.55). However, Eq. (5.57) is partly in contrast to experimental results obtained on rocks and concretes.
Table 5.8 Machinability numbers of engineering materials
Material Machinability number Absolute Relative (%)
Alumina Ceramic AD 85 17.3 8.1 Alumina Ceramic AD 90 10.3 4.8 Alumina Ceramic AD 94 17.3 8.1 Alumina Ceramic AD 99.5 13.1 6.2 Alumina Ceramic AD 99.9 1.6 0.8 Aluminum, AL 6061-T6 213 100 Asphalt Concrete 461 216 B4C 4.2 2 Concrete (medium strength) 516 242 Concrete (high strength) 468 220 Copper 110 52 Dupont Corian 455 214 Glass 596 280 Granite 322 151 Graphite 875 411 Gray Cast Iron 121 57 Lead 490 230 Magnesia Chromite 430 202 Mortar 858 403 Nylon 538 252 Pine Wood 2,637 1,240 Plexiglas 690 324 Polypropylene 985 462 Refractory bauxite 106 50 Silica Carbide 12.6 6 Silica Ceramic Si3N4, hot pressed 1.1 0.5 Silica Ceramic SS 304 81.9 38 Silica Ceramic SS 316L 83.1 39 Sintered Magnesia 408 190 Stainless Steel 304 115 52 Steel, ASTM A34 87.6 41 Ti3B2 4.3 2 Titanium 115 54 Tool Steel 901 120 56 White Marble 535 251 Zinc-Allo;! 136 64

158 5. Material-Removal Mechanisms in Abrasive Water-Jet Machining
Momber et al. [252], for example, find that the resistance of concrete against the abrasive water jet increases with an increase in the diameter of the inclusion grains (Figure 5.53a). He~ling [253] observes the same tendency during rock cutting. In this study, the rock with the largest grains is very difficult to cut (Figure 5.53b). He~ling find that the energy release rate, that depends on the surface energy, 'YM, is only weakly related to the depth of cut in brittle rocks. On the other hand, the reverse relation between material resistance and Young's modulus is confirmed (Figure 5.55).
Like all other material properties, a variation in the machinability number must be expected. For aluminum, for example, this number varies within ±1O % for 61 % of the data and within ±20 % for 90 % of the data. If a standardized set of process parameters is used, the erroris less than ±1O %. The concept of a machinability number is extended to other machining operations, such as turning and piercing (chapter 9).
160 180
• .,..100-200 MPa pump pressure in MPa
110--0.6 mm
__ 100 -+- 350
150 __ 250
e v=10-30 mmIs e 120 dr:=2.8 mm do--o.457 mm .5 mA=30'iis e 120 v=4mmls ~ • quartz sand
e dr:=1.27 mm u .5
'0 elektrokorund = mA=7.41 'iis I:! 80 • u 90 garnet. 36 ii. target: '0 ~ rocks t f II 60
"a
II 40 > • • • I • 30
• 0 0
0 0.2 0.4 0.6 O.B 10 20 30 40 50 60 70
quartz grain diameter In mm coarse aggregate Inclusions In %
a - Limestone grains in concrete (authors} b - Quartzite grains in rock [253]
Figure 5.531njluence of the inclusion-grain size on the depth of cut
5.9.2.2 Other 'Machinability' Conceptions
In their cutting model, Capello and Gropetti [225] introduce a 'machinability parameter' '(I. Nevertheless, the authors report values for only three engineering materials (Table 6.8), and do not install relationships to conventional strength parameters. Also, a comparison of the '(I-values for aluminum and glass show a difference of more than one order of magnitude. In Table 5.8, the difference in the corresponding machinability numbers is only about 250 %.
Gou et al. [254] develop a database that relates the specific cutting efficiency of material to a reference material. As the reference material, the authors use aluminum. Table 5.9 lists several materials. Good agreement with the order of materials obtained by using the machinability number is noticed.
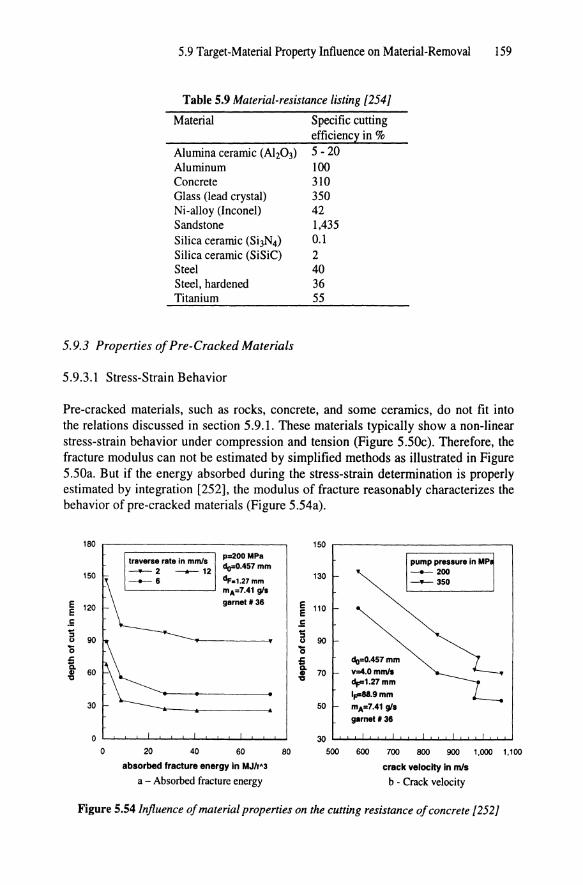
5.9 Target-Material Property Influence on Material-Removal 159
Table 5.9 Material-resistance listing [254J
Material
Alumina ceramic (A1203) Aluminum Concrete Glass (lead crystal) Ni-alloy (Inconel) Sandstone Silica ceramic (Si3N4)
Silica ceramic (SiSiC) Steel Steel, hardened Titanium
5.9.3 Properties of Pre-Cracked Materials
5.9.3.1 Stress-Strain Behavior
Specific cutting efficiency in %
5 - 20 100 310 350 42 1,435 0.1 2 40 36 55
Pre-cracked materials, such as rocks, concrete, and some ceramics, do not fit into the relations discussed in section 5.9.1. These materials typically show a non-linear stress-strain behavior under compression and tension (Figure 5.50c). Therefore, the fracture modulus can not be estimated by simplified methods as illustrated in Figure 5.50a. But if the energy absorbed during the stress-strain determination is properly estimated by integration [252], the modulus of fracture reasonably characterizes the behavior of pre-cracked materials (Figure 5.54a).
180 150
traverse rate in mmls p=200MPa
pump pressure in MP __ 2 ----.- 12 do=O.457mm
--200 150 ~.1.27mm 130 --350
mA=7.41 gls
E 120 garnet 1/36 E 110 E E
.5 .5 '5
90 '5
90 u u 0 0 :; :; 110=0.457 mm a.
60 a. v=4.0mmls .. ., 70
" " dp=1.27mm
1F"'88.9mm 30 50 mA=7.41 gls
garnet .36
0 30
0 20 40 60 80 500 600 700 800 900 1,000 1,100
absorbed fracture energy in MJ/rA3 crack velocity in mls
a - Absorbed fracture energy b - Crack velocity
Figure 5.54 Influence of material properties on the cutting resistance of concrete [252J

160 5. Material-Removal Mechanisms in Abrasive Water-Jet Machining
5.9.3.2 Relations to Conventional Testing Procedures
Momber et al. [252], Hepling [253] and Momber and Kovacevic [255] carry out systematic investigations in the resistance of rocks and concrete against abrasive water-jet cutting. Using statistical methods, Momber et al. [252] find that the crack velocity of concrete shows the strongest relation to the depth of cut generated by an abrasive water jet (Figure 5.54b).
E E .s ; ()
"0 J:. a III "C III 01 I!! ~ III
160
120
80
40
0
0
160
p=100-2oo MPa p=100-2OO MPa do=0.6mm do=O.6mm v=1G-30 mmls E v=1G-30 mmls dp=2.8mm E 120 dr-2•8mm mA=30 gls .5 mA=30 gls quartz sand 5 quartyz sand ()
elekrtokorund "0 elektrokorund J:. 80
target: a target: rocks rocks III
"C III 01 I!! ~ 40 III
0
30 60 90 0 0.4 0.8 1.2 1.6 2
dynamic Young's modulus in GPa fracture toughness in MNI,A1.5
105
95
E 85 E .s ;
75 ()
"0
= Q. 65 III
"C
55
45
0
target: concrete
10
abrasive mass flow rate In gls -- 6.12 __ 10.6
20
p=200 MPa do=O.457mm v=4.0mmls df"1.27mm gamet II 36
30 40
Young's modulus in GPa
50
Figure 5.55 Influence of strength parameters on the depth of cut in pre-cracked. multi phase materials [252. 253 J
2.4
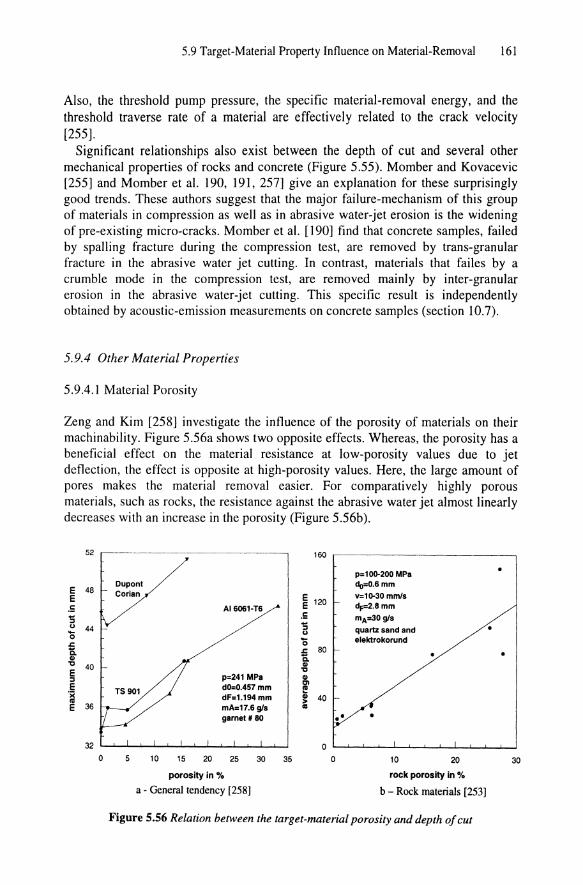
5.9 Target-Material Property Influence on Material-Removal 161
Also, the threshold pump pressure, the specific material-removal energy, and the threshold traverse rate of a material are effectively related to the crack velocity [255].
Significant relationships also exist between the depth of cut and several other mechanical properties of rocks and concrete (Figure 5.55). Momber and Kovacevic [255] and Momber et al. 190, 191, 257] give an explanation for these surprisingly good trends. These authors suggest that the major failure-mechanism of this group of materials in compression as well as in abrasive water-jet erosion is the widening of pre-existing micro-cracks. Momber et al. [190] find that concrete samples, failed by spalling fracture during the compression test, are removed by trans-granular fracture in the abrasive water jet cutting. In contrast, materials that failes by a crumble mode in the compression test, are removed mainly by inter-granular erosion in the abrasive water-jet cutting. This specific result is independently obtained by acoustic-emission measurements on concrete samples (section 10.7).
5.9.4 Other Material Properties
5.9.4.1 Material Porosity
Zeng and Kim [258] investigate the influence of the porosity of materials on their machinability. Figure 5.56a shows two opposite effects. Whereas, the porosity has a beneficial effect on the material resistance at low-porosity values due to jet deflection, the effect is opposite at high-porosity values. Here, the large amount of pores makes the material removal easier. For comparatively highly porous materials, such as rocks, the resistance against the abrasive water jet almost linearly decreases with an increase in the porosity (Figure 5 .56b).
52 160
p=100-200 MPa
E 48 Dupont do=O.6mm
E Coria" ~ 120
v=1Q-30 mmls
.5 AI6061-T6 dp2.8mm
'S .5 mA=30 g/s u 44 'S quartz sand and 'l5 u
.c 'l5 elektrokorund
'is. t 80 CD
" 40 CD
E " ::s p=241 MPa CD
E dO=O.4S7mm til
T5901 ; ';( dF=1.194 mm 40 Ol > E 36 mA=17.6 g/s ..
garnet 1180 .. 32 0
0 5 10 15 20 25 30 35 0 10 20 30
porosity in 'Yo rock porosity in 'Yo
a - General tendency [258] b - Rock materials [253]
Figure 5_56 Relation between the target-material porosity and depth of cut

162 5. Material-Removal Mechanisms in Abrasive Water-Jet Machining
5.9.4.2 Thermal-Shock Factor
For ceramics, Kahlman et al. [193] suppose an alternative mechanism of thermal spalling. This spalling is the result of the creation of highly-localized temperatures (T::1280°C). The main resistance parameter against this type of failure in brittle materials is a thermal-shock factor,
(5.58)
Figure 5.57 presents some results. The figure indicates a decrease in the removed volume with an increase in the thermal-shock resistance. The somewhat low cutting resistance of the aluminum whisker is explained by a reinforcement mechanisms of the whiskers that locally reduces fracture and holds the matrix together. This alternative material-resistance parameter needs some further support from additional experimental work. Eq. (5.58) shows the same Young's modulus dependence as all equations presented in this section.
200
160
'" E E .5 120
~ ::J '0 > 80 1 " ~
40
0 0
• •
4 8 12
p=310MPa dF=O·76mm mA=4·2gfs gamel.ao
16
thermal shock resistance In W/mm
20 24
Figure 5.57 Relation between the thermal shock resistance of ceramics and material-volume removal [193 J