Embed Size (px)
Citation preview
Abrasive Slurry Jet Micro-Machining of Talc Filled
Polypropylene - Planar Area, Transitional Slope and
Curved Edges Machining
by
Neda Tamannaee
A thesis submitted in conformity with the requirements for the degree of Master of Applied Science
Department of Mechanical and Industrial Engineering University of Toronto
© Copyright by Neda Tamannaee 2015
ii
Abrasive Slurry Jet Micro-Machining of Talc Filled Polypropylene-
Planar Area, Transitional Slope and Curved Edges Machining
Neda Tamannaee
Master of Applied Science
Graduate department of Mechanical and Industrial Engineering
University of Toronto
2015
Abstract
The abrasive slurry-jet erosion of a talc-filled TPO (60% PP, 25% EP rubber and 15% talc) was
measured as a function of the impact angle and the talc filler content. A ductile erosion response
was observed, showing a maximum erosion rate at 45°. A superposition model was then
developed to predict the cross-sectional shapes of small-scale flat-bottomed pockets and curved
edges machined in TPO using abrasive slurry-jet micro-machining (ASJM). The model was
based on the spatial distribution of the erosion across the jet footprint measured during a shallow
“first pass” channel at a specific angle. The model predictions of planar depth and waviness were
in close agreement with experimental measurements. The measured dependence of the erosion
rate on the impact angle was used to develop novel machining configurations to increase the
slope of bounding sidewalls. A model was then developed to predict these slopes.

iii
Acknowledgments
I would like to express my deepest appreciation to my supervisors, Dr. Jan K. Spelt and Dr.
Marcello Papini; without their guidance and persistence help this thesis would not have been
possible.
I would like acknowledge the support of Natural Sciences and Engineering Research Council of
Canada, Canada Research Chairs, POLYCON Industries, and MAGNA International Inc.
Grateful acknowledgement must be paid to my beloved husband, Mehran, for his special support
and understanding through my study period. This job would not be accomplished unless through
his passion-infusing advice.
I would like to thank my parents; if it was not for their endless love and consideration for twenty
five years, I would not be standing anywhere near this.
Moreover, I would like to thank my fellow researchers for the great work space we had together
during my study period; Dr. Kamyar Hashemnia, Hooman Nouraei, Amir Nourani, Saeed Akbari
and Kavin Kowsari.
This thesis is dedicated to my future children.

iv
Table of Contents
Contents
Acknowledgments.......................................................................................................................... iii
Table of Contents ........................................................................................................................... iv
List of Tables ................................................................................................................................. vi
List of Figures ............................................................................................................................... vii
Chapter 1 Introduction .....................................................................................................................1
1.1 Overview ..............................................................................................................................1
1.2 Motivation ............................................................................................................................5
1.3 Thesis Outline and Objectives .............................................................................................5
Chapter 2 Experimental Analysis on Talc-Filled Polypropylene for Erosion Characterization,
Planar Area and Curved Edge Machining ...................................................................................7
2.1 Overview ..............................................................................................................................7
2.2 Experimental Apparatus.......................................................................................................7
2.3 Abrasive Slurries ..................................................................................................................8
2.4 Target Material.....................................................................................................................9
2.5 Erosion Characterization ......................................................................................................9
2.6 Roughness Measurement ...................................................................................................14
2.7 Effect of Filler Concentration ............................................................................................14
2.8 Planar Area Machining ......................................................................................................15
2.9 Curved Edge Machining ....................................................................................................16
Chapter 3 Erosive Efficacy Superposition Modeling and Nozzle Path Plan Algorithm for
Machining Edges and Planar Areas ..........................................................................................17
v
3.1 Overview ............................................................................................................................17
3.2 Erosive Efficacy Function..................................................................................................17
3.3 Superposition Model for Machining Planar Area ..............................................................19
3.4 Superposition Model for Machining a Curved Edge .........................................................24
Chapter 4 Experimental Results and Superposition Model Verification for Machining Planar
Area and Curved Edges .............................................................................................................26
4.1 Overview ............................................................................................................................26
4.2 Erosion Characterization ....................................................................................................26
4.2.1 Effect of Angle of Attack .......................................................................................26
4.2.2 Roughness Measurements ......................................................................................29
4.3 Planar Area Machining ......................................................................................................30
4.4 Curved Edge Machining ....................................................................................................41
4.5 Control of Side-Wall Slope ................................................................................................45
Chapter 5 Conclusion .....................................................................................................................50
5.1 Summary ............................................................................................................................50
5.2 Contributions......................................................................................................................51
References ......................................................................................................................................52

vi
List of Tables
Table 1 ASJM experimental conditions ........................................................................................ 12
Table 2 Predicted and measured depth and waviness. ................................................................. 39
Table 3 Predicted and measured depth and waviness for machined planar areas with smoothing
passes. ................................................................................................................................... 40
Table 4-Machining parameters for edge (c) in Fig. 4-9. δ =100 μm. ΔXi =200 μm. ..................... 43

vii
List of Figures
Figure 2-1 ASJM Apparatus Set up (not to scale) (Kowsari 2013) ................................................ 8
Figure 2-2 Talc-filled polypropylene images: (a) SEM, arrows indicate talc particles, and (b)
EDX with light areas being Si. ............................................................................................... 9
Figure 2-3 Schematic of stages (not to scale). .............................................................................. 11
Figure 2-4 (a) Asymmetrical configuration used to measure angular dependence of erosion rate,
(b) Forward inclination for roughness measurements and planar machining (α=45°). ........ 13
Figure 3-1 Schematic of approach to machine flat, planar areas using parallel shallow channels
(not to scale). Nozzle offsets, δi, were assigned to produce a surface having a waviness less
than a prescribed limit ........................................................................................................... 20
Figure 3-2 Superposition model for cross-sectional profiles resulting from 2 , 3 and 4 passes of a
nozzle with a pitch of 150 μm and constant scan speed of 0.7 mm/s, nozzle configuration
α=45° forward inclination (Fig. 2-4 (b)). The profile of channel 1 represents the shallow
first-pass profile used to determine the erosive efficacy function for the ASJM system. .... 22
Figure 3-3 (a) Schematic of procedure used to machine rounded edges. ∆𝑋𝑖 is nozzle step-over
prior to machining each level with depth ΔYi. (b) Illustration of arrangement of individual
machined channels with pitch δ used to remove layer 1. Planar area of uniform depth begins
after a development distance equal to the width of a single channel. ................................... 25
Figure 4-1 Dependence of specific erosion rate of talc-filled polypropylene on impact angle.
Error bars indicate ±1 standard deviation for 3 cross-sectional measurements on a single
channel 30 mm in length. ...................................................................................................... 27
viii
Figure 4-2 Normalized erosion rate as a function of impact angle for TPO with 15 wt% talc.
Dashed line represents the best fit to the data based on Eq. (2). Error bars indicate ±1
standard deviation for 3 cross-sectional measurements on a single channel 30 mm in length.
............................................................................................................................................... 29
Figure 4-3 Centerline average roughness as a function of impact angle for shallow channels
machined in TPO (15 wt% talc). Error bars indicate ±1 standard deviation for 3
measurements. ....................................................................................................................... 30
Figure 4-4 Schematic of the local front geometry during ASJM of a channel at a relatively low
scan speed (not to scale) showing local impact angle θ. At sufficiently high scan speed β≈0.
............................................................................................................................................... 32
Figure 4-5 Channel centerline depth as a function of particle dose and scan speed. Error bars
indicate ±1 standard deviation for 3 cross-sectional measurements on a single 30 mm long
channel. The straight line gives the predicted dependence of erosion on dose. ................... 33
Figure 4-6 Predicted dependence of local front angle (β, Fig. 10) on scan speed and abrasive
dose. ...................................................................................................................................... 34
Figure 4-7 Measured (data points) and model predictions (dashed lines) for machining of planar
areas using one (upper curves) and two sets of passes. 15 wt% talc-filled TPO, nozzle
pitch=200 μm, scan speed=0.35 mm/s, α=45° forward inclination (Fig. 2-4 (b)). Note that
the scales of depth and width are different. Experiment #1 in Table 2. ............................... 37
Figure 4-8 Measured (data points) and model predictions (dashed lines) for machining of planar
areas using one (upper curves) to four sets of passes. 15 wt% talc-filled TPO, nozzle
pitch=100 μm, scan speed=0.70 mm/s, α=45° forward inclination (Fig. 2-4(b)). Note that
the scales of depth and width are different. Experiment #2 in Table 2. ............................... 38
ix
Figure 4-9 Comparison of measured (data points) and predicted (dashed lines) curved edge
profiles in 15% talc-filled TPO. Positions of the initial sharp edges are indicated by the
vertical solid lines. Desired curves were defined by: 1 780 00019a
.X.Y ( ) , 1 8
0 0002b
.X.Y ( ) ,
1 820 00021c
.X.Y ( ) and 1 82
0 00056d
.X.Y ( ) . .......................................................................... 42
Figure 4-10 Model predictions of edge shape for nozzle step-overs (ΔXi) of 200, 300 and 400
μm. Nozzle pitch δ =100 μm. Desired shape was that of case (c) in Fig. 4-9. ..................... 44
Figure 4-11 Schematic of forward machining with a compound inclination- of the nozzle. ψ is
the tilt angle about the Y axis in the XZ plane, and α is the angle in the YZ plane. The
objective was to steepen the indicated bounding sidewall. The outlines of subsequent nozzle
passes to machine an adjacent planar area are illustrated by the dashed curves on the right
edge of the target. .................................................................................................................. 46
Figure 4-12 Excessively wavy surface profiles measured for two levels of planar area with α=45°
asymmetrical nozzle inclination of Fig. 2-4(a). Nozzle passes began at the left edge and
shifted to the right with a 100 μm pitch. Scan speed of 0.7 mm/s. Width and depth have
different scales. ..................................................................................................................... 47
Figure 4-13 Measured sidewall slope vs. feature depth machined using: (a) A single multi-pass
channel machined with compound inclination α=45°, ψ=45° (Fig. 4-11). (b) Planar area
machined with the compound inclination α=45°, ψ=45° (Fig. 4-11). (c) Planar area
machined with the inclined forward orientation α=45° (Fig. 2-4(b)). Experimental
conditions for (b) and (c): Nozzle pitch: 100 μm, scan speed: 0.7 mm/s. Error bars indicate
1 standard deviation for 3 cross-sectional measurements. .................................................. 49
1
Chapter 1
Introduction
1.1 Overview
Abrasive slurry jet micromachining (ASJM) is a relatively new machining technique that
employs a narrow jet of abrasive slurry to create small features in a variety of materials such as
glass, metals and polymers. The jet diameter is often small enough to produce high-resolution
features without the use of erosion-resistant masks typically used with abrasive air jet micro-
machining (AJM). Surfaces machined by slurry jet do not suffer from heat-affected zones and are
much smoother that those usually produce by high-pressure abrasive water jets.
A number of investigators have utilized ASJM to micro-machine features in a variety of
materials. For example, Miller (2004) developed a novel ASJM apparatus that used pre-mixed
20 wt% aqueous abrasive slurry operating at 70 MPa to produce fine cuts in metals. Pang et al.
(2012) used another ASJM system operating at 8-14 MPa to investigate the machining of micro-
channels in glass as a function of process parameters, and their experimental results show that
increases slurry pressure, particle size, and particle concentration all increase the channel depth
as well as overall material removal. They also noticed a significant secondary material removal
caused by returning flow.
Nouraei et al. (2013) found that micro-channels and holes machined in borosilicate glass using a
relatively low-pressure (1-7 MPa) ASJM were smoother than those machined with masked AJM,
and were of a comparable size. Kowsari et al. (2014) found that the changes in the liquid
extensional properties resulting from the addition of a high-molecular-weight polymer to the
2
slurry mix could produce narrower machined features in borosilicate glass for a given diameter
of slurry jet.
Nouraei et al. (2014) predicted the shape of micro-channels machined in borosilicate glass with
ASJM using an adaptation of the model developed by Ghobeity et al. (2008) for the abrasive air
jet micro-machining of glass. The brittle nature of the erosion made it possible to consider only
the component of the incident particle velocity that was normal to the evolving glass surface.
Micromachining of polymers has been of a great recent interest due to its growing application in
the fabrication of microfluidics devices. Although the ASJM of polymers has not previous been
studied, a number of investigators have utilized abrasive air jets to micro-machine features in
polymers. For example, Getu et al. (2007) and (2008) investigated the micro-machining of
Polymethylmethaacrylate using AJM, and developed a model to predict the evolution of the
cross-sectional shape and depth of masked micro-channels as a function of the dose of abrasive
delivered to the surface at a given kinetic energy. The model was more complex than that
previously developed for the AJM of brittle materials since polymer erosion is a function of both
the normal and tangential components of particle velocity, whereas the erosion of glass depends
largely on the normal component. This required the measurement of the erosion rate of the
target polymer as a function of the jet inclination angle.
Getu et al. (2008) used liquid nitrogen (LN2) in a cryogenic abrasive jet micro-machining
(CAJM) setup in order to increase the machinability of polydimethylsiloxane (PDMS),
acrylonitrile butadiene styrene (ABS) and polytetrafluoroethylene (PTFE). According to the
reported results, the use of LN2 cooling resulted in brittle erosion in the samples, showing a
higher erosion rate at higher impact angles, as well as reduction in particle embedding and the
incubation period.
3
In the continuation of Getu’s work, Gradeen et al. (2012) and (2014) employed a novel CAJM
system to investigate the PDMS erosion over a wide range of temperature (-178 - 17°C). They
determined that a lowering of the temperature to -178°C, below the transition temperature≃-
120°C resulted in a shift toward a more brittle erosion behavior.
In the production of micro-devices, it is often required to manufacture complex parts, which is
often made feasible by machining primary features such as channels, holes, recessed planar areas
and transitional slopes. Hence, it is essential to have a methodology that allows the prediction of
the machining path required to produce a desired feature shape.
Ghobeity et al. (2008) developed a computational model to predict the surface evolution of
recessed planar areas, and transitional slopes between such areas, machined in glass using AJM.
Since the energy distributions across the nozzle were found to be non-uniform in a single pass,
multiple passes were arranged in a way that the summation of their energy distributions provided
a uniform energy flux to the surface resulting in a machined planar area. An erosion resistant
mask was used to create relatively steep side walls bounding the recessed pockets having flat
bottoms.
Billingham et al. (2013) used overlapping channel footprints created by high pressure abrasive
waterjet in order to machine planar pockets in Ti6Al4V. Their model was based on the calibration
and validation of a predictive mathematical model for the machining a single trench footprint,
delivering a reasonable prediction of the final profile shape of the machined pocket. Despite the
relatively good results obtained in previous studies, no approaches have yet been introduced
that allow control over the side wall slope as surface waviness resulting from multiple machining
passes.
4
Comparisons between neat polymers and their composites have been also an important portion of
studies related to composite materials. The manner in which the addition of fillers and fibers
affects the properties is generally directly related to how the properties of additives compare to
those of the neat matrix.
Sole and Ball (1996) surveyed the effect of mineral filler percentage on the wear resistance of
filled polypropylene conducting dry abrasion tests on a Rockwell belt modified sanding machine.
For Talc, it was shown that wear rate of filled composite was higher than of neat polymer, and
there were also an increase in wear rate with higher wt% of talc.
In previous work, the effect of filler percentage on the erosion rate of Polypropylene composites
has been explored, and unlike the investigations on fiber reinforced composites (Barkoula 2002,
Arjula 2008, Suresh 2009) erosion behavior changes in terms of angular dependency (the
probable change in the angle which corresponds to the highest erosion rate, and a shift in the
erosion behavior toward a more brittle manner) have not been explored.
The present work first investigated the angular dependence of the erosion of a talc-filled
thermoplastic olefin (TPO) consisting of polypropylene and rubber. Such composites are being
widely used to manufacture injection-molded interior and exterior automotive parts. A model
was then developed to predict the shape, waviness and inclination of recessed pockets machined
using ASJM. The model was demonstrated to be capable of providing nozzle path instructions to
machine complex features of desired geometry. Approaches to control the slope of bounding
sidewalls without using masks were also developed and tested. The model was also employed to
predict paths necessary to trim sharp edges to a desired radius.
5
1.2 Motivation
ASJM has great potential as a versatile, low-cost method to micro-machine a very wide variety
of materials. To machine complex components, it is essential to have methodologies to predict
the abrasive jet machining path required to produce a desired feature shape. The goal of the
present research was to develop such models for the ASJM of planar areas and transitional slopes
in a common polymeric material. The knowledge gained is applicable to other ductile materials
and the development of ASJM models for the production of other feature shapes.
1.3 Thesis Outline and Objectives
Chapter 2 provides the details on abrasive slurry jet machining apparatus as well as complete
information on experimental procedures. Measurement methods employed through the data
acquisition and analysis are also introduced.
Chapter 3 explains the basis of the erosive efficacy superposition model in detail, and describes
the terms and methods utilized within its development. Moreover, theoretical limitations of
superposition model are discussed, and the employment methods for machining edges and planar
areas are proposed through the nozzle path planning algorithm.
The first part of Chapter 4 delivers the experimental results on the erosion rate angular
dependence of Talc filled polypropylene, effect of talc percentage on the erosion rate and effect
of angle on channel centerline roughness along with comprehensive discussions. The second part
of this chapter evaluates the applicability of erosive efficacy superposition model in predicting
the depth and waviness of flat bottom recesses as well as the curved edges, all machined through
the prescribed nozzle path plan resulted from algorithm. The third part of this chapter introduces

6
the novel nozzle configuration proposed for machining planar areas with enhanced and
controlled bounding sidewalls.
7
Chapter 2
Experimental Analysis on Talc-Filled Polypropylene for Erosion
Characterization, Planar Area and Curved Edge Machining
2
2.1 Overview
In this chapter, the ASJM apparatus utilized for experimental analysis is introduced, and
preliminary information on target material is summarized. In addition, experimental approaches
are explained in detail, along with associated measurement techniques.
2.2 Experimental Apparatus
The ASJM set up used to conduct the experiments in this study had been previously developed
by Nouraei et al. (2013) and Kowsari et al. (2014). The set up utilizes an abrasive slurry pump
and pulsation damper connected to an open reservoir tank (Figure 2-1). It consisted of an open,
stirred slurry tank feeding a diaphragm pump connected to a pulsation damper. Current
experiments were conducted using a pressure of 4 MPa and a flow rate of 1.61 ± 0.1% mL/s
through a 180 μm sapphire water jet orifice (KMT Water jet, KS, USA) which produced a jet
diameter of 140 μm.
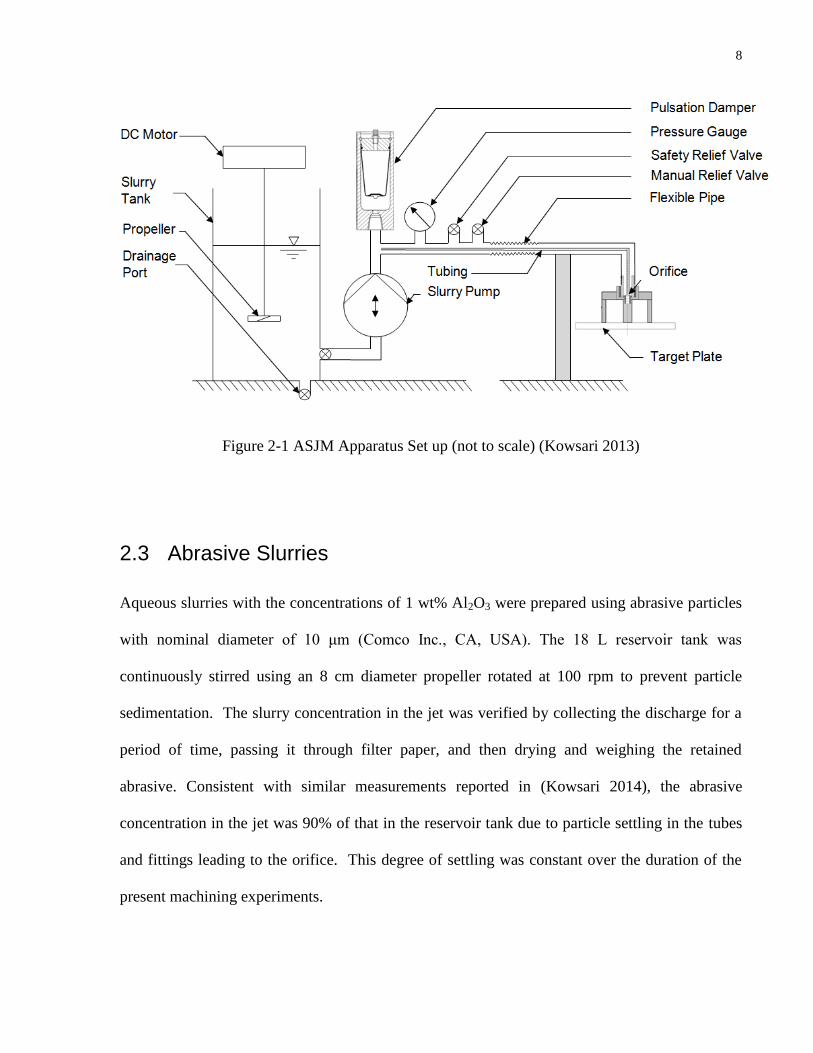
8
Figure 2-1 ASJM Apparatus Set up (not to scale) (Kowsari 2013)
2.3 Abrasive Slurries
Aqueous slurries with the concentrations of 1 wt% Al2O3 were prepared using abrasive particles
with nominal diameter of 10 μm (Comco Inc., CA, USA). The 18 L reservoir tank was
continuously stirred using an 8 cm diameter propeller rotated at 100 rpm to prevent particle
sedimentation. The slurry concentration in the jet was verified by collecting the discharge for a
period of time, passing it through filter paper, and then drying and weighing the retained
abrasive. Consistent with similar measurements reported in (Kowsari 2014), the abrasive
concentration in the jet was 90% of that in the reservoir tank due to particle settling in the tubes
and fittings leading to the orifice. This degree of settling was constant over the duration of the
present machining experiments.
9
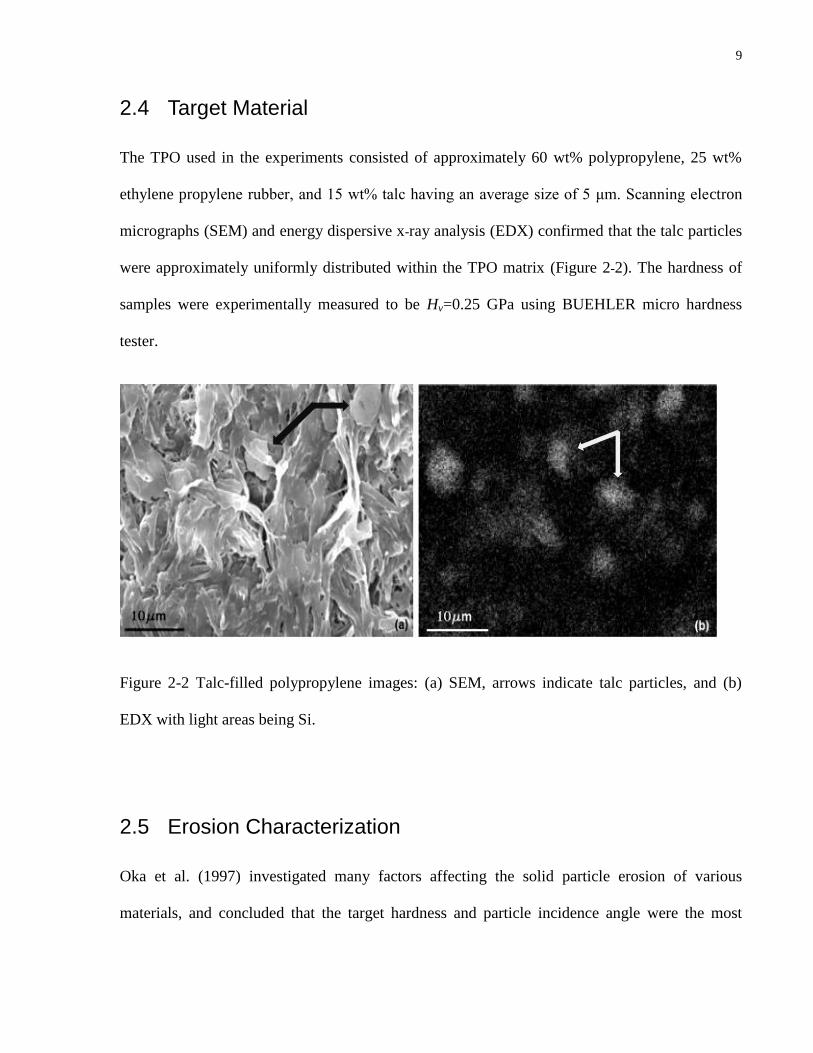
2.4 Target Material
The TPO used in the experiments consisted of approximately 60 wt% polypropylene, 25 wt%
ethylene propylene rubber, and 15 wt% talc having an average size of 5 μm. Scanning electron
micrographs (SEM) and energy dispersive x-ray analysis (EDX) confirmed that the talc particles
were approximately uniformly distributed within the TPO matrix (Figure 2-2). The hardness of
samples were experimentally measured to be Hv=0.25 GPa using BUEHLER micro hardness
tester.
Figure 2-2 Talc-filled polypropylene images: (a) SEM, arrows indicate talc particles, and (b)
EDX with light areas being Si.
2.5 Erosion Characterization
Oka et al. (1997) investigated many factors affecting the solid particle erosion of various
materials, and concluded that the target hardness and particle incidence angle were the most

10
important. The erosion rate, E, at any angle of attack, α, can be non-dimensioned using the
erosion rate at normal incidence.
90( ) ( )E g E (1)
where g(α) is a function that expresses the angular dependency of the erosion rate . Oka (2005)
found that g(α) can be expressed in a semi-empirical form as
1 2( ) (sin( )) (1 (1 sin( )))n n
vg H (2)
where the first term represents the contribution due to repeated plastic deformation, dependent on
the impact energy transferred normal to the surface, while the second term expresses the cutting
action, dependent on the energy transferred parallel to the surface. The constants n1 and n2 are
found experimentally and depend on the particle hardness and other impact conditions, and Hv
(GPa) is the initial target hardness. The incorporation of Hv makes Eqs. (1) and (2) applicable to
a wide range of materials at any impact angle.
Equations (1) and (2) have been used in the modeling of the cross-sectional profiles of channels
machined using AJM in PMMA (Getu 2007) and metals (Ally 2012). Although the use of water
as the accelerating medium in ASJM creates uncertainty in the local particle impact angle since
small particles tend to follow the streamlines of the impinging jet, Nouraei et al. (2014) found
that a similar model could be used to predict the shapes of channels machined with ASJM in
brittle targets such as glass. Therefore, it was of interest to determine whether Eqs. (1) and (2)
could capture the angular dependency of the erosion rate measured using ASJM on a ductile
material such as talc-filled polypropylene.
11
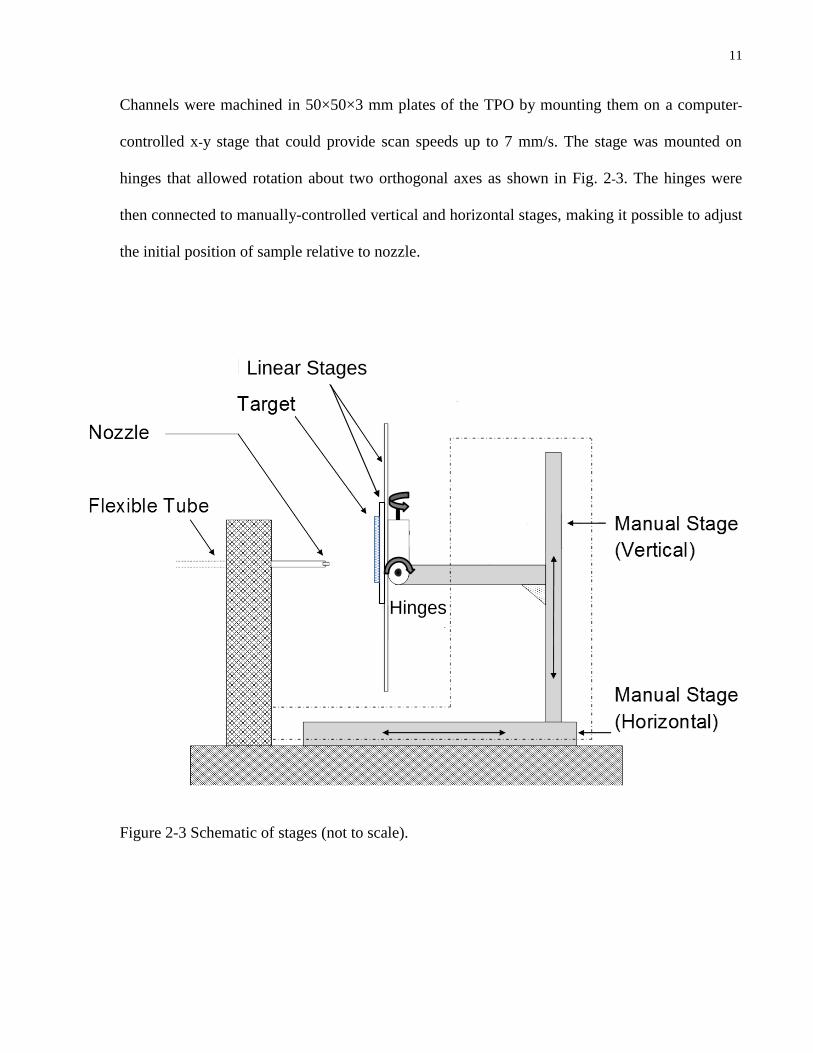
Channels were machined in 50×50×3 mm plates of the TPO by mounting them on a computer-
controlled x-y stage that could provide scan speeds up to 7 mm/s. The stage was mounted on
hinges that allowed rotation about two orthogonal axes as shown in Fig. 2-3. The hinges were
then connected to manually-controlled vertical and horizontal stages, making it possible to adjust
the initial position of sample relative to nozzle.
Linear Stages
Hinges
Figure 2-3 Schematic of stages (not to scale).
12
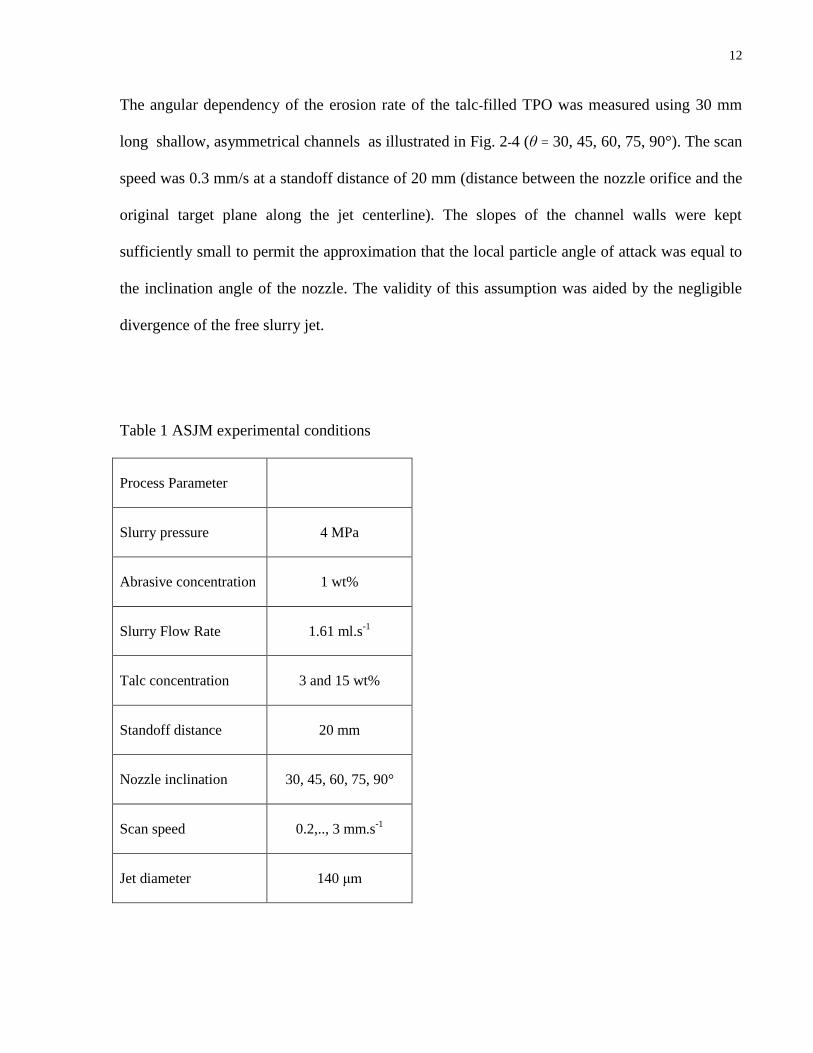
The angular dependency of the erosion rate of the talc-filled TPO was measured using 30 mm
long shallow, asymmetrical channels as illustrated in Fig. 2-4 (θ = 30, 45, 60, 75, 90°). The scan
speed was 0.3 mm/s at a standoff distance of 20 mm (distance between the nozzle orifice and the
original target plane along the jet centerline). The slopes of the channel walls were kept
sufficiently small to permit the approximation that the local particle angle of attack was equal to
the inclination angle of the nozzle. The validity of this assumption was aided by the negligible
divergence of the free slurry jet.
Table 1 ASJM experimental conditions
Process Parameter
Slurry pressure 4 MPa
Abrasive concentration 1 wt%
Slurry Flow Rate 1.61 ml.s-1
Talc concentration 3 and 15 wt%
Standoff distance 20 mm
Nozzle inclination 30, 45, 60, 75, 90°
Scan speed 0.2,.., 3 mm.s-1
Jet diameter 140 μm
13
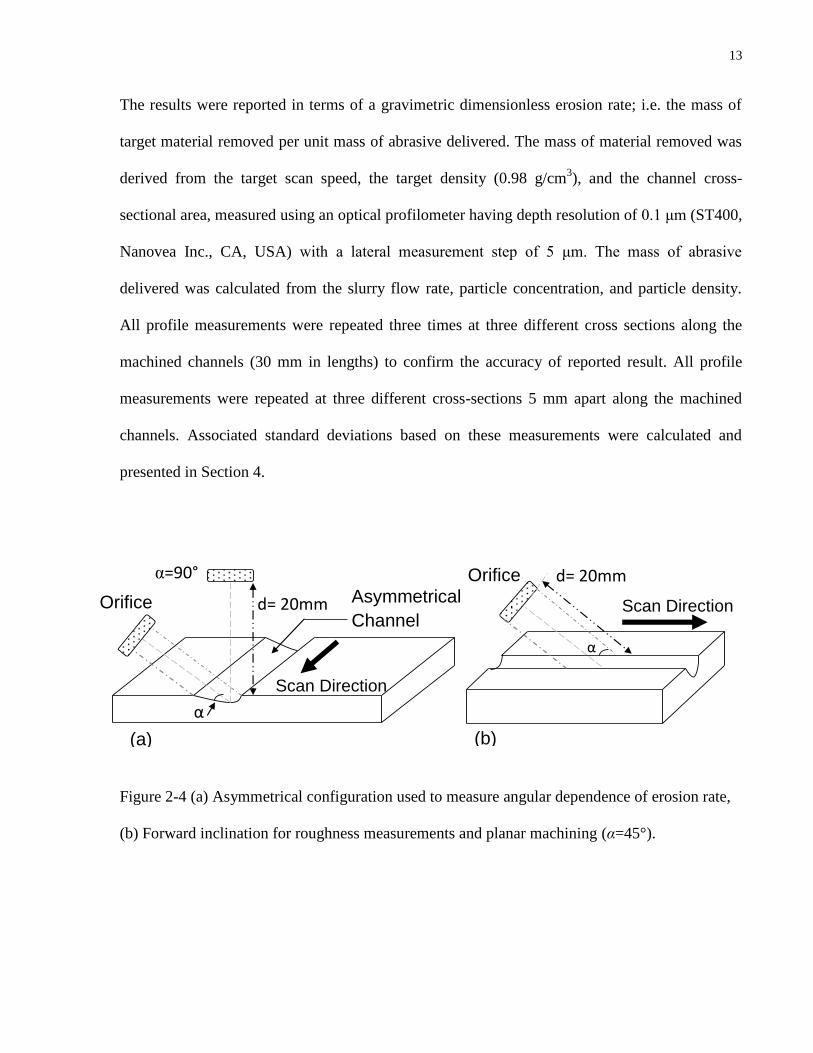
The results were reported in terms of a gravimetric dimensionless erosion rate; i.e. the mass of
target material removed per unit mass of abrasive delivered. The mass of material removed was
derived from the target scan speed, the target density (0.98 g/cm3), and the channel cross-
sectional area, measured using an optical profilometer having depth resolution of 0.1 μm (ST400,
Nanovea Inc., CA, USA) with a lateral measurement step of 5 μm. The mass of abrasive
delivered was calculated from the slurry flow rate, particle concentration, and particle density.
All profile measurements were repeated three times at three different cross sections along the
machined channels (30 mm in lengths) to confirm the accuracy of reported result. All profile
measurements were repeated at three different cross-sections 5 mm apart along the machined
channels. Associated standard deviations based on these measurements were calculated and
presented in Section 4.
Scan Direction
α=90°
d= 20mm Asymmetrical
Channel Orifice Scan Direction
α
(a)
Orifice
α
d= 20mm
(b)
Figure 2-4 (a) Asymmetrical configuration used to measure angular dependence of erosion rate,
(b) Forward inclination for roughness measurements and planar machining (α=45°).
14
The repeatability of the process was assessed by machining three channels for a given angle of
attack without turning off the pump. The average channel depth for nozzle angles α = 30, 45, 60,
75, 90° varied by less than 6% for a given angle, which was similar to the variability reported by
Nouraei et al. (2014) using the same ASJM system.
2.6 Roughness Measurement
The effect of impact angle on the channel centerline roughness was measured using forward
nozzle inclinations of α = 30, 45, 60, 75 and 90° (Fig. 2-4(b)). The optical profilometer was
scanned over a 10 mm length of each channel using a 1 μm sampling interval, and the roughness
was calculated according to the ISO 4288 (1996) with a 0.25 mm cut-off length (low-pass
wavelength filter). The measurements were repeated over each separate the three 10 mm
sections comprising the 30 mm long channel. Associated standard deviations based on these
measurements were calculated and presented in Section 4.
2.7 Effect of Filler Concentration
The effect of talc concentration on the erosion rate of TPO was measured using samples
containing 15 and 3 wt% talc. Channels were created in both samples using 1 wt% Al2O3 slurry
at 4 MPa and a scan speed of 0.3 mm/s.
15
2.8 Planar Area Machining
The machine path model presented in Section 3 is based on the hypothesis that flat surfaces can
be achieved if a uniform erosive flux is established over the machined area by superimposing
linear parallel passes with specified nozzle offsets. The erosion produced in a single pass of the
nozzle is characterized by the “erosive efficacy”, which is the transverse distribution of the
erosive energy in the jet footprint on the target surface. This distribution is due to the combined
effects of the distributions of the particle velocity, mass flux and local impact angle over the jet
footprint. Previous work has indicated that it can be measured for the AJM of brittle and ductile
targets, and for the ASJM of brittle targets from a shallow, “first-pass” profile machined in the
target (Getu 2007, Ghobeity 2008, Nouraei 2014). In the present work, the erosive efficacy was
acquired by machining shallow passes in TPO samples using 1 wt% Al2O3 slurries at 4 MPa. The
measured profiles of the machined shallow passes were then used in Eq. (4) below to determine
the erosive efficacy function, as described in Section 3.
To test the machining path model, single and multi-level planar areas were machined in 50×50×3
mm plates of the TPO using overlapping adjacent passes. Experiments were conducted using 1
wt% Al2O3 slurries at 4 MPa, with scan speeds varying from 0.2 to 0.7 mm/s. The cross-sectional
profiles of the resulting planar areas were measured using the optical profilometer and compared
with the model predictions. The amplitude and dominant frequency of the planar area waviness
were obtained using MATLAB R2011.

16
2.9 Curved Edge Machining
A modified version of the superposition model was also utilized to determine the nozzle path
required to create a curved edge. This model was tested by machining sharp 90° edges to a
specified curvature using the multi-level planar machining algorithm presented in Section 3.
These experiments were also performed using 1 wt% Al2O3 slurry at 4 MPa.
17
Chapter 3
Erosive Efficacy Superposition Modeling and Nozzle Path Plan
Algorithm for Machining Edges and Planar Areas
3.1 Overview
This chapter explains the methods based on which the erosive efficacy superposition model is
developed. The application of this model in delivering the required nozzle path plan for
machining planar area and curved edge with desired conditions is introduced by defining new
process parameters prescribed with values resulted from the model.
3.2 Erosive Efficacy Function
Ghobeity et al. (2007),(2008) and Getu et al. (2007) determined the erosive efficacy of AJM
nozzles eroding brittle and ductile materials by measuring the cross-sectional profiles of shallow
channels under the machining conditions of interest. Nouraei et al. (2014) showed that the same
approach could be used in the ASJM of glass substrates, in spite of the large differences in
particle trajectories within the footprints of impacting air jets and slurry jets.
The erosive efficacy function is defined as
,t
2
,
( )( 1 (z ) ) ( )x
zQ x
g
(3)
18
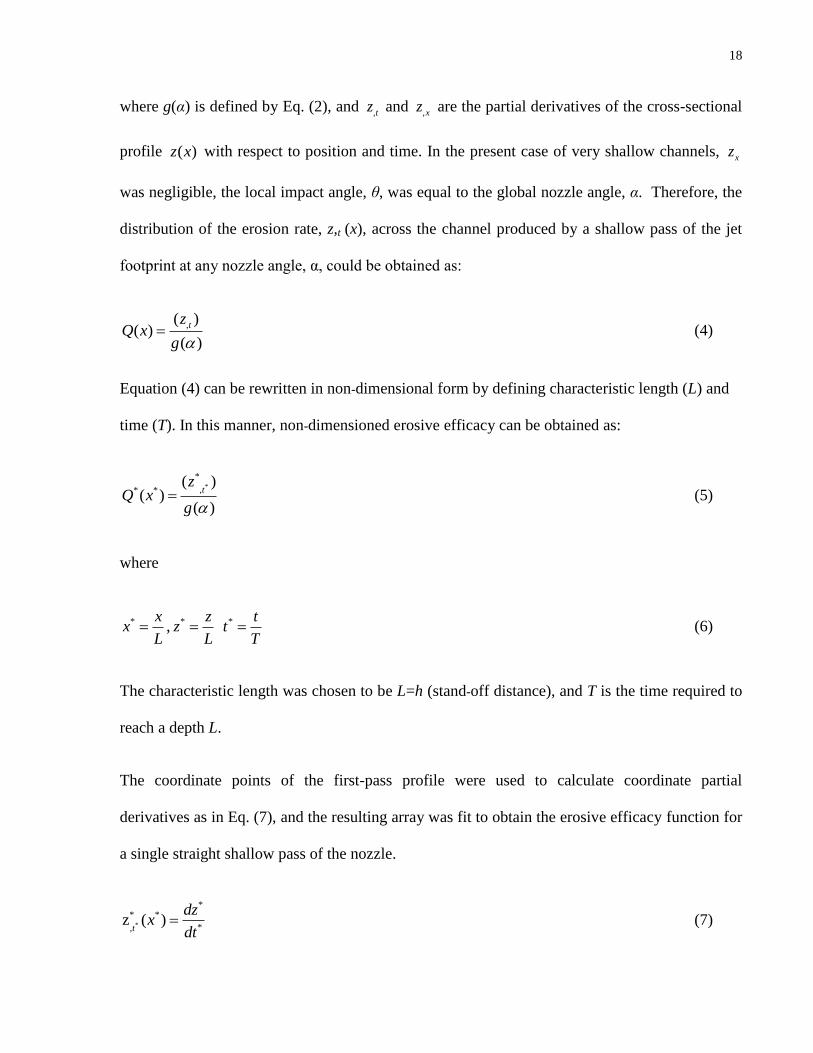
where g(α) is defined by Eq. (2), and ,tz and ,xz are the partial derivatives of the cross-sectional
profile ( )z x with respect to position and time. In the present case of very shallow channels, xz
was negligible, the local impact angle, θ, was equal to the global nozzle angle, α. Therefore, the
distribution of the erosion rate, z,t (x), across the channel produced by a shallow pass of the jet
footprint at any nozzle angle, α, could be obtained as:
,( )( )
( )
tzQ x
g (4)
Equation (4) can be rewritten in non-dimensional form by defining characteristic length (L) and
time (T). In this manner, non-dimensioned erosive efficacy can be obtained as:
*
*
,* *( )
( )( )
tz
Q xg
(5)
where
* xx
L , * z
zL
* tt
T (6)
The characteristic length was chosen to be L=h (stand-off distance), and T is the time required to
reach a depth L.
The coordinate points of the first-pass profile were used to calculate coordinate partial
derivatives as in Eq. (7), and the resulting array was fit to obtain the erosive efficacy function for
a single straight shallow pass of the nozzle.
*
** *
*,z ( )
t
dzx
dt (7)
19
As long as the channel was sufficiently shallow, the magnitude of the erosive efficacy at any
point on a channel cross-section was linearly proportional to the centerline depth of that channel,
and hence to the dose of abrasive delivered to the surface, or, equivalently, to the inverse of the
nozzle scan speed.
3.3 Superposition Model for Machining Planar Area
As discussed in the preceding section, a flat planar area can be produced if a uniform erosive
efficacy can be delivered to the target surface. The present superposition algorithm calculates the
required nozzle offsets and the number of parallel traverses necessary to obtain the desired depth,
width, and residual waviness of the planar area (Fig. 3-1), using as the primary input the erosive
efficacy determined from the profile of a shallow, single-pass reference channel.

20
Figure 3-1 Schematic of approach to machine flat, planar areas using parallel shallow channels
(not to scale). Nozzle offsets, δi, were assigned to produce a surface having a waviness less than
a prescribed limit
21
The nozzle path algorithm summed the erosive efficacies received by each surface point for a
single set of nozzle passes over the planar area. Two variables were available to adjust the
erosive efficacy received by a given point: (i) the nozzle speed was linearly related to the dose
and hence the magnitude of the erosive efficacy delivered to each point on the surface during that
pass, and (ii) the nozzle offset controlled the amount of superposition from one pass to the next.
To initiate the optimization procedure having the maximum waviness as the constraint, a few
preliminary experiments along with related runs of the model were conducted to deliver a
reasonable initial guess for nozzle speed and offset to produce the desired planar area (Section 4
and Table 2). As will be discussed in Section 4, there was a lower limit on the scan speed too
avoid making a channel that was too deep in a single pass. In very deep channels, the slurry flow
field could be quite different from that in a shallow channel, leading to an altered erosive
efficacy distribution. The tentative nozzle pass sequence was then evaluated for its waviness
using a fast Fourier transform of the resultant erosive efficacy distribution to determine the
amplitude of the dominant frequency. If this exceeded the specified flatness of the surface, the
tentative offset, δ0, and the scan speed, V0, were adjusted simultaneously as
δ = (δ0)*K (9)
Vi = (V0)/K (10)
where K was initially 0.9, and was then decreased by 10% for each waviness correction loop
needed thereafter. By altering the scan speed and nozzle offset using the same factor, K, the total
machining time and overall dose delivered to the surface would remain constant and the feature
depth would be unchanged. For example, if the nozzle offset was halved (K=0.5), twice the
number of passes would be required to machine a given area, and thus the scan speed had to be
doubled to keep the machining time and overall dose constant.
22
Once the machining algorithm for the smooth planar area was established, it could be repeated
any number of times to create pockets of arbitrary depth.
-15
-12
-9
-6
-3
0
0 150 300 450 600 750
Dep
th(μ
m)
Width (μm)
Channel 1
Channel 2
Channel 3
Channel 4
Superposition of Channels 1 and 2
Superposition of Channels 1,2 and 3
Superposition of Channels1,2,3 and 4
Figure 3-2 Superposition model for cross-sectional profiles resulting from 2 , 3 and 4 passes of a
nozzle with a pitch of 150 μm and constant scan speed of 0.7 mm/s, nozzle configuration α=45°
forward inclination (Fig. 2-4 (b)). The profile of channel 1 represents the shallow first-pass
profile used to determine the erosive efficacy function for the ASJM system.

23
Figure 3-2 illustrates that each point on the surface was exposed to the summation of the erosive
efficacies from the all passes that overlapped that point. Therefore, the flat portion of the planar
area began a distance from the left-most edge (Fig. 3-2) equal to the width of the erosive efficacy
distribution (i.e. the width of the shallow, first-pass channel produced by the jet; 380 μm).
Beyond this point, all portions of the planar area would be exposed to the same total erosive
efficacy as the nozzle was scanned over the surface in overlapping passes. The width of the
erosive efficacy distribution could thus be viewed as the distance over which the bounding
sidewall of the planar area developed and merged with the flat bottom.
A key difference between the present ASJM model and that developed by Ghobeity et al. (2008)
for AJM, was the requirement to avoid excessive secondary erosion created by slurry flow
beyond the primary footprint of the impinging jet. Secondary erosion became significant when
the surface topography altered the footprint erosion pattern characteristic of the shallow first-
pass. This could occur, for example, when the footprint overlapped a relatively steep slope,
thereby deflecting the jet and creating unpredictable erosion patterns. It is also noted that the jet
divergence in ASJM was much smaller than in AJM, thereby permitting the machining of
features with much higher resolution. For example, Nouraei et al. (2013) measured a slurry jet
divergence angle of about 0.015° for a 254 μm orifice at 2 MPa, while it was approximately 10°
in a 760 μm air jet nozzle (Ghobeity 2008).
24
3.4 Superposition Model for Machining a Curved Edge
Figure 3-3 illustrates the procedure used to machine curved edges of a desired radius when
starting from a sharp edge. The material to be removed was discretized into a number of layers,
each with a thicknesses ΔYi and an adjusted starting point ΔXi prescribed to be less than or equal
to the development distance (i.e. the width of the erosive efficacy function, as described Section
3.3). The algorithm to machine each of these layers beginning at the end of the step-over ΔXi was
then identical to that for planar areas (Section 3.3).
The step-over distances, ΔXi, and the planar area depths for each layer, ΔYi, of Fig. 3-3 were
selected using the machining model to provide an acceptable agreement between the predicted
curved-edge profile and the desired profile. Choosing smaller values of ΔXi and ΔYi corresponded
to shorter segments of the developing slope (left side of profile illustrated in Fig. 3-2) being
matched to the desired edge profile over the distance ΔXi, and therefore could produce a better
fit.
25
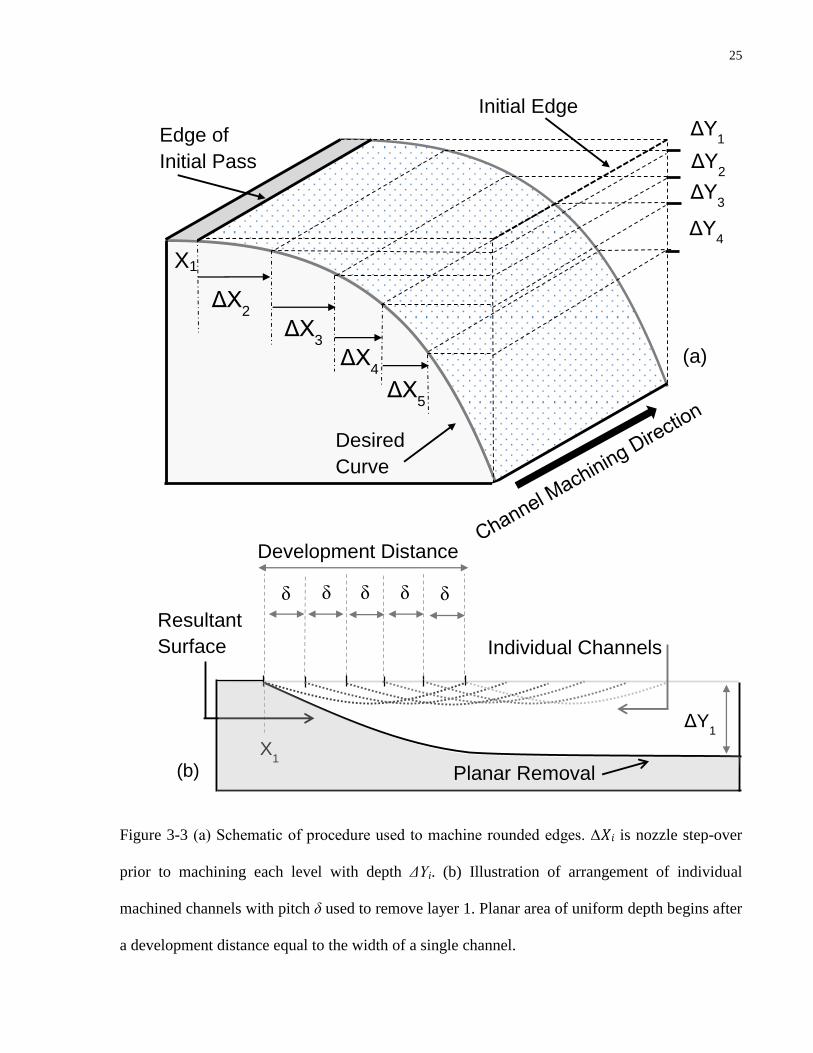
X1
ΔX2
ΔX3
ΔX4
ΔY1
ΔY2
ΔY3
ΔY4
ΔX5
Edge of
Initial Pass
Initial Edge
Desired
Curve
(a)
δ δ δ δ δ
X1
Individual Channels
Resultant
Surface
Development Distance
ΔY1
Planar Removal (b)
Figure 3-3 (a) Schematic of procedure used to machine rounded edges. ∆𝑋𝑖 is nozzle step-over
prior to machining each level with depth ΔYi. (b) Illustration of arrangement of individual
machined channels with pitch δ used to remove layer 1. Planar area of uniform depth begins after
a development distance equal to the width of a single channel.

26
Chapter 4
Experimental Results and Superposition Model Verification for
Machining Planar Area and Curved Edges
4.1 Overview
In the first section of this chapter (Section 4.2), experimental results on erosion behavior and
surface roughness are summarized. Followed by Sections 4.3 and 4.4, the applicability of erosive
efficacy superposition model in delivering the required nozzle path plan for machining planar
area and curved edge at desired conditions are evaluated by comparing the experimental results
and model predictions. Section 4.5 introduces the novel machining configuration employed in
planar area machining for side wall slope enhancement; experimental results on side wall slopes
are also compared and analyzed in this section.
4.2 Erosion Characterization
4.2.1 Effect of Angle of Attack
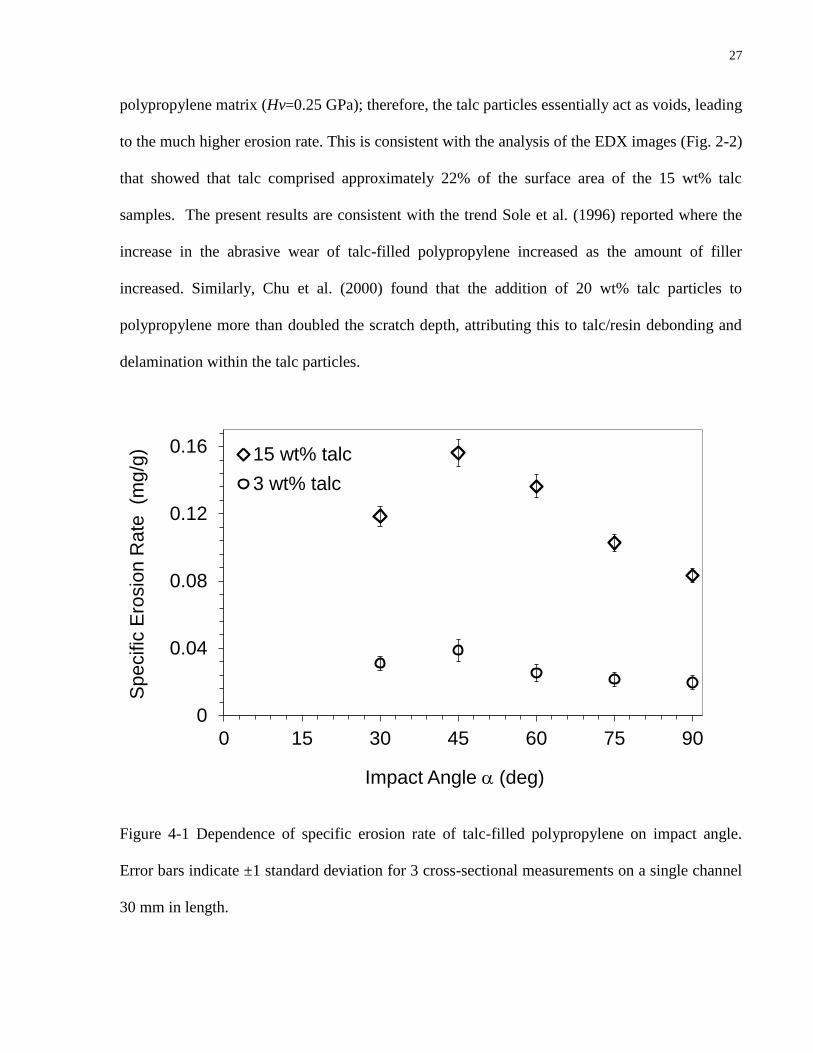
Figure 4-1 shows that the maximum specific gravimetric erosion rate occurred at 45, and was
approximately twice the erosion rate at 90, indicating that a ductile erosion mechanism was
dominant. The higher weight percentage of talc increased the erosion rate by over four times at
45°, but did not change the overall shape of the angular dependence.
Talc is composed of Si2O52-
sheets that are weakly bonded together, leading to a hardness (1
Mohs, approximately 0.06 GPa) (Mallock 1926)) which is much less than that of the
27
polypropylene matrix (Hv=0.25 GPa); therefore, the talc particles essentially act as voids, leading
to the much higher erosion rate. This is consistent with the analysis of the EDX images (Fig. 2-2)
that showed that talc comprised approximately 22% of the surface area of the 15 wt% talc
samples. The present results are consistent with the trend Sole et al. (1996) reported where the
increase in the abrasive wear of talc-filled polypropylene increased as the amount of filler
increased. Similarly, Chu et al. (2000) found that the addition of 20 wt% talc particles to
polypropylene more than doubled the scratch depth, attributing this to talc/resin debonding and
delamination within the talc particles.
0
0.04
0.08
0.12
0.16
0 15 30 45 60 75 90
Sp
ecific
Ero
sio
n R
ate
(m
g/g
)
Impact Angle (deg)
15 wt% talc
3 wt% talc
Figure 4-1 Dependence of specific erosion rate of talc-filled polypropylene on impact angle.
Error bars indicate ±1 standard deviation for 3 cross-sectional measurements on a single channel
30 mm in length.
28
The presence of the talc caused the specific erosion rates in Fig. 4-1 to be much higher than those
reported by Tilly (1969) for the erosion of unfilled polypropylene by 60 μm quartz particles at
104 m/s; e.g. 0.016 mg/g. This paper also described ductile erosion behavior and incubation
periods with significant weight gains due to particle embedment at angles greater than 55°. In
contrast, an EDX analysis of the present channels did not reveal any alumina, perhaps because
these particles (10 μm Al2O3) were much smaller than those used by Tilly (1969). Moreover, the
particle impact velocity in the present ASJM setup was much smaller than that used by Tilly
(1969); i.e. it was estimated to be 41 m/s for the present conditions (Nouraei 2013).
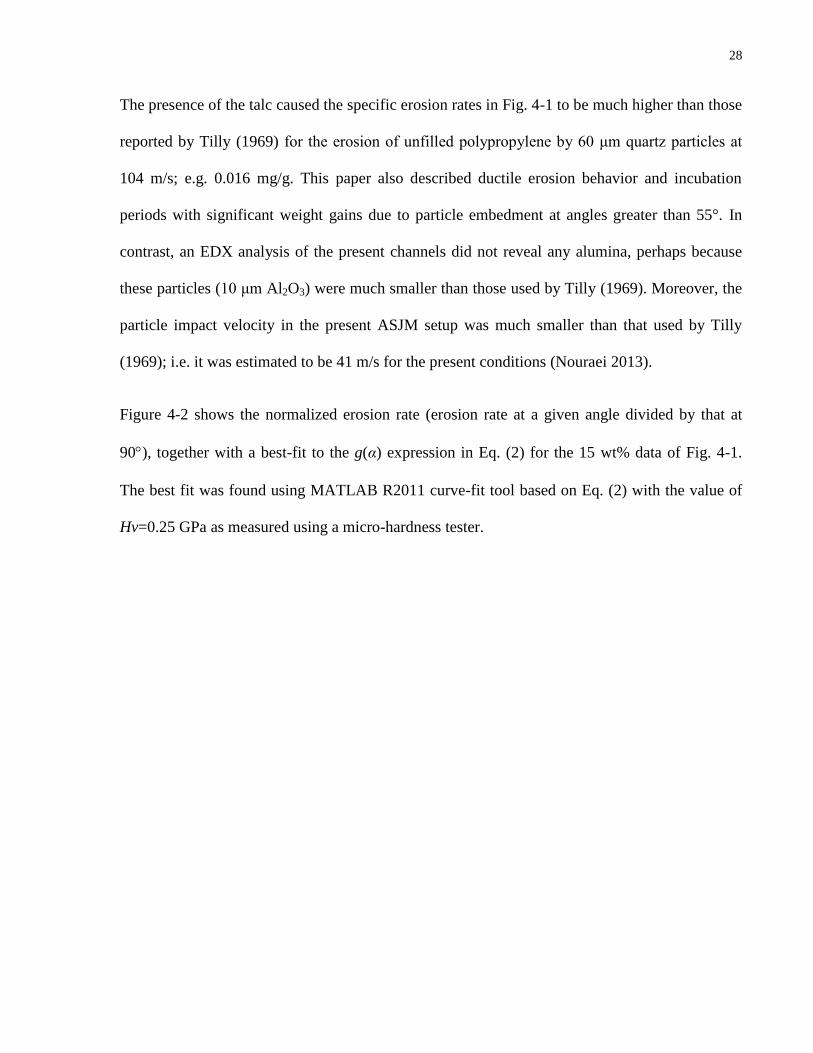
Figure 4-2 shows the normalized erosion rate (erosion rate at a given angle divided by that at
90), together with a best-fit to the g(α) expression in Eq. (2) for the 15 wt% data of Fig. 4-1.
The best fit was found using MATLAB R2011 curve-fit tool based on Eq. (2) with the value of
Hv=0.25 GPa as measured using a micro-hardness tester.

29
0
0.5
1
1.5
2
0 15 30 45 60 75 90
No
rma
lize
d E
rosio
n R
ate
g(
)
Impact Angle (deg)
R2 = 0.99
Figure 4-2 Normalized erosion rate as a function of impact angle for TPO with 15 wt% talc.
Dashed line represents the best fit to the data based on Eq. (2). Error bars indicate ±1 standard
deviation for 3 cross-sectional measurements on a single channel 30 mm in length.
4.2.2 Roughness Measurements
Figure 4-3 shows that the highest centerline average roughness (Ra) on shallow channels
occurred at 45°, which was also the angle for the maximum specific erosion rate of Fig. 4-1. For
the AJM of channels in borosilicate glass, Jafar et al. (2013) found that both the centerline
roughness and the erosion rate increased with the incident particle kinetic energy associated with
the normal component of the impact velocity, since this governed material removal by fracture. It
is interesting to note that for ductile materials such as TPO where both cutting and repeated
plastic deformation lead to material removal both the erosion rate and roughness were found to

30
depend on the relative amounts of normal and tangential velocity components, with both
exhibiting a maximum at 45°.
0
0.3
0.6
0.9
1.2
0 15 30 45 60 75 90
Ro
ughn
ess (
mm
)
Impact Angle (deg)
Figure 4-3 Centerline average roughness as a function of impact angle for shallow channels
machined in TPO (15 wt% talc). Error bars indicate ±1 standard deviation for 3 measurements.
4.3 Planar Area Machining
The present ASJM path model assumed that the nozzle scan speed was linearly proportional to
the abrasive dose delivered to the target and hence the erosion rate. However, as mentioned
previously, this assumption implied a sufficiently shallow channel, where the sidewalls and the
channel front were small enough so that the local impact angle was equal to the global nozzle
angle. Figure 4-4 illustrates that if the scan speed was too small the erosion rate of the local front

31
would be increased as the local impact angle approached 45. In this case, the angle of the front
of the channel as it was being machined is given by
1tan ( )D
W (11)
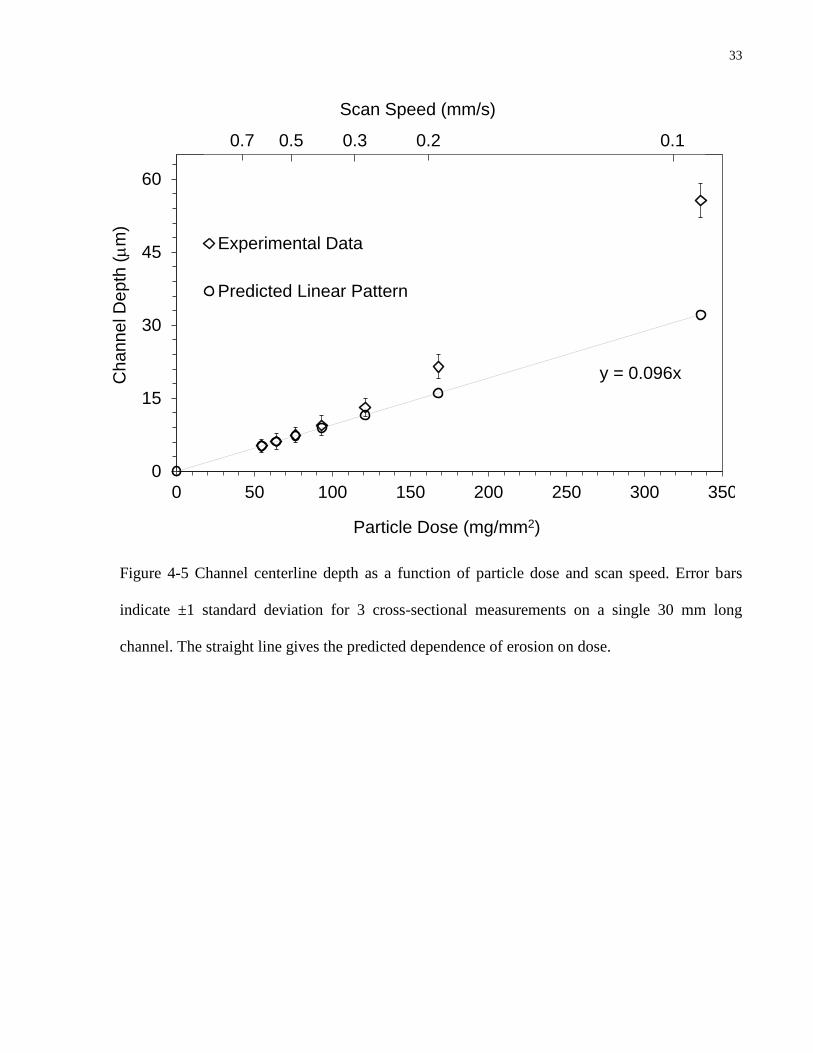
where D is channel depth and W is the width of the jet. This behavior is illustrated in Fig. 4-5,
where the centerline erosion rate is seen to diverge from its predicted linear dependence on dose
(or scan speed) when the scan speed fell below approximately 0.3 mm/s. As shown in Fig. 4-6, at
lower abrasive doses (higher scan speeds, shallower channels), the local front angle, β,
approached 0°, maintaining the local impact angle, θ, equal to the global nozzle angle, α (Fig. 4-
4). To ensure that the erosion rate was linearly proportional to the dose and scan speed, the
machining parameters were selected to keep the overall depth of each machined planar level (i.e.
the depth produced by a set of adjacent passes) less than 15 μm, leading to a local front slope (β,
Fig. 4-4) smaller than about 6°.

32
Jet width Scan Direction
Nozzle
D β
W
θ
Figure 4-4 Schematic of the local front geometry during ASJM of a channel at a relatively low
scan speed (not to scale) showing local impact angle θ. At sufficiently high scan speed β≈0.
33
y = 0.096x
0
15
30
45
60
0 50 100 150 200 250 300 350
Ch
anne
l D
epth
(m
m)
Particle Dose (mg/mm2)
Experimental Data
Predicted Linear Pattern
Scan Speed (mm/s)
0.7 0.5 0.3 0.2 0.1
Figure 4-5 Channel centerline depth as a function of particle dose and scan speed. Error bars
indicate ±1 standard deviation for 3 cross-sectional measurements on a single 30 mm long
channel. The straight line gives the predicted dependence of erosion on dose.

34
0
5
10
15
20
25
0 0.1 0.2 0.3 0.4 0.5 0.6 0.7
Local F
ron
t A
ngle
(deg)
Scan Speed (mm/s)
Particle Dose (mg/mm2)
336 167 121 93 76 64 55
Figure 4-6 Predicted dependence of local front angle (β, Fig. 10) on scan speed and abrasive
dose.
In order to test the ASJM nozzle path model, planar areas were machined to various depths using
two different combinations of nozzle pitch and speed, both with a nozzle forward inclination of
45°, as shown in Fig. 2-4(b). The width of the erosive efficacy distribution was 380 μm. As
described in Section 3.3, this was also the distance from the edge of the first machining pass
required to establish the flat bottom of the planar area.
35
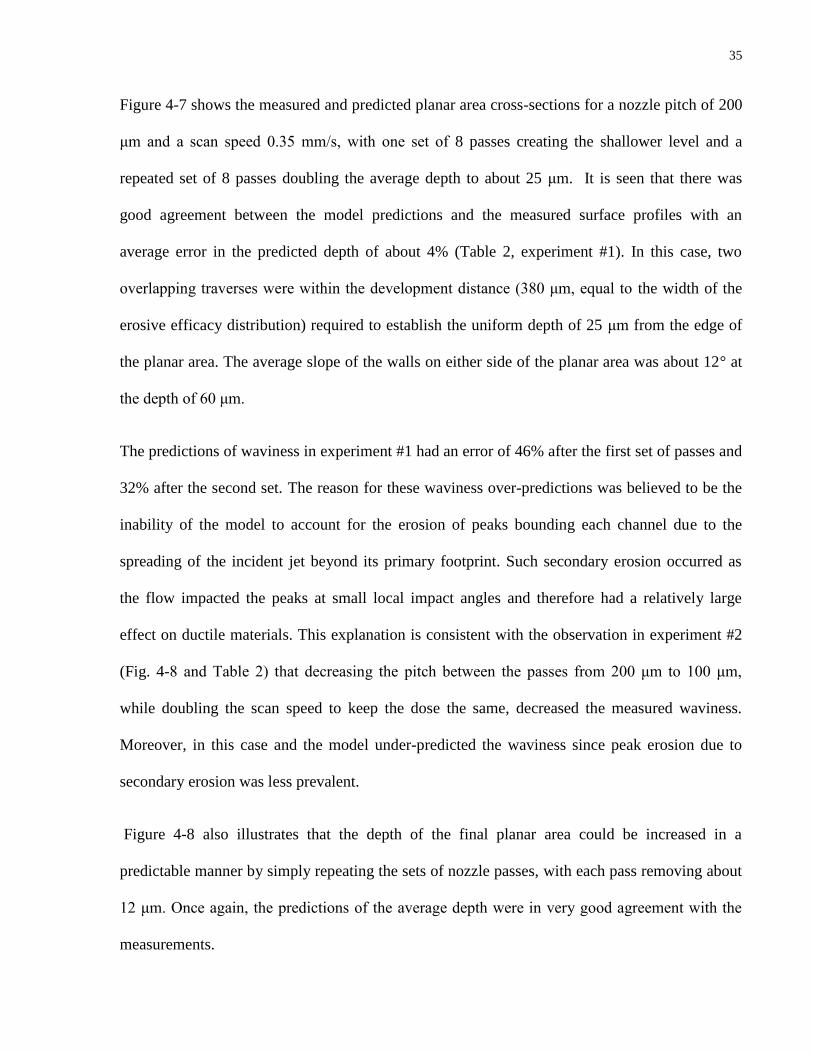
Figure 4-7 shows the measured and predicted planar area cross-sections for a nozzle pitch of 200
μm and a scan speed 0.35 mm/s, with one set of 8 passes creating the shallower level and a
repeated set of 8 passes doubling the average depth to about 25 μm. It is seen that there was
good agreement between the model predictions and the measured surface profiles with an
average error in the predicted depth of about 4% (Table 2, experiment #1). In this case, two
overlapping traverses were within the development distance (380 μm, equal to the width of the
erosive efficacy distribution) required to establish the uniform depth of 25 μm from the edge of
the planar area. The average slope of the walls on either side of the planar area was about 12° at
the depth of 60 μm.
The predictions of waviness in experiment #1 had an error of 46% after the first set of passes and
32% after the second set. The reason for these waviness over-predictions was believed to be the
inability of the model to account for the erosion of peaks bounding each channel due to the
spreading of the incident jet beyond its primary footprint. Such secondary erosion occurred as
the flow impacted the peaks at small local impact angles and therefore had a relatively large
effect on ductile materials. This explanation is consistent with the observation in experiment #2
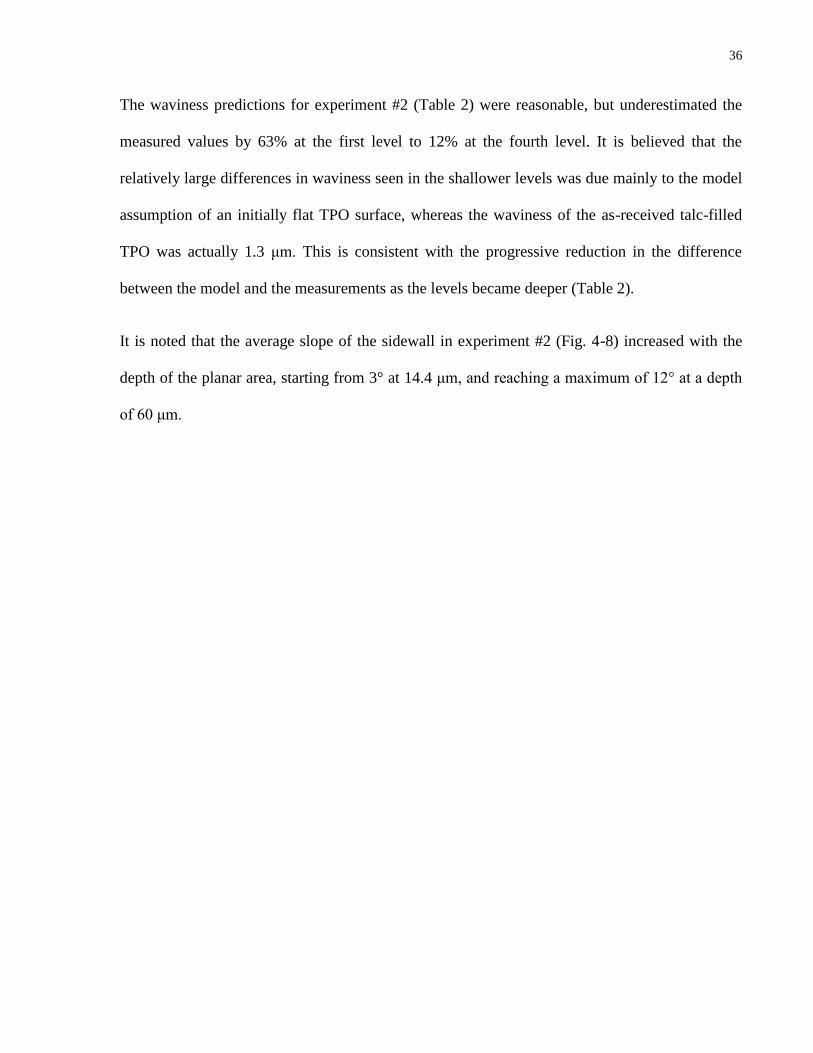
(Fig. 4-8 and Table 2) that decreasing the pitch between the passes from 200 μm to 100 μm,
while doubling the scan speed to keep the dose the same, decreased the measured waviness.
Moreover, in this case and the model under-predicted the waviness since peak erosion due to
secondary erosion was less prevalent.
Figure 4-8 also illustrates that the depth of the final planar area could be increased in a
predictable manner by simply repeating the sets of nozzle passes, with each pass removing about
12 μm. Once again, the predictions of the average depth were in very good agreement with the
measurements.
36
The waviness predictions for experiment #2 (Table 2) were reasonable, but underestimated the
measured values by 63% at the first level to 12% at the fourth level. It is believed that the
relatively large differences in waviness seen in the shallower levels was due mainly to the model
assumption of an initially flat TPO surface, whereas the waviness of the as-received talc-filled
TPO was actually 1.3 μm. This is consistent with the progressive reduction in the difference
between the model and the measurements as the levels became deeper (Table 2).
It is noted that the average slope of the sidewall in experiment #2 (Fig. 4-8) increased with the
depth of the planar area, starting from 3° at 14.4 μm, and reaching a maximum of 12° at a depth
of 60 μm.
37
-40
-30
-20
-10
0
0 400 800 1200 1600 2000D
ep
th (
mm
)
Width (mm)
Figure 4-7 Measured (data points) and model predictions (dashed lines) for machining of planar
areas using one (upper curves) and two sets of passes. 15 wt% talc-filled TPO, nozzle pitch=200
μm, scan speed=0.35 mm/s, α=45° forward inclination (Fig. 2-4 (b)). Note that the scales of
depth and width are different. Experiment #1 in Table 2.
38
-75
-60
-45
-30
-15
0
0 400 800 1200 1600 2000D
ep
th (
mm
)
Width (mm)
Figure 4-8 Measured (data points) and model predictions (dashed lines) for machining of planar
areas using one (upper curves) to four sets of passes. 15 wt% talc-filled TPO, nozzle pitch=100
μm, scan speed=0.70 mm/s, α=45° forward inclination (Fig. 2-4(b)). Note that the scales of depth
and width are different. Experiment #2 in Table 2.
39
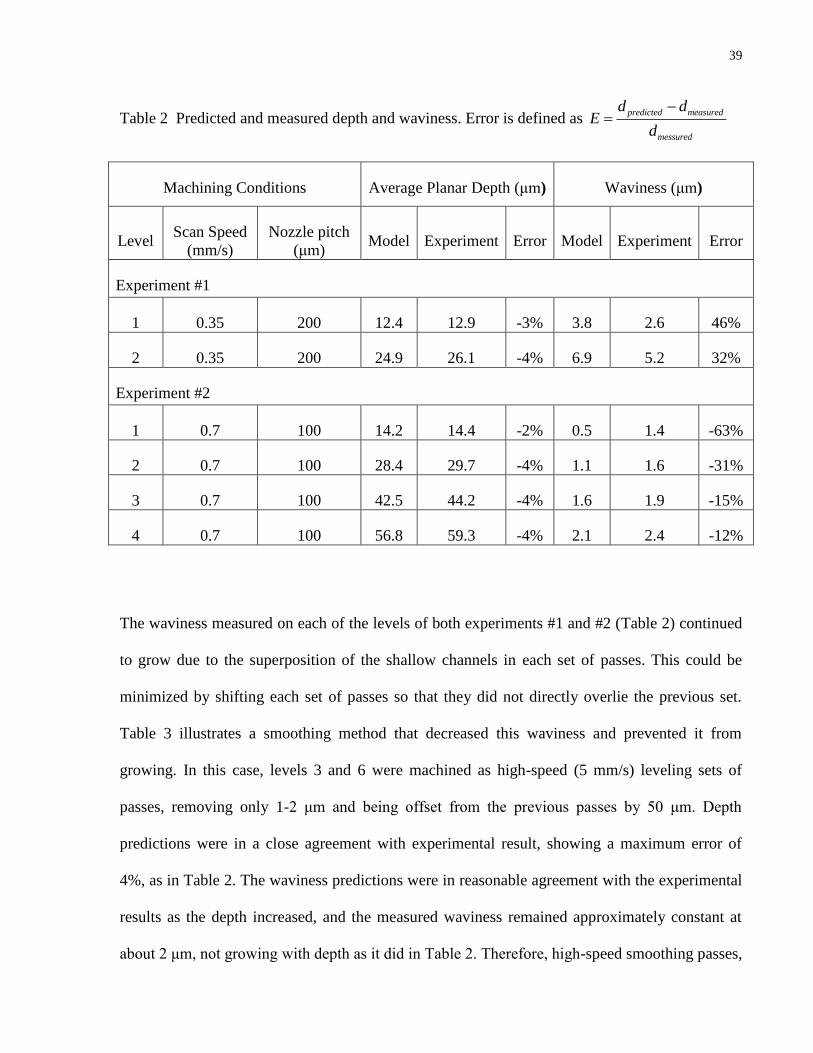
Table 2 Predicted and measured depth and waviness. Error is defined as predicted measured
messured
d dE
d
Machining Conditions Average Planar Depth (μm) Waviness (μm)
Level Scan Speed
(mm/s)
Nozzle pitch
(μm) Model Experiment Error Model Experiment Error
Experiment #1
1 0.35 200 12.4 12.9 -3% 3.8 2.6 46%
2 0.35 200 24.9 26.1 -4% 6.9 5.2 32%
Experiment #2
1 0.7 100 14.2 14.4 -2% 0.5 1.4 -63%
2 0.7 100 28.4 29.7 -4% 1.1 1.6 -31%
3 0.7 100 42.5 44.2 -4% 1.6 1.9 -15%
4 0.7 100 56.8 59.3 -4% 2.1 2.4 -12%
The waviness measured on each of the levels of both experiments #1 and #2 (Table 2) continued
to grow due to the superposition of the shallow channels in each set of passes. This could be
minimized by shifting each set of passes so that they did not directly overlie the previous set.
Table 3 illustrates a smoothing method that decreased this waviness and prevented it from
growing. In this case, levels 3 and 6 were machined as high-speed (5 mm/s) leveling sets of
passes, removing only 1-2 μm and being offset from the previous passes by 50 μm. Depth
predictions were in a close agreement with experimental result, showing a maximum error of
4%, as in Table 2. The waviness predictions were in reasonable agreement with the experimental
results as the depth increased, and the measured waviness remained approximately constant at
about 2 μm, not growing with depth as it did in Table 2. Therefore, high-speed smoothing passes,
40
offset from the preceding deeper sets of passes, could be used to decrease waviness and prevent
it from growing as the number of levels increased.
Table 3 Predicted and measured depth and waviness for machined planar areas with smoothing
passes. Error defined as predicted measured
messured
d dE
d
Machining Conditions Average Planar
Depth (μm)
Waviness (μm)
Level
Scan
Speed
(mm/s)
Nozzle
pitch (μm)
Nozzle
shift (μm) Model Expt Error Model Expt Error
1 0.7 100 N/A 14.3 14.5 -2% 0.5 1.4 -63%
2 0.7 100 N/A 28.6 29.1 -4% 1.1 1.7 -35%
3 5 100 50 30.1 31.1 -3% 0.7 1.4 -57%
4 0.7 100 -50 43.4 44.2 -2% 1.6 1.9 -15%
5 0.7 100 N/A 57.5 58.7 -2% 2.1 2.3 -12%
6 5 100 50 58.5 59.6 -2% 1.7 1.9 -10%

41
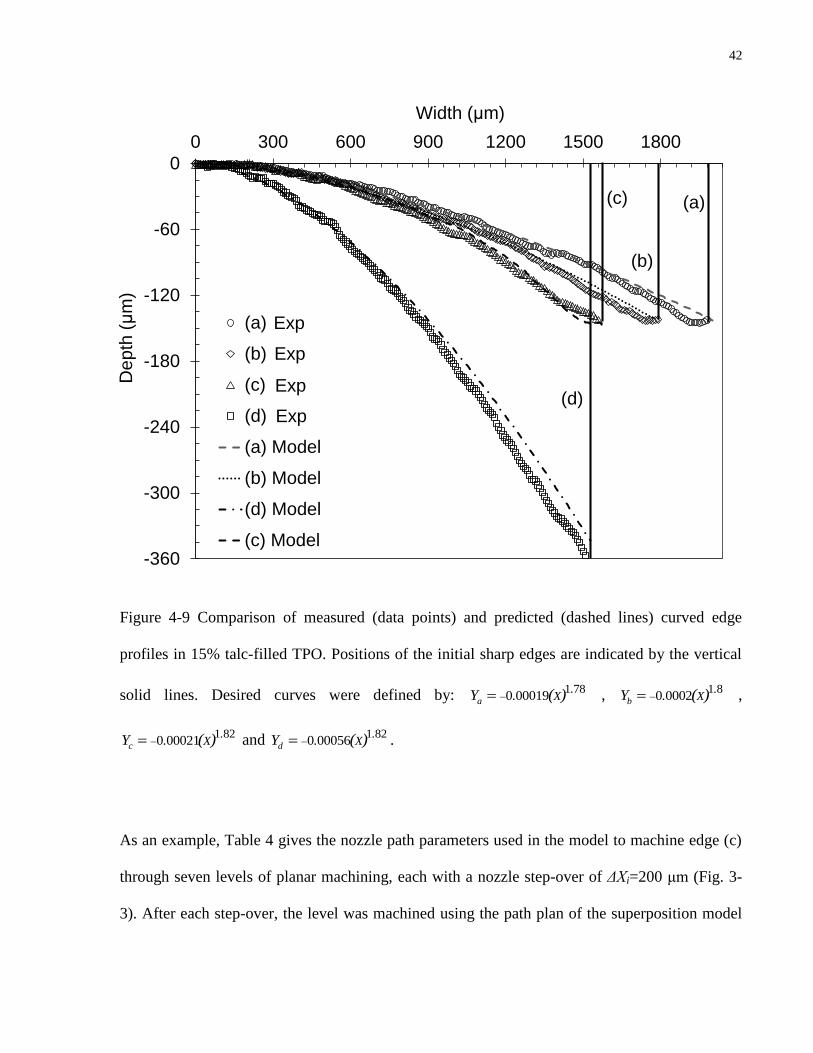
4.4 Curved Edge Machining
Two comparisons are of interest in curved-edge machining: (i) the actual profile of the machined
edge compared with the model predictions, and (ii) the model edge profile compared with the
desired curved edge. The former tests the ability of the model to reflect the actual erosion
produced by the jet, while the second illustrates the accuracy with which the model can replicate
an arbitrary, smooth curved edge. Figure 4-9 compares the predicted edge shapes with the
measured profiles for four desired edge geometries defined by the relation Xq
Y p.( ) , where p
and q are given in Fig.4-9. The layers removed to create the edges were machined using the
nozzle path machining model described in Section 3.4. In general, the agreement was very good,
with only a small under-prediction (about 8%) of the erosion near the vertical edge (toward the
right side of the machined edges in Fig. 4-9). It is believed that this additional erosion resulted
from deflection of the unbounded slurry jet toward the free edge where it rapidly eroded edge
material at a small local impact angle. The small hook seen in the machined edges of (a) and (b)
in Fig. 4-9 was due to small errors in the positioning of the first passes of the nozzle. This could
have been eliminated by simply continuing to the right with another set of passes.
42
-360
-300
-240
-180
-120
-60
0
0 300 600 900 1200 1500 1800D
ep
th (μ
m)
Width (μm)
(a) Exp
(b) Exp
(c) Exp
(d) exp
(a) Model
(b) Model
(d) Model
(c) Model
(a)
(b)
(d)
(c)
Exp
Exp
Exp
Exp
Figure 4-9 Comparison of measured (data points) and predicted (dashed lines) curved edge
profiles in 15% talc-filled TPO. Positions of the initial sharp edges are indicated by the vertical
solid lines. Desired curves were defined by: 1 780 00019a
.X.Y ( ) , 1 8
0 0002b
.X.Y ( ) ,
1 820 00021c
.X.Y ( ) and 1 82
0 00056d
.X.Y ( ) .
As an example, Table 4 gives the nozzle path parameters used in the model to machine edge (c)
through seven levels of planar machining, each with a nozzle step-over of ΔXi=200 μm (Fig. 3-
3). After each step-over, the level was machined using the path plan of the superposition model
43
for planar areas (Section 3.3), with the levels 4-7 on the steepest past of the curved edge having
more than one sublevel (set of passes).
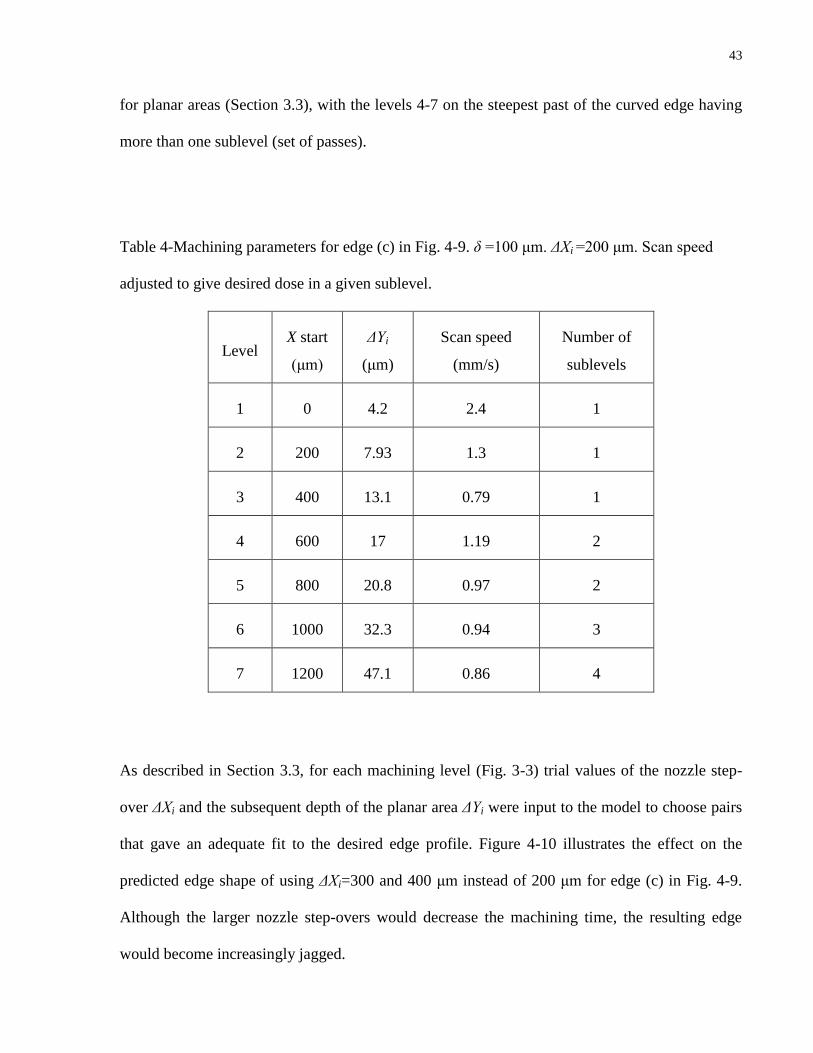
Table 4-Machining parameters for edge (c) in Fig. 4-9. δ =100 μm. ΔXi =200 μm. Scan speed
adjusted to give desired dose in a given sublevel.
Level X start
(μm)
ΔYi
(μm)
Scan speed
(mm/s)
Number of
sublevels
1 0 4.2 2.4 1
2 200 7.93 1.3 1
3 400 13.1 0.79 1
4 600 17 1.19 2
5 800 20.8 0.97 2
6 1000 32.3 0.94 3
7 1200 47.1 0.86 4
As described in Section 3.3, for each machining level (Fig. 3-3) trial values of the nozzle step-
over ΔXi and the subsequent depth of the planar area ΔYi were input to the model to choose pairs
that gave an adequate fit to the desired edge profile. Figure 4-10 illustrates the effect on the
predicted edge shape of using ΔXi=300 and 400 μm instead of 200 μm for edge (c) in Fig. 4-9.
Although the larger nozzle step-overs would decrease the machining time, the resulting edge
would become increasingly jagged.
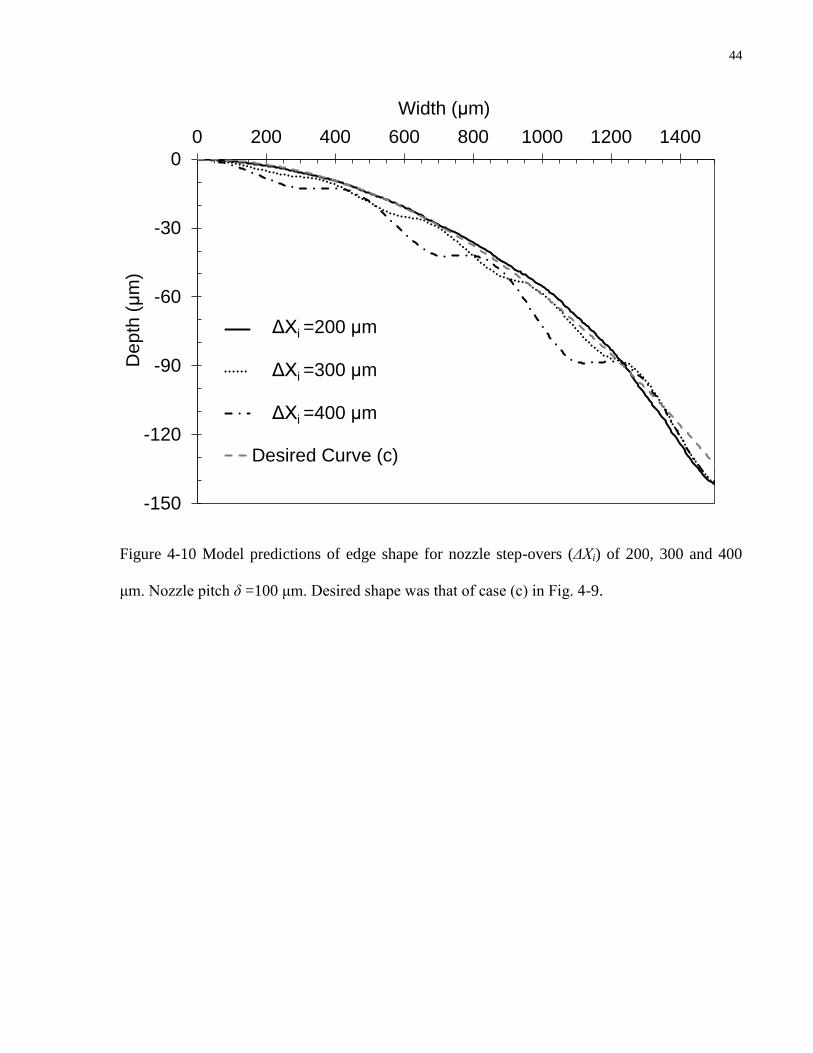
44
-150
-120
-90
-60
-30
0
0 200 400 600 800 1000 1200 1400D
ep
th (μ
m)
Width (μm)
200
300
400
Desired Curve (c)
ΔXi =200 μm
ΔXi =300 μm
ΔXi =400 μm
Figure 4-10 Model predictions of edge shape for nozzle step-overs (ΔXi) of 200, 300 and 400
μm. Nozzle pitch δ =100 μm. Desired shape was that of case (c) in Fig. 4-9.

45
4.5 Control of Side-Wall Slope
The inclined forward nozzle configuration of Fig. 2-4(b) produced sidewalls with relatively
shallow slopes of up to 12 at 60 μm depth (Figs. 4-7 and 4-8), which increased to 33 at a planar
depth of 188 μm (cross-section not shown). These slopes were defined largely by the slope of the
single-pass channel and the depth of the planar area.
It was of interest to investigate whether this slope could be increased and controlled for a given
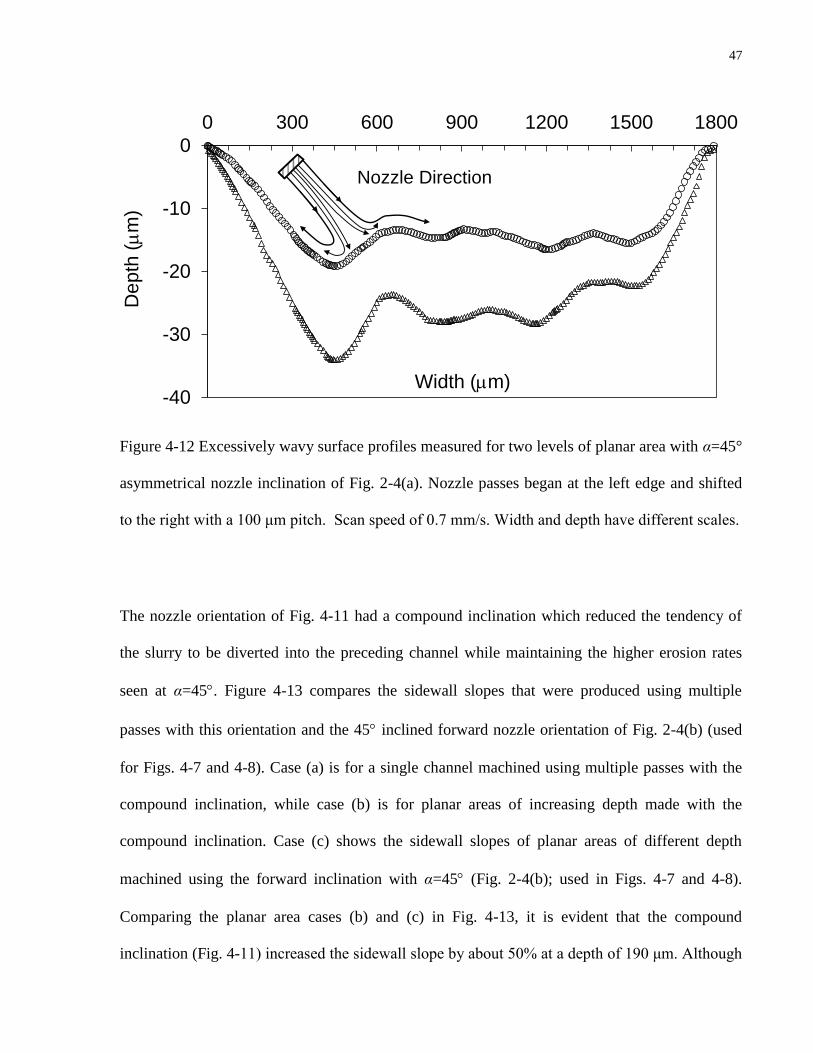
planar area depth. An initial set of experiments to machine steeper sidewalls was performed
using the nozzle orientation of Fig. 2-4(a). Although repeated passes over the same channel in
this orientation produced a slope of 82 at a depth of 224 μm, it proved to be impossible to
continue to scan with this nozzle configuration to machine an adjacent smooth planar area. The
problem is illustrated in Fig. 4-12, which shows a planar area ending in a relatively steep right
sidewall. In this case, the passes progressed from left to right, and it was seen that as the abrasive
jet flowed across the ridges of the preceding passes, the slurry was diverted into these channels
and the waviness was accentuated.
46
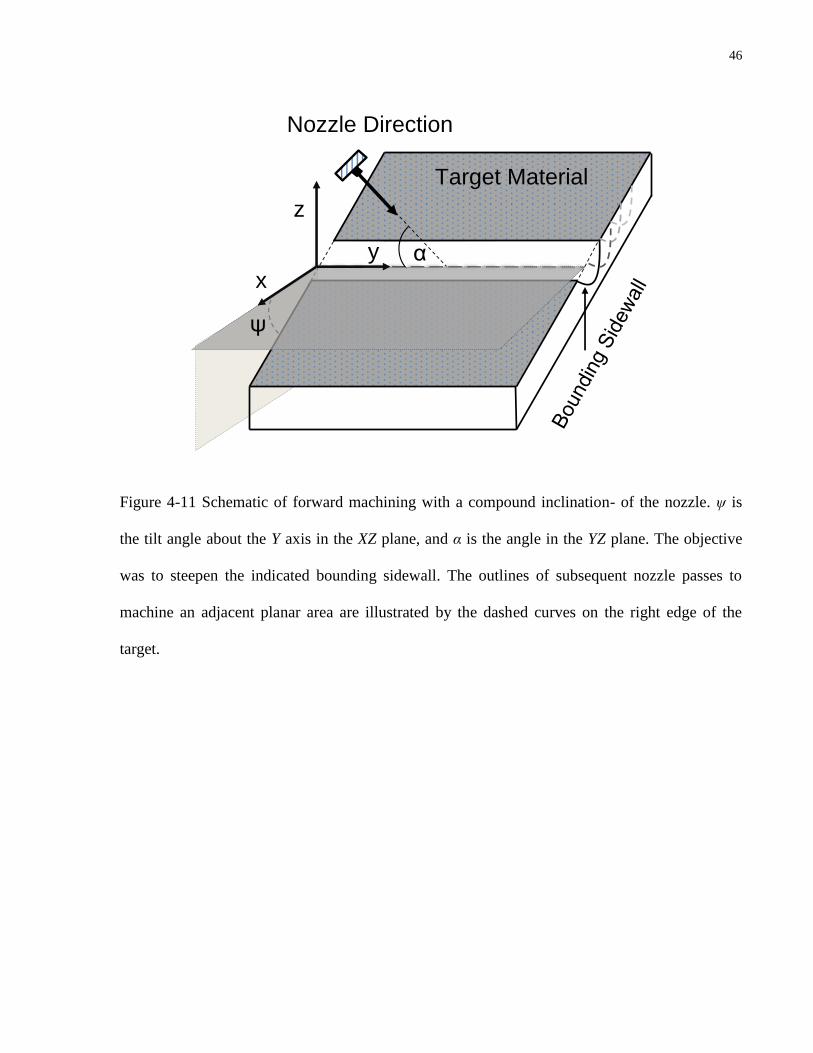
x
z
Nozzle Direction
Target Material
α
ψ
y
Figure 4-11 Schematic of forward machining with a compound inclination- of the nozzle. ψ is
the tilt angle about the Y axis in the XZ plane, and α is the angle in the YZ plane. The objective
was to steepen the indicated bounding sidewall. The outlines of subsequent nozzle passes to
machine an adjacent planar area are illustrated by the dashed curves on the right edge of the
target.
47
-40
-30
-20
-10
0
0 300 600 900 1200 1500 1800D
epth
(m
m)
Width (mm)
Nozzle Direction
Figure 4-12 Excessively wavy surface profiles measured for two levels of planar area with α=45°
asymmetrical nozzle inclination of Fig. 2-4(a). Nozzle passes began at the left edge and shifted
to the right with a 100 μm pitch. Scan speed of 0.7 mm/s. Width and depth have different scales.
The nozzle orientation of Fig. 4-11 had a compound inclination which reduced the tendency of
the slurry to be diverted into the preceding channel while maintaining the higher erosion rates
seen at α=45. Figure 4-13 compares the sidewall slopes that were produced using multiple
passes with this orientation and the 45 inclined forward nozzle orientation of Fig. 2-4(b) (used
for Figs. 4-7 and 4-8). Case (a) is for a single channel machined using multiple passes with the
compound inclination, while case (b) is for planar areas of increasing depth made with the
compound inclination. Case (c) shows the sidewall slopes of planar areas of different depth
machined using the forward inclination with α=45 (Fig. 2-4(b); used in Figs. 4-7 and 4-8).
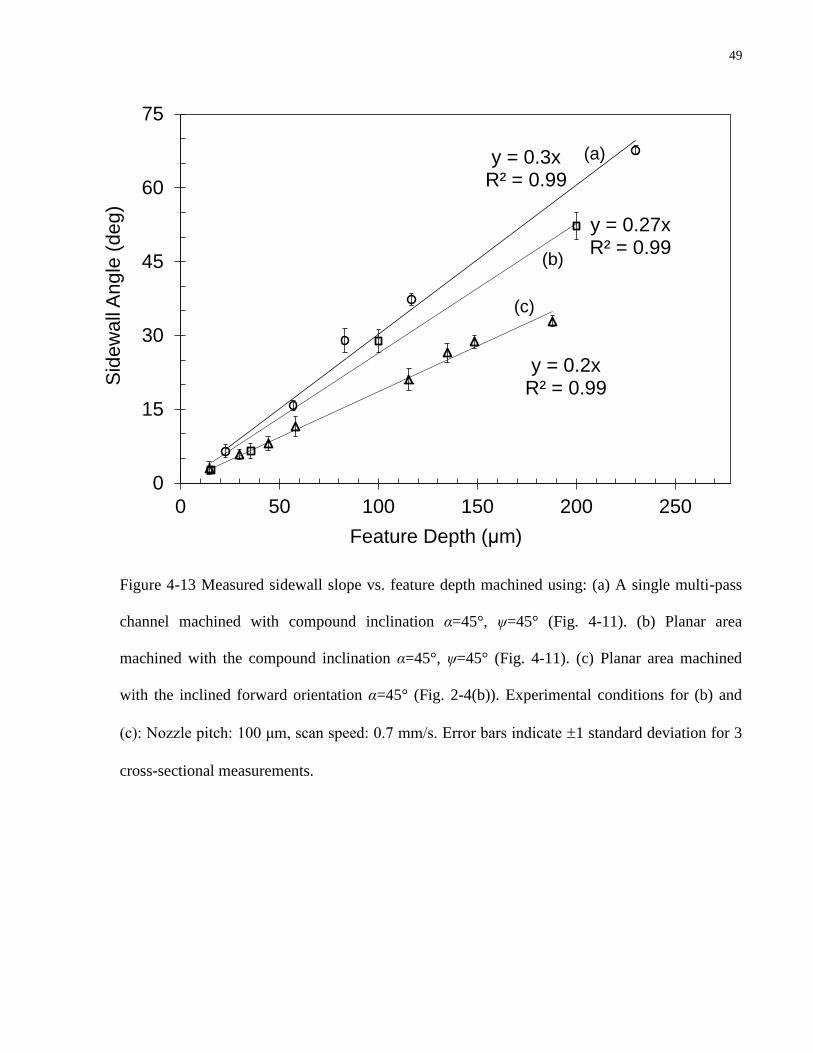
Comparing the planar area cases (b) and (c) in Fig. 4-13, it is evident that the compound
inclination (Fig. 4-11) increased the sidewall slope by about 50% at a depth of 190 μm. Although
48
the present machining models cannot predict these sidewall slopes, the linear trends seen in
Fig.4-13 make it possible in principle to predict the sidewall slope at an arbitrary depth using
only a single measurement of depth and slope for a given target and ASJM system. Case (a) in
Fig. 4-13 shows that repeated passes over a single channel using the compound nozzle
inclination produced slightly steeper sidewalls than those machined adjacent to planar areas (case
(b)).
49
y = 0.3xR² = 0.99
y = 0.27xR² = 0.99
y = 0.2xR² = 0.99
0
15
30
45
60
75
0 50 100 150 200 250
Sid
ew
all
Angle
(deg)
Feature Depth (μm)
(a)
(b)
(c)
Figure 4-13 Measured sidewall slope vs. feature depth machined using: (a) A single multi-pass
channel machined with compound inclination α=45°, ψ=45° (Fig. 4-11). (b) Planar area
machined with the compound inclination α=45°, ψ=45° (Fig. 4-11). (c) Planar area machined
with the inclined forward orientation α=45° (Fig. 2-4(b)). Experimental conditions for (b) and
(c): Nozzle pitch: 100 μm, scan speed: 0.7 mm/s. Error bars indicate 1 standard deviation for 3
cross-sectional measurements.
50
Chapter 5
Conclusions
5.1 Summary
An abrasive slurry jet micro-machining system (ASJM) was used to measure the angular
dependence of the erosion rate of 15 wt% talc-filled thermoplastic olefin (TPO). A typical
ductile erosion response was observed with the maximum erosion rate at 45° angle of incidence.
Reducing the talc concentration to 3 wt% caused a four-fold decrease in the erosion rate.
A model was developed to predict the depth and waviness of planar areas machined in the TPO
using repeated passes of the ASJM nozzle. Comparisons with machined areas showed that depth
and waviness could be predicted with an accuracy of 96%. It was demonstrated that the tendency
of waviness to grow with the number of machining passes could be circumvented by the
introduction of shallow smoothing passes.
The slopes of the sidewalls bounding the planar areas showed a linear dependence on the depth
of the area. A compound nozzle inclination (45° relative to both the target plane and the axis of
the machining pass) provided the steepest sidewalls while maintaining low values of planar area
waviness.
A second model was developed to predict the nozzle path and scan speed to machine curved
edges of arbitrary shape. The predicted and measured edge profiles had a maximum depth error
of about 7%, and it was shown that the smoothness of the machined edge could be controlled by
adjusting the spacing between the nozzle passes and the depth of each cut.
51
5.2 Contributions
The thesis presented a novel nozzle path model to machine planar areas of specified waviness in
ductile materials. The model is applicable to a wide variety of materials and needs only a few
preliminary experiments to capture the erosion behavior of the material and the erosive efficacy
distribution of the abrasive system. The research also investigated the machining of the sidewalls
bounding planar areas, and developed an approach to the creation of slopes having a desired
steepness. Finally, the thesis presented novel measurements of the dependence of the erosion rate
of a talc-filled thermoplastic polyolefin on the particle impact angle and the amount of talc filler.
52
6 References
Ally, S., Spelt, J. K., Papini, M. (2012). Prediction of machined surface evolution in the abrasive
jet micro-machining of metals. Wear 292-293, 89-99.
Arjula, S., Harsha, A. P., Ghosh, M. K. (2008). Solid-particle erosion behavior of high-
performance thermoplastic polymers. Journal of Materials Science 43, 1757-1768.
Barkoula, N. M., Karger-Kocsis, J. (2002). Effects of fibre content and relative fibre-orientation
on the solid particle erosion of GF/PP composites. Wear 252, 80-87.
Billingham, J., Miron, C. B., Axinte, D. A., Kong, M. C. (2013). Mathematical modelling of
abrasive waterjet footprints for arbitrarily moving jets: Part II - Overlapped single and multiple
straight paths. International Journal of Machine Tools and Manufacture 68, 30-39.
Chu, J., C. Xiang, H. J. Sue and R. D. Hollis (2000). Scratch resistance of mineral-filled
polypropylene materials. Polymer Engineering & Science 40, 944-955.
Getu, H., Ghobeity, A., Spelt, J. K., Papini, M. (2007). Abrasive jet micromachining of
polymethylmethacrylate. Wear 263(7-12 SPEC. ISS.), 1008-1015.
Getu, H., Spelt, J. K., Papini, M. (2008). Cryogenically assisted abrasive jet micromachining of
polymers. Journal of Micromechanics and Microengineering 18(11).
Ghobeity, A., Getu, H., Papini, M., Spelt, J. K. (2007). Surface evolution models for abrasive jet
micromachining of holes in glass and polymethylmethacrylate (PMMA). Journal of
Micromechanics and Microengineering 17, 2175-2185.
Ghobeity, A., Krajac, T., Burzynski, T., Papini, M., Spelt, J. K. (2008). Surface evolution models
in abrasive jet micromachining. Wear 264, 185-198.
Ghobeity, A., Spelt, J. K., Papini, M. (2008). Abrasive jet micro-machining of planar areas and
transitional slopes. Journal of Micromechanics and Microengineering 18(5).

53
Gradeen, A. G., Papini, M., Spelt, J. K. (2014). The effect of temperature on the cryogenic
abrasive jet micro-machining of polytetrafluoroethylene, high carbon steel and
polydimethylsiloxane. Wear 317, 170-178.
Gradeen, A. G., Spelt, J. K., Papini, M. (2012). Cryogenic abrasive jet machining of
polydimethylsiloxane at different temperatures. Wear 274-275, 335-344.
Jafar, R. H. M., Papini, M., Spelt, J. K. (2013). Simulation of erosive smoothing in the abrasive
jet micro-machining of glass. Journal of Materials Processing Technology 213, 2254-2261.
Kowsari, K., James, D. F., Papini, M., Spelt, J. K. (2014). The effects of dilute polymer solution
elasticity and viscosity on abrasive slurry jet micro-machining of glass. Wear 309, 112-119.
Mallock, A. (1926). Hardness. Nature 117, 117-118.
Miller, D. S. (2004). Micromachining with abrasive waterjets. Journal of Materials Processing
Technology 149, 37-42.
Nouraei, H., Kowsari, K., Spelt, J. K., Papini, M. (2014). Surface evolution models for abrasive
slurry jet micro-machining of channels and holes in glass. Wear 309, 65-73.
Nouraei, H., Wodoslawsky, A., Papini, M., Spelt, J. K. (2013). Characteristics of abrasive slurry
jet micro-machining: A comparison with abrasive air jet micro-machining. Journal of Materials
Processing Technology 213, 1711-1724.
Oka, Y. I., Ohnogi, H., Hosokawa, T., Matsumura, M. (1997). The impact angle dependence of
erosion damage caused by solid particle impact. Wear 203-204, 573-579.
Oka, Y. I., Okamura, K.,Yoshida, T. (2005). Practical estimation of erosion damage caused by
solid particle impact: Part 1: Effects of impact parameters on a predictive equation. Wear 259,
95-101.
Pang, K. L., Nguyen, T., Fan, J. M., Wang, J. (2012). Modelling of the micro-channelling
process on glasses using an abrasive slurry jet. International Journal of Machine Tools and
Manufacture 53, 118-126.

54
Sole, B. M., Ball, A. (1996). On the abrasive wear behaviour of mineral filled polypropylene.
Tribology International 29, 457-465.
Suresh, A., Harsha, A. P., Ghosh, M. K. (2009). Solid particle erosion of unidirectional fibre
reinforced thermoplastic composites. Wear 267, 1516-1524.
Tilly, G. P. (1969). Erosion caused by airborne particles. Wear 14, 63-79.