Embed Size (px)
Citation preview

This eBook is protected by Copyright law and International Treaties. All rights are reserved. This book is covered by an End UserLicensee Agreement (EULA). The full EULA may be seen at http://www.library4science.com/eula.html .
1
BOOK 1
Chrom-Ed Book Series
Raymond P. W. Scott
PRINCIPLES AND
PRACTICE OF
CHROMATOGRAPHY

This eBook is protected by Copyright law and International Treaties. All rights are reserved. This book is covered by an End UserLicensee Agreement (EULA). The full EULA may be seen at http://www.library4science.com/eula.html .
2
Chrom-Ed Book Series
Book 1 Principles and Practice of ChromatographyBook 2 Gas ChromatographyBook 3 Liquid ChromatographyBook 4 Gas Chromatography DetectorsBook 5 Liquid Chromatography DetectorsBook 6 The Plate Theory and Extensions for Chromatography ColumnsBook 7 The Thermodynamics of ChromatographyBook 8 The Mechanism of RetentionBook 9 Dispersion in Chromatography ColumnsBook 10 Extra Column DispersionBook 11 Capillary ChromatographyBook 12 Preparative ChromatographyBook 13 GC Tandem SystemsBook 14 LC Tandem SystemsBook 15 GC Quantitative AnalysisBook 16 LC Quantitative AnalysisBook 17 Silica Gel and Its Uses in ChromatographyBook 18 Thin Layer ChromatographyBook 19 Chiral ChromatographyBook 20 Sample Preparation
COPYRIGHT @2003 by LIBRARYFORSCIENCE, LLCALL RIGHTS RESERVED
Neither this book or any part may be reduced or transmitted in anyform or by any means, electronic or mechanical, including photocopying, microfilming, and recording or by anyinformation storage and retrieved system without permission in writingfrom the publisher except as permitted by the in-user license agreement.
World Wide Webhttp://www.library4science.com/

This eBook is protected by Copyright law and International Treaties. All rights are reserved. This book is covered by an End UserLicensee Agreement (EULA). The full EULA may be seen at http://www.library4science.com/eula.html .
3

This eBook is protected by Copyright law and International Treaties. All rights are reserved. This book is covered by an End UserLicensee Agreement (EULA). The full EULA may be seen at http://www.library4science.com/eula.html .
4
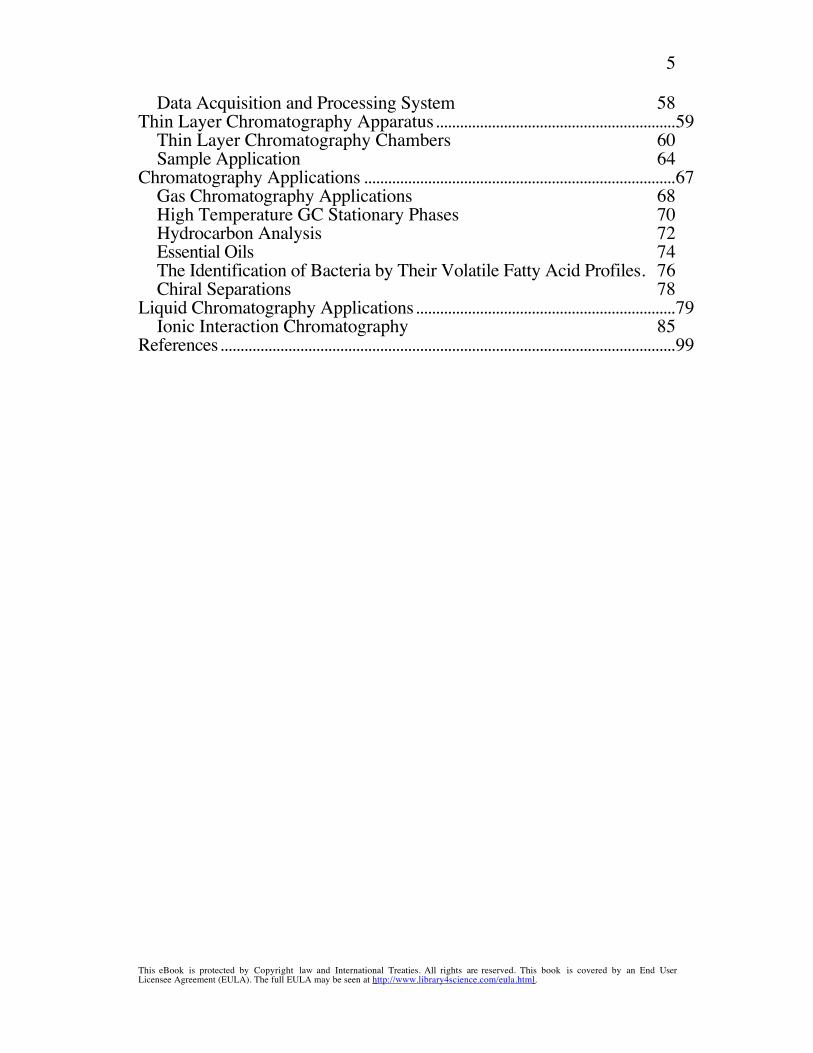
ContentsIntroduction ...............................................................................................................1The Development Process......................................................................................5
Displacement Development 5Frontal Analysis 6Elution Development 7Elution Development in Thin Layer Chromatography 10
Chromatography Nomenclature...........................................................................12Factors Controlling Retention ...............................................................................14
The Thermodynamic Explanation of Retention 15Factors Affecting the Magnitude of the Distribution Coefficient(K)................................................................................................................................19
Molecular Forces 19Dispersion Forces 19Polar Forces 21Dipole-Dipole Interactions 21Dipole-Induced-Dipole Interactions 23Ionic Forces 24
Hydrophobic and Hydrophilic Interactions 26Molecular Forces and Chromatographic Selectivity........................................27
Separations Based on Dispersive Interactions 28Separations Based on Polar Interactions 30Separations Based on Ionic Interactions 33
The Control of Chromatographically Available Stationary Phase(Vs)...............................................................................................................................34
The Effect of Stationary Phase Loading on the Performance of aChromatographic System 35Stationary Phase Limitation by Chiral Selectivity 36Stationary Phase Limitation by Exclusion 39
Peak Dispersion in a Chromatographic Column...............................................40The Multi-Path Effect 41Longitudinal Diffusion 42The Resistance to Mass Transfer in the Mobile Phase 43The Resistance to Mass Transfer in the Stationary Phase 44The Golay Equation for Open Tubular Columns 46The Efficiency of a TLC Plate 47
The Basic Column Chromatograph .....................................................................48The Mobile Phase Supply 49The Sampling System 50The Column and Column Oven 52Detector and Detector Electronics 53
The Detector Output 53
This eBook is protected by Copyright law and International Treaties. All rights are reserved. This book is covered by an End UserLicensee Agreement (EULA). The full EULA may be seen at http://www.library4science.com/eula.html .
5
Data Acquisition and Processing System 58Thin Layer Chromatography Apparatus............................................................59
Thin Layer Chromatography Chambers 60Sample Application 64
Chromatography Applications ..............................................................................67Gas Chromatography Applications 68High Temperature GC Stationary Phases 70Hydrocarbon Analysis 72Essential Oils 74The Identification of Bacteria by Their Volatile Fatty Acid Profiles. 76Chiral Separations 78
Liquid Chromatography Applications.................................................................79Ionic Interaction Chromatography 85
References..................................................................................................................99


This eBook is protected by Copyright law and International Treaties. All rights are reserved. This book is covered by an End UserLicensee Agreement (EULA). The full EULA may be seen at http://www.library4science.com/eula.html .
1
Introduction
Chromatography, although primarily a separation technique, is mostlyemployed in chemical analysis. Nevertheless, to a limited extent, it is alsoused for preparative purposes, particularly for the isolation of relativelysmall amounts of materials that have comparatively high intrinsic value.Chromatography is probably the most powerful and versatile techniqueavailable to the modern analyst. In a single step process it can separate amixture into its individual components and simultaneously provide anquantitative estimate of each constituent. Samples may be gaseous, liquidor solid in nature and can range in complexity from a simple blend oftwo entantiomers to a multi component mixture containing widelydiffering chemical species. Furthermore, the analysis can be carried out,at one extreme, on a very costly and complex instrument, and at theother, on a simple, inexpensive thin layer plate.
The first scientist to recognize chromatography as an efficient method ofseparation was the Russian botanist Tswett (1), who used a simple formof liquid-solid chromatography to separate a number of plant pigments.The colored bands he produced on the adsorbent bed evoked the termchromatography for this type of separation (color writing). Althoughcolor has little to do with modern chromatography, the name haspersisted and, despite its irrelevance, is still used for all separationtechniques that employs the essential requisites for a chromatographicseparation,viz. a mobile phase and a stationary phase.
The technique, as described by Tswett was largely ignored for a alongtime and it was not until the late 1930s and early 1940s that Martin andSynge(2) introduced liquid-liquid chromatography by supporting thestationary phase, in this case water, on silica in a packed bed and used itto separate some acetyl amino acids. In their paper, they recommendedreplacing the liquid mobile phase by a suitable gas, as the transfer ofsample between the two phases would be faster, and thus provide moreefficient separations. In this manner, the concept of gas chromatographywas created but again, little notice was taken of the suggestion and it was

This eBook is protected by Copyright law and International Treaties. All rights are reserved. This book is covered by an End UserLicensee Agreement (EULA). The full EULA may be seen at http://www.library4science.com/eula.html .
2
left to Martin himself and A. T. James to bring the concept to practicalreality nearly a decade later. In the same publication in 1941, theessential requirements for HPLC (High Performance LiquidChromatography) were unambiguously defined,
"Thus, the smallest HETP (the highest efficiency) should beobtainable by using very small particles and a high pressure differenceacross the column".
Despite his recommendations, however, it was nearly four decadesbefore this concept were taken seriously and the predicted highefficiency liquid chromatography columns became a reality. By the mid1960s the development of all aspects of chromatography were virtuallycomplete and since then, despite the plethora of publications that haveappeared on the subject, the vast majority has dealt with applications ofthe technique and only a minority with fundamental aspects of thesubject and novel instrumentation concepts.
Today, chromatography is an extremely versatile technique; it canseparate gases, and volatile substances by GC, involatile chemicals andmaterials of extremely high molecular weight (including biopolymers) byLC and if necessary very inexpensively by TLC. All three techniques,(GC), (LC) and TLC have common features that classify them aschromatography systems.
Chromatography has been defined as follows,
Chromatography is a separation process that is achieved by distributingthe components of a mixture between two phases, a stationary phaseand a mobile phase. Those components held preferentially in thestationary phase are retained longer in the system than those that aredistributed selectively in the mobile phase. As a consequence, solutesare eluted from the system as local concentrations in the mobile phasein the order of their increasing distribution coefficients with respect tothe stationary phase; ipso facto a separation is achieved.
In practice, the distribution system, (that part of the chromatographicapparatus where the solutes are distributed between the phases) can take

This eBook is protected by Copyright law and International Treaties. All rights are reserved. This book is covered by an End UserLicensee Agreement (EULA). The full EULA may be seen at http://www.library4science.com/eula.html .
3
the form of a column such as a tube packed with particulate matter onwhich the stationary phase is bonded or coated. The mobile phase (whichmay be a gas or a liquid) passes under pressure through the column toelute the sample. The column form may also be a long, small-diameteropen tube that has the stationary phase coated or bonded to the internalsurface. Alternatively, the chromatographic system may take the form ofa plate (usually glass) the surface of which is loaded with particulatematter to which the stationary phase is coated or bonded. The mobilephase (a liquid) is arranged to percolate up the plate (usually by surfacetension forces) to elute the sample. The sample is injected into the mobilephase stream just before the front of the columns. The column isdesigned to allow two processes to take place that will produce theseparation. Firstly, as a result of different forces between each moleculartype and the stationary phase, each solute is retained to a different extentand, thus, the more weakly held will elute first and the more stronglyheld elute last. The process is diagramatically depicted below.
Two Processes Occur in the Column
1 The peaks are moved appart as a result of their relative affinities for the stationary phase.
2 The spread (dispersion) of the peaks is constrained so that the solutes can be eluted discretely.
Colum(Distrubution System)
SampleMixture
PeaksSeparated
Peak Spreading Constrained
The Function of the Column

This eBook is protected by Copyright law and International Treaties. All rights are reserved. This book is covered by an End UserLicensee Agreement (EULA). The full EULA may be seen at http://www.library4science.com/eula.html .
4
Consequently, each solute will be sequentially eluted from the column inthe reverse order of the magnitude of the interacting forces betweeneach solute and the stationary phase. Secondly, the spreading of eachsolute band (that is its dispersion) must be constrained so that each soluteis eluted discreetly. The first function of the column is achieved bychoosing the appropriate phase system (the optimum stationary phase inGC and the optimum combination of mobile phase and stationary phasein LC) to separate the solutes. The second function is achieved byselecting the optimum physical properties of the column (columndimensions, particle diameter, mobile phase velocity etc.) to ensure thatband dispersion is adequately constrained. As all chromatographicseparations are carried out using a mobile and a stationary phase, theprimary classification of chromatography is based on the physical natureof the mobile phase. The mobile phase can be a gas or a liquid whichgives rise to the two basic forms of chromatography, namely, gaschromatography (GC) and liquid chromatography (LC).
Table 1 The Classification of Chromatography
MOBILE PHASE STATIONARY PHASE
GAS
Gas Chromatography
(GC)
LIQUID
Liquid Chromatography
(LC)
LIQUIDGas-Liquid Chromatography
(GLC)SOLID
Gas-Solid Chromatography(GSC)
Liquid-Liquid Chromatography(LLC)
Liquid-Solid Chromatography(LSC)
LIQUID
SOLID
The stationary phase can also take two forms, solid and liquid, whichprovides two subgroups of GC and LC, namely; gas–solid

This eBook is protected by Copyright law and International Treaties. All rights are reserved. This book is covered by an End UserLicensee Agreement (EULA). The full EULA may be seen at http://www.library4science.com/eula.html .
5
chromatography (GSC) and gas–liquid chromatography (GLC), togetherwith liquid solid chromatography (LSC) and liquid chromatography(LLC). The different forms of chromatography are summarized in Table1. Most thin layer chromatography techniques are considered liquid-solidsystems although the solute normally interacts with a liquid-like surfacecoating on the adsorbent or support or, in some cases an actual liquidcoating.
The Development Process
A solute progresses through the chromatographic system, albeit througha column or along a plate, only while it is in the mobile phase. Thisprocess, whereby the substances are moved through thechromatographic system, is called chromatographic development. Thereare three types of chromatographic development, elution development,displacement development and frontal analysis. Elution development isnow virtually the only development technique employed in both GC andLC although some displacement development is occasionally used inpreparative LC.
In TLC, the development process is confused by the frontal analysis ofthe multicomponent solvent that occurs as the mobile phase movesthrough the system. In contrast, the solutes are transported across theplate by elution development. This apparent paradox will be explained indetail in due course.
Displacement Development
Displacement development is only effective with a solid stationary phasewhere the solutes are adsorbed on its surface. The sample mixture isplaced on the front of the distribution system, and the individual solutescompete for the immediately available adsorption sites. Initially, all thenearby adsorbent sites will be saturated with the most strongly heldcomponent. As the sample band moves through the system the nextavailable adsorption sites will become saturated with the next moststrongly adsorbed component. Thus, the components array themselvesalong the distribution system in order of their decreasing adsorption

This eBook is protected by Copyright law and International Treaties. All rights are reserved. This book is covered by an End UserLicensee Agreement (EULA). The full EULA may be seen at http://www.library4science.com/eula.html .
6
strength. The sample components are usually held on the stationaryphase so strongly that they are eluted very slowly or even not at all.Consequently the solute must be displaced by a substance more stronglyheld than any of the solutes (called the displacer). The displacer,contained at a low concentration in the mobile phase, first displaces themost strongly held component. In turn this component will displace theone next to it. Thus, the displacer forces the adsorbed componentsprogressively through the distribution system, each componentdisplacing the one in front until they are all pass through the system. Thesolutes will be characterized by the order in which they elute and theamount of each solute present will be proportional to the length of eachband, not the height. In displacement development the solutes are neveractually separated from one another. The solutes leave the systemsequentially and in contact, each somewhat mixed with its neighbor. Thistype of development is not used in analytical chromatography and onlyvery rarely in preparative LC. However, displacement effects can occurin overloaded distribution systems and in the development of thin layerplates with multicomponent solvents.
Frontal Analysis
This type of chromatographic development is rarely used and probably isof academic interest only; it and can only be effectively employed in acolumn distribution system. The sample is fed continuously onto thecolumn as a dilute solution in the mobile phase in contrast todisplacement and elution development, where discrete samples are placedon the system and the separation subsequently processed. Frontalanalysis can only separate part of the first compound in a relatively purestate, each subsequent component being mixed with those previouslyeluted. Consider a three component mixture, containing solutes (A), (B)and (C) as a dilute solution in the mobile phase that is fed continuouslyonto a column. The first component to elute, (A), will be that solute heldleast strongly in the stationary phase. Then the second solute, (B), willelute but it will be mixed with the first solute. Finally, the third solute (C),will elute in conjunction with (A) and (B). It is clear that only solute (A)is eluted in a pure form and, thus, frontal analysis would be quite

This eBook is protected by Copyright law and International Treaties. All rights are reserved. This book is covered by an End UserLicensee Agreement (EULA). The full EULA may be seen at http://www.library4science.com/eula.html .
7
inappropriate for most practical analytical applications. This developmenttechnique has been completely superseded by elution development.
Elution Development
Elution development is best described as a series of absorption-extractionprocesses which are continuous from the time the sample is injected intothe distribution system until the time the solutes exit from it. The elutionprocess is depicted in Figure 1. The concentration profiles of the solute inboth the mobile and stationary phases are depicted as Gaussian in form.Equilibrium occurs between the two phases when the probability of asolute molecule striking the boundary and entering one phase is the sameas the probability of a solute molecule randomly acquiring sufficientkinetic energy to leave the stationary phase and enter the other phase.The distribution system is continuously thermodynamically driventoward equilibrium. However, the moving phase will continuouslydisplace the concentration profile of the solute in the mobile phaseforward, relative to that in the stationary phase which, in a grosslyexaggerated form, is depicted in Figure 1.
Profile of Solute Concentration in the Mobile Phase
Profile of Solute Concentrationin the Stationary Phase
Stationary Phase
Direction of Flow
Solute Transferring From the Stationary Phase to the Mobile Phase at theBack of the Peak Profile
Mobile Phase
Solute Transferring from the Mobile Phase to the Stationary Phase at theFront of the Peak Profile
Figure 1. The Elution of a Solute Through a ChromatographicSystem
This displacement causes the concentration of solute in the mobile phaseat the front of the peak to exceed the equilibrium concentration withrespect to that in the stationary phase. As a consequence, a net quantityof solute in the front part of the peak is continually entering the

This eBook is protected by Copyright law and International Treaties. All rights are reserved. This book is covered by an End UserLicensee Agreement (EULA). The full EULA may be seen at http://www.library4science.com/eula.html .
8
stationary phase from the mobile phase in an attempt to re-establishequilibrium. At the rear of the peak, the reverse occurs. As theconcentration profile moves forward, the concentration of solute in thestationary phase at the rear of the peak is now in excess of theequilibrium concentration. A net amount of solute must now leave thestationary phase and enters the mobile phase to re-establish equilibrium.Thus, the solute moves through the chromatographic system as a resultof solute entering the mobile phase at the rear of the peak and returningto the stationary phase at the front of the peak. However, that solute isalways transferring between the two phases over the whole of the peakin an attempt to attain or maintain thermodynamic equilibrium.Nevertheless, the solute band progresses through the system as a resultof a net transfer of solute from the mobile phase to the stationary phasein the front half of the peak. This net transfer of solute is compensatedby solute passing from the stationary phase to the mobile phase at therear half of the peak. Equilibrium processes between two phases iscomplicated, but a simplified explanation is as follows. The distribution ofkinetic energy of the solute molecules contained in the stationary phaseand mobile phase is depicted in Figure 2A and 2B. Solute moleculesleave the stationary phase when their kinetic energy is equal to orgreater than the potential energy of their interaction with the stationaryphase. The distribution of kinetic energy between the molecules dissolvedin the stationary phase at any specific temperature T, can be consideredto take the form of a Gaussian curve as shown in Figure 2A. Otherdistribution functions might be more appropriate, but the specific natureof the function used will not affect the following explanation and so, forsimplicity, the Gaussian function is assumed. The number of molecules atthe boundary surface (N1) that have a kinetic energy in excess of thepotential energy associated with their molecular interactions with thestationary phase (EA), (i.e., those molecules represented by the red areaof the distribution curve) will leave the stationary phase and enter themobile phase. Those with an energy less than (EA) will remain in thestationary phase. The distribution of energy of the solute molecules in themobile phase is depicted in Figure 2B. The distribution is again taken asGaussian in form and it is seen that the number of molecules (N2)striking the surface that have an energy less than (EA) (i.e., the red area

This eBook is protected by Copyright law and International Treaties. All rights are reserved. This book is covered by an End UserLicensee Agreement (EULA). The full EULA may be seen at http://www.library4science.com/eula.html .
9
in figure 2B) will remain in the stationary phase after entering the liquid,whereas the others having energies above (EA) will collide with thesurface and 'rebound'. 'Rebound' is, perhaps, a somewhat inappropriateterm in this context.
Kinetic Energy of Molecules
Num
ber
of M
olec
ules
Energy of Interaction of the Solute Moleculewith the Stationary Phase
N
E A
Energy Distribution Profileof Solute Molecules in the Stationary Phase
1
Kinetic Energy of MoleculesE A
A
Energy Distribution Profileof Solute Molecules in the Gas Phase
N 2
B
Energy of Interaction of the Solute Moleculewith the Stationary Phase
Figure 2. Energy Distribution of Solute Molecules in theStationary and Mobile Phase
In fact, some may rebound, others may communicate their excessenergy to a another solute molecule which will give it sufficient energyto enter the mobile phase.
In either case, the net effect is the same; there will be no net moleculetransfer if its energy is too great.

This eBook is protected by Copyright law and International Treaties. All rights are reserved. This book is covered by an End UserLicensee Agreement (EULA). The full EULA may be seen at http://www.library4science.com/eula.html .
10
Under equilibrium conditions,
N1 = N2
This description of the dynamics of solute equilibrium is oversimplified,but is sufficiently accurate for the reader to understand the basicprinciples of solute distribution between two phases.
Consider distribution between a gaseous mobile phase and a liquidstationary phase. As the temperature is raised the energy distributioncurve in the gas moves to a higher range of energies. Thus, as thecolumn temperature is increased, more solute molecules in the stationaryphase will randomly acquire sufficient energy (EA) to leave thestationary phase and enter the gas phase. Thus, the distributioncoefficient of all solutes with respect to the stationary phase will bereduced as the temperature rises and it will be seen in due course thatthis will cause the band velocity of all the solutes to be increased.
Elution Development in Thin Layer Chromatography
The development processes that take place on a thin layer plate iscomplicated by the frontal analysis of the mobile phase itself. The mobilephases used to elute the solutes in TLC are usually multi-component,containing at least three individual solvents. If the plate is not pre-conditioned with solvent, there is an elaborate modification of the platesurface which is depicted, for a ternary solvent mixture, in Figure 3.
The edge of the plate is dipped into a tray of the solvent mixture whichbegins to migrate along the plate, driven by surface tension forces. Thedifferent solvents array themselves on the surface in the manner shownin Figure 3. The solvent that interacts most strongly with the stationaryphase is extracted from the mixture and forms an adsorbed layer on thesurface that corresponds to the area (X) in the diagram. The now binarymixture continues to migrate along the plate and the next solventcomponent that interacts most strongly with the stationary phase

This eBook is protected by Copyright law and International Treaties. All rights are reserved. This book is covered by an End UserLicensee Agreement (EULA). The full EULA may be seen at http://www.library4science.com/eula.html .
11
(solvent B) is adsorbed as a layer on the surface corresponding to thearea (Y).
Plate Surface
Mobile Phase ContainingSolvents B and C
Mobile Phase ContainingSolvents A, B and C
Mobile Phase ContainingSolvent C Only
Adsorbed Solvent A Adsorbed Solvent C
Adsorbed Solvent B
Mobile Phase
X Y z
Glass PlateAdsorbent
Figure 3. The Development of a Thin Layer Plate
Finally, the remaining solvent (C) with the weakest interactions with thestationary phase continues to migrate and cover the surface with a layerof solvent (C) in the area (Z). It is seen that the distribution system,which results from the frontal analysis of the three mobile phasecomponents is now quite complex. The solutes will interact during theseparation process. In the first section (X) solutes will be distributedbetween the ternary solvent mixture (A), (B) and (C) and the surfacecovered with solvent (A). In the next section (Y) the solutes will bedistributed between a binary solvent mixture of (B) and (C) and a surfacecovered with solvent (B). Finally, distribution will take place in section(Z) between pure solvent (C) and a surface covered with solvent (C).Even this is an over-simplification, as the composition of the mobilephase in each section will not be constant but will decrease along theplate. Furthermore, as the separation progresses, the lengths of sections(X), (Y) and (Z) will continually increase. Such a system is extremelydifficult to treat theoretically particularly as the boundaries are not assharp as those depicted in Figure 3. In fact, the overall effect is as though

This eBook is protected by Copyright law and International Treaties. All rights are reserved. This book is covered by an End UserLicensee Agreement (EULA). The full EULA may be seen at http://www.library4science.com/eula.html .
12
the separation was carried out sequentially on three separate sections of aplate, each section having a different stationary phase and mobile phase.In each section, the separation will then be achieved by elutiondevelopment, but the overall effect will be a form of gradient elution.
The complexity of the system increases with the number of solvents usedand, of course, their relative concentrations. The process can besimplified considerably by pre-conditioning the plate with solvent vaporfrom the mobile phase before the separation is started. Unfortunately,this only partly reduces the adsorption effect, as the equilibrium betweenthe solvent vapor and the adsorbent surface will not be the same as thatbetween the liquid solvent and the surface. It is clear that by forming agradient by the frontal analysis of the mobile phase and carefullychoosing the solvent mixture, very delicate pseudo-gradients can becreated, which, in no small measure, accounts for the great versatility,popularity, and success of TLC.
Chromatography Nomenclature
Chromatography nomenclature has evolved over the years but it wasnot until the late 1950s that the various terms used for the characteristicsof a chromatogram were rationalized. A summary of the nomenclature isshown diagramatically in figure 4. The various terms are defined asfollows.
The baseline is any part of the chromatogram where only mobile phaseis emerging from the column.
The peak maximum is the highest point of the peak.
The injection point is that point in time/position time when/where thesample is placed on the column.
The dead point is the position of the peak-maximum of an unretainedsolute.The dead time (to) is the time elapsed between the injection point andthe dead point.

This eBook is protected by Copyright law and International Treaties. All rights are reserved. This book is covered by an End UserLicensee Agreement (EULA). The full EULA may be seen at http://www.library4science.com/eula.html .
13
Dead Volume
Dead Time
Theophyline PropanololChlomethiazol
PhenytoinCarbamazapine
Dead Point
PeakHeight
Peak Width at 0.607 (h) (2 s)
Peak Width at 0.5 (h)
Retention Time (t )r
Corrected Retention Time (t' )r
Corrected Retention Volume (V' )r
Elution Point of Unretained Solute
Retention Volume (V )r
Peak Width at Base
Vo
ot
Figure 4 The Nomenclature of a Chromatogram.
The dead volume (Vo) is the volume of mobile phase passed through thecolumn between the injection point and the dead point.
Thus, Vo = Qto where Q is the flow rate in ml/min.
The retention time (tr) is the time elapsed between the injection pointand the peak maximum. Each solute has a characteristic retention time.
The retention volume (Vr) is the volume of mobile phase passed throughthe column between the injection point and the peak maximum.
Thus, Vr = Qtr where Q is the flow rate in ml/min.
This eBook is protected by Copyright law and International Treaties. All rights are reserved. This book is covered by an End UserLicensee Agreement (EULA). The full EULA may be seen at http://www.library4science.com/eula.html .
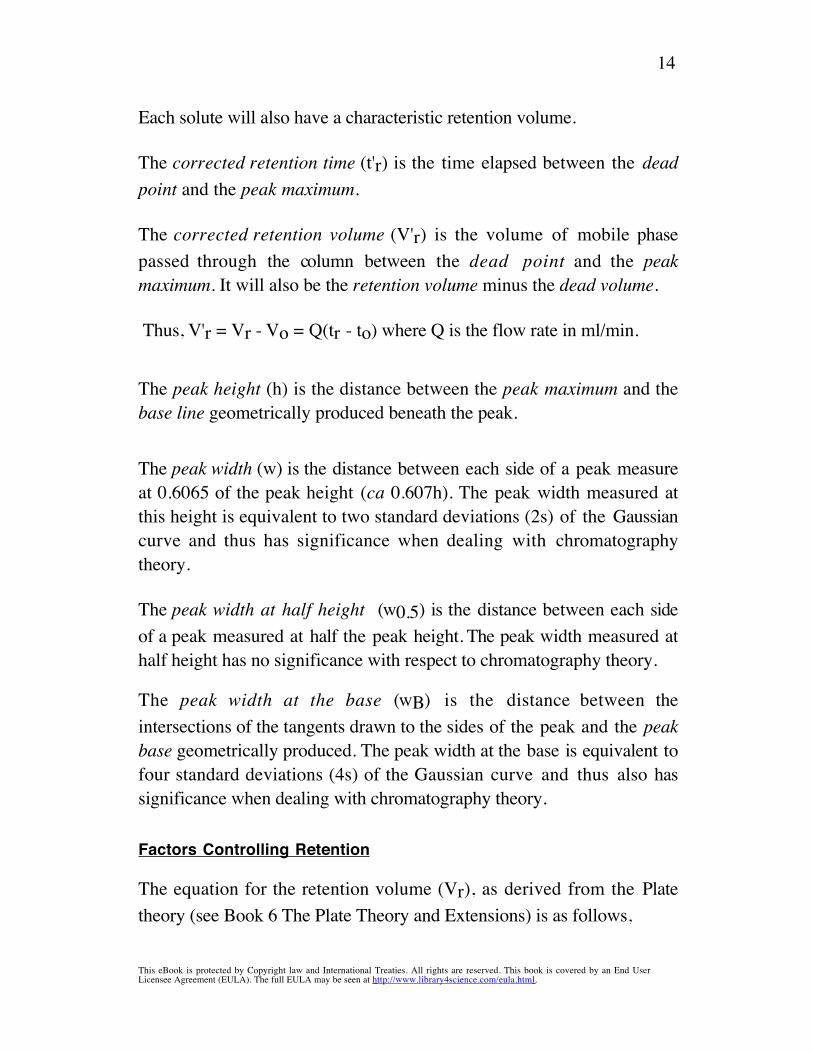
14
Each solute will also have a characteristic retention volume.
The corrected retention time (t'r) is the time elapsed between the deadpoint and the peak maximum.
The corrected retention volume (V'r) is the volume of mobile phasepassed through the column between the dead point and the peakmaximum. It will also be the retention volume minus the dead volume.
Thus, V'r = Vr - Vo = Q(tr - to) where Q is the flow rate in ml/min.
The peak height (h) is the distance between the peak maximum and thebase line geometrically produced beneath the peak.
The peak width (w) is the distance between each side of a peak measureat 0.6065 of the peak height (ca 0.607h). The peak width measured atthis height is equivalent to two standard deviations (2s) of the Gaussiancurve and thus has significance when dealing with chromatographytheory.
The peak width at half height (w0.5) is the distance between each sideof a peak measured at half the peak height. The peak width measured athalf height has no significance with respect to chromatography theory.
The peak width at the base (wB) is the distance between theintersections of the tangents drawn to the sides of the peak and the peakbase geometrically produced. The peak width at the base is equivalent tofour standard deviations (4s) of the Gaussian curve and thus also hassignificance when dealing with chromatography theory.
Factors Controlling Retention
The equation for the retention volume (Vr), as derived from the Platetheory (see Book 6 The Plate Theory and Extensions) is as follows,

This eBook is protected by Copyright law and International Treaties. All rights are reserved. This book is covered by an End UserLicensee Agreement (EULA). The full EULA may be seen at http://www.library4science.com/eula.html .
15
Vr = Vm + KVS
or V'r = KVS (1)
where (Vm) is the volume of mobile phase in the column(VS) is the volume of stationary phase in the column,(K) is the distribution coefficient of the solute between the
phases,and (V'r) is the corrected retention volume i.e., (Vr - Vm)
From equation (1) it is seen that the corrected retention volume iscontrolled by two parameters: firstly the distribution coefficient of thesolute between the two phases and secondly, the amount of stationaryphase that is available to the solute.Consequently, the magnitude of (V'r) is determined by (K) or (Vs) orboth.From equation (1) the conditions necessary to separate two solutes (A)and (B) can be deduced.
To separate solutes (A) and (B), V'r(A)<>V'r(B), which can be achieved by making either K(A)< >K(B) or VS(A) < > VS(B) or an appropriate combination of both.Thus, to separate a mixture, either the values of (K) for all components,or the amount of stationary phase (VS), available to each component,must be made to differ or, again, appropriate adjustments must be madeto both.
Prior to discussing the parameters that determine the magnitude of (K)and (Vs) and how they can be changed, it is useful to develop thethermodynamic approach to the problem of solute retention inchromatographic separations.
The Thermodynamic Explanation of Retention
Classical thermodynamics provides an expression that describes thechange in free energy of a solute when transferring from one phase tothe other as a function of the equilibrium constant (distributioncoefficient). The expression is as follows,

This eBook is protected by Copyright law and International Treaties. All rights are reserved. This book is covered by an End UserLicensee Agreement (EULA). The full EULA may be seen at http://www.library4science.com/eula.html .
16
RT ln K = -DGo
where (R) is the gas constant, (T) is the absolute temperature, and (DGo) is the Standard Free Energy Change.
In addition, classical thermodynamics provides an expression for(DGo), i.e., DGo = DHo - TDSo
where (DHo) is the Standard Enthalpy Change, and (DSo) is the Standard Entropy Change.
Thus, lnK = -
DHo
RT -DSo
RÊ
Ë Á ˆ
¯ ˜ (2)
or,
K = e- DHo
RT - DSoR
È
Î
Í Í Í
˘
˚
˙ ˙ ˙ (3)
It is seen that if the standard entropy change and standard enthalpychange for the distribution could be calculated then the distributioncoefficient (K) and, consequently, the retention volume could also bepredicted. Unfortunately, these properties are difficult, if not impossible,to isolate and estimate and so the magnitude of the overall distributioncoefficient can not be estimated in this way. Nevertheless, once the phasesystem has been identified, with sufficient experimental data beingavailable, empirical equations can be developed to optimize a givendistribution system for a specific separation. Computer programs, basedon this rationale, are available for LC to carry out such optimizationprocedures for solvent mixtures having three or more components.Nevertheless, the appropriate stationary phase is still usually identifiedfrom the types of interactions that need to be exploited to effect therequired separation. By measuring the retention volume of a solute overa range of temperatures equation (2) can also be used to identify the typeof retention mechanism that is operative in a particular separation .
Rearranging equation (2)

This eBook is protected by Copyright law and International Treaties. All rights are reserved. This book is covered by an End UserLicensee Agreement (EULA). The full EULA may be seen at http://www.library4science.com/eula.html .
17
log K = -D HoR T
+D So
R
Noting, V' = KVs
log V' = -D HoR T
+D So
R- log Vs
Thus, a curve relating log(V') to 1/T will give a straight line the slope ofwhich will be proportional to the standard enthalpy and the interceptwill be related to the standard entropy and, two, the dominant effectsthat control the distribution system can be identified from such curves.Such curves are called Vant Hoff curves and an example of two VantHoff for two different types of distribution systems are shown in figure5.
1/T
Log
(V')
DHoRT
È Î Í
˘ ˚ ˙
DSoR
Vs
DS oR
Vs
Energy Driven Distribution
Entropically Driven Distribution
DHoRT
È Î Í
˘ ˚ ˙
System ASystem B
A
AB
B
Figure 5 The Vant Hoff Curves for Two Different DistributionSystems.

This eBook is protected by Copyright law and International Treaties. All rights are reserved. This book is covered by an End UserLicensee Agreement (EULA). The full EULA may be seen at http://www.library4science.com/eula.html .
18
It is seen that distribution system (A) has a large enthalpy valueD HoR T
È
Î Í
˘
˚ ˙ A
and a low entropy contribution -D So
R- Vs
È
Î Í
˘
˚ ˙
A. The large
value of D HoR T
È
Î Í
˘
˚ ˙ A
means that the distribution is predominantly
controlled by molecular forces. The solute is preferentially distributedin the stationary phase as a result of solute interactions with thestationary phase being much greater than those with the mobile phase.As the change in enthalpy is the major contribution to the change in freeenergy,
the distribution, in thermodynamic terms, is said to be "energydriven".
In contrast, for distribution system (B) there is only a small enthalpy
change D HoR T
È
Î Í
˘
˚ ˙ B
, but a high entropy contribution -D So
R- Vs
È
Î Í
˘
˚ ˙
B.
Thus, the distribution is not predominantly controlled by molecularforces. The entropy is a measure of the degree of randomness that asolute molecule experiences in a particular phase. The more random and'more free' the solute molecule is in a particular phase, the greater itsentropy. A large negative entropy change means that the solutemolecules are more restricted or less random in the stationary phase (B).and this loss of freedom is responsible for the greater solute retention.The change in entropy in system (B) is the major contribution to thechange in free energy, so ,
the distribution, in thermodynamic terms, is said to be "entropicallydriven".
Chiral separations and separations made by size exclusion are examplesof entropically driven systems. Chromatographic separations are notexclusively "energetically driven" or "entropically driven". In most casesretention has both "energetic" and "entropic" components which, bycareful adjustment, can be made to achieve very difficult and subtleseparations.

This eBook is protected by Copyright law and International Treaties. All rights are reserved. This book is covered by an End UserLicensee Agreement (EULA). The full EULA may be seen at http://www.library4science.com/eula.html .
19
Thermodynamics show that there are two processes controllingdistribution but does not indicate how the distribution can be managedor controlled. To do this, it is necessary to identify how the magnitude of(K) and (Vs) are controlled. In general, (K) is usually determined by thenature and strength of the intermolecular forces between the solute andthe two phases. The availability of the stationary phase (the magnitude of(Vs)) is largely determined by the geometry of the stationary phase.
Factors Affecting the Magnitude of the Distribution Coefficient (K)
The magnitude of (K) is determined by the relative affinity of the solutefor the two phases. Those solutes interacting more strongly with thestationary phase will exhibit a larger distribution coefficient and will beretained longer in the chromatographic system. Molecular interactionresults from intermolecular forces of which there are three basic types.
Molecular Forces
All intermolecular forces are electrical in nature. The three different typesare termed dispersion forces, polar forces and ionic forces. Allinteractions between molecules are composites of these three forces.
Dispersion Forces
Dispersion forces were first described by London (3), and for this reasonwere originally called 'London's dispersion forces'. London's name hasnow been dropped and they are now simply referred to as 'dispersion'forces. They arise from charge fluctuations throughout a moleculeresulting from electron/nuclei vibrations.
Glasstone (4) suggested that dispersion forces could be best described asfollows,
"although the physical significance probably cannot be clearlydefined, it may be imagined that an instantaneous picture of a moleculewould show various arrangements of nuclei and electrons having dipolemoments. These rapidly varying dipoles when averaged over a largenumber of configurations would give a resultant of zero. However, at

This eBook is protected by Copyright law and International Treaties. All rights are reserved. This book is covered by an End UserLicensee Agreement (EULA). The full EULA may be seen at http://www.library4science.com/eula.html .
20
any instant they would offer electrical interactions with anothermolecule resulting in interactive forces".
Dispersion forces are typically those that occur between hydrocarbonsand because of them, hexane is a liquid boiling at 68.7oC and not a gas.In the biotechnology field, dispersive interactions are often referred to as'hydrophobic' or 'lyophobic' interactions, probably because dispersivesubstance (e.g., aliphatic hydrocarbons) do not dissolve readily in water.For academic interest only, to a first approximation the interactionenergy, (UD), involved with dispersive forces has been
calculated to be (5), UD =3hnoa2
4r6
where (a) is the polarizability of the molecule, (no) is a characteristic frequency of the molecule, (h) is Plank's constant, and (r) is the distance between the molecules.The dominant factor that controls the magnitude of the dispersive forceis the polarizability (a) of the molecule, which, for substances that haveno dipoles, is given by
D - 1D +2
=43
p na
where (D) is the dielectric constant of the material, (n) is the number of molecules per unit volume.
If (r) is the density of the medium and (M) is the molecular weight, thenthe number of molecules per unit volume is Nr
M where (N) is
Avogadro's number, Thus, 4
3p Na =
(D -1)(D + 2)
Mr
= P
where (P) is called the Molar Polarizability.
It is seen that the Molar Polarizability is proportional to Mr
, the molar
volume; consequently dispersive forces (and thus "hydrophobic" or

This eBook is protected by Copyright law and International Treaties. All rights are reserved. This book is covered by an End UserLicensee Agreement (EULA). The full EULA may be seen at http://www.library4science.com/eula.html .
21
"lyophobic forces") will be related to the 'molar volume' of theinteracting substances. A diagrammatic representation of dispersiveinteractions is shown in figure 4.
+ - + - + - + - + - + - + -+ - + - + - + - + - + - + - + - - + - + - + - + - + - + - + - + + - + - + - + - + - + - + - + - + - + - + - + - + - + - + -
+ - + - + - + - + - + - + -+ - + - + - + - + - + - + - + - - + - + - + - + - + - + - + - + + - + - + - + - + - + - + - + - + - + - + - + - + - + - + - + - + - + - + - + - + - + -+ - + - + - + - + - + - + - + - - + - + - + - + - + - + - + - + + - + - + - + - + - + - + - + - + - + - + - + - + - + - + -
Charge Fluctuations - the Source of Dispersive Forces and Dispersive Interactions
Two Molecules Interacting and Held Together as a Result of Dispersive Forces
Figure 6 Dispersive Interactions
Dispersive interactions are not the result of a localized charge on anypart of the molecule, but from a host of fluctuating, closely associatedcharges that, at any instant, can interact with instantaneous charges of anopposite kind situated on a neighboring molecule.
Polar Forces
Polar interactions arise from electrical forces between localized chargesresulting from permanent or induced dipoles. They cannot occur inisolation, but must be accompanied by dispersive interactions and undersome circumstances may also be combined with ionic interactions. Polarinteractions can be very strong and result in molecular associations thatapproach, in energy, that of a weak chemical bond. Examples of suchinstances are 'hydrogen bonding' and in particular the association ofwater with itself.
Dipole-Dipole Interactions
The interaction energy (UP) between two dipolar molecules is given, to afirst approximation, by
U P =
2am2
r6
where (a) is the polarizability of the molecule, (m) is the dipole moment of the molecule, and (r) is the distance between the molecules.

This eBook is protected by Copyright law and International Treaties. All rights are reserved. This book is covered by an End UserLicensee Agreement (EULA). The full EULA may be seen at http://www.library4science.com/eula.html .
22
The energy is seen to depend on the square of the dipole moment, themagnitude of which can vary widely. Unfortunately, values of the dipolemoment, taken from bulk measurements over a range of temperatures,does not always give a correct indication of the strength of any polarinteractions that it might have with other molecules. For example, water,an extremely polar molecule, has a dipole moment of only 1.76 debyes.Similarly, the dipole moment of methanol, another extremely polarsubstance, is only 2.9 debyes. Unusually low values of dipole momentsfor strongly polar substances is often due to internal electric fieldcompensation when more than one dipole is present in themolecule.(e.g., water associates strongly with itself by very strong polarforces or 'hydrogen bonding' . Methanol also associates strongly withitself in a similar manner. Examples of possible associates of water andmethanol are shown in figure 5.
OH
H
OH
H
OH
OH
CH3
CH3
Figure 7 Possible Self Associates of Water and Methanol
Thus, with such associates (should they exist) the electric field from eachdipole would oppose that from the other, resulting in a reduction in thenet field as measured externally. It follows, bulk properties may notreflect the true value for the dipole moment of the individual dipoles. Amolecule, however, approaching a water or methanol molecule wouldexperience the uncompensated field of the single dipole and interactaccordingly.
The polarizability of a substance containing no dipoles will give anindication of the strength of any the dispersive interactions that mighttake place with another molecule. In contrast, due to internalcompensation, the dipole moment of a substance, determined from bulk

This eBook is protected by Copyright law and International Treaties. All rights are reserved. This book is covered by an End UserLicensee Agreement (EULA). The full EULA may be seen at http://www.library4science.com/eula.html .
23
dielectric constant measurements, will not always give an indication ofthe strength of any polar interaction that might take place. Adiagrammatic impression of a dipole-dipole interaction is shown in figure8.
It is seen that the dipoles interact directly, but it is important to realizethat with the dipole-dipole interaction is the dispersive interactions fromthe charge fluctuations on both molecules. The net interactive force will,therefore, be a combination of both. Dispersive interactions are the onlyinteractions that can occur in the absence of any other. All other types ofinteraction, polar and/or ionic, will occur in conjunction with dispersiveinteractions. Examples of some substances that have permanent dipolesand exhibit polar interaction with other molecules are alcohols, esters,ethers, amines, amides, nitriles, etc.
+ - + - + - + - + - + - + -+ - + - + - + - + - + - + - + - - + - + - + - + - + - + - + - + + - + - + - + - + - + - + - + - + - + - + - + - + - + - + -
+ - + - + - + - + - + - + -+ - + - + - + - + - + - + - + - - + - + - + - + - + - + - + - + + - + - + - + - + - + - + - + - + - + - + - + - + - + - + -
+ - + - + - + - + - + - + -+ - + - + - + - + - + - + - + - - + - + - + - + - + - + - + - + + - + - + - + - + - + - + - + - + - + - + - + - + - + - + -
+ - + - + - + - + - + - + -+ - + - + - + - + - + - + - + - - + - + - + - + - + - + - + - + + - + - + - + - + - + - + - + - + - + - + - + - + - + - + - + - + - + - + - + - + - + -
+ - + - + - + - + - + - + - + - - + - + - + - + - + - + - + - + + - + - + - + - + - + - + - + - + - + - + - + - + - + - + -
+ - + - + - + - + - + - + -+ - + - + - + - + - + - + - + - - + - + - + - + - + - + - + - + + - + - + - + - + - + - + - + - + - + - + - + - + - + - + -
+ - + - + - + - + - + - + -+ - + - + - + - + - + - + - + - - + - + - + - + - + - + - + - + + - + - + - + - + - + - + - + - + - + - + - + - + - + - + -
+ - + - + - + - + - + - + -+ - + - + - + - + - + - + - + - - + - + - + - + - + - + - + - + + - + - + - + - + - + - + - + - + - + - + - + - + - + - + -
+ - + - + - + - + - + - + -+ - + - + - + - + - + - + - + - - + - + - + - + - + - + - + - + + - + - + - + - + - + - + - + - + - + - + - + - + - + - + -
+ - + - + - + - + - + - + -+ - + - + - + - + - + - + - + - - + - + - + - + - + - + - + - + + - + - + - + - + - + - + - + - + - + - + - + - + - + - + -
Molecule Exhibitng Both Charge Fluctuations and a Permanant Dipole
Molecules Interacting Both by Dispersive Forces from Charge Fluctuations and Polar Forces from Dipole-Dipole Interactions
Figure 8 Polar Interactions: Dipole-Dipole Interactions
Dipole-Induced-Dipole Interactions
Certain compounds, such as those containing the aromatic nucleus andthus (p) electrons, are polarizable. When such molecules come into closeproximity with a molecule having a permanent dipole, the electric fieldfrom the dipole induces a counter dipole in the polarizable molecule.This induced dipole acts in the same manner as a permanent dipole and

This eBook is protected by Copyright law and International Treaties. All rights are reserved. This book is covered by an End UserLicensee Agreement (EULA). The full EULA may be seen at http://www.library4science.com/eula.html .
24
the polar forces between the two dipoles result in interaction between themolecules. Aromatic hydrocarbons are typically polarizable, adiagrammatic impression of a dipole-induced dipole interaction is shownin figure 9.
Induced dipole interactions are always accompanied by dispersiveinteractions just as dipole interactions take place coincidentally withdispersive interactions. Thus, compounds such as aromatic hydrocarbonscan be retained and separated purely on the basis of dispersiveinteractions, for example in GC using an hydrocarbon stationary phase. Inaddition, they can be retained and separated by combined induced-polarand dispersive interactions in LC using silica gel as a stationary phaseand a dispersive mobile phase such as n-heptane. Molecules need notexhibit one type of interaction only.
+ - + - + - + - + - + - + -+ - + - + - + - + - + - + - + - - + - + - + - + - + - + - + - + + - + - + - + - + - + - + - + - + - + - + - + - + - + - + -
+ - + - + - + - + - + - + -+ - + - + - + - + - + - + - + - - + - + - + - + - + - + - + - + + - + - + - + - + - + - + - + - + - + - + - + - + - + - + -
+ - + - + - + - + - + - + -+ - + - + - + - + - + - + - + - - + - + - + - + - + - + - + - + + - + - + - + - + - + - + - + - + - + - + - + - + - + - + -
Molecules Interacting Both by Dispersive Forces from Charge Fluctuations and Polar Forces from Induced Dipole-Dipole Interactions
Molecule withinducd dipoles
Molecule withpermanent dipoles
Figure 9 Polar Interactions: Dipole-Induced Dipole Interactions
Phenyl ethanol, for example, will possess both a dipole as a result of thehydroxyl group and be polarizable due to the aromatic ring. Morecomplex molecules can have many different interactive groups.
Ionic Forces
Polar compounds possessing dipoles, have no net charge. In contrast, ionspossess a net charge and consequently can interact strongly with ions

This eBook is protected by Copyright law and International Treaties. All rights are reserved. This book is covered by an End UserLicensee Agreement (EULA). The full EULA may be seen at http://www.library4science.com/eula.html .
25
having an opposite charge. Ionic interactions are exploited in ionexchange chromatography where the counter ions to the ions beingseparated are situated in the stationary phase.
In a similar manner to polar interactions, ionic interactions are alwaysaccompanied by dispersive interactions and usually, also with polarinteractions. Nevertheless, in ion exchange chromatography, thedominant forces controlling retention usually result from ionicinteractions. Ionic interaction is depicted diagramatically in figure 10.
+ - + - + - + - + - + - + -+ - + - + - + - + - + - + - + - - + - + - + - + - + - + - + - + + - + - + - + - + - + - + - + - + - + - + - + - + - + - + -
Molecules Interacting Both by Dispersive Forces from Charge Fluctuations and Ionic Forces from Interactions Between Net Charges
Molecule Exhibiting Both Charge Fluctuations and a Net positive Ionic Charge
+ - + - + - + - + - + - + -+ - + - + - + - + - + - + - + - - + - + - + - + - + - + - + - + + - + - + - + - + - + - + - + - + - + - + - + - + - + - + - + - + - + - + - + - + - + -
+ - + - + - + - + - + - + - + - - + - + - + - + - + - + - + - + + - + - + - + - + - + - + - + - + - + - + - + - + - + - + -
Figure 10 Ionic and Dispersive Interactions
A molecule can have many interactive sites comprised of the three basictypes, dispersive, polar and ionic. Large molecules (for examplebiopolymers) may have hundreds of different interactive sites throughoutthe molecule and the interactive character of the molecule as a whole willbe determined by the net effect of all the sites. If the dispersive sitesdominate, the overall property of the molecule will be dispersive whichthe biotechnologists call "hydrophobic" or "lyophobic". If dipoles andpolarizable groups dominate in the molecule, then the overall property ofthe molecule will be polar, which the biotechnologist call "hydrophilic"or lyophilic". These terms are not based on physical chemical argumentbut have evolved largely in the discipline of biology.

This eBook is protected by Copyright law and International Treaties. All rights are reserved. This book is covered by an End UserLicensee Agreement (EULA). The full EULA may be seen at http://www.library4science.com/eula.html .
26
Hydrophobic and Hydrophilic Interactions
The term "hydrophobic interaction" implies some form of molecularrepulsion, which, of course, outside the Van der Waals radii of amolecule, is impossible. The term "hydrophobic force", literally meaning"fear of water" force, is an alternative to the well-established term,dispersive force. The term may have been provoked by the immiscibilityof a dispersive solvent such as n-heptane with a very polar solvent suchas water.
n-heptane and water are immiscible, not because water molecules repelheptane molecules, they are immiscible because the forces between twoheptane molecules and the forces between two water molecules aremuch greater than the forces between a heptane molecule and a watermolecule. Thus, water molecules and heptane molecules interact verymuch more strongly with themselves than with each other.
Water has, in fact, a small but finite solubility in n-heptane, and n-heptanehas a small but finite solubility in water. Although water-waterinteractions and hydrocarbon-hydrocarbon interactions are muchstronger than water-hydrocarbon interactions, the latter does exist and issufficiently strong to allow mutual solubility.
The term "hydrophilic force", literally meaning "love of water" force,appears to merely be the complement to "hydrophobic". It is equivalentto the term polar, and polar solvents are hydrophilic solvents becausethey interact strongly with water or other polar solvents.
The reasons for the introduction of the terms "lyophobic" (meaning fearof lye) and "lyophilic" (meaning love of lye) are a little more obscure.The terms originated in the early days of the soap industry when soapwas prepared by boiling a vegetable oil with an alkaline solution obtainedfrom leaching 'wood ash' with water. The alkaline product from thewood ash was a crude solution of sodium and potassium carbonatescalled "lye". On boiling the vegetable oil with the lye, the soap (sodiumand potassium salts of long-chained fatty acids) separated from the lye

This eBook is protected by Copyright law and International Treaties. All rights are reserved. This book is covered by an End UserLicensee Agreement (EULA). The full EULA may be seen at http://www.library4science.com/eula.html .
27
due to the dispersive interactions between the fatty acid alkane chainsand were thus called "lyophobic". It follows that "lyophobic", from aphysical chemical point of view, would be the same as "hydrophobic",and interactions between hydrophobic and lyophobic materials aredominantly dispersive. The other product of the soap-making industrywas glycerol, which remained in the lye and was consequently termed"lyophilic". Thus, glycerol mixes with water because of its manyhydroxyl groups and is very polar and hence is a "hydrophilic" or"lyophilic" substance.
Hydrophobic and hydrophilic terms are extensively employed inbiotechnology to describe the interactive character of the molecule as awhole. The use of a more general term to describe the interactiveproperty of a biomolecule can be understood if one considers thecharacter of a biopolymer, for example a polypeptide. The peptide willcontain a large number of different types of amino acids, each havingdifferent interactive groups. All will exhibit polar interactions with thecarbonyl and amide groups but each amino acid will contribute its ownunique interactive character to the peptide. Thus, the terms hydrophilicand hydrophobic are more often used to describe the overall interactivecharacter of a large molecule as opposed to the individual groupinteractions. Nevertheless they are basically alternative terms that havebeen adopted to describe polar and dispersive interactions respectively.
Molecular Forces and Chromatographic Selectivity
To chose a suitable stationary phase for a particular separation it isnecessary to select a substance with which the solutes will interactrelatively strongly. If the solutes to be separated are predominantlydispersive, then a hydrocarbon-like stationary phase would beappropriate, which, in GC, might be a high molecular weighthydrocarbon such as squalane. The operating temperature would bechosen so that the kinetic energy of the dissolved solutes molecules wassufficiently high to provide adequate partial vapor pressure for each andthus permit elution in a reasonable time.

This eBook is protected by Copyright law and International Treaties. All rights are reserved. This book is covered by an End UserLicensee Agreement (EULA). The full EULA may be seen at http://www.library4science.com/eula.html .
28
Interactions in the mobile phase are extremely weak in GC, (5) and arenot employed to influence selectivity. In LC, an appropriate dispersivestationary phase might be a bonded phase with a long aliphatic chain. Toensure that the selectivity resided predominantly in the stationary phase,a complementary polar and weakly dispersive mobile phase would beused. In LC, it is usual to allow one type of interaction to dominate in thestationary phase while a different type of interaction remains controllingin the mobile phase.
Separations Based on Dispersive Interactions
Separations based solely on dispersive interactions in GC must employ anonpolar stationary phase such as a hydrocarbon or an alkyl siliconepolymer. The separation of unleaded gasoline separated on a 50-m fusedsilica capillary column coated with 0.5 mm film of a methysiliconepolymer is shown in figure 11.
nC7nC5nC8 nC9
benzene
toluene
ethylbenzene
m and p xylene o xylene
Courtesy of Supelco Inc.
Figure 11 A Chromatogram of the Hydrocarbons Contained inUnleaded Gasoline Using a Dispersive (Nonpolar) Stationary Phase
Helium was employed as the carrier gas at a flowrate of 20 ml/min. Thetemperature of the column was programmed from 35oC to 200oC at2oC per min. The solute retention increases with the molecular weightirrespective as to their being simple alkanes or aromatics with polarizablenuclei. This is because, interactions with the aromatics are purely

This eBook is protected by Copyright law and International Treaties. All rights are reserved. This book is covered by an End UserLicensee Agreement (EULA). The full EULA may be seen at http://www.library4science.com/eula.html .
29
dispersive and related to their molar volume. As a consequence, they fallin the expected molecular weight sequence for the paraffins. An exampleof the use of dispersive interactions in LC is afforded by the separation ofsome benzodiazepines on a reverse-phase column shown in figure 12.The column, 15 cm long, 4.6 mm I.D., contained a bonded reversedphase (dispersive phase) having aliphatic chains 8 carbon atoms long.The mobile phase was a mixture of acetonitrile and an aqueous solutionof potassium dihydrogen phosphate and triethylamine to act as a buffer(pH 3.15). The retentive interactions with the stationary phase are solelydispersive. In contrast, the interactive character of the mobile phase waslargely polar but accompanied by some dispersive interactions with theacetonitrile.
Demoxepam
Nitrazepam N-DesmethylchlordiazepoxideOxazepam
Chlordiazepoxide
N-DesmethyldiazepamTemazepam
Diazepam
0 8 124Time (minutes)
Courtesy of Supelco Inc.
Figure 12 The Separation of Eight Benzodiazepines
It is seen that an excellent separation is obtained. To reduce the retentionof the solutes the concentration of acetonitrile would need to beincreased. This would increase the competitive dispersive interactions inthe mobile phase and thus elute the solutes more rapidly. However, the

This eBook is protected by Copyright law and International Treaties. All rights are reserved. This book is covered by an End UserLicensee Agreement (EULA). The full EULA may be seen at http://www.library4science.com/eula.html .
30
column efficiency would remain the same and thus some resolutionwould be lost.
Separations Based on Polar Interactions
Two separations by GC of some airborne contaminants shown in figure13 illustrate the different selectivity that can be obtained by usingdispersive or polar stationary phases. GC separations demonstrate theeffects of phase selectivity very elegantly as there are no significantinteractions with the mobile phase and, therefore, retention differencescan be exclusively attributed to the nature of the stationary phase.
Stationary Phase, Stationary Phase Polyethylene Glycol Carbopack (dispersive)
0 04 48 812 12Time (minutes)
n-heptane
1-heptene
methanol
benzene
tolueneimpurity
higheraromatics
methanol
tetrachloroethylene
1,2,-dichloro propane
chloroform
carbontetrachloride
trichloro-ethylene
bromoform
1, 1, 1 - trichloroethane1, 2, - dichloroethane
Courtesy of Supelco Inc.
Figure 13 The Separation of Some Airborne Contaminants by GC
The solutes that disclose the nature of the interactions that are takingplace with the two stationary phase are methanol and benzene. On thepolyethylene glycol stationary phase, methanol (B. Pt. 64.7oC, polar) andbenzene (B. Pt. 80.1oC, polarizable) are eluted well after n-heptane (B.Pt. 98.4oC, dispersive) and 1-heptene (B. Pt. 93.6oC, dispersive andslightly polarizable). The strong polar interactions between the OH

This eBook is protected by Copyright law and International Treaties. All rights are reserved. This book is covered by an End UserLicensee Agreement (EULA). The full EULA may be seen at http://www.library4science.com/eula.html .
31
groups of the polyethylene glycol and both the OH groups of themethanol and the polarized nucleus of the benzene are far greater thanthe dispersive interactions with heptane and heptene. This differenceoccurs despite the greater molecular weights and higher boiling points ofheptane and heptene. On the stationary phase Carbopack, methanol,weakly dispersive, is eluted almost at the dead volume while the moredispersive solutes are extensively retained.
An example of the use of induced dipoles to separate polarizablesubstances is afforded by the analysis of some aromatic andnitroaromatic hydrocarbons by LC using silica gel as the stationaryphase.
1
2
3
4
6
78
9
5
0 45
1/ naphthalene2/ pyrene 3/ 1-nitronaphthalene 4/ 4-nitroanthracene 5/ 9-nitroanthracene 6/ 3-nitrobiphenyl7/ 2 -nitronaphthalene 8/ 4-nitro-p-terphenyl 9/ 1-nitropyrene
Minutes
Courtesy of Supelco Inc.Figure 14 The Separation Aromatic and Nitro-AromaticHydrocarbons
A small-bore column 25 cm long and 1 mm I.D. was employed, packedwith silica gel having a particle diameter of 10 m. The mobile phase wasn-hexane at a flow-rate 50 ml per min. The solutes of interest are

This eBook is protected by Copyright law and International Treaties. All rights are reserved. This book is covered by an End UserLicensee Agreement (EULA). The full EULA may be seen at http://www.library4science.com/eula.html .
32
naphthalene and pyrene, the first two peaks. The two solutes are wellseparated and, as they have no permanent dipole, and as dispersiveinteractions with the silica gel are weak, they are selectively retainedalmost exclusively by induced dipole interactions. These interactionsoccur between the strong dipoles of the silanol groups on the silica gelsurface and the induced dipoles on the aromatic nucleus resulting fromtheir proximity to the silanol groups. To ensure that polar interactionsdominate in the stationary phase the mobile phase consists of thedispersive solvent n-hexane. An interesting example of polar selectivityby hydroxyl groups on the surface of native silica is shown by theanalysis of Darvocet® and its generic equivalent in figure 15.
Impurity Impurity
Propoxyphene
Acetaminophen Acetaminophen
Impurity
PropoxypheneImpurity
Impurity in Generic Formulation Only
42 2Minutes Minutes
0 0
Darvocet® Generic Formulation
4
Courtesy of Supelco Inc.
Figure 15 The Analysis of Acetaminophen Formulations
Darvocet® is an acetaminophen product in which it is the activeingredient. Other substances are present which also contain polar groupsand thus, the sample lends itself to separation on the polar stationaryphase, silica gel. The analysis was completed in less than 4 minutes usinga short column 3.3 cm long and 4.6 mm in diameter packed with silica(particle size of 3 m). The column appears to be significantly overloaded,but the impurities are well still separated from the main component and asubstance in the generic formulation that was not present in the

This eBook is protected by Copyright law and International Treaties. All rights are reserved. This book is covered by an End UserLicensee Agreement (EULA). The full EULA may be seen at http://www.library4science.com/eula.html .
33
Darvocet® clearly indicated. The mobile phase was 98.5%dichloromethane with 1.5% v/v of methanol containing 3.3% ammoniumhydroxide. Although, the ammoniacal methanol helped to decreaseextreme polar activity from specially active adsorption sites on the silicasurface, the overall interaction of the solutes with the stationary phasewas predominately polar. In contrast solute interactions with themethylene dichloride in the mobile phase would be almost exclusivelydispersive.
Separations Based on Ionic Interactions
Ionic materials are not volatile under the conditions normally employedin GC, so, ionic interactions cannot be exploited in GC stationary phasesto control retention. However, they are very important in LC, and ionexchange chromatography (the name given to LC separations thatemploy ionic interactions to control retention) is widely used to analyzeion mixtures. The use of ionic interactions to separate some alkali andalkaline earth cations is shown in figure 16.
1
5
2
0
5
3
6
4
10Time (minutes)
1/ Lithium2/Sodium3/ Ammonium4/ Potassium5/ Magnesium6/ Calcium.
Courtesy of Whatman Inc.
Figure 16 The Separation of Cations by Ion-ExchangeChromatography

This eBook is protected by Copyright law and International Treaties. All rights are reserved. This book is covered by an End UserLicensee Agreement (EULA). The full EULA may be seen at http://www.library4science.com/eula.html .
34
The column used was IonPacCS12 (a proprietary cation exchangecolumn) and the mobile phase was a 20nM solution of methanesulfonicacid in water. The flow rate was 1 ml/min. and 25ml of sample wasinjected. The separation almost exclusively involved ionic interactions asany dispersive interactions between a metal ion and the stationary phasewould be very small indeed.
The Control of Chromatographically Available Stationary Phase (Vs)
The volume of stationary phase that is made available to the solutes canbe controlled in a number of ways. Firstly, the stationary phase loadingon the column can be varied to adjust the retention as required. Aspecific stationary phase loading may be selected, to either improve theresolution, or to reduce the analysis time, or in some instances, toincrease the sample load. Sometimes, the stationary phase loading isreduced so the column is more amenable to specific compounds (e.g. toprevent proteins from being denatured).
Secondly, the stationary phase can contain molecules of a special shapethat can only make c lose contact with molecules having acomplementary shape. Other molecules can not interact so closely withthe stationary phase and consequently, the stationary phase available tothem will be restricted. This approach is exploited in chiralchromatography where the stationary phase is made to consist largely ofa specific enantiomer that confers chiral selectivity to the distributionsystem
Thirdly, the stationary phase can be attached to the surface of a poroussupport, and the pore size chosen to be commensurate with the size ofthe solute molecules to be separated. Under such circumstances themolecules that are smaller than the pores will enter the matrix of thematerial and have more stationary phase available to them. Conversely,the larger molecules will be excluded from the pores and, consequently,come in contact with much less of the stationary phase. Size selectivity,achieved by the use of porous solids, is utilized in size exclusionchromatography (SEC) where solutes are separated almost exclusively

This eBook is protected by Copyright law and International Treaties. All rights are reserved. This book is covered by an End UserLicensee Agreement (EULA). The full EULA may be seen at http://www.library4science.com/eula.html .
35
on the basis of molecular size. The separation of chiral compounds can besuccessfully utilized in both GC and LC; size exclusion chromatography,however, is not greatly used in GC and is almost exclusively confined toLC.
The Effect of Stationary Phase Loading on the Performance of aChromatographic System
The stationary phase content of a column can affect a separation in twoways. The more stationary phase there is in a column, the more thesolutes will be retained, the further they will be apart and the greater theseparation. Any change in stationary phase, however, will change theretention of all solutes proportionally and thus the separation will onlyincrease, if the peak widths remain unchanged. Increasing the amount ofstationary phase will usually increase the thickness of the stationaryphase film, which, as is shown in Book 7 will increase peak dispersion. Itfollows that there will be a specific stationary phase loading that providesthe best compromise between separation and band dispersion (6) andthus provides the maximum resolution. The loading can be quite criticalfor open tubular columns in GC. Thus, the stationary phase loadingcannot be increased indefinitely to separate the peaks as, eventually, thepeaks will start spreading to a greater extent than they are beingseparated.
Increasing the stationary phase load on a GC column (packed or opentube) will allow the sample placed on the column to be increased. A largesample is often necessary in trace analysis to provide sufficient materialfor detection. Under such circumstances the column may be overloadedgiving a very broad asymmetric peak which may obscure the tracematerials of interest. This asymmetric dispersion is due to solute-soluteinteraction in the mobile and stationary phases causing a nonlinearadsorption isotherm. The subject of adsorption isotherms will not bediscussed here and it is sufficient to say that the asymmetric dispersioncan be reduced by increasing the stationary phase in the column.. Alarger amount of stationary phase, will, even with a larger charge, reducethe sample concentration in the stationary phase and thus the deleterioushigh sample concentrations are never reached.

This eBook is protected by Copyright law and International Treaties. All rights are reserved. This book is covered by an End UserLicensee Agreement (EULA). The full EULA may be seen at http://www.library4science.com/eula.html .
36
The stationary phase loading of a an LC column is not modified thesame way as a GC column. This is because, irrespective of the type ofsupport material, the amount of stationary phase in an LC column isprimarily determined by its surface area. In addition, the amount ofavailable stationary phase on a bonded phase can be modified byadjusting the molecular size (chain length) of the bonded material.
The chain length of the bonded material can be critical when separatingproteins as dispersive interactions between the alkane chains and thedispersive (hydrophobic) groups of the protein can be strong enough tocause structural deconformation; (i.e., the protein becomes denatured).Reducing the chain length of the bonded material, the dispersive forcescan be reduced significantly and the deconformation diminished. Inpractice, carbon chains only two or four carbon atoms long are amongthose most commonly used for separating labile proteins.
Stationary Phase Limitation by Chiral Selectivity
The extent to which an enantiomer can interact with the stationary phasedepends on how close it can approach the molecules of the stationaryphase. If the stationary phase is also chiral in nature, it is likely that oneenantiomer in the sample will fit closely to the stationary phase surfacewhereas the other will be stearically excluded and thus have lessstationary phase with which to interact. The first chiral separations in GCwere reported by Gil-Av et al. as in 1966 (7), but, surprisingly, the useof GC for the separation of enantiomers has only recently beeninvestigated and developed into a practical system. The use of chiralstationary phases in GC has been dogged by entantiomeric instabilityarising from the racemization of both the chiral stationary phase and thechiral solutes at elevated temperatures. In addition, at the elevatedtemperatures necessary to elute the solutes in a reasonable time, thechiral selectivity of the stationary phase can also be impaired.
A thermally stable chiral stationary phase was produced by Frank,Nicholson and Bayer (8) in 1977 by the co-polymerization of

This eBook is protected by Copyright law and International Treaties. All rights are reserved. This book is covered by an End UserLicensee Agreement (EULA). The full EULA may be seen at http://www.library4science.com/eula.html .
37
dimethylsiloxane with (2-carboxypropyl) methoxysilane and L-valine-t-butylamide.
0 8 16 24Time (minutes)
Chiral Center
Chiral Center
Courtesy of ASTEC Inc.
Figure 17 The Separation of the Enantiomers of a-HalocarboxylicAcid Esters on a b-Cyclodextrin-Based Stationary Phase
This material was relatively stable up to 220oC with little racemization but,was not made commercially available until 1989. Presently, there are anumber of effective GC chiral stationary phases available, some of themore effective being based on cyclodextrin,. The separation of theenantiomers of an a-halocarboxylic acid ester on a fused silica opentubular column coated with a b-cyclodextrin product is shown in figure17. The column was 10 m long and operated at 60oC using nitrogen asthe carrier gas.
The use of LC for chiral separations is easier to carry out and generallymore efficient. A number of racemic mixtures can be easily separatedusing a reverse-phase column and a mobile phase doped with a chiralreagent. In some cases, the reagent is adsorbed strongly on to thestationary phase, under which circumstances, the chiral selectivity residesin the stationary phase. Conversely, if the reagent remains predominantly

This eBook is protected by Copyright law and International Treaties. All rights are reserved. This book is covered by an End UserLicensee Agreement (EULA). The full EULA may be seen at http://www.library4science.com/eula.html .
38
in the mobile phase, then the chiral selectivity will be in the mobile phase.Camphor sulphonic acid and quinine are examples of mobile phaseadditives. The most common method used to achieve chiral selectivity isto bond chirally selective compounds to silica in a similar manner to areverse phase (e.g., example of which is afforded by the cyclodextrins).
Courtesy of ASTEC Inc.
Figure 18 The Separation of Warfarin Isomers on aCYCLOBOND Column
The cyclodextrins are produced by the partial degradation of starchfollowed by the enzymatic coupling of the glucose units into crystalline,homogeneous toroidal structures of different molecular sizes. Three ofthe most widely characterized are alpha, beta and gamma cyclodextrinswhich contain 6, 7 and 8 glucose units respectively. Cyclodextrins arechiral structures and the beta- cyclodextrin has 35 stereogenic centers.CYCLOBOND is a trade name used to describe a series of cyclodextrinschemically bonded to spherical silica gel. The separation of the isomers ofWarfarin is shown in figure 18. The column was 25 cm long and 4.6 mmin diameter packed with 5 micron CYCLOBOND 1. The mobile phase

This eBook is protected by Copyright law and International Treaties. All rights are reserved. This book is covered by an End UserLicensee Agreement (EULA). The full EULA may be seen at http://www.library4science.com/eula.html .
39
was approximately 90%v/v acetonitrile, 10%v/v methanol, 0.2 %v/vglacial acetic acid and 0.2%v/v triethylamine. It is seen that an excellentseparation has been achieved with the two isomers completely resolved.
Stationary Phase Limitation by Exclusion
Size Exclusion Chromatography might imply that solute retention wasdetermined solely by the size of the molecule. However, this can only betrue if the magnitude of the interaction forces between the solute andeach phase is the same. This situation can be closely approached by theappropriate choice of the mobile phase. Under such circumstances thelarger molecules, being partially or wholly excluded, will elute first andthe smaller molecules elute last.
It is important to understand that, even when the dominant retentionmechanism is controlled by molecular forces, if the stationary phase orsupporting material contains pores of size commensurate with those ofthe solute molecules, exclusion will still partly control retention. This isbecause the larger molecules will interact with less stationary phase andbe eluted relatively faster than if they had interacted with the sameamount of stationary phase as the smaller molecules. The two mostcommon exclusion media used in LC are silica gel and macroporouspolystyrene divinylbenzene resins. Figure 19 shows an exclusionchromatogram of a series of molecular weight standards obtained onsilica gel.
The column length was 50 cm and the mobile phase tetrahydrofuran(THF). The THF would be strongly adsorbed on the silica surface andthus the solutes would be distributed between pure THF in the mobilephase and THF on the surface of the silica. As a consequence, theinteractions are virtually identical in the two phases and the retention wasdetermined almost exclusively by stationary phase availability. Themolecular diameter of solute standards were (1) 11,000Å, (2) 240Å, (3)49.5Å, (4) 27.1Å and (5) 7.4Å.

This eBook is protected by Copyright law and International Treaties. All rights are reserved. This book is covered by an End UserLicensee Agreement (EULA). The full EULA may be seen at http://www.library4science.com/eula.html .
40
Courtesy of Supelco Inc.
Figure 19 The Separation of a Mixture by ExclusionChromatography
Until relatively recently, silica has been the most commonly usedexclusion media for the separation of high molecular weighthydrocarbons and polymers. However, it was not so successful in theseparation of polymeric materials of biological origin. More recently themicro-reticular macroporous polystyrene gels have been introduced andfound to be very useful for the separation of biopolymers by sizeexclusion. These materials have even replaced many of the traditionalapplications of silica gel.In summary, in all types of chromatography,solute retention is controlled by either the magnitude and probability ofinteraction and/or by the amount of stationary phase that is available tothem. However, even if, by appropriate choice of the phase system, thesolutes are separated, unless the peak dispersion is contained to allow theindividual solutes to be eluted discretely, the mixture will not be resolved.
Peak Dispersion in a Chromatographic Column
The first comprehensive approach to dispersion in chromatographiccolumns was taken by Van Deemter (8) who developed the dispersion

This eBook is protected by Copyright law and International Treaties. All rights are reserved. This book is covered by an End UserLicensee Agreement (EULA). The full EULA may be seen at http://www.library4science.com/eula.html .
41
equation for a packed GC column. Van Deemter's development did nottake into account the compressibility of the mobile phase which wasdealt with later by Katz, Ogan and Scott (9). A simple form of thistheory will be given that does not accommodate the compressibility ofthe mobile phase but a more detailed and comprehensive treatment isgiven in Books 6 and 7.
Van Deemter et al. assumed that there were four band spreadingprocesses responsible for peak dispersion, namely, multi-path dispersion,longitudinal diffusion, resistance to mass transfer in the mobile phaseand resistance to mass transfer in the stationary phase. Van Deemterderived an expression for the variance contribution of each process tothe overall variance per unit length of the column. Furthermore, as theindividual dispersion processes can be assumed to be random and non-interacting, the total variance per unit length of the column can beobtained from a sum of the individual variance contributions.
The Multi-Path Effect
The multi-path effect is diagramatically depicted in figure 20.
dl
Figure 20 Multipath Dispersion
When flowing through a packed column, the individual solute moleculeswill describe a tortuous path through the interstices between theparticles. As a result, some will randomly travel shorter routes than theaverage and some longer. It follows, that those molecules taking shorterpaths will move ahead of the mean and those that take the longer pathswill lag behind the mean. This will result in a differential distance traveled(dl) as shown in figure 3. This differential flow of the solute moleculesresults in band dispersion.

This eBook is protected by Copyright law and International Treaties. All rights are reserved. This book is covered by an End UserLicensee Agreement (EULA). The full EULA may be seen at http://www.library4science.com/eula.html .
42
Van Deemter et al. derived the following function for the multi-pathvariance contribution ( sM
2 ) to the overall variance per unit length of thecolumn, sM
2 = 2 l dp (4)
where (dp) is the particle diameter of the packing, and (l) is a constant that depended on the quality of the packing.
Longitudinal Diffusion
Solutes when contained in a fluid naturally diffuse and spread driven bytheir concentration gradient. Thus, in a chromatographic column adiscrete solute band will diffuse in the gas or liquid mobile phase. It alsofollows, that because the diffusion process is random in nature, aconcentration curve that is Gaussian in form will be produced. Thisdiffusion effect occurs in the mobile phase of both GC and LC columns.The diffusion process is depicted in figure 21.
Mobile Phase
Sample
Figure 21 Peak Dispersion by Longitudinal Diffusion
The longer the solute band remains in the column, the greater will be theextent of diffusion. The time the solute remains in the column is inverselyproportional to the mobile phase velocity, so, the dispersion will also beinversely proportional to the mobile phase velocity. Van Deemter et al.derived the following expression for the variance contribution bylongitudinal diffusion, (sL
2 ), to the overall variance/unit length of thecolumn.

This eBook is protected by Copyright law and International Treaties. All rights are reserved. This book is covered by an End UserLicensee Agreement (EULA). The full EULA may be seen at http://www.library4science.com/eula.html .
43
s L2
=2 g Dm
u (5)
where (Dm) is the diffusivity of the solute in the mobile phase, (u) is the linear velocity of the mobile phase, and (g) is a constant that depended on the quality of the packing.
The Resistance to Mass Transfer in the Mobile Phase
During passage through a chromatographic column, the solute moleculesare constantly and reversibly transferring from the mobile phase to thestationary phase. This transfer is not instantaneous; time is required forthe molecules to pass (by diffusion) through the mobile phase to reachthe interface and enter the stationary phase. Those molecules close to thestationary phase enter it immediately, whereas those molecules somedistance away will find their way to it some time later. Since the mobilephase is continually moving, during this time interval, those moleculesthat remain in the mobile phase will be swept along the column anddispersed away from those molecules that were close and entered thestationary phase immediately. This process is depicted in figure 22. Thediagram shows 6 solute molecules in the mobile phase and the pairclosest to the surface, (1 and 2), enter the stationary phase immediately.While molecules 3 and 4 diffuse through the mobile phase to theinterface, the mobile phase moves on. As a consequence, whenmolecules 3 and 4 reach the interface, they enter the stationary phasesome distance ahead of the first two. Finally, while molecules 5 and 6diffuse to the interface, the mobile phase has moved even further downthe column until molecules 5 and 6 enter the stationary phase ahead ofmolecules 3 and 4. Thus, the 6 molecules, originally relatively closetogether, are now spread out in the stationary phase. This explanation,although over-simplified, gives a correct description of the mechanism ofmass transfer dispersion.
Van Deemter derived the following expression for the variancecontribution by the resistance to mass transfer in the mobile phase,(sR M
2 ),

This eBook is protected by Copyright law and International Treaties. All rights are reserved. This book is covered by an End UserLicensee Agreement (EULA). The full EULA may be seen at http://www.library4science.com/eula.html .
44
s RM2 =
f1(k' )dp2
Dmu (6)
where (k') is the capacity ratio of the solute, and the other symbolshave the meaning previously ascribed to them.
1 2
1 2 3 4
5 6
1 2 3 4 5 6
1 2 3 4
3 45 6
Stationary Phase
Stationary Phase
Stationary Phase
Stationary Phase
Mobile Phase
Mobile Phase
Mobile Phase
Mobile Phase
5 6
Figure 22 Resistance to Mass Transfer in the Mobile Phase
The Resistance to Mass Transfer in the Stationary Phase
Dispersion due to resistance to mass transfer in the stationary phase isexactly analogous to that in the mobile phase. Solute molecules close tothe interface will leave the stationary phase and enter the mobile phasebefore those that have diffused further into the stationary phase and havea longer distance to diffuse back. Thus, as those molecules that wereclose to the surface will be swept along in the moving phase, they will bedispersed from those molecules still diffusing to the surface. Thedispersion resulting from the resistance to mass transfer in the stationaryphase is depicted in figure 23. Molecules 1 and 2 (the two closest to thesurface) will enter the mobile phase and begin moving along the column.Their movement will continue while molecules 3 and 4 diffuse to theinterface at which time they will enter the mobile phase and startfollowing molecules 1 and 2 down the column.

This eBook is protected by Copyright law and International Treaties. All rights are reserved. This book is covered by an End UserLicensee Agreement (EULA). The full EULA may be seen at http://www.library4science.com/eula.html .
45
2 1
4 3 2 1
5 6
1 2 3 45 6
3 4 5 6
Stationary Phase
Stationary Phase
Stationary Phase
Stationary Phase
Mobile Phase
Mobile Phase
Mobile Phase
Mobile Phase
Mobile Phase
6 5 4 3 2 1
Figure 23 Resistance to Mass Transfer in the Stationary Phase
All four molecules will continue moving down he column, whilemolecules 5 and 6 diffuse to the interface. By the time molecules 5 and 6enter the mobile phase, the other four molecules will have been smearedalong the column and the original 6 molecules will be dispersed.
Van Deemter derived an expression for the variance from the resistanceto mass transfer in the stationary phase, (sR S
2 ), which is as follows:
sRS2 = f2 (k' )d f
2
DSu (7)
where (k') is the capacity ratio of the solute, (df) is the effective film thickness of the stationary phase, (DS) is the diffusivity of the solute in the stationary phase, and the other symbols have the meaning previously ascribed to them.Now, applying the law of Summation of Variances,
sx2 = sM
2 + s L2 + s RM
2 + sRS2 (8)
where (sx2 ) is the total variance/unit length of the column.

This eBook is protected by Copyright law and International Treaties. All rights are reserved. This book is covered by an End UserLicensee Agreement (EULA). The full EULA may be seen at http://www.library4science.com/eula.html .
46
Thus substituting for (sM2 ), (sL
2 ), (sR M2 ) and ( sR S
2 ) from equations (4),(5), (6) and (7), respectively,
sx2
= 2 ld p +2 g Dm
u+
f 1(k' )dp2
Dmu +
f2( k' ) d f2
DSu (9)
Equation (9) is the Van Deemter equation that describes the variance perunit length of a column in terms of the physical properties of the columncontents, the distribution system and the linear velocity of the mobilephase. Alternatively the Van Deemter equation can be expressed in theform,
H = 2 ld p +2 g Dm
u+
f 1(k' )dp2
Dmu +
f2( k' ) d f2
DSu (10)
where (H) is the Height of the Theoretical Plate. The relationshipbetween (H) and (sx) is explained in Book 6.
Hence the term "HETP equation" for equation (10). This form of theVan Deemter equation is very nearly correct for LC but, due to thecompressibility of the gaseous mobile phase in GC, neither the linearvelocity nor the pressure is constant along the column. Furthermore, asthe diffusivity, (Dm), is a function of pressure, the above form of theequation can only be approximate. However, equation (10) generallygives the correct form of the relationship between (H) and the linearvelocity (u). It also predicts that there will be an optimum velocity thatgives a minimum value for (H) and thus, a maximum efficiency. Pressurecorrections for retention volume and the height of the theoretical plateare derived in Books 6 and 7.
The Golay Equation for Open Tubular Columns
The corresponding equation describing dispersion in an open tubularcolumn was developed by Golay (10) for GC columns but is equallyapplicable to LC columns and to dispersion in connecting tubes. The

This eBook is protected by Copyright law and International Treaties. All rights are reserved. This book is covered by an End UserLicensee Agreement (EULA). The full EULA may be seen at http://www.library4science.com/eula.html .
47
Golay equation differs from equation (10) in that, as there is no packing,there can be no multipath term. Consequently, the equation containsonly three functions. One function describes dispersion from longitudinaldiffusion and the other two describes dispersion from the resistance tomass transfer in the mobile and stationary phases, respectively. TheGolay equation takes the following form:-
H =2 Dm
u+
f1 k'( ) r2
Dmu +
f2 k'( )r2
K2 Dsu (11)
where (r) is the column radius, and other symbols have the meaning previously ascribed to them.
Open tubular columns behave in exactly the same way as packedcolumns with respect to pressure. As the column is geometrically simplethe respective functions of (k') can also be explicitly developed.
The Efficiency of a TLC Plate
TLC plate efficiency is a measure of its capacity to restrain solutedispersion and maintain narrow spots as the solutes migrate along theplate. An explicit equation that describes the dispersion in TLC has notbeen rigorously developed, nevertheless, high efficiencies are realized inmuch the same way as they are in GC and LC. Primarily, the particlesize of the silica layer must be made as small as possible and the layermust be spread in a thin, homogenous film on the supporting plate. TLCplate efficiency is measured in a similar manner to column efficiency butslightly modified. It is very difficult, if not impossible, to identify thepositions of the points of inflexion on a TLC spot, but if the visible edgesof the spot are assumed to occur at four standard deviations of the spotdistribution, then it is still possible to assess the efficiency. In general it isconsidered that over 95% of the material in the spot is confined within 4standard deviations of the spot dispersion.
If the diameter of the spot (d), corresponds to four standard deviations,then applying the same rationale as with the packed column,

This eBook is protected by Copyright law and International Treaties. All rights are reserved. This book is covered by an End UserLicensee Agreement (EULA). The full EULA may be seen at http://www.library4science.com/eula.html .
48
Re t. Dis tancePeak Width
=Zsd
=n4
where (Zs) is the retention distance of the solute.
Thus, n = 16 Zsd
Ê Ë Á ˆ
¯ ˜
2
It shout be pointed out, however, the method contains implicitassumptions that may not necessarily be valid. Besides assuming that thevisible limits of the spot correspond to four standard deviations, the basicassumption that the value of (K) is constant throughout the development,is also tacitly made and this is certainly not so. In fact, this procedurewould give similar errors to those that would arise from calculating theefficiency of an LC column under conditions of gradient elution.Nevertheless, the method does allow the relative performance ofdifferent plates to be accessed and in this way can be helpful.
The Basic Column Chromatograph
A chromatograph consists of five basic units and these units, althoughpossibly designed differently for different systems, are essential for alltypes of chromatograph, including both gas and liquid chromatographs.The layout of all the five essential units is shown in figure 24. Theyconsists of a mobile phase supply, a sampling system, a column andcolumn oven including a temperature controller and temperatureprogramming system. The temperature controller and programmer willprobably have its own microprocessor which may also be under thecontrol of the data acquisition and processing computer.
The column eluent will pass to an appropriate detector and its associatedelectronics. There may be more than one detector and they may beemployed in parallel or in series and individually controlled andmonitored. The final unit will be a computer and data acquisition system

This eBook is protected by Copyright law and International Treaties. All rights are reserved. This book is covered by an End UserLicensee Agreement (EULA). The full EULA may be seen at http://www.library4science.com/eula.html .
49
and may include a simple potentiometric recorder to monitor thechromatogram in real time, if this is not provided by the computer.
Detector
Detector Electronics
Potentiometric Recorder or Computer Data Acquisition andProcesssing System
Oven Controller
Column
Sampling SystemMobile Phase Supply
Column Oven
Detector Oven
Figure 24 The Basic Chromatograph
The Mobile Phase Supply
The first unit, the mobile phase supply, can range in complexity from asimple gas cylinder connected to a flow controlling valve for a gaschromatograph, to a complex multi-piston pump supplied by four or fivesolvent reservoirs and fitted with both flow programming and gradientelution facilities, each with its own controlling micro-processor. For a gaschromatograph the gas supplies will vary depending on the type ofdetector employed and column that is used. If gases are being analyzedthen a katharometer detector will probably be appropriate and thushelium will be used as the carrier gas to provide the best sensitivity. If aflame ionization detector (FID) is to be used then oxygen or air andhydrogen will be needed for the detector and helium or nitrogen must beavailable as the mobile phase. If an argon ionization detector is to beused then an argon supply will be necessary. Flow controllers are usuallysupplied to each gas supply, often under microprocessor control and

This eBook is protected by Copyright law and International Treaties. All rights are reserved. This book is covered by an End UserLicensee Agreement (EULA). The full EULA may be seen at http://www.library4science.com/eula.html .
50
fitted with inline flow controllers. Such a system can provide flowprogramming facilities if so desired.
The mobile phase supply for a liquid chromatograph usually has acapacity for at least four solvents which are normally housed in a flameproof environment and solvent vapors are removed by a suitable vaporscavenging device. The solvents can be selected by a microprocessor ormanually by suitable valves and these pass either directly to a dual pistonpump for isocratic development or to a solvent programmer and thenceto a pump for gadient elution. Care must be taken to minimize thevolume existing between the solvent programmer exit and the samplevalve otherwise the gradient will be distorted by the logarithmic decayfunction of the interstitial volume.
The Sampling System
Gas samples are generally placed on a GC column using an external loopsampling valve but liquid samples are usually injected onto the columnby a syringe via a heated injector. Sample are placed on an LC columndirectly with either an internal or external loop sample valve the valvebeing connected directly to the column. The external loop samplesystem, employing six ports, is depicted in figure 25.
The external loop sample valve has three slots cut in the rotor so thatany adjacent pair of ports can be connected. In the loading position,shown on the left, the mobile phase supply is connected by the rotor slotbetween port (4) and port (5) directly through to the column. In thisposition, the sample loop is connected across ports (3) and (6). Samplepasses either from a syringe or other sample device into port (1) throughthe rotor slot to the sample loop at port (6) and the third slot in the rotorconnects the exit of the sample loop to waste at port (2).
The sampling position is shown by the diagram on the right. On rotatingthe valve, the sample loop is interposed between the column and themobile phase supply by connecting port (3) and (4) and ports (5) and (6)

This eBook is protected by Copyright law and International Treaties. All rights are reserved. This book is covered by an End UserLicensee Agreement (EULA). The full EULA may be seen at http://www.library4science.com/eula.html .
51
and the sample is swept onto the column. In the sampling position, thethird rotor slot connects the syringe port to the waste port.
Mobile Phase
Mobile Phase
Sample LoopSample Loop
To Column
To Column
Sample In Sample In ToWasteTo Waste
1 2
1 2
345
6 12
3456
Courtesy of Valco Instruments Inc.
Figure 25 The External Loop Valve
After sampling, the rotor can be returned to the loading position, thesystem washed with solvent and the sample loop loaded in readiness forthe next injection. For analytical applications, the sample loop can have avolume ranging from 1 to 20 ml, but for preparative work, loops withsample volumes of 1 ml or more can be placed on a preparative column.
Modern liquid chromatographs that are used for routine analysis usuallyinclude an automatic sampling device. This involves the use of some typeof a transport mechanism that may take the form of a carousel or someform of belt conveyor system. The transporter carries a series of vialsthat alternately contain sample and washing solvent. The sampling caninvolve a complex sequence of operations that are controlled by amicroprocessor. The syringe plunger is operated pneumatically and thesyringe is first washed with solvent, then rinsed with the sample,reloaded with the sample and the contents discharged into the column. Inroutine analytical laboratories, which often have very sophisticated LCassemblies, there may also be a sample-preparation robot which willautomatically carry out such procedures as extraction, concentration,derivatization, etc. which can be considered as part of the sampling

This eBook is protected by Copyright law and International Treaties. All rights are reserved. This book is covered by an End UserLicensee Agreement (EULA). The full EULA may be seen at http://www.library4science.com/eula.html .
52
system. The robot is usually programmable, so that a variety ofseparation procedures can be carried in a sequence that is unique foreach sample. In laboratories that have a high throughput of samples, anautomatic sampling device is often essential for the economic operationof the laboratory.
The Column and Column Oven
GC ovens usually require an operating range from about 5˚C to about400˚C although the majority of GC analyses are carried out betweentemperatures of 75˚C an 200˚C. In contrast, LC column ovens cover amore limited range of temperatures viz., 0˚C to 120˚C. Temperatureprogramming is an essential feature of all GC column ovens and isnecessary to handle a sufficiently wide molecular and polarity range ofsamples. Linear programming is the most common although otherfunctions of time are often available. LC column ovens are rarelyprovided with temperature programming facilities as the techniqueappears to be far less effective compared with GC, gradient elution beinga far more ffective alternative. The thermostatting medium used in GCovens is almost exclusively 'forced air' as the heat capacity of the GCmobile phase (i.e., a gas) is relative small. Consequently, air has sufficientheat capacity to change the column temperature rapidly withoutsignificant cooling from the carrier gas. Air ovens are also employed inLC column ovens but are far less effective as the mobile phase, a liquid,has a much higher heat capacity and thus a stronger cooling effect. Thisproblem is partly alleviated by using mobile phase preheaters but theseintroduce a significant volume between the solvent supply system andthe column which will distort the profile of any solvent gradient that isemployed. Nevertheless, a liquid thermostatting medium introducesdifficulties when changing columns and with column detectorconnections and is thus, not commonly used. The temperature programcan be controlled by a microprocessor incorporated in the programmeror can be controlled from a central computer that governs the operationof the whole instrument.
The GC column can be a packed or open tubular and thus the ovenmust be capable of taking both. The open tubular column is by far the

This eBook is protected by Copyright law and International Treaties. All rights are reserved. This book is covered by an End UserLicensee Agreement (EULA). The full EULA may be seen at http://www.library4science.com/eula.html .
53
most popular partly because they are considered state of the art and notbecause they necessarily provide an improved performance. Opentubular columns will always provide the highest efficiencies but, if correctoperating procedures are adopted, in general, analyses carried out onpacked columns, are likely to provide greater accuracy and betterprecision and repeatability. Packed GC columns are usually made ofstainless steel or glass and open tubular column almost exclusively fusedquartz.
Almost all LC columns are packed, although they can vary widely inlength and diameter depending of the nature of the sample and theresolution required. They are usually manufactured of stainless steel ortitanium (reputed to provide greater stability for labile materials ofbiological origin) and the connection to the sample valve and detectorshould be as short as possible and have a very small diameter to reduceextra column dispersion.
Detector and Detector Electronics
There is a wide range of detectors available for both GC and LC eachhaving their own particular areas of application. In general the morecatholic the response, the less sensitive the detector and the mostsensitive detectors are those that have a specific response. Theperformance of all detectors should be properly specified so that the usercan determine which is most suitable for a specific application. Suchspecifications are also essential to compare the performance of differentdetectors supplied by alternative instrument manufactures. Detectorspecifications should be presented in a standard form and in standardunits, so that detectors can be compared that function on widely differentprinciples. The more important detector specifications are summarizedin table 2.
The Detector Output
Most practical detectors must have a linear output, e.g.,
y = Ac

This eBook is protected by Copyright law and International Treaties. All rights are reserved. This book is covered by an End UserLicensee Agreement (EULA). The full EULA may be seen at http://www.library4science.com/eula.html .
54
where (y) is the output of the detector in appropriate units,(c) is the concentration of solute in the mobile phase,
and (A) is a constant.
Table 2 Detector Specifications
Specifications UnitsDynamic Range (DR) g/ml (e.g. 3 x 10⁻⁹ to 6 x 10⁻⁵ )Response Index (r) dimensionlessLinear Dynamic Range (DLR) g/ml (e.g. 1 x 10⁻⁸ to 2 x 10⁻⁵ )Detector Response (RC) Volts/g or (specific units of
measurement/g)Detector Noise Level (ND) usually in millivolts but may be in
specific units (e.g. Refractive Index Units)Sensitivity or minimumdetectable concentration
(XD) g/ml (e.g. 3 x 10⁻⁸) but may be in specific units (e.g. Absorption Units)
Total Detection System Dispersion
(sD2 ) (ml2 often ml2)
Cell Dimensions (length (l), and radius (r)), (cm)Cell Volume (VD), ml.Overall Time Constant(sensor and electronics)
(TD), seconds (sometimes milliseconds)
Pressure Sensitivity (DP) usually in the USA p.s.i, in Europe MPa
Flow Rate Sensitivity (DQ) usually in ml/minTemperature Range oC
All are designed to provide a response that is as close as possible tolinear for accurate quantitative analysis. However, the output from somedetector sensors may not be linearly related to the solute concentrationand appropriate signal modifying circuits must be introduced into thedetector electronics to provide a linear output (e.g., the output from alight adsorption sensor will be exponential and consequently it must beused with a logarithmic amplifier to produce an output that is linearlyrelated to solute concentration).

This eBook is protected by Copyright law and International Treaties. All rights are reserved. This book is covered by an End UserLicensee Agreement (EULA). The full EULA may be seen at http://www.library4science.com/eula.html .
55
The most important detector specification is sensitivity as it defines theminimum concentration of solute that can be detected. It is best defined afunction of the detector response and the noise level The detectorresponse (Rc) can be defined as the voltage output for unit change insolute concentration or as the voltage output that would result from unitchange in the physical property that the detector measures, e.g.refractive index or carbon content. Detector noise is the term given toany perturbation on the detector output that is not related to an elutedsolute. It is a fundamental property of the detecting system anddetermines the ultimate sensitivity or minimum detectable concentrationthat can be achieved. Detector noise has been arbitrarily divided intothree types, 'short term noise', 'long term noise' and 'drift' all three ofwhich are depicted in figure 26.
Short Term Noise
Long Term Noise
Drift
Total Noise
Figure 26 Different Types of Noise
Short term noise consists of baseline perturbations that have a frequencythat is significantly higher than the eluted peak. Short term detectornoise can be easily removed by appropriate noise filters withoutsignificantly affecting the profiles of the peaks. Its source is usuallyelectronic, originating from either the detector sensor system or theamplifier. Long term noise consists of baseline perturbations that have afrequency that is similar to that of the eluted peak. This noise is the mostsignificant as it is indiscernible from very small peaks in thechromatogram. Long term noise cannot be removed by electronicfiltering without affecting the profiles of the eluted peaks. In figure 26, it

This eBook is protected by Copyright law and International Treaties. All rights are reserved. This book is covered by an End UserLicensee Agreement (EULA). The full EULA may be seen at http://www.library4science.com/eula.html .
56
is clear that the peak profile can easily be discerned above the highfrequency noise but is lost in the long term noise. Long term noiseusually arises from temperature, pressure or flow rate changes in thesensing cell. Drift are baseline perturbations that have a frequency that islarge to that of an eluted peak. Drift is almost always due to eitherchanges in ambient temperature, changes in mobile flow rate, or columnbleed in GC; in LC drift can be due to pressure changes, flow ratechanges or variations in solvent composition. A combination of all threesources of noise is shown by the trace at the bottom of figure 26.
The detector noise is defined as the maximum amplitude of thecombined short– and long-term noise measured over a period of 15minutes. The detector must be connected to a column and mobile phasepassed through it during measurement. The detector noise (ND) isobtained by constructing parallel lines embracing the maximumexcursions of the recorder trace over the defined time period as shownin figure 27.
Figure 27 Measurement of Detector Noise
Detector sensitivity or minimum detectable concentration (MDC) isdefined as the minimum concentration of solute passing through thedetector that can be unambiguously discriminated from noise,conventionally taken when the signal to noise ratio is two and this criteriahas been adopted for defining detector sensitivity.
Thus for a concentration sensitive detector, the detector sensitivity (XD)is given by

This eBook is protected by Copyright law and International Treaties. All rights are reserved. This book is covered by an End UserLicensee Agreement (EULA). The full EULA may be seen at http://www.library4science.com/eula.html .
57
X D =2NDR c
( g / ml )
The two important ranges that are specified for a detector are thedynamic range and the linear dynamic range. The dynamic range (DR)extends from the minimum detectable concentration (i.e. the sensitivity)to that concentration at which the detector no longer responds to anyincrease. The dynamic range is not usually pertinent to general analyticalwork but is important in preparative chromatography. The lineardynamic range or detector linearity is as important as sensitivity for anydetector that is to be used for quantitative analysis. It is defined as theconcentration range over which the detector response is linearly relatedto the concentration of solute passing through it.
That is, V = A Cm
where (A) is a constant, (Cm) is the concentration of solute, and (V) is the output of the detector.
Because of the imperfections in mechanical and electrical devicespractical detectors can only approach this ideal response. A measure oflinearity that is specified in numerical terms so that comparisons can bemade between detectors can be obtained as follows. It is assumed thatfor a closely linear detector the response could be described by thefollowing power function
V = A Cmr (1)
where (r) is defined as the Response IndexIt follows that for a truly linear detector, r = 1, and the proximity of (r)to unity will indicate the extent to which the response of the detectordeviates from true linearity. In addition if (r) is not unity but is knownthen appropriate corrections can be made to the response and improvedaccuracy can be achieved.
The three remaining important specifications are pressure sensitivitywhich is particularly crucial if multidimensional chromatography is

This eBook is protected by Copyright law and International Treaties. All rights are reserved. This book is covered by an End UserLicensee Agreement (EULA). The full EULA may be seen at http://www.library4science.com/eula.html .
58
envisaged, flow rate sensitivity which is important if flow programming iscontemplated and, of course, the maximum operating temperature toensure the detector is not damaged by overheating. A GC detector mustbe situated in a separate oven and maintained at a temperature at least15˚C above that of the column oven to ensure that no solute condensesin the detector and causes detector fowling. In GC any connecting tubebetween the column and the detector must also be heated to atemperature above that of the oven to prevent condensation.
Data Acquisition and Processing System
A diagram of a chromatographic data acquisition and processing systemis shown in figure 28.
FromDetector
ScalingAmplifier
A/D Converter
Potentiometric Recorder
Computer Printer
Figure 28 The Data Acquisition and Processing System
The actual format of the data system can vary widely from manufacturerto manufacturer. Most systems have a means for real time monitoringthe detector output either by using an ancillary recorder or by computersoftware, the chromatogram being drawn by the computer on theprinter. The signal from the detector is first scaled, usually to a rangefrom 0 to 5 volt by a suitable amplifier and the scaled signal is thendigitized by means of an A/D converter. The data is then regularly read

This eBook is protected by Copyright law and International Treaties. All rights are reserved. This book is covered by an End UserLicensee Agreement (EULA). The full EULA may be seen at http://www.library4science.com/eula.html .
59
by the computer and stored on disk. The data may be partially processed'on the fly' or processed at the completion of the analysis.
Thin Layer Chromatography Apparatus
Thin layer chromatography appears to have been first developed andutilized by Schraiber in 1939 (11). Schraiber working with Izmailov atthe Khar'kov Chemistry and Pharmacy Research Institute employed thetechniques for the analysis of pharmaceuticals. In her own words,
" It occurred to us that a thin layer of the sorbent could be used in lieuof a strip of paper; also we felt that the flat bed could be considered asa cut-out of the adsorbent column. We believed that in carrying out theseparation process in such a layer, the process would be acceleratedsignificantly. In our work, we deposited a drop of the solution beinginvestigated on the flat adsorbent layer and observed the separationinto concentric circular zones which could become visible because oftheir fluorescence in the light of a UV lamp."
Schraiber not only invented thin layer chromatography in 1939 but alsowas the first to use fluorescence as the separation indicator or detectionsystem. Unfortunately, Schraiber's work does not seem to have beenheeded and the technique appears to have been rediscovered byKirchner in 1951 (12).
Although thin layer chromatography (TLC) phase systems are basicallythe same as those used in LC, the equipment required is far simpler andvery much less expensive. Furthermore, as many separations can becarried out simultaneously by multiple spotting, analysis times are muchshorter and there can be as many as 60 samples per plate which, in effectmeans that each analysis will only take about 5 seconds to complete.Resolution obtained from TLC is far less than that obtainable by LC but,as a result of the cost advantage, the technique is very widely used. Infact, despite the many advances that have taken place in LC techniquesover the past years, the use of TLC for routine analyses continues togrow. However, samples containing multiple components cannot beseparated by TLC due to restricted plate capacity. In TLC all the solutes

This eBook is protected by Copyright law and International Treaties. All rights are reserved. This book is covered by an End UserLicensee Agreement (EULA). The full EULA may be seen at http://www.library4science.com/eula.html .
60
must be contained by the plate whereas in LC, as the solutes are elutedfrom the column, the component capacity is much greater.
Thin Layer Chromatography Chambers
A diagram of two simple thin layer chromatography developmentchambers is shown in figure 29.
Thin Layer Plate
Thin Layer Plate
Solvent Mixture
Solvent Mixture
Solvent Wick to Help Saturate the Enclosure with Solvent vapor
Cover Plates
Figure 29 The Normal Method of Thin Layer Plate Development
Solvent must be prevented from evaporating from the plate surfaceduring development as this would cause the composition of thedeveloping solvent to change. In the simplest case, the developingchamber can consist of a round or square glass jar fitted with a glass cap.Sufficient solvent mixture is placed in the chamber to raise the levelabout a centimeter from the base. The plate is then placed in thechamber with the end where the samples have been placed dipping intothe solvent and the cap replaced. The sample spots must not be at, orbelow, the surface of the solvent mixture or they will be washed from

This eBook is protected by Copyright law and International Treaties. All rights are reserved. This book is covered by an End UserLicensee Agreement (EULA). The full EULA may be seen at http://www.library4science.com/eula.html .
61
the plate. To improve the air space saturation with solvent, the walls, orpart of the walls, of the chamber are sometimes covered with filter paperto act as a wick that soaks up the solvent and provides a greater surfacearea for evaporation. The use of a paper wick is depicted on the right-hand side of figure 29.
The saturated solvent vapor in the chamber not only prevents solventevaporating from the plate surface but partly controls the retentionmechanism by surface deactivation. The solvents are selectively adsorbedon the surface of the stationary phase causing the solutes to interact, notwith the native silica surface, but with the silica surface covered with themost strongly interacting solvent. It should be emphasized, however,that the equilibrium between the solvent vapor and the plate will not bethe same as the equilibrium between the solvent and the plate. Forexample, for a binary mixture of solvents having concentrations ofsolvent in the gas phase of c1 and c2 respectively,
c1 ≠ x1 and c2 ≠ x2
where (x1) is the molar fraction of solvent (1) and (x2) is the molar fraction of solvent (2)
In fact, Raoult's Law applies and
c1c2
=x1P1
1 - x1( )P2where x2 = 1-x1( )
and (P1) and (P2) are vapor pressures of pure solvents (1) and (2)respectively. One form of apparatus that can be used for the pre-equilibrium of a thin layer plate is shown in figure 30.
The apparatus is very similar to that used for normal development but aseparate reservoir contains the developing solvent. The plate is placed inthe enclosure and allowed to come into equilibrium with the solventvapor for a few minutes. The plate is then lifted and placed so that theend now dips into the developing solvent and the separation processed inthe usual way. There are two main effects resulting from the pre-saturation of a TLC plate. These affects are depicted in figure 31. Firstlythe velocity of the solvent front is increased relative to that of theunsaturated plate. Secondly, as a significant amount of the solvent at the

This eBook is protected by Copyright law and International Treaties. All rights are reserved. This book is covered by an End UserLicensee Agreement (EULA). The full EULA may be seen at http://www.library4science.com/eula.html .
62
front is adsorbed onto the silica surface of the unsaturated plate, theseparated components are much closer to the solvent front.
Thin Layer Plate
Solvent Mixture
Thin Layer Plate
Cover Plates
Plate Coming Into Equilibrium with Solvent Vapor
Plate Development
Figure 30 Apparatus for Establishing the Pre-Equilibrium of aTLC Plate
Consequently, the apparent advantage resulting from the faster movingfront of the pre-saturated plate on the analysis time is offset by the closerproximity of the spots to the solvent front in the unsaturated plate. Inmost cases, the effect of pre-saturation on the actual separation is smallbut can be important for special mixtures where subtle changes inretention can make the necessary difference.
Continuous Plate Development
The normal development of a thin layer plate is limited by its physicaldimensions but a continuous development procedure has been usedemploying special equipment. An apparatus used for the continuousdevelopment of a thin layer plate is shown in figure 32. The plate is held

This eBook is protected by Copyright law and International Treaties. All rights are reserved. This book is covered by an End UserLicensee Agreement (EULA). The full EULA may be seen at http://www.library4science.com/eula.html .
63
horizontal and inverted so that the stationary phase layer facesdownwards and rests on a second glass cover plate.
Plate Saturated by Solvent Unsaturated Plate Vapor
Solvent Front
Figure 31 Effect of Plate Saturation on Plate Development
A wick transfers the solvent from the reservoir to the stationary phasecoating which is sandwiched between the two glass plates.
ElectricHeater
Thin Layer Plate
Cover Plate
Developing Solvent
Solvent VaporEvaporated from the TLC Plate
Solvent Wick
Figure 32 Apparatus for the Continuous Development of a ThinLayer Plate
This eBook is protected by Copyright law and International Treaties. All rights are reserved. This book is covered by an End UserLicensee Agreement (EULA). The full EULA may be seen at http://www.library4science.com/eula.html .
64
The whole system is situated in a suitable chamber to prevent solventevaporation from the reservoir. The solvent passes along the plate bysurface tension forces in the usual way until it reaches the end of theplate. A small area at the end of the plate is exposed and heatedelectrically to evaporate the solvent as it arrives. In this way developmentcan be continued and the system now resembles an LC column oflamina shape. The value of this technique is a little questionable as itsintent is to simulate an LC column, in which case it would be preferableto use an LC column in the first place.
Sample Application
Samples should be placed on a TLC plate as a spot that is as small aspossible. Sample volumes of 1 to 2 ml are common but when using theso called high performance TLC plates (HPTLC plates) coated withparticles 5-7 mm in diameter a maximum loading of about 100-200 nlcan only be tolerated. Ideally the sample area should be circular and notgreater than 1 mm in diameter, on any HPTLC plate. As this requiresthe use of samples a few nanoliters in volume, most will need to beconcentrated. Manually, the sample can be applied with a micro-pipetteand the solvent is then allowed to evaporate, This procedure is repeateduntil sufficient sample is placed on the plate. Micro-syringes can also beemployed to place a sample on to the plate. With care, and a little localheating, sample concentration can also be accomplished. The contents ofthe syringe are slowly but continuously discharged onto the plate and atthe same time the solvent is progressively evaporated. This procedurecan be automated, using computer controlled syringes and, in this way,samples can be focused onto the plate and constrained to a very smallarea.There are various devices that are commercially available that will applysamples to a TLC plate either individually or as multiple groups. Anexample of a device for automatically concentrating a sample and thenplacing it on a plate is shown in figure 33.

This eBook is protected by Copyright law and International Treaties. All rights are reserved. This book is covered by an End UserLicensee Agreement (EULA). The full EULA may be seen at http://www.library4science.com/eula.html .
65
Polymer Film
Vacuum
Vacuum Drop of Sample Solution
Sample Concentrated by Evaporation
Thin Layer Plate
Pressure
Figure 33 A TLC Sampling Device Incorporating SampleConcentration
The device consists of a plate with a small indentation, at the center ofwhich is an aperture that can be connected either to a vacuum or to asource of gas pressure. A polymer film is placed over the plate surfaceand a vacuum applied to suck the film into the indentation. A smallquantity of sample solution is placed in the indentation and the solventevaporated. This procedure is repeated until sufficient sample is presenton the film for a satisfactory TLC separation. It is important that thesample is not evaporated to dryness as the transfer of solid materials tothe thin layer plate can be very inefficient. When sufficient sample hasbeen accumulated and the droplet is still liquid, the thin layer plate isplaced over the film and a positive pressure now applied to the apertureat the center of the indentation. The film extends to the surface of theTLC plate and the sample is transferred by contact, as a result of surface

This eBook is protected by Copyright law and International Treaties. All rights are reserved. This book is covered by an End UserLicensee Agreement (EULA). The full EULA may be seen at http://www.library4science.com/eula.html .
66
tension forces and the adsorptivity of the TLC plate surface. The plate isthen conveyed to the solvent chamber and the separation developed inthe usual way.
If larger samples are required for semi preparative work, sample bandscan be applied to the plate as opposed to sample spots. Sample bandscan be applied either by using TLC plates with concentrating zones oralternatively by using band applicators. A diagram of a TLC plate thatincludes a concentrating zone is shown in figure 34.
Glass Plate
Concentrating Zone
Normal Retentive Coating
Figure 34 TLC Plate with Sample Concentrating Zone
The concentrating zone is about 2 cm wide and consists of a coatingmade from relatively large particles of silica with a relatively low surfacearea and consequently low retentive capacity. The concentrating band iscoated closely adjacent to the normal retentive coating which, consists ofthe usual particles 5-7 mm in diameter but with a much higher surfacearea and, thus, much greater retentive capacity. Several samples of a fewmicroliters or more can be placed sequentially on to the concentratingzone and the solvent allowed to evaporate until there is an adequatequantity of sample on the plate. The sample is now spread along theconcentration zone in a fairly broad band. When the plate is developedthe solutes move rapidly through the concentration zone due to its lowretentive character to the interface between the layers. At the interfacethe solutes are slowed down by the more retentive layer and are thusfocused as a sharp band at the front of the plate. As developmentproceeds, the solutes separate in the normal high retentive layer in theusual manner. This procedure has other advantages. If the sample iscontaminated with salts or biological polymers, these will be trapped inthe concentration zone and, thus, will not pass onto the separation regionof the plate and effect the quality of the separation. Band applicators

This eBook is protected by Copyright law and International Treaties. All rights are reserved. This book is covered by an End UserLicensee Agreement (EULA). The full EULA may be seen at http://www.library4science.com/eula.html .
67
operate differently and are usually fully automated. The sample isatomized in a stream of air or nitrogen depending on the nature of thesample and its tendency to oxidation. A diagram of the type of atomizerused in band application is shown in figure 35.
Atomized Spray
Air orNitrogen
SampleSolution
Figure 34 TLC Plate with Sample Concentrating Zone
The atomizer is mounted on a mechanical arm that can sweep from sideto side while directing the atomized sample on to the surface of a TLCplate. The range and the number of sweeps, are usually under computercontrol and the speed of movement is adjusted such that the solvent isable to evaporate from a given area of sample before it receives thesubsequent dose. After dosing, the plate is developed in the normal way.Some exceedingly novel and clever devices have been developed forTLC. These devices indeed improve the performance of the TLCanalysis but are also expensive and in many cases tend to make the TLCsystem more like a liquid chromatograph. The great advantage of TLCis its low cost and its relatively high separating capability. If therequired performance required is at the limit or beyond the capability ofthe technique, there is no point in trying to stretch it. The rationalsolution for the chemist or analyst would be to change to an alternativeprocedure such as liquid chromatography or to some other technique ifmore appropriate. Chromatography Applications
Gas chromatography has an entirely different field of applications to thatof liquid chromatography. In general, gas chromatography is used for

This eBook is protected by Copyright law and International Treaties. All rights are reserved. This book is covered by an End UserLicensee Agreement (EULA). The full EULA may be seen at http://www.library4science.com/eula.html .
68
the separation of volatile materials and liquid chromatography for theseparation of involatile liquids and solids. There are certain compounds,however, that can be separated with either techniques, and moreimportantly, many involatile substances such as amino acids, steroids andhigh molecular eight fatty acids can be derivatized to form volatilesubstances that can be separated by GC. The derivatization must be highlyreproducible and usually proceed to completion in order to maintainadequate accuracy. The capillary columns in GC can have much higherefficiencies than their LC counterpart and thus GC can more easilyhandle multicomponent mixtures such as essential oils. On the otherhand, only LC can separate the peptides, polypeptides, proteins andother large biopolymers that are important in biotechnology.
Gas Chromatography Applications
The most common hydrocarbon analysis carried out by GC is probablythat of gasoline. The analysis of gasoline is typical of the type of samplefor which GC is the ideal technique. It is this type of multicomponentmixtures containing very similar compounds that need the highefficiencies available from GC for a successful analysis. The separation ofa sample of gasoline carried out on a long open tubular column is shownin figure 35. It is clear that the column had a very high efficiency whichwas claimed to be in excess of 400,000 theoretical plates. The columnwas 100 m long and only 250 mm I.D., carrying a film of the stationaryphase, Petrocol DH, 0.5 mm thick. Petrocol DH is specially designedstationary phase for the separation of hydrocarbons and consists ofbonded dimethylsiloxane, a very dispersive type of stationary phase,retaining the solutes approximately in the order of their increasingboiling points.
Nonpolar or dispersive stationary phases are employed for theseparation of hydrocarbons (e.g. OV101, which is also a polyalkyl-siloxane, is widely used in packed columns). The flow velocity of 20cm/sec., appears to have been taken from the ratio of the column lengthto the dead time. Thus, due to the pressure correction the actual effectivelinear velocity would be much less than that (see Book 7 Peak
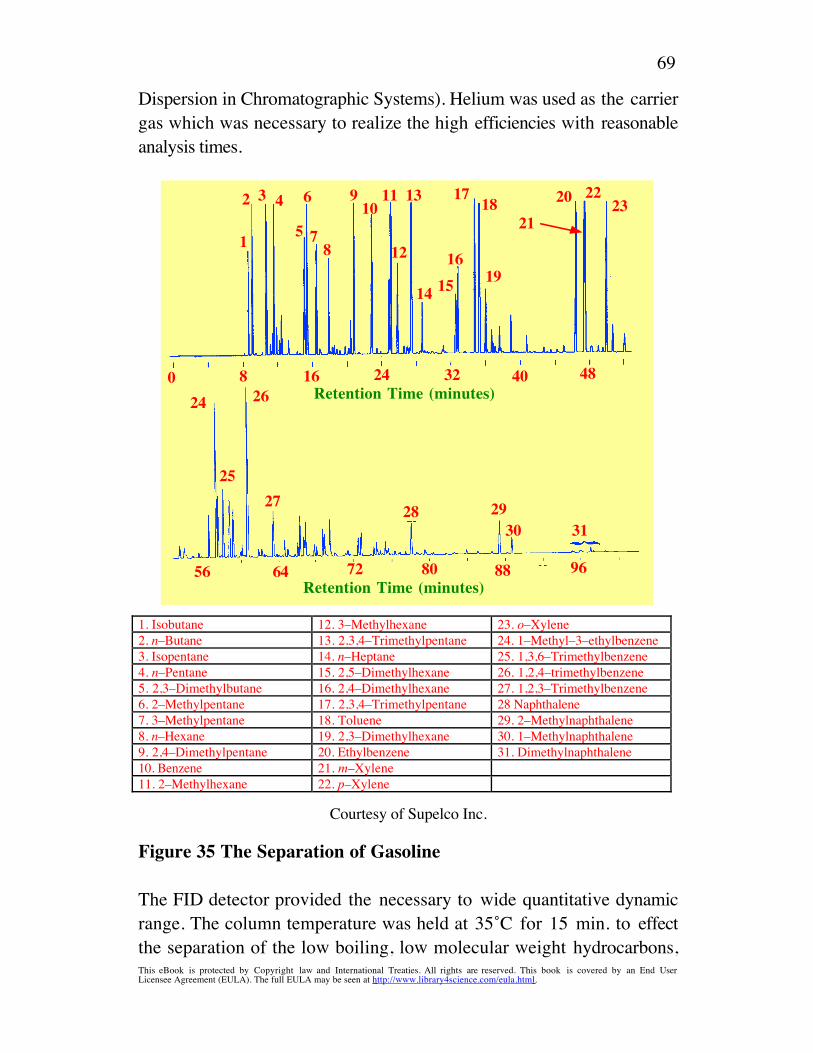
This eBook is protected by Copyright law and International Treaties. All rights are reserved. This book is covered by an End UserLicensee Agreement (EULA). The full EULA may be seen at http://www.library4science.com/eula.html .
69
Dispersion in Chromatographic Systems). Helium was used as the carriergas which was necessary to realize the high efficiencies with reasonableanalysis times.
0 8 16 24 32 40 48
56 64 72 80 88 96Retention Time (minutes)
Retention Time (minutes)24
25
26
27 28 2930 31
1
2 3 4
5
6
78
910
11
12
13
14 1516
17 18
19
2021
2223
1. Isobutane 12. 3–Methylhexane 23. o–Xylene2. n–Butane 13. 2,3,4–Trimethylpentane 24. 1–Methyl–3–ethylbenzene3. Isopentane 14. n–Heptane 25. 1,3,6–Trimethylbenzene4. n–Pentane 15. 2,5–Dimethylhexane 26. 1,2,4–trimethylbenzene5. 2,3–Dimethylbutane 16. 2,4–Dimethylhexane 27. 1,2,3–Trimethylbenzene6. 2–Methylpentane 17. 2,3,4–Trimethylpentane 28 Naphthalene7. 3–Methylpentane 18. Toluene 29. 2–Methylnaphthalene8. n–Hexane 19. 2,3–Dimethylhexane 30. 1–Methylnaphthalene9. 2,4–Dimethylpentane 20. Ethylbenzene 31. Dimethylnaphthalene10. Benzene 21. m–Xylene11. 2–Methylhexane 22. p–Xylene
Courtesy of Supelco Inc.
Figure 35 The Separation of Gasoline
The FID detector provided the necessary to wide quantitative dynamicrange. The column temperature was held at 35˚C for 15 min. to effectthe separation of the low boiling, low molecular weight hydrocarbons,

This eBook is protected by Copyright law and International Treaties. All rights are reserved. This book is covered by an End UserLicensee Agreement (EULA). The full EULA may be seen at http://www.library4science.com/eula.html .
70
the temperature was then increased to 200˚C at 2˚C/min. and finally heldat 200˚C for 5 min. to ensure the complete elution of the higher boilingcomponents.
An excellent separation is obtained giving clearly separated peaks for themarker compounds which are of importance in fuel evaluation.Nevertheless, due to the complexity of the sample, exceedingly highefficiencies were necessary and so, the analysis time was about 100 min.Long analysis times are directly related to the use of long columns Thecomplete analysis was carried out using only 0.1 ml of gasoline with asplit of 100:1 at 250˚C (ca 1 mg) confirming the remarkable sensitivity ofthe FID for general analysis.
High Temperature GC Stationary Phases
The major limitation of gas chromatography is the stability of thestationary phase at high temperatures. The higher the polarity and thehigher the molecular weight of the solutes, the higher the temperaturenecessary to provide adequate solute partial vapor pressure to allow agas chromatographic separation to be realized. Similarly, the stability ofthe solutes at high temperature can also become a problem. The solutemust be thermally stable so that the partial pressure is sufficiently high toallow elution in a reasonable time. Nothing can be done with respect tothe solute stability as this is determined by the nature of the sample.
There are certain materials hat can be used as stationary phases atremarkably high temperatures. These materials are based on thepolymerization of carborane substituted siloxanes. An example of theempirical formula of a carborane silicone polymer is as follows,
Si Si
R
RR
R
CCB H O1 01 0
n
where CCB H1 01 0 represents the meta–carborane nucleus.

This eBook is protected by Copyright law and International Treaties. All rights are reserved. This book is covered by an End UserLicensee Agreement (EULA). The full EULA may be seen at http://www.library4science.com/eula.html .
71
There are three commonly used carborane stationary phases, The first adispersive phase, Dexsil 300 where the carboranes are linked with amethylsilicone polymer and can be used up to a temperature of 450˚C(an exceedingly high temperature for chromatographic separations).Some induced polarizability has been introduced into the carboranepolymer by employing a methyl phenyl silicone and this resulted in thesecond carborane having intermediate polarity that can be operated upto a temperature of 400˚C. The introduction of a phenyl group makes itslightly less thermally stable. The third and most polar carborane isDexsil 410 that contains methyl, b–cyanoethyl silicone (the polaritybeing contributed by the cyano group) which can be used up to 375˚C.
0 10 20 30 40Retention Time (minutes)
Det
ecto
r Out
put
Courtesy of Mr. Andrew Lynn of the Dexsil Corporation
Figure 36 The Separation of a High Molecular WeightHydrocarbon Wax on a High Temperature Stationary Phase
As would be expected the more polar the stationary phase the lower thetemperature stability. An example of the use of Dexsil 400 to separatesome very high boiling waxes is shown in figure 36. The column wasprogrammed from 50˚C to 380˚C at 4˚C /min. and held at 380˚C for 6.5min. The carrier gas flow rate was 30 ml/min. The wax components are

This eBook is protected by Copyright law and International Treaties. All rights are reserved. This book is covered by an End UserLicensee Agreement (EULA). The full EULA may be seen at http://www.library4science.com/eula.html .
72
well resolved and the baseline appears very stable even a 380˚C. Thestable base line, with no drift, indicates there is little or no decompositionof the solutes or the stationary phase, even at 380˚C. Stationary phasesbased on the carborane structure, can extend the temperature range ofgas chromatography very significantly, However, having thermally stablestationary phases solves only half the problem, the solutes themselvesmust be equally stable.
Hydrocarbon Analysis
Due to the perceived toxicity and carcinogenic character of the aromatichydrocarbons, the presence of these materials is carefully monitored inall areas where they might enter the human food chain. The analysis ofwater for aromatic hydrocarbons, particularly surface water in thoseareas where contamination might take place, is a common assay madeby the public analyst. It is essential to be able to measure concentrationsin the ppb levels, and thus GC method employing a high sensitivedetector is essential. Nevertheless, even if a high sensitivity detector isemployed, some sample concentration will be necessary to measurecontaminants at such low levels.
Quartz WoolQuartz Wool
1.2 cm Carbopack B7 cm of Carbopack C
Helium
Sample
Figure 37. Purge and Trap System for Aromatic Hydrocarbons inWater

This eBook is protected by Copyright law and International Treaties. All rights are reserved. This book is covered by an End UserLicensee Agreement (EULA). The full EULA may be seen at http://www.library4science.com/eula.html .
73
One method is the purge and trap procedure, using a solid adsorbent toremove the hydrocarbon vapors. A diagram of the purge and trapsystem is shown in figure 37. A 5 ml sample of spiked water was placedin a small vial through which a stream of helium was passed at a flowrate of 40 ml/min. The purge was carried out at room temperature for11 min.
After bubbling through the sample, the helium passed through a stainlesssteel adsorption tube, 1/8 in. diameter having a 7 cm length packed withCarbopack C and a 1.2 cm length packed with Carbopack B. CarbopackC is 20/40 mesh, graphitized carbon, having a surface area of 10 m2/gand the short length of Carbopack B packing had a surface area of about100 m2/g.
The short length of packing with the higher surface area (thus highadsorptive capacity) was to used to ensure that none of the samplematerial was eluted through the adsorption bed and lost. The sample vialwas then removed and the trap purged dry with 40 ml/min. of dryhelium for 5 min. The trap was then transferred to a small heating ovenand the contents desorbed onto the column at 250˚C with a 4 min. bakeat 260˚C. A chromatogram of the separation that was obtained is shownin figure 38.
The open tubular column used was 60 m long, 0.75 mm I.D. carried a 1mm film of the stationary phase Supelcowax 10. This stationary phase isstrongly polar and corresponds to a bonded polyethylene glycol. Thestrong fields from the hydroxyl groups polarize the aromatic nuclei ofthe aromatic hydrocarbons and thus retention was effected largely bypolar interactions between the permanent and induced dipoles of thestationary phase and solute molecules respectively.
The flow rate was 10 ml/min. in conjunction with the FID detector. Thecolumn was held at 50˚C for 8 min. and then programmed to 100˚C at4˚C per min. More than adequate separation is achieved and even the mand p xylenes are well resolved. This might indicate that a significantlyshorter analysis was possible. The aromatic hydrocarbons were present

This eBook is protected by Copyright law and International Treaties. All rights are reserved. This book is covered by an End UserLicensee Agreement (EULA). The full EULA may be seen at http://www.library4science.com/eula.html .
74
in the original aqueous solution at 10 ppb and so the 5 ml of watercontained about 50 pg. of each aromatic hydrocarbon.
0 4 8 12 16Retention Time (minutes)
Methanol
Benzene
Toluene
Ethylbenzene
p– Xylenem– Xylene
o– Xylene
Courtesy of Supelco Inc.
Figure 38 The Separation of 10 ppb Quantities of AromaticHydrocarbons from Water
Essential Oils
Without the use of gas chromatography the analysis of essential oilswould be extremely difficult. Prior to the technique being developed,only the major components of the oils could be separated, achieved bydistillation with high efficiency columns. Even so, such columns rarelycontained more than 100 theoretical plates (distillation plates), were veryslow in operation, and took many days to complete an analysis. Due tothe limited separation efficiency of the distillation column, even the majorcomponents were contaminated with traces of materials, many of whichhad strong olfactory intensity and thus confused the olfactory characterof the major component. The gas chromatograph had a startling impacton the essential oil industry. Not only was the complex nature of the rawmaterials disclosed for the first time, but the character of each pure

This eBook is protected by Copyright law and International Treaties. All rights are reserved. This book is covered by an End UserLicensee Agreement (EULA). The full EULA may be seen at http://www.library4science.com/eula.html .
75
individual components could be accurately ascertained by olfactoryassessment of the eluted peaks (using a non destructive detector such asthe katherometer, and smelling them).
The first separations of essential oils were carried out on packed columnsthat provided limited efficiency but, nevertheless represented atremendous advance on distillation. The introduction of the technique oftemperature programming improved the separation even more.However, it was not until the capillary column, with its many thousandsof theoretical plates, became commercially available that the truecomplex nature of many of the essential oils was revealed. The chemicalstructure of the individual components of many of the oils, elucidated bythe GC/MS tandem systems, provided the knowledge necessary tosynthesize a number of commercially important synthetic flavors. Forexample, the synthetic flavors that closely imitate those of the peach,melon and other fruits that are presently available to the contemporaryfood chemist are a direct result of the separating capabilities of gaschromatography.
An example of the separation of lime oil employing modern GCtechniques is shown in figure 39. The separation was carried out on aSB–5 column, that contained poly(5%diphenyl-95%–dimethylsiloxane)as the stationary phase. Although the diphenyl group will contributesome induced polarizability capability to interact with polar solutes, it islargely a dispersive stationary phase, and thus substances are elutedroughly in order of their boiling points (excepting very polar solutes).The introduction of the diphenyl groups contributes more to phasetemperature stability than it does to solute selectivity. The column was30 m long, 250 mm I.D. carrying a film 0.25 mm thick of stationaryphase. Helium was used as the carrier gas at a linear velocity of 25cm/sec(set at 155˚C).
The column was held isothermally for 8 min. at 75˚C and thenprogrammed up to 200˚C at 4˚c/min. and finally held at 200˚C for 4min. The sample volume was 0.5 m l which was split at 100:1 ratioallowing about 5 mg to be placed on the column. It is seen from figure 5that a very good separation is obtained that convincingly confirms the

This eBook is protected by Copyright law and International Treaties. All rights are reserved. This book is covered by an End UserLicensee Agreement (EULA). The full EULA may be seen at http://www.library4science.com/eula.html .
76
complex nature of the essential oil. In practice, however, the net flavor orodor impact can often be achieved by a relatively simple mixture ofsynthetic compounds.
0 4 8 12 16 20 24 28 32
Retention Time (minutes)
1
2
345 76 8
9
10
11
1213
1415
1617
18
1. a–Pinene 7. g–Terpinene 13. Geraniol2. Camphene 8. Terpinolene 14. Neryl Acetate3. b–Pinene 9. Linalool 15. Geranyl Acetate4. Myrcene 10. Terpinene–4–ol 16. Caryophyllene5. p–Cymene 11. a–Terpineol 17.trans–a–Bergamotene6. Limonene 12. Neral 18. b–Bisabolen
Courtesy of Supelco Inc.
Figure 39 A Chromatogram of Lime Oil
The Identification of Bacteria by Their Volatile Fatty Acid Profiles.
The bacteria genus clostridium are rod shaped and found largely in soil.

This eBook is protected by Copyright law and International Treaties. All rights are reserved. This book is covered by an End UserLicensee Agreement (EULA). The full EULA may be seen at http://www.library4science.com/eula.html .
77
0 2 4 6 8 10
0 2 4
6
0 2 4 6
2
2
4
24
6
8
3
1
3
5
1
3
5
7
Retention Time (minutes)
Retention Time (minutes)
1. Formic Acid2. Acetic Acid3. Propionic Acid4. Isobutyric Acid5. n-Butyic Acid6. Isovaleric Acid7. n–Valeric Acid8. Isocaproic Acid
Clostridium difficile
Clostridium Subterminale Veillonellasp.
Courtesy of Supelco Inc.
Chromatogram provided to Supelco by K.J. Hauser, Department of Pathology, MountSinai Medical Center, Milwaukee, WI.
Figure 40 Volatile Fatty Acid Profiles from Different Bacteria.

This eBook is protected by Copyright law and International Treaties. All rights are reserved. This book is covered by an End UserLicensee Agreement (EULA). The full EULA may be seen at http://www.library4science.com/eula.html .
78
Among these germs are those that can cause some of the most deadlydiseases in man, such as tetanus (clostridium tetani) botulism,(clostridium botulinum) and gas gangrene, the deadly killer of woundedsoldiers in the trench warfare of the first world war. The clostridiumbacteria are particularly dangerous as they are very resistant to heat andthus all materials with which they may come in contact must becarefully sterilized. Samples are prepared using the following procedure.2 ml of the acidified culture is placed in a conical centrifuge tube and 1ml of diethyl ether added. The tube is sealed and well mixed and thencentrifuged to break up the emulsion. The ether layer is pipetted fromthe tube and anhydrous sodium sulfate added. The mixture then isallowed to stand for about 10 min. to remove all traces of water. Anappropriate volume of the dry ether extract is injected onto the column.An example of the fatty acid profiles for three different types of bacteriaare shown in figure 40, two of which are clostridium. A packed columnwas employed carrying a 15 % loading of a proprietary stationary phaseand 1% of phosphoric acid supported on 100/120 Chromosorb W AW,a processed diatomite. The column was made of glass, 6 ft long, 4 mmI.D. and operated isothermally at 145˚C. Helium was used as the carriergas at a flow rate if 60 ml/min. and 15 ml of the ether extract wasinjected onto the column. The three different types of bacteria gave quitedifferent volatile fatty acid profiles. Furthermore it would appear that theacid profile; could be used as a means of identification.
Chiral Separations
An example of a chromatogram of a test mixture used by Supelco todemonstrate the chromatographic characteristics of their a-DEX columnis shown in figure 41. The stationary phase is claimed to have a highshape selectivity for positional isomers (e.g. xylenes, menthols, cresolsetc.) and the small internal cavity of the permethylated a-cyclodextringives it a rigid character and unique chiral selectivities. The use of thedifferent solutes illustrates the retentive character of the stationary phase.The relative elution times of the normal paraffins (which are solelyretained by dispersive interactions with the stationary phase) indicate amoderate dispersive character, but it is interesting to note that thepropane diols are eluted between the C10 and C11 hydrocarbons. This

This eBook is protected by Copyright law and International Treaties. All rights are reserved. This book is covered by an End UserLicensee Agreement (EULA). The full EULA may be seen at http://www.library4science.com/eula.html .
79
indicates that the C3 chain alcohol is retained by polar forces to analmost equivalent extent as the C11 hydrocarbon retained by dispersionforces only. This implies a fairly strong overall polar character to thestationary phase. It is also seen that the m and p xylenes are wellseparated showing good spatial selectivity and the separation of diolenantiomers good chiral selectivity.
1 2
3
4
5 6 7
1. n-Nonane2. p-Xylene3. m-Xylene4. n-Decane5. (+)-1,2-Propanediol6. (-)-1,2-Propanediol7. n-Undecane
0 2 4 6 8 10 12 14Time (minutes)
Courtesy of SupelcoThe a-DEX™ column was 30 m long, 0.25 mm I.D., carrying a film of stationaryphase 0.25 mm thick. The temperature was 90˚C and the helium flow velocity was 30cm/s. Figure 41 Chromatogram of a Test Mixture for a Permethylateda-Cyclodextrin Stationary Phase
As the two enantiomers are strongly polar it would also appear that thegreater retention of the (–)-1,2-propane diol was due to polar interactionsbetween the OH groups with the neighboring polar moieties on the a-cyclodextrin.
Liquid Chromatography Applications
Liquid chromatography lends itself particularly to the separation ofhighly polar and large molecular weight materials that have very low

This eBook is protected by Copyright law and International Treaties. All rights are reserved. This book is covered by an End UserLicensee Agreement (EULA). The full EULA may be seen at http://www.library4science.com/eula.html .
80
volatility and, thus, can not be separated by gas chromatography. Inaddition, however, the technique is also used in trace analysis (e.g., drugsand drug metabolites in blood) where a concentration procedure isnecessary and the sample is eventually regenerated in a small volume ofliquid that can be injected directly onto an LC column. In general, thesample is passed through a short length of tube packed with anadsorbent which selectively removes the material of interest. Theadsorbent is then washed and the adsorbed material extract with a smallamount of suitable solvent and the solvent then inject onto the column.
An example of the use of this technique is in the determination oftetrahydrocannabinol carboxylic acid in urine. This substance appears inthe urine of those subjects that have recently smoked marihuana. Thetetrahydrocannabinol carboxylic acid can be extracted from the urine bymeans of a solid state extraction cartridge packed with a C18 reversephase (a strongly dispersive packing containing bondedoctyldecyldimethyl chains). The urine sample can be used direct, withoutpretreatment and the materials of interest are irreversibly adsorbed onthe reverse phase solely by dispersive interactions. The actual procedurefor extracting the tetrahydrocannabinol carboxylic acid according toSupelco is as a follows (1).
5 ml of urine was diluted with 5 ml of water and 0.5 ml of 10Mpotassium hydroxide and placed in a silanized glass tube. Note the tubewith a non-polar wall was used to ensure that none of the acid wasadsorbed on the hydroxyl groups of the glass. The tube was heated to60oC for fifteen minutes and then cooled to room temperature. Thesample was then adjusted to a pH of 4.5 with acetic acid. The C18reversed-phase in the extraction tube was pre-conditioned with a mixtureof 2 ml of methanol and 1 ml of 1% acetic acid. The hydrolyzed samplewas allowed to percolate slowly through the tube by dropwise addition.The tube packing was then washed twice with 1 ml of a 20% aqueoussolution of acetone, once with 1.5 ml aqueous 0.01M KH2PO4 , oncewith 0.5 ml of aqueous 0.01M Na2HPO4 and finally 0.5 ml of 1%aqueous acetic acid. The sample was then slowly desorbed from thereversed-phase with 1 ml of pure methanol and collected in a silanized
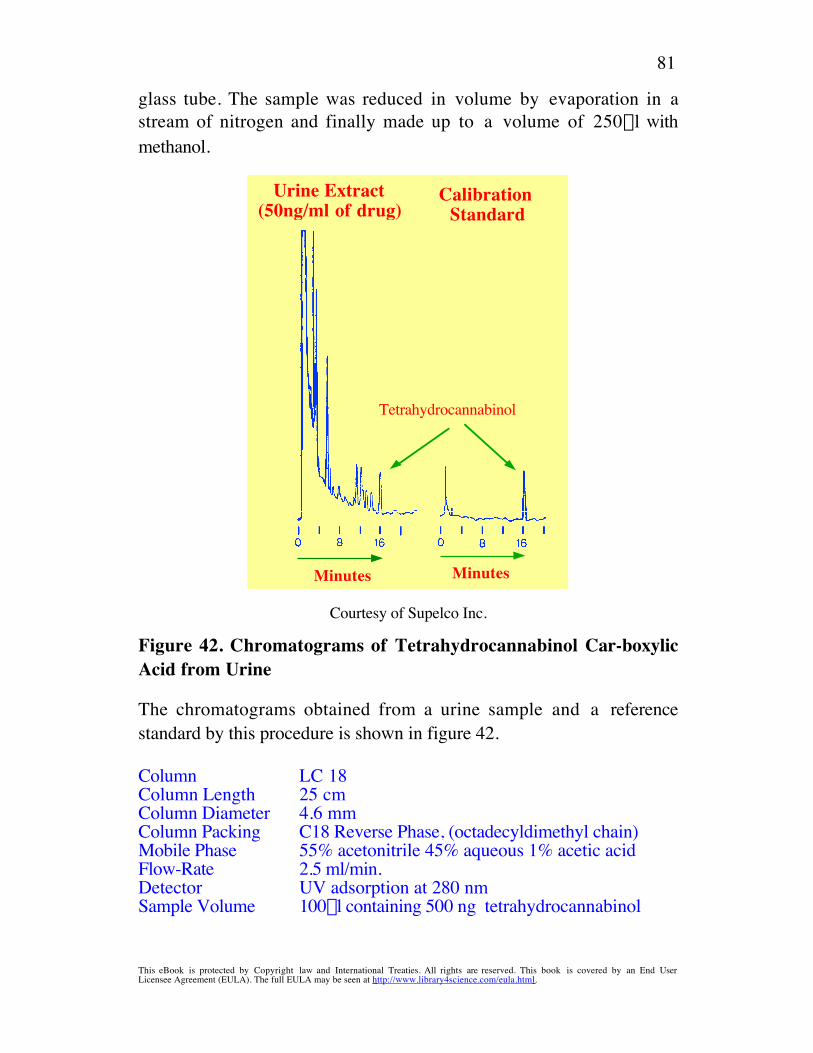
This eBook is protected by Copyright law and International Treaties. All rights are reserved. This book is covered by an End UserLicensee Agreement (EULA). The full EULA may be seen at http://www.library4science.com/eula.html .
81
glass tube. The sample was reduced in volume by evaporation in astream of nitrogen and finally made up to a volume of 250ml withmethanol.
Urine Extract (50ng/ml of drug)
Calibration Standard
Tetrahydrocannabinol
MinutesMinutes
Courtesy of Supelco Inc.
Figure 42. Chromatograms of Tetrahydrocannabinol Car-boxylicAcid from Urine
The chromatograms obtained from a urine sample and a referencestandard by this procedure is shown in figure 42.
Column LC 18Column Length 25 cmColumn Diameter 4.6 mmColumn Packing C18 Reverse Phase, (octadecyldimethyl chain)Mobile Phase 55% acetonitrile 45% aqueous 1% acetic acidFlow-Rate 2.5 ml/min.Detector UV adsorption at 280 nmSample Volume 100ml containing 500 ng tetrahydrocannabinol

This eBook is protected by Copyright law and International Treaties. All rights are reserved. This book is covered by an End UserLicensee Agreement (EULA). The full EULA may be seen at http://www.library4science.com/eula.html .
82
This is a typical application for liquid chromatography using solid phaseextraction cartridges. It is seen that the tetrahydrocannabinol carboxylicacid is clearly and unambiguously separated from the contaminatingmaterials with an extraction efficiency of over 90%.
Another example employing a similar technique is the determination ofthe tricyclic antidepressant drugs in blood serum (13). The solid phaseadsorbent used in this extraction is a weak ion exchanger and thematerial is preconditioned with a wash of 0.5 ml of 0.5M phosphoric acidfollowed by 1 ml of deionized water. A volume of 0.5 ml of the serumcontaining the tricyclic antidepressant drug standards is mixed with 0.5ml of deionized water and allowed to percolate slowly through thepacking. As in the previous example the drugs are held on the ionexchanger whereas the sample matrix materials pass through. Thepacking is then washed with 0.5 ml of 1.0M aqueous ammoniumhydroxide and then two, 1 ml aliquots of 5% methanol in water. Thesample is then desorbed by two separate aliquots of 1 ml of 0.22Mammonium hydroxide in pure methanol. Finally, the sample is collectedin a silanized glass tube and the solvent removed by evaporation understream of dry nitrogen. The volume of the sample is then made up to250 ml and 100 ml placed on the column. The separation obtained isshown in figure 43. The separation was carried out using an LC-PCNcolumn packed with a bonded phase carrying cyanopropylmethylmoieties on the surface. Thus, in contrast to the extraction process,which appears to be based on ionic interactions with the weak ionexchange material, the LC separation appears to be based on a mixtureof interactions. There will be dispersive interactions of the drugs with thehydrocarbon chains of the bonded moiety and also weakly polarinteractions with the cyano group. It is seen that the extractionprocedures are very efficient and all the tricyclic antidepressant drugs areeluted discretely.
An example of the use of native silica is in the analysis of Darvocet® andits generic equivalent formulation. The separation obtained is shown infigure 44. Darvocet® is an acetaminophen product of whichacetaminophen itself is the active ingredient together with other weakly

This eBook is protected by Copyright law and International Treaties. All rights are reserved. This book is covered by an End UserLicensee Agreement (EULA). The full EULA may be seen at http://www.library4science.com/eula.html .
83
polar substances present. Consequently, the mixture lends itself toseparation on silica gel. The analysis was completed in less than 4minutes using a short column 3.3 cm long and 4.6 mm in diameter.
1/ Trimipidine (int.Std.) 2/ Doxepin 3/ Amitriptyline 4/ Imipramine 5/ Desmethyldoxepin 6/ Nortriptyline 7/ Desipramine 8/ Protriptyline (int. std.)
Minutes
Courtesy of Supelco Inc.
Figure 43 Chromatogram of the Tricyclic Antidepressant Drugsfrom Blood Serum
The chromatographic conditions were as follows.
Column LC-PCNColumn Length 25 cmColumn Diameter 4.6 mmColumn Packing C18 Reverse Phase, (cyanopropile chain)
Column Temperature 30oCMobile Phase 25%0.01M potassium phosphate (adjusted to pH 7 with
85% phosphoric acid)60% acetonitrile and 15%methanol
Flow-Rate 2 ml/min.Detector UV adsorption at 215 nmSample Volume 100ml

This eBook is protected by Copyright law and International Treaties. All rights are reserved. This book is covered by an End UserLicensee Agreement (EULA). The full EULA may be seen at http://www.library4science.com/eula.html .
84
The silica packing had a particle size of 3 m providing a maximumefficiency of about 5,500 theoretical plates. The column appears to besignificantly overloaded in order to identify the impurities, Nevertheless,the impurities were well separated from the main component and thepresence of a substance was demonstrated in the generic formulationthat was not present in the Darvocet®.
ImpurityImpurity
Propoxyphene
Acetaminophen Acetaminophen
Impurity
Propoxyphene
Impurity
Impurity in Generic Formulation Only
42 2Minutes Minutes
0 0
Darvocet® Generic Formulation
4
Courtesy of Supelco Inc.
Figure 44 The Analysis of Acetaminophen Formulations
The mobile phase consisted of a mixture of 98.5% dichloromethane with1.5% v/v of methanol containing 3.3% ammonium hydroxide. Theammoniacal methanol deactivated the silica gel but the interaction of thesolutes with the stationary phase would still be polar in nature. Incontrast solute interactions with the methylene dichloride would beexclusively dispersive. The separation of some steroid hormones isanother example of the use of silica gel as an interactive stationary phasethe separation obtained is shown in figure 45. The column was 25 cmlong, 4.6 mm in diameter, and packed with silica gel particle (particlediameter 5 mm) which gave a maximum efficiency at the optimum

This eBook is protected by Copyright law and International Treaties. All rights are reserved. This book is covered by an End UserLicensee Agreement (EULA). The full EULA may be seen at http://www.library4science.com/eula.html .
85
velocity of 25,000 theoretical plates. The mobile phase consisted of 76%v/v n-hexane and 24% v/v 2-propyl alcohol at a flow-rate of 1.0 ml/min.
SolventCortisol
Corticosterone
6-b-Hydroxycorttisol
Dexamethasone
triamcinolone, (int. std.)
Deoxycorticosterone
Courtesy of Supelco Inc.(Supplied to Supelco by Dr. S. N. Rao and Prof. M. Okamato, Cornell University
Medical College, New York)
Figure 45 The Separation of Steroid HormonesThe steroid hormones are mostly weakly polar, consequently, theseparation on silica gel, will be based primarily on polarity. The silica,however, was heavily deactivated by a relatively high concentration ofthe moderator 2-propyl alcohol and thus the silica gel surface would becovered with isopropanol and thus the interacting surface would bevirtually pure 2-propyl alcohol. Whether the interaction is by sorption ordisplacement is difficult to determine. It is likely that the early peaksinteracted by sorption and the late peaks possibly by displacement.
Ionic Interaction Chromatography
Ionic interaction chromatography, or ion chromatography as it is usuallycalled, is typically carried out employing ion exchange resins as thestationary phase. There are some silica based ion exchange materials

This eBook is protected by Copyright law and International Treaties. All rights are reserved. This book is covered by an End UserLicensee Agreement (EULA). The full EULA may be seen at http://www.library4science.com/eula.html .
86
available, but the bonded silicas tend to be unstable in the presence ofhigh salt concentrations and at extremes of pH. As a consequence, theyhave very limited areas of application. Alternatively, the polystyrenedivinyl benzene cross-linked polymers, are extremely stable to a widerange of salt concentrations and can function well within the pH range of2.0 to 12.0. An obvious application area for ion exchangechromatography is in the separation of all types of anions and cations.Metal cations and inorganic anions are all separated predominantly byionic interactions with an ion exchange resin. Organic acids and bases,however, would be retained by mixed interactions, as dispersive andpolar interactions will take place between the solute molecules and thearomatic nuclei and the aliphatic side chains of the polymer base.
CH2CH2
Minutes
CN NCH2 H2++
Paraquat
2Cl
N N
2Cl
Diquat
+ +
Courtesy of Asahi Chemical Industry Co. Ltd.
Figure 46 The Separation of the Herbicides Diquat and Paraquat
The separation of simple acids and bases require that the mobile phase isbuffered appropriately according to the pKa of the salts so thatdissociation occurs and the ions are free to interact with the stationaryphase. By employing mobile phase additives and using novel operating

This eBook is protected by Copyright law and International Treaties. All rights are reserved. This book is covered by an End UserLicensee Agreement (EULA). The full EULA may be seen at http://www.library4science.com/eula.html .
87
conditions, ionic interactions can be used to separate a far wider range ofmaterials than simple organic and inorganic anions and cations. Anexample of the use of ion interactions to separate the non-selectivecontact herbicides Diquat and Paraquat is given in figure 46. Thecolumn was fairly large (10 cm long and 7.6 mm in diameter) and waspacked with cross-linked polystyrene beads, 9 mm in diameter, carrying -COOH groups as the interacting ion moieties. At the optimum flow ratethe column would give about 5,500 theoretical plates but at the flow-rateused which was 1 ml/min. the efficiency would be considerably belowthat. Nevertheless, it is clear that a very good separation was obtained.An example of the use of a C18 reverse phase column that separatessubstances purely on the basis of dispersive interactions is shown infigure 47. The packing is incorporated in a short column 3.3 cm long,4.6 mm in diameter and packed with particles 3 mm in diameter. Theexample of its use is in the separation of mixture of growth regulators
The efficiency expected from such a column when operated at theoptimum velocity would be about 5,500 theoretical plates. This is not aparticularly high efficiency and, as a consequence, the separation reliedheavily on the phases selected and the gradient employed. The separationwas achieved by a complex mixture of competitive interactions, ionicand dispersive interactions between the solutes and the stationary phaseand ionic, polar and dispersive between the solutes and the mobile phase.The gradient started with an initial solvent mixture of 1% acetic acid and1 mM tetrabutyl ammonium phosphate buffered to a pH of 2.8. Initiallythe tetrabutyl ammonium salt would be adsorbed strongly on the reversephase and thus acted as an adsorbed ion exchanger. During the program,acetonitrile was added to the solvent and initially this increased thedispersive interactions between the solute and the mobile phase.
As the acetonitrile concentration increased, however, the concentrationof adsorbed tetrabutyl ammonium salt would also be reduced and itwould be eluted from the reverse phase with a resulting reduction in theionic interactions of the solutes with the stationary phase. At higherconcentrations of acetonitrile, the tetrabutyl ammonium salt would be

This eBook is protected by Copyright law and International Treaties. All rights are reserved. This book is covered by an End UserLicensee Agreement (EULA). The full EULA may be seen at http://www.library4science.com/eula.html .
88
completely removed and the interactions of the solutes with thestationary phase would become almost exclusively dispersive.
1/ 6-Benzylaminopurine riboside (445ng)2/ Indole-3-acetic acid (222ng)3/ Ascisic acid (222ng)4/ a-Naphthalene acetamide (222ng)5/ Colchicine (555ng)6/ Indole-3-propanoic acid (333ng)7/ p-chlorophenoxy acetic acid (333ng)8/ Indole-3-butyric acid (333ng)9/ a-Naphthalene acetic acid (333ng)10/ b-Naphthalene acetic acid (333ng)11/ 2,4-Dichlorophenoxy acetic acid (555ng)12/ Indole-3-acetic acid ethyl ester (445ng)13/ 2,4,5-Trichlorophenoxy acetic acid (555ng)
Courtesy of Supelco Inc.
Figure 47 The Separation of a Mixture of Growth Regulators on aC18 Reverse Phase C18 Column
This is an example where the phase system is complex and is required tobe so, because limited column efficiency demanded clever phase selectionto obtain the necessary differential retention.
Another liquid chromatography application that involves some novelderivatization is the separation of some 'b blockers', the enantiomers ofpropranolol, metroprolol and atenalol as fluorescent enhanced derivativeson cellulose tris(3,5–dimethylphenylcarbamate) coated on silica gel. This

This eBook is protected by Copyright law and International Treaties. All rights are reserved. This book is covered by an End UserLicensee Agreement (EULA). The full EULA may be seen at http://www.library4science.com/eula.html .
89
technique was developed by Yang et al. [14] and involved the synthesisof their fluorescent derivatives, which were formed by reacting themwith an electrophilic fluorogenic reagent, 4-(N-chloroformethyl-N-methylamino-7-N-N–dimethylaminosulfonyl-2, 1, 2–benzoxydiazole(DBD-COCl). These derivatives show intense fluorescence at longexcitation wavelengths (450Ex and 560Em nm) and thus significantlyreduce the level of detection. It was found that Propranolol, Metoprololand Atenolol, three very commonly used b blockers, reacted directlywith reagent forming 1:1 adducts by reaction with the secondary aminogroup of the b-blockers. The DBD-COCl reagent reacted readily withthe drugs under mild conditions, with no catalyst, and the reaction wasrelatively fast and was complete in about 5 min. The initial separationwas carried out on a TSKgel ODS-80T column, 15 cm long, 4.6 mmI.D., packed with 5 mm particles. The solvent gradient used to developthe separation commenced with 50% aqueous solution of acetonitrilewhich was increased to 80% acetonitrile over a period of 40 min. forPropanolol; from 40% to 48% over 15 min. and the increasing to 100%at 30 min. for Metroprolol and from 33% to 42% in 10 min. and then to100% at 60 min. for Atenolol.
0 10 2030 0 1020 30 400 1020 30 40Time (minutes)
A B C
12 x
1
2
x
1
2x
Fluo
resc
ence
Inte
nsity
Courtesy of the Royal Society of Chemistry, Ref. [14]
Figure 48 The Separation of Derivatized Propranolol (Pro)Metroprolol (Met) and Atenolol (Ate)

This eBook is protected by Copyright law and International Treaties. All rights are reserved. This book is covered by an End UserLicensee Agreement (EULA). The full EULA may be seen at http://www.library4science.com/eula.html .
90
The separations obtained are shown in figure 48. Peak 2 represents theDBD derivative of each drug, peak 1 DBD-COOH and peak x wasascribed to the anhydride produced by the reaction of DBD–COCl withDBD–COOH. The drug derivatives were collected and then subjected toseparation on a chiral column. CHIRACEL OD-R (a cellulose carbamate)and CHIRACEL OJ-R (a cellulose ester) were used as stationary phasesto separate the individual enantiomers. The enantiomers of the DBD–Prowere well separated on the CHIRACEL OD-R column. However, theDBD–Met enantiomers could not be separated on the CHIRACEL OD-R column but were well separated on the CHIRACEL OJ-R column aswere the DBD–Ate isomers. The separation of the DBD–Met andDBD–Ate isomers are shown in figure 49 (chromatogram A, DBD–Metand chromatogram B, DBD–Ate).
0 10 20 0 10 20Time (minutes)
Fluo
resc
ence
Inte
nsity
A B
DBC–(S)–Ate
DBD–(R)–Ate
DBC–(S)–Met
DBD–(R)–Met
Courtesy of the Royal society of Chemistry, Ref. [12]
Figure 49 The Separation of Derivatized Metoprolol and Atenololat High Sensitivity
Each enantiomeric pair represents 50 pmol of the original drug. Theseparation was carried out on the CHIRACEL OJ-R column (15 cmlong, 4.6 mm I.D., packed with particles 5 mm in diameter coated with

This eBook is protected by Copyright law and International Treaties. All rights are reserved. This book is covered by an End UserLicensee Agreement (EULA). The full EULA may be seen at http://www.library4science.com/eula.html .
91
the cellulose ester. The mobile phase used for the separation ofDBD–Met was methanol/acetonitrile : 90/10 v/v, at a flow rate of 0.5ml/min., the separation ratio was 1.33. The mobile phase used for theseparation of DBD–Ate was methanol, also at a flow rate of 0.5 ml/min.,the separation ratio being 1.53. The excitation wavelength was 450 nmand the emission wavelength was 560 nm. The fluorescent derivativeswere found to be stable at 4˚C for over 1 week. The detection limits at asignal-to-noise ratio of 3 were 50 fmol for both (S)- and (R)-Propanolol,12 and 17 fmol for (S)- and (R)-Metroprolol respectively and 15 and 20fm for (S)- and (R)-Atenolol respectively.
The cyclodextrin based stationary phases are some of the more popularand effective chiral stationary phases presently available. One of theirdistinct advantages lies in their unrestricted and successful use with alltypes of solvent. In particular, they can be used very effectively in thereversed phase mode (a method of development that is not possible withsome other chiral stationary phases) as well as being very effective in anormal phase conditions. They can also be used in the so-called polarorganic mode, where the polar constituents of the mobile phase can beanhydrous diethylamine or glacial acetic acid, but in the completeabsence of water. The cyclodextrins and their derivatives are widely usedfor all types of chiral separations, they have a good sample capacity, andcan often be used for preparative separations. Cyclodextrin-based phasesare readily available, usually covalently bonded to spherical silica gelparticles 5 mm in diameter. There are numerous examples of the use ofcyclodextrins in chiral separations and the following are someapplications that illustrate their general use.
Cyclodextrin based chiral stationary phases have also been used toseparate b blocking agents in conjunction with an optically activefluorescent Edman-type reagent to enhance detection. Toyo'oka and Liu[15] used the optically active Edman type fluorescent reagents, 4-(3-isothiocyanatepyrrolidin-1-yl)-7-nitro-2,1,3-benzoxadiaz-ole [(r)-(–) and(S)-(+)-NBD-PyNCS] and 4-(3-(3-isothiocyanatepyrrol-idin-1-yl)-7-(N,N-dimethylaminosulfonyl)-2,1,3-benzoxydiazole [(R)-(–)-and (S)-(+)-DBD-PyNCS] to produce diastereomers that could be separated on a simple

This eBook is protected by Copyright law and International Treaties. All rights are reserved. This book is covered by an End UserLicensee Agreement (EULA). The full EULA may be seen at http://www.library4science.com/eula.html .
92
reversed phase column and, at the same time, provide enhancedsensitivity.
The reagents reacted quantitatively with primary and secondary aminofunctional groups, under mild conditions (55˚C for 10 min.), in thepresence of triethylamine, to produce the corresponding fluorescentthiourea derivatives. The purity of the reagents were ascertained byseparation on a cyclodextrin column and the results are shown in figure50.
Time (minutes)0 20 400 20 40
0
2040
0 20 400 20 40
0
20 40
A B C
D E F1
2 1
21
2
12
1
21
2
Det
ecto
r Si
gnal
Courtesy of the Royal �Society of Chemistry, [Ref. 15]
Figure 50 The Separation of Enantiomeric Pairs of NBD-PyNCSand DBD-PyNCS on Utron ES-PhCD, a Cyclodextrin BasedStationary Phase
The separation was carried out on a derivatized cyclodextrin column(ES-PhCD) 15 cm long and 6 mm I.D., packed with 5 mm particles.

This eBook is protected by Copyright law and International Treaties. All rights are reserved. This book is covered by an End UserLicensee Agreement (EULA). The full EULA may be seen at http://www.library4science.com/eula.html .
93
Chromatogram A shows the elution of the (R)-(–)-NBD-PyNCS isomer,B, the elution of the (R)-(+)-NBD-PyNCS isomer and C, the separationof the racemic mixture. The mobile phase was a mixture ofacetonitrile/methanol/water : 3/3/4 v/v/v. Chromatogram D shows theelution of the (R)-(–)-DBD-PyNCS isomer, E, the elution of the (R)-(+)-DBD-PyNCS isomer and F, the separation of the racemic mixture. Inthis case, the mobile phase consisted of a mixture of acetonitrile/water :8/2 v/v. It is seen that the cyclodextrin based stationary phase elegantlyresolves both pairs of enantiomers. The separation of the diastereomersformed by reacting the reagents with some chiral drugs is shown infigure 51.
Det
ecto
r Out
put
0 10 20Time (minutes)
1
2
34
5
Courtesy of the Royal Society of Chemistry, [Ref. 15]
Figure 51 The Separation of the Diastereomers of Propanolol andAlprenolol on a Reversed Phase Column
The column was the Intersil ODS 80A, 15 cm long, 4.6 mm I.D., packedwith 5 mm particles. The largest peak in the chromatogram was the

This eBook is protected by Copyright law and International Treaties. All rights are reserved. This book is covered by an End UserLicensee Agreement (EULA). The full EULA may be seen at http://www.library4science.com/eula.html .
94
reagent itself. Peak 1 was (R)-(+)-Propanolol, peak 2 was (S)-(-)-Propanolol, peak 3 (R)-(+)-Alprenolol and peak 4 (S)-(–)-Alprenolol.Each peak, except that of the reagent, represents 25 ng of the originaldrug.
Another group of chiral stationary phase are the macrocyclicglycopeptide phases. The macrocyclic glycopeptides were firstintroduced by Armstrong [16]. One way of preparing the glycopeptidephases is to covalently bond Vancomycin to the surface of silica gelparticles. Vancomycin contains 18 chiral centers surrounding three'pockets' or 'cavities' which are bridged by five aromatic rings. Strongpolar groups are proximate to the ring structures to offer strong polarinteractions with the solutes. This type of stationary phase is stable inmobile phases containing 0–100% organic solvent. The proposedstructure of Vancomycin is shown in figure 52.
OCH3
NH2
CH3
OH
OO
NN
NNN
NO
OHH
HOH
HOOC
HH
OO
O
OOH
H H2NCO
Cl
NHCH3
H H
OO
O
OHHO
HOCH2
OHOH HO
H
Cl
A
BC
A, B and C are inclusion cavities. Molecular weight 1449. Chiral centers 18. pK's 2.9,7.2, 8.6, 9.6, 10.4, 11.7. Isoelectric point 7.2
Courtesy of ASTEC Inc.
Figure 52 The Proposed Structure of Vancomycin

This eBook is protected by Copyright law and International Treaties. All rights are reserved. This book is covered by an End UserLicensee Agreement (EULA). The full EULA may be seen at http://www.library4science.com/eula.html .
95
Vancomycin is a very stable chiral stationary phase, has a relatively highsample capacity, and when covalently bonded to the silica gel, hasmultiple linkages to the silica gel surface. It can either be used withmobile phases with a high water content, as a reversed phase, or with ahigh solvent content, as a largely polar stationary phase. For example,when used as a reversed phase the strongly polar THF–water mixtureswould be very effective mobile phases. Conversely, when used as a polarstationary phase, n-hexane–ethanol mixtures would be more appropriate.Vancomycin has a number of ionizing groups and thus can be used overa range of different pH values (pH 4.0 to 7.0) and exhibit a wide rangeof retention characteristics and chiral selectivities.
a = 1.38 a = 1.30 a = 1.30
Terbutaline
Methanol 100Acetic Acid 0.3 TEA 0.2
Methanol 99Amm.Acet. (20 mM)
Methanol 100Amm. Hydrox. 0.05 TFA 0.05
Figure 53 The Separations of the Isomers of TerbutalineEmploying Different Buffer Solutions
Ammonium nitrate, triethylammonium acetate and sodium citrate buffershave all been used satisfactorily with this stationary phase. Other than

This eBook is protected by Copyright law and International Treaties. All rights are reserved. This book is covered by an End UserLicensee Agreement (EULA). The full EULA may be seen at http://www.library4science.com/eula.html .
96
controlling the pH, the effect of the chosen buffer has little or no effecton chiral selectivity. This is verified by the chromatograms shown infigure 53. It is seen that virtually the same selectivity is obtained from allthree buffers irrespective of the actual chemical nature of the buffersthemselves. However, although the difference is exceedingly small, theslightly greater separation ratio obtained from the buffer containingtriethylamine might reflect the relatively strong dispersive character ofthe ethyl groups in the buffer molecule. The enthalpic contributions toretention can be strongly dispersive, and/or strongly polar, or result frominduced dipole interactivity.
3-Methyl-5-Phenylhydantoin
3.288 min.
4.290min.
7.207 min.
8.760 min.
100% Ethanol 10/90 THF20mM Amonium NitratepH 5.5
to 1.85 min. to 2.80 min.k1 0.78 k1 1.57k2 1.32 k2 2.13a 1.69 a 1.35R 2.18 R 3.0
Courtesy of ASTEC Inc.
Figure 54 The Separation of the Enantiomers of 3-Methyl-5-Phenylhydantoin Using Polar and Dispersive Interactions

This eBook is protected by Copyright law and International Treaties. All rights are reserved. This book is covered by an End UserLicensee Agreement (EULA). The full EULA may be seen at http://www.library4science.com/eula.html .
97
The aromatic rings will allow induced dipole interactions with thestationary phase and conversely, the strong polar groups on thestationary phase can induce dipole interaction with polarizable groups onthe solute. The cavities are more shallow than those in the cyclodextrinsand thus interactions are weaker however, this allows more rapid soluteexchange between the phases, and thus higher column efficiencies. Anexample of the use of the stationary phase to separate the enantiomers of3-methyl-5-phenylhydantoin is shown in figure 54.
The separation is carried out under two conditions, the first used pureethanol as the mobile phase, which is relatively dispersive, and in thesecond, a mobile phase that contains 90% of water which is stronglypolar. Pure ethanol provides extremely strong dispersive interactions inthe mobile phase relative to that of the aqueous solvent which will besignificantly more dispersive than any interactions involved with thestationary phase.
It follows that the remaining dominant retentive forces will be polar orionic in nature. In the second case, the mobile phase is predominantlywater and thus provides very strong polar interactions with the solutebut very weak dispersive interactions. It also follows, that the retentionforces of the stationary phase, in this case, will be dominantly dispersivein nature. This demonstrates the very useful selective flexibility ofVancomycin. By adjusting the mobile phase composition, selectivity canbe made to depend largely on dispersive interactions (hydrophobic) or,alternatively, to depend largely on polar interactions (hydrophilic).
Hosoya et al. and Kobayashi et al. (17), developed a method for packinguniformly sized polymer based LC packing materials that providedpractically adequate column efficiency using a copoly-merizationtechnique.
The uniformly sized, polymer-based packing was prepared frommixtures of alkyl methracrylate and glycerol dimethacrylate bycopolymerization techniques using a multistep swelling andpolymerization method. The resulting materials gave good efficiencies

This eBook is protected by Copyright law and International Treaties. All rights are reserved. This book is covered by an End UserLicensee Agreement (EULA). The full EULA may be seen at http://www.library4science.com/eula.html .
98
and worked well with microbore columns. An example of their use inthe separation of some polyaromatic hydrocarbons is given in figure 55.The column was 15 cm long, 4.6 mm I.D. and the mobile phase80%(v/v) aqueous acetonitrile employed at a flow rate of 1 ml/min.
0 10 20 30Time (minutes)
Figure 55 Chromatogram of Some Polyaromatic HydrocarbonsSeparated on the Polymer Based Pickings
The temperature was 30˚C and a UV detector operating at awavelength 254 nm was used to monitor the separation. Theperformance of the polymer based packings was compared with that of acommercial silica based packing using a synthetic mixture.
The chromatogram obtained for the mixture on the two columns isshown in figure 56. It is seen that although the polymer columns exhibitsa large number of theoretical plates and uracil and caffeine, and tolueneand phenylacetyl acetone are better separated, 2-ethyl pyridine and

This eBook is protected by Copyright law and International Treaties. All rights are reserved. This book is covered by an End UserLicensee Agreement (EULA). The full EULA may be seen at http://www.library4science.com/eula.html .
99
phenol coelute are also reasonably well resolved on the silica basedcolumn.
1 2 3
45
6
7
8
9
10
1 2
3 4
56
7
8
9
10
0 10 155 0 10 15520
N=13300
Polymer Based Column Siica Based Column
1. Uracil 6. benzene 2. Caffeine 7. N,N-diethylaniline 3. 2-ethylpyridine 8. toluene 4.phenol 9. phenylacetyl acetone 5. butyl benzoate 10. naphthalene
Column length 15 cm, diameter 2 mm, mobile phase 50% (v/v) aqueousacetonitrile, flow rate 0.19 ml/min., temperature 40˚C, detector UV at254 nm.
Figure 56 The Relative Performance of a Column Packed withPolymer Based Material and that from a Column Packed withSilica Based Material
References
1. M. S. Tswett, "Khromfilli v Rastitel'nom i Zhivotnom Mire' Izd. Karbasnikov, Warsaw,(1910)3802. A. J. P. Martin and R. L. M. Synge, Biochem J. 35(1941)1358.3. F. London, Phys. Z. 60(1930)245.4. S. Glasstone, "Textbook of Physical Chemistry", D.Van Nostrand Co, New York (1946) 298 and 534.

This eBook is protected by Copyright law and International Treaties. All rights are reserved. This book is covered by an End UserLicensee Agreement (EULA). The full EULA may be seen at http://www.library4science.com/eula.html .
100
5. E. Gil-Av, B. Fiebush and Charles-Sigler, Tetrahedron Lett., 10(1966)1009.6. R. P. W. Scott and P. Kucera, J. Chromatogr.,125(1976)251.7. E. Gil-Av, B. Fiebush and Charles-Sigler, Tetrahedron Lett., 10(1966)1009.8. J. J. Van Deemter, F. J. Zuiderweg and A. Klinkenberg, Chem. Eng. Sci., (1956)271.9. K. Ogan and R. P. W. Scott, J. High Res. Chromatogr., 7.July (1984)382.10. M. J. E.Golay, in "Gas Chromatography 1958", (Ed. D.H.Desty), Butterworths, London, (1958)36.11. M.S.Schreiber, "75 Years of Chromatography-an Historical Dialogue", Elsevier Scientific Publishing Company, Amsterdam-Oxford New York (1979)413.12. J.G.Kirchner, "75 Years of Chromatography-an Historical Dialogue", Elsevier Scientific Publishing Company, Amsterdam- Oxford-New York (1979)201.13. Application Sheet No 909100-0271 Supelco Inc.14. X. Yang, T. Fukushima, T. Santa, H. Homma and K. Imai, Analyst.,122(1997)1365.15. T. Toyo'oka and Y. Liu, Analyst, 120(1995)285.16. S. Chen, Y. Liu, D. W. Armstrong, J. I. Borrell, B. Martinez- Teipel and J. L. Matallana, J. Liq. Chromatogr., 18(8)(1995)1495.17. Ken Hosoya, Masashi Teramachi and Nobuo Tanak in cooporation with, Atsushi Kobayashi, Taketoshi and Yuraka Ohtsu, Analyst., 73(2001)5852.


![Continuous Purifications in Multistep Continuous Flow Synthesis …–R_… · High purity can be achieved by using multicolumn chromatography,[6] simulated moving bed (SMB) chromatography,](https://img.pdfslide.us/doc/110x75/5f5554ef174c4d30913a2af2/continuous-purifications-in-multistep-continuous-flow-synthesis-r-high-purity.jpg)