Embed Size (px)
Citation preview
Dec. 6, 2005
Princeton UniversityProspect Eleven
Towards Real-Time MinETA Routing
Tuesday, December 6, 2005
RPI, Troy, NY
Alain L. KornhauserProfessor, Operations Research & Financial Engineering
Dec. 6, 2005
Princeton UniversityProspect Eleven
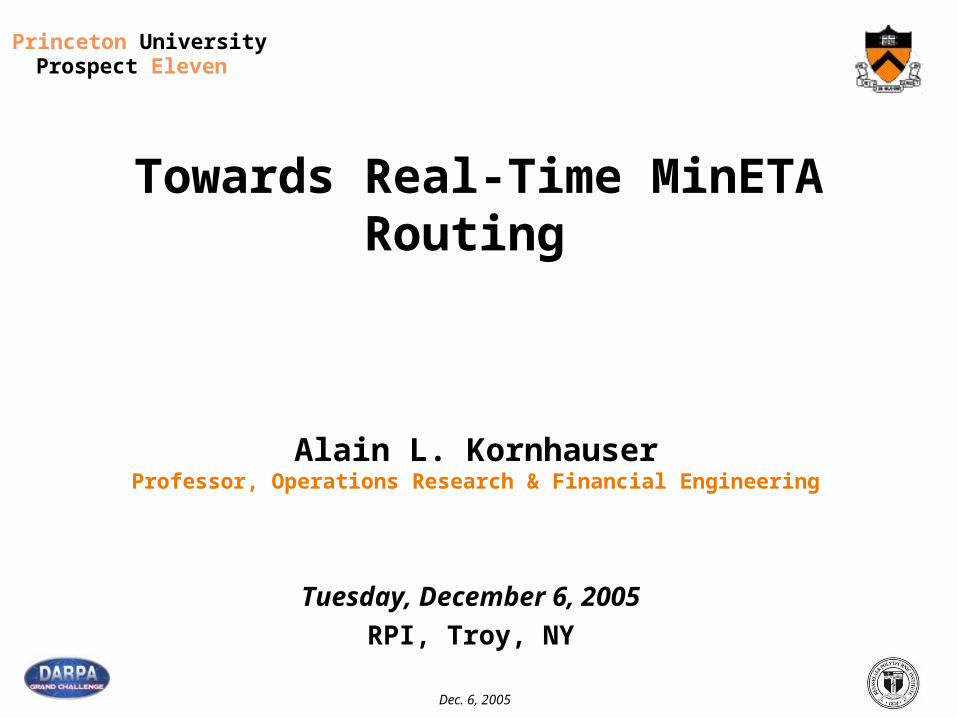
Finally… Convergence of
GPS
Real-Time Decisions that substantially improve the Bottom line of Carriers & Shippers
& Robust OS
& Memory
Real-Time Mobile Information
& Wireless
&
& Processing
Optimal Real-Time Management
& Control of Mobile Assets

Dec. 6, 2005
Princeton UniversityProspect Eleven
1 6
1
1 1
2
2
2
3
3
3
4
3
5 5
6
6
8
8
9
6
•PROBLEM: How to get from A to B
•Many Paths, Each with a Different Value to the Decision Maker
Company Fundamental
4
Dec. 6, 2005
Princeton UniversityProspect Eleven Including Real-Time Information:
Concepts
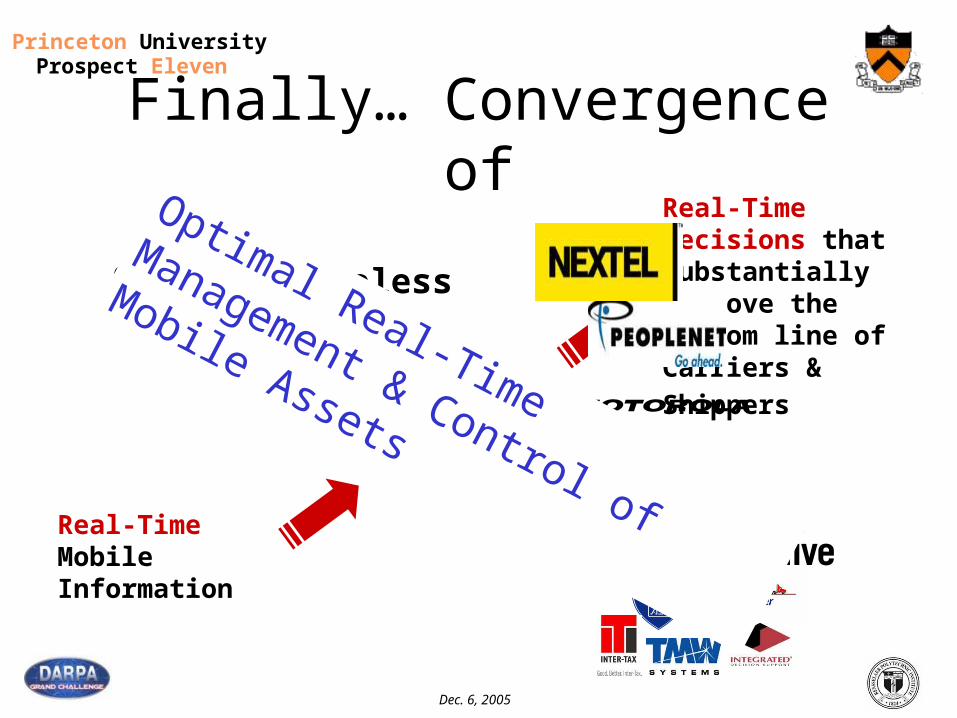
Peak Hour Characteristics & Return to
Normalcy250
350
450
550
650
750
850
950
1050
0 10000 20000 30000 40000 50000 60000 70000 80000
Function
Real Data
580
680
780
880
980
1080
1180
1280
0 10000 20000 30000 40000 50000 60000 70000 80000
Series2
Series1
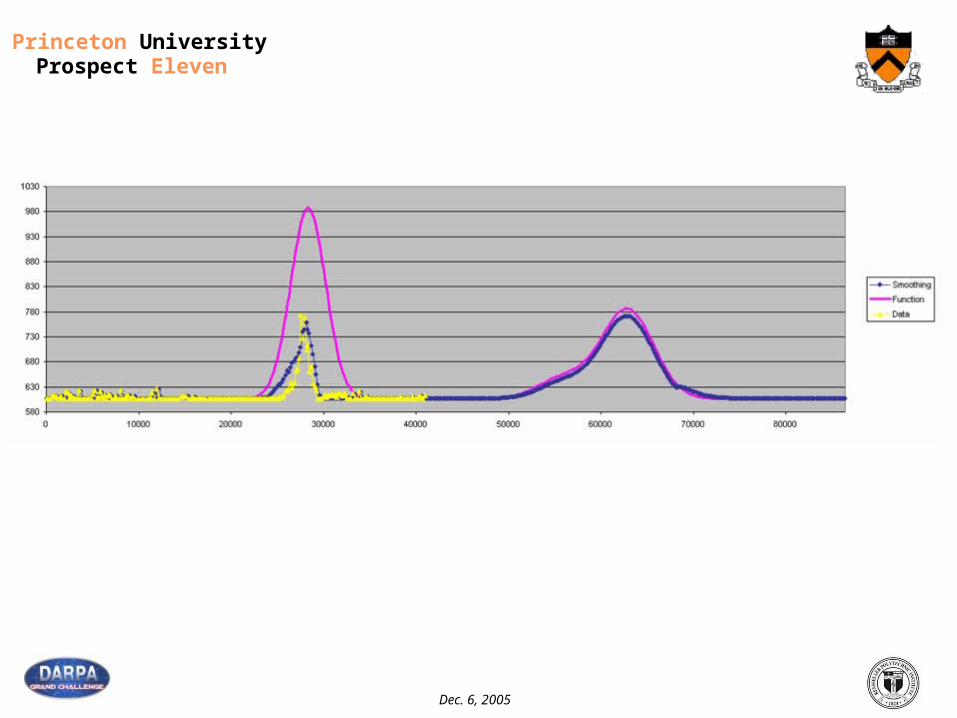
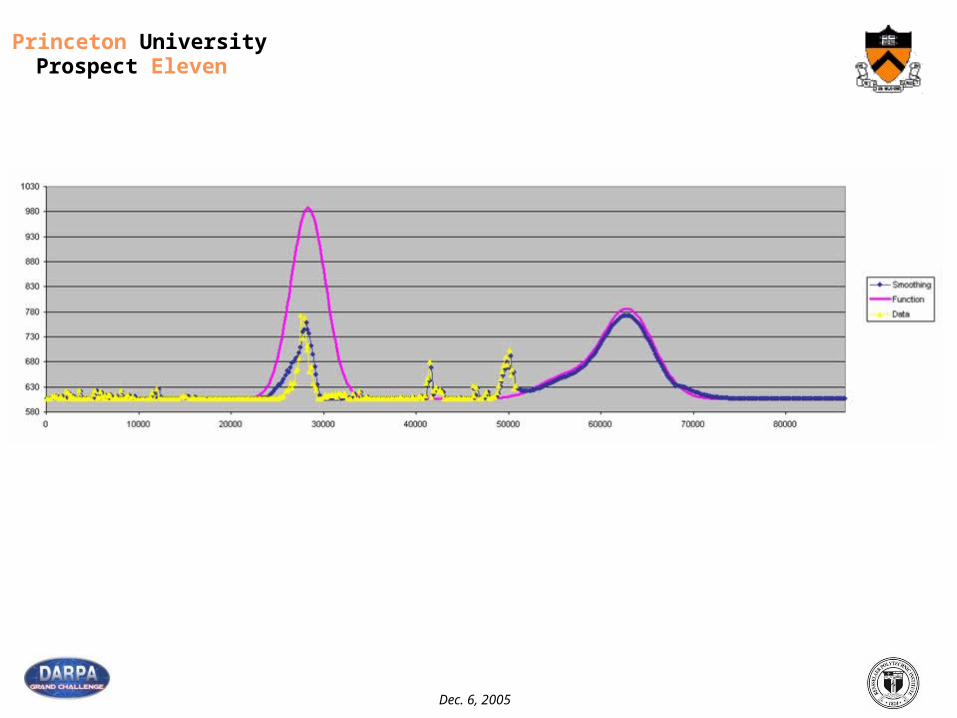
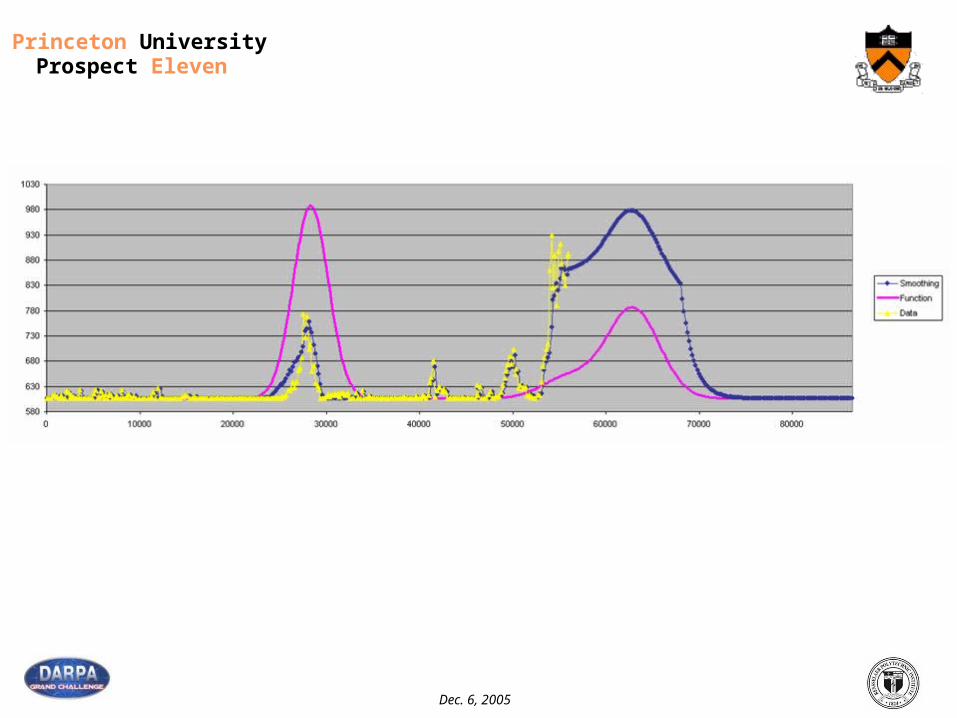
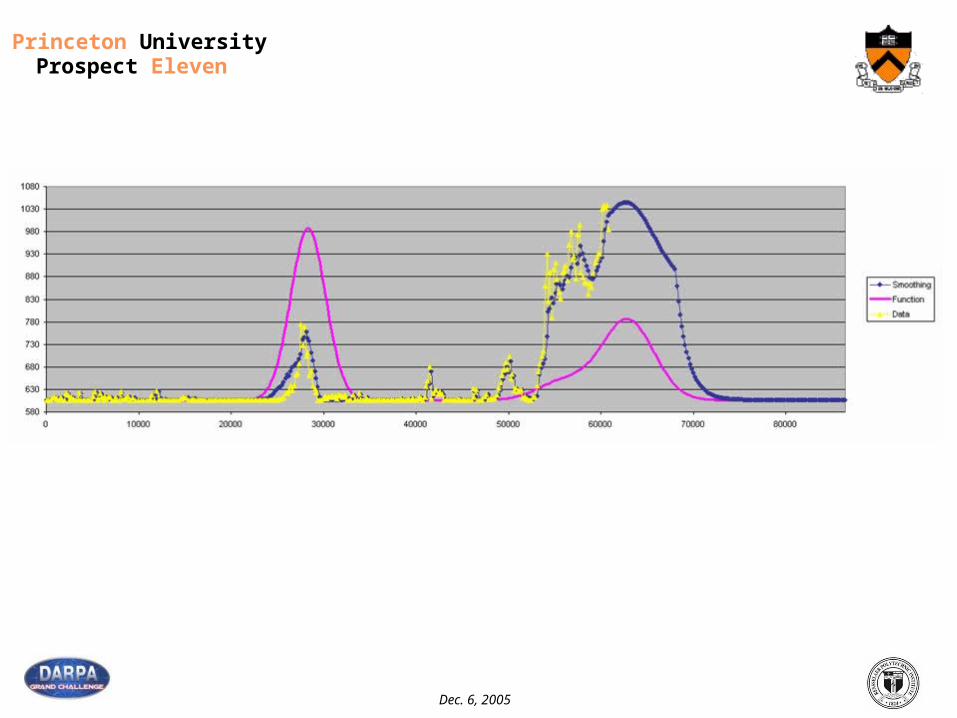
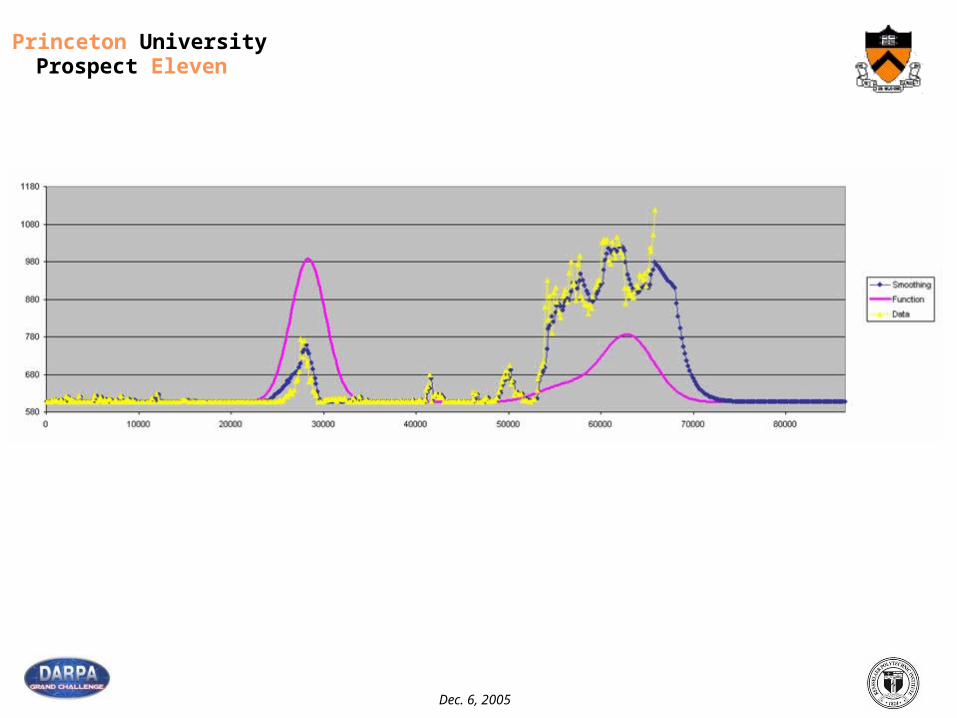
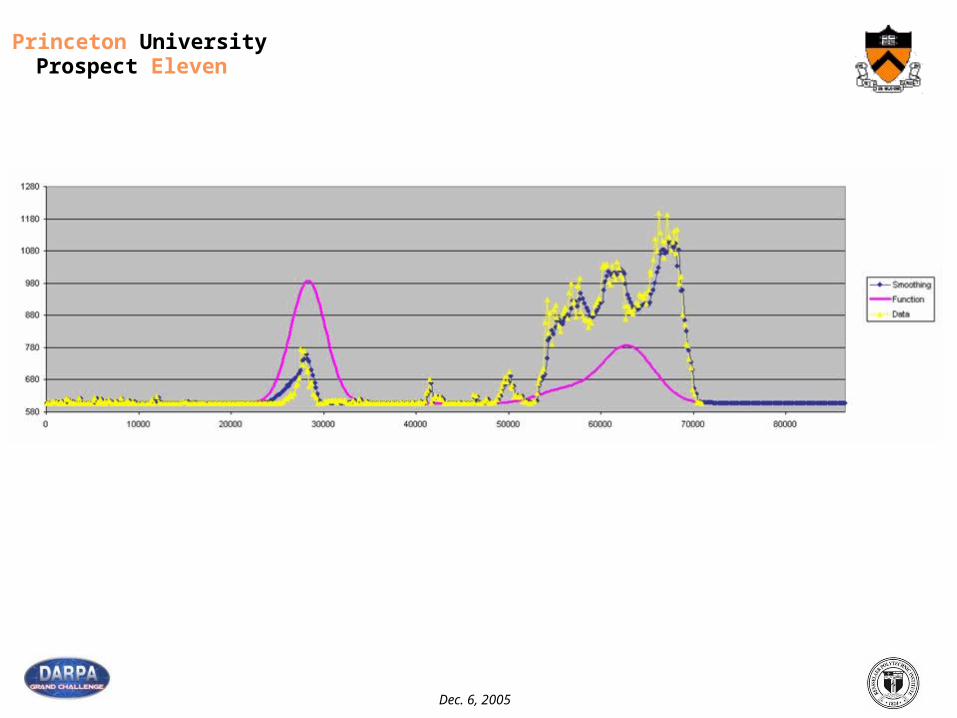
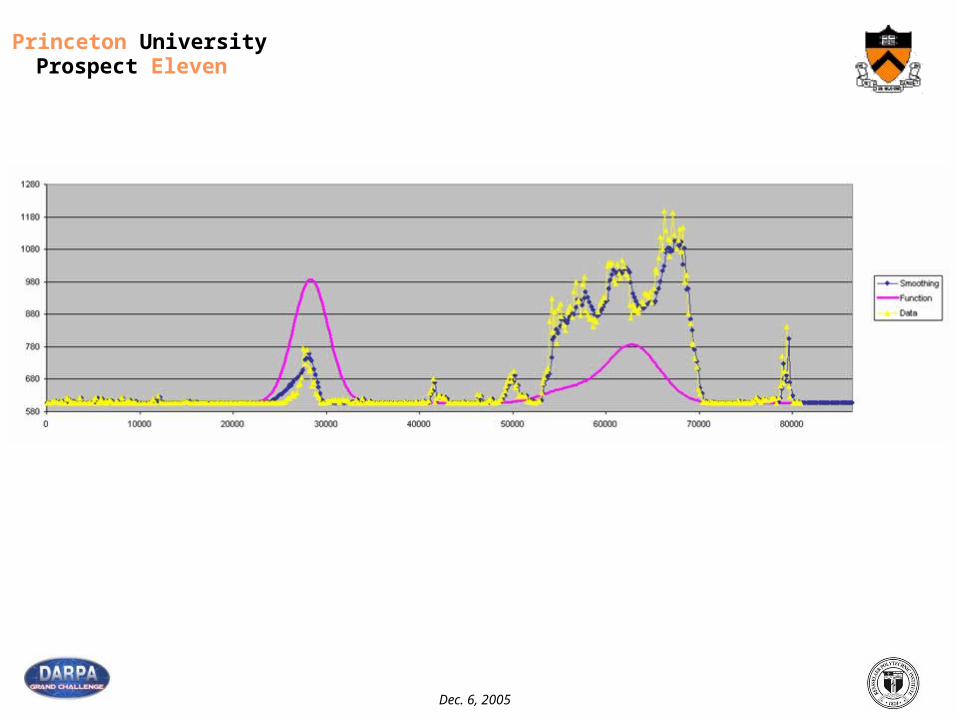
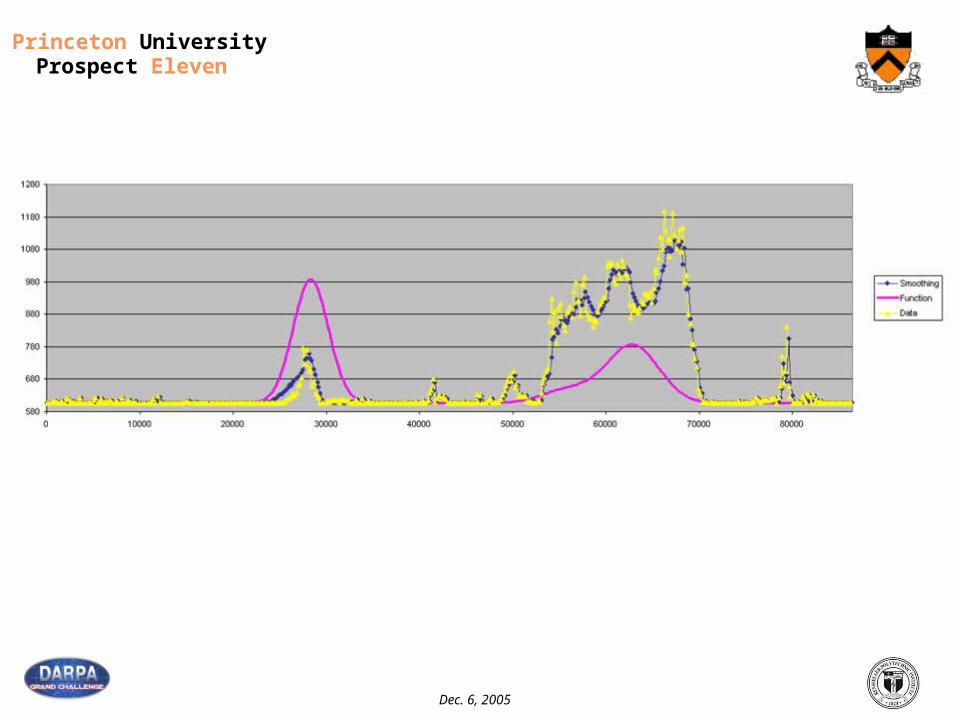
During Peak Hours, Traffic Patterns Remain at a relatively constant distance to Historical Estimate
There will be a time at which traffic patterns will return to free flow conditions
Moorland - Downtown
Burleigh - Zoo
Dec. 6, 2005
Princeton UniversityProspect Eleven
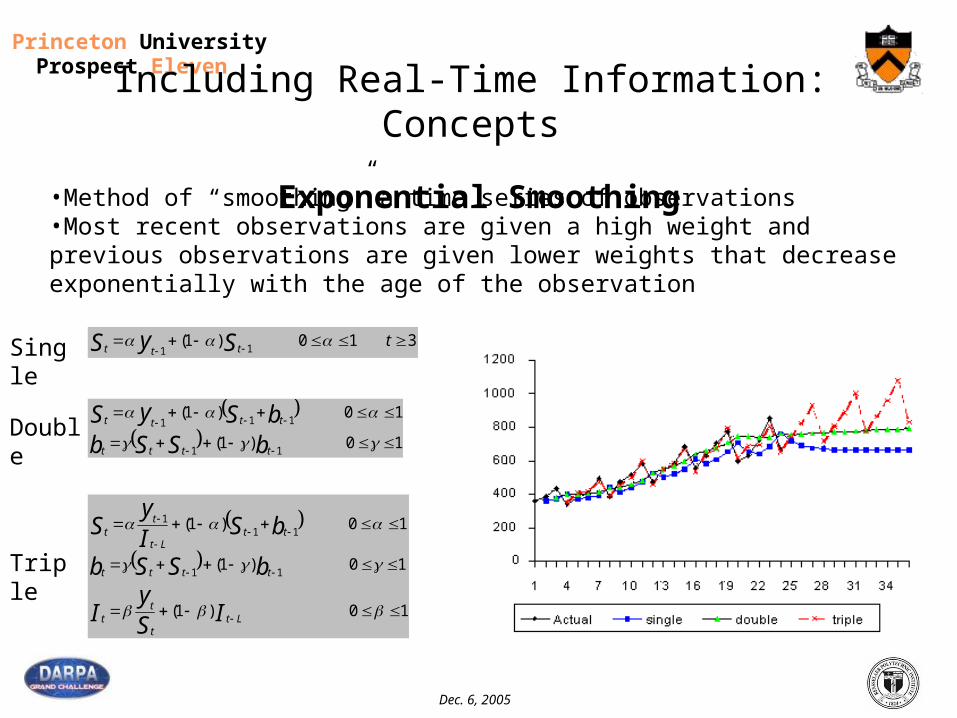
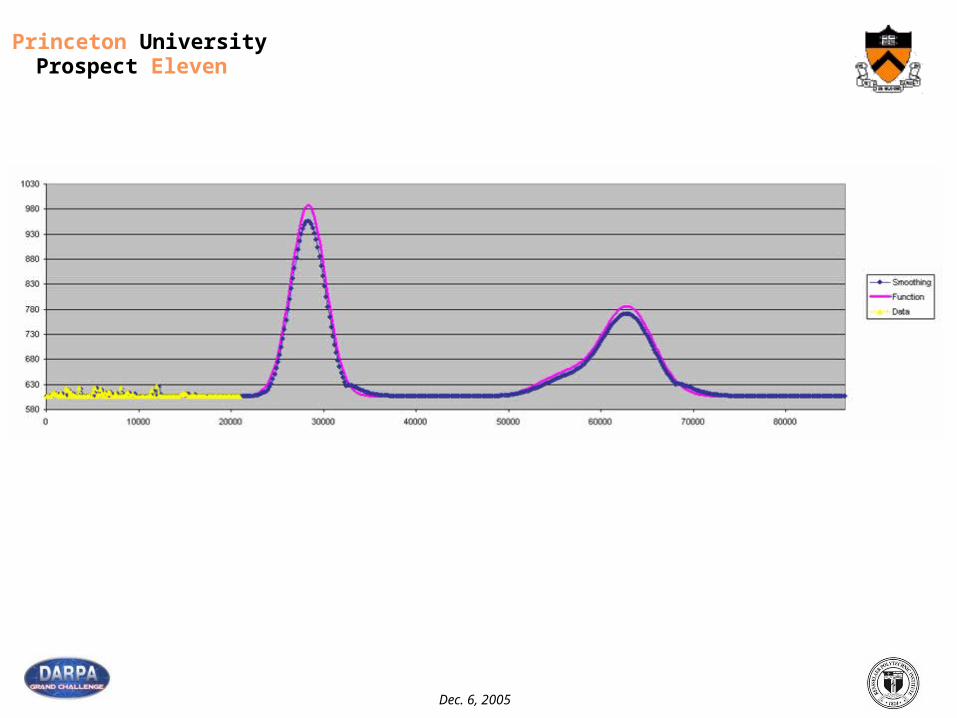
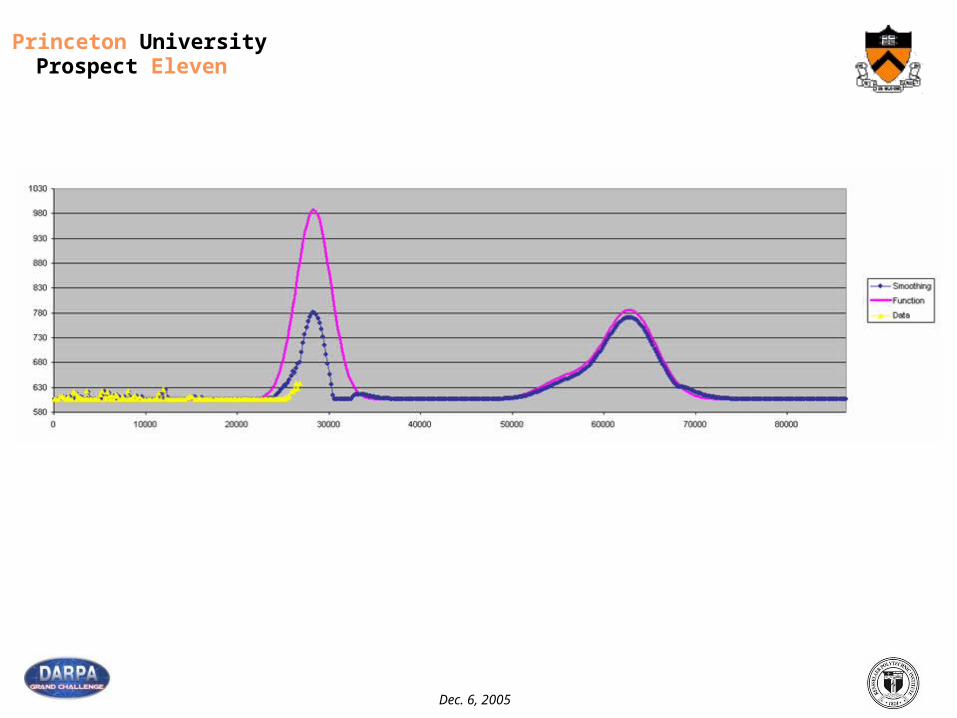
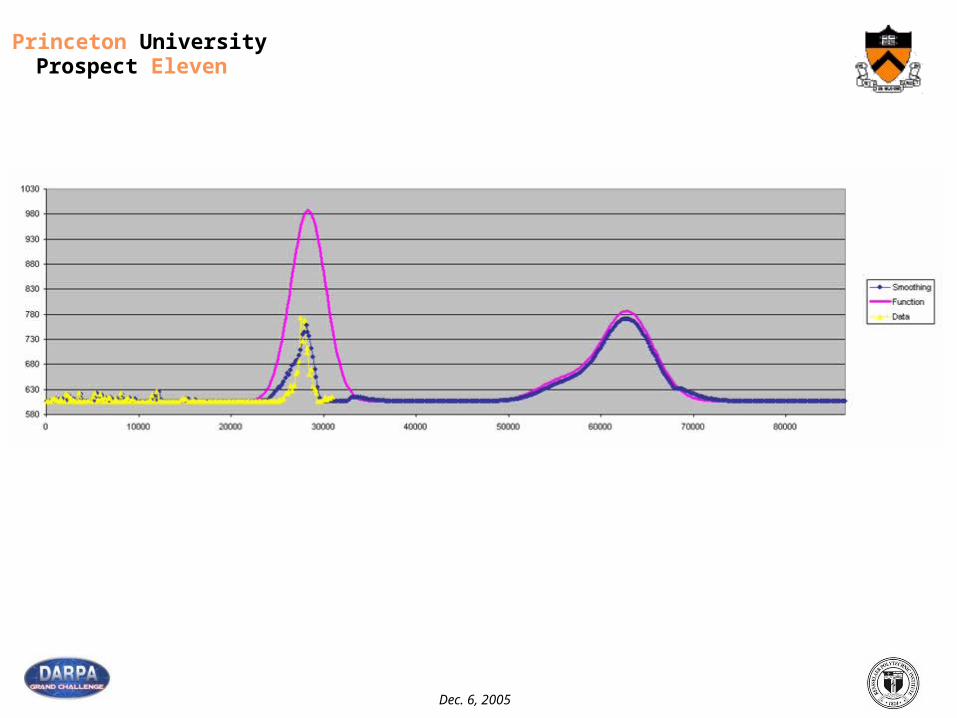
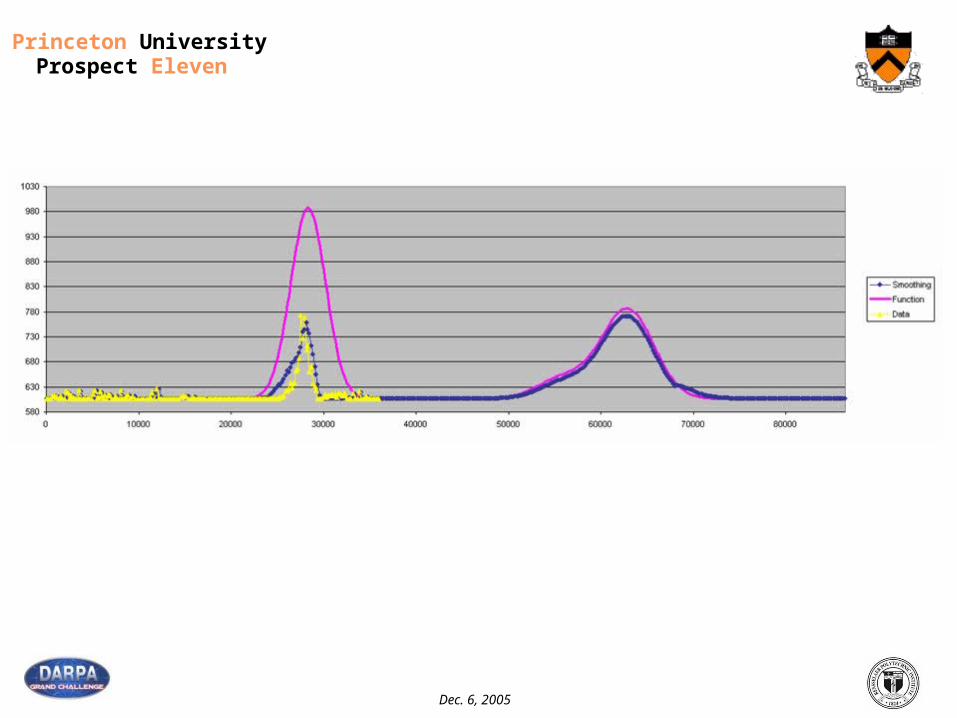
•Method of “smoothing” a time series of observations•Most recent observations are given a high weight and previous observations are given lower weights that decrease exponentially with the age of the observation
Including Real-Time Information: Concepts
Exponential Smoothing
310)1(11
tSyS ttt
10)1(
10)1(
11
111
bSSbbSyStttt
tttt
10)1(
10)1(
10)1(
11
111
ISy
I
bSSb
bSIy
S
Ltt
tt
tttt
ttLt
tt
Single
Double
Triple
Dec. 6, 2005
Princeton UniversityProspect Eleven
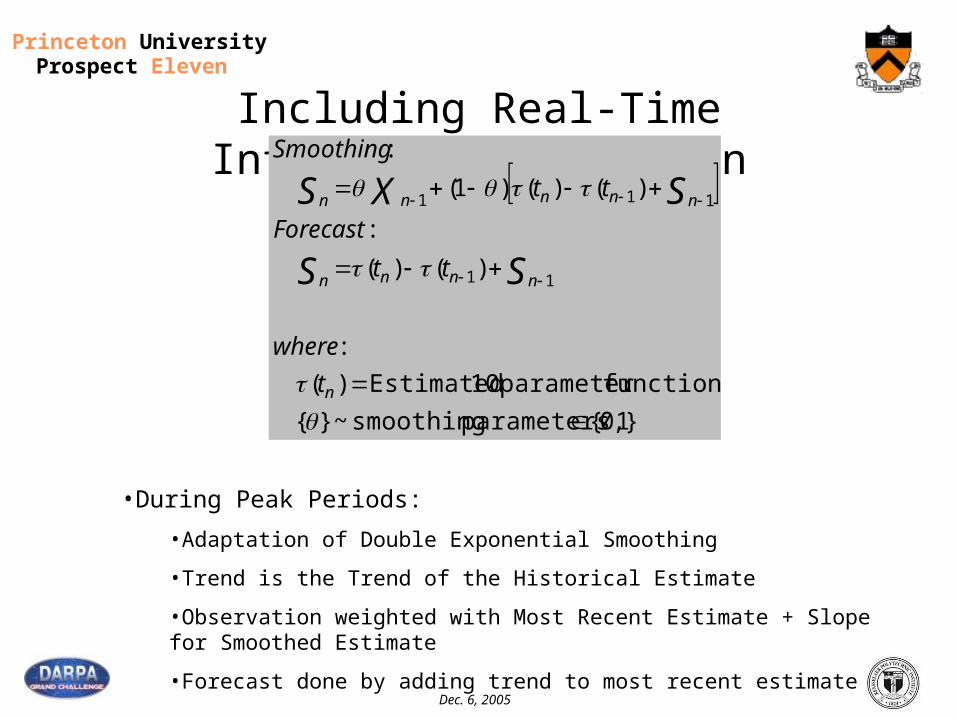
Including Real-Time Information: Solution
•During Peak Periods:
•Adaptation of Double Exponential Smoothing
•Trend is the Trend of the Historical Estimate
•Observation weighted with Most Recent Estimate + Slope for Smoothed Estimate
•Forecast done by adding trend to most recent estimate
}1,0{ parameters smoothing ~ }{
functionparameter 10 Estimated)(
:
)()(
:
)()()1(
:
11
111
n
nnnn
nnnnn
t
where
tt
Forecast
tt
Smoothing
SS
SXS
Dec. 6, 2005
Princeton UniversityProspect Eleven
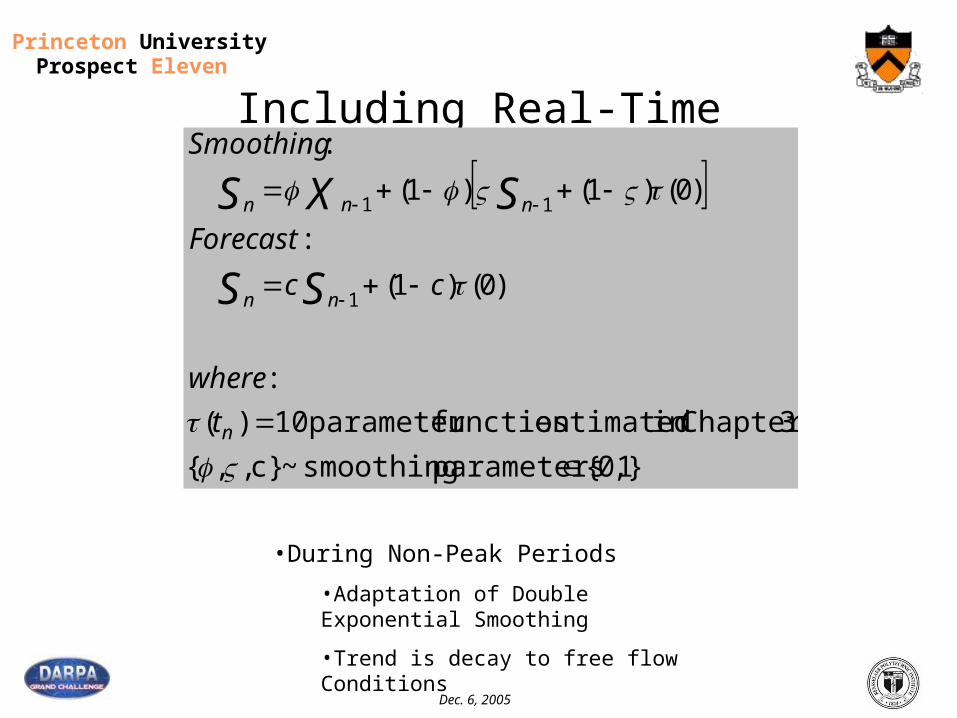
Including Real-Time Information: Solution
•During Non-Peak Periods
•Adaptation of Double Exponential Smoothing
•Trend is decay to free flow Conditions
}1,0{ parameters smoothing ~ c},,{
3Chapter in estimatedfunction parameter 10)(
:
)0()1(
:
)0()1()1(
:
1
11
n
nn
nnn
t
where
cc
Forecast
Smoothing
SS
SXS
Dec. 6, 2005
Princeton UniversityProspect Eleven
250
450
650
850
1050
1250
1450
0 10000 20000 30000 40000 50000 60000 70000 80000
Smoothing
Function
Real Data
(c)
(b)
(a)
250
450
650
850
1050
1250
1450
0 10000 20000 30000 40000 50000 60000 70000 80000
Smoothing
Function
Real Data
0.0
0.2
0.4
0.6
0.8
1.0
0 10000 20000 30000 40000 50000 60000 70000 80000
Weights
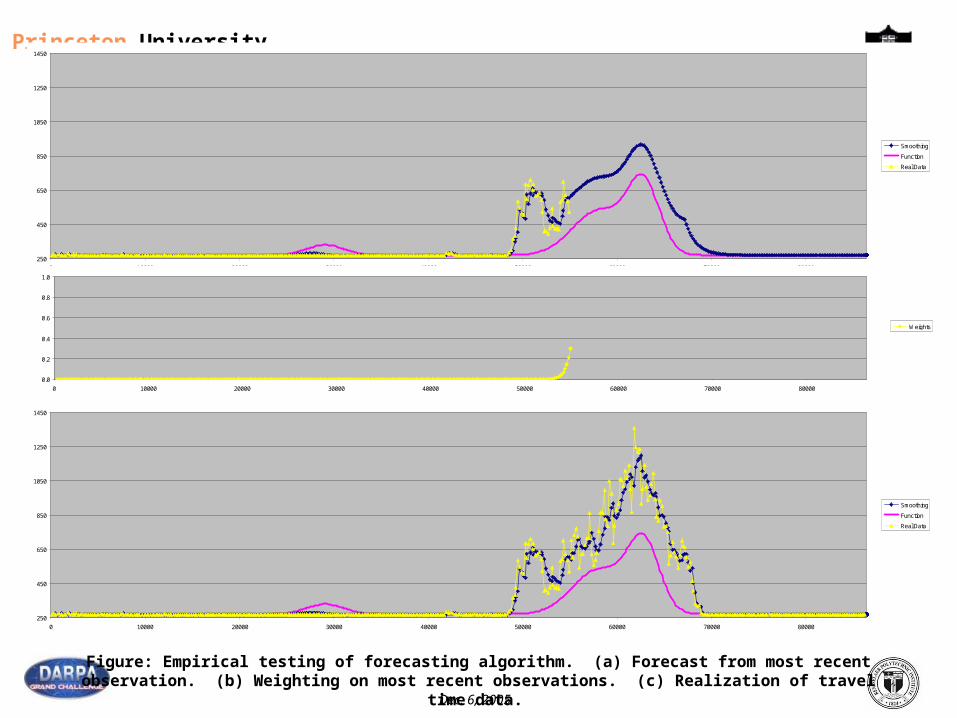
Figure: Empirical testing of forecasting algorithm. (a) Forecast from most recent observation. (b) Weighting on most recent observations. (c) Realization of travel time data.
Dec. 6, 2005
Princeton UniversityProspect Eleven
Dec. 6, 2005
Princeton UniversityProspect Eleven
Dec. 6, 2005
Princeton UniversityProspect Eleven
Dec. 6, 2005
Princeton UniversityProspect Eleven
Dec. 6, 2005
Princeton UniversityProspect Eleven

Dec. 6, 2005
Princeton UniversityProspect Eleven
Dec. 6, 2005
Princeton UniversityProspect Eleven
Dec. 6, 2005
Princeton UniversityProspect Eleven
Dec. 6, 2005
Princeton UniversityProspect Eleven
Dec. 6, 2005
Princeton UniversityProspect Eleven
Dec. 6, 2005
Princeton UniversityProspect Eleven

Dec. 6, 2005
Princeton UniversityProspect Eleven
Dec. 6, 2005
Princeton UniversityProspect Eleven
Dec. 6, 2005
Princeton UniversityProspect Eleven
Dec. 6, 2005
Princeton UniversityProspect Eleven
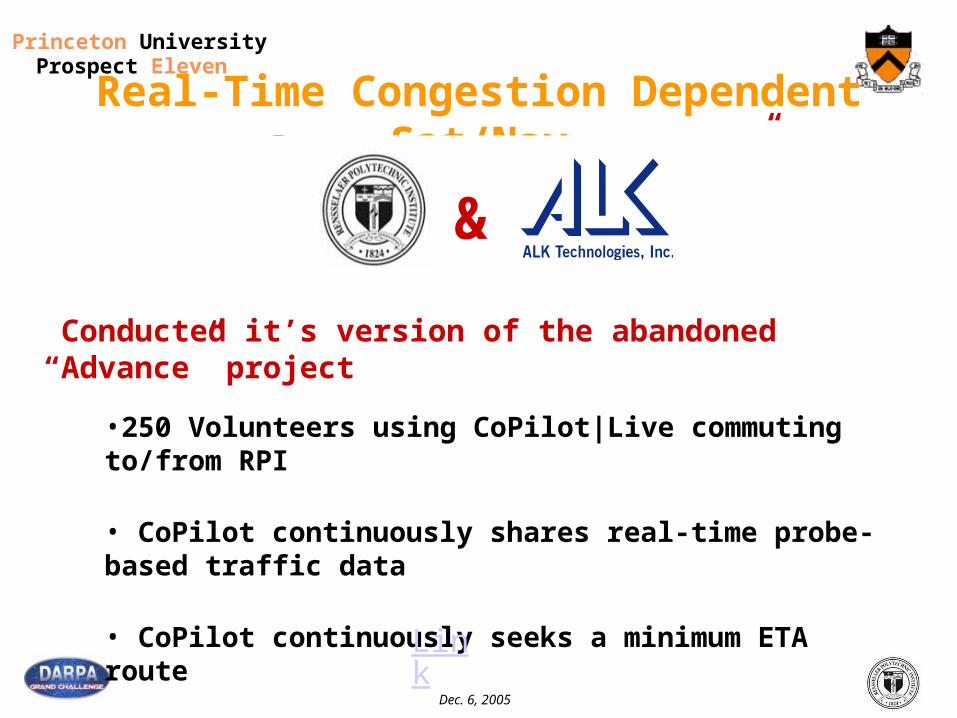
Real-Time Congestion Dependent Sat/Nav
•250 Volunteers using CoPilot|Live commuting to/from RPI
• CoPilot continuously shares real-time probe-based traffic data
• CoPilot continuously seeks a minimum ETA route
“Advance” project Illinois Universities
Transportation Research Consortium
The late 90s
Conducted it’s version of the abandoned “Advance” project
Link
&
Dec. 6, 2005
Princeton UniversityProspect Eleven
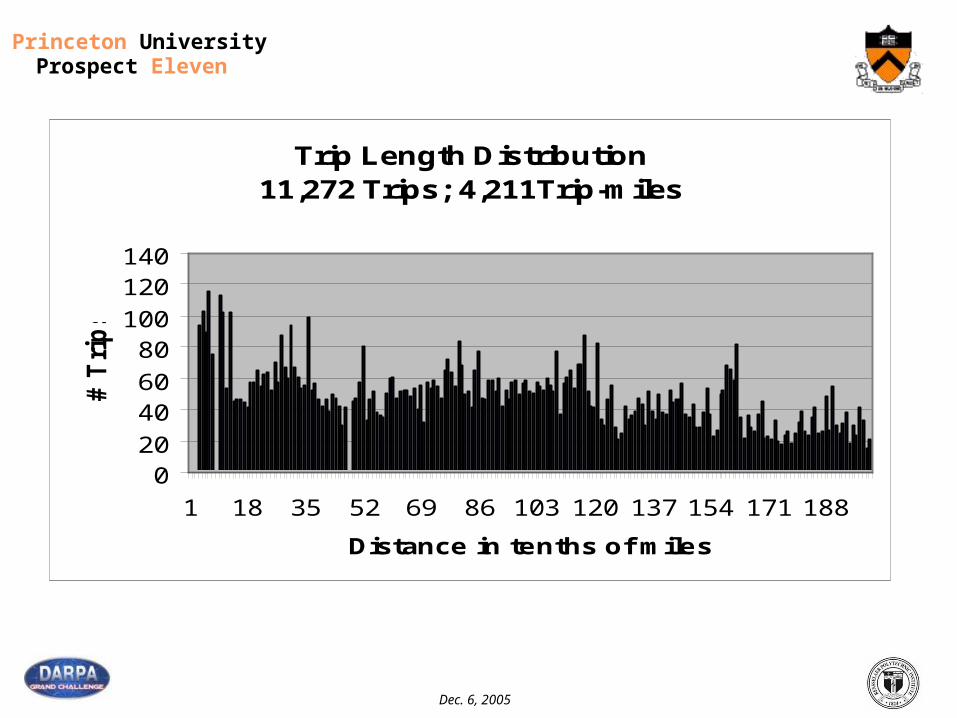
Trip Length Distribution11,272 Trips; 4,211Trip-miles
020
4060
80100
120140
1 18 35 52 69 86 103 120 137 154 171 188
Distance in tenths of miles
# T
rip
s
Dec. 6, 2005
Princeton UniversityProspect Eleven
Dec. 6, 2005
Princeton UniversityProspect Eleven
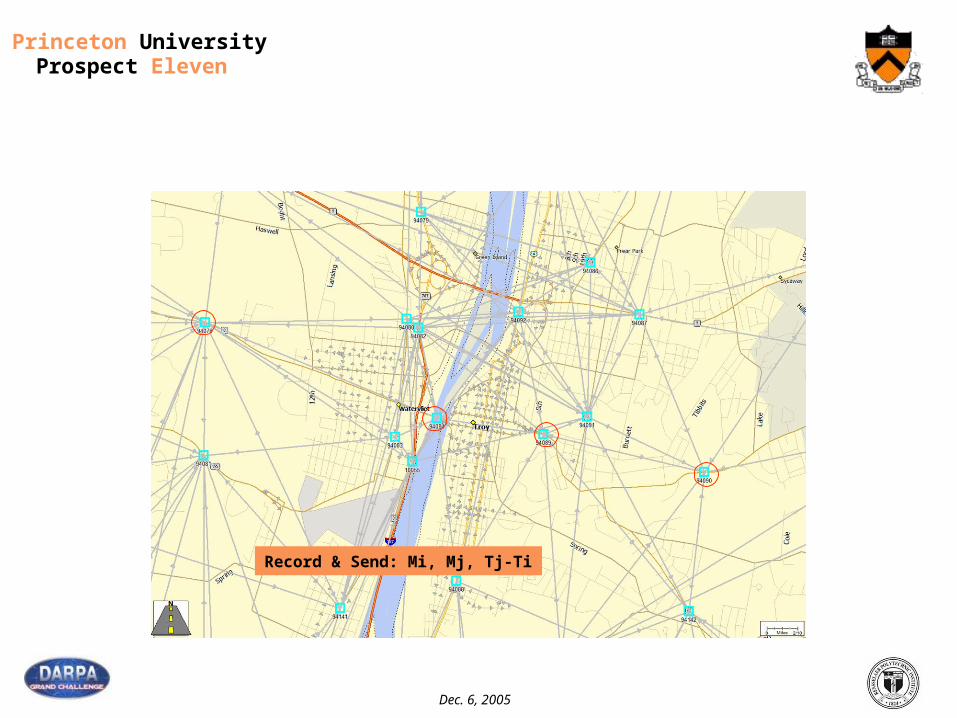
Record & Send: Mi, Mj, Tj-Ti
Dec. 6, 2005
Princeton UniversityProspect Eleven

Dec. 6, 2005
Princeton UniversityProspect Eleven
Cell Phones as Traffic Probes:A Way to Get Started?
Dec. 6, 2005
Princeton UniversityProspect Eleven
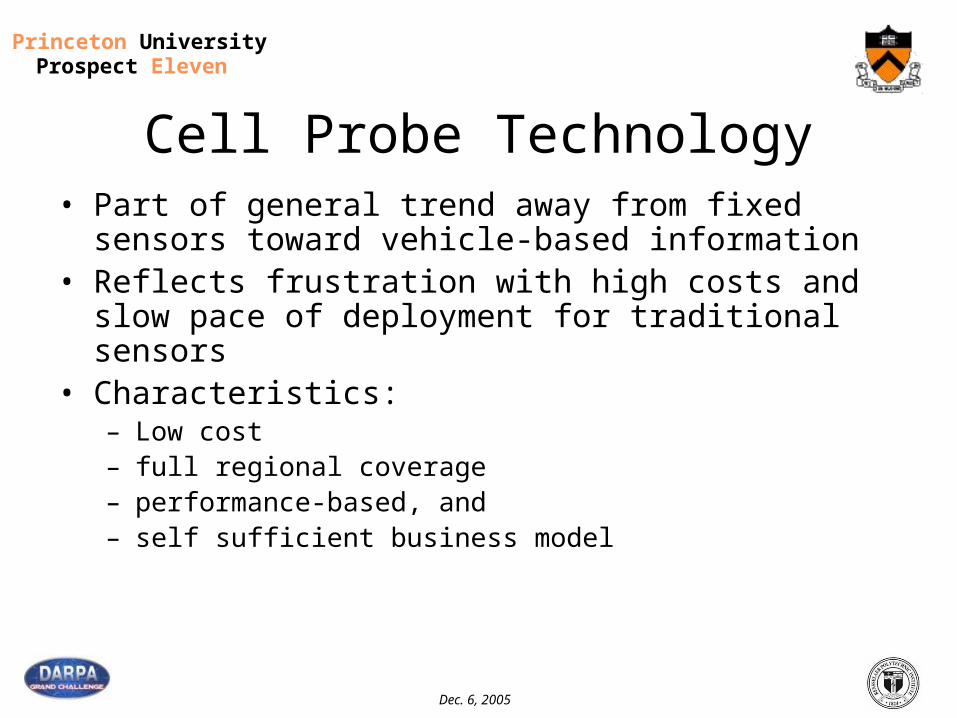
Cell Probe Technology• Part of general trend away from fixed sensors toward vehicle-
based information• Reflects frustration with high costs and slow pace of
deployment for traditional sensors• Characteristics:
– Low cost– full regional coverage– performance-based, and – self sufficient business model
Dec. 6, 2005
Princeton UniversityProspect Eleven
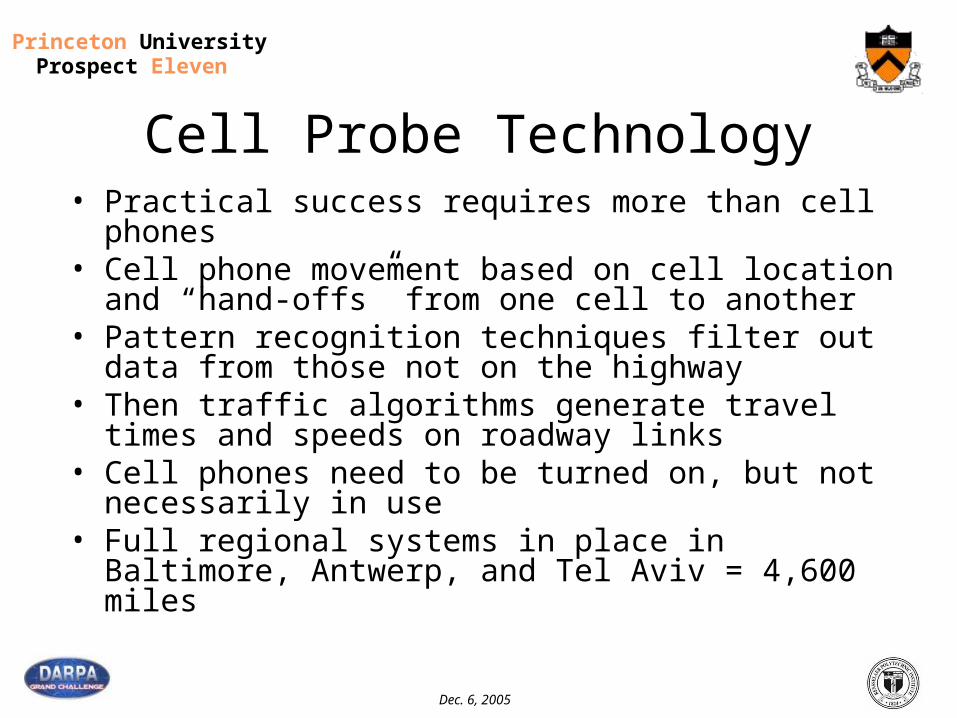
Cell Probe Technology• Practical success requires more than cell phones• Cell phone movement based on cell location and “hand-offs”
from one cell to another• Pattern recognition techniques filter out data from those not
on the highway• Then traffic algorithms generate travel times and speeds on
roadway links• Cell phones need to be turned on, but not necessarily in use• Full regional systems in place in Baltimore, Antwerp, and Tel
Aviv = 4,600 miles
Dec. 6, 2005
Princeton UniversityProspect Eleven
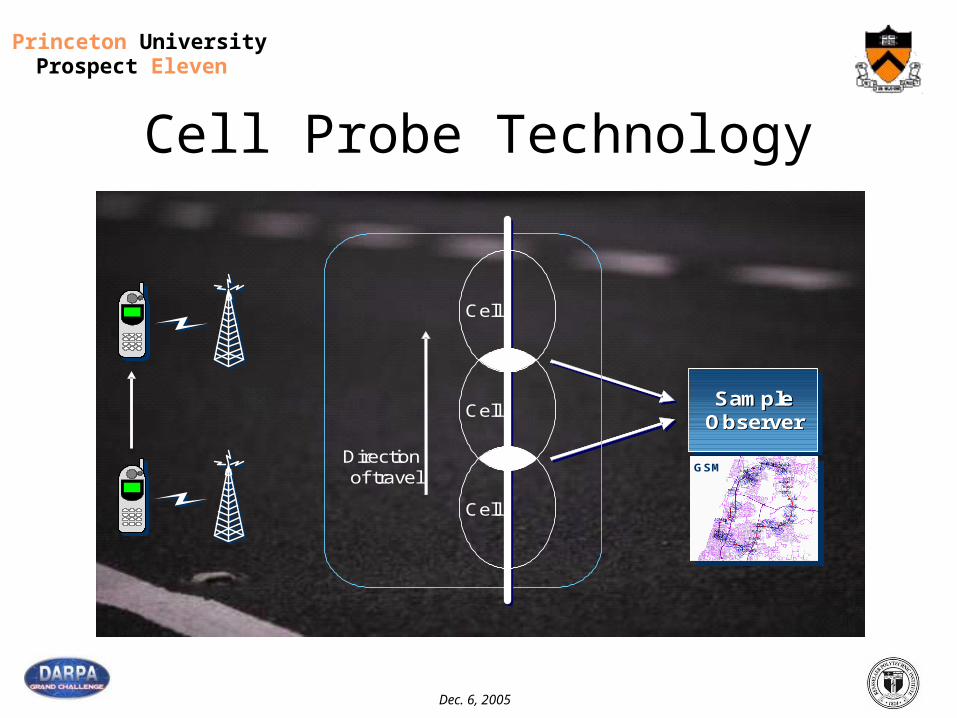
Cell Probe Technology
GSM
SampleObserverSampleSample
ObserverObserver
Cell
Cell
Cell
Directionof travel
GSMGSM
SampleObserverSampleSample
ObserverObserver
Cell
Cell
Cell
Directionof travel
Dec. 6, 2005
Princeton UniversityProspect Eleven
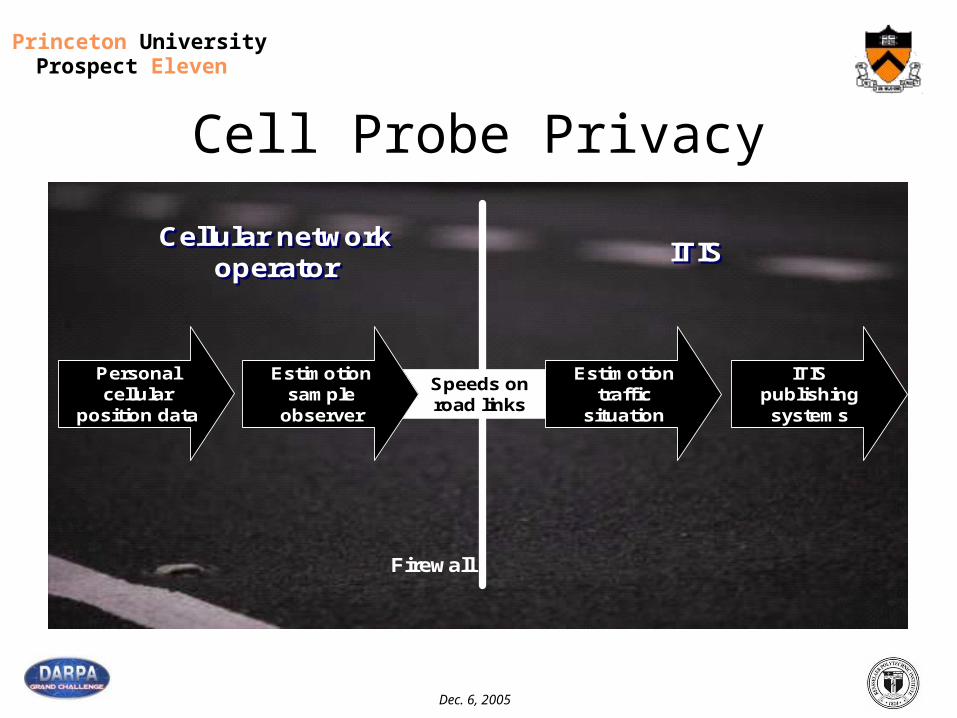
Cell Probe Privacy
Speeds on road links
Personal cellular
position data
Estimotion sample
observer
Estimotion traffic
situation
ITIS publishing systems
Cellular network operator
Cellular network operator ITISITIS
Firewall
Speeds on road links
Personal cellular
position data
Estimotion sample
observer
Estimotion traffic
situation
ITIS publishing systems
Cellular network operator
Cellular network operator ITISITIS
Firewall
Dec. 6, 2005
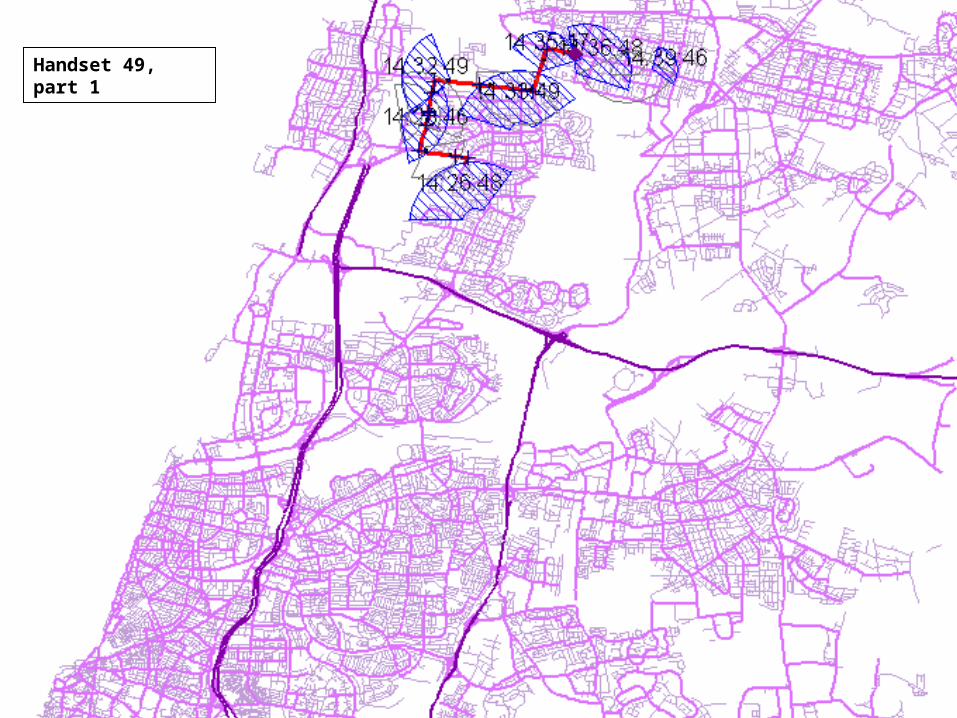
Princeton UniversityProspect Eleven Handset 49, part 1
Dec. 6, 2005
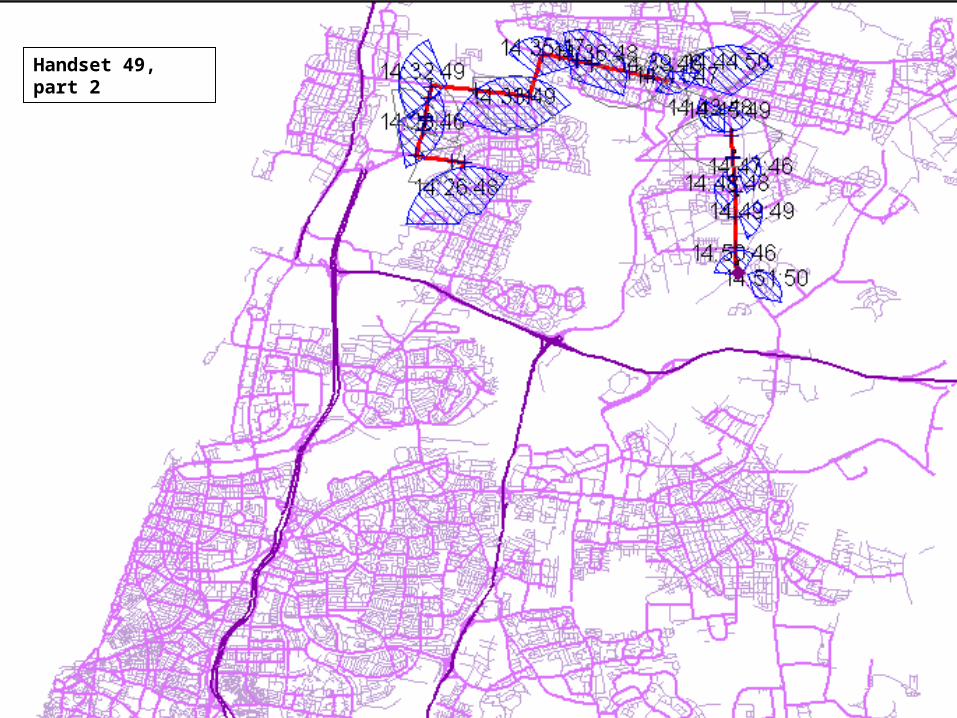
Princeton UniversityProspect Eleven Handset 49, part 2
Dec. 6, 2005
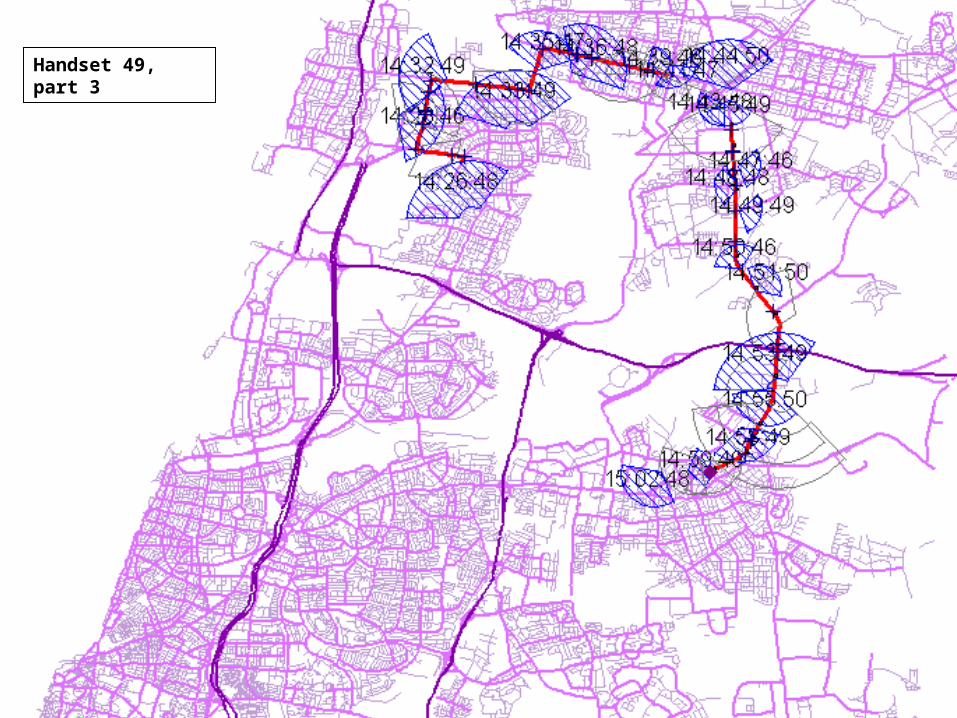
Princeton UniversityProspect Eleven Handset 49, part 3
Dec. 6, 2005
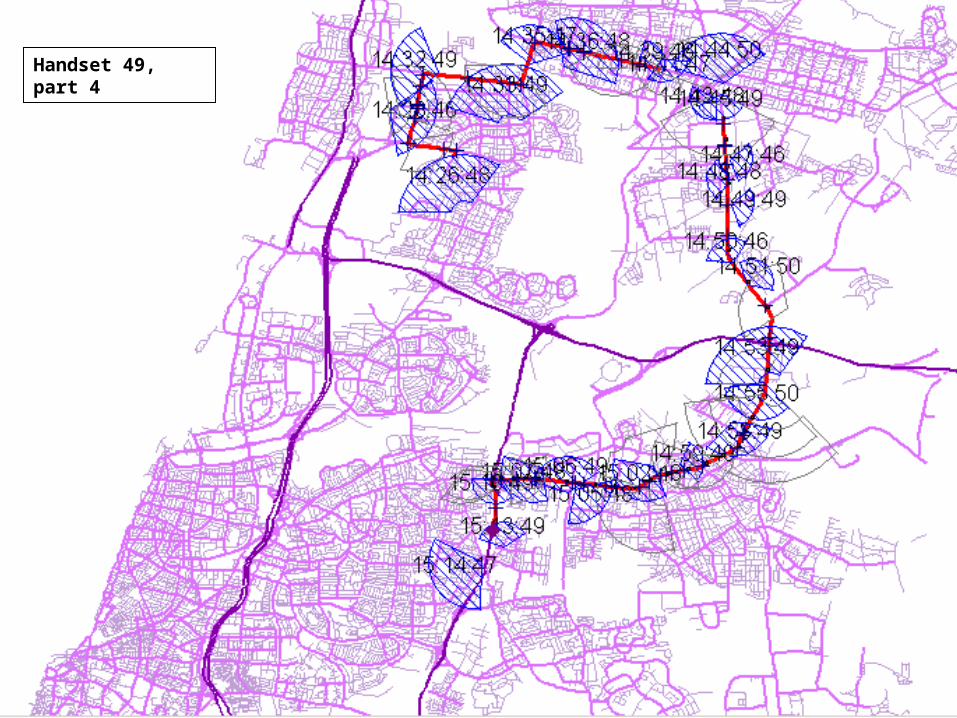
Princeton UniversityProspect Eleven Handset 49, part 4
Dec. 6, 2005
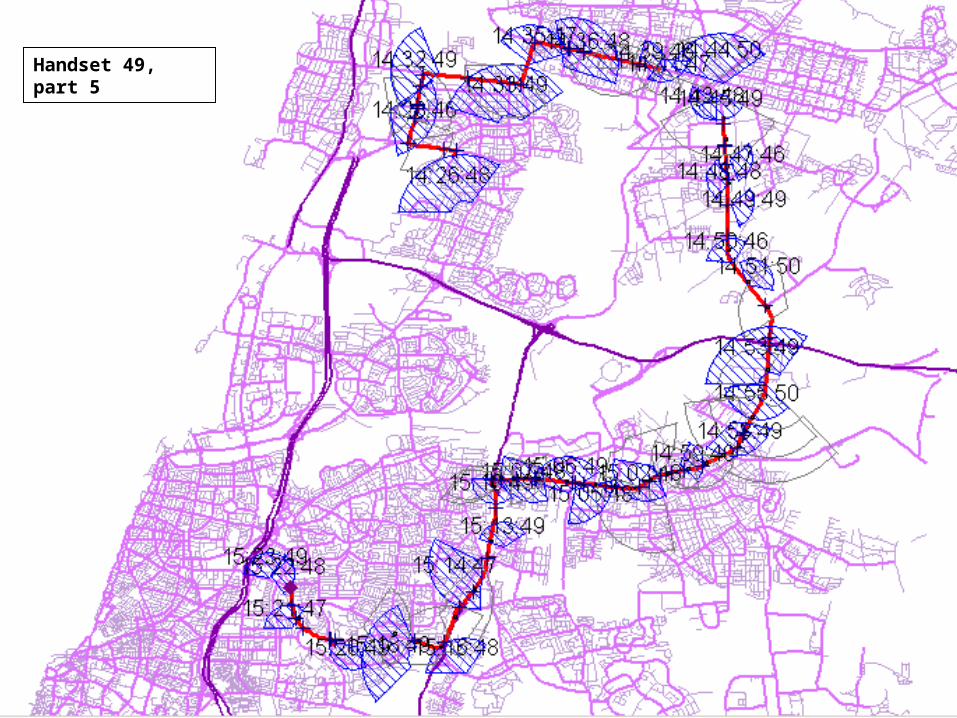
Princeton UniversityProspect Eleven Handset 49, part 5
Dec. 6, 2005
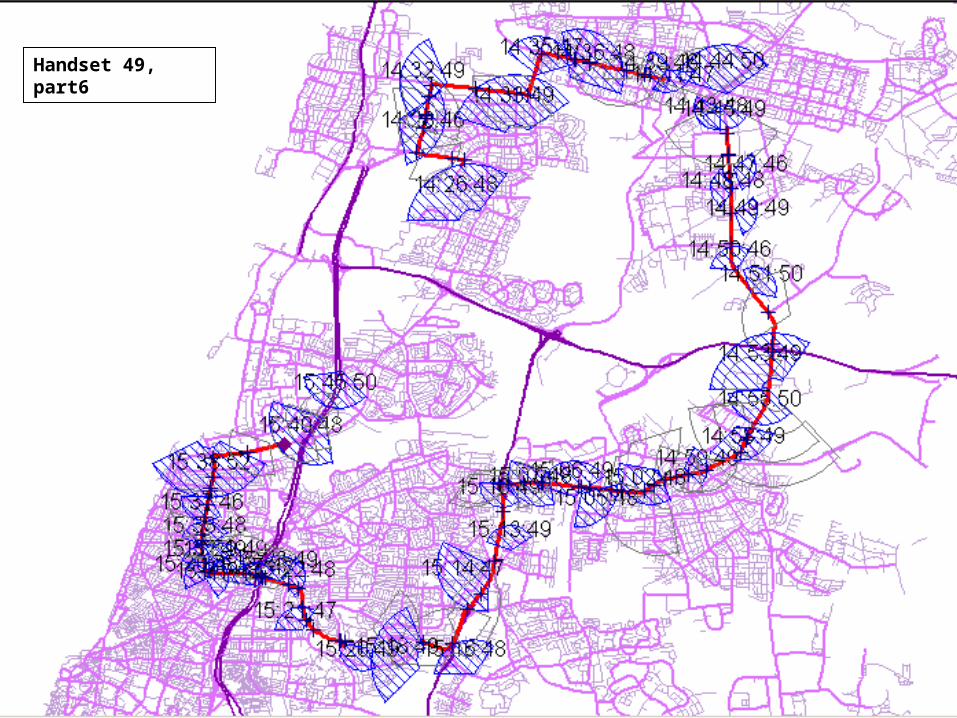
Princeton UniversityProspect Eleven Handset 49, part6
Dec. 6, 2005
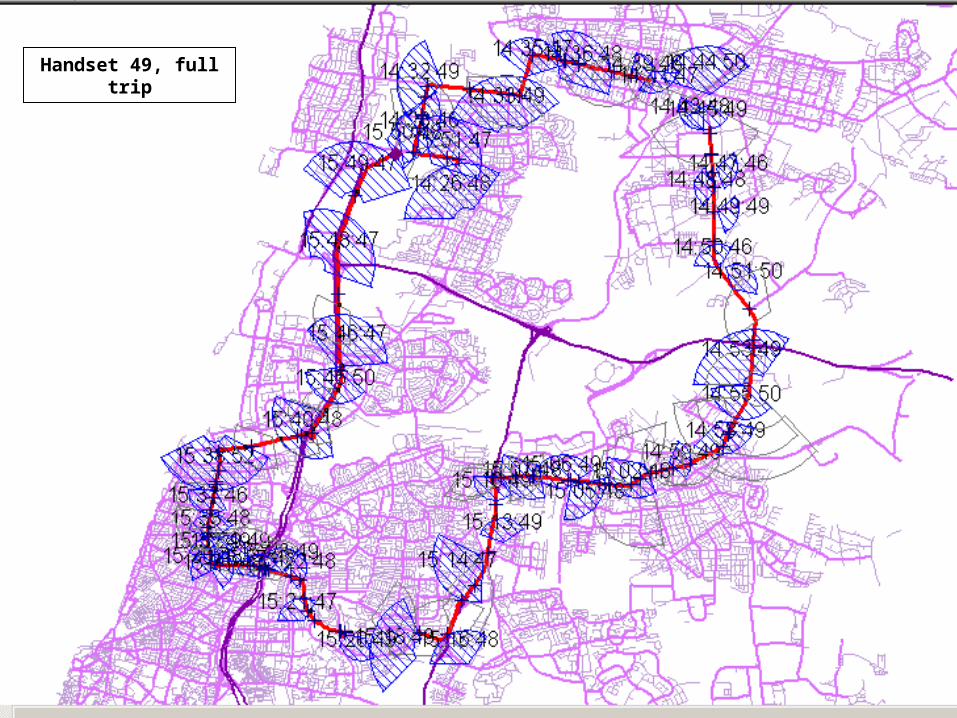
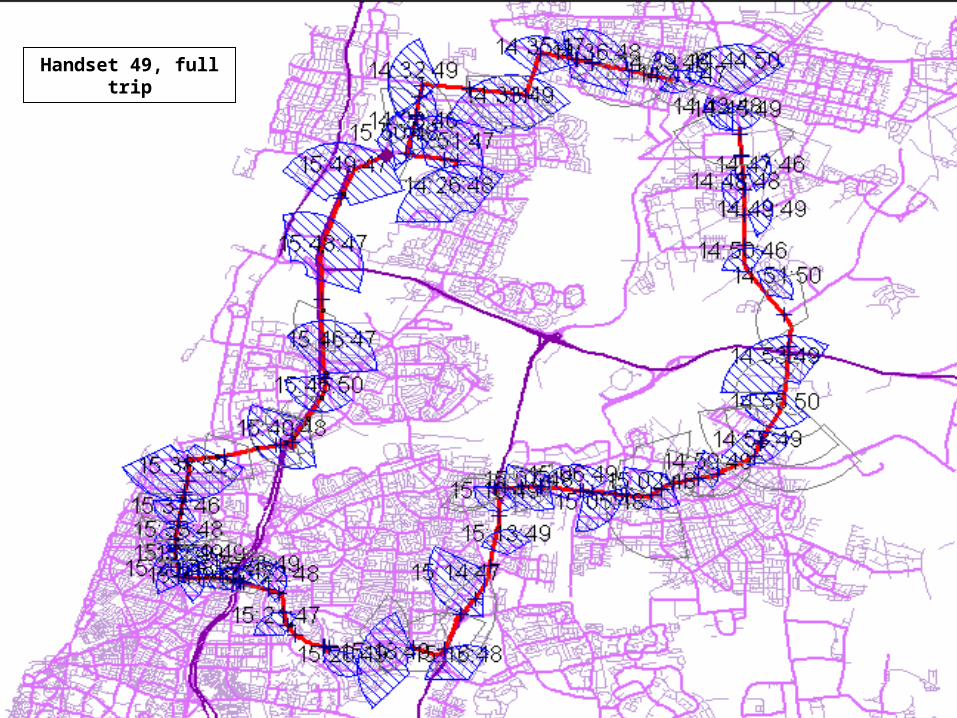
Princeton UniversityProspect Eleven Handset 49, full trip
Dec. 6, 2005
Princeton UniversityProspect Eleven Handset 49, full trip
Dec. 6, 2005
Princeton UniversityProspect Eleven
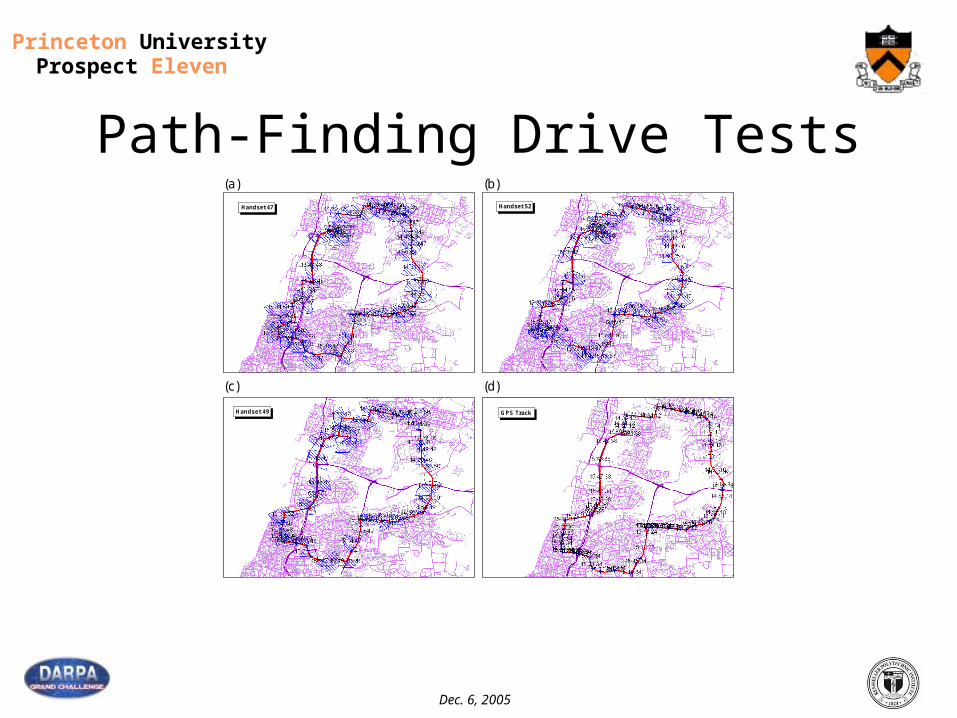
Path-Finding Drive Tests
Handset 47Handset 47 Handset 52Handset 52
Handset 49Handset 49 GPS TrackGPS Track
(b)(a)
(c) (d)
Dec. 6, 2005
Princeton UniversityProspect Eleven
Possible Applications• Travel Times
– For message signs; web sites• Performance measures
– Include arterial network– “Top 10” routes– TTI-type reports
• Operations planning– Special events– Work zone management– Evaluation of actions
• Safety– Focus on problem areas and assessments
• Port/intermodal access• Local/regional web sites• Statewide coverage
Dec. 6, 2005
Princeton UniversityProspect Eleven
Applications• General Planning and Management
– Regional congestion management– Archived data supports system analysis, ”average day”
information, long-range planning– Integrated regional or corridor management– Plan for “extreme” or special events– Homeland security applications – no-notice evacuations– Rapid evaluation of alternatives– Work zone management– Rural planning and operations– Traffic volume estimates -- future
Dec. 6, 2005
Princeton UniversityProspect Eleven
Applications (2)• Performance Measurement
– System performance in near real time
– Reliability measures – critical from user’s perspective (travel time index, planning time index, etc.)
– Performance-based systems – information for operators, users, and the public
– Congestion management – support for HOT lanes and other finance alternatives
– Economic value from partnerships with business – the DOT a part of just in time delivery
Dec. 6, 2005
Princeton UniversityProspect Eleven
Applications (3)• Travel Demand and Air Quality Modeling
– Today – Validate travel demand and Mobile6 models– Tomorrow – origin/destination data– Tomorrow – New model development: activity-based and beyond
• Safety– Analysis and prediction– Targeted deployment of safety personnel
• Communication– Public participation – real data on congestion– Near real-time data – web, PDA, 511– Premium 511 service
Dec. 6, 2005
Princeton UniversityProspect Eleven
Applications (4)• Freight Operations
– Web- or cell-based distribution of roadway information– Individual dynamic routing recommendations based on congestion– Travel time prediction to improve asset utilization
• Freight Analytics– Strategic analysis of freight movement for congestion mitigation– Origin/destination data to examine flows and set priorities– Support for cost/benefit and alternatives analysis
Dec. 6, 2005
Princeton UniversityProspect Eleven
Safety Example• Operational tool
– Assign patrol cars to road segments based on:• Average speed – Z percent above speed limit
• Trigger points – X percent of traffic more than Y percent above speed limit
– Identify trends and historical patterns
– Short-term forecasts
• Evaluation tool – near real-time– Assess what worked and how well
– Statistical analysis of patterns
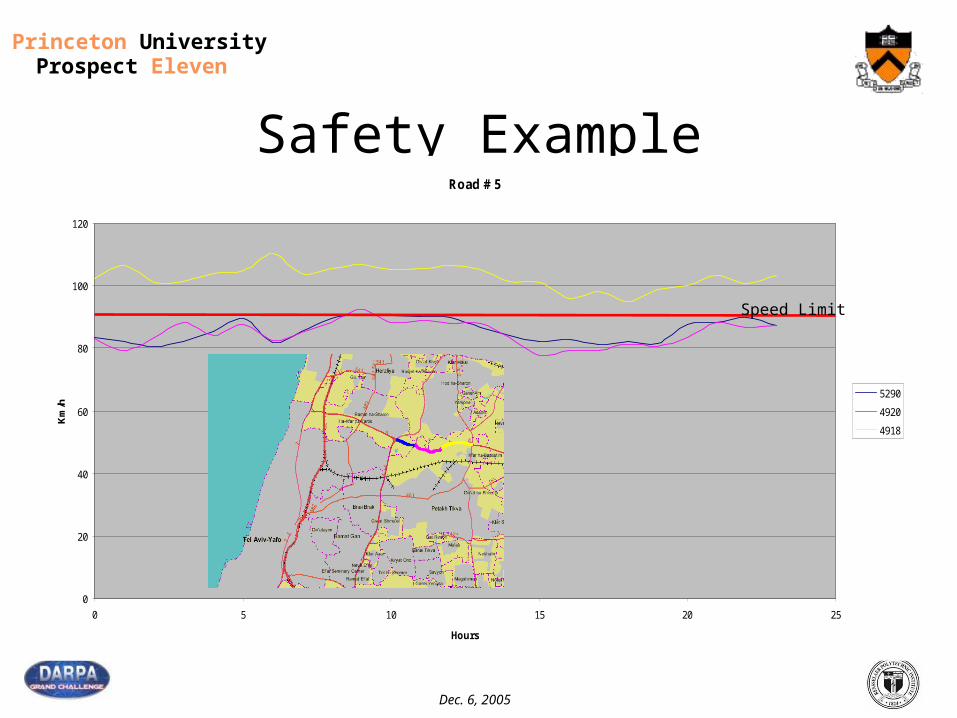
Dec. 6, 2005
Princeton UniversityProspect Eleven
Safety ExampleRoad # 5
0
20
40
60
80
100
120
0 5 10 15 20 25
Hours
Km
/h
5290
4920
4918
Speed Limit