Embed Size (px)
Citation preview
1
Primary Factors behind the Heavy Rain Event of July 2018 and the Subsequent
Heatwave in Japan from Mid-July Onward
22 August 2018
Tokyo Climate Center, Japan Meteorological Agency
https://ds.data.jma.go.jp/tcc/tcc/index.html
Abstract
Japan experienced significant rainfall particularly from western Japan to the Tokai region mainly
in early July (The Heavy Rain Event of July 2018), which caused widespread havoc nationwide.
Extremely high temperatures subsequently persisted throughout most of Japan from mid-July
onward.
In this context, the Japan Meteorological Agency (with the help of the Tokyo Climate Center
Advisory Panel on Extreme Climatic Events) investigates atmospheric and oceanic conditions
considered to have contributed to such climate extremes and summarizes related primary factors.
Based on this work, the Heavy Rain Event of July 2018 is attributed to an ongoing concentration of
two massively moist air streams over western Japan and persistent upward flow associated with the
activation of a stationary Baiu front. The related heatwave is attributed to the expansion of a
persistent North Pacific Subtropical High and Tibetan High to the Japanese mainland. The serial
occurrence of these two extreme climate events was caused by significant and persistent meandering
of the subtropical jet stream in the upper troposphere. The long-term trend of increased intensity in
observed extreme precipitation events in Japan and the clear upward trend in amounts of airborne
water vapor also suggest that the Heavy Rain Event may be linked to global warming. Global
warming and ongoing higher-than-normal zonally averaged tropospheric air temperatures associated
with the northward shift of the subtropical jet stream are also considered responsible for the extreme
heatwave.
Table of contents
Introduction
1. The Heavy Rain Event of July 2018
1.1 Climate conditions
1.2 Primary factors behind rainfall with relatively large temporal/spatial scales
1.2.1 Ongoing concentration of two massively moist air streams over western Japan
1.2.2 Persistence of upward flow associated with activation of the stationary Baiu front
1.2.3 Characteristics of line-shaped precipitation systems
1.3 Primary factors behind large-scale atmospheric circulation
2. Heatwave in Japan from mid-July onward
2.1 Climate conditions
2.2 Primary factors behind the heatwave
References
Annexes
2
Introduction
The Heavy Rain Event of July 2018 is the official name given by the Japan Meteorological
Agency (JMA) to an extreme climate event that brought unprecedented amounts of precipitation
throughout Japan. It caused significant disaster conditions, particularly from western Japan to the
country’s Tokai region, in early July in association with the presence of a stationary Baiu front and
Typhoon Prapiroon (T1807), which caused widespread havoc nationwide. Extremely high
temperatures subsequently persisted throughout Japan (except in the Okinawa/Amami region) in
association with a stronger-than-normal North Pacific Subtropical High in the vicinity of the nation
from mid-July onward.
To clarify the conditions of the event, identify possible causative factors and enable the timely
provision of related climate information to the public, JMA has analyzed the general characteristics
of and primary factors behind the Heavy Rain Event of July 2018 (28th June – 8th July) and the
notable heatwave conditions observed from mid-July onward. In parallel with these efforts, the
Tokyo Climate Center (TCC) Advisory Panel on Extreme Climatic Events (a JMA body staffed by
prominent experts on climate science from universities and research institutes) has investigated
atmospheric and oceanic conditions considered to have contributed to such extreme climatic
conditions.
This report summarizes the above climate extremes and possible related factors based on analysis
conducted by JMA with the help of the panel. It consists of two chapters – one for each event – and
related annexes.
3
1. The Heavy Rain Event of July 2018
1.1 Climate conditions
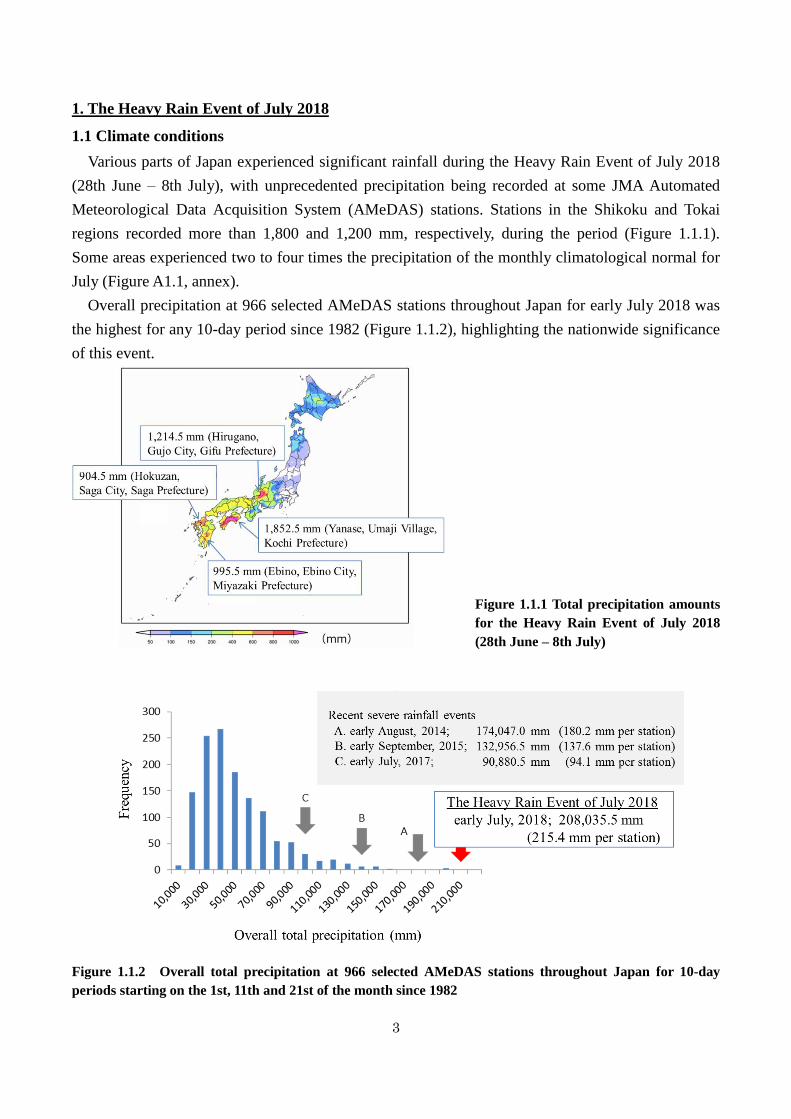
Various parts of Japan experienced significant rainfall during the Heavy Rain Event of July 2018
(28th June – 8th July), with unprecedented precipitation being recorded at some JMA Automated
Meteorological Data Acquisition System (AMeDAS) stations. Stations in the Shikoku and Tokai
regions recorded more than 1,800 and 1,200 mm, respectively, during the period (Figure 1.1.1).
Some areas experienced two to four times the precipitation of the monthly climatological normal for
July (Figure A1.1, annex).
Overall precipitation at 966 selected AMeDAS stations throughout Japan for early July 2018 was
the highest for any 10-day period since 1982 (Figure 1.1.2), highlighting the nationwide significance
of this event.
Figure 1.1.1 Total precipitation amounts
for the Heavy Rain Event of July 2018
(28th June – 8th July)
Figure 1.1.2 Overall total precipitation at 966 selected AMeDAS stations throughout Japan for 10-day
periods starting on the 1st, 11th and 21st of the month since 1982
4
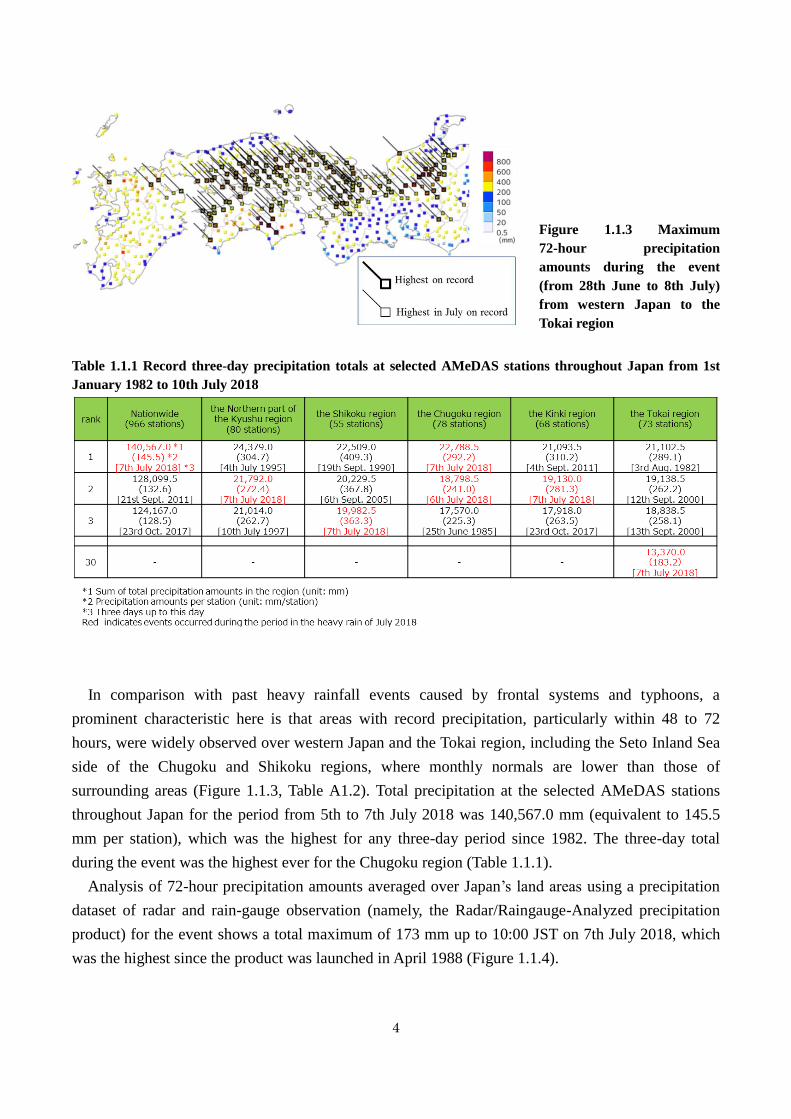
Figure 1.1.3 Maximum
72-hour precipitation
amounts during the event
(from 28th June to 8th July)
from western Japan to the
Tokai region
Table 1.1.1 Record three-day precipitation totals at selected AMeDAS stations throughout Japan from 1st
January 1982 to 10th July 2018
In comparison with past heavy rainfall events caused by frontal systems and typhoons, a
prominent characteristic here is that areas with record precipitation, particularly within 48 to 72
hours, were widely observed over western Japan and the Tokai region, including the Seto Inland Sea
side of the Chugoku and Shikoku regions, where monthly normals are lower than those of
surrounding areas (Figure 1.1.3, Table A1.2). Total precipitation at the selected AMeDAS stations
throughout Japan for the period from 5th to 7th July 2018 was 140,567.0 mm (equivalent to 145.5
mm per station), which was the highest for any three-day period since 1982. The three-day total
during the event was the highest ever for the Chugoku region (Table 1.1.1).
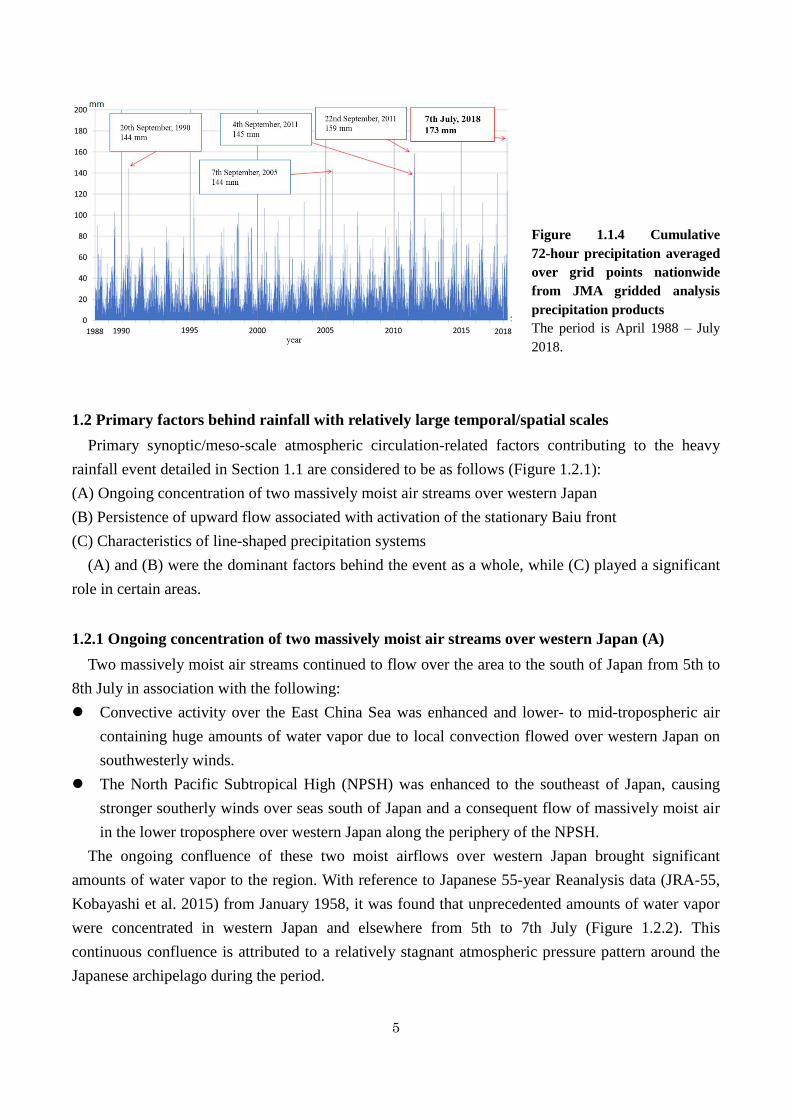
Analysis of 72-hour precipitation amounts averaged over Japan’s land areas using a precipitation
dataset of radar and rain-gauge observation (namely, the Radar/Raingauge-Analyzed precipitation
product) for the event shows a total maximum of 173 mm up to 10:00 JST on 7th July 2018, which
was the highest since the product was launched in April 1988 (Figure 1.1.4).
5
Figure 1.1.4 Cumulative
72-hour precipitation averaged
over grid points nationwide
from JMA gridded analysis
precipitation products
The period is April 1988 – July
2018.
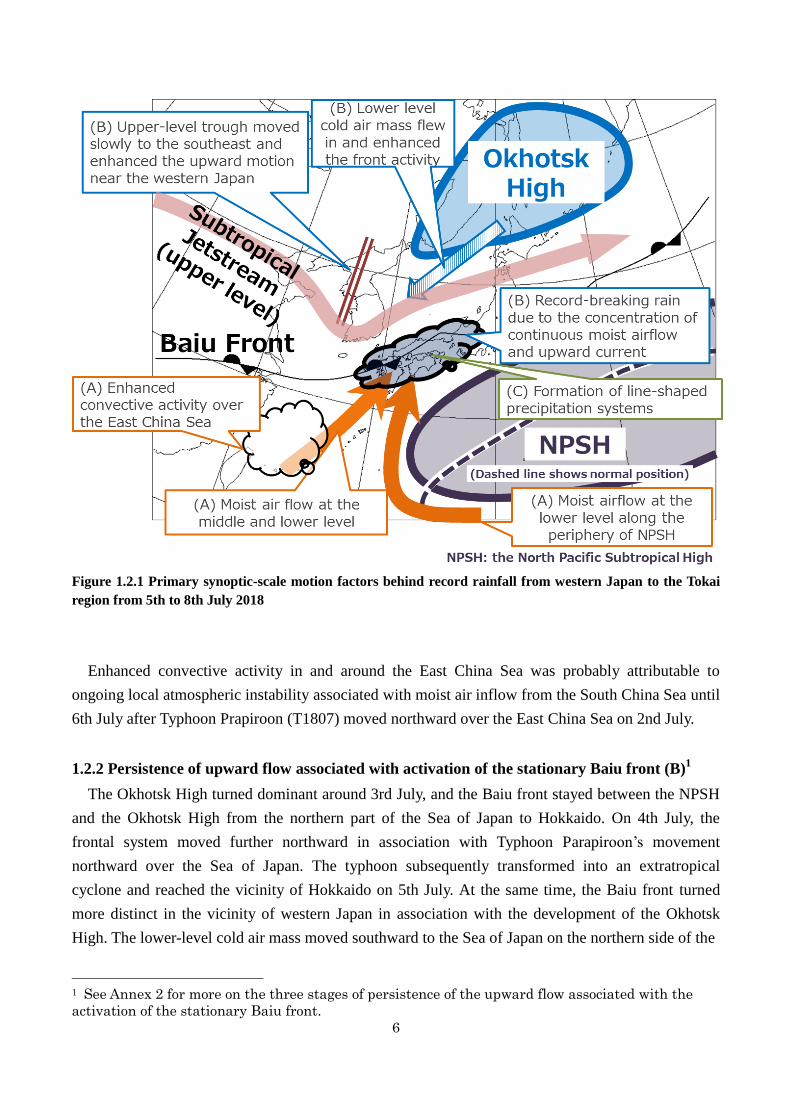
1.2 Primary factors behind rainfall with relatively large temporal/spatial scales
Primary synoptic/meso-scale atmospheric circulation-related factors contributing to the heavy
rainfall event detailed in Section 1.1 are considered to be as follows (Figure 1.2.1):
(A) Ongoing concentration of two massively moist air streams over western Japan
(B) Persistence of upward flow associated with activation of the stationary Baiu front
(C) Characteristics of line-shaped precipitation systems
(A) and (B) were the dominant factors behind the event as a whole, while (C) played a significant
role in certain areas.
1.2.1 Ongoing concentration of two massively moist air streams over western Japan (A)
Two massively moist air streams continued to flow over the area to the south of Japan from 5th to
8th July in association with the following:
Convective activity over the East China Sea was enhanced and lower- to mid-tropospheric air
containing huge amounts of water vapor due to local convection flowed over western Japan on
southwesterly winds.
The North Pacific Subtropical High (NPSH) was enhanced to the southeast of Japan, causing
stronger southerly winds over seas south of Japan and a consequent flow of massively moist air
in the lower troposphere over western Japan along the periphery of the NPSH.
The ongoing confluence of these two moist airflows over western Japan brought significant
amounts of water vapor to the region. With reference to Japanese 55-year Reanalysis data (JRA-55,
Kobayashi et al. 2015) from January 1958, it was found that unprecedented amounts of water vapor
were concentrated in western Japan and elsewhere from 5th to 7th July (Figure 1.2.2). This
continuous confluence is attributed to a relatively stagnant atmospheric pressure pattern around the
Japanese archipelago during the period.
6
Figure 1.2.1 Primary synoptic-scale motion factors behind record rainfall from western Japan to the Tokai
region from 5th to 8th July 2018
Enhanced convective activity in and around the East China Sea was probably attributable to
ongoing local atmospheric instability associated with moist air inflow from the South China Sea until
6th July after Typhoon Prapiroon (T1807) moved northward over the East China Sea on 2nd July.
1.2.2 Persistence of upward flow associated with activation of the stationary Baiu front (B)1
The Okhotsk High turned dominant around 3rd July, and the Baiu front stayed between the NPSH
and the Okhotsk High from the northern part of the Sea of Japan to Hokkaido. On 4th July, the
frontal system moved further northward in association with Typhoon Parapiroon’s movement
northward over the Sea of Japan. The typhoon subsequently transformed into an extratropical
cyclone and reached the vicinity of Hokkaido on 5th July. At the same time, the Baiu front turned
more distinct in the vicinity of western Japan in association with the development of the Okhotsk
High. The lower-level cold air mass moved southward to the Sea of Japan on the northern side of the
1 See Annex 2 for more on the three stages of persistence of the upward flow associated with the
activation of the stationary Baiu front.
7
(a)
(b)
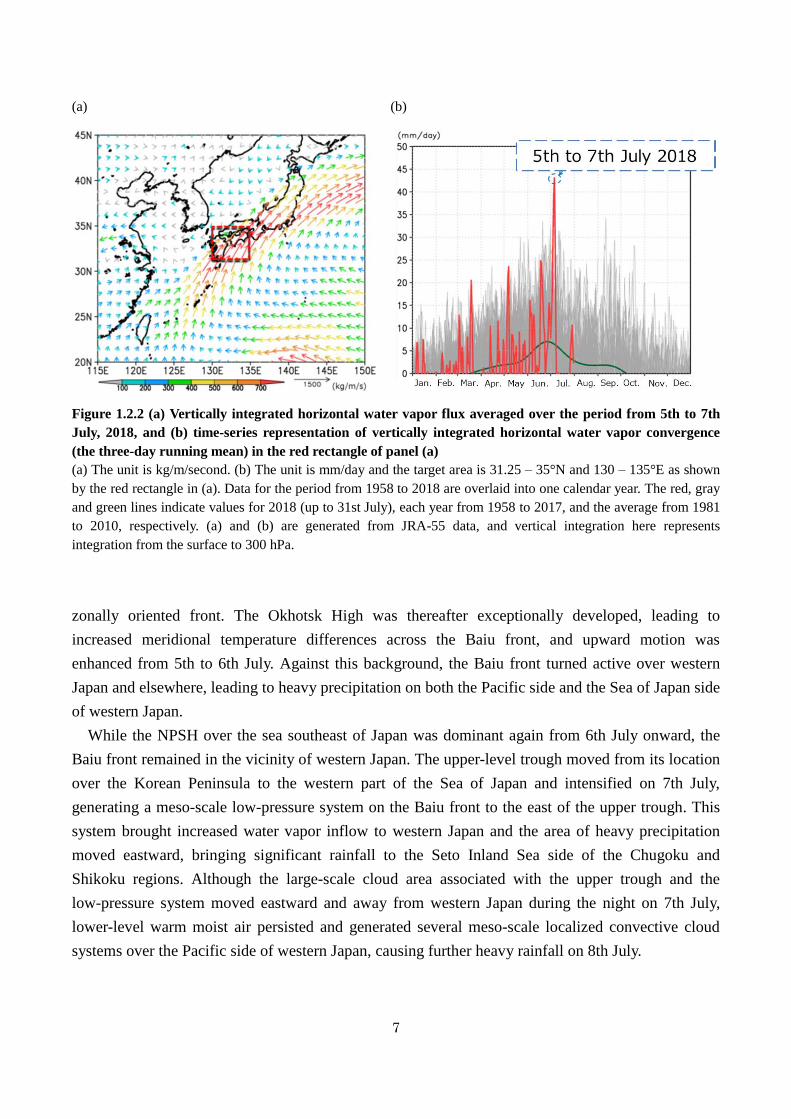
Figure 1.2.2 (a) Vertically integrated horizontal water vapor flux averaged over the period from 5th to 7th
July, 2018, and (b) time-series representation of vertically integrated horizontal water vapor convergence
(the three-day running mean) in the red rectangle of panel (a)
(a) The unit is kg/m/second. (b) The unit is mm/day and the target area is 31.25 – 35°N and 130 – 135°E as shown
by the red rectangle in (a). Data for the period from 1958 to 2018 are overlaid into one calendar year. The red, gray
and green lines indicate values for 2018 (up to 31st July), each year from 1958 to 2017, and the average from 1981
to 2010, respectively. (a) and (b) are generated from JRA-55 data, and vertical integration here represents
integration from the surface to 300 hPa.
zonally oriented front. The Okhotsk High was thereafter exceptionally developed, leading to
increased meridional temperature differences across the Baiu front, and upward motion was
enhanced from 5th to 6th July. Against this background, the Baiu front turned active over western
Japan and elsewhere, leading to heavy precipitation on both the Pacific side and the Sea of Japan side
of western Japan.
While the NPSH over the sea southeast of Japan was dominant again from 6th July onward, the
Baiu front remained in the vicinity of western Japan. The upper-level trough moved from its location
over the Korean Peninsula to the western part of the Sea of Japan and intensified on 7th July,
generating a meso-scale low-pressure system on the Baiu front to the east of the upper trough. This
system brought increased water vapor inflow to western Japan and the area of heavy precipitation
moved eastward, bringing significant rainfall to the Seto Inland Sea side of the Chugoku and
Shikoku regions. Although the large-scale cloud area associated with the upper trough and the
low-pressure system moved eastward and away from western Japan during the night on 7th July,
lower-level warm moist air persisted and generated several meso-scale localized convective cloud
systems over the Pacific side of western Japan, causing further heavy rainfall on 8th July.
8
1.2.3 Characteristics of line-shaped precipitation systems (C)
From 4th to 8th July during the Heavy Rain Event of July 2018, wide areas from the Tokai region
to the Kyushu region of Japan intermittently experienced heavy rainfall, with precipitation totals
exceeding 200 mm in many places. During this period, a total of 15 line-shaped precipitation systems
affected various areas (see Annex 3). Nine of these systems were prominent, with maximum
three-hour precipitation amounts exceeding 150 mm.
Some areas affected by the line-shaped precipitation systems experienced extended periods of
torrential rainfall, resulting in locally anomalous precipitation totals. In some places, precipitation
caused by these systems alone accounted for more than 50% of all precipitation in the event for
certain parts of the Tokai, Chugoku, Shikoku and Kyushu regions of Japan. The ratios of
precipitation caused by line-shapedar precipitation systems to the total in this event were lower than
those in the Heavy Rain Event of July 2017 in the northern part of the Kyushu region, but heavy
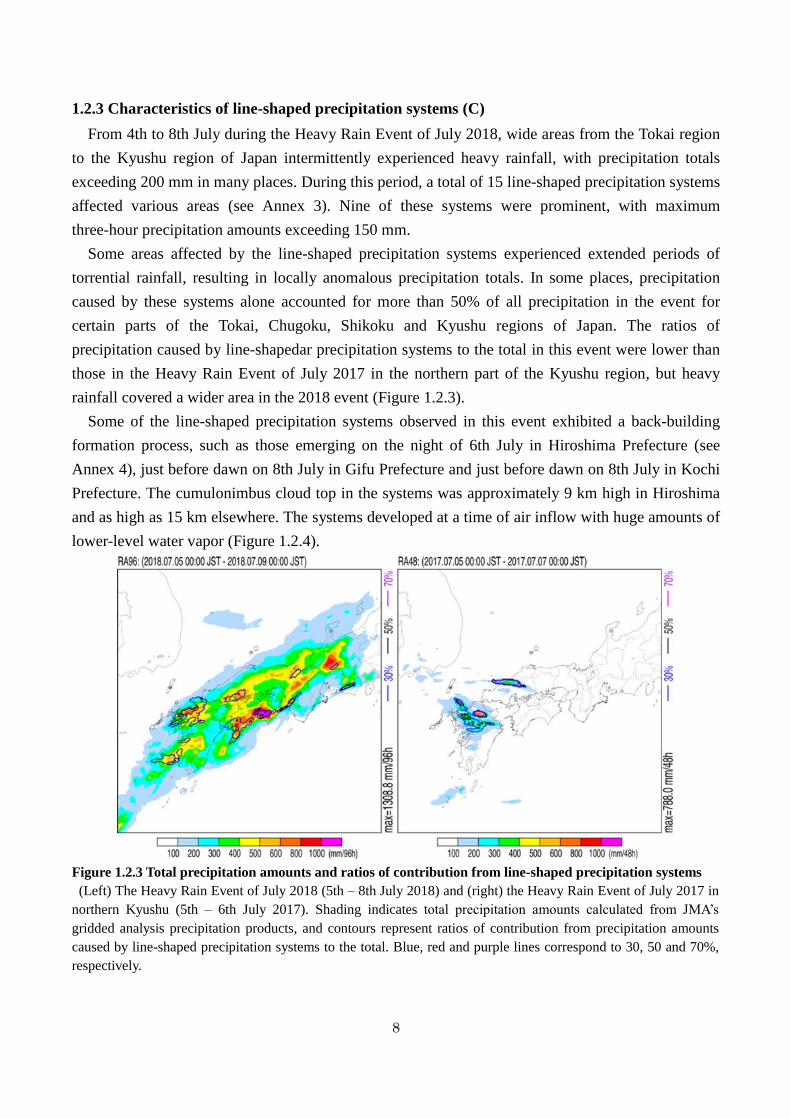
rainfall covered a wider area in the 2018 event (Figure 1.2.3).
Some of the line-shaped precipitation systems observed in this event exhibited a back-building
formation process, such as those emerging on the night of 6th July in Hiroshima Prefecture (see
Annex 4), just before dawn on 8th July in Gifu Prefecture and just before dawn on 8th July in Kochi
Prefecture. The cumulonimbus cloud top in the systems was approximately 9 km high in Hiroshima
and as high as 15 km elsewhere. The systems developed at a time of air inflow with huge amounts of
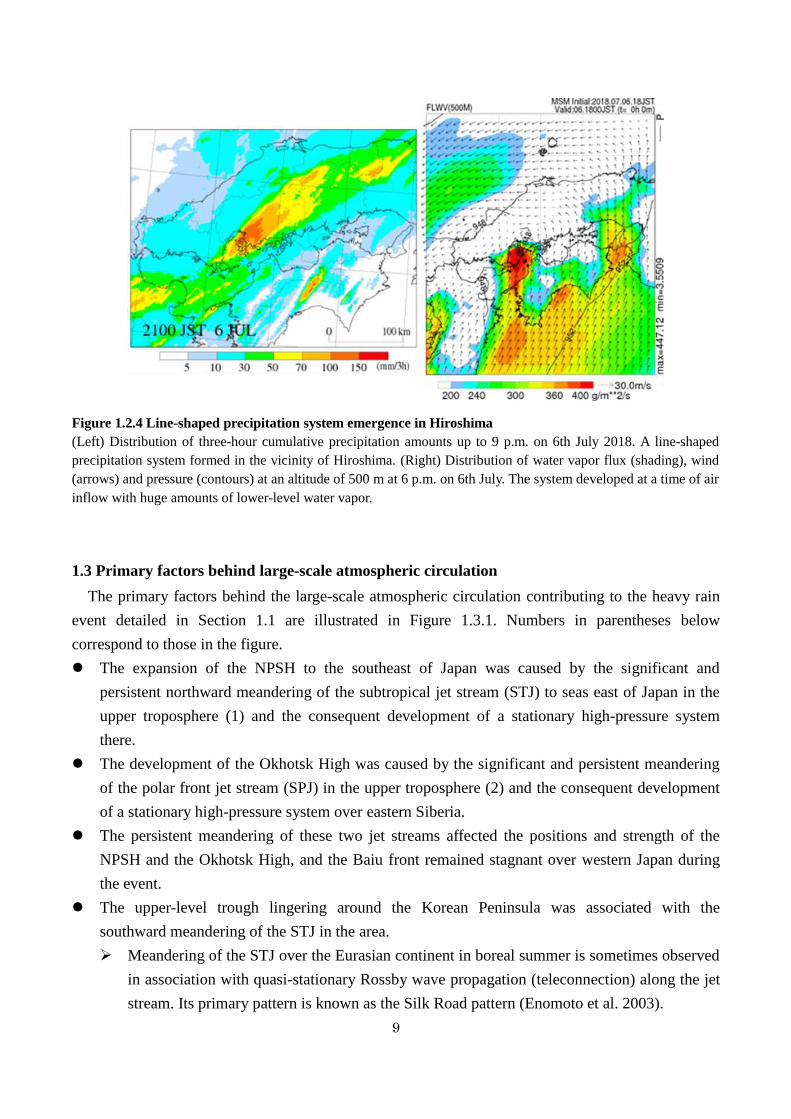
lower-level water vapor (Figure 1.2.4).
Figure 1.2.3 Total precipitation amounts and ratios of contribution from line-shaped precipitation systems
(Left) The Heavy Rain Event of July 2018 (5th – 8th July 2018) and (right) the Heavy Rain Event of July 2017 in
northern Kyushu (5th – 6th July 2017). Shading indicates total precipitation amounts calculated from JMA’s
gridded analysis precipitation products, and contours represent ratios of contribution from precipitation amounts
caused by line-shaped precipitation systems to the total. Blue, red and purple lines correspond to 30, 50 and 70%,
respectively.
9
Figure 1.2.4 Line-shaped precipitation system emergence in Hiroshima
(Left) Distribution of three-hour cumulative precipitation amounts up to 9 p.m. on 6th July 2018. A line-shaped
precipitation system formed in the vicinity of Hiroshima. (Right) Distribution of water vapor flux (shading), wind
(arrows) and pressure (contours) at an altitude of 500 m at 6 p.m. on 6th July. The system developed at a time of air
inflow with huge amounts of lower-level water vapor.
1.3 Primary factors behind large-scale atmospheric circulation
The primary factors behind the large-scale atmospheric circulation contributing to the heavy rain
event detailed in Section 1.1 are illustrated in Figure 1.3.1. Numbers in parentheses below
correspond to those in the figure.
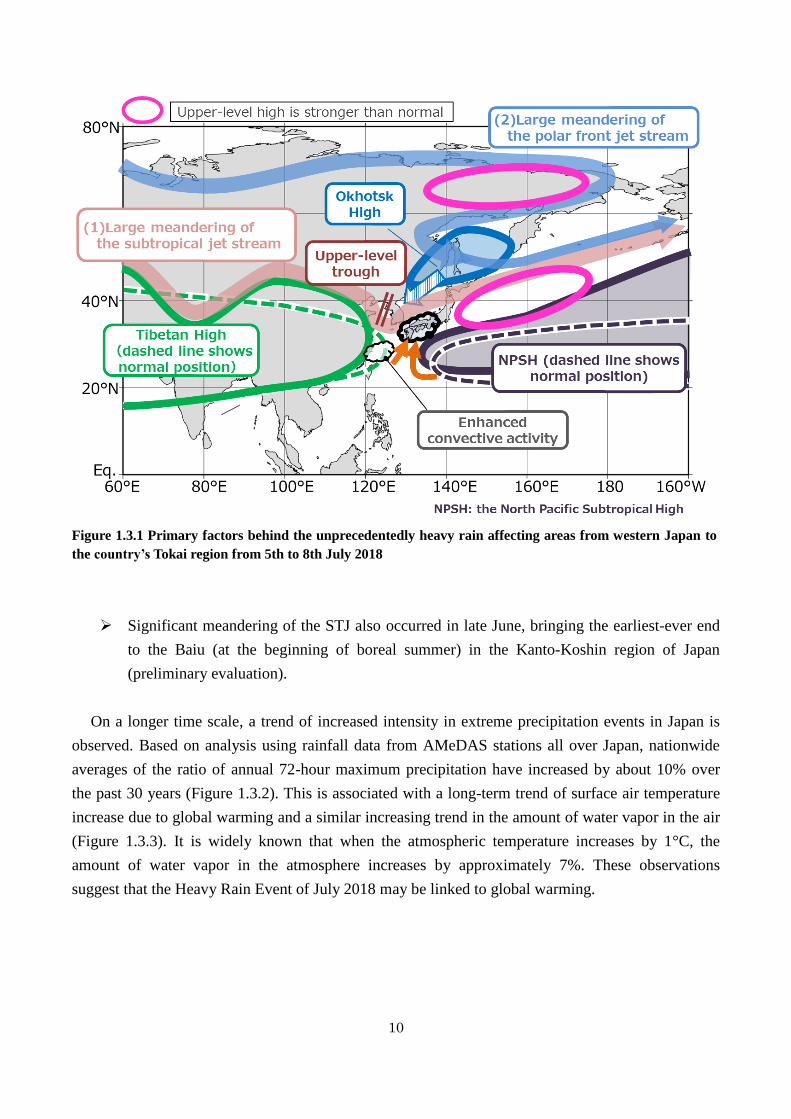
The expansion of the NPSH to the southeast of Japan was caused by the significant and
persistent northward meandering of the subtropical jet stream (STJ) to seas east of Japan in the
upper troposphere (1) and the consequent development of a stationary high-pressure system
there.
The development of the Okhotsk High was caused by the significant and persistent meandering
of the polar front jet stream (SPJ) in the upper troposphere (2) and the consequent development
of a stationary high-pressure system over eastern Siberia.
The persistent meandering of these two jet streams affected the positions and strength of the
NPSH and the Okhotsk High, and the Baiu front remained stagnant over western Japan during
the event.
The upper-level trough lingering around the Korean Peninsula was associated with the
southward meandering of the STJ in the area.
Meandering of the STJ over the Eurasian continent in boreal summer is sometimes observed
in association with quasi-stationary Rossby wave propagation (teleconnection) along the jet
stream. Its primary pattern is known as the Silk Road pattern (Enomoto et al. 2003).
10
Figure 1.3.1 Primary factors behind the unprecedentedly heavy rain affecting areas from western Japan to
the country’s Tokai region from 5th to 8th July 2018
Significant meandering of the STJ also occurred in late June, bringing the earliest-ever end
to the Baiu (at the beginning of boreal summer) in the Kanto-Koshin region of Japan
(preliminary evaluation).
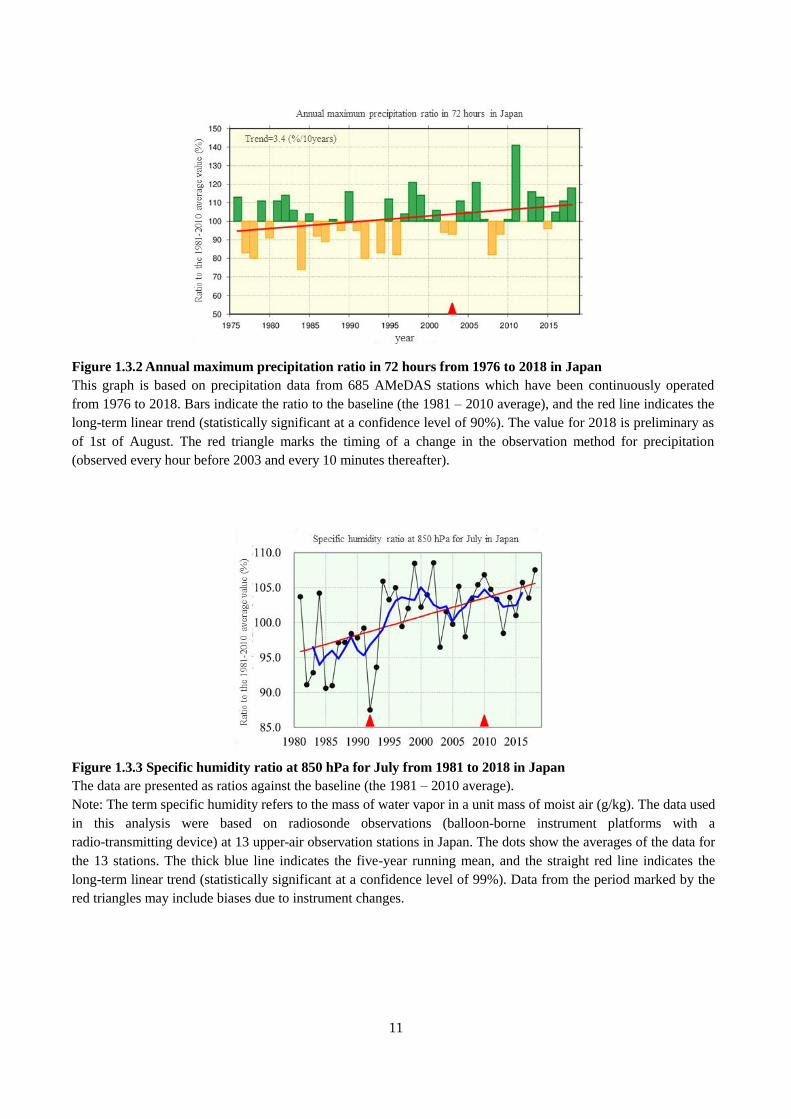
On a longer time scale, a trend of increased intensity in extreme precipitation events in Japan is
observed. Based on analysis using rainfall data from AMeDAS stations all over Japan, nationwide
averages of the ratio of annual 72-hour maximum precipitation have increased by about 10% over
the past 30 years (Figure 1.3.2). This is associated with a long-term trend of surface air temperature
increase due to global warming and a similar increasing trend in the amount of water vapor in the air
(Figure 1.3.3). It is widely known that when the atmospheric temperature increases by 1°C, the
amount of water vapor in the atmosphere increases by approximately 7%. These observations
suggest that the Heavy Rain Event of July 2018 may be linked to global warming.
11
Figure 1.3.2 Annual maximum precipitation ratio in 72 hours from 1976 to 2018 in Japan
This graph is based on precipitation data from 685 AMeDAS stations which have been continuously operated
from 1976 to 2018. Bars indicate the ratio to the baseline (the 1981 – 2010 average), and the red line indicates the
long-term linear trend (statistically significant at a confidence level of 90%). The value for 2018 is preliminary as
of 1st of August. The red triangle marks the timing of a change in the observation method for precipitation
(observed every hour before 2003 and every 10 minutes thereafter).
Figure 1.3.3 Specific humidity ratio at 850 hPa for July from 1981 to 2018 in Japan
The data are presented as ratios against the baseline (the 1981 – 2010 average).
Note: The term specific humidity refers to the mass of water vapor in a unit mass of moist air (g/kg). The data used
in this analysis were based on radiosonde observations (balloon-borne instrument platforms with a
radio-transmitting device) at 13 upper-air observation stations in Japan. The dots show the averages of the data for
the 13 stations. The thick blue line indicates the five-year running mean, and the straight red line indicates the
long-term linear trend (statistically significant at a confidence level of 99%). Data from the period marked by the
red triangles may include biases due to instrument changes.
12
2. Heatwave in Japan from mid-July onward
2.1 Climate conditions
The Heavy Rain Event of July 2018 ended in association with the northward shift of the stationary
Baiu front due to re-enhancement of the NPSH. This shift precipitated the withdrawal of the Baiu,
and preliminary analysis indicates that the dates of withdrawal from Japan’s Hokuriku region to the
northern part of the Kyushu region were significantly earlier than those of the climatological normal.
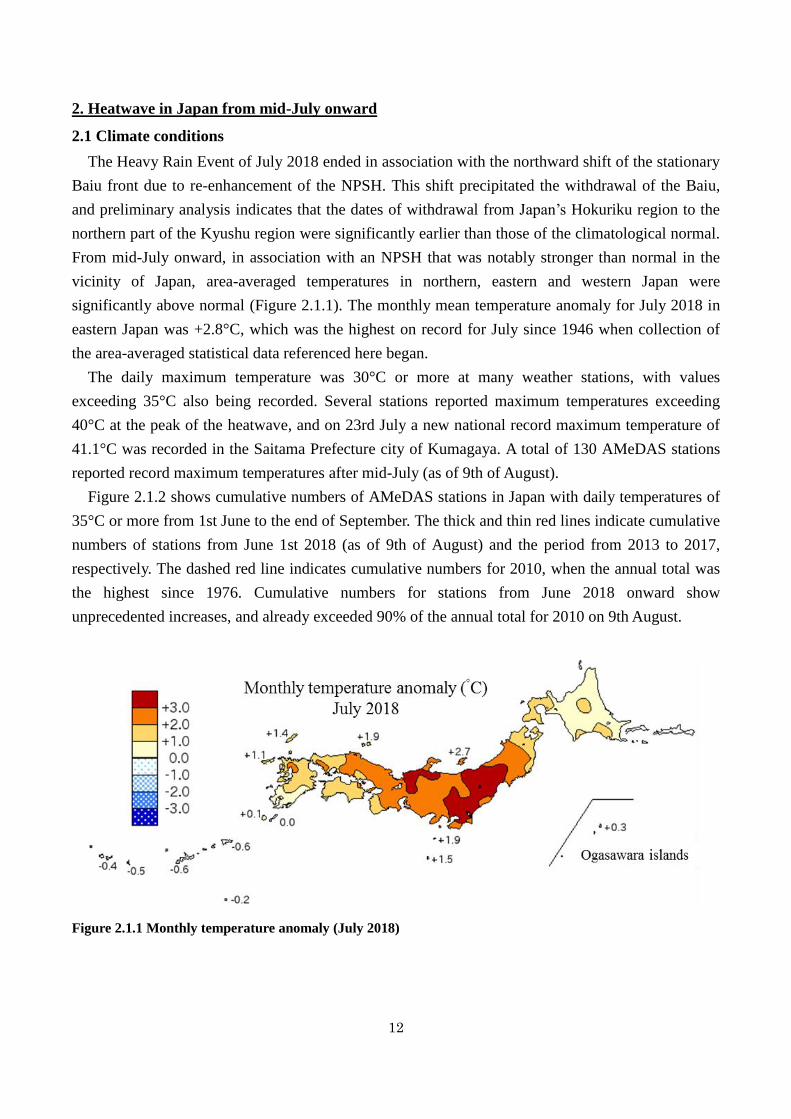
From mid-July onward, in association with an NPSH that was notably stronger than normal in the
vicinity of Japan, area-averaged temperatures in northern, eastern and western Japan were
significantly above normal (Figure 2.1.1). The monthly mean temperature anomaly for July 2018 in
eastern Japan was +2.8°C, which was the highest on record for July since 1946 when collection of
the area-averaged statistical data referenced here began.
The daily maximum temperature was 30°C or more at many weather stations, with values
exceeding 35°C also being recorded. Several stations reported maximum temperatures exceeding
40°C at the peak of the heatwave, and on 23rd July a new national record maximum temperature of
41.1°C was recorded in the Saitama Prefecture city of Kumagaya. A total of 130 AMeDAS stations
reported record maximum temperatures after mid-July (as of 9th of August).
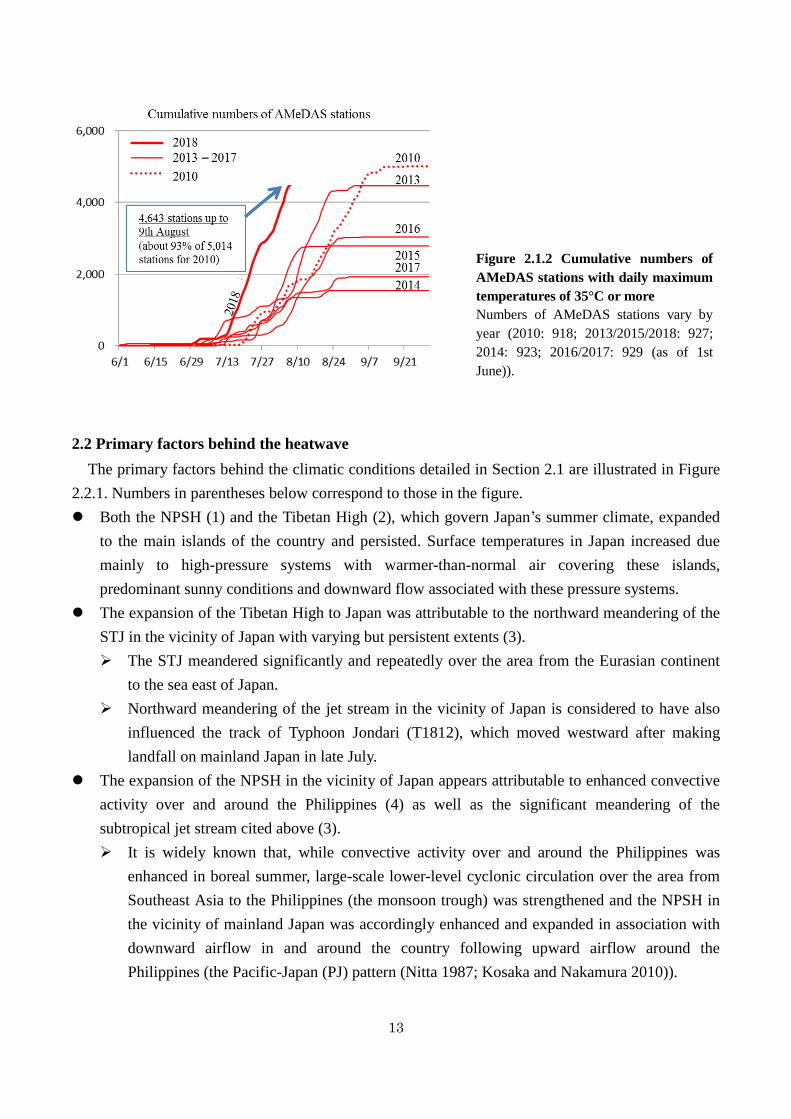
Figure 2.1.2 shows cumulative numbers of AMeDAS stations in Japan with daily temperatures of
35°C or more from 1st June to the end of September. The thick and thin red lines indicate cumulative
numbers of stations from June 1st 2018 (as of 9th of August) and the period from 2013 to 2017,
respectively. The dashed red line indicates cumulative numbers for 2010, when the annual total was
the highest since 1976. Cumulative numbers for stations from June 2018 onward show
unprecedented increases, and already exceeded 90% of the annual total for 2010 on 9th August.
Figure 2.1.1 Monthly temperature anomaly (July 2018)
13
Figure 2.1.2 Cumulative numbers of
AMeDAS stations with daily maximum
temperatures of 35°C or more
Numbers of AMeDAS stations vary by
year (2010: 918; 2013/2015/2018: 927;
2014: 923; 2016/2017: 929 (as of 1st
June)).
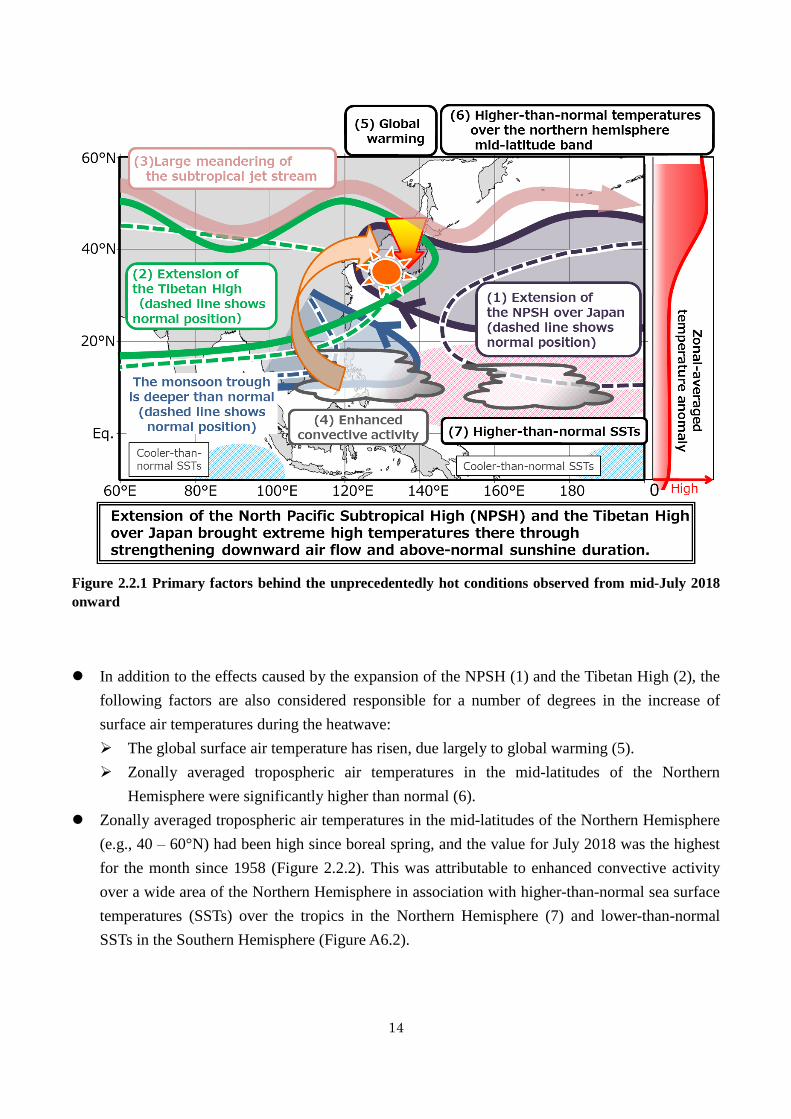
2.2 Primary factors behind the heatwave
The primary factors behind the climatic conditions detailed in Section 2.1 are illustrated in Figure
2.2.1. Numbers in parentheses below correspond to those in the figure.
Both the NPSH (1) and the Tibetan High (2), which govern Japan’s summer climate, expanded
to the main islands of the country and persisted. Surface temperatures in Japan increased due
mainly to high-pressure systems with warmer-than-normal air covering these islands,
predominant sunny conditions and downward flow associated with these pressure systems.
The expansion of the Tibetan High to Japan was attributable to the northward meandering of the
STJ in the vicinity of Japan with varying but persistent extents (3).
The STJ meandered significantly and repeatedly over the area from the Eurasian continent
to the sea east of Japan.
Northward meandering of the jet stream in the vicinity of Japan is considered to have also
influenced the track of Typhoon Jondari (T1812), which moved westward after making
landfall on mainland Japan in late July.
The expansion of the NPSH in the vicinity of Japan appears attributable to enhanced convective
activity over and around the Philippines (4) as well as the significant meandering of the
subtropical jet stream cited above (3).
It is widely known that, while convective activity over and around the Philippines was
enhanced in boreal summer, large-scale lower-level cyclonic circulation over the area from
Southeast Asia to the Philippines (the monsoon trough) was strengthened and the NPSH in
the vicinity of mainland Japan was accordingly enhanced and expanded in association with
downward airflow in and around the country following upward airflow around the
Philippines (the Pacific-Japan (PJ) pattern (Nitta 1987; Kosaka and Nakamura 2010)).
14
Figure 2.2.1 Primary factors behind the unprecedentedly hot conditions observed from mid-July 2018
onward
In addition to the effects caused by the expansion of the NPSH (1) and the Tibetan High (2), the
following factors are also considered responsible for a number of degrees in the increase of
surface air temperatures during the heatwave:
The global surface air temperature has risen, due largely to global warming (5).
Zonally averaged tropospheric air temperatures in the mid-latitudes of the Northern
Hemisphere were significantly higher than normal (6).
Zonally averaged tropospheric air temperatures in the mid-latitudes of the Northern Hemisphere
(e.g., 40 – 60°N) had been high since boreal spring, and the value for July 2018 was the highest
for the month since 1958 (Figure 2.2.2). This was attributable to enhanced convective activity
over a wide area of the Northern Hemisphere in association with higher-than-normal sea surface
temperatures (SSTs) over the tropics in the Northern Hemisphere (7) and lower-than-normal
SSTs in the Southern Hemisphere (Figure A6.2).
15
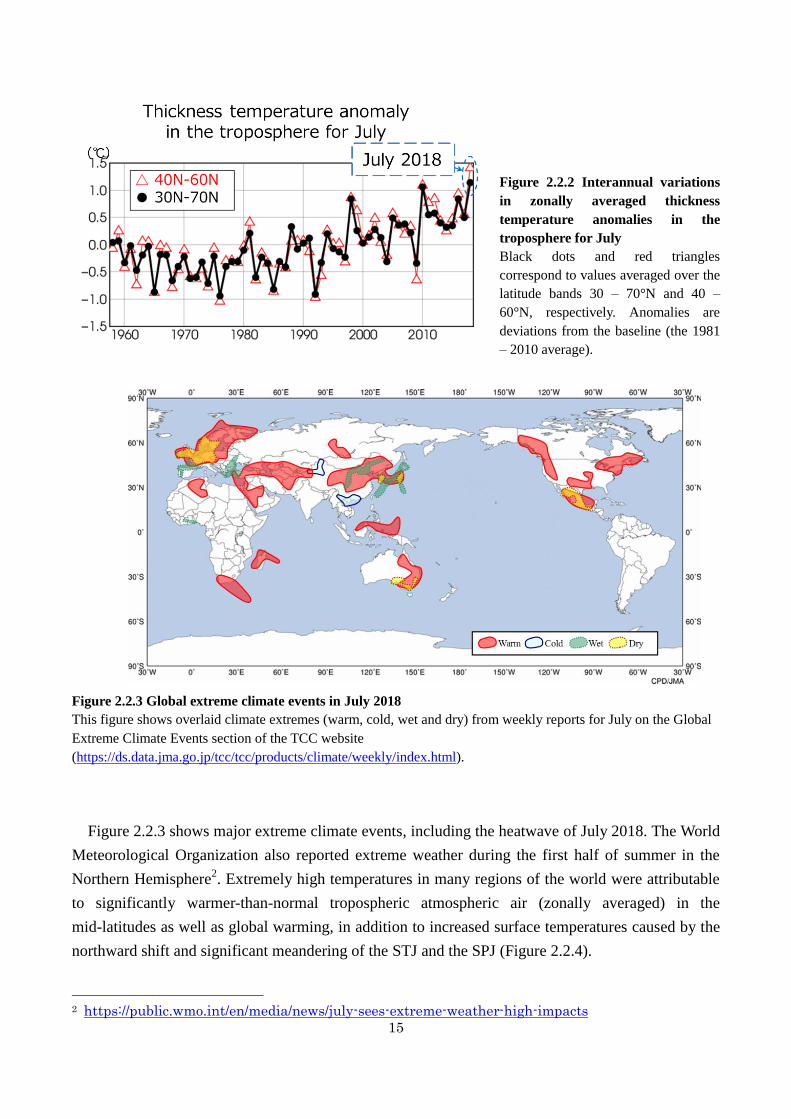
Figure 2.2.2 Interannual variations
in zonally averaged thickness
temperature anomalies in the
troposphere for July
Black dots and red triangles
correspond to values averaged over the
latitude bands 30 – 70°N and 40 –
60°N, respectively. Anomalies are
deviations from the baseline (the 1981
– 2010 average).
Figure 2.2.3 Global extreme climate events in July 2018
This figure shows overlaid climate extremes (warm, cold, wet and dry) from weekly reports for July on the Global
Extreme Climate Events section of the TCC website
(https://ds.data.jma.go.jp/tcc/tcc/products/climate/weekly/index.html).
Figure 2.2.3 shows major extreme climate events, including the heatwave of July 2018. The World
Meteorological Organization also reported extreme weather during the first half of summer in the
Northern Hemisphere2. Extremely high temperatures in many regions of the world were attributable
to significantly warmer-than-normal tropospheric atmospheric air (zonally averaged) in the
mid-latitudes as well as global warming, in addition to increased surface temperatures caused by the
northward shift and significant meandering of the STJ and the SPJ (Figure 2.2.4).
2 https://public.wmo.int/en/media/news/july-sees-extreme-weather-high-impacts
16
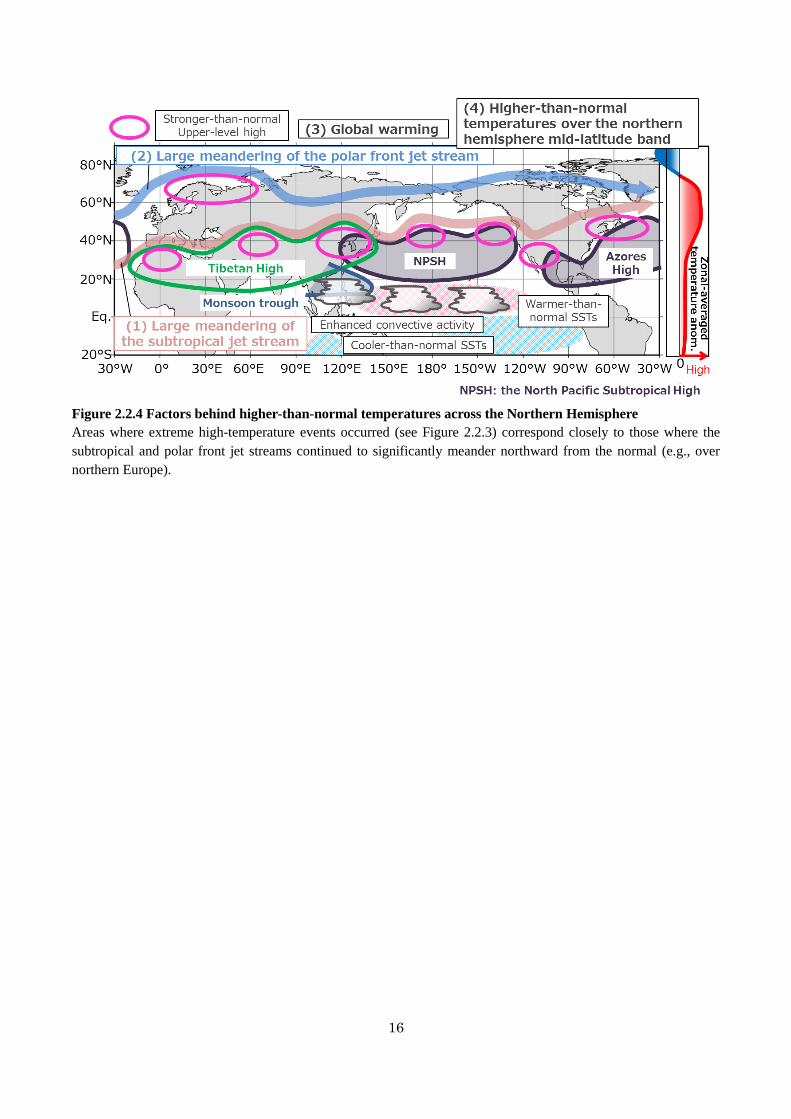
Figure 2.2.4 Factors behind higher-than-normal temperatures across the Northern Hemisphere
Areas where extreme high-temperature events occurred (see Figure 2.2.3) correspond closely to those where the
subtropical and polar front jet streams continued to significantly meander northward from the normal (e.g., over
northern Europe).
17
References
Enomoto, T., B. J. Hoskins and Y. Matsuda, 2003: The formation mechanism of the Bonin high in
August. Quart. J. Roy. Meteor. Soc., 129, 157 – 178.
Kobayashi, S., Y. Ota, Y. Harada, A. Ebita, M. Moriya, H. Onoda, K. Onogi, H. Kamahori, C.
Kobayashi, H. Endo, K. Miyaoka and K. Takahashi, 2015: The JRA-55 Reanalysis: General
specifications and basic characteristics. J. Meteor. Soc. Japan, 93, 5 – 48.
Kosaka, Y., and H. Nakamura, 2010: Mechanisms of meridional teleconnection observed between a
summer monsoon system and a subtropical anticyclone. Part I: The Pacific-Japan pattern. J.
Climate, 23, 5085 – 5108.
Nitta, T., 1987: Convective activities in the tropical western Pacific and their impact on the Northern
Hemisphere summer circulation. J. Meteor. Soc. Japan, 65, 373 – 390.
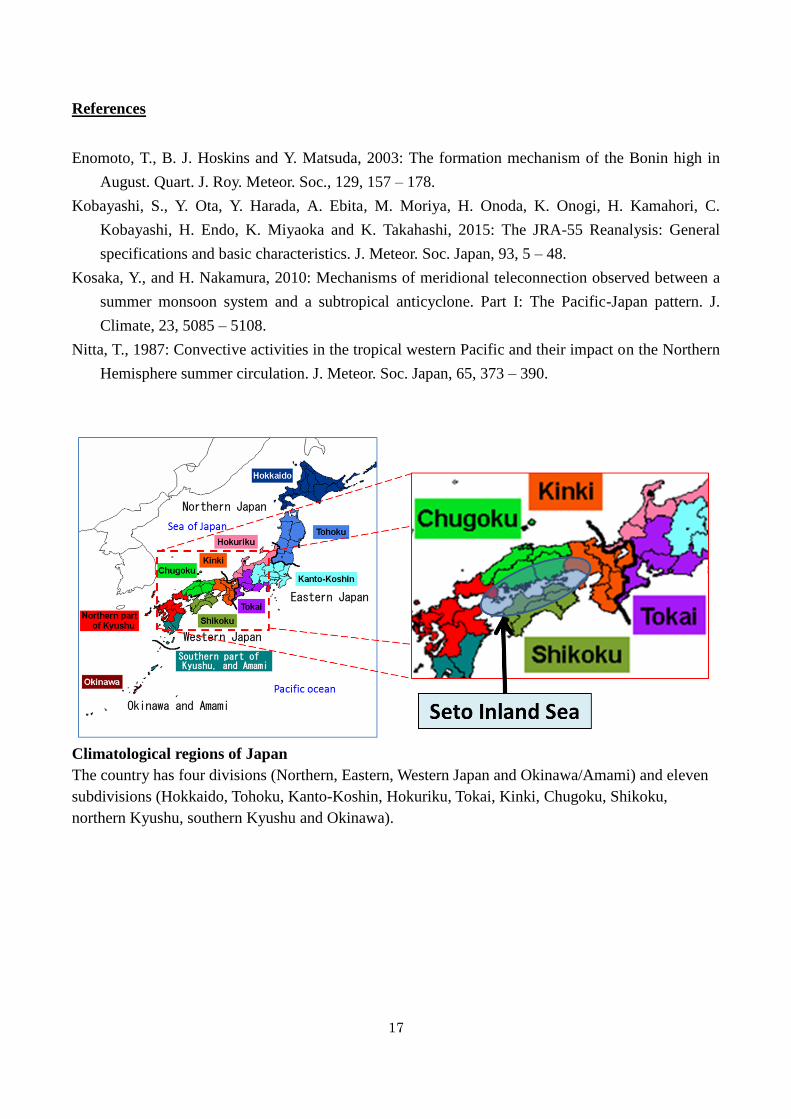
Climatological regions of Japan
The country has four divisions (Northern, Eastern, Western Japan and Okinawa/Amami) and eleven
subdivisions (Hokkaido, Tohoku, Kanto-Koshin, Hokuriku, Tokai, Kinki, Chugoku, Shikoku,
northern Kyushu, southern Kyushu and Okinawa).
18
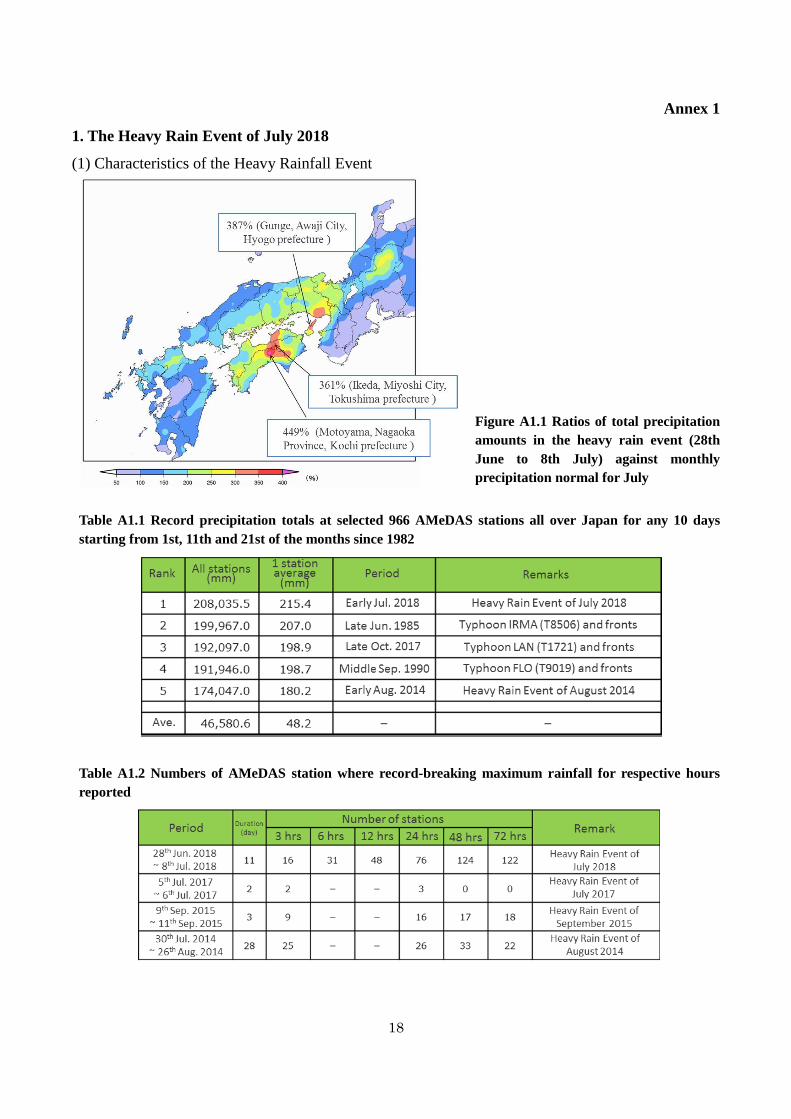
Annex 1
1. The Heavy Rain Event of July 2018
(1) Characteristics of the Heavy Rainfall Event
Figure A1.1 Ratios of total precipitation
amounts in the heavy rain event (28th
June to 8th July) against monthly
precipitation normal for July
Table A1.1 Record precipitation totals at selected 966 AMeDAS stations all over Japan for any 10 days
starting from 1st, 11th and 21st of the months since 1982
Table A1.2 Numbers of AMeDAS station where record-breaking maximum rainfall for respective hours
reported
19
Annex 2
1. The Heavy Rain Event of July 2018
(2) Primary factors behind rainfall with relatively large temporal/spatial scales
(B) Persistence of upward flow associated with activation of the stationary Baiu front
This extreme precipitation event is characterized by a continuance of the heavy rainfall for several days.
Factors that contributed to the heavy rainfall were investigated in detail and were found to vary with time.
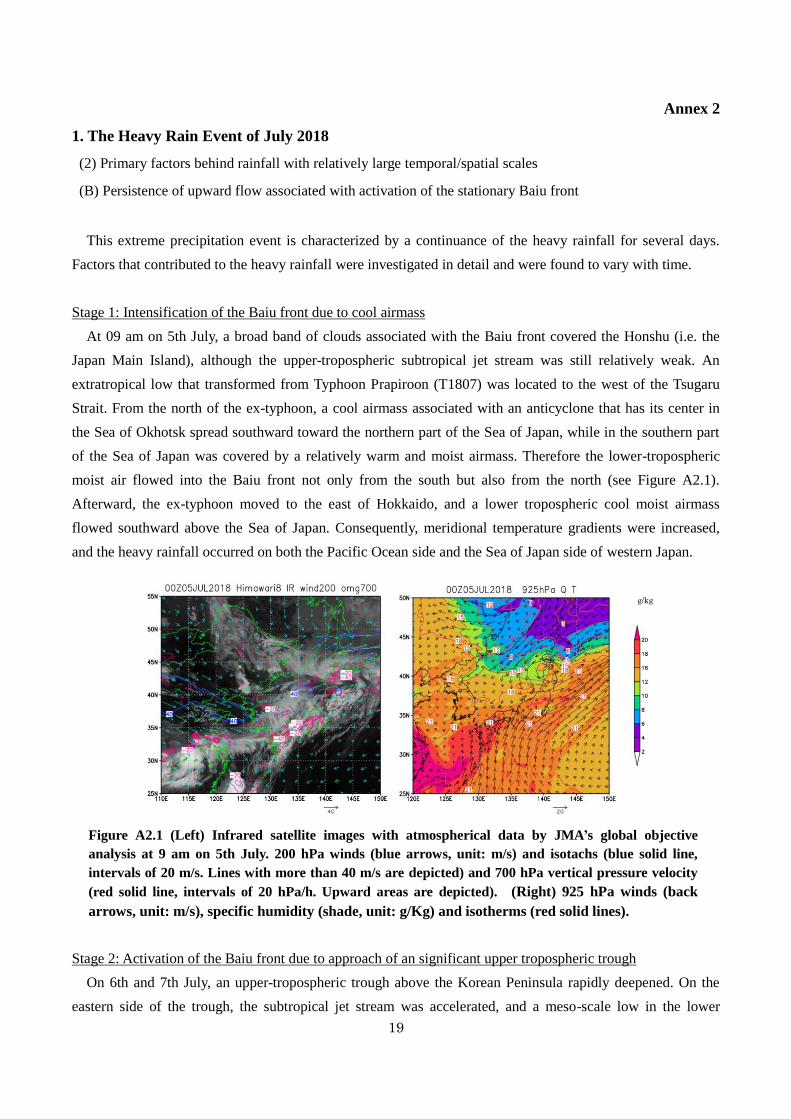
Stage 1: Intensification of the Baiu front due to cool airmass
At 09 am on 5th July, a broad band of clouds associated with the Baiu front covered the Honshu (i.e. the
Japan Main Island), although the upper-tropospheric subtropical jet stream was still relatively weak. An
extratropical low that transformed from Typhoon Prapiroon (T1807) was located to the west of the Tsugaru
Strait. From the north of the ex-typhoon, a cool airmass associated with an anticyclone that has its center in
the Sea of Okhotsk spread southward toward the northern part of the Sea of Japan, while in the southern part
of the Sea of Japan was covered by a relatively warm and moist airmass. Therefore the lower-tropospheric
moist air flowed into the Baiu front not only from the south but also from the north (see Figure A2.1).
Afterward, the ex-typhoon moved to the east of Hokkaido, and a lower tropospheric cool moist airmass
flowed southward above the Sea of Japan. Consequently, meridional temperature gradients were increased,
and the heavy rainfall occurred on both the Pacific Ocean side and the Sea of Japan side of western Japan.
Figure A2.1 (Left) Infrared satellite images with atmospherical data by JMA’s global objective
analysis at 9 am on 5th July. 200 hPa winds (blue arrows, unit: m/s) and isotachs (blue solid line,
intervals of 20 m/s. Lines with more than 40 m/s are depicted) and 700 hPa vertical pressure velocity
(red solid line, intervals of 20 hPa/h. Upward areas are depicted). (Right) 925 hPa winds (back
arrows, unit: m/s), specific humidity (shade, unit: g/Kg) and isotherms (red solid lines).
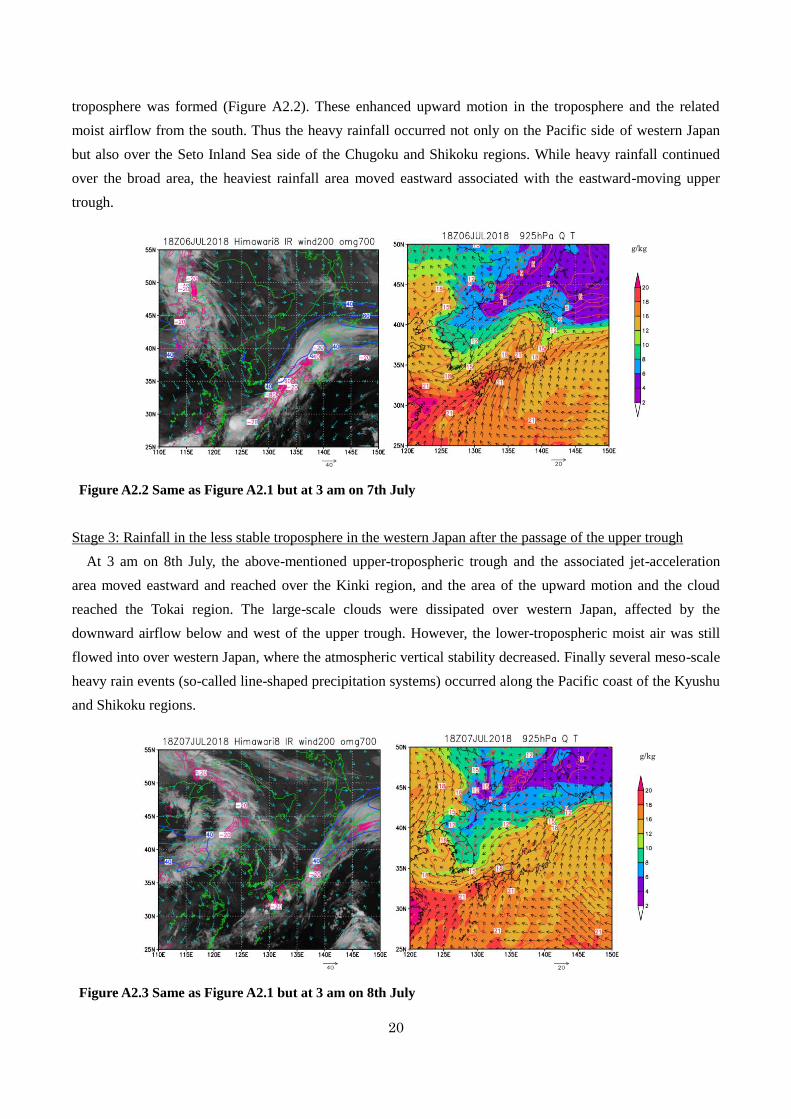
Stage 2: Activation of the Baiu front due to approach of an significant upper tropospheric trough
On 6th and 7th July, an upper-tropospheric trough above the Korean Peninsula rapidly deepened. On the
eastern side of the trough, the subtropical jet stream was accelerated, and a meso-scale low in the lower
g/kg
20
troposphere was formed (Figure A2.2). These enhanced upward motion in the troposphere and the related
moist airflow from the south. Thus the heavy rainfall occurred not only on the Pacific side of western Japan
but also over the Seto Inland Sea side of the Chugoku and Shikoku regions. While heavy rainfall continued
over the broad area, the heaviest rainfall area moved eastward associated with the eastward-moving upper
trough.
Figure A2.2 Same as Figure A2.1 but at 3 am on 7th July
Stage 3: Rainfall in the less stable troposphere in the western Japan after the passage of the upper trough
At 3 am on 8th July, the above-mentioned upper-tropospheric trough and the associated jet-acceleration
area moved eastward and reached over the Kinki region, and the area of the upward motion and the cloud
reached the Tokai region. The large-scale clouds were dissipated over western Japan, affected by the
downward airflow below and west of the upper trough. However, the lower-tropospheric moist air was still
flowed into over western Japan, where the atmospheric vertical stability decreased. Finally several meso-scale
heavy rain events (so-called line-shaped precipitation systems) occurred along the Pacific coast of the Kyushu
and Shikoku regions.
Figure A2.3 Same as Figure A2.1 but at 3 am on 8th July
g/kg
g/kg
21
Annex 3
1. The Heavy Rain Event of July 2018
(2) Primary factors behind rainfall with relatively large temporal/spatial scales
(C) Characteristics of line-shaped precipitation systems
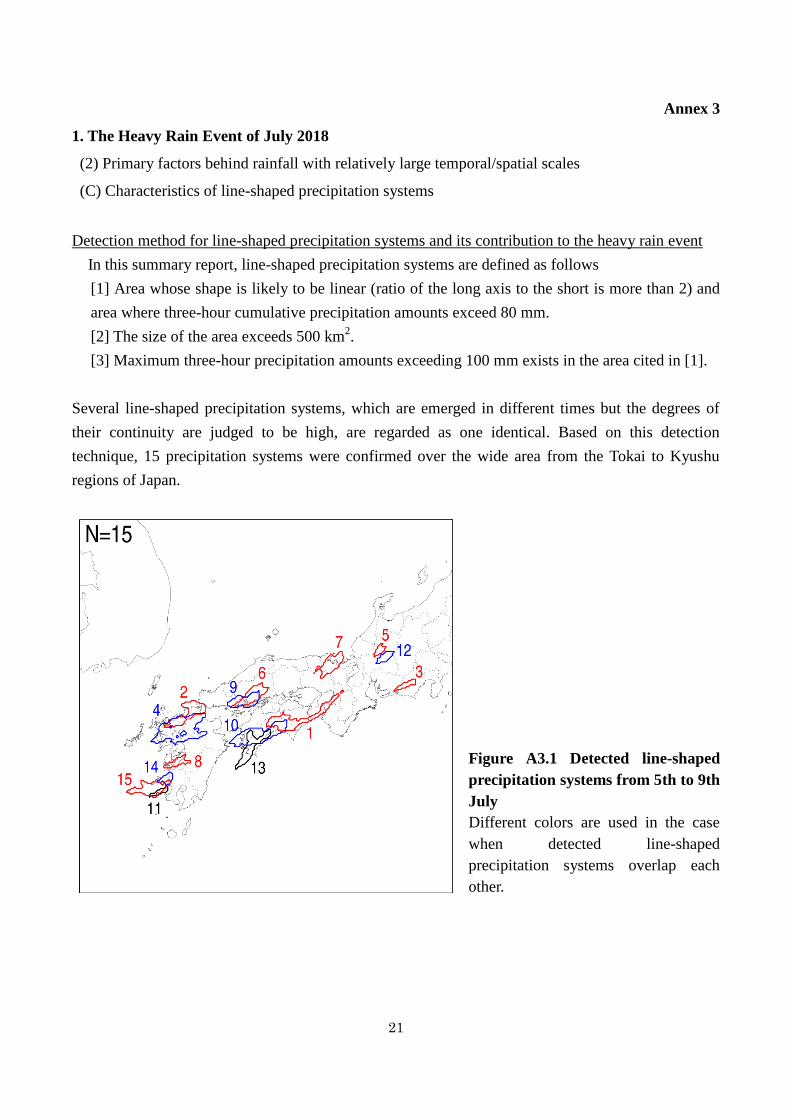
Detection method for line-shaped precipitation systems and its contribution to the heavy rain event
In this summary report, line-shaped precipitation systems are defined as follows
[1] Area whose shape is likely to be linear (ratio of the long axis to the short is more than 2) and
area where three-hour cumulative precipitation amounts exceed 80 mm.
[2] The size of the area exceeds 500 km2.
[3] Maximum three-hour precipitation amounts exceeding 100 mm exists in the area cited in [1].
Several line-shaped precipitation systems, which are emerged in different times but the degrees of
their continuity are judged to be high, are regarded as one identical. Based on this detection
technique, 15 precipitation systems were confirmed over the wide area from the Tokai to Kyushu
regions of Japan.
Figure A3.1 Detected line-shaped
precipitation systems from 5th to 9th
July
Different colors are used in the case
when detected line-shaped
precipitation systems overlap each
other.
22
Annex 4
1. The Heavy Rain Event of July 2018
(2) Primary factors behind rainfall with relatively large temporal/spatial scales
(C) Characteristics of line-shaped precipitation systems
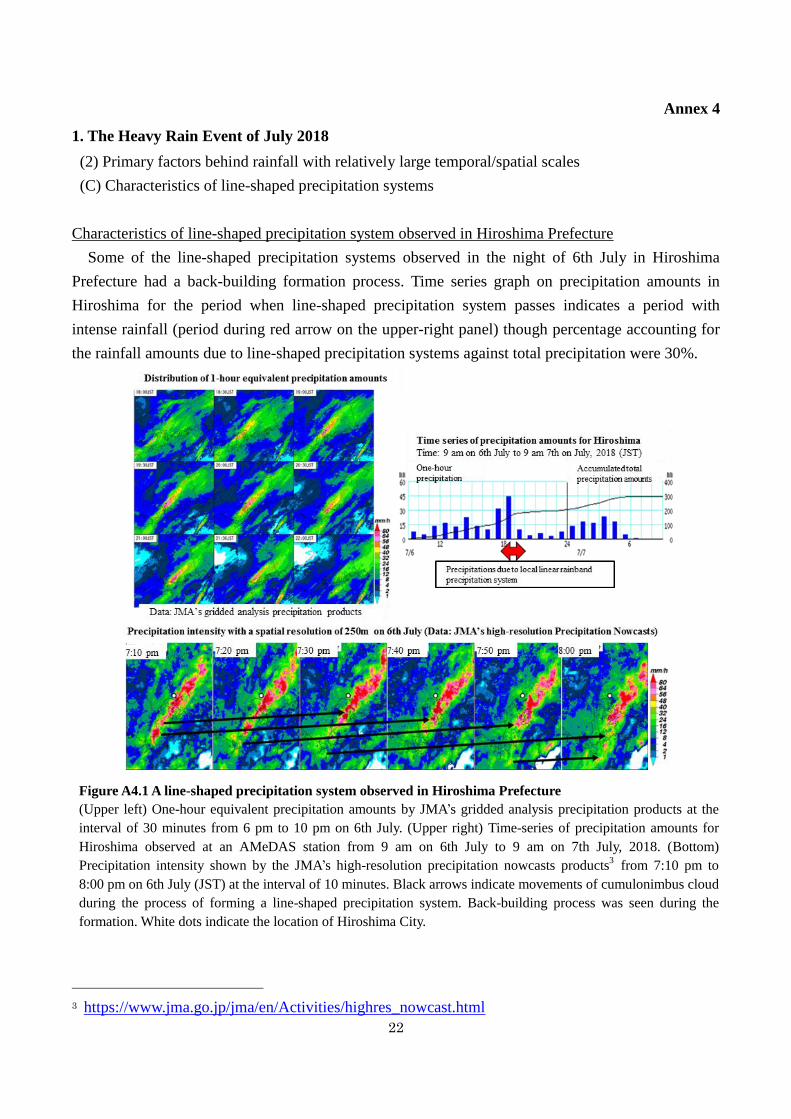
Characteristics of line-shaped precipitation system observed in Hiroshima Prefecture
Some of the line-shaped precipitation systems observed in the night of 6th July in Hiroshima
Prefecture had a back-building formation process. Time series graph on precipitation amounts in
Hiroshima for the period when line-shaped precipitation system passes indicates a period with
intense rainfall (period during red arrow on the upper-right panel) though percentage accounting for
the rainfall amounts due to line-shaped precipitation systems against total precipitation were 30%.
Figure A4.1 A line-shaped precipitation system observed in Hiroshima Prefecture
(Upper left) One-hour equivalent precipitation amounts by JMA’s gridded analysis precipitation products at the
interval of 30 minutes from 6 pm to 10 pm on 6th July. (Upper right) Time-series of precipitation amounts for
Hiroshima observed at an AMeDAS station from 9 am on 6th July to 9 am on 7th July, 2018. (Bottom)
Precipitation intensity shown by the JMA’s high-resolution precipitation nowcasts products3 from 7:10 pm to
8:00 pm on 6th July (JST) at the interval of 10 minutes. Black arrows indicate movements of cumulonimbus cloud
during the process of forming a line-shaped precipitation system. Back-building process was seen during the
formation. White dots indicate the location of Hiroshima City.
3 https://www.jma.go.jp/jma/en/Activities/highres_nowcast.html
23
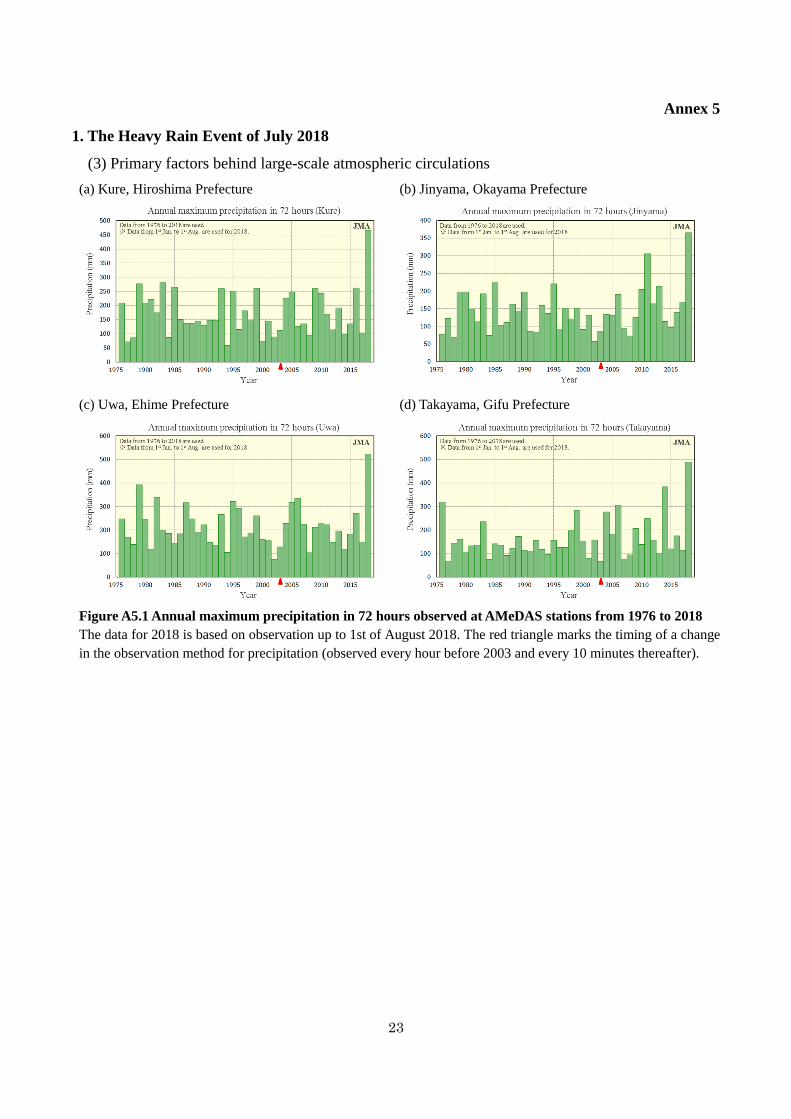
Annex 5
1. The Heavy Rain Event of July 2018
(3) Primary factors behind large-scale atmospheric circulations
(a) Kure, Hiroshima Prefecture
(b) Jinyama, Okayama Prefecture
(c) Uwa, Ehime Prefecture
(d) Takayama, Gifu Prefecture
Figure A5.1 Annual maximum precipitation in 72 hours observed at AMeDAS stations from 1976 to 2018
The data for 2018 is based on observation up to 1st of August 2018. The red triangle marks the timing of a change
in the observation method for precipitation (observed every hour before 2003 and every 10 minutes thereafter).
24
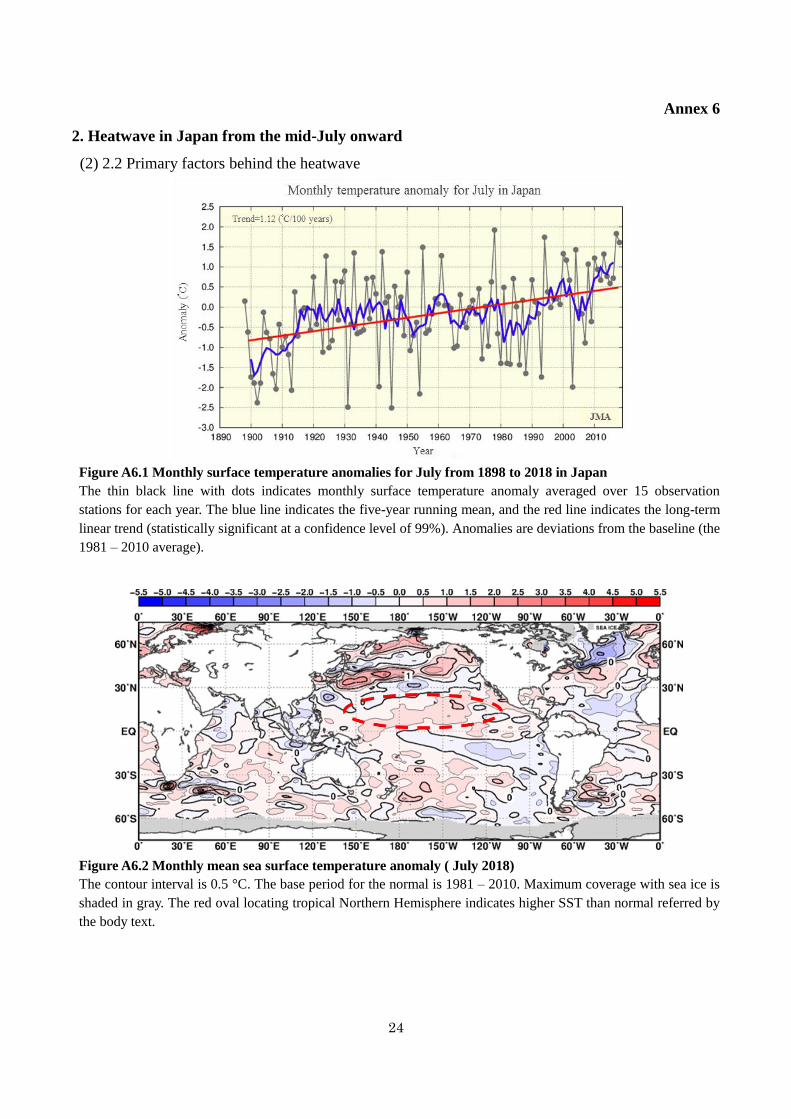
Annex 6
2. Heatwave in Japan from the mid-July onward
(2) 2.2 Primary factors behind the heatwave
Figure A6.1 Monthly surface temperature anomalies for July from 1898 to 2018 in Japan
The thin black line with dots indicates monthly surface temperature anomaly averaged over 15 observation
stations for each year. The blue line indicates the five-year running mean, and the red line indicates the long-term
linear trend (statistically significant at a confidence level of 99%). Anomalies are deviations from the baseline (the
1981 – 2010 average).
Figure A6.2 Monthly mean sea surface temperature anomaly ( July 2018)
The contour interval is 0.5 °C. The base period for the normal is 1981 – 2010. Maximum coverage with sea ice is
shaded in gray. The red oval locating tropical Northern Hemisphere indicates higher SST than normal referred by
the body text.