Embed Size (px)
Citation preview

U.S. Department of the Interior Bureau of Reclamation Technical Service Center Water and Environmental Services Division Water Treatment Engineering Research Team Denver, Colorado December 2014
Desalination & Water Purification Research And Development Program Report No. XXX
Primary Evaluation of Algae Biofuel Production from Concentrate Stream
Prepared for Reclamation Under Agreement No. R10AC80283
By
Saeid Aghahossein Shirazi, Jalal Rastegary, Abbas Ghassemi
2011-2015 FINAL REPORT - COOPERATIVE AGREEMENT NO. R10AC80283 Page 899

Disclaimer
The views, analysis, recommendations, and conclusions in this report are those of the authors and do not represent official or unofficial policies or opinions of the United States Government, and the United States takes no position with regard to any findings, conclusions, or recommendations made. As such, mention of trade names or commercial products does not constitute their endorsement by the United States Government.
MISSION STATEMENTS The mission of the Department of the Interior is to protect and provide access to our Nation's natural and cultural heritage and honor our trust responsibilities to Indian tribes and our commitments to island communities. The mission of the Bureau of Reclamation is to manage, develop, and protect water and related resources in an environmentally and economically sound manner in the interest of the American public.
2011-2015 FINAL REPORT - COOPERATIVE AGREEMENT NO. R10AC80283 Page 900

i
Acknowledgements I would like to thank the sponsor of this research, Bureau of Reclamation,
for their support under the contract R10AC80283.
2011-2015 FINAL REPORT - COOPERATIVE AGREEMENT NO. R10AC80283 Page 901

ii
Contents Page Executive Summary .................................................................................................1 Chapter 1 ..................................................................................................................2 Introduction ..............................................................................................................2
1.1 Background ................................................................................................... 2 1.2 Research objective ......................................................................................... 3
Conclusions and Recommendations ........................................................................4 Conclusions ......................................................................................................... 4 Recommendations ............................................................................................... 5
Chapter 2 ..................................................................................................................6 Literature Review.....................................................................................................6
2.1 Introduction ................................................................................................... 6 2.2 Renewable energy ......................................................................................... 6 2.3 Biofuel ........................................................................................................... 7 2.4 What are algae? ............................................................................................. 8 2.5 Algae growth ............................................................................................... 10 2.6 Algal strain selection ................................................................................... 12 2.7 Carbon dioxide fixation ............................................................................... 13 2.8 Culture systems in commercial scale .......................................................... 13 2.9 Open ponds .................................................................................................. 14 2.10 Photobioreactors ........................................................................................ 14
2.10.1 Tubular photobioreactor ..................................................................... 15 2.10.2 Fence-like solar collector.................................................................... 15 2.10.3 Helical tubular photobioreactor .......................................................... 15
2.11 Open raceway ponds vs. photobioreactors ................................................ 15 2.12 Harvesting ................................................................................................. 16 2.13 Algal drying ............................................................................................... 17 2.14 Oil extraction ............................................................................................. 17 2.15 Energy conversion from microalgae ......................................................... 18
2.15.1 Biochemical conversion ..................................................................... 18 2.15.1.1 Fermentation ................................................................................ 18 2.15.1.2 Transesterification........................................................................ 18
2.15.2 Thermochemical conversion............................................................... 18 2.15.2.1 Gasification .................................................................................. 18 2.15.2.2 Pyrolysis ....................................................................................... 18 2.15.2.3 Liquefaction ................................................................................. 18 2.15.2.4 Hydrogenation .............................................................................. 19
2.16 Biodiesel from algae .................................................................................. 19 2.17 Ethanol from algae .................................................................................... 19 2.18 Methane from algae ................................................................................... 20 2.19 Economics of biodiesel production ........................................................... 20 2.20 Water scarcity ............................................................................................ 20 2.21 Water desalination ..................................................................................... 21 2.22 Concentrate disposal problem ................................................................... 21
2011-2015 FINAL REPORT - COOPERATIVE AGREEMENT NO. R10AC80283 Page 902

iii
2.23 Objective of this research .......................................................................... 23 Chapter 3 ................................................................................................................24 Experimental Studies .............................................................................................24
3.1 Introduction ................................................................................................. 24 3.2 Strains of algae ............................................................................................ 24 3.3 Culture and medium .................................................................................... 25
3.3.1 Concentrate medium ............................................................................. 25 3.3.2 f/2 medium ............................................................................................ 25 3.3.3 50:50 combination of f/2 and concentrate medium .............................. 25 3.3.4 Deionized medium ................................................................................ 25
3.4 Photobioreactor set up ................................................................................. 25 3.5 Design of experiment .................................................................................. 25
3.5.1 Experimental Apparatus ....................................................................... 26 3.5.2 Test procedure ...................................................................................... 26
3.6 Analytical method ....................................................................................... 27 3.6.1 Algae growth ........................................................................................ 27
3.6.1.1 Dry biomass weight analysis ......................................................... 27 3.6.1.2 Optical density ............................................................................... 28
3.6.2 Ion removal ........................................................................................... 28 3.6.2.1 Salinity (TDS and EC) ................................................................... 28 3.6.2.2 Total Nitrogen analysis .................................................................. 28 3.6.2.3 Ion content analysis ........................................................................ 28
Chapter 4 ................................................................................................................29 Results and Discussion ..........................................................................................29
4.1 Introduction ................................................................................................. 29 4.2 Experiment 1 ............................................................................................... 29
4.2.1 Algae growth ........................................................................................ 29 4.2.2 Ion removal ........................................................................................... 31
4.3 Experiment 2 ............................................................................................... 32 4.3.1 Algae growth ........................................................................................ 32 4.3.2 Ion removal ........................................................................................... 32
4.4 Growth comparison ..................................................................................... 33 4.5 Ion removal comparison .............................................................................. 34
Chapter 5 ................................................................................................................36 Conclusion .............................................................................................................36
5.1 Conclusion ................................................................................................... 36 5.2 Recommendations ....................................................................................... 37
References ..............................................................................................................38 Tables .....................................................................................................................51
Chapter 2 ........................................................................................................... 51 Chapter 3 ........................................................................................................... 54 Chapter 4 ........................................................................................................... 55
Figures....................................................................................................................60 Chapter 2 ........................................................................................................... 60 Chapter 3 ........................................................................................................... 63 Chapter 4 ........................................................................................................... 64
2011-2015 FINAL REPORT - COOPERATIVE AGREEMENT NO. R10AC80283 Page 903

iv
Chapter 5 ........................................................................................................... 72 Appendices .............................................................................................................73
Appendix A ....................................................................................................... 73 Units of Measure ........................................................................................... 73
Appendix B ....................................................................................................... 74 Data Record ................................................................................................... 74
2011-2015 FINAL REPORT - COOPERATIVE AGREEMENT NO. R10AC80283 Page 904

1
Executive Summary
Drinking water scarcity accentuates the need to find new water sources, such as saline and inland brackish, to provide enough clean water for a growing population. With proper consideration of factors affecting these new sources, such as the lower salinity of inland brackish water compared to seawater, the use of membrane methods to desalinate brackish water can be highly effective. Due to this efficacy, the use of electrodialysis reversal (EDR) and reverse osmosis (RO) technologies has significantly increased over the past two decades. However, environmental effects associated with concentrate disposal have restricted the expansion and practical deployment of desalination technologies for inland brackish water sources.
Because water is essential to the production of energy, the looming global energy crisis and the over-reliance on fossil fuels have tied the concept of energy shortage to the production of safe water. Interestingly, microalgae cultivation in desalination concentrate waste may combat the twin water and energy crises by combining increased efficiency for the removal of pollutants from concentrate with the cultivation of algal biomass for biofuel feedstock production. Algae are also a perfect candidate for CO2 sequestration and greenhouse gas reduction due to algae’s ability to use CO2 as their main carbon source. Other advantages of using microalgae are that they are a sustainable technology capable of growth in most habitats; they do not compete with food crops for resources; they have no NOx emissions and a short growth cycle; and they are the most rapidly growing option for producing biofuel, fats, oils, sugars, and hydrocarbons, all while fixing carbon dioxide.
Furthermore, some algae species naturally live and thrive in brackish water. To investigate the feasibility of using microalgae in pollutant removal and biomass production by growing algae in desalination concentrate, where the algae could use salts and other nutrients to grow, a full factorial experiment was conducted on the growth of two strains of marine algae in concentrate under 16 hours of illumination at 25 ºC, and ion removal by algae was observed to characterize the role of algae in removing pollutants.
2011-2015 FINAL REPORT - COOPERATIVE AGREEMENT NO. R10AC80283 Page 905

2
Chapter 1 Introduction
1.1 Background
As population has increased, the demand for energy and water has increased in tandem (Foster et al., 2009). However, finding new and affordable sources of energy and drinking water has become more difficult, and exploiting those sources has become more challenging (Armaroli et al., 2006). The supplies of water and energy are also interrelated: due to water concerns, the operation of some energy facilities has been curtailed, and the construction and operation of new energy facilities must take into account the value of water resources.
Along with availability and cost constraints, one of the paramount concerns related to using fossil fuels is that they release enormous amounts of CO2 into the atmosphere. This release results in global warming, which affects food and water resources, ecosystems, and other parts of the environment (Foster et al., 2009). Hence, concerted effort is needed to find sustainable, renewable, and CO2-balanced alternative energy sources that can supplant fossil fuels (Righelato and Spracklen, 2007).
In recent years, biofuel has been considered to have the greatest potential as an alternative to fossil fuels because it is derived from non-toxic, biodegradable, and potentially renewable resources while providing less harmful environmental features (Gouveia and Oliveira, 2009). Furthermore, biofuel can be obtained from various different sources, such as sugar crops, starch crops, oilseed crops, and algae. However, a major concern over biomass-based energy, particularly in large-scale fuel production, is that it will consume vast amounts of farmland and water, compete with food production, and drive up food prices (Patil et al., 2008). While this concern is relevant to biofuel production from sugar crops, starch crops, and oilseed crops, microalgae can produce biofuels by utilizing undeveloped lands and wastewater, without using resources necessary for food production.
Using microalgae as a renewable and sustainable feedstock for the production of biofuels can lessen humanity’s dependence on fossil fuels while making worthwhile use of resources that would otherwise be wasted: microalgae can be cultivated in non-arable land in various climates, and they can be grown using brackish water and wastewater, which minimizes or even avoids the use of scarce freshwater as a growth medium (Chisti, 2007; Chisti, 2008). Furthermore, cultivation of algae consumes less total water than other crops to produce the same amount of oil (Dinh et al., 2009), and even while growing with such marginal resources, some strains of algae can yield biomass ranging from 10 to 100 times more than comparable energy crops such as corn, soybean and canola (Oilgae report, 2010).
An additional advantage of algae is their short growth cycle: the majority of microalgae use a photosynthetic process similar to higher plants, and complete
2011-2015 FINAL REPORT - COOPERATIVE AGREEMENT NO. R10AC80283 Page 906

3
entire growing cycles every few days (da Silva et al., 2009). For this growth, microalgae’s main requirements are nutrients, sunlight, CO2, and water (Demirbas and Demirbas, 2011). Notably, microalgae have a low carbon footprint because they capture CO2 during photosynthesis (Righelato and Spracklen, 2007).
With no shadow of doubt, water and energy are connected. Water is essential to the production of energy of all forms, and energy is needed to produce safe water. In energy production, a significant amount of water is currently needed, mainly in steam electric power plants. According to a report from the U.S. Department of Energy, about ninety percent of all power plants are thermoelectric, which means that they require billions of gallons of water to cool their machinery and produce the steam used to drive their turbines. Conversely, energy plays an essential role in water treatment and storage. For instance, according to a report from Sandia National Laboratories, about 4 percent of power generation in United States is used for water supply and treatment. Hence, it is crucial to have a combined approach to water and energy.
Water is essential to life as a part of every ecosystem, and it is also essential to industry. Although approximately 70% of the Earth's surface is covered by water, people in developing countries are suffering from water scarcity. Poor water quality is the reason for 80% to 90% of all diseases and 30% of all deaths in developing countries (Leitner, 1998). The continuation of current policies will result in an increase in the number of people affected by water shortages, and the spread of water shortages through both the developed and developing world in the future will worsen for two reasons: 1) population growth, and 2) the increased demands on natural resources from industrialization. In order to ease the crisis, planners must include desalination as a part of the development process. Unfortunately, although desalination has great potential to reduce the impacts of water shortages, the technologies used for desalination are expensive. Accordingly, cost reduction for water desalination is essential to propagating the technology (Miller, 2003). Another barrier to overcome is the problem of desalination concentrate, a highly saline byproduct of desalinization that has restricted the use of desalination technologies, especially for inland brackish water sources, because of its environmental impacts and associated costs. Although seawater desalination facilities can simply return the concentrate back to the sea for safe and controllable dilution, this option is not available to inland facilities, which face prohibitive costs for safely disposing of the concentrate. Hence, any attempt to reduce the volume and make beneficial use of concentrate stream could significantly increase the practical deployment of brackish water desalination.
1.2 Research objective
The objective of this research is to increase biofuel production and decrease the cost of desalination by making use of byproducts from the desalination process. The productive use of concentrate, which offers an alternative to disposal, is highly desirable; hence, this study investigates the use of concentrate
2011-2015 FINAL REPORT - COOPERATIVE AGREEMENT NO. R10AC80283 Page 907

4
from water desalination to cultivate and grow algae. Two strains of algae, Nannochloropsis oculata (UTEX- LB 2164) and Dunaliella tertiolecta (UTEX-LB 999), were considered and evaluated using concentrate as a growing medium. Additionally, ion removal from concentrate was investigated for both species.
Conclusions and Recommendations
Conclusions
Based on this research, the following conclusions can be reached:
• The concentrate growth medium (80% desalination concentrate and 20% f/2 (the ratio of 4 concentrate and 1 f/2 with algae was used to inoculate)) was an optimal match for the investigated algae species, and it maximized the percentage increase of dry weight biomass better than an f/2 medium. The results of optical density at 750 nm conveyed the same result.
• There was no significant difference in biomass production and ion removal between the two algae species. Both Nannochloropsis oculata (UTEX- LB 2164) and Dunaliella tertiolecta (UTEX-LB 999) were acceptable, but the combination of Dunaliella tertiolecta and concentrate medium yielded the highest biomass production.
• Sufficient evidence indicates that the combination of growth medium and algae species was the determinant factor for biomass production. Temperature, light cycle, light intensity, air flow, and other conditions were controlled.
• The contribution of algal cultures in the removal of ions was not significant, with the exception of specific ions such as nitrate, phosphate and fluoride. Total nitrogen decreased considerably during the experiment, but TDS did not change considerably because the ions responsible for high TDS were not removed noticeably.
• Cultivation of marine algae strains in concentrate disposal of water desalination units is a unique approach that combines the increase of removal efficiency of pollutants in concentrate and the cultivation of the algal biomass for the biofuel feedstock production.
• Results of this research identify a potential to reduce the cost of desalination when biofuel production is included, and can bring about environmentally-friendly benefits, such as CO2 mitigation and concentrate disposal treatment.
2011-2015 FINAL REPORT - COOPERATIVE AGREEMENT NO. R10AC80283 Page 908

5
Recommendations
Future research into the growth of microalgae in concentrate streams could benefit from the following approaches:
• Investigating the effect of concentrate on the growth of algae strains that have the capability to survive in saline environments.
• Increasing the amount of inoculum of algae to obtain more reliable results due to the relationship between initial biomass and growth rates.
• Using immobilized algae instead of suspended algae to encourage better ion removal because immobilized algae will increase the effective surface area for reaction.
• Ensuring all ion removal is done by algae by measuring the nutrient uptake by algae and ion removal from the medium, then correlate the two results to determine how much removal is done by algae.
• Examining different combinations of f/2 and concentrate, such as 25:75 and 75:25, may yield additional interesting results.
• Another option for future studies could be analyzing the economic feasibility of the complete process of biofuel generation and desalination concentrate treatment process (figure 5.1).
2011-2015 FINAL REPORT - COOPERATIVE AGREEMENT NO. R10AC80283 Page 909

6
Chapter 2 Literature Review
2.1 Introduction
This section discusses microalgae and their potential as an alternative fuel source. Additionally, the section presents information on CO2 fixation, algae cultivation methods and harvesting, oil extraction from microalgae, products of algal biofuel, and problems associated with the disposal of concentrate from water desalination.
2.2 Renewable energy
Renewable energy is defined as the energy that comes from resources which could be repeatedly replaced, and renewable energy is an appropriate choice because it is clean and safe (Demirbas, 2011). Renewable energy sources include hydropower, wind, solar, geothermal, marine, and biofuel energy (Demirbas, 2008). In contrast to fossil and nuclear sources, the distribution of renewable energy resources is almost even around the world.
The global economy is highly dependent on energy, and since the population has increased, the demand for energy has also increased (Patil et al., 2008). If the current growth in energy consumption continues, the world will need about 60% more energy by 2030 (International Energy Agency, 2007). Currently, over 80% of total energy usage is supplied from fossil fuels, including petroleum, coal, and natural gas (Demirbas and Demirbas, 2011). Transportation, manufacturing, electricity, and domestic heating account for the majority of global energy consumption (Gouveia and Oliveira, 2009), and transportation alone uses 27% of this energy (Antoni et al., 2007).
Since fossil fuels resources are finite, they are widely recognized as unsustainable energy (Srivastava and Prasad, 2000). Furthermore, combustion of fossil fuels emit a great deal of greenhouse gases, including CO2, SO2, and nitrogen oxide (NOx) (Patil et al., 2008). Combustion of fossil fuels accounts for almost 98% of carbon emissions (Biofuels Media Ltd, 2007). These greenhouse gas emissions result in global warming (Amin, 2009) and adversely impact the environment and human life. For instance, about one-third of carbon dioxide emitted by fossil fuels is absorbed by oceans, which steadily decreases the water pH, leading to adverse impacts in the marine ecosystems and consequently human life (Ormerod et al., 2002).
The other issue associated with fossil fuels is their availability and cost. Increases in the price of petroleum crude oil over past several decades have had and will continue to have immediate negative impacts on energy accessibility and therefore on human life (Amin, 2009). Fossil fuels are not distributed evenly in the world. As an illustration, almost 63% of petroleum reservoirs are located in
2011-2015 FINAL REPORT - COOPERATIVE AGREEMENT NO. R10AC80283 Page 910

7
the Middle East (Hacisalihoglu et al., 2009). As a result, fossil fuels are considered to be unsustainable, and production of alternative energy sources seems desirable and ultimately necessary. Replacing petroleum-derived fuels with sustainable, renewable, and carbon-neutral transport fuels will reduce many of the aforementioned adverse effects (Chisti, 2008). Technological requirements to make this evolution happen are becoming available (Demirbas, 2009). Altering the heavy dependence on fossil fuels through the use of renewable energy sources like biofuel can greatly contribute to better control and management of greenhouse gases and their negative effects (Demirbas and Demirbas, 2007; Ragauskas et al., 2006).
2.3 Biofuel
Biomass is a material obtained from living organisms like plants, and is usually derived from energy crop cultivation, forest harvesting, and plant residues (McKendry, 2003). Since plants obtain their energy from the sun during the photosynthesis process, biofuel can be thought of as a natural battery for storing solar energy. Biofuel can be in the form of a solid, liquid, or gas (Patil et al., 2008). Biofuel has the capability to replace a substantial fraction of fossil fuels (Perlack, 2005). Biomass from crops reduces emission of greenhouse gases such as CO2, nitrogen, and sulfur oxides. As a consequence, biomass prevents climatic changes and global warming. Moreover, biofuels help countries without fossil fuel resources to decrease their degree of dependence on other countries that produce fossil fuels, increasing energy supply security and environmental sustainability (Gouveia and Oliveira, 2009).
There are several different types of biofuel, including biodiesel, ethanol, bioalcohols, and biogas. Among these, biodiesel is the most widely used, and is usually produced from soybeans, canola oil, animal fat, palm oil, corn oil, jatropha oil (Barnwal and Sharma, 2005), and waste cooking oil (Felizardo et al., 2006; Kulkarni and Dalai, 2006). Approximately 60–75% of the total cost of biodiesel fuel is based on the feedstock used for biodiesel production (Canakci and Sanli, 2008).
In order to replace the transport fuel consumption in the United States, the country will need at least 0.53 billion cubic meters of biodiesel per year (Chisti, 2007). However, in the U.S., most biodiesel production comes from soybeans - a crop that is also used for food. To better illustrate the difficulty posed by this level of production from biofuel crops, Chisti modeled the land area needed to satisfy 50% of the United States transportation fuel demand (table 2.1).
Obviously, petroleum fuels cannot be significantly replaced by oil crops due to the huge land area needed and the low average oil yield per hectare. In addition, since oil crops are edible plants, using them as a feedstock for biodiesel production will increase food prices without having a significant effect on global warming (Fargione et al., 2008). Furthermore, widespread use of vegetable oils leads to the possibility of malnutrition and even starvation in developing countries
2011-2015 FINAL REPORT - COOPERATIVE AGREEMENT NO. R10AC80283 Page 911

8
(Demirbas and Demirbas, 2011). Thus, the main concern regarding first generation biofuels (biofuels made from sugar, starch, or vegetable oil) is their inefficiency and unsustainability (Patil et al., 2008). In order for biodiesel to be priced competitively against fossil fuel derived diesel, and avoid competition with food crops, biodiesel must be produced from low cost and non-edible plants.
The solution is a transition to second generation biofuels such as microalgae (Mata et al., 2010). Like other plants, algae are photosynthetic species which are able to convert energy from the sun to chemical energy in the form of proteins, hydrocarbon, and oil (Demirbas and Demirbas, 2011). In contrast to first generation biofuels, microalgae biodiesel has the capability to replace fossil fuels completely, without the negative consequences on food, energy security, and the environment (Patil et al., 2008). Based on calculations done by Chisti, microalgae with an average oil content of 30% dry weight in biomass would require only 3% of the U.S. cropping area. Based on some estimations, although the oil contents are similar between seed plants and microalgae (Mata et al., 2010), algal oil yield per acre is 200 times greater than oilseed crops (Sheehan et al., 2008). As a result, biodiesel production from microalgae would be 10 to 20 times greater than oil crops (Tickell, 2000).
Additionally, microalgae can grow more rapidly than the other crops rich in oil and can double their biomass in less than a day (Demirbas and Demirbas, 2011). Microalgae appear to be the only source of renewable biodiesel that is capable of meeting the global demand for transport fuels due to its advantages, which include higher photosynthetic efficiency, higher biomass production, higher growth rate, higher oil yield, and lower land requirements (Richardson et al., 2009; Minowa et al., 1995).
There are, however, some obstacles to the development of biofuel production, including both technological and non-technological barriers (Patil et al., 2008). Critics of biofuels often believe that biofuel production occupies vast amounts of farmland and increases food prices while not significantly reducing greenhouse gas emissions (Crutzen et al., 2007; Righelato and Spracklen, 2007). However, many studies show that biofuels can supply nearly 30% of global energy demand without affecting food prices or producing greenhouse gas emissions (Koonim, 2006).
2.4 What are algae?
Algae are a large and diverse group of autotrophic organisms that can range from unicellular to multicellular in form. Unicellular algae are called microalgae, and multicellular are called macroalgae. They are mainly aquatic and microscopic (Demirbas, 2011). There are two main populations of algae: phytoplankton and filamentous algae. Phytoplankton are important organisms because they generate oxygen while converting inorganic nutrients and sunlight to biomass. Most phytoplankton are too small to be seen with the naked eye; however, sometimes their aggregated presence in water causes discoloration. Phytoplankton populations can experience rapid growth, which occurs mostly as a
2011-2015 FINAL REPORT - COOPERATIVE AGREEMENT NO. R10AC80283 Page 912

9
result of excess nutrients. Significant phytoplankton population growth is commonly known as algal bloom, which is one of the most common aquatic plant problems faced by pond owners.
Microalgae typically live in fresh and brackish water and convert sunlight, water, and CO2 to algal biomass (Shimizu, 1996, 2003; Borowitzka, 1999). Microalgae are present in aquatic ecosystems as well as almost all other ecosystems such as terrestrial systems. An estimated 50,000 species of algae, approximately, are available, but only 30,000 have been studied (Richmond, 2004).
The potential of microalgae as a feedstock for biofuel has been studied for 50 years (Mata et al., 2001), and this research was intensified in the 1970s during the first oil crisis (Spolaore et al., 2006). Today, research on microalgae is taken more seriously due to ever-increasing petroleum prices and global warming concerns associated with the combustion of fossil fuels (Gavrilescu and Chisti, 2005). Microalgae can produce various renewable biofuels such as methane (Spolaore et al., 2006), biodiesel (Roessler et al., 1994; Sawayama et al., 1995; Dunahay et al., 1996) and biohydrogen (Ghirardi et al., 2000; Akkerman et al., 2002; Melis, 2002).
Many algae species have exhibited rapid growth and high productivity. In the exponential phase of microalgae growth, biomass doubling time is usually just about 3.5 hours (Chisti, 2007). A simple microalgae cultivation system is capable of producing 100 g m-2 d-1 dry biomass (Patil et al., 2005). Approximately 1 kg of biomass can fix almost 1.6-1.8 kg of CO2. Thus, if algae are cultivated close to power plants or other CO2 producing facilities, they could consume the CO2 from the facilities’ combustion processes (Klass, 1998; Kong et al., 2007; Sheehan et al., 1998). Additionally, using wastewater as a medium for algae cultures can effectively remove nitrogen, phosphorus, and heavy metals such as As, Cd, and Cr from the wastewater stream (Kong et al., 2007, Sawayama et al., 1995). The use of CO2 emitted from power plants to grow algae in wastewater, which the algae can treat, can bring about environmental and economic benefits.
Algae consist of chemicals such as proteins, carbohydrates, lipids, and nucleic acids (Demirbas and Demirbas, 2011). Table 2.2 shows the chemical composition of algae on a dry matter basis (%). The percentages vary with the type of algae. Some species have about 40% of their overall mass made up of fatty acids (Becker, 1994). Fatty acids have a vital influence on the quality of biodiesel obtained from these strains of microalgae (Mata et al., 2010).
Common oil levels of microalgae are often between 20 and 50% of dry weight. Table 2.3 shows oil content of some microalgae. Some microalgae, such as Botryococcus braunii, contain a high percent of oil content but have low productivity; however, most common microalgae like Dunaliella and Nannochloropsis have oil content between 20 and 50% and higher productivities (Mata et al., 2010).
Microalgae oil content can even go beyond 80% dry weight biomass (Metting, 1996; Spolaore et al., 2006). Based on reports that have been published regarding lipid content of cells, some species, including Chlorella species (Fukuda et al., 2001), Dunaliella species (Gerpen, 2005), Nannochloris species
2011-2015 FINAL REPORT - COOPERATIVE AGREEMENT NO. R10AC80283 Page 913

10
(Ghirardi et al., 2000), Parietochloris incisa (Haesman et al., 2000), and Botryococcus braunii (Harris, 1989) have high quantities of oil content under optimized conditions. The amount of derived oil depends on factors such as algae growth rate and lipid content of dry biomass. Microalgae with high oil content under suitable conditions have the capability to produce 19,000-57,000 l of oil per acre annually (Demirbas and Demirbas, 2011). Lipid accumulation usually happens in the stationary phase, in which most of the nutrients, especially nitrate, have already been consumed for reproducing in the exponential phase (Livansky, 2005). All in all, the effect of nitrate deficiency is that protein content and the chlorophyll level decrease, while carbohydrate and lipid contents increase (Mata et al., 2010). 2.5 Algae growth
The growth of an axenic culture of microalgae in batch reactor is characterized by five phases: 1- Lag phase
In this phase, only a small increase in cell density occurs. This phase is quite long, but it could be made considerably shorter if the added inoculum is in its exponential phase. The lag in growth is attributed to the physiological adaptation of the cell metabolism to growth to promote the growth of additional cells. 2- Exponential phase
In the second phase, the cell density increases as a function of time t according to a logarithmic function:
Ct = C0.emt (2-1) Where Ct and C0 are cell concentrations at time t and 0, respectively, and
m is specific growth rate, which is a function of algal species, light intensity, and temperature. 3- Phase of declining growth rate
In this phase, cell division slows down when nutrients, light, pH, carbon dioxide, or other physical and chemical factors begin to limit growth. 4- Stationary phase
In this stage, the limiting factors mentioned in part three and the growth rate are balanced, which results in a quite constant cell density. 5- Death or crash phase
In this phase, due to the deterioration of water quality and depletion of nutrients, cell density decreases very quickly until the culture collapses. The main factors causing this phase are depletion of nutrients, oxygen deficiency, overheating, pH disturbance, or contamination.
Generally, algal cultures in the exponential growth phase contain more protein, while cultures in the stationary phase have more carbohydrates (De Pauw et al., 1984); therefore, the beginning of the stationary phase is the best time to harvest algae. In general, the cost of microalgal biomass production is more than the cost for growing other oil crops (Chisti, 2007). Algae need water, inorganic
2011-2015 FINAL REPORT - COOPERATIVE AGREEMENT NO. R10AC80283 Page 914
11
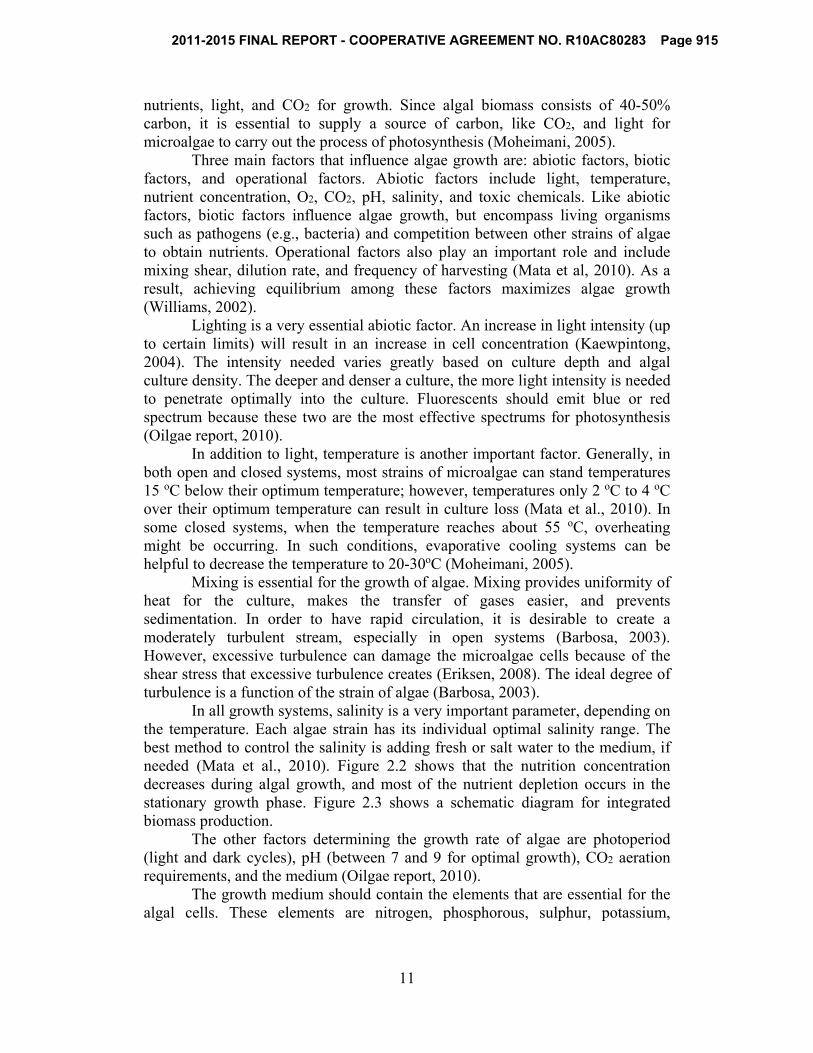
nutrients, light, and CO2 for growth. Since algal biomass consists of 40-50% carbon, it is essential to supply a source of carbon, like CO2, and light for microalgae to carry out the process of photosynthesis (Moheimani, 2005).
Three main factors that influence algae growth are: abiotic factors, biotic factors, and operational factors. Abiotic factors include light, temperature, nutrient concentration, O2, CO2, pH, salinity, and toxic chemicals. Like abiotic factors, biotic factors influence algae growth, but encompass living organisms such as pathogens (e.g., bacteria) and competition between other strains of algae to obtain nutrients. Operational factors also play an important role and include mixing shear, dilution rate, and frequency of harvesting (Mata et al, 2010). As a result, achieving equilibrium among these factors maximizes algae growth (Williams, 2002).
Lighting is a very essential abiotic factor. An increase in light intensity (up to certain limits) will result in an increase in cell concentration (Kaewpintong, 2004). The intensity needed varies greatly based on culture depth and algal culture density. The deeper and denser a culture, the more light intensity is needed to penetrate optimally into the culture. Fluorescents should emit blue or red spectrum because these two are the most effective spectrums for photosynthesis (Oilgae report, 2010).
In addition to light, temperature is another important factor. Generally, in both open and closed systems, most strains of microalgae can stand temperatures 15 oC below their optimum temperature; however, temperatures only 2 oC to 4 oC over their optimum temperature can result in culture loss (Mata et al., 2010). In some closed systems, when the temperature reaches about 55 oC, overheating might be occurring. In such conditions, evaporative cooling systems can be helpful to decrease the temperature to 20-30oC (Moheimani, 2005).
Mixing is essential for the growth of algae. Mixing provides uniformity of heat for the culture, makes the transfer of gases easier, and prevents sedimentation. In order to have rapid circulation, it is desirable to create a moderately turbulent stream, especially in open systems (Barbosa, 2003). However, excessive turbulence can damage the microalgae cells because of the shear stress that excessive turbulence creates (Eriksen, 2008). The ideal degree of turbulence is a function of the strain of algae (Barbosa, 2003).
In all growth systems, salinity is a very important parameter, depending on the temperature. Each algae strain has its individual optimal salinity range. The best method to control the salinity is adding fresh or salt water to the medium, if needed (Mata et al., 2010). Figure 2.2 shows that the nutrition concentration decreases during algal growth, and most of the nutrient depletion occurs in the stationary growth phase. Figure 2.3 shows a schematic diagram for integrated biomass production.
The other factors determining the growth rate of algae are photoperiod (light and dark cycles), pH (between 7 and 9 for optimal growth), CO2 aeration requirements, and the medium (Oilgae report, 2010).
The growth medium should contain the elements that are essential for the algal cells. These elements are nitrogen, phosphorous, sulphur, potassium,
2011-2015 FINAL REPORT - COOPERATIVE AGREEMENT NO. R10AC80283 Page 915

12
magnesium, iron, and trace metals like calcium, sodium, cobalt, zinc, copper, and molybdenum (Chisti 2007; Oilgae report, 2010).
Microalgae generally accept nitrate, ammonia, and other sources of organic nitrogen, like urea. Phosphorous is vital for cellular processes, and mostly available in forms of inorganic phosphate or H2PO4
- or HPO42-. Since sulphur is
one of the constituents of essential amino acids, some algae have been known to be capable of utilizing organic sulphur sources. The presence of calcium is also important because it plays a key role in the maintenance of cytoplasm. Calcium is usually deposited on the cell walls of some algae.
Without potassium, an algae culture’s photosynthesis will be reduced, creating a deficiency in growth. Sodium is essential for marine algae because it is needed for nitrogen fixation. The presence of sodium is necessary for the transformation of molecular nitrogen to ammonia. For all algal species, magnesium is a requirement because it is a central atom of the chlorophyll molecule. Iron is also important due to its nitrogen assimilation from a growth medium. The availability of trace metals in very small amounts is useful for some strains of algae because these metals have an influence on growth and protein accumulation (Oilgae report, 2010).
Microalgae have four main metabolisms for growth: autotrophic, heterotrophic, mixotrophic, and photoheterotrophic. Autotrophic organisms use light as their only source of energy and convert it to chemical energy through photosynthesis. Heterotrophic organisms cannot fix carbon, and only use organic carbons in order to grow. Mixotrophic organisms can live either autotrophically or heterotrophically, meaning that their growth depends on the concentration of organic compounds and light intensity. Since this metabolism can eliminate or reduce the need for light, it can decrease the cost of the wastewater treatment and biofuel generation processes. Photoheterotrophic organisms need light to use organic carbon (Mata, 2010).
2.6 Algal strain selection
It is estimated that there is a large number of strains of algae available (Richmond, 2004). However, in reality, only some of them could be used for energy production in an economically feasible manner. Thus, selecting the right strain of algae is very important to the production of any kind of bioenergy. Based on previous studies, the following criteria are central to selection of algal species (Mata et al., 2010, Oilgae report, 2010):
- Growth rate; - High performance in competitive mass nature and tolerance to predators; - High lipid content and energy yield based on type of fuel from biomass; - Tolerance to changes in environmental conditions, including resistance to
temperature, nutrient input (salinity), and light change; - Nutrient availability, especially CO2, when carbon fixation is the goal; - Possibility of obtaining other valuable chemicals; - Degree of easiness of biomass isolation; and
2011-2015 FINAL REPORT - COOPERATIVE AGREEMENT NO. R10AC80283 Page 916

13
- Less complex structure, and as a result easier oil extraction.
2.7 Carbon dioxide fixation
Excessive carbon dioxide emission has caused global warming; therefore, the mitigation and sequestration of CO2 is paramount to lowering human impact on the global climate. While there are other approaches to CO2 sequestration, biological approaches are more economical and are more popular due to the fact that they combine biomass production with CO2 fixation while reducing or eliminating waste (Pluz and Gross, 2004).
Carbon forms approximately 50% of algal biomass (Sánchez Mirón et al., 2003). This carbon is mostly supplied from CO2. Microalgae have a voracious appetite for carbon dioxide. Based on estimations, producing 100 tons of biomass will fix nearly 183 tons of CO2 (Antoni et al., 2007). To grow algal biomass, CO2 must be injected into the growing medium continuously in daytime. This CO2 could be supplied from the existing flue gas of coal-fired power plants (Sawayama et al., 1995; Yun et al., 1997) which are responsible for 7% of the total world CO2 emissions (Kadam, 1997). To completely fix the CO2 emission of a power plant with the capacity of one MW, roughly 40 acres of algal pond is needed (Awshti and Singh, 2010). This process could be also combined with using wastewater as a medium for algae to grow and recycle CO2 while treating water (Demirbas and Demirbas, 2011).
2.8 Culture systems in commercial scale
Considering available materials and local conditions, it is possible to design different culture systems with different capacities, materials, and mixing types (Mata et al., 2010). However, in reality, there are only two feasible methods available for large-scale production of microalgal biomass: raceway ponds (Terry and Raymond, 1985; Molina Grima, 1999) and tubular photobioreactors (Molina Grima et al., 1999; Tredici, 1999). Batch, semi-batch, and continuous systems could be used for cultivation (Awasthi and Singh, 2011). In order to select the optimal method, several criteria must be considered (Mata et al., 2010): the selected algae strain, local environmental and climatic conditions, and the availability of nutrients. In large scale commercial production, a continuous method is mainly used, where medium is fed at a constant rate to the algal broth which is harvested continuously (Molina Grima et al., 1999). Photobioreactors can be operated in batch mode as well, but the continuous mode has some advantages over batch, including: higher control, more reliable results due to steady state condition, more control over biomass concentration by changing the dilution rate, and easier system investigation and analysis (Williams, 2002).
2011-2015 FINAL REPORT - COOPERATIVE AGREEMENT NO. R10AC80283 Page 917

14
2.9 Open ponds
Open ponds have been used for algal production since the 1950s. Species such as Nannochloropsis, Chlorella, and Dunaliella salina have been cultivated in outdoor ponds. A raceway pond consists of closed loop circulation channels that have a 0.3 m depth. Baffles are used at the end of each channel to change the flow direction. Channels are commonly made of concrete and covered with plastic. There is paddlewheel from where flow begins. Also, feed is injected to the algal broth continuously during the daylight, exactly in front of the paddlewheel. Harvesting is done behind the paddlewheel. The paddlewheel must operate all day long in order to prevent sedimentation (Chisti, 2007). A schematic view of a raceway pond is shown in figure 2.4.
In terms of economics, open ponds are relatively more economical than photobioreactors, but these ponds have drawbacks due to water availability, climatic conditions, contamination by microorganisms like bacteria and fungi, low productivity, and the occupation of a large land area (Mata et al., 2010; Patil et al., 2008; Ugwu, et al., 2008).
2.10 Photobioreactors
Photobioreactors are known as a method for producing a huge amount of algal biomass (Molina Grima et al., 1999; Tredici, 1999; Carvalho et al., 2006). Although artificial illumination is more expensive than natural illumination, artificial illumination has been used successfully in large scale biomass production, and is practically feasible (Pulz, 2001). To prevent sedimentation in the tubes, turbulent flow is provided by either mechanical pump or airlift pump (Molina Grima et al., 1999). Mechanical pumps can be installed and operated more easily; however, they can damage the biomass (García Camacho et al., 2007; Sánchez Mirón et al., 2003; Mazzuca Sobczuk et al., 2006).
In most photobioreactors, dissolved oxygen must be lower than 400% of air saturation; therefore, since the oxygen cannot be removed within the tubes, the length of the tubes must be limited by a continuous mode. For this reason, the culture must be intermittently returned to the degassing zone, where air bubbles strip out the accumulated oxygen. The length of the tube is also a function of other factors such as biomass concentration, light intensity, flow rate, and oxygen concentration at the entrance (Chisti, 2007). Due to these restrictions, the tubes normally should not exceed 80 m (Molina Grima et al., 2001).
An increase in pH will occur when the broth goes forward through the tube due to the consumption of CO2 (Camacho Rubio et al., 1999); thus, in some cases, carbon injection is needed at certain intervals in order to prevent carbon deficiency and increase the pH (Molina Grima et al., 1999). Photobioreactors must have a cooling device to operate both day and night due to the changes in temperature, which injure the algae and reduce the biomass (Chisti, 2007).
Photobioreactors are more flexible than open ponds because they can be adjusted depending on algal strains, especially the strains that cannot be grown in
2011-2015 FINAL REPORT - COOPERATIVE AGREEMENT NO. R10AC80283 Page 918

15
open pond; however, the set-up cost of a photobioreactor is much higher than the set-up cost for an open pond (Patil et al., 2008).
2.10.1 Tubular photobioreactor
Tubular photobioreactors have been proven to be the most satisfactory photobioreactor design for large scale algal biomass production (Chisti, 2009). Tubular photobioreactors are made of an array (solar collector) of translucent plastic or glass tubes. The diameter of the tubes must not exceed 0.1 m, because a diameter greater than this does not allow the light to penetrate deep into a culture’s denser areas (Chisti, 2007). The tubes are usually oriented north to south for better sunlight capture.
The culture broth is circulated from a degassing zone to a solar collector zone to capture sunlight. The culture is then circulated back to the degassing zone. This circulation is continuously repeated and makes turbulent flow. This flow causes a suspension of the cells, prevents sedimentation, and efficiently mixes gases inside the photobioreactor. Figure 2.5 illustrates the design of a tubular photobioreactor. 2.10.2 Fence-like solar collector
Like figure 2.6, sometimes tubes are located horizontally in parallel to each other, similar to a fence. Thus, this design has been called the fence-like solar collector. This design tries to maximize the number of tubes that can be located in a limited area. The tubes have their ends placed in the north and south direction to optimize sunlight capture. The bottoms of the tubes are either painted with white color or covered with white sheets for better reflection (Chisti, 2007). 2.10.3 Helical tubular photobioreactor
In this design, tubes, instead of being laid either horizontally or vertically, are coiled around a supporting frame. The tubes are made of polyethylene, so they are flexible and capable of being coiled. The diameter of each tube is typically 3 cm. This system is equipped with a gas exchanger tower and a heat exchange system. The device used in this design for circulation is a centrifugal pump. This design is useful for small volumes of microalgal culture (Chisti, 2007).
2.11 Open raceway ponds vs. photobioreactors
The following table (table 2.4) provides the most important criteria for selecting the appropriate microalgal biomass production method for a given situation.
Temperature control is difficult in raceway ponds and evaporation is high due to exposed surface area. This increase in evaporation causes less CO2 fixation in comparison to photobioreactors. Additionally, low biomass concentrations occur in raceway ponds because of poor mixing (Chisti, 2007). Raceway ponds consume more energy to homogenize nutrients in the growing medium, and the
2011-2015 FINAL REPORT - COOPERATIVE AGREEMENT NO. R10AC80283 Page 919

16
water depth cannot exceed 15 cm in order to let microalgae receive enough sunlight (Richmond, 2004). The atmosphere contains only 0.03%–0.06% CO2; therefore, because of this mass transfer limitation in open ponds, microalgae growth will be slow unless CO2 is injected (Mata et al., 2010). In contrast to photobioreactors, open ponds cannot process single-species culture for a long period of time due to high contamination risks. The harvesting and recovery of biomass for oil extraction typically costs more in open ponds than in photobioreactors because the biomass concentration in the photobioreactor is much denser (almost 30 times) than open pond systems (Chisti, 2007).
Although there are many advantages of photobioreactors over open ponds, these two do not have to be viewed as competing technologies. Photobioreactors have many disadvantages, including high upfront and maintenance costs, cell damage due to higher shear stress, overheating, bio-fouling, hard scaling-up, and oxygen accumulation.
2.12 Harvesting
Harvesting is the process of recovering biomass from the culture medium. This process is very difficult, energy intensive, and expensive (Pimentel et al., 2004). Harvesting accounts for 20%-30% of the total cost of algal cultivation (Grima et al., 2003). In addition to cost, harvesting has other challenges including flocculant toxicity and the difficulty of large scale application (Awshti and Singh, 2011). There are some conventional methods to harvest microalgae from media, including centrifugation (Briens et al., 2008), foam fractionation (Brown et al., 1997), flocculation (Canakci and Van Gerpen, 2001), membrane filtration (Chisti, 2007), and ultrasonic separation (Chynoweth et al., 1993).
Flocculation is easier than centrifugation and filtration because flocculation can treat a large amount of culture. The most effective flocculant agent that has been reported so far is aluminum sulfate, followed by certain cationic polyelectrolytes (Conover, 1975). The role of the flocculant is to aggregate algae cells in order to increase the effective particle size and, as a result, make recovery more convenient (Grima et al., 2003). However, chemical flocculation is too expensive for large scale operations (Amin, 2009).
Another technology to recover biomass is membrane filtration. It can be performed under pressure or in a vacuum to recover biomass, but it is quite slow. This method is appropriate for large size microalgae. For small scale operations, microfiltration and ultra-filtration can be used instead of conventional filtration systems. Filtration is expensive mostly because of membrane replacement and pumping costs (Mata, 2010).
The other method available is froth flotation, which is not broadly used. This method separates algae from the culture by making air bubbles and adjusting optimal pH in order to create a froth of algae that accumulates above the liquid level (Awshti and Singh, 2011). Ultrasound-based methods of algae harvesting are under development.
2011-2015 FINAL REPORT - COOPERATIVE AGREEMENT NO. R10AC80283 Page 920

17
Based on suggestions (Richmond, 2004), the most important criterion for choosing a harvesting method is the desired final product. For instance, for low-price products, gravity sedimentation coupled with flocculation is appropriate, but for high-quality recovery, centrifugation is of interest because it can process large volumes of biomass.
2.13 Algal drying
Drying or dewatering is a process of reducing the water content of algae from almost 90% to 50% prior to oil extraction. This level of drying is essential for producing a solid material. Several methods have been employed to dry microalgae. The most common drying methods are spray-drying, drum drying, freeze-drying, and solar drying (Richmond, 2004). Solar drying may not require any additional energy sources, but it does require a large land area to be expedient. The most efficient method is to use low-grade waste heat from power plants to dry algae in vessels. Spray-drying is expensive and not economically feasible for low value products, such as biofuel or protein (Mata et al, 2010).
2.14 Oil extraction
There are several methods to extract oil from microalgae for biofuel production. It is possible with either a press or through chemical methods. There are three chemical methods available for oil extraction: solvent method, soxhlet extraction, and supercritical fluid extraction.
Hexane solvent usually is used along with a press method. First, oil is extracted using a press, then the remaining pulp is mixed with cyclo-hexane to extract the remaining oil. The oil dissolves in cyclo-hexane, and the pulp is filtered out. The final stage is the separation of oil and cyclo-hexane by distillation. This method may recover approximately 95% of the total oil in algae.
Soxhlet extraction uses chemical solvents. Oil is extracted through repeated washing with an organic solvent, such as hexane or ether in special glassware.
In supercritical fluid or CO2 extraction, CO2 is first liquefied under pressure and heated to the point where it has the properties of both a liquid and a gas (critical point). Next, this liquefied fluid is used as the solvent in oil extraction (Awshti and Singh, 2011). Supercritical fluid extraction is far more efficient than traditional solvent separation methods. Since supercritical fluids are selective, the product would be very pure (Paul and Wise, 1971). The performance of CO2 extraction is almost 100% (Demirbas and Demirbas, 2011).
2011-2015 FINAL REPORT - COOPERATIVE AGREEMENT NO. R10AC80283 Page 921

18
2.15 Energy conversion from microalgae
In addition to oil, it is possible to derive non-fuel products from microalgae. Since microalgae contain proteins, carbohydrates and other nutrients, the residual biomass from the transesterification process for biofuel production could be used as animal feed (Schneider, 2006). Additionally, it could be burnt directly to produce heat. These possibilities could reduce the cost of biodiesel. Also, microalgal biomass is available in powder form for the human health food market (Demirbas and Demirbas, 2011).
The energy conversion processes from microalgae can be categorized into biochemical, thermochemical, and direct combustion (Tsukahara and Sawayama, 2005). Biochemical conversion can subdivided into fermentation and transesterification. Thermochemical conversion can be subdivided into gasification, pyrolysis, liquefaction, and hydrogenation. The chart of energy conversion from microalgae is shown in figure 2.7 and a brief description for each process is detailed in sections 2.16.1 and 2.16.2. 2.15.1 Biochemical conversion 2.15.1.1 Fermentation
The goal of fermentation is to produce ethanol at a large scale. First, the biomass is ground, and then converted to sugar by enzymes. Next, the sugar is converted to ethanol by yeast (McKendry, 2003).
2.15.1.2 Transesterification
Transesterification is the reaction between a fatty acid and alcohol to form esters and glycerol. The result of the reaction is biodiesel (Schuchardt, 1998).
2.15.2 Thermochemical conversion 2.15.2.1 Gasification
Gasification is a chemical process in which hydrocarbons are converted to synthetic gas by partial oxidation with air at high temperature in the range of 800-900 ºC (Awshti and Singh, 2010).
2.15.2.2 Pyrolysis
Pyrolysis is a phenomenon related to the decomposition of biomass by heating the biomass at a high temperature (around 500 ºC) in the absence of oxygen in order to produce biofuel, charcoal, and gas (McKendry, 2003; Miao et al., 2004).
2.15.2.3 Liquefaction
Microalgal biomass has a high water content (80-90%) after harvesting, and large amounts of energy are required to reduce moisture prior to processing. This drying is a pretreatment to make the biomass ready for heat and power generation. Thus, because more energy is needed, the production cost increases
2011-2015 FINAL REPORT - COOPERATIVE AGREEMENT NO. R10AC80283 Page 922

19
(Klass, 1998). However, a liquefaction reaction produces biofuel directly without need of drying (Singh and Gu, 2010). The main product of this reaction is bio-crude with a heating value ranging from 30 MJ kg-1 to 35 MJ kg-1 (Goudriaan, 2001).
2.15.2.4 Hydrogenation
Hydrogenation is a reductive reaction in which hydrogen atoms are added to double bonds of a molecule, in the presence of a catalyst and a solvent, under high temperature and pressure conditions. The process forms a three-phase operation in which the contact among the gaseous phase (hydrogen and hydrocarbon phase), the liquid phase (mixture of solvent and liquid product), and the solid particle phase (algal and catalyst) results in algal conversion and the promotion of effective momentum, heat, and mass transfer (Gaffron and Rubin, 1942; Awshti and Singh, 2010).
2.16 Biodiesel from algae
Biodiesel is produced through the process of transesterification. Aquatic unicellular green algae are used in this reaction for biodiesel production. Transesterification is a reaction of parent oil with short chain alcohol (commonly methanol) in the presence of a catalyst. The use of an acid catalyst has been proved possible, but the reaction rates are too slow (Meng et al., 2009); therefore, alkali-catalysts are commonly used commercially because they are 400 times faster (Awshti and Singh, 2010). Products of the reaction are glycerol and fatty acid methyl esters (FAME) or biodiesel (Chisti, 2007; Belarbi et al., 2000).
The energy of biodiesel is similar to petroleum diesel. The heating value of petroleum diesel is 42.7 MJ/kg, and the heating value of biodiesel derived from algae is 41 MJ/kg (Xu et al., 2006). On the other hand, biodiesel from microalgae does have some disadvantages. For instance, it is unstable and contains many polyunsaturated fatty acids (Demirbas and Demirbas, 2011). Biodiesel production from microalgae could be more cost effective and environmentally-friendly if integrated with wastewater treatment and power plant flue gas treatment (CO2 fixation) (Hodaifa et al., 2008). The schematic process of biodiesel production is shown in figure 2.9.
2.17 Ethanol from algae
Ethanol could be derived from microalgae through either fermentation or gasification due to microalgae’s high content of hydrocarbon and polysaccharides (Minowa and Sawayama, 1999). Since bioethanol has only 64% of biodiesel energy and annual U.S. biodiesel needs are 0.53 billion m3, approximately 828 million m3 of bioethanol would be required to fulfill this need. The amount of algae necessary to create enough bioethanol would require 111 M hectares of land
2011-2015 FINAL REPORT - COOPERATIVE AGREEMENT NO. R10AC80283 Page 923

20
area, almost 61% of the total available cropping area in U.S. Therefore, selecting ethanol over biodiesel would be impractical (Chisti, 2008).
2.18 Methane from algae
Methane can be derived from residual biomass through anaerobic digestion to generate the electrical power needed to run the biomass production facility (Raven and Gregersen, 2007). Studies have indicated that, among different sources of biomass, marine algae offer the greatest potential for biomethanation due to their high growth rate (Chynoweth et al., 1993).
2.19 Economics of biodiesel production
The main obstacle to large-scale production of microalgae is economics. If efficient methods for recovery and oil extraction processes are utilized, microalgal production costs can be minimized (Chisti, 2008). These parameters are very important, but the key for large-scale production of biofuel from microalgae is creating a holistic biorefinery that would integrate several factors (Pushparaj et al., 1993), including biomass production, growth management, wastewater management by using the wastewaters as a growth medium, CO2 sequestration by using the flue gas of power plants as a carbon source for algae, transport to conversion plants, drying, product separation, recycling, and transport of products to the market place (Patil et al, 2008). The ideal would be to build the biorefinery near power plants, and to design conversion plants within the biorefinery to remove or minimize the cost of transportation (Klass, 1998).
2.20 Water scarcity
Lack of water to meet daily needs is a reality today for one in three people all around the world (Oki and Kanae, 2006). According to a report of the United Nations, about 1.2 billion people are suffering from water scarcity, and another 1.6 billion people are encountering water shortage due to economic factors: i.e., countries lack infrastructure to make use of water from rivers or aquifers. Globally, the problem is getting worse as cities and populations grow, and the demands for water increase in agriculture, industry, and households.
Water scarcity has two causes: natural phenomena and human-made phenomena. An example of a natural phenomenon is that, although there are enough freshwater sources for the current global population, these resources are unevenly distributed geographically. Human-made phenomena include wasting water and global warming.
Because water scarcity forces people to rely on unsafe sources of drinking water, poor water quality can increase the risk of infection from diseases such as
2011-2015 FINAL REPORT - COOPERATIVE AGREEMENT NO. R10AC80283 Page 924

21
typhoid and paratyphoid fever (Crump and Mintz, 2009). Thus, water scarcity underscores the need for better water management. Since the amount of freshwater on the planet has remained fairly constant over time, there is a crucial need to desalinate and make use of saline and brackish waters. There are many desalination methods that can be applied in combination with available local energy sources for water in dry places. Choosing a specific technique depends on local geographic conditions and the production capacity desired (Belessiotis and Delyannis, 2001). 2.21 Water desalination
Technologies for water purification are based on three main categories: membrane technologies, thermal technologies, and chemical approaches. In some cases, a combination of all three approaches is applicable. The most common desalination approach in the United States is the use of membrane technologies, while thermal methods are rarely used in the United States (Younos and Tulou, 2009).
Generally, membrane technologies use either pressure-driven or electrical-driven technologies. Pressure-driven membrane technologies include reverse osmosis (RO), nanofiltration (NF), ultrafiltration, and microfiltration (Duranceau 2001). Electrical-driven membrane technologies include electrodialysis (ED) and electrodialysis reversal (EDR). The use of EDR and RO systems has significantly increased over the past two decades. There are different typical thermal technologies available, such as solar distillation (SD), multistage-flash, multiple effect evaporation (MEE), thermal vapor compression (TVC), mechanical vapor compression (MVC), and adsorption vapor compression.
Chemical approaches have been considered impractical for treating water with high levels of total dissolved solids (TDS). Such methods are usually used for water softening in a process referred to as ion exchange, which could be described as the interchange of ions between a solid phase and a liquid phase surrounding the solid. There are a limited number of high-quality sources of water in United States; therefore, wastewater, brackish sources, and salt waters, or a combination of the three, are used to meet the demand for water. However, two issues have restricted the expansion and practical deployment of water desalination technologies for inland brackish water: (1) costs associated with treatment technologies, and (2) environmental effects related to concentrate disposal.
2.22 Concentrate disposal problem
Concentrate is a byproduct of desalination that contains between 10 and 50% of the treated water, as shown in figure 2.10. Concentrate has very high salinity, and may have low concentrations of the chemicals used in the pretreatment and post-treatment (cleaning) processes, such as the antiscalants
2011-2015 FINAL REPORT - COOPERATIVE AGREEMENT NO. R10AC80283 Page 925

22
which are used to prevent scaling in membranes. The types of chemicals left over in the concentrate depend on the type of membrane.
Concentrate features depend on the type of desalination technology used. The amount of the produced concentrate is a function of the desalination process recovery rate. Since membrane technologies have a higher recovery rate, the produced concentrate from membrane technologies is more salty than concentrate produced from thermal or chemical technologies (Younos, 2005).
RO concentrate usually remains at the ambient water temperature. In comparison to freshwater, concentrate has a higher density because of its high salt concentration; therefore, when the concentrate is disposed of into lower salinity water, concentrate has a tendency to sink, which results in problems for the marine environment. These impacts can be mitigated by diluting concentrate before disposing of it (Younos, 2005).
Toxicity in concentrate is connected to three parameters: pH, TDS, and ion imbalance. As a result of adding acidic solution in order to prevent scaling of calcium carbonate in membranes, the pH in concentrate is lower than most surface waters when it leaves the membranes. Low pH waters can add toxicity in marine environments. This pH problem can be solved by adding caustic soda or some similar basic solution. As a result of excessive TDS, the high density of concentrate will have negative benthic impacts if deposited in a body of water. Water mixed with concentrate that has excessive TDS is also toxic to grass, crops, and landscaping. If the feed water is seawater and has an efficient treatment performed on it, the TDS of concentrate can go beyond 36,000 ppm, which is very harmful for the environment. Furthermore, the toxicity created by ions like calcium, fluoride, and potassium is hard to remove. Concentrate has been proved to be toxic to freshwater and marine organisms. The ions that mostly account for this toxicity are calcium, fluoride, and potassium (Mickley 2001). In the case of the treatment of groundwater, which often contains high levels of potentially harmful gases such as carbon dioxide and hydrogen sulfide, the resulting concentrate from groundwater treatment will have a high toxicity (Mickley 2001). Lastly, ion imbalance is also a function of the desalination method used. For instance, in the nanofiltration method, calcium, magnesium, bicarbonate, and fluoride are the ions that deviate from ion balance.
Brine concentrate resulting from seawater desalination contains a level of TDS that exceeds 36,000 mg/L. Therefore, if concentrate is disposed of in an inappropriate fashion, it will create problems for marine and other habitats (Younos, 2005). There are several methods to dispose of concentrate: surface water discharge, sewer discharge, deep well injection, evaporation ponds, infiltration basins, and irrigation. In the United States, the most common methods are surface water discharge (for almost 50% of all plants) and sewer discharge (for about a third of all plants). Surface water discharge includes disposal into freshwater rivers, coastal waters, and freshwater lakes or ponds. Rather than disposing of concentrate in surface waters, sewer disposal puts concentrate underwater. These methods are usually available for coastal areas.
For inland areas like New Mexico, concentrate disposal is a major hindrance for building desalination units because the concentrate cannot be
2011-2015 FINAL REPORT - COOPERATIVE AGREEMENT NO. R10AC80283 Page 926
23
returned to sea water easily. There are various factors to consider for choosing the disposal method for concentrate from inland brackish water, such as concentrate volume, TDS of concentrate, location of the desalination unit, capital and operating costs, and environmental issues (Younos, 2005).
2.23 Objective of this research
In order to increase the feasibility of the desalination processes, identifying a beneficial use for the concentrate from inland desalination systems is highly desired. The objective of this research is to develop an innovative solution to use concentrate streams from the RO process, which contain high concentrations of dissolved solids, to grow microalgae for the production of biofuel. Specifically, the objective of this research is to:
Evaluate the growth of two strains of microalgae in desalination concentrate; and
Evaluate ion removal from concentrate by microalgae.
2011-2015 FINAL REPORT - COOPERATIVE AGREEMENT NO. R10AC80283 Page 927
24
Chapter 3 Experimental Studies
3.1 Introduction
To examine whether concentrate from inland desalination could be an appropriate medium for growing microalgae while investigating whether microalgae can contribute to concentrate treatment, a full factorial experiment with completely random design (CRD) arrangement was conducted. Two strains of algae, Nannochloropsis oculata (UTEX- LB 2164) and Dunaliella tertiolecta (UTEX-LB 999), were cultivated in four different media (concentrate, f/2, a 50:50 combination of f/2 and concentrate, and deionized water). The microalgae growth was compared among the different types of growing media. Additionally, ion removal from concentrate by microalgae was studied. This chapter covers experimental apparatus and analytical methods used in this study.
3.2 Strains of algae
In this research, two strains of microalgae, Nannochloropsis oculata (UTEX- LB 2164) and Dunaliella tertiolecta (UTEX-LB 999), were obtained from the University of Texas Algae Collection in Austin, Texas. The pre-cultures of both strains were cultivated in f/2 medium (Guillard, 1975) for about three weeks in a 10 gallon aquarium aerated with ambient air. The air pumps were connected to air stones for better air distribution. When an optical density of approximately 1.00 was obtained at a wave length of 750 nm for each strain, four liters from each strain was taken for the experiment.
Both Nannochloropsis oculata and Dunaliella tertiolecta absorb CO2 efficiently, making these algae species good candidates to test the hypothesis of this paper (Ono et al., 2004).
Nannochloropsis is a green algae that includes approximately six species. Nannochloropsis has been considered as a suitable candidate for biofuel production due to its fast reproduction and high oil content, which ranges from 31-68% of dry weight (Chisti, 2007; Apt & Behrens, 1999). Nannochloropsis oculata is known as a marine algae; however, this strain also has been observed growing in fresh and brackish water (Karen and Marvin, 2007). This strain was selected for this experiment due to the high salinity of the concentrate.
Dunaliella tertiolecta is a unicellular algae strain with oil content of approximately 40% of dry weight. Dunaliella tertiolecta is a very fast growing strain with a high CO2 fixation rate (Demirbas, 2009). Additionally, Dunaliella is a green algae capable of growing in water bodies containing more than 10% salt, such as oceans and brine lakes (Oilgae report, 2010). This strain was selected due to its tolerance of saline environments.
2011-2015 FINAL REPORT - COOPERATIVE AGREEMENT NO. R10AC80283 Page 928

25
3.3 Culture and medium
In this research, four different media were used: concentrate, f/2, a 50:50 combination of f/2 and concentrate, and deionized water.
3.3.1 Concentrate medium
Concentrate refers to an 80/20 mixture of concentrate and f/2 in this experiment. It was obtained from the reverse osmosis (RO) water desalination process at the Brackish Groundwater National Desalination Research Facility (BGNDRF) in Alamogordo, New Mexico. The concentrate specifications were as follows: TDS was 6240 ppm, electroconductivity (EC) was 10260 µS/cm, and pH was 7.83. The ion content of concentrate is shown in table 3.1. Only ions which are vital for algae to grow were targeted. Since NH4
+ was not available in the concentrate, that ion is not mentioned in Table 3.1. 3.3.2 f/2 medium
The f/2 medium is a common and widely used general enriched seawater medium designed for growing coastal marine algae. The recipe used in this experiment for making one liter of f/2 is tabulated in table 3.2. 3.3.3 50:50 combination of f/2 and concentrate medium
This combination was incorporated into the experimental design because it is more economical than f/2 while using concentrate.
3.3.4 Deionized medium
This medium served as the control medium in this experiment.
3.4 Photobioreactor set up
In this study, 32 cylindrical, glass UTEX 500-milliliter photobioreactors were used. Each photobioreactor was 14 cm in height and 7 cm in diameter with a working volume of 500 ml and an autoclavable body. Each photobioreactor was equipped with five air delivery modules, a water trap, an air pump, an air stone, and one additional access port for sampling and measurements as shown in figure 3.1. 3.5 Design of experiment
32 runs were conducted in order to provide the data required for testing the various combinations of the 2 types of microalgae and 4 media. Since the experimental design used was a full-factorial design (2X4), eight combinations of microalgae and media were obtained (table 3.3). Furthermore, since four
2011-2015 FINAL REPORT - COOPERATIVE AGREEMENT NO. R10AC80283 Page 929

26
replications were taken at each level, there were four data points at each combination.
3.5.1 Experimental Apparatus
An experimental apparatus was constructed using the UTEX glass photobioreactors. In order to pass an air tube into the photobioreactor through a check valve on the top of the lid, each photobioreactor had a quarter-inch hole made in the center of the lid. Then, the air tube was connected to the air stone for better air distribution, as well as to create more homogenous bubbles. Each photobioreactor was aerated by a Fusion Air Pump 200 (1.5 W). The lighting device used consisted of four General Electric, F40PL/AQ-ECO, wide-spectrum, 40W florescent tubes with a 3100K color temperature, producing 1900 lumens for each rack. The average distance from the bulbs to the experimental medium was 25 cm. For better light distribution, the floor of each rack was covered with aluminum foil. This addition enabled light from the bottom of the rack to reflect to the underbelly of the photobioreactor.
All weights were measured using an Acculab AL-204 scale with an accuracy of +/- 0.0001g. An Eppendorf 5804 centrifuge was used to isolate biomass from the medium. The wet biomass was dried in a Fisher vacuum oven. An Eppendorf 1-50 ml pipette was used for the inoculation and transfer of algae. Volumes of the medium were measured using volumetric flasks. The pH was measured using an Accumet AB15/15+ pH meter. Before taking each pH sample, the pH meter was calibrated with standard pH 7 solution. A SANYO MLS-3751L was used to autoclave glassware.
3.5.2 Test procedure
In this experiment, concentrate medium with TDS of 6240 mg/l was obtained from concentrate disposed from the RO pilot plant located in BGNDRF in Alamogordo, New Mexico. The f/2 medium was prepared using the standard protocol. To avoid any contamination, all glassware was washed and rinsed with distilled water, and then autoclaved. Eight algae/medium sets with four replications for each treatment were placed separately inside the 32 batch photobioreactors. All the photobioreactors were placed under 16 hours of illumination and 8 hours of darkness at 30 oC ± 2.0 °C. Then, the inoculums of microalgae were cultivated in four media at the ratio of 1 to 4 in photobioreactors.
The next step was filling the photobioreactors with 320 ml of their respective media. Subsequently, the pH of the media was measured and found to be at 7.8, 6.9, 7.5 and 7.1 for concentrate, f/2, the 50:50 combination of f/2 and concentrate, and deionized water, respectively. Next, 80 ml of stirred homogenous algae was added to each photobioreactor containing 320 ml of medium. The initial biomass of the inoculating algae was defined by taking four 50 ml samples. The samples were centrifuged at 10,000 rpm for three minutes. The supernatant was discarded from each sample, and the remaining algae in each sample were again rinsed with deionized water and then centrifuged a second time. These samples were then dried for 24 hours at 80 °C. The initial biomass added to the photobioreactor was 0.052 g and 0.043 g for Dunaliella tertiolecta (UTEX-LB
2011-2015 FINAL REPORT - COOPERATIVE AGREEMENT NO. R10AC80283 Page 930

27
999) and Nannochloropsis oculata (UTEX- LB 2164), respectively.The photobioreactors were placed randomly in racks. Air with a volumetric flow rate of 5 ml/s entered each photobioreactor through the air hose inserted through the lid. The experiments ran for 10 days. During this period, pH, optical density at 750 nm, TDS, EC and total nitrogen (TN) were measured every day. Furthermore, dry biomass and the ion content of each concentrate medium were measured in the first and last days of the experiment. The resulting data were analyzed using a general linear model (GLM) procedure. Assumptions were checked using SAS 9.1.3. Means were compared using Tukey’s Test (P<0.05).
3.6 Analytical method 3.6.1 Algae growth
One of the main objectives of this experiment is to compare the growth of microalgae between different conventional media. Basically, there are three methods to quantify biomass concentration: measuring dry weight of biomass, counting cell numbers, and using the optical density method. Measuring biomass concentration is difficult and sometimes even unreliable. For instance, dry weight method and cell counting are susceptible to failure if the suspension contains insoluble particulates (Richmond & Hu, 2013). Likewise, if the suspension is not clear, optical density is not very accurate as a measure. Furthermore, optical density does not have the capability to distinguish viable cells from others. The number of cells is counted in order to evaluate the amount of biomass in optical microscopy or flow cytometry (FCM). In this experiment, optical density and dry biomass weight were used in tandem to assess biomass production.
3.6.1.1 Dry biomass weight analysis
Although calculating the dry weight of a sample is challenging, it is the most accurate method to determine biomass production (Richmond & Hu, 2013). To measure dry biomass, a 50 ml sample of culture suspension was taken. Then, the sample was transferred to a pre-weighed 50 ml plastic tube. The plastic tube, with content of algal culture, was centrifuged for 3 minutes at 10,000 RPM, after which the supernatant was extracted. Since the dry weight, especially for marine algae, is heavily affected by the salts and nutrients absorbed on the cell surface, the centrifuged content was rinsed with deionized water in order to reduce the error in determining the amount of dry biomass based on a suggestion by Lee and Shen (Lee & Shen, 2004). Subsequently, the tubes were centrifuged at 10,000 RPM for 3 minutes after rising with deionized water. The clear supernatant was discarded, while the tubes containing the biomass were dried in the oven at 80 oC for 24 hours. In order to prevent loss of volatile components in algae cells, the temperature was maintained below 90 oC. The dry biomass was determined by the difference between the initial and final weight of the tube.
2011-2015 FINAL REPORT - COOPERATIVE AGREEMENT NO. R10AC80283 Page 931

28
3.6.1.2 Optical density Optical density is determined by the following relationship: A= -log (I/I0) (3-1) Where A is absorbance, I0 is the intensity of light before it enters the
sample, and I is the intensity of light that has passed through the sample (transmitted light). Optical density (absorbance) is a fast, indirect, and nondestructive method to measure biomass. The light absorbed by a suspension can be related directly to biomass; the relationship has already been established by calculating chlorophyll A, B, and total chlorophyll for each variety (Griffiths et al., 2011). In order to determine biomass concentration, the optical density value at either 680 or 750 nm must be measured, along with particle size, shape, and refractive index effect optical density. Therefore, there is less congruity between the results of optical density and dry weight biomass.
A HACH DR 5000 Spectrophotometer was used to track the daily algae growth in terms of optical density. Optical density was measured daily at a wavelength of 750 nm, which is the range where chlorophyll is a dominant pigment. 3.6.2 Ion removal
The other central objective of this experiment is to evaluate whether microalgae can contribute significantly to the removal of environmentally hazardous ions from desalination concentrate. There are two methods to measure ion removal: measuring ions accumulated by algae, and measuring the decrease of ions in the medium. The second method was used in this experiment to analyze ion removal.
For this purpose, TDS, EC, and TN were measured daily. The ion content of concentrate was determined from the first and final days.
3.6.2.1 Salinity (TDS and EC)
TDS and EC were measured a using sensION5 Conductivity Meter. 3.6.2.2 Total Nitrogen analysis
Combining the SHIMADZO TNM-1 with a SHIMADZO TOC-VCS/CP analyzer creates a total organic carbon (TOC)/ total nitrogen (TN) simultaneous analysis system which was used for TN analysis in this experiment. The analysis was conducted at the Freeport-McMoRan Water Quality Lab at New Mexico State University.
3.6.2.3 Ion content analysis
Ion content of the concentrate medium was analyzed using a DIONEX ICS-3000 Ion Chromatography System.
2011-2015 FINAL REPORT - COOPERATIVE AGREEMENT NO. R10AC80283 Page 932

29
Chapter 4 Results and Discussion
4.1 Introduction
A full factorial design experiment with CRD arrangement was conducted for two reasons: (1) to evaluate the growth of the two strains of microalgae (factor A), Nannochloropsis oculata (UTEX- LB 2164) and Dunaliella tertiolecta (UTEX-LB 999), in a concentrate from water desalination units; and (2) to investigate ion removal from concentrate by these two strains. Four different media (factor B) (concentrate, f/2, a 50:50 combination of f/2 and concentrate, and deionized water) were used to compare microalgae growth. For this purpose, two one-way experiments were run simultaneously to form a full factorial experiment each for ten days. This chapter presents the results obtained from these experiments.
4.2 Experiment 1
In this part of the experiment, Dunaliella tertiolecta (UTEX-LB 999) was used in order to investigate the microalgae growth in a concentrate medium with TDS of 6240 ppm. The concentrate solution was obtained from the concentrate disposal of the RO desalination pilot plant in BGNDRF, Alamogordo, New Mexico. Lab scale photobioreactors were used for conducting this experiment. Besides concentrate, three other media were used (f/2, a 50:50 combination of f/2 and concentrate, and deionized water). The deionized water medium was incorporated into this experiment as a control due to the fact that this medium contains no nutrients. Table 4.1 shows the specifications of the media used.
For each combination of microalgae and medium, four replications were considered. Thus, sixteen runs for a period of 10 days were conducted for the required data. Optical density at 750 nm, pH, TDS, electroconductivity and total nitrogen were monitored daily; in addition, the dry biomass and ion content of the concentrate medium were measured on first day and last day. All factors that might affect the biomass growth were kept as constant as possible in order to clarify the effects of algae type and medium on biomass growth.
4.2.1 Algae growth
The initial dry weight biomass was determined by taking three 50 ml samples at three different levels of the glass carboy in which the inoculum algae was located. Each photobioreactor started with 0.052 g of initial biomass. After ten days, the final biomass of all samples was measured. By using the following formula, the percent increase in biomass was calculated for all samples.
2011-2015 FINAL REPORT - COOPERATIVE AGREEMENT NO. R10AC80283 Page 933

30
100 %
Figure 4.1 depicts the effect of medium on percent increase in biomass. The P-value of 0.004 shows a significant difference in biomass production in different media compared with DI water as control.
Concentrate was the medium that maximized biomass production, and there were no significant differences in percent increase of biomass among other media that did not contain concentrate. This analysis reveals that the high salinity and nutrients available in concentrate provided a better environment for this strain of marine algae to grow than other media. High concentrations of nitrate, phosphate, and NaCl could be possible reasons behind this increased growth.
Compared to f/2 medium, the 50:50 medium demonstrated better performance because it contained the nutrients of both f/2 and the concentrate. This result shows that nutrients available in concentrate can still contribute to algae growth when the nutrients in f/2 are diminishing. Furthermore, there was no significant difference between the growths of the biomass in the f/2 medium when compared with the deionized water medium. This result is because the inoculum algae added to the culture medium were pre-cultivated in f/2 (refer to 3.2); therefore, 20% of deionized water medium was actually f/2. The reason that the percent increase in biomass was used as a measure instead of the actual weight of the biomass increase is that these experimental results were intended to be compared with the results of the second experiment (experiment 2). Since the initial biomasses for these strains of algae were not same, the percent increase is a better criterion for comparison.
Figure 4.2 displays the growth curve for four different media during the ten days of experimentation.
The results obtained from optical density at 750 nm confirm the results obtained from dry weight biomass.
Similar to the results gained from the dry weight test, algae grown in concentrate consistently had the highest optical density from day five to day ten. Aside from concentrate, 50:50 and f/2 media had the next highest optical densities, respectively.
During the first three days, the growth trends in all media were slow and almost the same because the algae cultures are in their lag phases. On the fourth day, the cultures began their exponential phases, which appear to be when the differences in media manifest themselves. The rates of the increase in concentrate and 50:50 media were significantly higher than those in f/2 medium during the exponential phase due to the high concentrations of nitrate and phosphate available in concentrate. Dunaliella tertiolecta can accumulate 70% lipid content when salinity is high; however, their high salinity in the initial phase inhibits the cell growth (Takagi, 2006).
On the eighth day, the algae growth in the concentrate medium slowed, mostly because of a depletion of nutrients. The role of light was also important in this stage because the culture becomes very dense and turbid, inhibiting light penetration, especially in the middle of the reactor. However, since the algae cultivated in f/2 and deionized water did not become overly dense, light
2011-2015 FINAL REPORT - COOPERATIVE AGREEMENT NO. R10AC80283 Page 934

31
penetration was better than in the other media. Hence, they did not exhibit the same inhibitory factor for photosynthesis that the strain in the concentrate medium experienced. It is anticipated that continuation of the experiment for few more days would have resulted in a similar outcome for the cultures cultivated in f/2 and deionized water, which would eventually collapse due to their photosynthetic inhibitions. Based on the results shown in Fig 4.2, the best day for harvesting Dunaliella tertiolecta from concentrate is either the ninth or tenth day.
4.2.2 Ion removal
In the preliminary phases of growth, the intracellular substance content—such as lipids and proteins—is relatively low because nutrients are used for biomass production. Once the culture reaches the stable phase, the microalgae begin to accumulate lipids. Furthermore, higher biomass production in a culture results in additional ion reduction. Since removing ions from concentrate for environmental reasons is an important goal of algal concentration processing, TDS, EC, and TN were measured daily; moreover, the ion content of concentrate was determined in the first and final days.
4.3 shows TN removal trending over the period of the experiment, revealing that Dunaliella tertiolecta can significantly reduce the nitrogen from concentrate. An exponential regression fit was obtained with an R-squared value of 0.99 (figure 4.3).
The nitrogen removal yield (YN) was 0.93, which is considerable, and the volumetric rate of N removal (QN) was 1.99 mg.dm-3.day-1.
Nitrogen removal is biotic. Since nitrogen is needed for biomass growth, a high nitrogen concentration is important to support the reproduction of microalgae cells. However, the nitrogen concentration is eventually depleted and remains at a level that only supports the synthesis of enzymes and critical cell formation. Under this condition, available carbons are converted into lipids rather than proteins, which slows algal growth because proteins are necessary for continued algal growth (Suali and Sarbatly, 2012). This accentuates the importance of nitrogen removal.
An exponential regression fit was obtained with an R-squared value of 97.8% between total nitrogen and optical density at 750 nm as shown in figure 4.4.
Figure 4.4 shows that a high concentration of nitrogen resulted in a high rate of growth, and shows that when the nitrogen concentration was reduced, the growth rate was also reduced. Under nitrogen deficiency, cells accumulate lipids instead of reproducing.
In addition to TN, the amount of some ions in the concentrate medium was measured in the first and final days. Only ions that are important for algae growth were measured (refer to chapter 2). Table 4.2 and table 4.3 display the concentration of these ions.
The contribution of Dunaliella tertiolecta to fluoride, nitrate, and phosphate removal was significant. Phosphorous is removed by two mechanisms: biotic removal, and abiotic removal by chemical perception by forming complex with metal ions. Therefore, phosphorous must be provided in excess because not
2011-2015 FINAL REPORT - COOPERATIVE AGREEMENT NO. R10AC80283 Page 935

32
all phosphorous is bioavailable. One of the factors that can affect nitrate removal yield is the nitrate level in the medium. Lower nitrate concentration results in higher removal. Overall, TDS of concentrate decreased from 6290 to 5802.5 mg/l and electroconductivity was reduced from 10,180 to 9455 µS/cm.
4.3 Experiment 2
In this portion of the experimental process, Nannochloropsis oculata (UTEX- LB 2164) was used. All the conditions were similar to those in Experiment 1. Sixteen runs were performed in order to obtain the data required for assessing the various combinations of media.
4.3.1 Algae growth
The initial biomass was 0.043 g. Figure 4.5 shows the effect of the medium on percent increase in biomass. The P-value of less than 0.0001 shows a significant difference in biomass production in different media.
Again, concentrate was the medium that produced the greatest amount of biomass, and the 50:50 medium produced a larger biomass than the f/2 medium. However, the deionized water and f/2 media showed little difference statistically. Again, high concentrations of some ions – such as nitrate, phosphate and NaCl – were an important parameter causing this difference.
Figure 4.6 depicts the growth curve for the different media in this experiment.
The results obtained from optical density at 750 nm are similar to the results from dry biomass measurement. The vertex point for max biomass happened in the seventh day of the experiment for f/2 and deionized water, indicating that the nutrients in f/2 were diminishing; consequently, growth of algae was decreasing. Lack of nutrients in f/2 and deionized water media caused the stationary phase to be almost one day, which, compared to the other media, was considerably shorter. Thus, the high salinity of concentrate is one of the advantages that can help continuous algae growth. This high salinity of concentrate further explains why the 50:50 medium was still growing after the seventh day.
4.3.2 Ion removal
Figure 4.7 shows TN removal trends over time, which clearly demonstrates that Nannochloropsis oculata can meaningfully lessen the amount of nitrogen in concentrate in a similar fashion to the other strain of algae used in this experiment.
An exponential regression fit was obtained with an R-squared value of 0.97. The equation is shown in figure 4.9. The ANOVA table (table 4.5) verifies the accuracy of the model (P-value < 0.00001).
The nitrogen removal yield (YN) was 0.91 and volumetric rate of nitrogen removal (QN) was 1.81 mg.dm-3.day-1.
2011-2015 FINAL REPORT - COOPERATIVE AGREEMENT NO. R10AC80283 Page 936

33
An exponential regression fit for total nitrogen and optical density at 750 nm has an R-squared value of 99% (P-value < 0.00001) (figure 4.8).
Table 4.6 and table 4.7 show anion and cation concentrations in the samples. Similar to Dunaliella tertiolecta, Nannochloropsis oculata removed fluoride, nitrate, and phosphate significantly. Since the experiment was designed to avoid cross contamination and because the experiment used pure algae, ion removal was performed by the algae and not any other organisms. TDS of the concentrate decreased from 6270 to 4930 mg/l while EC reduced from 10200 to 8170 µS/cm.
4.4 Growth comparison
The full factorial experiment (factor 1: algae, factor 2: medium), with two levels for factor 1: algae, and four levels for factor 2: medium, considered the interaction of these two factors. Analyzing algae type, medium, and the interaction between the algae and the medium indicated some effects on final biomass production.
Figure 4.9 shows there is no significant difference between levels of factor 1: algae in biomass increase in Nannochloropsis oculata (UTEX- LB 2164) and Dunaliella tertiolecta (UTEX-LB 999) (P-value = 0.35).
Results show significant variations in dry biomass produced by the four media (P-value < 0.0001). Figure 4.10 illustrates two observations: (1) a significant difference in dry biomass production was observed when concentrate was used, and (2) there was a significant biomass increase in 50:50 medium when compared to f/2. Deionized water and f/2 were essentially the same in terms of percentage increase in biomass because the inoculum of algae used was pre-cultured in f/2; as a result, it contained practically all the main nutrients of f/2.
There were no significant differences among interactions (P-value = 0.2470). Figure 4.11 demonstrates that the interaction of the concentrate medium with Dunaliella tertiolecta (UTEX-LB 999) produced the highest dry biomass. The interaction of concentrate medium with Nannochloropsis oculata (UTEX- LB 2164) was substantial as well. Interactions of 50:50 medium with both strains of algae yielded considerable amounts of dry biomass, but these amounts were significantly less than the biomass produced in the concentrate medium. Since concentrate alone is less expensive than f/2, concentrate is a better choice than both the 50:50 and f/2 media.
Based on results obtained from dry weight biomass, two kinetic parameters are calculated. Table 4.6 shows volumetric growth rate and specific growth rate, calculated for eight combinations of algae and medium. Specific growth rate could be obtained by using following equation:
µ = Ln (mt / m0) / t (4-1) Volumetric growth rate could be obtained from following equation: Qx= Ct-C0/t (4-2)
2011-2015 FINAL REPORT - COOPERATIVE AGREEMENT NO. R10AC80283 Page 937

34
Based on specific growth rate, the cell concentration of Dunaliella tertiolecta in concentrate during the log phase is calculated by the following equation, where C is the cell concentration at any time t (gr/ml):
C=1.3*10-4e0.19t (4-3) 1.3*10-4 is the initial cell concentration (C0) and 0.19 is the specific
growth rate (µ) of Dunaliella in concentrate medium. The equation for Nannochloropsis oculata cell concentration is: C=1.075*10-4e0.18t (4-4) For comparison, the growth curve of two cultures of algae in concentrate
medium is shown in figure 4.12. The results indicate that in concentrate medium, Dunaliella tertiolecta had
a longer lag phase; however, its rate of the growth in the lag phase was higher than that of Nannochloropsis oculata.
4.5 Ion removal comparison
For better comparison of the two strains’ contributions to concentrate treatment, the results of TN removal and ion removal are shown in table 4.9 and table 4.10, respectively.
Y and Q are removal yield and volumetric removal rate, respectively, which can be obtained from following equations:
Y= C0-Ct/C0 (4-5) Q= C0-Ct/t (4-6) The elementary composition and C: P: N ratio of microalgal cells usually
varies with the strain type; therefore, the absorptive capability of nitrogen and phosphorous may be different for different species of microalgae. Molecular ratios of carbon, nitrogen, and phosphorus in marine algae, usually C: N: P = 106:16:1, allow them to grow quickly and uptake the nutrients available in waste water and salty water. This result from research shows a similar conclusion when the concentrate was used in this experiment. This uptake can occur especially quickly in water bodies with high concentrations of N and P (Lundquist, 2008).
Growth rates of microalgae can also be based on the source of nitrogen present in the body of water. For instance, NH4
+ can influence growth rate more than urea and nitrate. However, NO3
- can be removed faster than NH4+ and urea.
Since the concentrate used in this experiment did not have NH4+ available, the
growth was not as fast as when it is available. Since the main source of the nitrogen in this experiment was nitrate, the removal yield was high by both strains of algae, as illustrated in table 4.9.
The previous two tables and figure 4.13 reveal that there was no meaningful difference between the two strains of algae for nitrogen and ion removal in terms of statistics.
Figure 4.14 and figure 4.15 show that the TDS and electroconductivity decreased in the concentrate medium during the experiment period as a result of the algae species Nannochloropsis oculata and Dunaliella tertiolecta.
2011-2015 FINAL REPORT - COOPERATIVE AGREEMENT NO. R10AC80283 Page 938

35
The presence of ions such as potassium, chloride, sodium, calcium, and sulphate caused high TDS (Bishnoi & Arora, 2007). Table 4.8 shows that these ions were not removed significantly, indicating that TDS was not decreased considerably. The same scenario exists for EC because TDS and EC have the following relationship:
TDS = keEC Where ke is a correlation factor varying between 0.55 and 0.8 based on the temperature and water type.
2011-2015 FINAL REPORT - COOPERATIVE AGREEMENT NO. R10AC80283 Page 939
36
Chapter 5 Conclusion
5.1 Conclusion
A full factorial design experiment was developed to investigate algal growth in the desalination concentrate from water desalination units in lab scale photobioreactors. Simultaneously, ion removal from concentrate by algal cultures was examined.
Based on research findings, an optimal match between algae and medium was identified. These findings indicated that, among all the investigated media, a concentrate medium maximized the percentage increase of dry weight biomass better than an f/2 medium, which is a conventional and accepted medium for growing marine algae. The results of optical density at 750 nm conveyed the same result as well.
There was no significant difference in biomass production and ion removal from concentrate between Nannochloropsis oculata (UTEX- LB 2164) and Dunaliella tertiolecta (UTEX-LB 999). Both strains are acceptable for the purpose of biomass production and ion removal; however, the combination of Dunaliella tertiolecta and concentrate medium yielded the highest biomass production.
Since temperature, light cycle, light intensity, air flow, and other conditions were controlled among the four growth media, it can be reasonably concluded that the differences in results were due to the growth media. The variables under study in this experiment, algae and medium, had different effects on the growth rates and biomass production. Based on statistical analysis, there is sufficient evidence to indicate significant increases in biomass occurred due to the selection of specific combinations of medium and algae.
The contribution of algal cultures in the removal of some ions from concentrate was not significant other than for specific ions, such as nitrate, phosphate and fluoride; however, TN decreased considerably during the experiment. TDS did not change considerably because the ions responsible for high TDS were not removed noticeably.
Based on the findings, it can be concluded that the cultivation of marine algae strains in the concentrate disposal of water desalination units is a unique approach that combines an increased efficiency in the removal of pollutants from concentrate with the cultivation of algal biomass for biofuel feedstock production. The results of this research identify a potential to reduce the cost of desalination when biofuel production is included, and can bring about environmentally-friendly benefits, such as CO2 mitigation and concentrate disposal treatment.
2011-2015 FINAL REPORT - COOPERATIVE AGREEMENT NO. R10AC80283 Page 940

37
5.2 Recommendations
The next step to continue this study could be to investigate the effect of concentrate on the growth of other strains of algae that have the capability to survive in saline environments. Increasing the amount of inoculum of algae would lead to the acquisition of more reliable results because of the relationship between initial biomass and growth rates. Also, using immobilized algae instead of suspended algae would encourage better ion removal because immobilized algae would increase the effective surface area for reaction. To ensure that all ion removal is done by algae and not by other organisms that may have contaminated the experiment, it would also be a good idea to: 1) measure the nutrient uptake by algae, 2) measure ion removal from the medium, and 3) correlate these two results to find out how much of this removal is done by algae. Also, examining different combinations of f/2 and concentrate, such as 25:75 and 75:25, might yield additional interesting results.
Another option for future studies could be analyzing the economic feasibility of the complete process of biofuel generation and desalination concentrate treatment process (figure 5.1).
2011-2015 FINAL REPORT - COOPERATIVE AGREEMENT NO. R10AC80283 Page 941

38
References
Ackman RG, Tocher CS, McLachlan J (1968). Marine phytoplankton fatty acid. Journal of the Fisheries Research Board of Canada. 25: 1603-1620.
Adey WH, Loveland K (2007). Dynamic aquaria: building living ecosystems. 3rd Edn, Academic Press, New York, USA.
Akkerman, I., Janssen, M., Rocha, J., & Wijffels, R. H. (2002). Photobiological hydrogen production: Photochemical efficiency and bioreactor design. In International Journal of Hydrogen Energy. 27, 1195–1208.
Amin, S. (2009). Review on biofuel oil and gas production processes from microalgae. Energy Conversion and Management. 50(7). 1834–1840.
Antoni, D., Zverlov, V. V, & Schwarz, W. H. (2007). Biofuels from microbes. Applied Microbiology and Biotechnology, 77, 23–35.
Antoni, D.; Zverlov, V.V.; Schwarz, H. (2007) Biofuels from Microbes. Applied Microbiology and Biotechnology. 77. 23-35.
Apt K., E., Behrens, P., W. (1999) Commercial development in microalgal biotechnology. Journal of Phycology. 35. 215-226.
Armaroli, N., & Balzani, V. (2006). The future of energy supply: challenges and opportunities. Angew. Chem., Int. Ed., 46, 52–66.
Awasthi, M., & Singh, R. K. (2011). Development of algae for the production of bioethanol, biomethane, biohydrogen and biodiesel, 14–23.
Barbosa, M. (2003). Microalgal photobioreactors : - up and optimisation Scale. Wageningen Food and Bioprocess Engineering Group.1–166.
Barnwal, B. K., & Sharma, M. P. (2005). Prospects of biodiesel production from vegetable oils in India. Renewable and Sustainable Energy Reviews, 9, 363-378
Becker EW. (1994) In: Baddiley J et al., editors. Microalgae: biotechnology and microbiology. Cambridge (New York): Cambridge Univ. Press.
Belarbi, E. H., Molina, E., & Chisti, Y. (2000). A process for high yield and scaleable recovery of high purity eicosapentaenoic acid esters from microalgae and fish oil. Enzyme and Microbial Technology, 26, 516–529.
2011-2015 FINAL REPORT - COOPERATIVE AGREEMENT NO. R10AC80283 Page 942

39
Belessiotis, V., & Delyannis, E. (2001). Water shortage and renewable energies (RE) desalination - Possible technological applications. Desalination, 139, 133–138. Benemann, J. R., & Oswald, W. J. (1996). Systems and Economic Analysis of Microalgae Ponds for Conversion of CO2 to Biomass. Final Report to the Department of Energy, Pittsburgh Energy Technology Center. 260.
Bigogno, C., Khozin-Goldberg, I., Boussiba, S., Vonshak, A., & Cohen, Z. (2002). Lipid and fatty acid composition of the green oleaginous alga Parietochloris incisa, the richest plant source of arachidonic acid. Phytochemistry, 60, 497–503.
Bilanovic D, Shelef G, Sukenik A (1988). Flocculation of microalgae with cationic polymers: effects of medium salinity. Biomass 17. 65-76.
Biofuels Media Ltd (2007) Bringing the biofuel markets together. In: Algae: feedstock of the future. http://www.biofuelsmedia.com/press. Accessed 8 Sep 2008
Bishnoi, M., & Arora, S. (2007) Potable groundwater quality in some villages of Haryana. India: focus on fluoride. Journal of Environmental Biology / Academy of Environmental Biology, India. 28(2), 291–4.
Borowitzka M.A. (1999) Pharmaceuticals and agrochemicals from microalgae. In: Cohen Z, editor. Chemicals from microalgae. Taylor & Francis. 313–52.
Briens, C., Piskorz, J., & Berruti, F. (2008). Biomass Valorization for Fuel and Chemicals Production -- A Review. International Journal of Chemical Reactor Engineering. 6: 1-49.
Brown, M. R., Jeffrey, S. W., Volkman, J. K., & Dunstan, G. A. (1997). Nutritional properties of microalgae for mariculture. In Aquaculture.151, 315–331.
Camacho Rubio, F., Fernandez, F., Perez, J., Camacho, F., & Grima, E. (1999). Prediction of dissolved oxygen and carbon dioxide concentration profiles in tubular photobioreactors for microalgal culture. Biotechnology and Bioengineering, 62, 71–86.
Camacho, F. G., Rodríguez, J. G., Mirón, A. S., García, M. C. C., Belarbi, E. H., Chisti, Y., & Grima, E. M. (2007). Biotechnological significance of toxic marine dinoflagellates. Biotechnology Advances. 25.176–94. Campbell CJ (1997) the coming oil crisis. Multi-science Publishing Company and petroconsultants S.A, Essex, England
2011-2015 FINAL REPORT - COOPERATIVE AGREEMENT NO. R10AC80283 Page 943
40
Campbell, M. N. (2008). Biodiesel : Algae as a Renewable Source for Liquid Fuel. Guelph Engineering Journal, 1, 2–7.
Canakci, M., & Gerpen, J. Van. (2001). Biodiesel production from oils and fats with high free fatty acids. Transactions of the ASAE, 44, 1429–1436.
Canakci, M., & Sanli, H. (2008). Biodiesel production from various feedstocks and their effects on the fuel properties. Journal of Industrial Microbiology & Biotechnology, 35, 431–441.
Carvalho A.P., Meireles L.A., Malcata F.X. (2006) Microalgal reactors: a review of enclosed system designs and performances. Biotechnol Prog, 22.1490–506.
Chisti, Y. (2008). Biodiesel from microalgae beats bioethanol. Trends in Biotechnology.26 (3), 126-31.
Chynoweth DP, Turick CE, Owens JM, Jerger DE, Peck MW (1993). Biochemical methane potential of biomass and waste feedstocks. Biomass and Bioenergy 5: 95-111.
Chynoweth DP, Turick CE, Owens JM, Jerger DE, Peck MW (1993). Biochemical methane potential of biomass and waste feedstocks. Biomass and Bioenergy 5: 95-111.
Conover SAM (1975). Partitioning of Nitrogen and Carbon in Cultures of the Marin Diatom Thalassiosira Fluviatilis Supplied with Nitrate, Ammonium or Urea. Mar Biol 32: 231.
Cravotto G, Boffa L, Mantegna S, Perego P, Avogadro M, Cintas P. (2008) Improved extraction of vegetable oils under high-intensity ultrasound and/or microwaves. Ultrasonics Sonochemistry. 15(5).898–902.
Crump, J. A., & Mintz, E. D. (2010). Global trends in typhoid and paratyphoid Fever. Clinical Infectious Diseases : An Official Publication of the Infectious Diseases Society of America, 50, 241–246.
Crutzen, P. J., Mosier, A. R., Smith, K. A., & Winiwarter, W. (2007). N2O release from agro-biofuel production negates global warming reduction by replacing fossil fuels. Atmospheric Chemistry and Physics Discussions. 7, 11191-11205.
Da Silva, T. L., Reis, A., Medeiros, R., Oliveira, A. C., & Gouveia, L. (2009). Oil production towards biofuel from autotrophic microalgae semicontinuous
2011-2015 FINAL REPORT - COOPERATIVE AGREEMENT NO. R10AC80283 Page 944

41
cultivations monitorized by flow cytometry. Applied Biochemistry and Biotechnology, 159, 568–578.
Demirbas A. (2008) Biofuels sources, biofuel policy, biofuel economy and global biofuel projections. Energy Convers Manage (49:2) 106–16.
Demirbas A. (2009) Future energy sources: part I. Future Energy Sources ,1,1–95.
Demirbas AH. (2009) Inexpensive oil and fats feedstocks for production of biodiesel. Energy Education Science Technology, 23, 1–13.
Demirbas, A. H.; Demirbas, I. (2007) Importance of Rural Bioenergy for Developing Countries. Energy Conversion and Management, 48(8), 2386-2398.
Demirbas, A., & Fatih Demirbas, M. (2011). Importance of algae oil as a source of biodiesel. Energy Conversion and Management. 52(1).163–170.
Dinh, L. T. T., Dinh, L. T. T., Guo, Y. Y., Guo, Y. Y., Mannan, M. S., & Mannan, M. S. (2009). Sustainability Evaluation of Biodiesel Production Using Multicriteria Decision-Making. Environmental Progress & Sustainable Energy, 28, 38–46.
Dunahay, T. G., Jarvis, E. E., Dais, S. S., & Roessler, P. G. (1996). Manipulation of microalgal lipid production using genetic engineering. Applied Biochemistry and Biotechnology, 57–58, 223–31.
Duranceau, S. J. (2001). Reverse Osmosis and Nanofiltration Technology: Inorganic, Softening and Organic Control. (paper presented at the American Membrane Technology Association’s Annual Symposium, Isle of Palms, S.C., August 5-8, 2001).
Eriksen, N. T. (2008). The technology of microalgal culturing. Biotechnology Letters, 30, 1525–1536.
Fargione, J., Hill, J., Tilman, D., Polasky, S., & Hawthorne, P. (2008). Land clearing and the biofuel carbon debt. Science (New York, N.Y.), 319, 1235–1238.
Felizardo, P., Neiva Correia, M. J., Raposo, I., Mendes, J. F., Berkemeier, R., & Bordado, J. M. (2006). Production of biodiesel from waste frying oils. Waste Management, 26, 487–494. Foster, R., M. Ghassemi, and A. Cota, (2009). Solar Energy: Renewable Energy and the Environment. CRC Press: New York.
2011-2015 FINAL REPORT - COOPERATIVE AGREEMENT NO. R10AC80283 Page 945

42
Fukuda, H., Kondo, A., & Noda, H. (2001). Biodiesel fuel production by transesterification of oils. Journal of Bioscience and Bioengineering. 92. 405-416.
Gaffron, H., & Rubin, J. (1942). Fermentative and photochemical production of hydrogen in algae. The Journal of General Physiology, 26, 219–240.
Gavrilescu, M., & Chisti, Y. (2005). Biotechnology - A sustainable alternative for chemical industry. Biotechnology Advances, 23, 471–99.
Ghirardi, M. L., Zhang, L., Lee, J. W., Flynn, T., Seibert, M., Greenbaum, E., & Melis, A. (2000). Microalgae: A green source of renewable H2. Trends in Biotechnology, 18, 506–11.
Goudriaan, F., Van De Beld, B., Boerefijn, F. R., Bos, G. M., Naber, J. E., Van Der Wal, S., & Zeevalkink, J. A. (2000). Thermal efficiency of the HTU® process for biomass liquefaction. Progress in Thermochemical Biomass Conversion, 1325, 1312–1325.
Gouveia, L., & Oliveira, A. C. (2009). Microalgae as a raw material for biofuels production. Journal of Industrial Microbiology & Biotechnology. 36(2). 269–74.
Gouveia, L., & Oliveira, A. C. (2009). Microalgae as a raw material for biofuels production. Journal of Industrial Microbiology & Biotechnology, 36, 269–274.
Griffiths, M.J., Garcin, C., van Hille, R.P., Harrison, S.T.L. (2011) Interference by pigment in the estimation of microalgal biomass concentration by optical density, Journal of Microbiological Methods, 85, 119–123.
Grobbelaar, J. U. (2004). Algal Nutrition. Handbook of microalgal culture: biotechnology and applied phycology, 97–115.
Grobbelaar, J. U. (2009). Factors governing algal growth in photobioreactors: the “open” versus “closed” debate. Journal of Applied Phycology, 21, 489-492.
Guillard, R. R. L. (1975). Culture of Phytoplankton for Feeding Marine Invertebrates. In Culture of Marine Invertebrate Animals. 29–60.
Hacisalihoglu B, Kirtay E, Demirbas A. (2009) Historical role of Turkey in petroleum between Caspian Sea Basin and the Middle East. Soc Polit Econ Cultural Res ,1, 1–25.
2011-2015 FINAL REPORT - COOPERATIVE AGREEMENT NO. R10AC80283 Page 946

43
Harris EH (1989). The Chlamydomonas sourcebook: a comprehensive guide to biology and laboratory use. Academic Press, San Diego, USA.
Heasman, M., Diemar, J., O’connor, W., Sushames, T., & Foulkes, L. (2000). Development of extended shelf-life microalgae concentrate diets harvested by centrifugation for bivalve molluscs ± a summary. Aquaculture Research, 31, 637–659.
Hodaifa, G., Martínez, M. E., & Sánchez, S. (2008). Use of industrial wastewater from olive-oil extraction for biomass production of Scenedesmus obliquus. Bioresource Technology, 99, 1111–1117.
International Energy Agency (2007) World Energy Outlook 2007. China and India Insights.
Kadam, K. L. (1997). Power plant flue gas as a source of CO2 for microalgae cultivation: Economic impact of different process options. Energy Conversion and Management. 38. 505–10.
Kaewpintong, K., Shotipruk, A., Powtongsook, S., & Pavasant, P. (2007). Photoautotrophic high-density cultivation of vegetative cells of Haematococcus pluvialis in airlift bioreactor. Bioresource Technology, 98, 288–295.
Karen, P. F., and Marven, W. F. (2007) Observation on diversity an d ecology of freshwater Nannochloropsis(Eustigmatophyceae), with description of new taxa. Protist, 158, 325-336.
Kim, W., Park, J., Gim, G., Jeong, S.-H., Kang, C., Kim, D.-J., and Kim, S.(2012) Optimization of culture conditions and comparison of biomass productivity of three green algae. Bioprocess and Biosystems Engineering.35(1-2), 19-27.
Klass. D.L. (1998) Biomass for Renewable Energy, Fuels, and Chemicals; Academic Press: San Diego, USA, 651.
Klass. D.L. (1998) Biomass for Renewable Energy, Fuels, and Chemicals; Academic Press: San Diego, USA, 651.
Klass. D.L. (1998)Biomass for Renewable Energy, Fuels, and Chemicals; Academic Press: San Diego,USA, 651.
Kong, Q.; Yu, F.; Chen, P.; Ruan. R. High Oil Content Microalgae Selection for Biodiesel Production. (2007) ASABE Annual International Meeting, Minneapolis, Minnesota, USA, June 17-20; American Society
2011-2015 FINAL REPORT - COOPERATIVE AGREEMENT NO. R10AC80283 Page 947

44
of Agricultural and Biological Engineers: St. Joseph, Michigan, USA, 2007; 077034.
Koonin, S. E. (2006). Getting serious about biofuels. Science (New York, N.Y.), 311, 435.
Kulkarni, M. G., & Dalai, A. K. (2006). Waste Cooking Oil An Economical Source for Biodiesel: A Review. Ind. Eng. Chem. Res., 45, 2901–2913.
Lee, Y.K. & Shen, H. (2004) Basic culturing techniques. Handbook of Microalgal Culture. Biotechnological and Applied phycology (ed. A. Richmond). 40-56. Black-well Publishing, Oxford
Leitner G. F. (1998) "Is there a water crisis?," International Desalination and Water Reuse Quarterly, vol. 7, p. 10, 1998.
Li Y, Horsman M, Wu N, Lan CQ, Dubois-Calero N. Biofuels from microalgae. Biotechnology Progress 2008, 24(4), 815–20.
Lívanský, K., Doucha, J., Straka, F. (2005). Utilization of flue gas for cultivation of microalgae Chlorella sp.) In an outdoor open thin-layer photobioreactor. Journal of Applied Phycology. 17. 403-412.
Lundquist T.J. (2008) Production of algae in conjunction with wastewater treatment. In: NREL—AFOSR workshop on algal oil for jet fuel production.
Mallick, N. (2002). Biotechnological potential of immobilized algae for wastewater N, P and metal removal: a review. Biometals : An International Journal on the Role of Metal Ions in Biology, Biochemistry, and Medicine, 15, 377–390.
Mata, T. M., Martins, A. a., & Caetano, N. S. (2010). Microalgae for biodiesel production and other applications: A review. Renewable and Sustainable Energy Reviews, 14(1), 217–232.
McKendry P. (2003) Energy production from biomass (part 2): conversion technologies. Biores Technol. 83:47–54.
McKendry P. Energy production from biomass (part 2): conversion technologies. Biores Technol 2003, 83, 47–54.
McKendry P. (2003) Energy production from biomass (part 2): conversion technologies. Biores Technol .83, 47–54.
MELIS, A. (2002). Green alga hydrogen production: progress, challenges and prospects. International Journal of Hydrogen Energy. 27.1217–28.
2011-2015 FINAL REPORT - COOPERATIVE AGREEMENT NO. R10AC80283 Page 948

45
Meng, X., Yang, J., Xu, X., Zhang, L., Nie, Q., & Xian, M. (2009). Biodiesel production from oleaginous microorganisms. Renewable Energy. 34, 1-5
Metting, F. B. (1996). Biodiversity and application of microalgae. Journal of Industrial Microbiology & Biotechnology. 17.477–89.
Miao, X., Wu, Q., & Yang, C. (2004). Fast pyrolysis of microalgae to produce renewable fuels. Journal of Analytical and Applied Pyrolysis, 71, 855–863.
Mickley, M.C. 2001. Major Ion Toxicity in Membrane Concentrates. AWWA Research Foundation Project # 290.
Miller, J. (2003). Review of water resources and desalination technologies. Sandia National Laboratories Report, SAND2003-0800, 3–54.
Minowa, T., Yokoyama, S., Kishimoto, M., & Okakura, T. (1995). Oil production from algal cells of Dunaliella tertiolecta by direct thermochemical liquefaction. Fuel, 74,1731–8.
Moheimani, N. R., & Borowitzka, P. M. (2005). The culture of Coccolithophorid algae for carbon dioxide bioremediation. Algal Biotechnology Laboratory. Retrieved from http://wwwlib.murdoch.edu.au/adt/browse/view/adt-MU20050901.140745
Molina Grima E. (1999) Microalgae, mass culture methods. In: Flickinger MC, Drew SW, editors. Encyclopedia of bioprocess technology: fermentation, biocatalysis and bioseparation, vol. 3.Wiley, 1753–69.
Molina Grima E. Microalgae, mass culture methods. In: Flickinger MC, Drew SW, editors. Encyclopedia of bioprocess technology: fermentation, biocatalysis and bioseparation, vol. 3.Wiley; 1999. p. 1753–69.
Molina Grima, E., Belarbi, E. H., Acién Fernández, F. G., Robles Medina, A., & Chisti, Y. (2003). Recovery of microalgal biomass and metabolites: Process options and economics. Biotechnology Advances. 20(7-8).491–515.
Molina, E., Fernández, J., Acién, F. G., & Chisti, Y. (2001). Tubular photobioreactor design for algal cultures. In Journal of Biotechnology. 92, 113–131.
Nagle, N., & Lemke, P. (1990). Production of methyl ester fuel from microalgae. Applied Biochemistry and Biotechnology. 24–5:355–61.
Oilgae Report 2010, Academic Edition, Tamilnadu, India.
2011-2015 FINAL REPORT - COOPERATIVE AGREEMENT NO. R10AC80283 Page 949
46
Oki, T., & Kanae, S. (2006). Global hydrological cycles and world water resources. Science (New York, N.Y.), 313, 1068–1072.
Ono, E., Cuello, J.L. (2004) Design parameters of solar concentrating systems for CO2-mitigating algal photobioreactors. Energy. 29. 1651–1657.
Ormerod WG, Freund P, Smith A, Davison J. (2002) Ocean storage of CO2. IEA greenhouse gas R&D programme. UK: International Energy Agency
Patil, V., Reitan, K.I., Knudsen, G.; Mortensen, L., Kallqvist, T., Olsen, E., Vogt, G., Gislerød, H.R. (2005) Microalgae as Source of Polyunsaturated Fatty Acids for Aquaculture. Current Topics in Plant Biology. 6, 57-65.
Patil, V., Tran, K.-Q., & Giselrød, H. R. (2008). Towards sustainable production of biofuels from microalgae. International Journal of Molecular Sciences. 9(7). 1188–95.
Paul PFM, Wise WS. The principle of gas extraction, mills and boon. London; 1971.
Pauw, N., Morales, J., & Persoone, G. (1984). Mass culture of microalgae in aquaculture systems: Progress and constraints. Hydrobiologia. 116/117. 121–34.
Perlack, R. D., Wright, L. L., Turhollow, A. F., Graham, R. L., Stokes, B. J., & Erbach, D. C. (2005). Biomass as Feedstock for a Bioenergy and Bioproducts Industry : The Technical Feasibility of a Billion-Ton Annual Supply. Agriculture, DOE/GO-102, 78.
Pimentel, D., Berger, B., Filiberto, D., Newton, M., Wolfe, B., Karabinakis, E. Nandagopal, S. (2004). Water Resources: Agricultural and Environmental Issues. 54.909–18.
Pulz, O. (2001). Photobioreactors: production systems for phototrophic microorganisms. Applied Microbiology and Biotechnology, 57, 287–293.
Pulz, O., & Gross, W. (2004). Valuable products from biotechnology of microalgae. Applied Microbiology and Biotechnology, 65, 635–648.
Pushparaj B, Pelosi E, Torzillo G, Materassi R (1993). Microbial biomass recovery using a synthetic cationic polymer. Bioresour Technol 43: 59-62.
Ragauskas, A.J.; Williams, C.K.; Davison, B.H.; Britovsek, G.; Cairney, J.; Eckert, C.A.;
2011-2015 FINAL REPORT - COOPERATIVE AGREEMENT NO. R10AC80283 Page 950
47
Ratledge, C. (1993). Single cell oils--have they a biotechnological future? Trends in Biotechnology, 11, 278–284.
Ratledge, C., & Wynn, J. P. (2002). The biochemistry and molecular biology of lipid accumulation in oleaginous microorganisms. Advances in Applied Microbiology, 51, 1–51.
Raven, R. P. J. M., & Gregersen, K. H. (2007). Biogas plants in Denmark: successes and setbacks. Renewable and Sustainable Energy Reviews. 11.116–32.
Richardson J.W., Outlaw J.L., Allison M. (2009) Economics of micro algae oil. In: 13th ICABR conference on the emerging bio-economy Ravello. 17–20.
Richmond, A. (2004). Handbook of Microalgal Culture: Biotechnology and Applied Phycology. Biotechnology (Vol. 40, p. 577). doi:10.1111/j.1529-8817.2004.40502.x
Richmond, A. (2004). Handbook of Microalgal Culture: Biotechnology and Applied Phycology.
Richmond, A., Hu, Q. (2013) Handbook of Microalgal Culture: Applied Phycology and Biotechnology, Wiley & Sons Publication
Righelato, R., & Spracklen, D. V. (2007). Environment. Carbon mitigation by biofuels or by saving and restoring forests? Science (New York, N.Y.), 317, 902.
Righelato, R., & Spracklen, D. V. (2007). Environment. Carbon mitigation by biofuels or by saving and restoring forests? Science (New York, N.Y.), 317, 902.
Roessler, P. G., Brown, L. M., Dunahay, T. G., Heacox, D. A., Jarvis, E. E., Schneider, J. C., Zeiler, K. G. (1994). Genetic Engineering Approaches for Enhanced Production of Biodiesel Fuel from Microalgae. In Enzymatic Conversion of Biomass for Fuels Production.566. 255–270.
Rosenberg JN, Oyler GA, Wilkinson L, Betenbaugh MJ. (2008) A green light for engineered algae: redirecting metabolism to fuel a biotechnology revolution. Current Opinion in Biotechnology .19(5).430–6.
Sánchez Mirón, A., Cerón García, M. C., Contreras Gómez, A., García Camacho, F., Molina Grima, E., & Chisti, Y. (2003). Shear stress tolerance and biochemical characterization of Phaeodactylum tricornutum in quasi steady-state continuous culture in outdoor photobioreactors. Biochemical Engineering Journal, 16, 287–297.
2011-2015 FINAL REPORT - COOPERATIVE AGREEMENT NO. R10AC80283 Page 951

48
Sánchez Mirón, A., Cerón García, M. C., Contreras Gómez, A., García Camacho, F., Molina Grima, E., & Chisti, Y. (2003). Shear stress tolerance and biochemical characterization of Phaeodactylum tricornutum in quasi steady-state continuous culture in outdoor photobioreactors. Biochemical Engineering Journal, 16, 287–297.
Sánchez Mirón, A., Cerón García, M. C., Contreras Gómez, A., García Camacho, F., Molina Grima, E., & Chisti, Y. (2003). Shear stress tolerance and biochemical characterization of Phaeodactylum tricornutum in quasi steady-state continuous culture in outdoor photobioreactors. Biochemical Engineering Journal, 16, 287–297.
Sawayama, S., Inoue, S., Dote, Y., & Yokoyama, S.-Y. (1995). CO2 fixation and oil production through microalga. Energy Conversion and Management. 36. 729–31.
Sawayama, S., Inoue, S., Dote, Y., & Yokoyama, S.-Y. (1995). CO2 fixation and oil production through microalga. Energy Conversion and Management. 36, 729-731.
Sawayama, S., Inoue, S., Dote, Y., & Yokoyama, S.-Y. (1995). CO2 fixation and oil production through microalga. Energy Conversion and Management. 36. 729–31.
Schenk, P. M., Thomas-Hall, S. R., Stephens, E., Marx, U. C., Mussgnug, J. H., Posten, C., Hankamer, B. (2008). Second Generation Biofuels: High-Efficiency Microalgae for Biodiesel Production. BioEnergy Research. 1.20–43.
Schneider D. (2006) Grow your own? Would the wide spread adoption of biomassderived transportation fuels really help the environment. Am Sci ,94.408–9.
Schuchardt, U., Sercheli, R., & Matheus, R. (1998). Transesterification of Vegetable Oils : a Review General Aspects of Transesterification Transesterification of Vegetable Oils Acid-Catalyzed Processes Base-Catalyzed Processes. J. Braz. Chem. Soc., 9, 199–210.
Sheehan, J., Dunahay, T., Benemann, J., & Roessler, P. (1998). A Look Back at the U.S. Department of Energy’s Aquatic Species Program: Biodiesel from Algae. Renewable Energy, 328, 1–328.
Sheehan, J., Dunahay, T., Benemann, J., & Roessler, P. (1998). A Look Back at the U.S. Department of Energy’s Aquatic Species Program: Biodiesel from Algae. Renewable Energy, 328, 1–328.
2011-2015 FINAL REPORT - COOPERATIVE AGREEMENT NO. R10AC80283 Page 952

49
Shimizu, Y. (1996). Microalgal metabolites: a new perspective. Annual Review of Microbiology, 50, 431–465.
Shimizu, Y. (2003). Microalgal metabolites. Current Opinion in Microbiology. 6. 236-43.
Sobczuk, T. M., Camacho, F. G., Grima, E. M., & Chisti, Y. (2006). Effects of agitation on the microalgae Phaeodactylum tricornutum and Porphyridium cruentum. Bioprocess and Biosystems Engineering, 28, 243–250.
Spolaore, P., Joannis-Cassan, C., Duran, E., & Isambert, A. (2006). Commercial applications of microalgae. Journal of Bioscience and Bioengineering, 101, 87–96.
Srivastava, A.; Prasad, R. (2000) Triglycerides-based Diesel Fuels. Renewable & Sustainable Energy Reviews.4.111-133.
Suali, E., & Sarbatly, R. (2012). Conversion of microalgae to biofuel. Renewable and Sustainable Energy Reviews, 16(6), 4316–4342.
Sukahara, K. T., & Awayama, S. S. (2005). Liquid Fuel Production Using Microalgae. Journal of the Japan Petroleum Institute, 48, 251–259.
Takagi, M., Watanabe, K., Yamaberi, K., & Yoshida, T. (2000). Limited feeding of potassium nitrate for intracellular lipid and triglyceride accumulation of Nannochloris sp. UTEX LB1999. Applied Microbiology and Biotechnology, 54, 112–117.
Terry, K. L., & Raymond, L. P. (1985). System design for the autotrophic production of microalgae. Enzyme and Microbial Technology, 7, 474–487.
Tickell J (2000) From the fryer to the fuel tank. The complete guide to using vegetable oil as an alternative fuel. Tallahasseee, USA.
Tredici M.R., Flickinger, M. C., Drew, S. W., & Wiley, J. (1999). Encyclopedia of Bioprocess Technology : Fermentation , Biocatalysis , and. Builder.1–5, 2844.
Tschaplinski, T. (2006) The Path Forward for Biofuels and Biomaterials. Science. 311. 484-489.
Ugwu, C. U., Aoyagi, H., & Uchiyama, H. (2008). Photobioreactors for mass cultivation of algae. Bioresource Technology. 99.4021–8.
2011-2015 FINAL REPORT - COOPERATIVE AGREEMENT NO. R10AC80283 Page 953

50
Van Gerpen, J. (2005). Biodiesel processing and production. Fuel Processing Technology, 86, 1097–1107.
Wang, B., Li, Y., Wu, N., & Lan, C. Q. (2008). CO(2) bio-mitigation using microalgae. Applied Microbiology and Biotechnology, 79, 707–718.
Weisz, P. B. (2004). Basic Choices and Constraints on Long-Term Energy Supplies. Physics Today, 57, 47.
Williams, J. A. (2002). Keys to bioreactor selections. Chemical Engineering Progress, 98, 34.
Williams, J. A. (2002). Keys to bioreactor selections. Chemical Engineering Progress, 98, 34.
Xu, H., Miao, X., & Wu, Q. (2006). High quality biodiesel production from a microalga Chlorella protothecoides by heterotrophic growth in fermenters. Journal of Biotechnology, 126, 499–507.
Younos, T. (2005). Environmental Issues of Desalination. Journal of Contemporary Water Research & Education, 132, 11–18
Younos, T., Tulou, K. E. (2009). Overview of Desalination Techniques. Journal of Contemporary Water Research & Education, 132(1), 3–10.
Yun, Y. S., Lee, S. B., Park, J. M., Lee, C. I., & Yang, J. W. (1997). Carbon Dioxide Fixation by Algal Cultivation Using Wastewater Nutrients. Journal of Chemical Technology Biotechnology, 69, 451–455.
2011-2015 FINAL REPORT - COOPERATIVE AGREEMENT NO. R10AC80283 Page 954

51
Tables
Chapter 2
TABLE 2.1 Comparison between different sources of biodiesel (Chisti, 2007)
Crop Oil yield (L/ha)
Land area needed (M ha) a
Percent of existing US cropping area a
Corn 172 1540 846 Soybean 446 594 326 Canola 1190 223 122
Jatropha 1892 140 77 Coconut 2689 99 54 Oil palm 5950 45 24
Microalgae b 136,900 2 1.1 Microalgae c 58,700 4.5 2.5
a For meeting 50% of all transport fuel needs of the United
States.
b 70% oil (by wt) in biomass.
c 30% oil (by wt) in biomass.
TABLE 2.2 Percentage of chemical composition of algae on a dry basis (Demirbas and Demirbas, 2011)
Species of sample Proteins Carbohydrates Lipids Nucleic acid
Scenedesmus obliquus 50–56 10–17 12–14 3–6 Scenedesmus quadricauda 47 – 1.9 –
Scenedesmus dimorphus 8–18 21–52 16–40 –
Chlamydomonas rheinhardii 48 17 21 –
Chlorella vulgaris 51–58 12–17 14–22 4–5
Chlorella pyrenoidosa 57 26 2 –
Spirogyra sp. 6–20 33–64 11–21 –
Dunaliella bioculata 49 4 8 –
Dunaliella salina 57 32 6 –
Euglena gracilis 39–61 14–18 14–20 –
Prymnesium parvum 28–45 25–33 22–38 1–2
Tetraselmis maculata 52 15 3 –
2011-2015 FINAL REPORT - COOPERATIVE AGREEMENT NO. R10AC80283 Page 955

52
Porphyridium cruentum 28–39 40–57 9–14 –
Spirulina platensis 46–63 8–14 4–9 2–5
Spirulina maxima 60–71 13–16 6–7 3–4.5
Synechoccus sp. 63 15 11 5
Anabaena cylindrica 43–56 25–30 4–7 –
TABLE 2.3 Oil content of some microalgae (Chisti, 2007) Microalga Oil content (% dry wt)
Botryococcus braunii 25–75 Chlorella sp. 28–32
Crypthecodinium cohnii 20 Cylindrotheca sp. 16–37
Dunaliella primolecta 23 Isochrysis sp. 25–33
Monallanthus salina 20 Nannochloris sp. 20–35
Nannochloropsis sp. 31–68 Neochloris oleoabundans 35–54
Nitzschia sp. 45–47 Phaeodactylum tricornutum 20–30
Schizochytrium sp. 50–77 Tetraselmis sueica 15–23
TABLE 2.4 Comparison of photobioreactor and open pond methods (Chisti, 2007; Mata et al., 2010)
Variable Photobioreactors Raceway ponds Annual biomass production
(kg) 100,000 100,000 Volumetric productivity(kg
m−3 d−1) 1.535 0.117 Areal productivity (kg m−2
d−1) 0.048 0.035 Biomass concentration(kg
m−3) 4 0.14
Area needed (m2) 5681 7828
Oil yield (m3 ha−1) 136.9 99.4 Annual CO2 consumption
(kg) 183,333 183,333
Contamination control Easy Difficult
2011-2015 FINAL REPORT - COOPERATIVE AGREEMENT NO. R10AC80283 Page 956
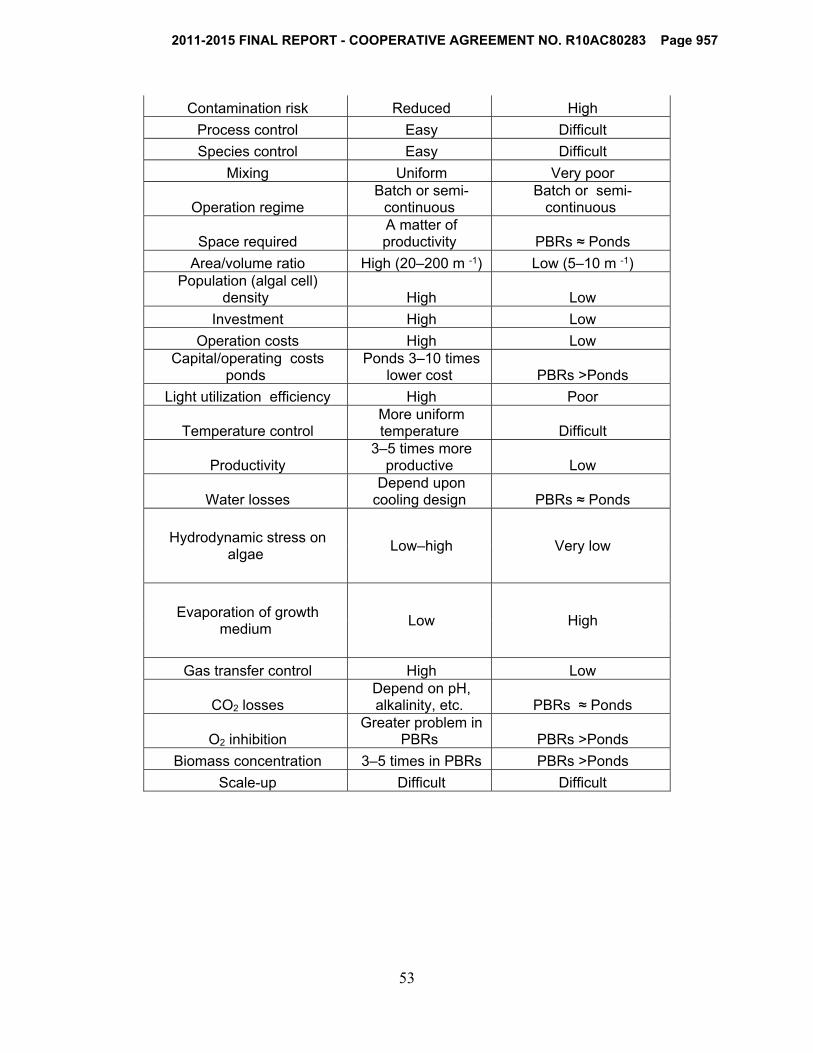
53
Contamination risk Reduced High
Process control Easy Difficult
Species control Easy Difficult
Mixing Uniform Very poor
Operation regime Batch or semi-
continuous Batch or semi-
continuous
Space required A matter of productivity PBRs ≈ Ponds
Area/volume ratio High (20–200 m -1) Low (5–10 m -1) Population (algal cell)
density High Low
Investment High Low
Operation costs High Low Capital/operating costs
ponds Ponds 3–10 times
lower cost PBRs >Ponds
Light utilization efficiency High Poor
Temperature control More uniform temperature Difficult
Productivity 3–5 times more
productive Low
Water losses Depend upon cooling design PBRs ≈ Ponds
Hydrodynamic stress on algae
Low–high Very low
Evaporation of growth medium
Low High
Gas transfer control High Low
CO2 losses Depend on pH, alkalinity, etc. PBRs ≈ Ponds
O2 inhibition Greater problem in
PBRs PBRs >Ponds
Biomass concentration 3–5 times in PBRs PBRs >Ponds
Scale-up Difficult Difficult
2011-2015 FINAL REPORT - COOPERATIVE AGREEMENT NO. R10AC80283 Page 957

54
Chapter 3
TABLE 3.1 Ion content of concentrate medium
Cation (mg/l)
K+ 32.93
Na+ 1936.80
Mg2+ 608.60
Ca2+ 495.25
Anion (mg/l)
F- 16.32
Cl- 2789.20
NO3- 854.60
SO42- 4729.78
PO43- 21.90
Total Nitrogen (mg/l) 22.88
TABLE 3.2 Recipe for 1 liter of f/2 medium
Component Amount Stock
Solution Concentration Final
Concentration
NaNO3 1 mL 7.5 g/100 mL dH20 880 µM
NaH2PO4·H2O 1 mL 0.5 g/100 mL dH20 36 µM
Na2SiO3·9H2O 1 mL 3 g/100 mL dH20 106 µM
Trace Metals Solution
1 mL/L See Recipe * --
Vitamin B12 1 mL/L See Recipe * --
Biotin Vitamin Solution
1 mL/L See Recipe * --
Thiamine Vitamin Solution
1 mL/L See Recipe * --
* Guillard and Ryther 1962, Guillard 1975, f/2 medium
2011-2015 FINAL REPORT - COOPERATIVE AGREEMENT NO. R10AC80283 Page 958

55
TABLE 3.3 Experimental design
Algae Medium Dunaliella tertiolecta (UTEX-LB 999) Concentrate Dunaliella tertiolecta (UTEX-LB 999) f/2 Dunaliella tertiolecta (UTEX-LB 999) 50% f/2 + 50%
Concentrate Dunaliella tertiolecta (UTEX-LB 999) DI water Nannochloropsis oculata (UTEX- LB 2164)
Concentrate
Nannochloropsis oculata (UTEX- LB 2164)
f/2
Nannochloropsis oculata (UTEX- LB 2164)
50% f/2 + 50% Concentrate
Nannochloropsis oculata (UTEX- LB 2164)
DI water
Chapter 4
TABLE 4.1 Specifications of media pH EC (µS/cm) TDS (mg/l)
Concentrate 7.83 10,260 6240
f/2 6.97 113.20 59.80
50:50 7.55 5660 3310
DI 7.15 0.94 0
TABLE 4.2 Analysis of variance for quadratic regression (TN vs. time for
Dunaliella) Source DF SS MS F P
Regression 2 483.3 241.6 223.3 <0.00001
Error 7 7.5 1.1
Total 9 490.9
2011-2015 FINAL REPORT - COOPERATIVE AGREEMENT NO. R10AC80283 Page 959

56
TABLE 4.3 Anions (Experiment 1)
TABLE 4.4 Cations (Experiment 1)
TABLE 4.5 Analysis of variance for quadratic regression (TN vs. time for
Nannochloropsis) Source DF SS MS F P
Regression 2 389.6 194.8 521.7 <0.00001
Error 7 2.614 0.373
Total 9 392.197
Unit=mg/l
F- Cl- NO3- SO4
2- PO43-
Anions
Initial 15.2 2605.8 834.9 3788.4 18.3
Final ≈0 2383.3 81.3 3608.1 ≈0
Removal 15.2 222.5 753.6 180.3 18.3
Ion removal
yield ≈1 0.1 0.9 0.0 ≈1
Volumetric rate
of ion removal 1.52 22.2 75.4 18 1.83
Unit=mg/l
K+ Na+ Mg2+ Ca2+
Cation
Initial 28.7 1889.2 579 464.2
Final 24.8 1655 537.4 347.3
Removal 3.9 234.2 41.6 116.9
Ion removal yield 0.1 0.1 0.1 0.2
Volumetric rate of ion
removal 0.4 23.4 4.1 11.7
2011-2015 FINAL REPORT - COOPERATIVE AGREEMENT NO. R10AC80283 Page 960

57
TABLE 4.6 Anions (Experiment 2)
Unit=mg/l
F- Cl- NO3- SO4
2- PO43-
Anion
Initial 15.2 2754.2 834.4 3598.3 20.8
Final 0 2489.6 72.9 3139.3 0
Removal 15.2 264.6 761.5 459 20.8
Ion removal
yield 1 0.09 0.9 0.1 1
Volumetric
rate of ion
removal 1.52 26.5 76.1 45.9 2.08
TABLE 4.7 Cations (Experiment 2)
Unit=mg/l
K+ Na+ Mg2+ Ca2+
Cation
Initial 29.6 1987.6 595.4 445.4
Final 26.8 1797.9 548.2 351.5
Removal 2.8 189.7 47.3 93.9
Ion removal
yield 0.1 0.09 0.1 0.2
Volumetric rate
of ion removal 0.3 18.9 4.7 9.4
2011-2015 FINAL REPORT - COOPERATIVE AGREEMENT NO. R10AC80283 Page 961

58
TABLE 4.8 Kinetic parameters
Qx=Volumetric
Growth Rate
(gr.dm-3.day)
µ=Specific
Growth Rate
(day-1)
Dunaliella
tertiolecta
(UTEX-LB 999)
Concentrate 0.08 0.19
f/2 0.03 0.12
1/2&1/2 0.04 0.14
DI 0.03 0.11
Nannochloropsis
oculata (UTEX-
LB 2164)
Concentrate 0.06 0.18
f/2 0.02 0.09
1/2&1/2 0.04 0.16
DI 0.01 0.07
2011-2015 FINAL REPORT - COOPERATIVE AGREEMENT NO. R10AC80283 Page 962

59
TABLE 4.9 Nitrogen removal (comparison) YN QN[=]mg.dm-3.day-1
Dunaliella tertiolecta 0.93 1.99
Nannochloropsis oculata 0.91 1.81
TABLE 4.10 Ion removal (comparison) Dunaliella tertiolecta Nannochloropsis oculata
Y
Q[=]mg.dm-
3.day-1 Y
Q[=]mg.dm-
3.day-1
Anion
F- ≈1 1.52 ≈1 1.52
Cl- 0.1 22.2 0.09 26.5
N03- 0.9 75.4 0.9 76.1
SO42- 0.04 18 0.1 45.9
PO43- ≈1 1.83 ≈1 2.08
Cation
K+ 0.1 0.4 0.1 0.3
Na+ 0.1 23.4 0.09 18.9
Mg2+ 0.1 4.1 0.1 4.7
Ca2+ 0.2 11.7 0.2 9.4
2011-2015 FINAL REPORT - COOPERATIVE AGREEMENT NO. R10AC80283 Page 963

60
Figures
Chapter 2
FIGURE 2.1 Five growth phases of microalgae cultures.
FIGURE 2.2 Algae growth rate in batch culture (solid line) and nutrient concentration (dashed line) in batch system (Mata et al., 2010)
2011-2015 FINAL REPORT - COOPERATIVE AGREEMENT NO. R10AC80283 Page 964

61
FIGURE 2.3 Schematic diagram for integrated biomass production
FIGURE 2.4 Schematic view of a raceway pond
FIGURE 2.5 Tubular photobioreactor with parallel run horizontal tubes
2011-2015 FINAL REPORT - COOPERATIVE AGREEMENT NO. R10AC80283 Page 965

62
FIGURE 2.6 A fence-like solar collector
FIGURE 2.7 Energy conversion processes from microalgae
FIGURE 2.8 Transesterification of oil to biodiesel
FIGURE 2.9 Schematic process of biodiesel production
2011-2015 FINAL REPORT - COOPERATIVE AGREEMENT NO. R10AC80283 Page 966

63
FIGURE 2.10 Schematic view of reverse osmosis (RO)
Chapter 3
FIGURE 3.1 UTEX photobioreactor
2011-2015 FINAL REPORT - COOPERATIVE AGREEMENT NO. R10AC80283 Page 967

64
FIGURE 3.2 Experiment set-up
Chapter 4 FIGURE 4.1 Effect of medium on biomass production for Dunaliella tertiolecta
0
100
200
300
400
500
600
700
800
DI f/2 1/2&1/2 Concentrate
% I
NC
RE
AS
E I
N B
IOM
AS
S
MEDIUM
2011-2015 FINAL REPORT - COOPERATIVE AGREEMENT NO. R10AC80283 Page 968

65
FIGURE 4.2 Growth curve for Dunaliella tertiolecta
FIGURE 4.3 Total nitrogen removal from concentrate by Dunaliella tertiolecta
0
0.1
0.2
0.3
0.4
0.5
0.6
0.7
0.8
0.9
1
D A Y 1
D A Y 2 D A Y 3
D A Y 4
D A Y 5
D A Y 6
D A Y 7
D A Y 8
D A Y 9
D A Y 1 0
OD
750 Concentrate
f/2
1/2&1/2
DI
y = 32.759e-0.316x
R² = 0.9913
0
5
10
15
20
25
30
0 2 4 6 8 10 12
Tota
l Nit
roge
n (m
g/l)
Time (Day)
Total Nitrogen Removal
2011-2015 FINAL REPORT - COOPERATIVE AGREEMENT NO. R10AC80283 Page 969

66
FIGURE 4.4 Correlation between TN and OD 750 for Dunaliella tertiolecta cultivated in concentrate
FIGURE 4.5 Effect of medium on biomass production for Nannochloropsis
oculata
y = 1.0082e-0.085x
R² = 0.9787
0
0.1
0.2
0.3
0.4
0.5
0.6
0.7
0.8
0.9
1
0 5 10 15 20 25
Opt
ical
Den
sity
@ 7
50 n
m
Total Nitrogen (mg/l)
0
100
200
300
400
500
600
DI f/2 1/2&1/2 Concentrate
% I
NC
RE
AS
E I
N B
IOM
AS
S
MEDIUM
2011-2015 FINAL REPORT - COOPERATIVE AGREEMENT NO. R10AC80283 Page 970

67
FIGURE 4.6 Growth curve for Nannochloropsis oculata
FIGURE 4.7 Total Nitrogen Removal from concentrate by
Nannochloropsis oculata
0
0.1
0.2
0.3
0.4
0.5
0.6
0.7
0.8
0.9
1
D A Y 1
D A Y 2
D A Y 3
D A Y 4
D A Y 5
D A Y 6
D A Y 7
D A Y 8
D A Y 9
D A Y 1 0
OD
750
TIME
Concentrate
f/2
1/2&1/2
DI
y = 28.004e-0.307x
R² = 0.9789
0
5
10
15
20
25
0 2 4 6 8 10 12
Tota
l Nit
roge
n (m
g/l)
Time (Day)
Total Nitrogen Removal
2011-2015 FINAL REPORT - COOPERATIVE AGREEMENT NO. R10AC80283 Page 971

68
FIGURE 4.8 Correlation between TN and OD 750 for Nannochloropsis oculata cultivated in concentrate
FIGURE 4.9 Algae effect on dry biomass production
y = 0.9103e-0.081x
R² = 0.9908
00.10.20.30.40.50.60.70.80.9
1
0 5 10 15 20 25
Opt
ical
Den
sity
@ 7
50 n
m
Total Nitrogen(mg/l)
0
100
200
300
400
500
600
Dunaliella tertiolecta (UTEX-LB 999) Nannochloropsis oculata (UTEX- LB 2164)
% I
NC
RE
AS
E I
N B
IOM
AS
S
ALGAE
2011-2015 FINAL REPORT - COOPERATIVE AGREEMENT NO. R10AC80283 Page 972

69
FIGURE 4.10 Medium effect on dry biomass production
FIGURE 4.11 Algae-Medium interaction effect on dry biomass
0
100
200
300
400
500
600
700
800
DI f/2 1/2&1/2 Concentrate
% I
NC
RE
AS
E I
N B
IOM
AS
S
MEDIUM
0100200300400500600700800
% I
NC
RE
AS
E I
N B
IOM
AS
S
ALGAE-MEDIUM
2011-2015 FINAL REPORT - COOPERATIVE AGREEMENT NO. R10AC80283 Page 973

70
FIGURE 4.12 Effect of algae on biomass concentration in concentrate
FIGURE 4.13 Ion removal from concentrate by two cultures of algae
0
0.1
0.2
0.3
0.4
0.5
0.6
0.7
0.8
0.9
1
OD
750
TIME
Dunaliella tertiolecta (UTEX-LB999)
Nannochloropsis oculata(UTEX- LB 2164)
0
0.2
0.4
0.6
0.8
1
1.2
F- Cl- N03- SO42- PO43- K+ Na+ Mg2+ Ca2+
Rem
oval
Yie
ld
Ions
Dunaliella tertiolecta
Nannochloropsis oculata
2011-2015 FINAL REPORT - COOPERATIVE AGREEMENT NO. R10AC80283 Page 974

71
FIGURE 4.14 TDS reduction in concentrate medium by two strains of algae
FIGURE 4.15 Electroconductivity reduction in concentrate medium by two strains of algae
0
1000
2000
3000
4000
5000
6000
7000
TD
S
TIME
Dunaliella tertiolecta (UTEX-LB999)
Nannochloropsis oculata(UTEX- LB 2164)
0
2000
4000
6000
8000
10000
12000
1 2 3 4 5 6 7 8 9 1 0
EL
EC
TR
OC
ON
DU
CT
IVIT
Y
TIME(DAY)
Dunaliella tertiolecta (UTEX-LB999)
Nannochloropsis oculata(UTEX- LB 2164)
2011-2015 FINAL REPORT - COOPERATIVE AGREEMENT NO. R10AC80283 Page 975

72
Chapter 5
FIGURE 5.1 Process overview
2011-2015 FINAL REPORT - COOPERATIVE AGREEMENT NO. R10AC80283 Page 976

73
Appendices
Appendix A
Units of Measure
ºC Degree(s) Celsius
ºF Degree(s) Fahrenheit
ft Feet
g Gram(s)
g/L Gram(s) per liter
g/L/d Gram(s) per liter per day
g. MJ-1 Gram(s) per mega joule(s)
GPD Gallon(s) per day
Kg kilogram
KWh kilowatt hour
L Liter(s)
m3 Cubic meter(s)
mg/L Milligram(s) per liter
MJ Mega Joule
MGD Million gallon(s) per day
ppm Part per million
Rpm Revolutions per minute
µm Micrometer(s)
µS/cm Micro-Siemens per centimeter
% Percentage
2011-2015 FINAL REPORT - COOPERATIVE AGREEMENT NO. R10AC80283 Page 977

74
Appendix B Data Record
1. Initial Media Characteristics pH EC (µS/cm) TDS (mg/l) Initial Biomass (g)
Concentrate 7.83 10,260 6240 0
f/2 6.97 113.2 59.8 0
50% f/2 + 50% Concentrate
7.55 5660
3310
0
DI water 7.15 0.94 0 0
Dunaliella tertiolecta inoculum
9.32
20,600
13,200
0.052
Nannochloropsis oculata inoculum
8.73
21,300
13,690
0.043
2. Initial Cation, Anion, and TN Characteristics of Concentrate
Cations (mg/l) Anions (mg/l)
Concen-trate
K Na Mg Ca F- Cl- NO3- SO42- PO4
3- TN
32.93 1936.8 608.6 495.25 16.32 2789.2 854.6 4729.78 21.9 22.88
3. Anion Removal by D. tertiolecta Initial
Concentration (mg/l)
Final Concentration
(mg/l)
Removal (mg/l)
Removal Yield
Volumetric Rate of
Removal
F- 15.20 ≈0 15.2 ≈1 1.52
Cl- 2605.81 2383.33 222.48 0.08 22.248
NO3- 834.90 81.31 753.59 0.90 75.36
SO42- 3788.44 3608.1 180.34 0.048 18.03
PO43- 18.3 ≈0 18.3 ≈1 1.83
2011-2015 FINAL REPORT - COOPERATIVE AGREEMENT NO. R10AC80283 Page 978

75
4. Anion Removal by N. oculata Initial
Concentration (mg/l)
Final Concentration
(mg/l)
Removal (mg/l)
Removal Yield
Volumetric Rate of
Removal
F- 15.2 0 15.2 1 1.52
Cl- 2754.23 2489.64 264.59 0.096 26.46
NO3- 834.4 72.86 761.54 0.91 76.15
SO42- 3598.3 3139.3 459 0.13 45.9
PO43- 20.8 0 20.8 1 2.08
5. Cation Removal D. tertiolecta Initial
Concentration (mg/l)
Final Concentration
(mg/l)
Removal (mg/l)
Removal Yield
Volumetric Rate of
Removal
K 28.67 24.76 3.91 0.14 0.39
Na 1889.19 1655.01 234.19 0.12 23.42
Mg 578.96 537.37 41.59 0.07 4.16
Ca 464.22 347.33 116.89 0.25 11.69
6. Cation Removal by N. oculata Initial
Concentration (mg/l)
Final Concentration
(mg/l)
Removal (mg/l)
Removal Yield
Volumetric Rate of
Removal
K 29.63 26.78 2.855 0.1 0.28
Na 1987.6 1797.86 189.73 0.09 18.97
Mg2+ 595.44 548.17 47.27 0.08 4.73
Ca2+ 445.44 351.55 93.89 0.21 9.39
2011-2015 FINAL REPORT - COOPERATIVE AGREEMENT NO. R10AC80283 Page 979

76
7. TDS Reduction TDS (mg/l)
Day
Algae Medium 1 2 3 4 5
Dunaliella tertiolecta (UTEX-LB 999)
Concen-trate
6290.0
6280.0
6152.5
6140.0
6150.0
Nannochloropsis oculata (UTEX- LB 2164)
Concen-trate
6270.0
6217.5
6077.5
6207.5
5632.5
TDS (mg/l)
Day
Algae Medium 6 7 8 9 10
Dunaliella tertiolecta (UTEX-LB 999)
Concen-trate
6075.0
6037.5
5932.5
5880.0
5802.5
Nanno-chloropsis oculata (UTEX- LB 2164)
Concen-trate
5457.5
5250.0
5087.5
4992.5
4930.0
8. EC Reduction Electroconductivity (µS/cm)
Day
Algae Medium 1 2 3 4 5
Dunaliella tertiolecta (UTEX-LB 999)
Concen-trate
10,180.0
10,250.0
9972.5
9965.0
9970.0
Nannochloropsis oculata (UTEX- LB 2164)
Concen-trate
10,200.0
10,152.5
9942.5
10,110.0
9232.5
Electroconductivity (µS/cm)
Day
Algae Medium 6 7 8 9 10
Dunaliella tertiolecta (UTEX-LB 999)
Concen-trate
9890.0
9812.5
9625.0
9552.5
9455.0
Nannochloropsis oculata (UTEX- LB 2164)
Concen-trate
8965.0
8635.0
8392.5
8272.5
8170.0
2011-2015 FINAL REPORT - COOPERATIVE AGREEMENT NO. R10AC80283 Page 980

77
9. pH Levels during Growth pH
Day
Algae Medium 1 2 3 4 5 6 7 8 9 10
Dunaliella tertiolecta (UTEX-LB 999)
Concen-trate
8.14
8.62
8.36
8.44
8.45
8.44
8.38
8.39
8.27
8.27
Dunaliella tertiolecta (UTEX-LB 999)
f/2 9.25
7.62
7.60
8.16
8.56
8.52
8.33
8.29
8.06
7.73
Dunaliella tertiolecta (UTEX-LB 999)
50% f/2 + 50% Concen-trate
8.37
8.41
8.43
8.56
8.54
8.54
8.51
8.43
8.38
8.35
Dunaliella tertiolecta (UTEX-LB 999)
DI water 9.35
7.58
7.57
8.42
8.33
7.96
7.79
7.76
7.70
7.37
Nanno-chloropsis
oculata (UTEX- LB
2164)
Concen-trate
7.93
8.56
8.51
8.49
8.43
8.36
8.29
8.36
8.42
8.39
Nanno-chloropsis
oculata (UTEX- LB
2164)
f/2 8.42
7.76
8.12
8.28
8.42
8.37
8.21
8.12
8.04
7.84
Nanno-chloropsis
oculata (UTEX- LB
2164)
50% f/2 + 50% Concen-trate
8.17
8.49
8.59 8.64 8.58
8.535
8.435
8.605
8.66
8.645
Nanno-chloropsis
oculata (UTEX- LB
2164)
DI water 8.75
7.79
8.16
8.54
8.27
8.16
7.84
7.61
7.71
7.66
10. Optical Density Optical Density at 750 nm
Day
Algae Medium 1 2 3 4 5 6 7 8 9 10
Dunaliella tertiolecta (UTEX-LB 999)
Concen-trate
0.186
0.162
0.251
0.338
0.456
0.652
0.767
0.811
0.861
0.795
Dunaliella tertiolecta (UTEX-LB 999)
Concen-trate
0.186
0.185
0.264
0.347
0.572
0.700
0.778
0.881
0.837
0.894
Dunaliella Concen- 0.186 0.185 0.295 0.396 0.624 0.767 0.728 0.893 0.911 0.981
2011-2015 FINAL REPORT - COOPERATIVE AGREEMENT NO. R10AC80283 Page 981

78
tertiolecta (UTEX-LB 999)
trate
Dunaliella tertiolecta (UTEX-LB 999)
Concen-trate
0.186
0.221
0.300
0.419
0.596
0.764
0.834
0.866
0.864
0.980
Dunaliella tertiolecta (UTEX-LB 999)
f/2 0.152
0.293
0.249
0.343
0.394
0.405
0.439
0.439
0.525
0.608
Dunaliella tertiolecta (UTEX-LB 999)
f/2 0.152
0.196
0.306
0.362
0.430
0.457
0.532
0.597
0.670
0.785
Dunaliella tertiolecta (UTEX-LB 999)
f/2 0.152
0.182
0.242
0.350 0.484
0.568
0.600
0.656
0.716
0.798
Dunaliella tertiolecta (UTEX-LB 999)
f/2 0.152
0.197
0.275
0.356
0.425
0.505
0.531
0.502
0.550
0.621
Dunaliella tertiolecta (UTEX-LB 999)
50% f/2 + 50% Concen-trate
0.175
0.175
0.248
0.368
0.505
0.679
0.676
0.657
0.692
0.744
Dunaliella tertiolecta (UTEX-LB 999)
50% f/2 + 50% Concen-trate
0.175
0.194
0.313
0.409
0.529
0.606
0.685
0.658
0.686
0.715
Dunaliella tertiolecta (UTEX-LB 999)
50% f/2 + 50% Concen-trate
0.175
0.228
0.282
0.507
0.603
0.773
0.817
0.850
0.865
0.857
Dunaliella tertiolecta (UTEX-LB 999)
50% f/2 + 50% Concen-trate
0.175
0.187
0.268
0.298
0.461
0.633
0.713
0.757
0.836
0.913
Dunaliella tertiolecta (UTEX-LB 999)
DI water 0.188
0.207
0.264
0.319
0.309
0.306
0.320
0.354
0.447
0.611
Dunaliella tertiolecta (UTEX-LB 999)
DI water 0.188
0.206
0.269
0.351
0.418
0.387
0.420
0.476
0.550
0.619
Dunaliella tertiolecta (UTEX-LB 999)
DI water 0.188
0.218
0.294
0.345
0.346
0.353
0.383
0.425
0.471
0.576
Dunaliella tertiolecta (UTEX-LB 999)
DI water 0.188
0.216
0.315
0.361
0.333
0.339
0.369
0.452
0.502
0.642
Nanno-chloropsis oculata (UTEX- LB 2164)
Concen-trate
0.181
0.236
0.321
0.472
0.497
0.603
0.674
0.772
0.815
0.858
Nanno-chloropsis
Concen-trate
0.181
0.239
0.347
0.439
0.542
0.634
0.704
0.786
0.842
0.881
2011-2015 FINAL REPORT - COOPERATIVE AGREEMENT NO. R10AC80283 Page 982

79
oculata (UTEX- LB 2164)
Nanno-chloropsis oculata (UTEX- LB 2164)
Concen-trate
0.181
0.229
0.352
0.449
0.529
0.618
0.691
0.770
0.808
0.853
Nanno-chloropsis oculata (UTEX- LB 2164)
Concen-trate
0.181
0.247
0.368
0.459
0.536
0.635
0.699
0.783
0.829
0.860
Nanno-chloropsis oculata (UTEX- LB 2164)
f/2 0.258
0.214
0.293
0.361
0.448
0.556
0.641
0.627
0.566
0.438
Nanno-chloropsis oculata (UTEX- LB 2164)
f/2 0.258
0.220
0.312
0.405
0.513
0.643
0.723
0.716
0.590
0.399
Nanno-chloropsis oculata (UTEX- LB 2164)
f/2 0.258
0.230
0.335
0.450
0.584
0.852
0.793
0.827
0.781
0.646
Nanno-chloropsis oculata (UTEX- LB 2164)
f/2 0.258
0.221
0.305
0.395
0.509
0.621
0.702
0.742
0.677
0.480
Nanno-chloropsis oculata (UTEX- LB 2164)
50% f/2 + 50% Concen-trate
0.128
0.228
0.328
0.396
0.507
0.612
0.707
0.817
0.857
0.907
Nanno-chloropsis oculata (UTEX- LB 2164)
50% f/2 + 50% Concen-trate
0.128
0.225
0.318
0.393
0.482
0.577
0.670
0.737
0.794
0.825
Nanno-chloropsis oculata (UTEX- LB 2164)
50% f/2 + 50% Concen-trate
0.128
0.233
0.336
0.425
0.535
0.633
0.710
0.811
0.848
0.890
Nanno-chloropsis oculata (UTEX- LB 2164)
50% f/2 + 50% Concen-trate
0.128
0.224
0.319
0.421
0.511
0.605
0.705
0.782
0.843
0.889
Nanno-chloropsis oculata (UTEX- LB 2164)
DI water 0.128
0.216
0.300
0.394
0.497
0.560
0.566
0.472
0.379
0.329
Nanno-chloropsis oculata (UTEX- LB 2164)
DI water 0.128
0.282
0.306
0.388
0.478
0.538
0.579
0.471
0.390
0.366
Nanno-chloropsis oculata
DI water 0.128
0.221
0.340
0.466
0.579
0.635
0.671
0.677
0.657
0.551
2011-2015 FINAL REPORT - COOPERATIVE AGREEMENT NO. R10AC80283 Page 983

80
(UTEX- LB 2164) Nanno-chloropsis oculata (UTEX- LB 2164)
DI water 0.128
0.218
0.366
0.409
0.511
0.587
0.611
0.652
0.665
0.657
11. Total Nitrogen vs. Optical Density Day
1 2 3 4 5
Optical Density at 750 nm
0.18600
0.18825
0.2775
0.37500
0.56200
Total Nitrogen (mg/l) 21.34
19.21
14.76
9.24
5.92
Day
6 7 8 9 10
Optical Density at 750 nm
0.72075
0.77675
0.86275
0.86825
0.9125
Total Nitrogen (mg/l) 4.89
3.56
2.42
1.98
1.46
12. Algae-Medium Interaction Effect on Biomass
Algae Medium Treatment 1 Treatment 2 Initial Biomass (g)
Final Biomass (g)
Dunaliella tertiolecta (UTEX-LB 999)
Concentrate 1 1 0.05224
0.2952
Dunaliella tertiolecta (UTEX-LB 999)
Concentrate 1 1 0.05224
0.3224
Dunaliella tertiolecta (UTEX-LB 999)
Concentrate 1 1 0.05224
0.5424
Dunaliella tertiolecta (UTEX-LB 999)
Concentrate 1 1 0.05224
0.2704
Dunaliella tertiolecta (UTEX-LB 999)
f/2
1 2 0.05224
0.1496
Dunaliella tertiolecta (UTEX-LB 999)
f/2
1 2 0.05224
0.148
Dunaliella tertiolecta (UTEX-LB 999)
f/2
1 2 0.05224
0.2008
Dunaliella tertiolecta (UTEX-LB 999)
f/2
1 2 0.05224
0.1952
Dunaliella tertiolecta (UTEX-LB 999)
50% f/2 + 50% Concentrate
1 3 0.05224
0.208
Dunaliella tertiolecta (UTEX-LB 999)
50% f/2 + 50% Concentrate
1 3 0.05224
0.2056
Dunaliella tertiolecta (UTEX-LB 999)
50% f/2 + 50% Concentrate
1 3 0.05224
0.2424
Dunaliella tertiolecta (UTEX-LB 999)
50% f/2 + 50% Concentrate
1 3 0.05224
0.188
Dunaliella tertiolecta (UTEX-LB 999)
DI water 1 4 0.05224
0.1576
Dunaliella tertiolecta DI water 1 4 0.05224 0.1688
2011-2015 FINAL REPORT - COOPERATIVE AGREEMENT NO. R10AC80283 Page 984

81
(UTEX-LB 999) Dunaliella tertiolecta (UTEX-LB 999)
DI water 1 4 0.05224
0.168
Dunaliella tertiolecta (UTEX-LB 999)
DI water 1 4 0.05224
0.172
Nannochloropsis oculata (UTEX- LB 2164)
Concentrate 2 1 0.043456
0.2808
Nannochloropsis oculata (UTEX- LB 2164)
Concentrate 2 1 0.043456
0.2928
Nannochloropsis oculata (UTEX- LB 2164)
Concentrate 2 1 0.043456
0.2664
Nannochloropsis oculata (UTEX- LB 2164)
Concentrate 2 1 0.043456
0.2728
Nannochloropsis oculata (UTEX- LB 2164)
f/2 2 2 0.043456
0.0976
Nannochloropsis oculata (UTEX- LB 2164)
f/2 2 2 0.043456
0.0808
Nannochloropsis oculata (UTEX- LB 2164)
f/2 2 2 0.043456
0.148
Nannochloropsis oculata (UTEX- LB 2164)
f/2 2 2 0.043456
0.1208
Nannochloropsis oculata (UTEX- LB 2164)
50% f/2 + 50% Concentrate
2 3 0.043456
0.2336
Nannochloropsis oculata (UTEX- LB 2164)
50% f/2 + 50% Concentrate
2 3 0.043456
0.1824
Nannochloropsis oculata (UTEX- LB 2164)
50% f/2 + 50% Concentrate
2 3 0.043456
0.2184
Nannochloropsis oculata (UTEX- LB 2164)
50% f/2 + 50% Concentrate
2 3 0.043456
0.2208
Nannochloropsis oculata (UTEX- LB 2164)
DI water 2 4 0.043456
0.0584
Nannochloropsis oculata (UTEX- LB 2164)
DI water 2 4 0.043456
0.0776
Nannochloropsis oculata (UTEX- LB 2164)
DI water 2 4 0.043456
0.1112
Nannochloropsis oculata (UTEX- LB 2164)
DI water 2 4 0.043456
0.1336
2011-2015 FINAL REPORT - COOPERATIVE AGREEMENT NO. R10AC80283 Page 985