Embed Size (px)
Citation preview

VALLEY COUNTYCommunity Health
Assessment
2017-2022
AcknowledgementThe Valley County Health Department and Valley CARE Coalition thanks the following partners for their active participation in the development of this assessment. These same partners will be essential to achieve a healthier Valley County.
DPHHS Systems Improvement Division City of Glasgow Eastern Montana Community Mental Health Center Frances Mahon Deaconess Hospital Glasgow DUI Task Force Glasgow Housing Authority Glasgow Police Department Glasgow Prevention Specialist Glasgow School District Hi Line Homes, Inc. Montana Healthcare Foundation Riverstone Health Soroptimist International Valley County Board of Health Valley County Emergency Medical Services Valley County Food Bank Valley County Health Department Valley County Ministerial Association Valley County Senior Center Valley County Sheriff Department Youth Dynamics, Inc.
2

Executive SummaryA Community Health Assessment was held in Valley County on Saturday, April 23, 2016. CASPER methodology was used to gather information from 121 households in Valley County. Key findings included: 42% of the household respondents were age 60 and older. Almost 60% had lived in Valley County for 16 or more years. 68% feel safe in their home and 59% feel safe in the community. Self-reporting their health as either excellent, very good or good is 78.9% of the respondents. 50.8% report their mental health to be excellent, very good, or good.
Areas for improvement include; 2 of 10 households use some type of tobacco product. 29.8% of Valley County respondents would like to see more parks, trails or greenways, the same amount would like to see more/ better sidewalks to enhance physical activity.
Through this process the Valley County Health Department, Frances Mahon Deaconess Hospital, Eastern Montana Community Mental Health Center and Glasgow Police Department formed the Valley C.A.R.E. Coalition ((Coordination, Access, Resources and Education) to bring community partners together to leverage resources which will promote better health in Valley County.
Mission Statement: Valley CARE Coalition created full and satisfying lives by improving health and wellness for our community.
Value Statement: Align wellness efforts of community members in a meaningful way, embrace health as more than physical status and engage in evidence-based tactics.
3

Table of Contents
Executive Summary 2Secondary Data...........................................4
Valley County..............................................................5
Secondary Data Sources.............................................6
Primary Data..............................................13
Primary Data Collection and Methodology...............14
Primary Data Results................................................16
Frances Mahon Deaconess Hospital Community Needs Assessment 20
Priority Areas.............................................21
Community Health Assessment Priority Ranking Sheet22
Community Health Assessment Feedback Form.......23
Identified Priority Areas............................................24
Appendices................................................21
Community Health Assessment Survey....................25
Community Health Assessment Volunteer Evaluation29
References.................................................30
4

5
Secondary Data

6
Valley CountyValley County is located in the eastern side of Montana and is a rural county with 11,576 persons (4.7 persons/square mile). Valley County Health Department (VCHD), Frances Mahon Deaconess Hospital (FMDH), and Eastern Montana Community Mental Health Center (EMCMHC) collaborated to complete the community health assessment.

Secondary DataThe following summary report provides an overview of key secondary data to be considered in the development of the 2016 Valley County Community Health Needs Assessment survey instrument.
United States Census Bureau Quick Facts i
The United States Census Bureau's mission is to serve as the leading source of quality data about the nation's people and economy. QuickFacts are summary profiles showing frequently requested data items from various Census Bureau programs.
County Demographic Information2010 Population Current Population
Estimates, 2014Net Change Population Density
7,369 7,640 3.7% 1.5
Demographic Profile: Age and Sex (July 1, 2014)Age Valley County Montana
Persons Under 5 years 5.4% 6.0%Persons Under 18 years 22.7% 22.0%
Persons 65 years and older 20.8% 16.7%Female Persons 49.5% 49.8%
Demographic Profile: Race/Ethnic Distribution Population Subgroup Valley County Montana
White alone 87.1% 89.4%Black or African American alone 0.4% 0.6%
American Indian and Alaska Native alone
9.4% 6.6%
Asian alone 0.7% 0.8%Native Hawaiian and other Pacific
Islander alone0.1% 0.1%
Two or more races 2.4% 2.6%Hispanic or Latino 2.2% 3.5%
White alone, not Hispanic or Latino 85.4% 86.7%
Population Characteristics Characteristic Valley County Montana
High school graduate or higher, percent of persons age 25 years+, 2010-2014 91.7% 92.4%
Bachelor’s degree or higher, percent of persons age 25 years+, 2010-2014 17.0% 29.1%
Veterans, 2010-2014 743 91,956With a disability, under age of 65 years,
2010-20149.5% 9.0%
Persons without health insurance, under 65 years, percent
23.5% 16.9%
Median Gross Rent, 2010-2014 $509 $696Households, 2010-2014 3,181 407,797
Persons per household, 2010-2014 2.32 2.40Persons in poverty 12.4% 15.4%
Unemployment 4.2% 5.6%
7

Montana Behavioral Risk Factor Surveillance System (BRFSS) ii
The following table includes an overview of selected findings from the 2014 Montana BRFSS survey. The survey is conducted through a collaborative effort with the Division of Behavioral Surveillance of the Centers for Disease Control and Prevention (CDC) and the Montana Department of Public Health and Human Services (DPHHS). This survey provides valuable information on health trends, chronic disease risks, and data for monitoring the effectiveness of policies, programs, and interventions. Dues to the small numbers in Montana, these indicators are reported by Health Planning Regions.
Health Status Indicator Eastern Montana Region MontanaSelf-Reported “Fair” or “Poor” Health 15.7% 15.4%
Frequent Poor Physical Health 9.4% 12.5%Frequent Poor Mental Health 10.2% 9.9%Frequent Activity Limitation 11.3% 16.0%
Health Care IndicatorsNo Health Care Coverage (ages 18-64) 12.1% 16.1%
Couldn’t Afford to See Doctor (past 12 months) 8.6% 11.9%
No Personal Healthcare Provider 33.2% 29.1%No Routine Checkup in the Past Year 37.9% 36.4%
No Dental Visit in the Past Year 42.6% 37.4%Clinical Preventive Practices
No Mammogram in Past 2 years (women ages 50+) 30.2% 28.0%
No Mammogram Ever 7.6% 4.8%No Pap Test in Past 3 years (women ages 18+) 29.1% 25.4%
No Colonoscopy in Past 10 years (ages 50-75) 52.3% 41.2%
No Up-To-Date Colorectal Cancer Screening (ages 50-75) 46.9% 37.6%
Health Related Risk BehaviorsNo Leisure-Time Physical Activity in Past 30 Days 24.8% 19.6%
Overweight (25.0≤ BMI < 30.0) 41.6% 36.6%
Obese (BMI ≥ 30.0) 33.6% 26.4%
Current Smokers 22.0% 19.9%Current Smokeless Tobacco Users 12.0% 7.6%Does Not Always Wear Seat Belt 45.6% 27.9%
Chronic Health ConditionsEver Diagnosed with Asthma 15.6% 13.4%Currently has Asthma 9.7% 9.6%Ever Diagnosed with a Heart Attack 5.3% 4.2%
Ever Diagnosed with Angina or CHD 5.1% 3.6%
Ever Diagnosed with a Stroke 2.7% 2.7%Ever Diagnosed with Diabetes 9.5% 8.8%Ever Diagnosed with a Depressive Disorder 18.4% 20.4%
Ever Diagnosed with Kidney Disease 3.0% 2.6%
8

County Health Rankings and Roadmaps iii
The County Health Rankings & Roadmaps program is a collaboration between the Robert Wood Johnson Foundation and the University of Wisconsin Population Health Institute. The County Health Rankings measure the health of nearly all counties in the nation and rank them within states. The Rankings are compiled using county-level measures from a variety of national and state data sources. These measures are standardized and combined using scientifically-informed weights. The annual Rankings provide a revealing snapshot of how health is influenced by where we live, learn, work and play.
Health Status Indicator Valley County MontanaQuality of Life
Poor or fair health 17% 14%Poor physical health days 3.0 3.5Poor mental health days 3.2 3.3
Low Birthweight 6.0% 7.3%Health Behaviors
Adult Smoking 18% 18.%Adult Obesity 29% 24%
Physical Inactivity 30% 22%Access to exercise opportunities 40% 72%
Excessive drinking 22% 19%Teen births 27 35
Clinical CareUninsured 24% 22%
Primary Care Physician 1,251:1 1,305:1Dentists 3,815:1 1,504:1
Mental Health Providers 1,526:1 428:1Preventable Hospital Stays 50 47
Diabetic Monitoring 82% 82%Mammography Screening 51.3% 64.2%Social Economic Factors
Children in Poverty 19% 21%Children in single-parent
households 37% 29%
Social Associations 24.0 14.3Injury Deaths 73 88
Physical EnvironmentSevere Housing Problems 9% 15%
Driving Alone to Work 78% 75%Long Commute-Driving Alone 16% 16%
9

Montana County Health Profiles 2015 iv
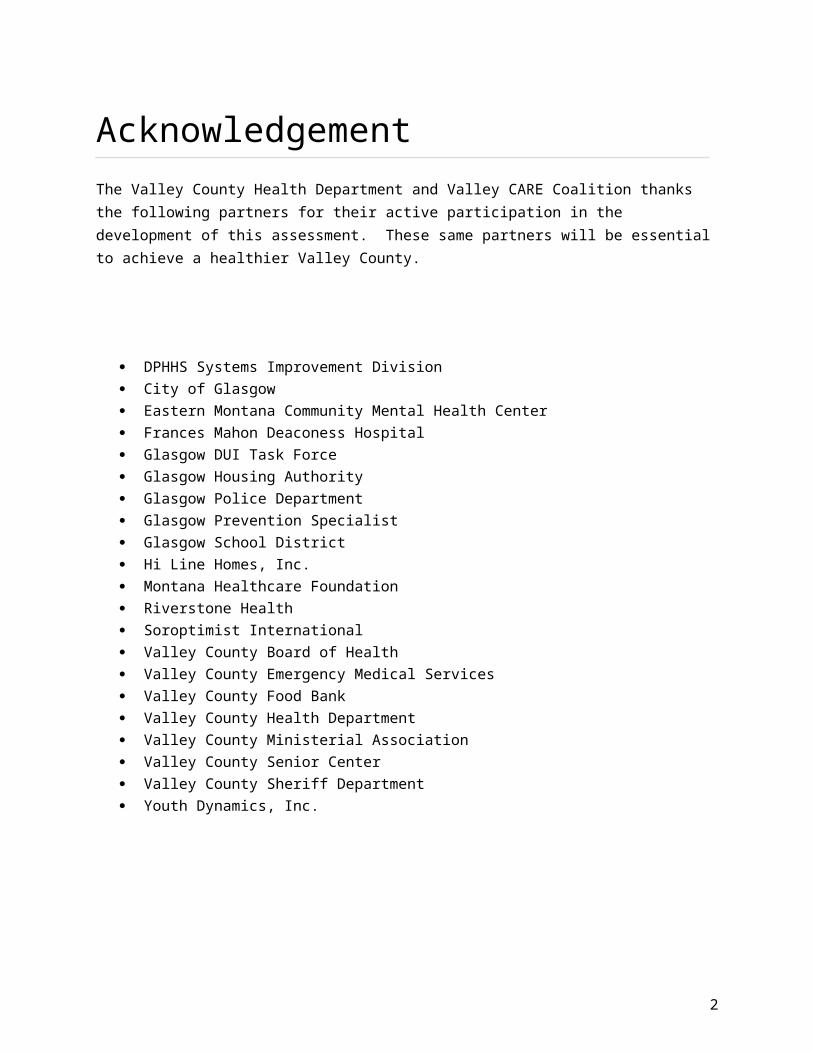
The Montana Department of Public Health and Human Services developed the County Health Profiles. The information below includes cancer data from the Montana Central Tumor Registry (MCTR). Immunization data was obtained from the Vaccines for Children (VFC) Program clinic reviews conducted every other year. The Montana Hospital Association provided access to emergency department visit and inpatient hospitalization data in the MHDDS, which is based on the 2004 Uniform Billing form, with ICD-9 CM coded primary and secondary diagnoses. The ICD9-CM codes can be found at http://www.cms.gov/medicare-coverage-database/staticpages/icd-9-code-lookup.aspx. Only persons hospitalized or visiting an emergency department recorded as residents of Montana during 2011–2013 were included in the analyses.
10

11
Montana Community Health Assessments 2011 v
The Office of Epidemiology and Scientific Support (OESS) maintains and distributes public health data from the following systems:
Montana Behavioral Risk Factor Surveillance System (BRFSS), Montana Hospital Data Discharge System, and Montana Vital Statistics Analysis Unit.
These data systems contain information on a wide variety of health issues and thus support Public Health programs in Montana. OESS's main purpose is to provide the most accurate and timely data possible to the Public Health and Safety Division Programs, the Department of Public Health and Human Services, local health agencies, policy makers, and community groups.
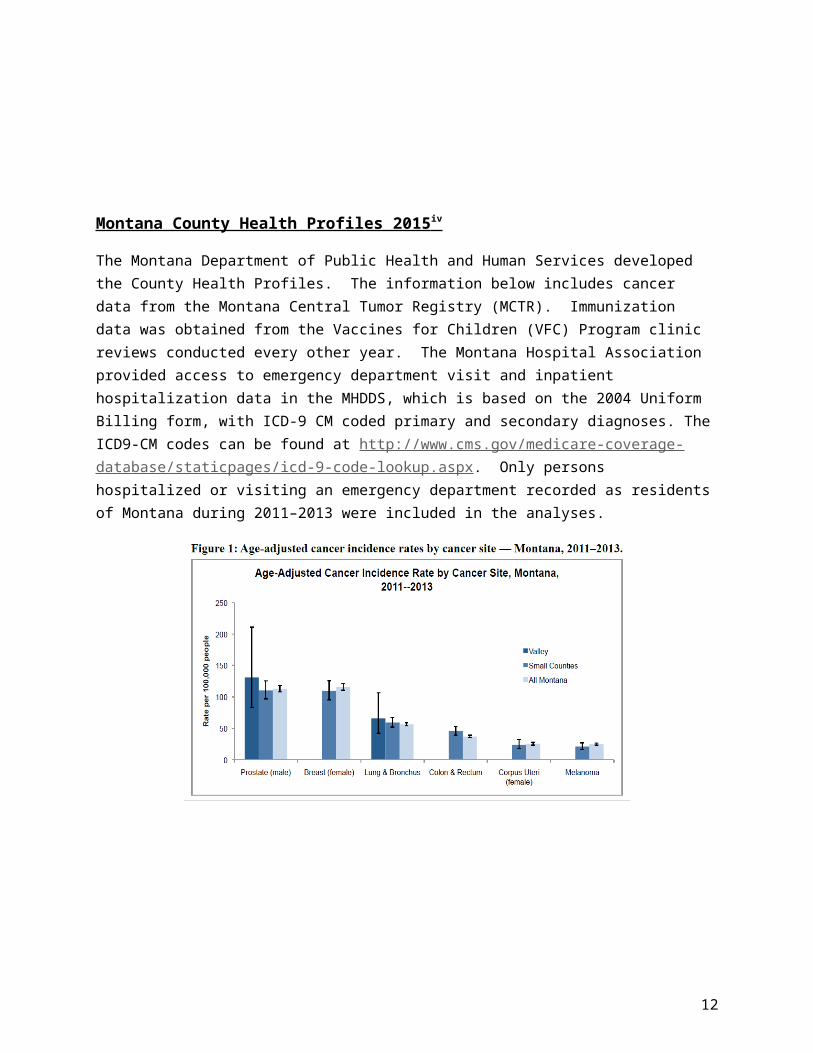
Health Indicator Valley County Region 1 Montana Data Source/DefinitionMaternal and Child Health
Infant mortality (death within 1st year): rate per 1000 live births
Not available 6.9(4.9-9.6)
6.1(5.5-6.7)
Vital Statistics (OVS) death and live birth data, 2004-2008. The number of infant (birth through 364 days of
age) deaths, divided by the total number of live births, multiplied by
1,000.
Child mortality (1 through 14 years): rate per 100,000 Not available 48.2
(33.0-68.0)18.4
(15.3-21.9)
Vital Statistics (OVS) death data, 2004-2008, and U.S. Census
Population Estimates, May 2009 release. The number of deaths to
children 1 through 14 years of age, divided by the estimated
population of children 1 through 14 years of age, multiplied by
100,000.
Neonatal (under 28 days of age) mortality: rate per 1000 live birth
Not available 4.1(2.6-6.3)
3.3(2.9-3.8)
Vital Statistics (OVS) death and live birth data, 2004-2008. The number of deaths to infants under 28 days of age, divided by the total number
of live births, multiplied by 1000.Mortality
Median age at death (All Races) 80 79 78
Vital Statistics: death certificates, Montana resident data from 2004-
2008. Total includes both sexes and all races. The age for which
half the deaths in a population are at a younger age and half at an
older age. In a population with an even number of decedents, the
median is the average of the two “middle” ages.
o White 82 81 79 --o American Indian 51 55 59 --
All Cancers mortality rate per 100,000 population
238(189.6-295.0)
257.8(241.9-274.5 )
200.9(197.5-205.0)
Vital Statistics: death certificates, Montana resident data from 2004-
2008.
12

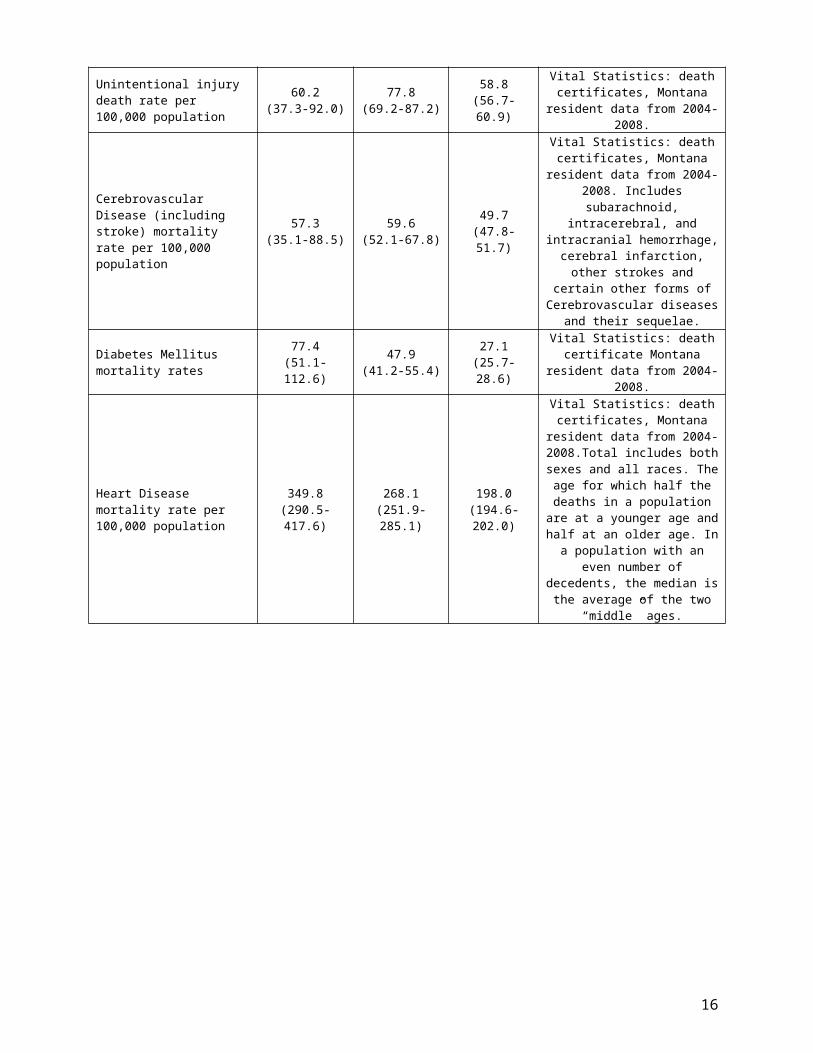
Unintentional injury death rate per 100,000 population
60.2(37.3-92.0)
77.8(69.2-87.2)
58.8(56.7-60.9)
Vital Statistics: death certificates, Montana resident data from 2004-
2008.
Cerebrovascular Disease (including stroke) mortality rate per 100,000 population
57.3(35.1-88.5)
59.6(52.1-67.8)
49.7(47.8-51.7)
Vital Statistics: death certificates, Montana resident data from 2004-
2008. Includes subarachnoid, intracerebral, and intracranial
hemorrhage, cerebral infarction, other strokes and certain other
forms of Cerebrovascular diseases and their sequelae.
Diabetes Mellitus mortality rates
77.4(51.1-112.6)
47.9(41.2-55.4)
27.1(25.7-28.6)
Vital Statistics: death certificate Montana resident data from 2004-
2008.
Heart Disease mortality rate per 100,000 population
349.8(290.5-417.6)
268.1(251.9-285.1)
198.0(194.6-202.0)
Vital Statistics: death certificates, Montana resident data from 2004-2008.Total includes both sexes and all races. The age for which half the
deaths in a population are at a younger age and half at an older age. In a population with an even number of decedents, the median is the average of the two “middle”
ages.
13

14
Primary Data
Primary Data CollectionVCHD, FMDH, EMCMHC, and the Public Health and Safety Division collaborated to complete a Community Assessment for Public Health Emergency Response (CASPER) to gather primary data for the CHA to improve the understanding of the health status of Valley County and to establish a volunteer network.
CASPER is an epidemiologic technique designed to provide household-level information and to be efficiently and rapidly deployed with minimum resources. CASPERs can be conducted to assess the effect of a disaster on a population, to determine the health status and basic needs of an affected population, to evaluate response and recovery efforts, to gain a better understanding of the community for CHAs, and to practice the CASPER technique as part of a preparedness exercise. The CASPER organization includes leadership, local coordination, logistics, data management, and field teams. Field teams consist of two persons with a target of 10–15 teams. A CASPER includes seven steps: 1) define the geographic area, 2) determine sampling method, 3) select instrument(s), 4) train field personnel, 5) conduct assessment, 6) analyze data, and 7) report results.
CASPER uses a two-stage cluster design based on the World Health Organization epidemiology technique for estimating vaccine coverage from small pox eradication. In the first stage of the sampling method, 20 clusters (i.e. census blocks) with ≥7 housing units (HUs) are selected with their probability proportional to the estimated number of HUs in each cluster. In the second stage, seven HUs are randomly selected in each of the 20 clusters by the field teams for the purpose of conducting the interviews with the goal of 140 completed interviews. Eighty percent completion rates allows population needs to be estimated from the sample and the estimates are usually within 10 percent.
VCHD contacted the PHSD in the fall of 2015 for help conducting a CASPER in April of 2016. Formal planning for the CASPER started immediately. VCHD, FMDH, and EMCMHC worked collaboratively to develop the survey for the CASPER with community stakeholder input, find and manage volunteers, completed all logistics including data collection, and completed the media campaign to raise awareness of the event. PHSD roles were coordinating the sampling and development of cluster maps with the Montana State Library, the just-in-time training for volunteers, completion of the volunteer evaluation, data analyses, and writing of the final report.
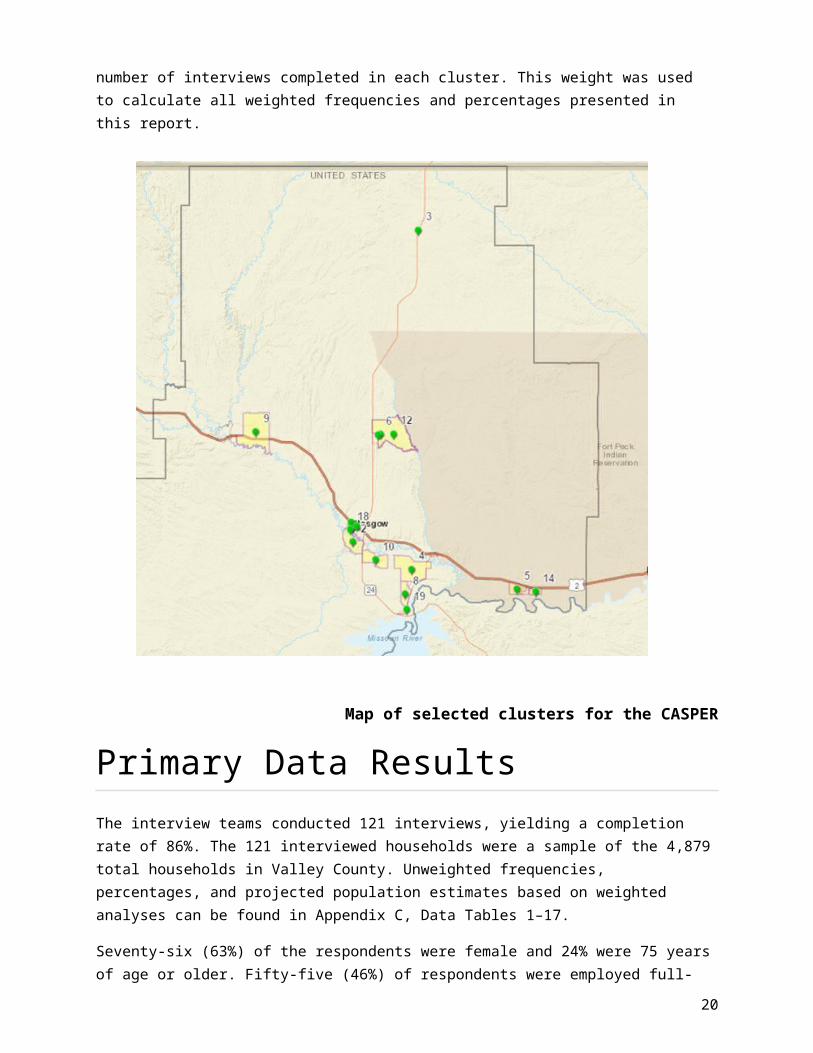
The geographic area for the CASPER included all of Valley County, which is 5,062 square miles. The main population center is Glasgow with a population of 3,374. Valley County contains 2,256 total census blocks including 1,438 blocks with 0 HUs, 635 blocks with 1–6 HUs, and 183 blocks with ≥7 HUs for a total of 4,879 HUs. The Montana State Library logically combined census blocks taking into account boundaries, roads, rivers, and other features to create new clusters with ≥7 HUs. In the first stage sampling, 20 clusters were randomly selected with probability proportional to the number of HUs within the merged blocks. In the second stage, field teams used a standardized method for randomization to select HUs for the seven interviews.
The survey instrument was designed to capture 1) demographic information 2) physical activity and nutrition 3) mental health and substance abuse 4) access to quality health servicers 5) injury 6) tobacco use 7) oral health and 8) community perceptions (Appendix A). On Saturday April 23, a just-in-time
15
training session for 45 volunteers provided an overview of a CASPER, household selection, interview techniques, and safety. Twenty-two, two-person teams attempted to conduct seven interviews in each of the 20 clusters selected for the sample, with a goal of 140 completed interviews. Residents of households who were at least 18 years of age were considered eligible respondents. Additionally, field teams distributed information about the VCHD, FMDH, and EMCMHC. Data collection occurred on Friday April 15 and Saturday April 23. All forms used during the CASPER were from the CASPER toolkit and were modified accordingly. All volunteers completed an evaluation at the end of the exercise (Appendix B).
Epi Info 7.1.2, a free statistical software package produced by the CDC, was used for data entry and analysis. The completion rate was calculated by dividing the number of completed interviews by 140 (i.e., the goal for completed interviews in this CASPER). To account for the probability that the responding household was selected, we created sampling weights based on the total number of occupied houses according to the 2010 Census, the number of clusters selected, and the number of interviews completed in each cluster. This weight was used to calculate all weighted frequencies and percentages presented in this report.
Map of selected clusters for the CASPER
16

Primary Data ResultsThe interview teams conducted 121 interviews, yielding a completion rate of 86%. The 121 interviewed households were a sample of the 4,879 total households in Valley County. Unweighted frequencies, percentages, and projected population estimates based on weighted analyses can be found in Appendix C, Data Tables 1–17.
Seventy-six (63%) of the respondents were female and 24% were 75 years of age or older. Fifty-five (46%) of respondents were employed full-time, 28% were retired, 12% were self-employed, and 7% were employed part-time. Table 1 contains complete demographic results.
Of the interviewed households, 97.5% strongly agree or agree they feel safe in their home; 95.1% strongly agree or agree they feel safe in their community; 93.4% strongly agree or agree they have enough financial resources to meet their basic needs; 85.9% strongly agree or agree their community is a good place to raise children; 83.5% strongly agree or agree their community is a good place to grow old; 83.4% strongly agree or agree they can get the health care they need near their home; and 80.7% strongly agree or agree they can buy affordable healthy food near their home. Respondents identified access to health care and other services (57.9%), clean air/water (42.1%), and good jobs and a healthy economy (31.4%) as most important aspects to a health community.
Of the interviewed households, 78.9% rated their physical health as excellent, very good, or good; 60.5% rated their day-to-day stress level as moderate or high; 22.5% haven’t visited a dentist for 3 or more years; 19.8% currently smoke, chew tobacco or use vaping products; and 90.6% rate their mental health as excelling, very good, or good. The main reasons respondents hadn’t visited a dentist within the last year included don’t need a dental appointment (27.8%), fear or apprehension (16.7%), could not afford (13%), and no insurance (13%). Respondents identified more parks, trails, or greenways (29.8%) and more/better sidewalks (29.8%) as improvements that would help them be more physically active. Thirty-three percent (33.9%) of interviewed persons stated the biggest barrier to being more physically active is they are too busy or don’t have time. Barriers to healthy eating include hard to find healthy choices outside the home (24.8%) healthy foods cost too much (18.2%), and takes too long to prepare and shop for healthy food (15.7%).
Twenty-three percent (22.5%) of respondents were unaware of programs to help pay for health care expenses and 23.1% did not get or were delayed in health care services in the past 12 months. Reasons health care services were delayed or not received included couldn’t get an appointment (46.4%), availability of services (32.1%), costs too much (25.0%), insurance didn’t cover (17.9%) and too long to wait for an appointment (17.9%). Items identified that would improve access to health care include availability of walk-in clinics (52.1%), availability of visiting specialists (46.3%), and more primary care providers (33.1%). The most common preventive services used in the past year were routine health check-up with family physician (59.5%), routine blood pressure check (52.1%), and a cholesterol check (42.2%). About half (49.6%) of persons interviewed received an influenza immunization within the last year. Friends/family (69.4%), health care provider (44.6%), radio (42.2%), and word of mouth/reputation (42.2%) were identified as the main sources of health services or health-related information available in the community.
17

Thirty-one percent (31.1%) of respondents stated someone in their household received medical attention for an injury in the last year. The main types of injuries included slips or falls (32.4%), sport injuries (24.3%), and household (16.2%).
Respondents would refer someone needing mental health services to Eastern Montana Community Mental Health Center (46.3%); healthcare provider (28.1%), and faith-based leader (26.5%). Respondents would refer someone needing substance abuse services to Eastern Montana Community Mental Health Center (36.4%), Alcoholics Anonymous (34.7%), and healthcare providers (31.4%). However, over 20% of respondents didn’t know where they would refer someone for mental health or substance abuse services.
Communication used on a daily basis included cell phones (79.4), email (58.7%), texting (55.4%), and landline (52.1%). Slightly more than half of respondents (55/6%) stated their family had a basic emergency preparedness kit. The top three sources of information during a emergency or disaster included radio (76.0%), television (55.4%), and word of mouth (38.0%). If respondents had to leave their home during a emergency, they would go to a relative/friends (44.6%), emergency shelter (14.9%), and leave town (11.6%).
Issues perceived as big problems in Valley County included illegal drug abuse (57%), prescription drug abuse (38.3%), obesity (33.1%), and child abuse/neglect (25.6%).
Volunteer Evaluations
All but three volunteers would definitely participate in a CASPER in the future. Overall, the volunteers felt their experience was good and they learned a lot in the process. Positive experiences from the CASPER included the willingness of people to participate, the number of volunteers, learning about people’s perceptions about Valley County, food, training, and working in teams. Volunteers felt the survey results could drive change in their communities. Volunteers recognized surveying takes a lot of time and energy. Some volunteers felt the survey was too long, the flow of the questions could be improved, the maps were confusing and could be improved, more sharing of volunteer phone numbers was needed, and data collection should have been at a different time and/or another day.
Discussion
Successful collaborations occurred between the VCHD, FMDH, EMCMHC, PHSD, and other Valley County local public health system partners. Lessons learned during the process will help refine the technique for use in Valley County and in other Montana counties. VCHD, FMDH, and EMCMHC were able to successfully find and utilize a volunteer network within the community. The post-exercise evaluations showed persons participating in the CASPER would volunteer again if needed. VCHD now has a list of volunteers that can be engaged if needed for future exercises or emergency events. These collaborations helped strengthen relationships and define roles of partners during a CASPER. Practicing the technique will be invaluable to the county and state in the event a CASPER will be needed during an emergency or disaster situation.
The CASPER met the stated purposes of improving the understanding of the health status of Valley County, developing a volunteer workforce, and completing an emergency preparedness exercise. VCHD and local public health system partners gained granular local data that can be used in addition to other
18
data sources to direct resources and improve services. Areas for potential public health interventions include continued efforts to decrease smoking, improve seat belt usage, increase influenza vaccine coverage, and to increase routine dental care. Improvements can be made to increase awareness of programs to help pay for health care expenses and to ensure and improve access to health care services.
Overall, results show residents feel Valley County is a good place to live, work, and retire. Valley County residents identified key issues they felt required immediate attention including increasing the availability of affordable housing and addressing illegal drug use and tobacco use. The results should be shared with local leaders, planners, and other local public health system groups to start discussions about how to address these community-wide issues.
Limitations
To create sampling weights, information from the 2010 Census was used to determine the household probability of being selected. Valley County could have experienced population changes since 2010, and thus the Census data might not be representative of the current population. The discrepancy between the 2010 Census and the current status, would not, however, affect the unweighted frequencies presented in this report.
Lessons Learned
1) CASPERs are a good method to gather local primary data for community health assessments.Because of Montana’s small population, granular local data can be hard to obtain. The CASPER method allows for collection of local data with population estimates. The data gained through a CASPER are invaluable to the health department and other local public health system partners for understanding the complete picture of community health.
2) Ensure cluster maps are adequate.Some of the cluster maps, especially the rural clusters, were not adequate. With future CASPERs, ensure both a street and topographic map are in the cluster packets with arrows designating the cluster entry point and more streets are labeled. These changes will decrease frustration for volunteer teams and ensure the correct households are being interviewed.
3) Administer the survey at different times during the day or on multiple days.As with the previous CASPER conducted in Montana, data collection dates and times are challenging. Many people were not home on a Saturday. Options to consider include two days of data collection with two sets of volunteers or to split volunteers into afternoon and evening groups. The biggest challenge of a CASPER is find the right time to ensure people are home. Multiple approached might need to be considered on future CASPERs.
4) Continually improve the survey length and flow.Some volunteers felt the survey was too long and the flow could be improved. As with any survey, improvements to questions can always be made to ensure the appropriate data is collected.
5) Regular meetings with executive planning committeeConducting regular meetings with the executive planning committee helped ensure the process kept moving forward and ensured communication occurred between all entities involved in the process.
19
Recommendations
Based on the results of the CASPER exercise, the following actions are recommended:
1) Share the results of the survey with local public health system partners and use as part of the community health assessment.Information gained in the CASPER will benefit local public health system partners and should be shared. VCHD, FMDH, and EMCMHC should use the results in addition to other data sources to determine community health priorities and in the development of a community health assessment and organizational strategic plan.
2) Continue to engage partners.Success of a CASPER or any community-based exercise is dependent on engagement and collaboration of partners. Partners were successfully engaged for collaboration during this project. Continued engagement of the partners will strengthen public health system and help ensure health priority areas are addressed in Valley County.
3) Continue to recruit and use volunteers regularly.CASPERs can use either a volunteer or deployable workforce. Volunteers were the basis of the field teams in this exercise. Volunteers found use in this exercise and were engaged during the process. A volunteer registry should be kept and continued use of volunteers for other exercises or projects should occur. If an emergency or disaster does occur, volunteer networks will already have been established and trained.
4) Use the results to implement public health interventions and create targeting public health messaging.Information gained about the population of Valley County during this exercise should be used to implement public health interventions and targeted public health messaging, to help address issues to access to health care, and to provide information about resource allocation for issues within the county.
5) Create and maintain randomized cluster maps for each county in Montana to be ready to be used for an exercise to practice the technique or during an emergency or disaster.One of the time consuming portions of the CASPER was combining census blocks, randomly selecting clusters, and creating detailed maps of the selected clusters. The Montana State Library provided the cluster maps for this CASPER; as no expertise exists within PHSD to complete the cluster mapping. PHSD should develop and maintain a bank of randomly selected clusters for each county in Montana. The state then would be able to provide this expertise to the counties for an exercise or during an emergency or disaster.
20

Frances Mahon Deaconess Hospital Community Needs Assessmentvi
Frances Mahon Deaconess Hospital Community Needs Assessment
Based on results from the 2013 Frances Mahon Deaconess Hospital Community Needs Assessment the following represent some of the leading health priorities for the community.
Access to Healthcare Serviceso Lack of Healthcare Coverageo Barriers to Accessing
Healthcareo Access to Dental Care
Cancero Cancer Screenings
Heart Disease and Strokeo Hyperlipidemiao Hypertension
Mental Health and Substance Abuseo Facilities, Resources & Access
Tobaccoo Use of Tobacco Products
Respiratory Diseaseo Incidence and Prevalence
Nutrition and Overweighto Overweight/Obesity
Prevalenceo Physical Activity Levels
21

22
Priority Areas

Community Health Assessment Priority Ranking Sheet
Heart
Disease Mental Health
Nutrition/Weight
Substance Abuse
Tobacco Abuse
1 - Scope
1 - Impact
2 - Scope
2 - Impact
3 - Scope
3 - Impact
4 – Scope 4 - Impact 5 - Scope
5 - Impact
1 10 10 9 10 10 10 8 7 9 92 5 6 6 8 5 6 6 9 6 93 2 8 3 7 5 5 5 6 3 64 7 7 7 8 9 10 8 9 7 85 9 5 7 5 9 5 8 5 4 86 8 8 6 5 8 8 8 8 9 57 7 7 9 8 8 9 10 10 9 108 7 7 6 7 6 7 9 5 5 39 8 8 8 6 8 8 8 7 7 8
10 6 6 9 8 8 5 10 10 10 1011 2 2 10 8 4 4 6 4 1 312 5 4 5 5 6 9 6 8 9 213 9 6 6 6 8 10 9 9 6 614 10 10 10 10 10 10 10 10 10 10
Total 95 94 101 101 104 106 111 107 95 97Ave. 6.8 6.7 7.2 7.2 7.4 7.6 7.9 7.6 6.8 6.9
Ranking Values8930 10201 11024 11877 9215
Priority Ranking6 3* 2* 1* 5
Hospital Survey Ranking1 3 2
23
Community Health Assessment Feedback Form
Community Resources for Health
ThreatsWillingness to Change
Community Views1 1 1 2= Very2 1 1 1= Some3 2 1 0= Not at All4 2 15 2 16 1 17 1 28 1 1
Total 11 9 Average 1.38 1.13
24

Identified Priority Areas1. Physical Activity and Nutrition
o 54% of Valley County households feel they do not have the time, or are too tired, to be physically active. 30% of the respondents said they would be more physically active if there were better access to parks, trails or greenways.
o 19.2% of Valley County household feel they cannot purchase affordable, healthy, food near their home. Almost 25% of the households responding said it is hard to find healthy choices when you eat outside the home.
2. Mental Health
o 8% of Valley County households rate their mental health to be fair or poor. Respondents say they have an average of 3.2 poor mental health days per month. Montana’s rate of suicide, 22.3% per 1,000 people nearly doubles the national rate of 12.2%.
3. Prevent Substance Abuse
o 77% of Valley County household’s respondents listed substance abuse as either a problem, or big problem in our community
o 38% of Valley County youth under the age of 18 have used alcohol in the last 30 days
o Between 2000 and 2015, 693 deaths in Montana were attributed to prescription opioid poisoning.
25

Appendix A. Survey
26

27

28

29

Appendix B. Volunteer Evaluation1. In your opinion, what went well? What did not go well?2. To what extent do you think this assessment will be useful to your
community in learning about the health of the county? 3. Did you think you were prepared (e.g., training, food, safety,
communications, supplies) for your assignment? 4. Would you want to participate on a team in the future? 5. If we were to do this assessment again, what improvements can be made? 6. Did you learn anything from this experience?
7. Were there specific situations that you encountered that you want to tell us about relating to:
a. Orientation of field teams?
b. Assessment methods?
c. Questionnaire/survey?
d. Supplies and equipment?
e. Food?
f. Safety?
g. Communications?
h. Transportation?
8. Please provide any additional comments.
THANK YOU FOR YOUR SERVICE TO YOUR COMMUNITY
30

iReferences http://quickfacts.census.gov/qfd/states/30/30105.html
ii http://dphhs.mt.gov/publichealth/BRFSS/Annual-Reports/2014AnnualReport
iiihttp://www.countyhealthrankings.org/app/montana/2015/rankings/valley/county/outcomes/overall/snapshot
ivhttp://dphhs.mt.gov/Portals/85/publichealth/Publications/County%20Health%20Profiles/Valley%20Community%20Health%20Profile.pdf
vhttp://dphhs.mt.gov/publichealth/Epidemiology/OESS-CHD
vihttp://www.fmdh.org/fil_files/35.pdf

![Mastering the FOIA at Census · Data FOLA Metrics by 2017-01-31 [Compatibility Mode] ... Natural and Man-made Disasters using U.S. Census Bureau's data and statistics United States](https://img.pdfslide.us/doc/110x75/5f99bcdeeca098317a455311/mastering-the-foia-at-census-data-fola-metrics-by-2017-01-31-compatibility-mode.jpg)