Embed Size (px)
Citation preview

The Census Bureau's Geographic Support System Initiative – An Update
Council of Professional Associations on Federal StatisticsSeptember 21, 2012
Tim TrainorChief, Geography Division
U.S. Census Bureau
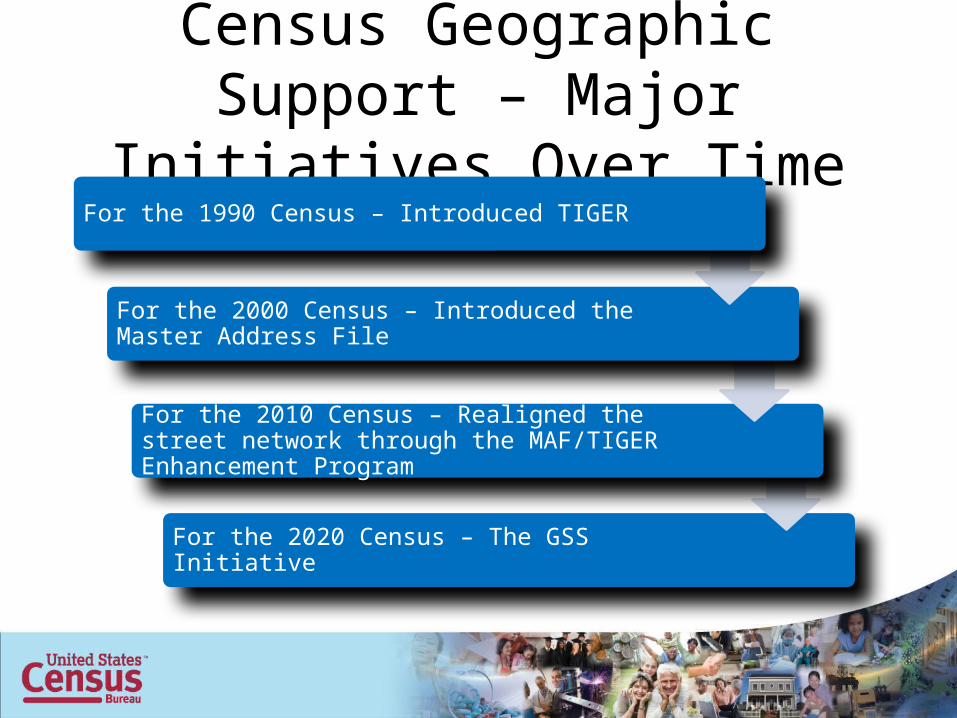
For the 2020 Census – The GSS Initiative
For the 2010 Census – Realigned the street network through the MAF/TIGER Enhancement Program
For the 2000 Census – Introduced the Master Address File
Census Geographic Support – Major Initiatives Over Time
For the 1990 Census – Introduced TIGER
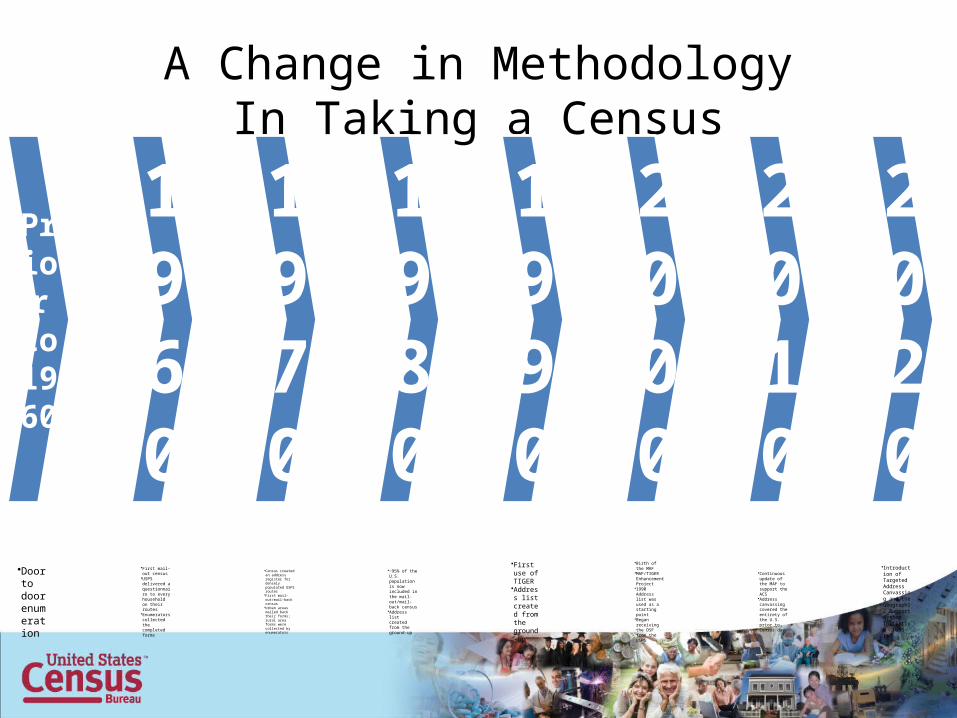
A Change in MethodologyIn Taking a Census
Prior
to 1960
•Door to door enumeration
1960
•First mail-out census
•USPS delivered a questionnaire to every household on their routes
•Enumerators collected the completed forms
1970
•Census created an address register for densely populated USPS routes
•First mail-out/mail-back census
•Urban areas mailed back their forms; rural area forms were collected by enumerators
1980•~95% of the U.S. population is now included in the mail-out/mail-back census•Address list created from the ground-up
1990•First use of TIGER
•Address list created from the ground-up
2000
•Birth of the MAF
•MAF/TIGER Enhancement Project
•1990 Address list was used as a starting point
•Began receiving the DSF from the USPS
2010•Continuous update of the MAF to support the ACS•Address canvassing covered the entirety of the U.S. prior to Census day
2020•Introduction of Targeted Address Canvassing and the Geographic Support System Initiative (GSS-I)
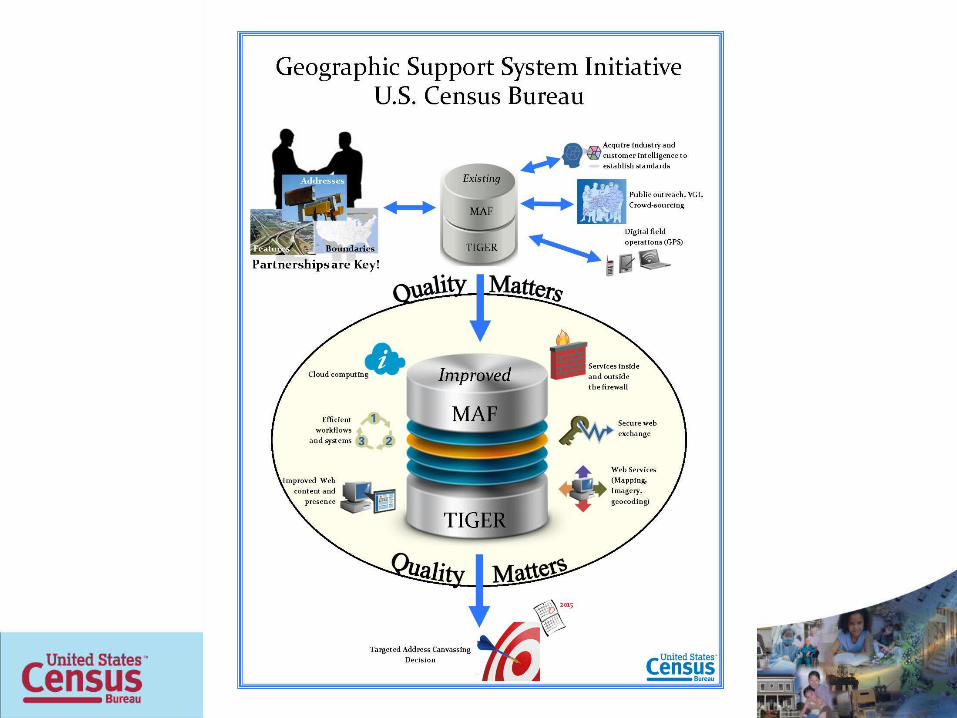
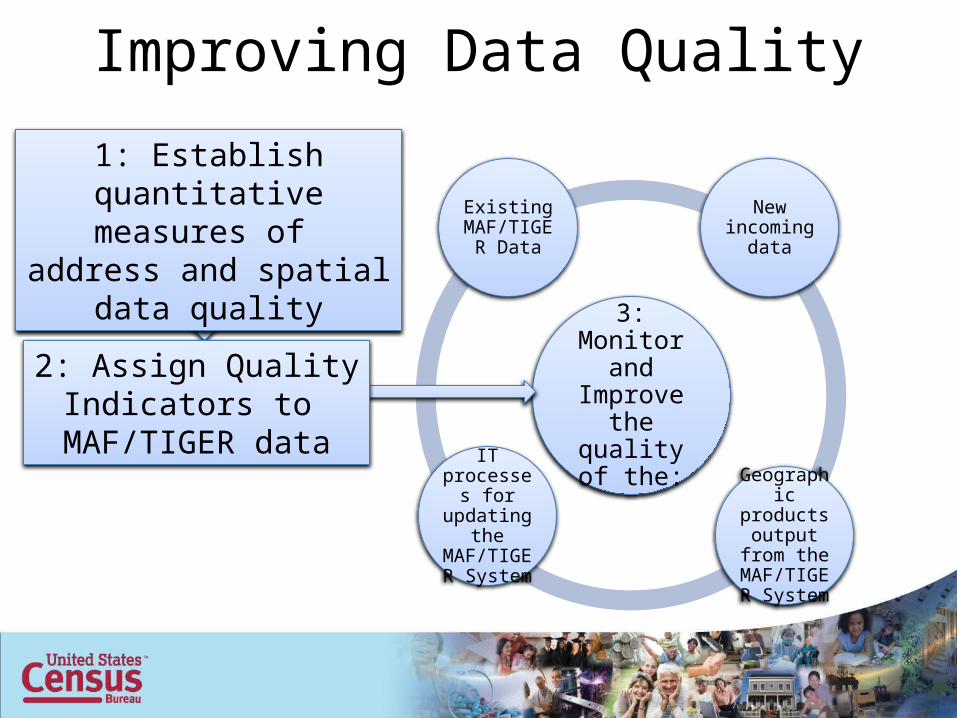
Improving Data Quality
3: Monitor and Improve the quality
of the:
Existing MAF/TIGER
Data
IT processes for updating
the MAF/TIGER
System
Geographic products
output from the
MAF/TIGER System
1: Establish quantitative measures of
address and spatial data quality
2: Assign Quality Indicators to
MAF/TIGER data
New incoming
data
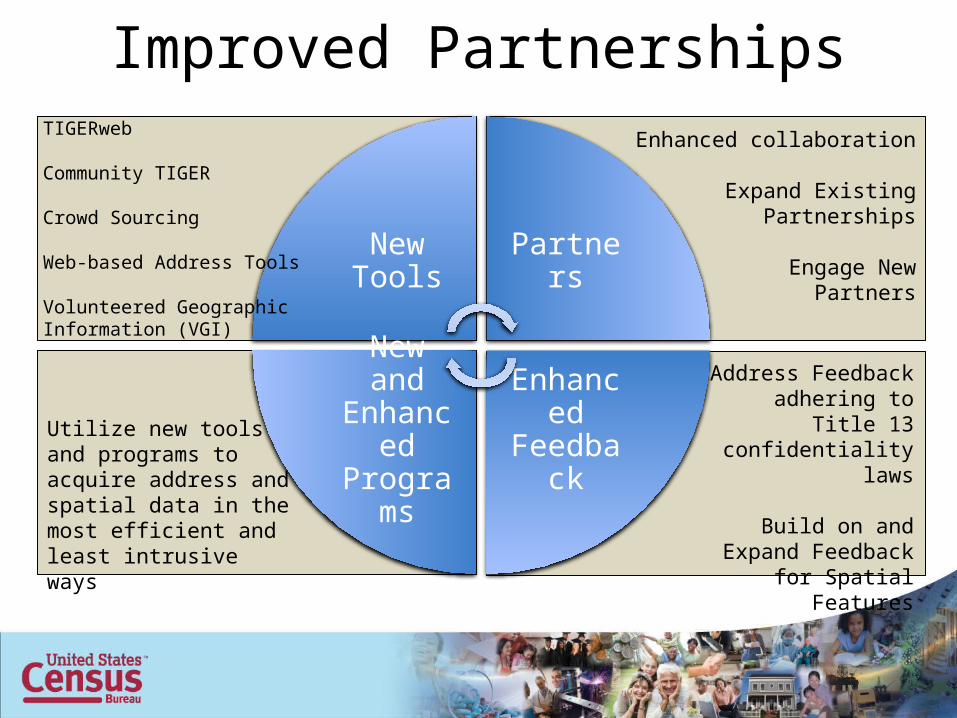
New Tools Partners
Enhanced Feedback
New and Enhanced Programs
TIGERweb
Community TIGER
Crowd Sourcing
Web-based Address Tools
Volunteered Geographic Information (VGI)
Enhanced collaboration
Expand ExistingPartnerships
Engage NewPartners
Utilize new toolsand programs to acquire address and spatial data in the most efficient and least intrusive ways
Address Feedback adhering to Title 13 confidentiality laws
Build on and Expand Feedback for Spatial
Features
Improved Partnerships
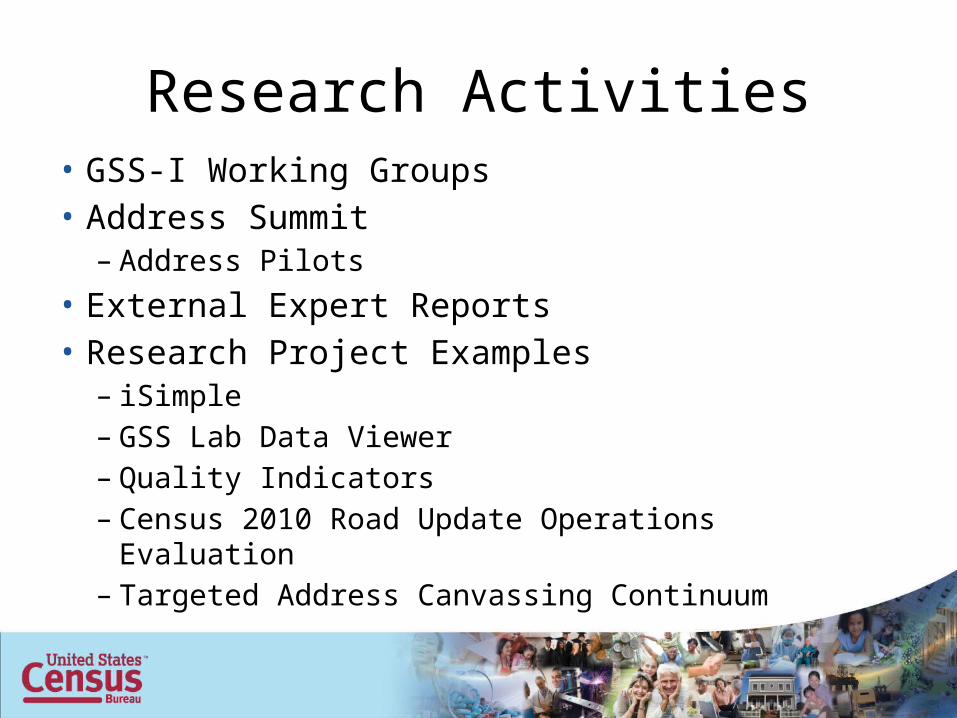
Research Activities• GSS-I Working Groups• Address Summit
– Address Pilots
• External Expert Reports• Research Project Examples
– iSimple– GSS Lab Data Viewer– Quality Indicators– Census 2010 Road Update Operations Evaluation– Targeted Address Canvassing Continuum
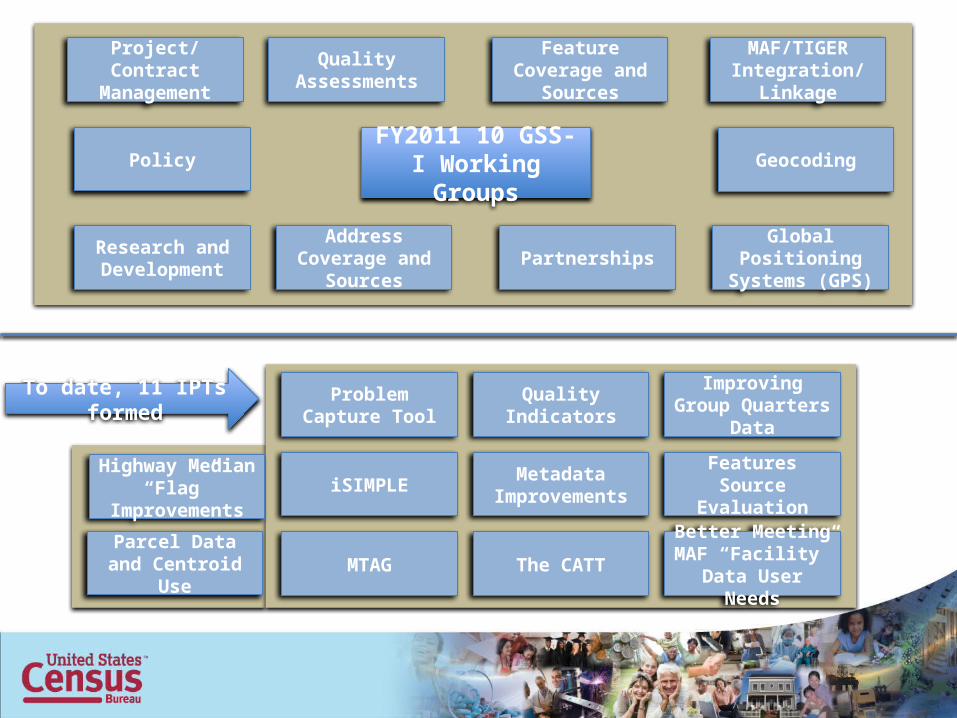
iSIMPLE
Problem Capture Tool
Features Source Evaluation
Metadata Improvements
MTAGBetter Meeting
MAF “Facility” Data User Needs
The CATT
Quality Indicators Improving Group Quarters Data
To date, 11 IPTs formed
Highway Median “Flag”
Improvements
Parcel Data and Centroid Use
FY2011 10 GSS-I Working Groups
Policy
Research andDevelopment PartnershipsAddress Coverage
and Sources
Project/ContractManagement
Feature Coverage and Sources
Quality Assessments
MAF/TIGER Integration/ Linkage
Geocoding
Global Positioning Systems (GPS)

Census Address Summit Goals• Educate our partners about the Geographic Support
System Initiative (GSS-I) and the benefits of targeted address canvassing
• Gain a common understanding regarding the definition of an address
• Learn how our partners are collecting, using, and maintaining address data
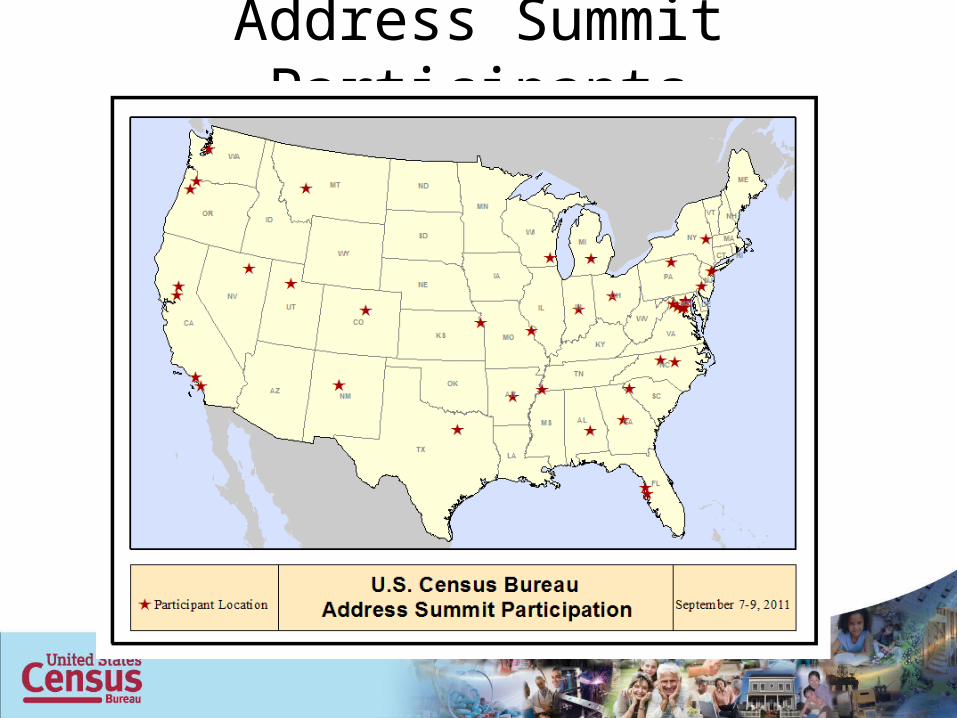
Address Summit Participants
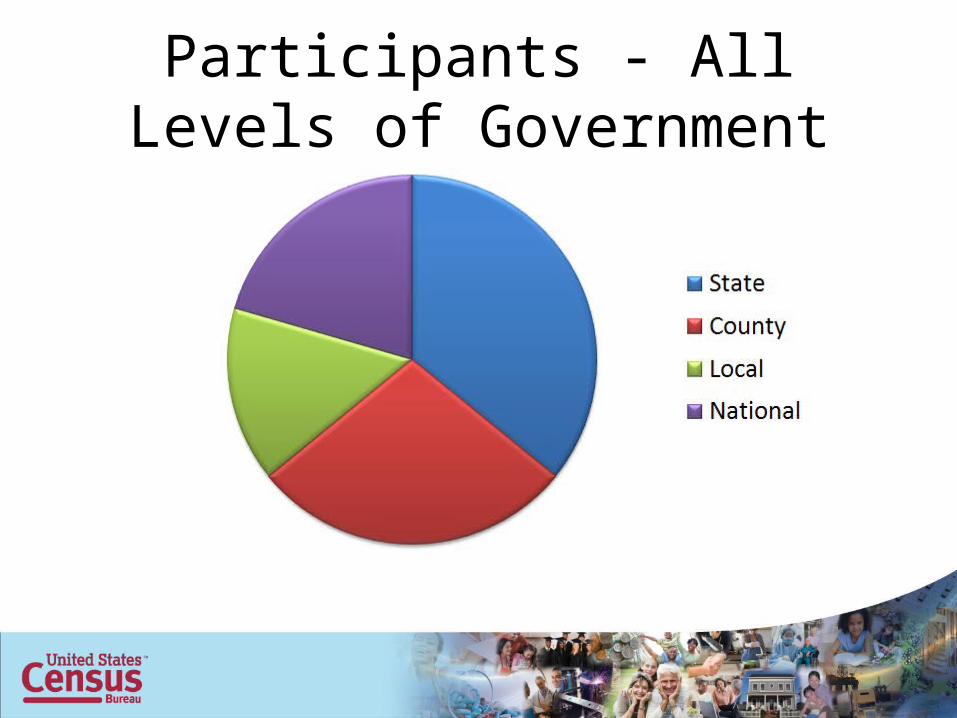
Participants - All Levels of Government
Observations• Continuous partnerships are needed and welcome• Public safety is a driving factor for local governments• Urban and rural areas will pose different challenges• Address coverage varies and is sometimes not known or
quantifiable• Communication and engagement are key
Results of the Address Summit
• Five Pilot Projects• Address Authority Outreach and Support for Data
Sharing Efforts• FGDC Address Standard and Implementation• Federal/State/Tribal/Local Address Management
Coordination• Data Sharing – Local/State/USPS/Census • Hidden/Hard to Capture Addresses

2012 Address Pilot Schedule

Moving Forward
These pilots will provide:• The Census Bureau with a testing ground for future
geographic partnership programs• The Census Bureau with an opportunity to identify the best
methods for the continual update of the MAF/TIGER System
• www.census.gov/geo/www/gss/address_summit/
15

Benefits of Establishing an Census Address Ontology
• Establishing an Ontology allows for– Effective communication – Common language– Ease the burden of data sharing – Explicit terminology, concepts, and relationships

Expert Research at Census• Five reports created by outside experts:
– The State and Anticipated Future of Addresses and Addressing– Identifying the Current State and Anticipated Future Direction of Potentially Useful Developing
Technologies– Measuring Data Quality– Use of Handheld Computers and the Display/Capture of Geospatial Data– Researching Address and Spatial Data Digital Exchange– http://www.census.gov/geo/www/gss/reports.html
• Summer at Census:– Steve Guptill; USGS Chief Scientist (Retired)
• Quantifying the Quality of the MAF/TIGER Database
– David Cowen; Distinguished Professor Emeritus• Use of Parcel Data to Update and Enhance Census Bureau Geospatial Data
– http://www.census.gov/geo/www/gss/qaewg.html
• 2 In-Progress Reports – Change Detection– Master Address File (MAF) Evaluation
Analysis of the MAF/TIGER System
• iSIMPLE– Evaluation of road features in TIGER– Is TIGER consistent with imagery?– 852,090 grid cells reviewed
• 94% had NO missing features• 5% had 4 or less missing features• 70% had NO misaligned features• 26% had 4 or less misaligned features
– First web service based review– Research will assist with targeting efforts
18
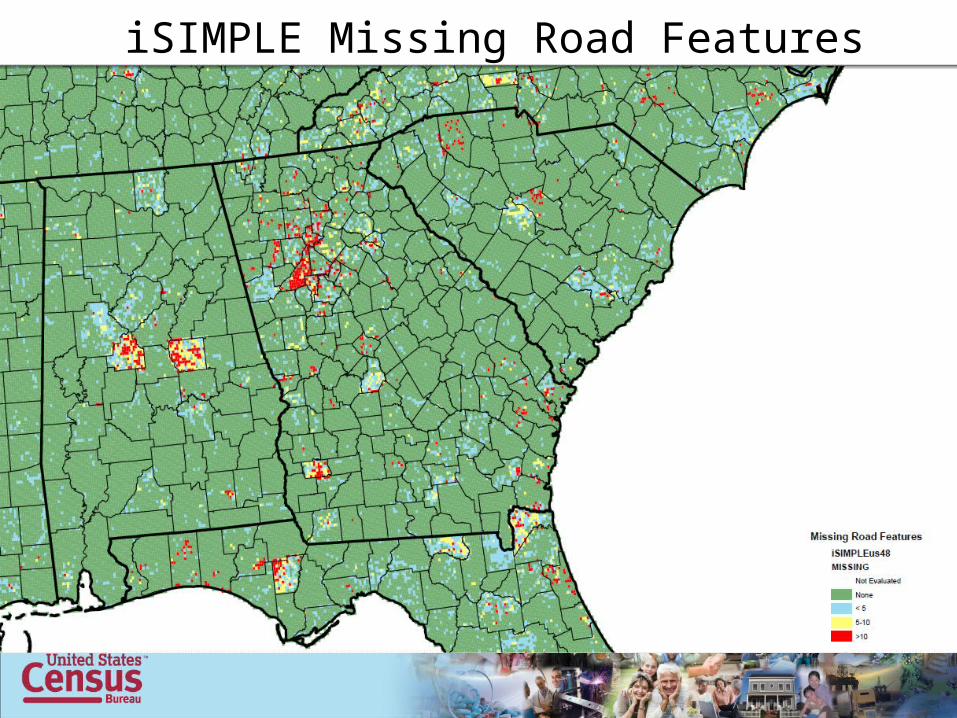
iSIMPLE Missing Road Features
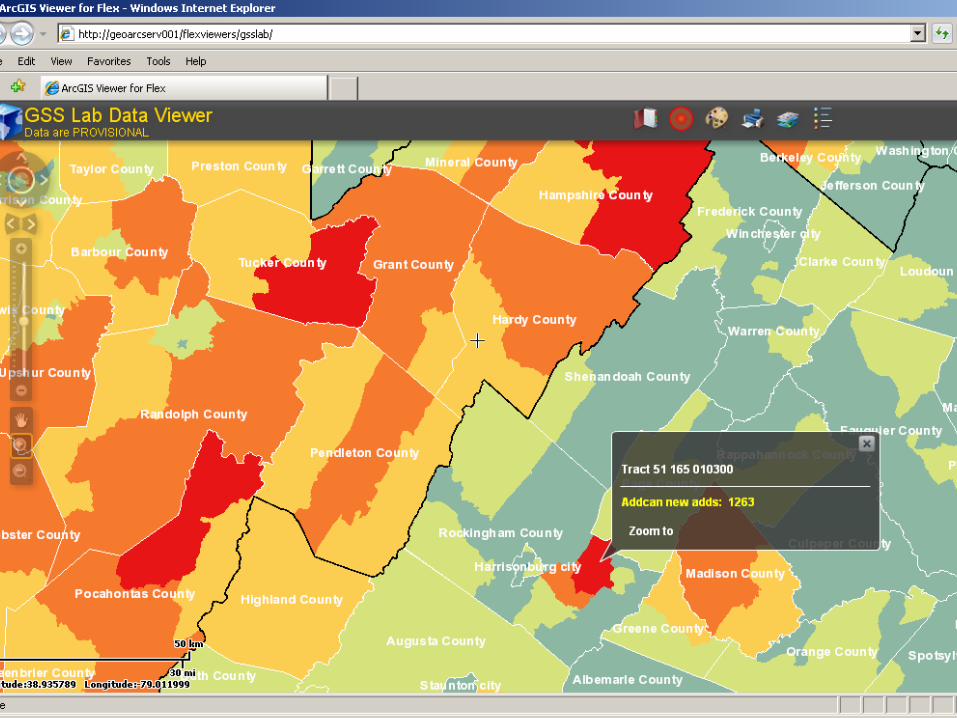
GSS Lab Data Viewer
• An on-line, interactive mapping tool to facilitate visualization of data and information
• Examples include:– 2010 Census Data
• Address Canvassing adds• Type A adds• Undeliverable as Addressed
– Delivery Sequence File Statistics– Natural Disaster Information
20
21
22
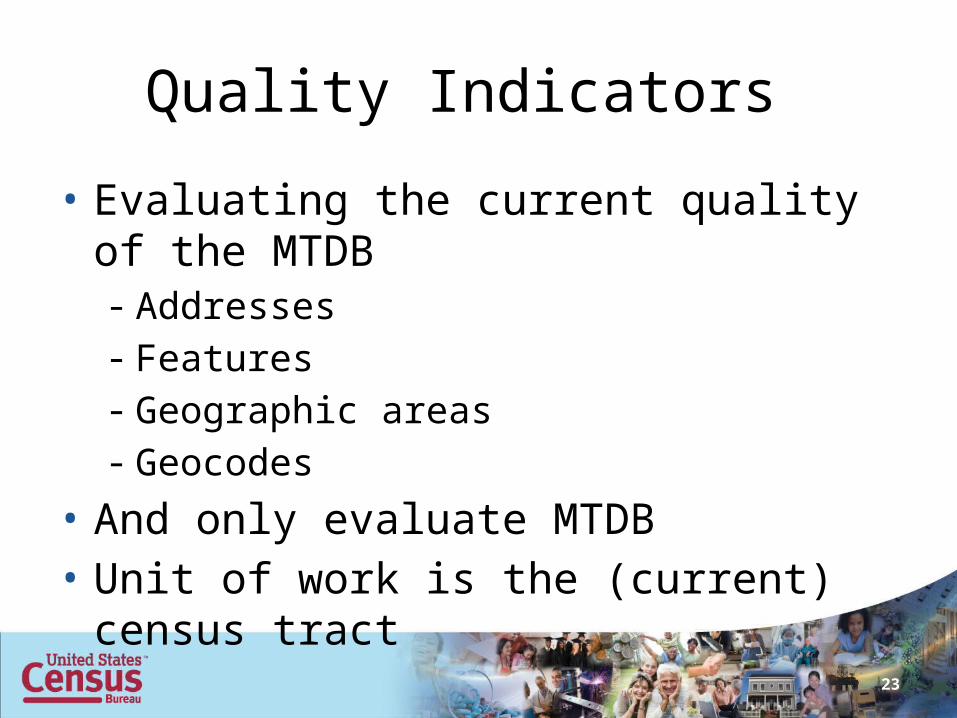
Quality Indicators
• Evaluating the current quality of the MTDB- Addresses- Features- Geographic areas- Geocodes
• And only evaluate MTDB• Unit of work is the (current) census tract
23
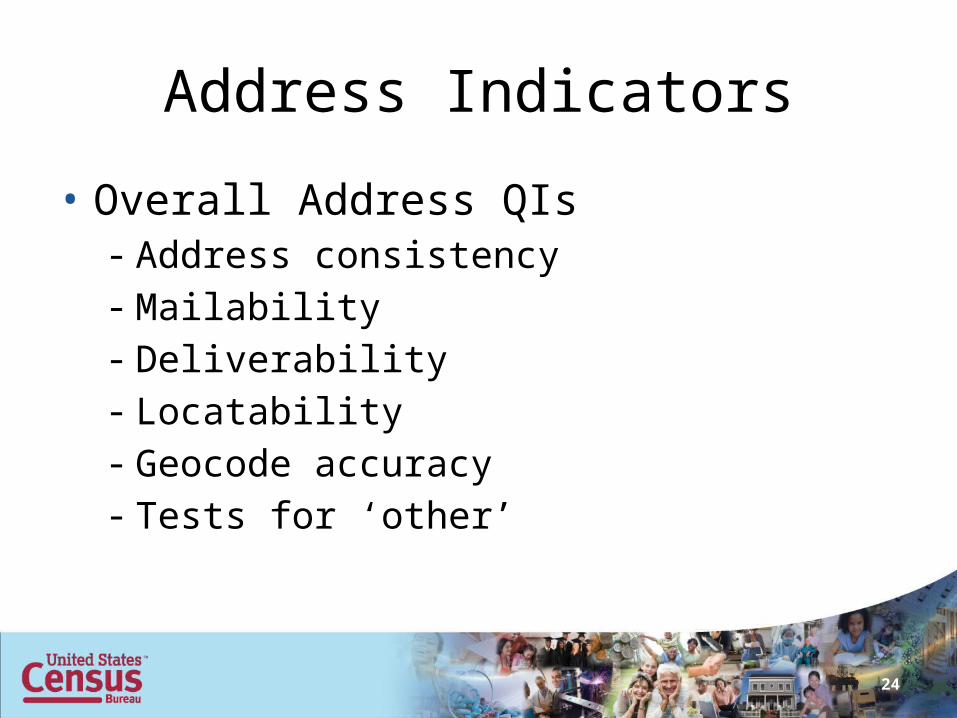
Address Indicators
• Overall Address QIs- Address consistency- Mailability- Deliverability- Locatability- Geocode accuracy- Tests for ‘other’
24
Feature Indicators
• Overall Feature QIs- Spatial accuracy- Feature naming- Address ranges- Feature classification
25
Geographic Area Indicators
• For each Geographic Area, four major tests or sub-indicators- Local review/approval of areas- Regional review/approval of areas- Program review/approval of areas- Independent subject matter review/approval
of areas
26
Geographic Area Indicators
• Additional tests for statistical criteria, attributes, type of submission, contiguity, etc…
• Also tests for geographic interaction (slivers), and block size and shape
27
Geocode Indicators
• Combines specific sub-indicators from each other category- Locatability and geocode accuracy (Address)- Spatial accuracy & address ranges (Feature)- Block size & shape (Geography)
28
Overall indicators & weighting
• Addresses, Features, Geographic Areas, and Geocodes QIs are then aggregated according to subject matter formulas
• Each census tract will receive a single overall score, and category scores where relevant
• History and tendency will be tracked
29
External sources
• Quality Indicators are MTDB only• In the future, external sources may also
help determine MTDB quality, such as:- Population estimates- Building permits (new development)- Comparison to Imagery
• Additional tests to check for completeness of MTDB (omission/commission)
30
Tract profiles
• Additional ability to adjust Quality Indicators based upon profile elements of the tract, such as:- Natural disaster- Unique address types- Rapidly changing development- Special land use areas
31
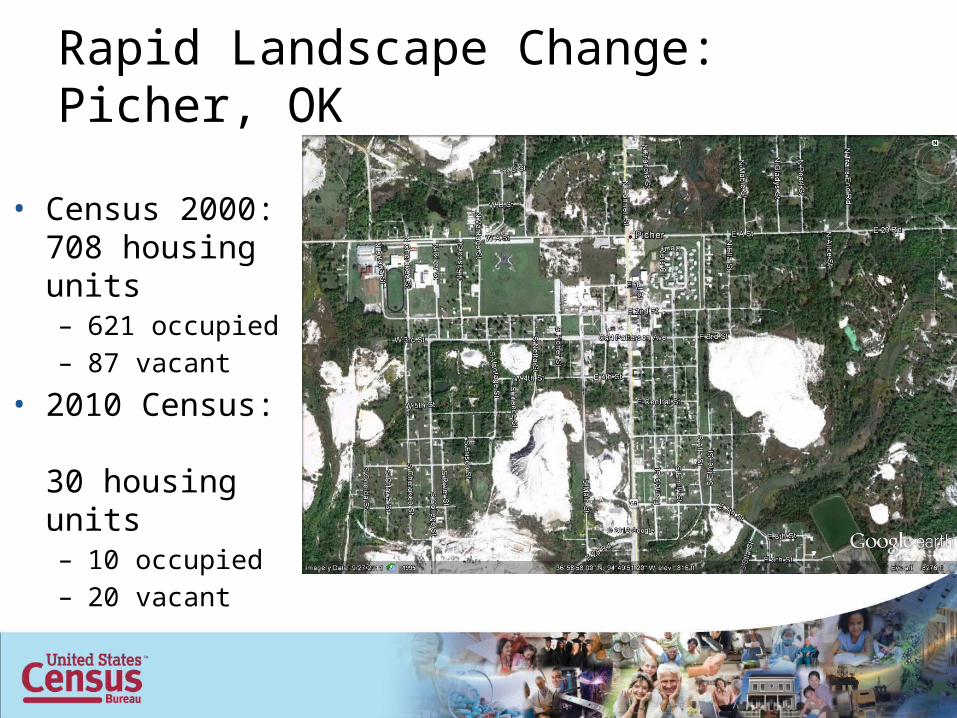
Rapid Landscape Change: Picher, OK
• Census 2000: 708 housing units– 621 occupied– 87 vacant
• 2010 Census: 30 housing units – 10 occupied– 20 vacant
The Result
• All census tracts will be tested and ranked• Work and updates can then be targeted to
specific areas most in need of update- Prioritization of internal work- Prioritization of partner contact and file
ingestion- Improved resource allocation
33
Project Scope:
The project evaluated the spatial accuracy of new road edges added to the MAF/TIGER database (MTDB) by 2010 Decennial Update Operations.
The Decennial Operations in the Study:• Address Canvassing• Update Leave• Update Enumerate• Enumeration at Transitory Locations• Group Quarters Enumeration• Group Quarters Validation
2010 Road Update Operations Evaluation
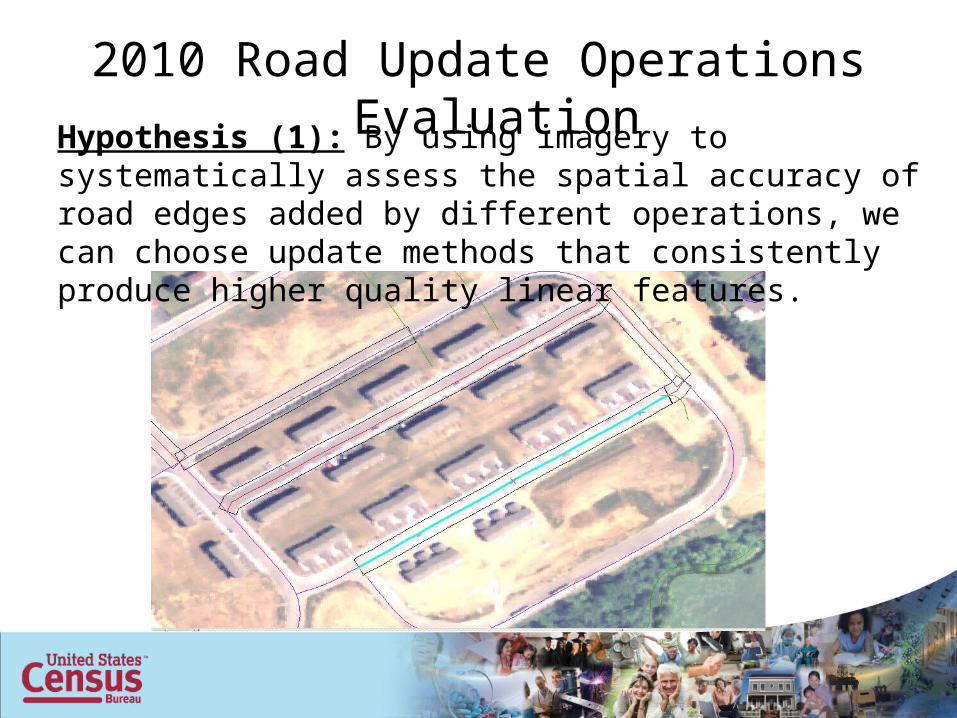
2010 Road Update Operations Evaluation
Hypothesis (1): By using imagery to systematically assess the spatial accuracy of road edges added by different operations, we can choose update methods that consistently produce higher quality linear features.
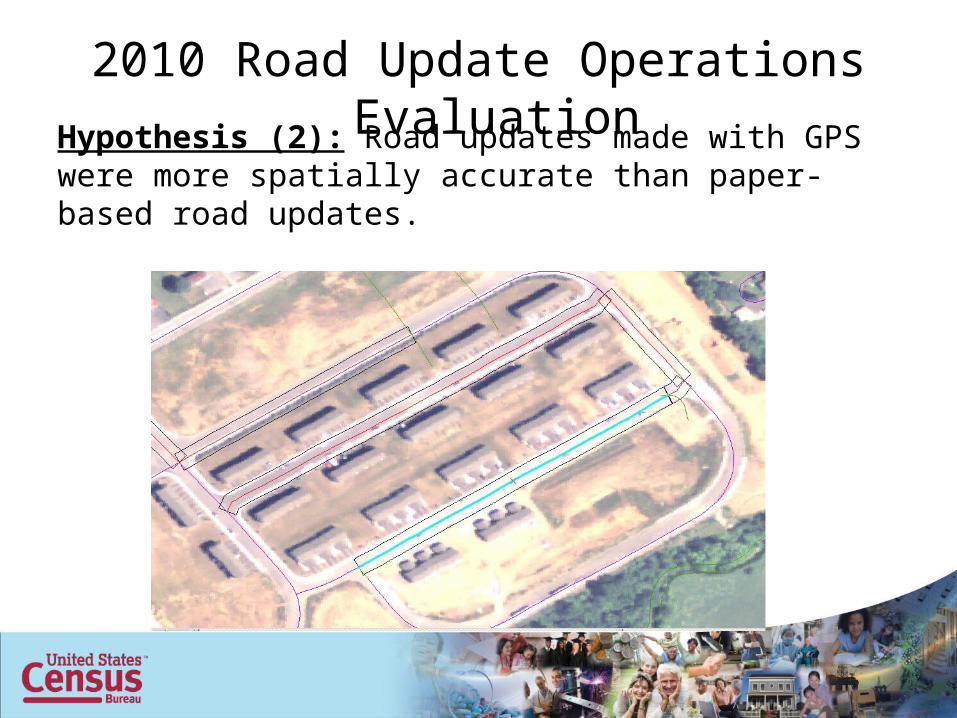
2010 Road Update Operations Evaluation
Hypothesis (2): Road updates made with GPS were more spatially accurate than paper-based road updates.
2010 Road Update Operations Evaluation
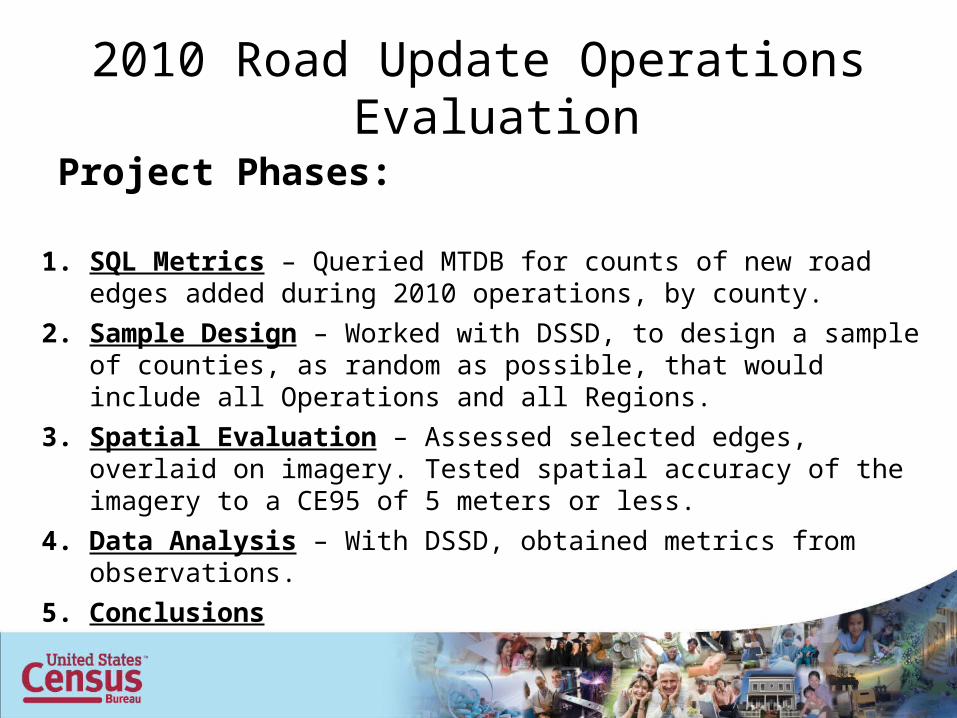
Project Phases:
1. SQL Metrics – Queried MTDB for counts of new road edges added during 2010 operations, by county.
2. Sample Design – Worked with DSSD, to design a sample of counties, as random as possible, that would include all Operations and all Regions.
3. Spatial Evaluation – Assessed selected edges, overlaid on imagery. Tested spatial accuracy of the imagery to a CE95 of 5 meters or less.
4. Data Analysis – With DSSD, obtained metrics from observations.
5. Conclusions
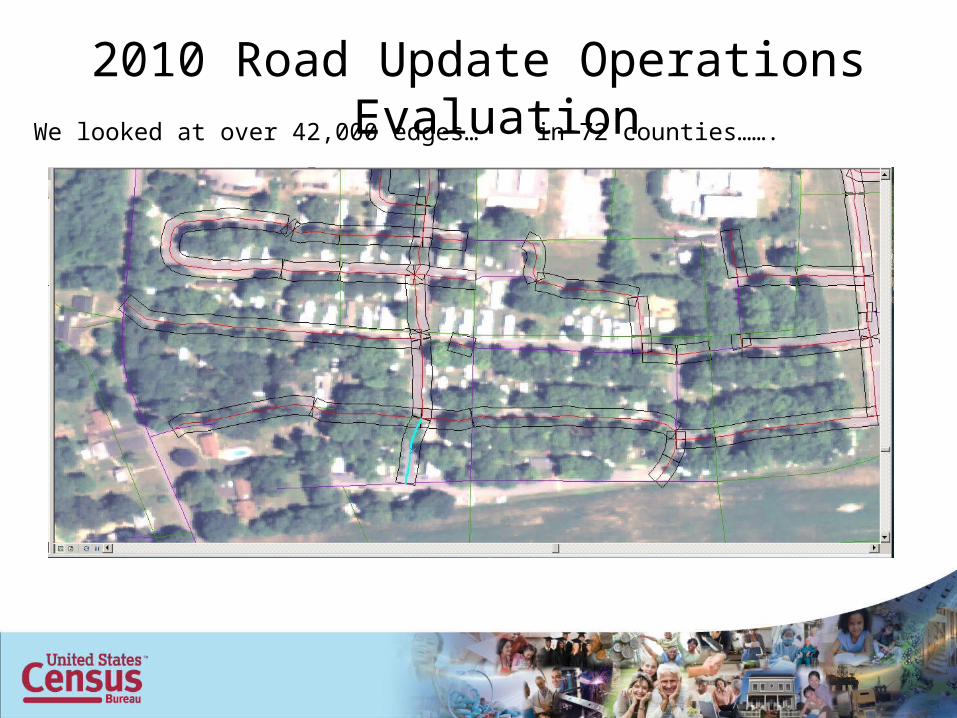
2010 Road Update Operations EvaluationWe looked at over 42,000 edges… in 72 counties…….
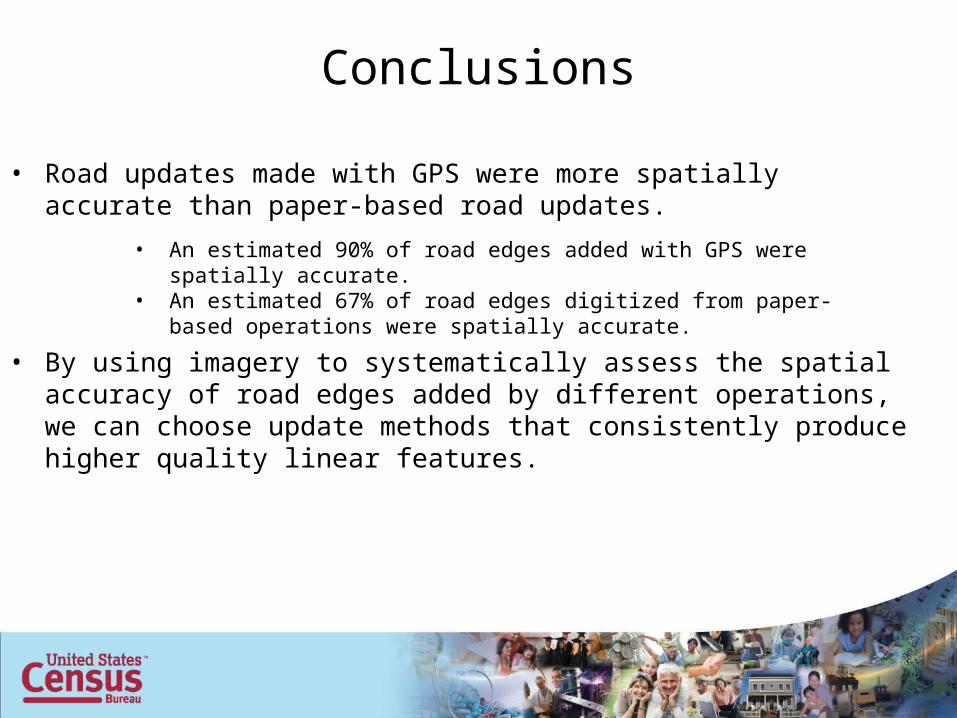
• An estimated 90% of road edges added with GPS were spatially accurate. • An estimated 67% of road edges digitized from paper-based operations were
spatially accurate.
Conclusions
• Road updates made with GPS were more spatially accurate than paper-based road updates.
• By using imagery to systematically assess the spatial accuracy of road edges added by different operations, we can choose update methods that consistently produce higher quality linear features.

Suggestions for Further Study
• Find other ways to glean what contributes to spatial quality using the data obtained in this review.
• Are edges with SMIDs (Spatial Metadata IDs) more likely to be spatially accurate than edges without SMIDs?
• Are roads that were named more likely to be spatially accurate than those not named?
• Why was the incidence of roads with no name information 38%? Were road names not collected?
• Is there a correlation between the use of NAIP imagery and the number of edges not visible in the imagery because NAIP is collected leaf-on?
• Is it possible to operationalize or automate this review so that it may be applied at a larger scale?
• What other operations that add linear features would benefit from the use of imagery for quality control?
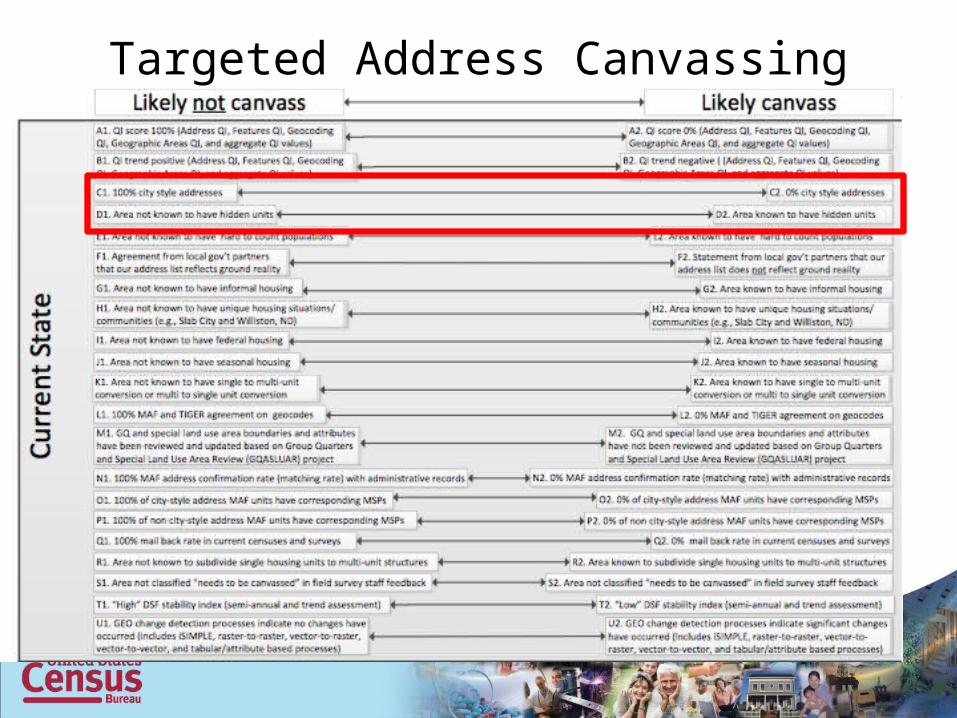
Targeted Address Canvassing Continuum
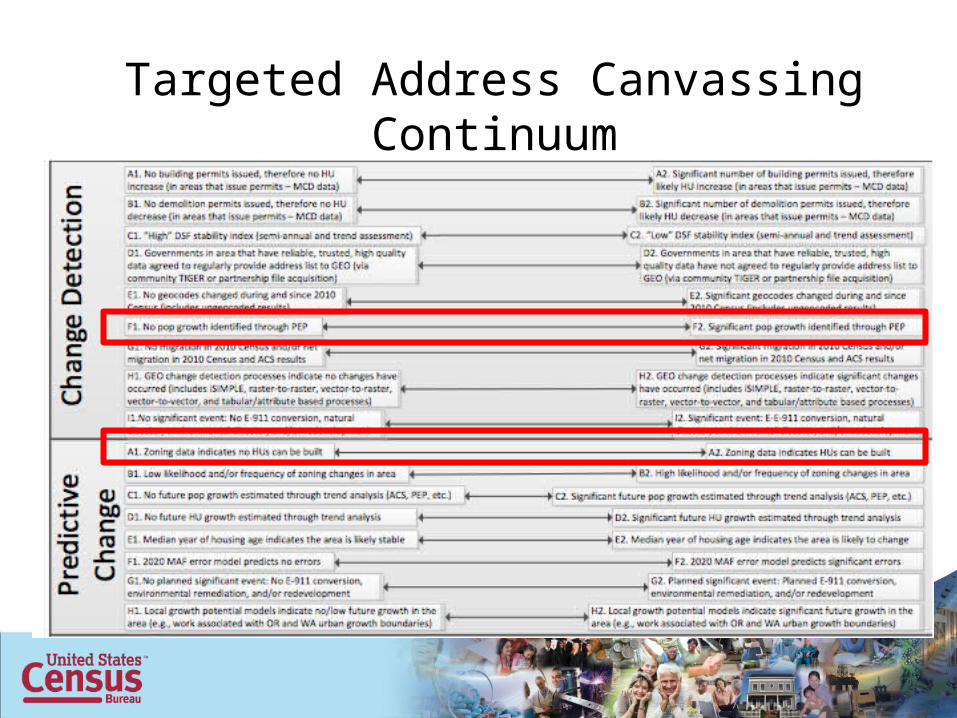
Targeted Address Canvassing Continuum
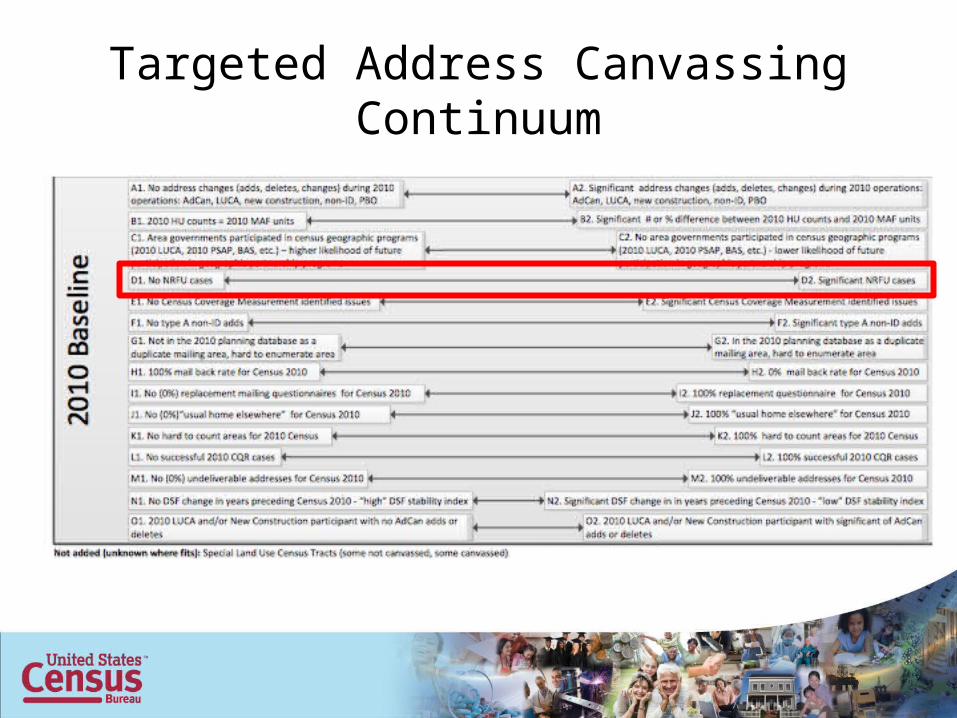
Targeted Address Canvassing Continuum
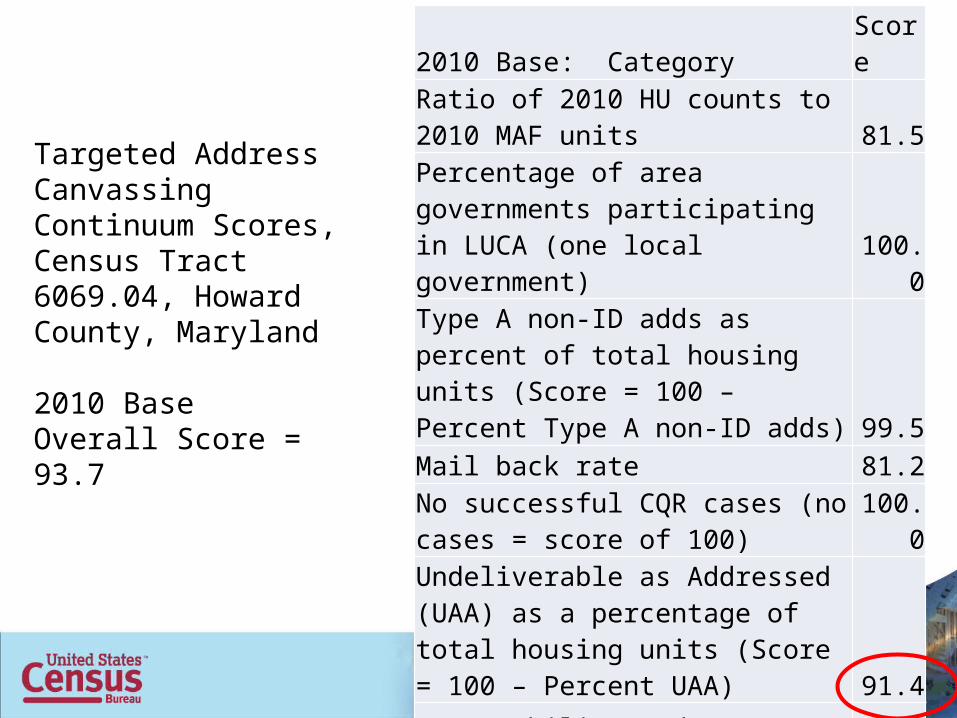
Targeted Address Canvassing Continuum Scores, Census Tract 6069.04, Howard County, Maryland
2010 BaseOverall Score = 93.7
2010 Base: Category ScoreRatio of 2010 HU counts to 2010 MAF units 81.5
Percentage of area governments participating in LUCA (one local government) 100.0
Type A non-ID adds as percent of total housing units (Score = 100 – Percent Type A non-ID adds) 99.5Mail back rate 81.2No successful CQR cases (no cases = score of 100) 100.0
Undeliverable as Addressed (UAA) as a percentage of total housing units (Score = 100 – Percent UAA) 91.4
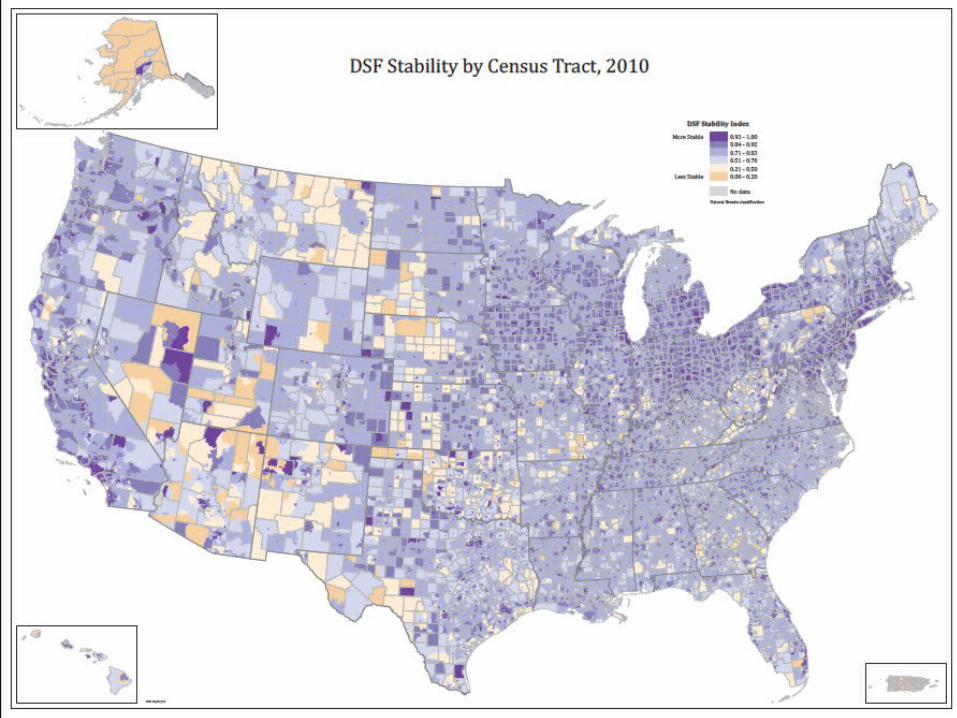
DSF Stability Index 97.3Ratio of Spring 2010 DSF to 2010 Census housing unit count 98.5
Total Points 749.4Overall Score 93.7
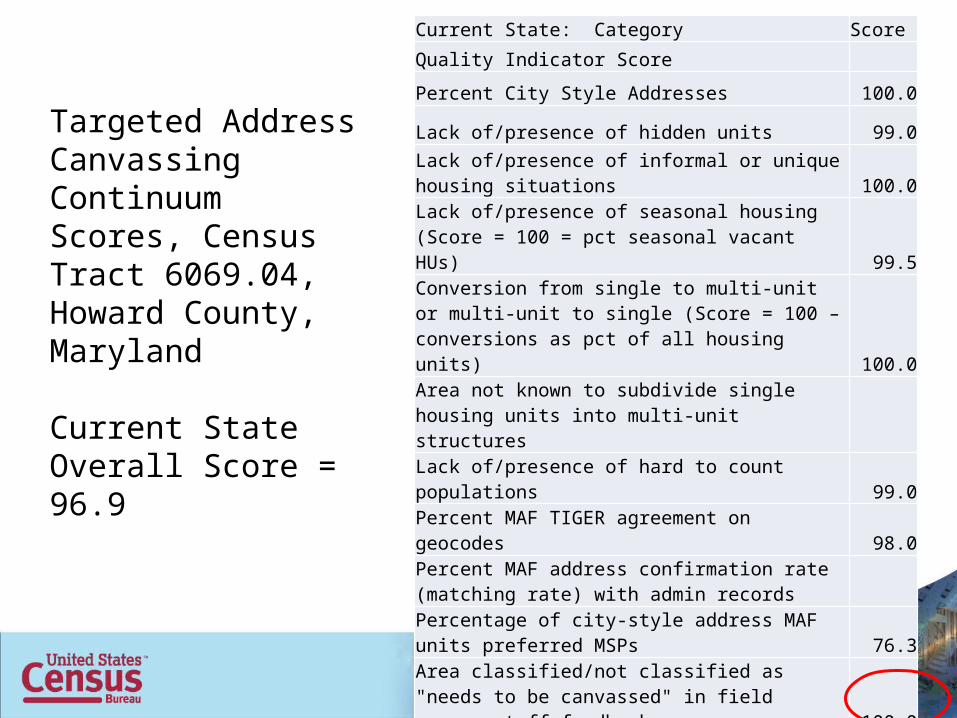
Targeted Address Canvassing Continuum Scores, Census Tract 6069.04, Howard County, Maryland
Current StateOverall Score = 96.9
Current State: Category Score
Quality Indicator Score
Percent City Style Addresses 100.0
Lack of/presence of hidden units 99.0
Lack of/presence of informal or unique housing situations 100.0
Lack of/presence of seasonal housing (Score = 100 = pct seasonal vacant HUs) 99.5
Conversion from single to multi-unit or multi-unit to single (Score = 100 – conversions as pct of all housing units) 100.0
Area not known to subdivide single housing units into multi-unit structures
Lack of/presence of hard to count populations 99.0
Percent MAF TIGER agreement on geocodes 98.0
Percent MAF address confirmation rate (matching rate) with admin records
Percentage of city-style address MAF units preferred MSPs 76.3
Area classified/not classified as "needs to be canvassed" in field survey staff feedback 100.0
DSF Stability Index 97.3
GEO Change detection processes indicate no changes have occurred
Overall Score 96.9
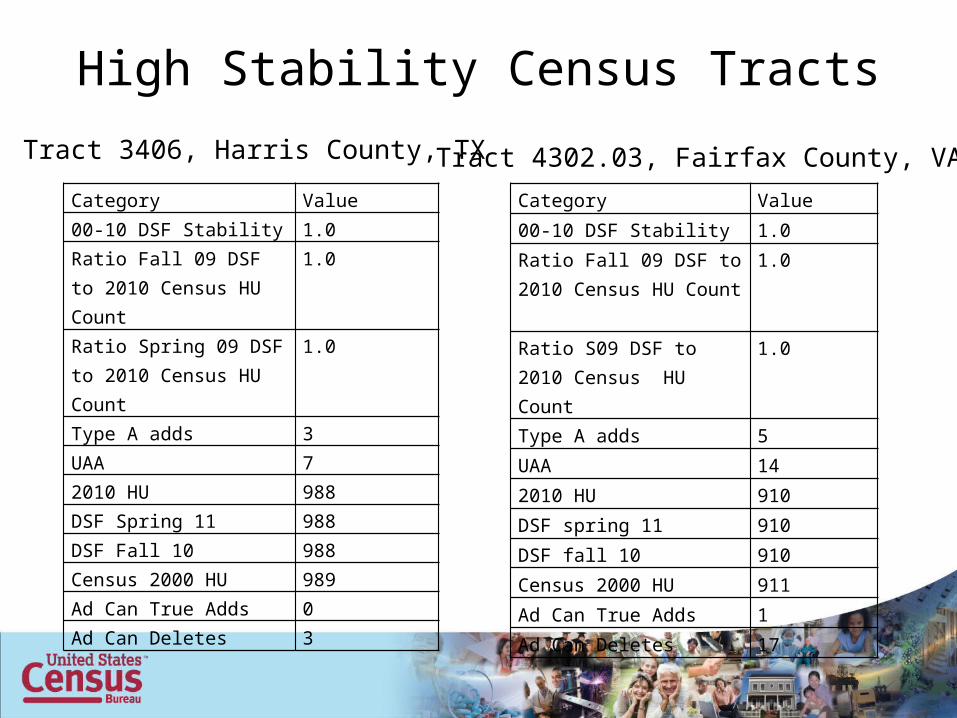
High Stability Census Tracts
Category Value
00-10 DSF Stability 1.0
Ratio Fall 09 DSF to 2010 Census HU Count
1.0
Ratio Spring 09 DSF to 2010 Census HU Count
1.0
Type A adds 3
UAA 7
2010 HU 988
DSF Spring 11 988
DSF Fall 10 988
Census 2000 HU 989
Ad Can True Adds 0
Ad Can Deletes 3
Category Value
00-10 DSF Stability 1.0
Ratio Fall 09 DSF to 2010 Census HU Count
1.0
Ratio S09 DSF to 2010 Census HU Count
1.0
Type A adds 5
UAA 14
2010 HU 910
DSF spring 11 910
DSF fall 10 910
Census 2000 HU 911
Ad Can True Adds 1
Ad Can Deletes 17
Tract 3406, Harris County, TX Tract 4302.03, Fairfax County, VA

• Questions?