Embed Size (px)
Citation preview
Pricing in Network Industries
by
Janice A. Hauge* and David E. M. Sappington**
* University of North Texas.
** University of Florida.
We are grateful to Sanford Berg, Tatiana Borisova, Marc Bourreau, Martin Cave, Pinar Dogan,
Lynne Holt, Ted Kury, and Mark Jamison for very helpful comments and assistance.
1
I. Introduction.
The design of pricing policies in network industries is a complex and challenging task,
particularly when industry conditions change constantly. The purpose of this chapter is to review
pricing policies that are commonly employed in two dynamic network industries –
telecommunications and electricity.1 We analyze important similarities and differences in pricing
policies in these two industries and explore how the policies in both industries have evolved over
time in response to changing industry conditions.
In principle, intense competition among industry suppliers might be relied upon to ensure
the delivery of high-quality services at low prices in the telecommunications and electricity
industries. In practice, though, such competition often is not available at every stage of the
production and delivery process in these industries. Massive network infrastructure typically is
required to produce and deliver electricity and basic telecommunications services. Consequently, it
is often prohibitively costly to have many suppliers operate at each stage of production. When
competitive pressures alone are insufficient to ensure the ubiquitous delivery of electricity and basic
telecommunications services at affordable prices, price regulation often is employed pursue this
objective.
The details of the price regulation that is implemented in practice vary across countries and
over time. We review key elements of recent pricing policies in selected jurisdictions as follows.
Section II describes the central features of the network infrastructure in the telecommunications and
electricity industries. Section III discusses three regulatory policies that are commonly employed in
both industries. Section IV reviews the predominant pricing policies in the telecommunications
industry. Section V presents a corresponding review of pricing policies in the electricity industry.
Section VI concludes with a comparison of the primary pricing policies in the telecommunications
and electricity industries.
II. Industry Configurations.
The most appropriate regulatory policy varies with the prevailing industry technology and
structure. Figure 1 summarizes the key elements of the network infrastructure in the
telecommunications industry.
1 See Byatt (1997), Garrido (2002), Wang et al. (2004), and Montginoul (2007), for example, for
complementary discussions of pricing policies in the water industry.
2
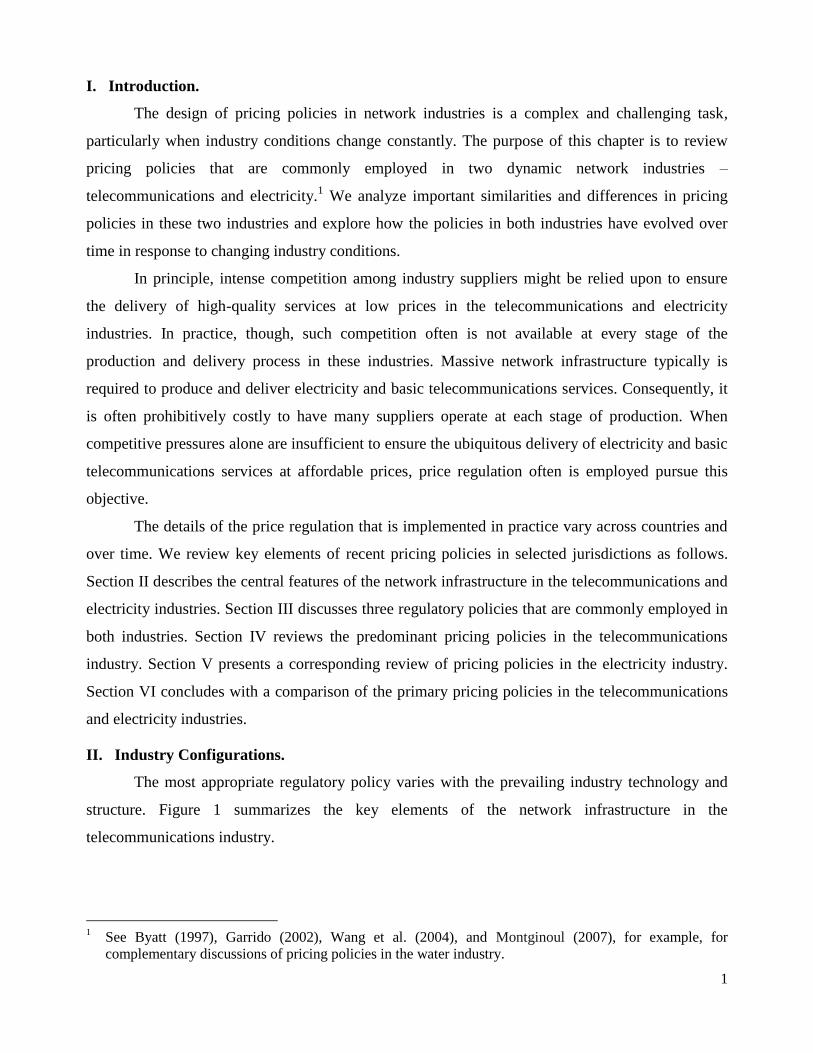
Figure 1. Network Structure in the Telecommunications Industry.
The simple telecommunications network illustrated in Figure 1 consists of two networks,
one operated by Provider 1 and the other operated by Provider 2. Customers C1 and C2 are served
directly by Provider 1. Customers C3 and C4 are served directly by Provider 2. Customers C1 and
C2 can communicate with each other using only Provider 1‟s network, just as customers C3 and C4
can communicate with each other using only Provider 2‟s network. However, if customer C1, say,
wishes to communicate with customer C3, then the call initiated by customer C1will be routed to
Provider 2‟s network by the switch (represented by the small shaded box) in Provider 1‟s network.
After traversing the facility (often a fiber optic cable) that connects the two networks, the call is
directed to customer C3 by the switch in Provider 2‟s network.
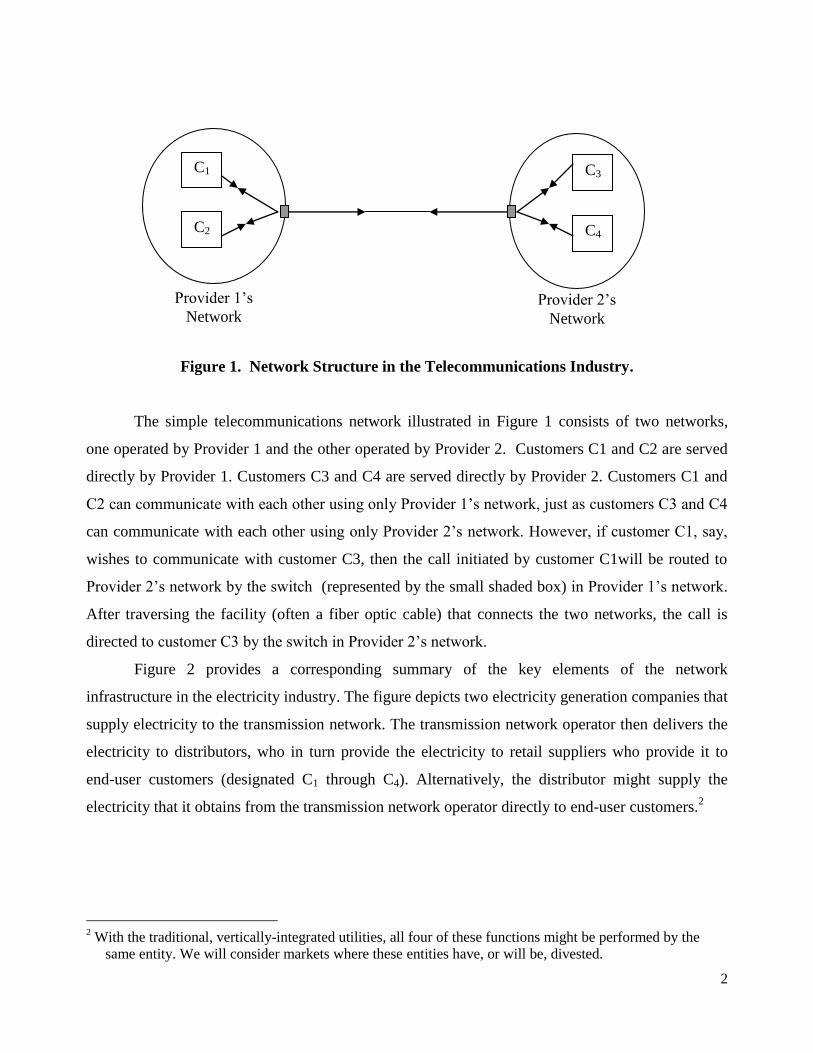
Figure 2 provides a corresponding summary of the key elements of the network
infrastructure in the electricity industry. The figure depicts two electricity generation companies that
supply electricity to the transmission network. The transmission network operator then delivers the
electricity to distributors, who in turn provide the electricity to retail suppliers who provide it to
end-user customers (designated C1 through C4). Alternatively, the distributor might supply the
electricity that it obtains from the transmission network operator directly to end-user customers.2
2 With the traditional, vertically-integrated utilities, all four of these functions might be performed by the
same entity. We will consider markets where these entities have, or will be, divested.
Provider 2‟s
Network
Provider 1‟s
Network
C1
C2
C3
C4
3
Figure 2. Network Structure in the Electricity Industry.
Figures 1 and 2 reveal that both the telecommunications and the electricity industries consist
of distinct facilities that are often owned and operated by different parties. If the
telecommunications and electricity networks are to operate effectively, the interactions among the
facilities that comprise the networks must be carefully coordinated. In some instances, market
forces can supply the necessary coordination. In other cases, regulation can be valuable in this
regard.
III. Regulatory Policies.
In settings where technological and cost considerations limit the number of firms that can
profitably compete in the industry, price regulation can be employed to substitute for the missing
discipline of competition.3 Regulation can, for example, implement prices that reflect prevailing
production costs, thereby limiting the extranormal profit4 of producers while providing appropriate
signals to consumers about the social costs of producing and delivering the regulated services.5
3 As Alfred Kahn (1970, p. 17) notes, “the single most widely accepted rule for the governance of regulated
industries is to regulate them in such a way as to produce the same result as would be produced by
effective competition, if it were feasible.”
4 Normal profit is the minimum amount of profit required to induce a supplier to operate in the industry on
an ongoing basis. Extranormal profit is profit in excess of normal profit.
5 Prices that reflect marginal costs of production can encourage consumers to make appropriate
consumption choices by requiring them to pay the incremental cost of providing the consumption in
question. However, in settings where unit production costs decline as output increases, production costs
exceed the revenue derived from marginal cost prices. Therefore, prices often must be increased above
marginal cost in order to ensure the viability of industry producers. Consumer surplus (the difference
between the value that consumers derive from their consumption of services and what they pay for the
Generator 1 Generator 2
Distributor 2‟s
Network
Distributor 1‟s
Network
C1
C2
C3
C4
Transmission
Network
Retail
Supplier
Retail
Supplier
4
Regulation also can help to attain distributional goals. For example, regulation may mandate
particularly low prices for consumers with limited income. Alternatively, regulation may require
similar prices for essential retail services throughout a broad geographic region, even though the
costs of serving consumers vary widely across the region.
Regulatory policy also can influence industry investment and industry cost structures.
Policies like rate of return (ROR) regulation can help industry suppliers to attract the capital that
they require for ongoing industry operation. Under ROR regulation, prices are set to generate
revenues that match the operating costs of the regulated supplier. These costs include investment
costs and a fair return on investment.6 One potential advantage of ROR regulation is that it can help
the regulated supplier to attract the capital it requires to build and maintain its infrastructure by
ensuring that the supplier will recover and secure a fair return on the requisite capital investment
costs. A potential disadvantage of ROR regulation is that it can limit the firm‟s incentive to reduce
its operating costs. When cost reductions trigger price reductions in order to equate revenues and
costs, the regulated firm anticipates little or no financial reward for reducing its operating costs.
In principle, price cap (PC) regulation can provide stronger incentives for cost reduction.
Under PC regulation, the prices the regulated firm is permitted to charge for its services are not
linked directly to its costs. Instead, authorized prices are linked to such other measures as an index
of prices elsewhere in the economy. A common form of PC regulation limits the rate at which the
prices charged by the regulated firm can increase, on average, to the economy-wide rate of (retail)
price inflation, less an offset. This offset, commonly referred to as the X factor, often is chosen to
generate a fair return on investment for the firm, if it operates efficiently.7 To illustrate, if the
economy-wide inflation rate is 2% and the X factor is 3%, then the regulated firm must reduce the
prices it charges for its regulated services, on average, by 1% annually. Because the specified X
factor typically is scheduled to remain in effect for several years (often four or five years), the
services) is maximized when prices are raised furthest above marginal cost on those services for which
consumer demand is least sensitive to variations in the price of the service (Baumol and Bradford, 1970).
6 A fair return on investment can be viewed as the minimum return required to attract capital on an ongoing
basis, given that the regulated firm is operating at minimum cost.
7 In practice, different X factors often are applied to different groups of the regulated firm‟s services. To
illustrate, price cap regulation was applied to four baskets of services in Germany between 2002 and
2004. These baskets and the corresponding X factors were: network access services (X = -1); local calls
(X = 5); long distance calls (X = 2); and international calls (X = 1) (OECD, 2004b, p. 20). By setting
distinct X factors for different baskets of services, a regulator can alter the average prices at which
different groups of services are sold, while allowing the regulated firm considerable discretion in setting
individual service prices.
5
actual earnings of the regulated firm can diverge significantly from expected earnings. While the
potential for such divergence can provide strong incentives for the firm to operate efficiently (in
order to reduce its operating costs and thereby increase its profit), it also can produce earnings that
are well above or well below expected levels. Extremely high earnings can be problematic for the
regulator and extremely low earnings can be problematic for the regulated firm (and perhaps for the
regulator as well).
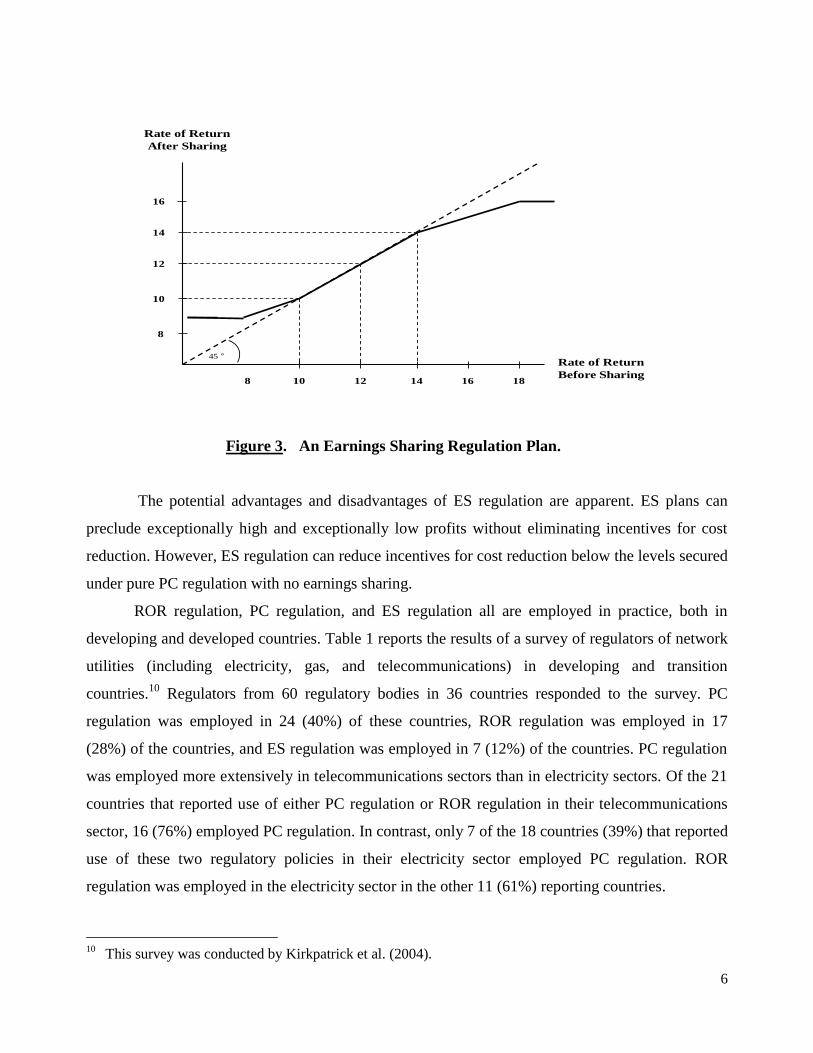
Earnings sharing regulation (sometimes called sliding scale regulation or profit sharing
regulation) can deliver substantial incentives for cost reduction while guarding against exceptionally
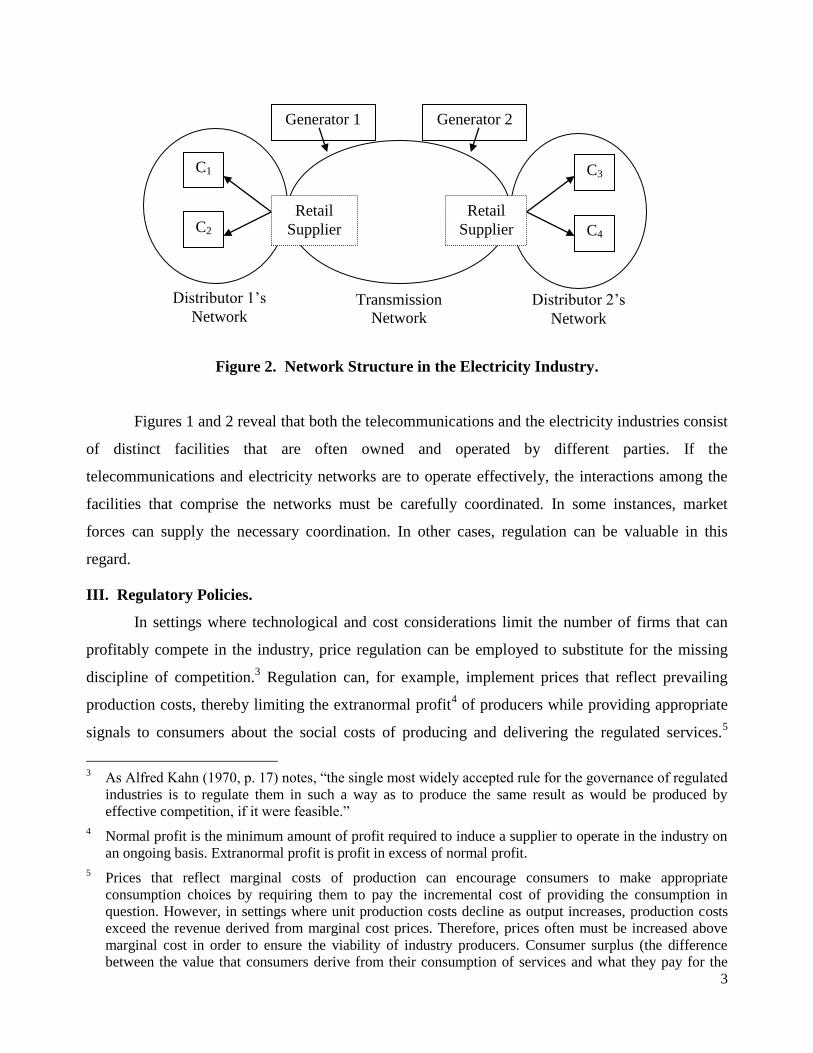
high and exceptionally low levels of earnings. Under a typical earnings sharing (ES) plan, a target
rate of return (e.g., 12% in Figure 3) is established for the regulated firm. A “no sharing” range of
earnings (e.g., earnings that generate rates of return between 10% and 14% in Figure 3) is
established around the target rate of return. The firm is authorized to keep all earnings that it secures
under the prevailing regulatory price structure within the no sharing range, and so ES regulation
functions much like PC regulation in this range.8 The two policies differ for higher or lower
earnings, however. Incremental earnings above and below the no sharing range of earnings are
shared with customers. This sharing can take the form of price reductions when earnings exceed the
upper bound of the no sharing range and price increases when earnings fall below the lower bound
of the range.9 Under the particular earnings sharing plan illustrated in Figure 3, the regulated firm
and its customers each receive one-half of incremental earnings when earnings are in the range that,
after sharing, secures rates of return between 9% and 10% and between 14% and 16%. This plan
also incorporates upper (16%) and lower (9%) bounds on the realized rate of return. Such bounds
are common in practice. Under the ES plan in Figure 3, all incremental earnings above the earnings
that provide a 16% return are awarded entirely to the firm‟s customers. Furthermore, if the firm
would secure less than a 9% return under the prevailing regulated price structure and earnings
sharing arrangement, the regulator would implement price increases to increase earnings to the level
of the specified lower bound on the rate of return (9%).
8 The prevailing prices might be dictated by a PC regulation plan, for example, so that prices might be
permitted to increase, on average, at the rate of inflation less an offset, as long as the resulting earnings
fall within the no sharing range of earnings.
9 Earnings above the upper bound of the no sharing range also can be shared with customers in the form of
direct cash payments or rebates on monthly bills. These earnings also can be employed to finance network
expansion (perhaps into regions that are relatively unprofitable to serve) or to finance network
modernization or other means of improving service quality.
6
12
14
8
10
10
8 1412 16
16
Rate of Return
Before Sharing
45
Rate of Return
After Sharing
18
Figure 3. An Earnings Sharing Regulation Plan.
The potential advantages and disadvantages of ES regulation are apparent. ES plans can
preclude exceptionally high and exceptionally low profits without eliminating incentives for cost
reduction. However, ES regulation can reduce incentives for cost reduction below the levels secured
under pure PC regulation with no earnings sharing.
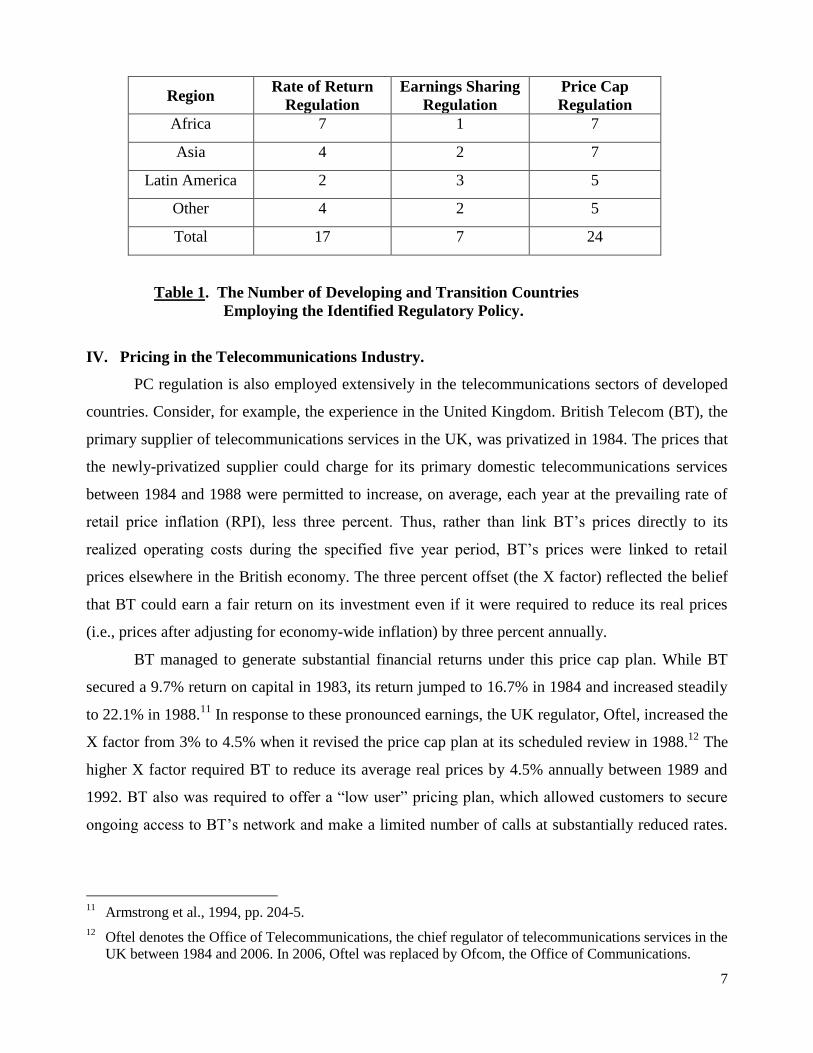
ROR regulation, PC regulation, and ES regulation all are employed in practice, both in
developing and developed countries. Table 1 reports the results of a survey of regulators of network
utilities (including electricity, gas, and telecommunications) in developing and transition
countries.10
Regulators from 60 regulatory bodies in 36 countries responded to the survey. PC
regulation was employed in 24 (40%) of these countries, ROR regulation was employed in 17
(28%) of the countries, and ES regulation was employed in 7 (12%) of the countries. PC regulation
was employed more extensively in telecommunications sectors than in electricity sectors. Of the 21
countries that reported use of either PC regulation or ROR regulation in their telecommunications
sector, 16 (76%) employed PC regulation. In contrast, only 7 of the 18 countries (39%) that reported
use of these two regulatory policies in their electricity sector employed PC regulation. ROR
regulation was employed in the electricity sector in the other 11 (61%) reporting countries.
10
This survey was conducted by Kirkpatrick et al. (2004).
7
Region Rate of Return
Regulation
Earnings Sharing
Regulation
Price Cap
Regulation
Africa 7 1 7
Asia 4 2 7
Latin America 2 3 5
Other 4 2 5
Total 17 7 24
Table 1. The Number of Developing and Transition Countries
Employing the Identified Regulatory Policy.
IV. Pricing in the Telecommunications Industry.
PC regulation is also employed extensively in the telecommunications sectors of developed
countries. Consider, for example, the experience in the United Kingdom. British Telecom (BT), the
primary supplier of telecommunications services in the UK, was privatized in 1984. The prices that
the newly-privatized supplier could charge for its primary domestic telecommunications services
between 1984 and 1988 were permitted to increase, on average, each year at the prevailing rate of
retail price inflation (RPI), less three percent. Thus, rather than link BT‟s prices directly to its
realized operating costs during the specified five year period, BT‟s prices were linked to retail
prices elsewhere in the British economy. The three percent offset (the X factor) reflected the belief
that BT could earn a fair return on its investment even if it were required to reduce its real prices
(i.e., prices after adjusting for economy-wide inflation) by three percent annually.
BT managed to generate substantial financial returns under this price cap plan. While BT
secured a 9.7% return on capital in 1983, its return jumped to 16.7% in 1984 and increased steadily
to 22.1% in 1988.11
In response to these pronounced earnings, the UK regulator, Oftel, increased the
X factor from 3% to 4.5% when it revised the price cap plan at its scheduled review in 1988.12
The
higher X factor required BT to reduce its average real prices by 4.5% annually between 1989 and
1992. BT also was required to offer a “low user” pricing plan, which allowed customers to secure
ongoing access to BT‟s network and make a limited number of calls at substantially reduced rates.
11
Armstrong et al., 1994, pp. 204-5.
12 Oftel denotes the Office of Telecommunications, the chief regulator of telecommunications services in the
UK between 1984 and 2006. In 2006, Oftel was replaced by Ofcom, the Office of Communications.
8
The low user plan thereby provided extra price protection for retail customers who, perhaps due to
limited income, made limited use of BT‟s network.
Despite the higher X factor and the mandated low user plan, BT continued to secure
substantial earnings (approximately 22% return on capital) during the second phase of the price cap
plan. In part due to these high earnings and in conjunction with an expansion of the basket of
regulated services, Oftel increased the X factor again in 1991, from 4.5% to 6.25%.13
This increase
was imposed as an interim correction before the comprehensive review of the price cap plan that
was scheduled for 1992. To the extent that this unscheduled revision of the plan linked the prices
that BT was allowed to charge to its realized costs rather than solely to the prevailing inflation rate,
the revision may have undermined BT‟s long-term incentives for efficient operation by
demonstrating the limits of regulatory tolerance for high levels of earnings.
At the scheduled review of the price cap plan in 1992, Oftel increased the X factor once
again, from 6.25% to 7.5%. Thus, for the four year period between 1993 and 1996, BT was required
to reduce its real prices by 7.5% on average. BT also was required to reduce by approximately 32%
(from £153 to £99) the one-time charge it imposed on customers for a new connection to the
network. In addition, BT‟s ability to increase the prices of individual services was restricted. BT
was not permitted to increase the real price of residential and single-line business basic access (i.e.,
line rental) service by more than 2% annually.14
BT also was prohibited from increasing the real
price of any other regulated service.
These relatively stringent requirements along with increasing industry competition served to
reduce BT‟s earnings. To illustrate, BT‟s return on capital declined from 21.0% in 1992 to 14.6% in
1993. In part because of these reduced earnings, the X factor was reduced from 7.5% to 4.5%
during the fourth phase of the price cap plan (1997 – 2002). During the fifth phase of the plan (2002
– 2006), Oftel implemented a “safeguard cap” under which the X factor was set equal to the
prevailing RPI. Consequently, the average real price of BT‟s regulated services was not permitted to
increase during the fifth phase of the plan.15
By this time, BT also was required to sell basic
13
International calls were added to the basket of BT‟s regulated services in 1991. The prices of international
calls were declining at this time due to increasing competition from other suppliers. The declining prices
of international calls made it easier for BT to comply with its new mandate to reduce real prices, on
average, by 6.25% annually.
14 This restriction also had been imposed during the second phase of the price cap plan, from 1989 – 1992.
15 The annual rate of retail price inflation varied between 1.7% and 3.0% during this period (National
Statistics Online, 2007).
9
network services to its competitors at regulated prices, thereby enhancing the ability of competitors
to impose meaningful discipline on BT.
In July of 2006, Ofcom (Oftel‟s successor) decided that competitive pressures had increased
to the point that most price controls for BT‟s retail services were no longer necessary.
Consequently, Ofcom ended price cap regulation of BT‟s services. BT was required to continue to
offer an affordable low user plan. BT also was required to offer uniform prices for many retail
services throughout most of the country. Thus, in 2006, Ofcom substituted non-discrimination
requirements and limited, targeted price controls on a key retail service for the extensive price
controls that had been imposed during the preceding twenty-two year period.
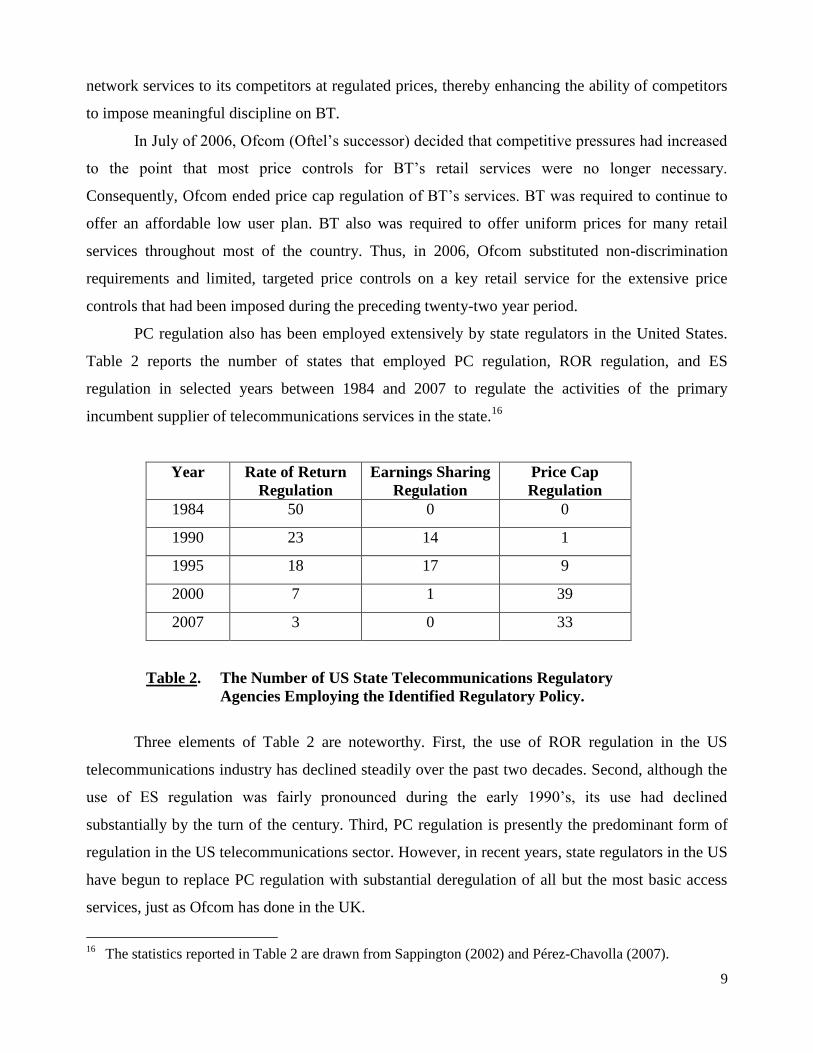
PC regulation also has been employed extensively by state regulators in the United States.
Table 2 reports the number of states that employed PC regulation, ROR regulation, and ES
regulation in selected years between 1984 and 2007 to regulate the activities of the primary
incumbent supplier of telecommunications services in the state.16
Year Rate of Return
Regulation
Earnings Sharing
Regulation
Price Cap
Regulation
1984 50 0 0
1990 23 14 1
1995 18 17 9
2000 7 1 39
2007 3 0 33
Table 2. The Number of US State Telecommunications Regulatory
Agencies Employing the Identified Regulatory Policy.
Three elements of Table 2 are noteworthy. First, the use of ROR regulation in the US
telecommunications industry has declined steadily over the past two decades. Second, although the
use of ES regulation was fairly pronounced during the early 1990‟s, its use had declined
substantially by the turn of the century. Third, PC regulation is presently the predominant form of
regulation in the US telecommunications sector. However, in recent years, state regulators in the US
have begun to replace PC regulation with substantial deregulation of all but the most basic access
services, just as Ofcom has done in the UK.
16
The statistics reported in Table 2 are drawn from Sappington (2002) and Pérez-Chavolla (2007).
10
The changes in regulatory policy depicted in Table 2 likely reflect the following
considerations. Prior to 1984, most telecommunications services were supplied throughout the fifty
states in the US by a single entity, AT&T. In 1984, AT&T was severed into eight independent
entities: a supplier of primarily long distance (interstate and international) services and seven
suppliers of primarily local (intrastate) services. This pronounced structural change in the industry
created substantial uncertainty about the capabilities of the seven new suppliers of local services,
known as the Regional Bell Operating Companies (RBOCs). This uncertainty made it difficult for
state regulators to specify a long-term price structure that would ensure an ongoing fair return on
investment for the RBOCs. Consequently, regulators initially implemented ROR regulation, which
allows prices to be adjusted on a regular basis to match realized operating costs.
The rate hearings that are employed to adjust prices under ROR regulation often are costly,
contentious, and time consuming, in part due to the need to measure regulated earnings. Regulated
earnings can be particularly difficult to measure accurately when the regulated firm operates in both
regulated and unregulated sectors of the economy.17
In part to limit costly regulatory hearings,
regulators sought alternatives to ROR regulation in the late 1980s and early 1990s to ensure that
consumers could benefit in a timely manner from the cost reductions the RBOCs were experiencing.
These cost reductions stemmed primarily from the declining prices of computers that are employed
extensively throughout modern telecommunications networks. ES regulation provided a convenient
and timely means to share the benefits of these input price reductions with consumers automatically
while avoiding exceptionally high or exceptionally low levels of earnings.
Over time, as state regulators acquired a better understanding of the RBOCs‟ capabilities,
the regulators began to adopt PC regulation. As noted above, PC regulation provides stronger
incentives for cost reduction than does ES regulation. Also, because PC regulation does not require
the formal measurement of regulated earnings, it can be less costly to implement than ROR.
Consequently, as uncertainty about likely earnings diminished and as RBOC operations in
unregulated sectors increased, state regulators turned increasingly toward PC regulation.
17
When a firm operates in both regulated and unregulated sectors and when its earnings in the regulated
sector are explicitly limited, the firm will have an incentive to overstate the costs it incurs supplying
regulated services, perhaps by understating the costs it incurs supplying unregulated services.
Overstatement of regulated costs can reduce measured earnings from regulated operations and thereby
promote the conclusion that prevailing earnings do not exceed the stipulated ceiling on earnings (e.g.,
Braeutigam and Panzar, 1993).
11
Competitive forces have intensified in the telecommunications industry in recent years.18
The increased competition has enabled regulators to rely more on market forces and less on
regulatory rules to discipline incumbent suppliers of telecommunications services. It is becoming
increasingly common for state regulators to regulate only the price of basic access service, and to
allow market forces to determine the prices of other retail telecommunications services. In several
states (as in the UK), even the price of basic access service is no longer regulated.19
Adapting Regulation to the Level of Competition
PC regulation can be designed to automatically focus regulatory protection on those
consumers who receive the least protection from market competition (e.g., small residential
customers) while limiting the impact of regulation on consumers who enjoy the benefits of
substantial industry competition (e.g., large industrial customers). PC regulation can do so simply
by adjusting the manner in which average price changes are calculated.
Recall that PC regulation restricts the rate at which regulated prices can increase, on
average. The average price change can be calculated in different ways. When the price change is
calculated to weight most heavily the changes that primarily affect customers with few competitive
alternatives, regulatory protection can be automatically focused on those customers.
In practice, “large” customers, i.e., those who purchase substantial quantities of regulated
products, often are relatively profitable to serve. Consequently, industry suppliers often compete
vigorously to serve these large customers. In contrast, “small” customers, i.e., those who purchase
relatively limited quantities of regulated services, often are not the focus of intense industry
competition. Thus, regulation that automatically adjusts to protect small customers as their
consumption patterns change often can focus regulatory protection on customers with the fewest
competitive alternatives.
To illustrate how regulatory protection can be so focused, consider the following simple
example. Suppose that a regulated firm sells two products (A and B) to five customers (numbered 1
through 5). Further suppose that the expenditures of the five customers on the two products are as
specified in Table 3.
18
The Telecommunications Act of 1996 (Pub. L. No. 104-104, 110 Stat. 56 (codified at 47 U.S.C. §§ 151 et
seq.)) opened nearly all US telecommunications markets to competition.
19 This is the case in Nebraska, for example. Basic local service rates were deregulated in 1987, when the
Nebraska Public Service Commission announced that it would only investigate proposed rate increases
for basic local service if these increases exceeded 10% in any year or if more than 2% of the telephone
company‟s customers signed a formal petition requesting regulatory intervention (Mueller, 1993).
12
Customer Customer Expenditure
on Product A
Customer Expenditure
on Product B
Total Expenditure
1 6 0 6
2 8 1 9
3 10 2 12
4 11 2 13
5 3 97 100
1 - 4 35 5 40
1 - 5 38 102 140
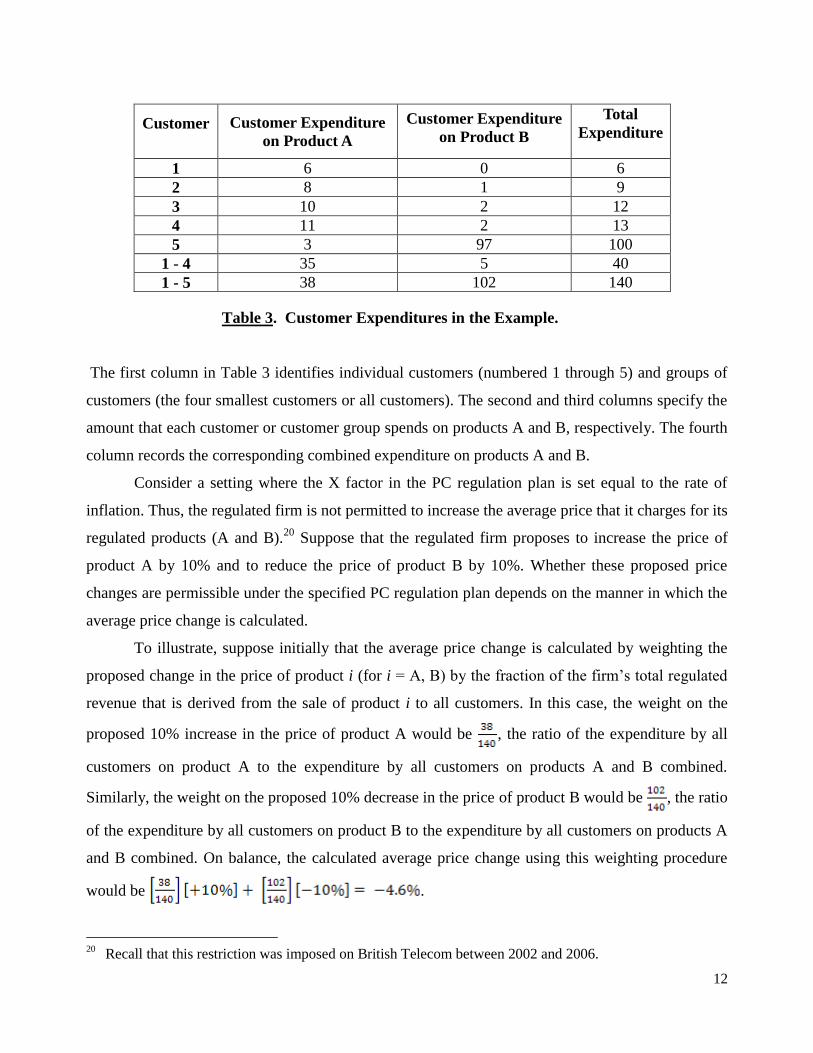
Table 3. Customer Expenditures in the Example.
The first column in Table 3 identifies individual customers (numbered 1 through 5) and groups of
customers (the four smallest customers or all customers). The second and third columns specify the
amount that each customer or customer group spends on products A and B, respectively. The fourth
column records the corresponding combined expenditure on products A and B.
Consider a setting where the X factor in the PC regulation plan is set equal to the rate of
inflation. Thus, the regulated firm is not permitted to increase the average price that it charges for its
regulated products (A and B).20
Suppose that the regulated firm proposes to increase the price of
product A by 10% and to reduce the price of product B by 10%. Whether these proposed price
changes are permissible under the specified PC regulation plan depends on the manner in which the
average price change is calculated.
To illustrate, suppose initially that the average price change is calculated by weighting the
proposed change in the price of product i (for i = A, B) by the fraction of the firm‟s total regulated
revenue that is derived from the sale of product i to all customers. In this case, the weight on the
proposed 10% increase in the price of product A would be , the ratio of the expenditure by all
customers on product A to the expenditure by all customers on products A and B combined.
Similarly, the weight on the proposed 10% decrease in the price of product B would be , the ratio
of the expenditure by all customers on product B to the expenditure by all customers on products A
and B combined. On balance, the calculated average price change using this weighting procedure
would be .
20
Recall that this restriction was imposed on British Telecom between 2002 and 2006.
13
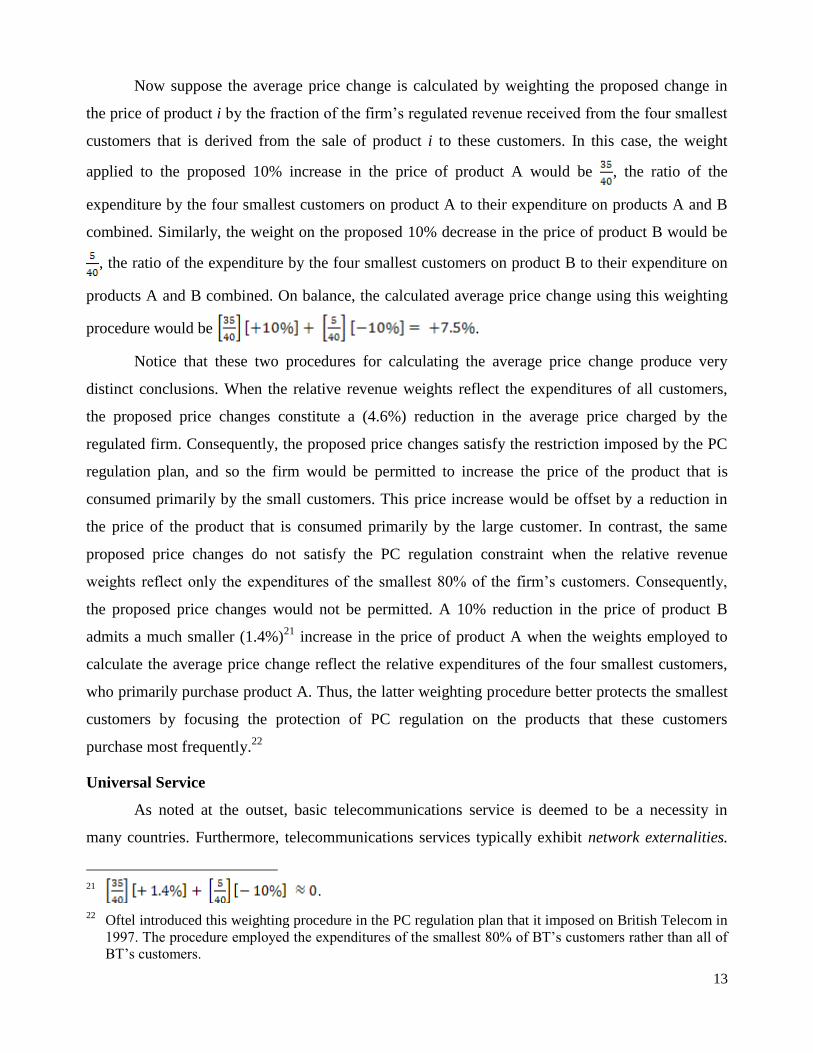
Now suppose the average price change is calculated by weighting the proposed change in
the price of product i by the fraction of the firm‟s regulated revenue received from the four smallest
customers that is derived from the sale of product i to these customers. In this case, the weight
applied to the proposed 10% increase in the price of product A would be , the ratio of the
expenditure by the four smallest customers on product A to their expenditure on products A and B
combined. Similarly, the weight on the proposed 10% decrease in the price of product B would be
, the ratio of the expenditure by the four smallest customers on product B to their expenditure on
products A and B combined. On balance, the calculated average price change using this weighting
procedure would be .
Notice that these two procedures for calculating the average price change produce very
distinct conclusions. When the relative revenue weights reflect the expenditures of all customers,
the proposed price changes constitute a (4.6%) reduction in the average price charged by the
regulated firm. Consequently, the proposed price changes satisfy the restriction imposed by the PC
regulation plan, and so the firm would be permitted to increase the price of the product that is
consumed primarily by the small customers. This price increase would be offset by a reduction in
the price of the product that is consumed primarily by the large customer. In contrast, the same
proposed price changes do not satisfy the PC regulation constraint when the relative revenue
weights reflect only the expenditures of the smallest 80% of the firm‟s customers. Consequently,
the proposed price changes would not be permitted. A 10% reduction in the price of product B
admits a much smaller (1.4%)21
increase in the price of product A when the weights employed to
calculate the average price change reflect the relative expenditures of the four smallest customers,
who primarily purchase product A. Thus, the latter weighting procedure better protects the smallest
customers by focusing the protection of PC regulation on the products that these customers
purchase most frequently.22
Universal Service
As noted at the outset, basic telecommunications service is deemed to be a necessity in
many countries. Furthermore, telecommunications services typically exhibit network externalities.
21
.
22 Oftel introduced this weighting procedure in the PC regulation plan that it imposed on British Telecom in
1997. The procedure employed the expenditures of the smallest 80% of BT‟s customers rather than all of
BT‟s customers.
14
In other words, the value that any one customer derives from access to a telecommunications
network increases as the number of other customers that can be reached on the network increases.
For both these reasons, many governments have implemented policies to promote universal service,
i.e., the widespread availability of telecommunications services at affordable prices. Universal
service policies can present important challenges, especially in countries where the unit cost of
supplying telecommunications service is substantially higher in some geographic regions than in
others.
The average cost of supplying telecommunications service to a customer often is higher in
sparsely populated, rural regions of a country than it is in densely populated urban regions.
Therefore, the goal of securing universal service can be particularly challenging in rural regions of a
country. Governments often respond to the challenge by requiring regulated incumbent suppliers to
make basic telecommunications services available on similar terms and conditions throughout their
operating territories. To illustrate, Telstra, the incumbent supplier of telecommunications services in
Australia, operates under such a requirement. “Telstra must offer basic line rental services to
residential and charity customers, in non-metropolitan areas, at the same or a lower price and on the
same price-related terms as it offers to residential and charity customers in metropolitan areas.”
Also, “Telstra must offer basic line rental services to business customers, in non-metropolitan areas,
at the same or a lower price and on the same price-related terms as it offers to business customers in
metropolitan areas.”23
Uniform price mandates of this sort can be readily implemented without jeopardizing the
financial integrity of an incumbent supplier when the supplier is a monopolist. A uniform price that
exceeds the unit cost of production in urban regions but is below the unit cost of production in rural
regions can be designed to generate a normal profit for a monopoly producer. The profit that a
monopolist secures in urban regions can be employed to offset the losses the supplier incurs in
supplying services at below-cost prices in rural regions. This balancing is more difficult to achieve
when the incumbent regulated supplier is not a monopolist. A requirement to serve all customers
(both rural and urban customers) at the same retail price can invite what is known as “cream
23
Telstra Carrier Charges – Price Control Arrangements, Notification and Disallowance Determination
No. 1 of 2005 (Amendment No. 1 of 2006), §19A(1),(2). In the United States, §254(b)(3) of the
Telecommunications Act of 1996 states that “Consumers in all regions of the Nation, including low-
income consumers and those in rural, insular, and high cost areas, should have access to
telecommunications and information services … that are reasonably comparable to those services
provided in urban regions and that are available at rates that are reasonably comparable to rates charged
for similar services in urban areas.”
15
skimming” by competing suppliers. Cream skimming arises when a competitor serves only the most
profitable customers, leaving the incumbent supplier to serve the less profitable customers.
When an incumbent supplier charges the same retail price for a service in both (low cost)
urban regions and (high cost) rural regions, competitors typically will find it profitable to serve the
urban regions where the incumbent‟s (uniform) price exceeds its unit cost of production. In contrast,
competitors will seldom find it profitable to serve the rural regions where the incumbent‟s uniform
price is below its unit cost of serving rural customers. Consequently, unfettered, intense competition
in the presence of a uniform retail price mandate can lead to situations in which competitors
primarily serve urban customers and the incumbent supplier is left to serve rural customers at
below-cost prices.
Taxes and subsidies often are employed to avoid such untenable situations. It is common,
for example, to require all suppliers of telecommunications services to contribute a fraction of the
revenues that they derive from retail sales to a universal service fund. This fund is then employed to
subsidize the operations of suppliers that serve customers in designated high-cost geographic
regions.24
In some countries, universal service also is promoted by subsidizing low-income
customers directly. The subsidies commonly take the form of discounted prices for the installation
of new telephone service and for ongoing basic access to the telecommunications network (e.g.,
Rosston and Wimmer, 2000; Nuechterlein and Weiser, 2005, chapter 10).
The Regulation of Wholesale Service Prices
While substantial competition has been developing among suppliers of retail
telecommunications services in many countries in recent years,25
competition in the supply of
wholesale telecommunications services typically is more limited.26
Ubiquitous network
infrastructure is very costly to provide, and so few firms have erected such infrastructure.27
24
In Germany, suppliers with less than a four percent share of the relevant market are not required to help
finance relevant universal service costs (OECD, 2004b, p. 36).
25 The extent to which wireless telecommunications services are a substitute for (and thus impose
competitive discipline on suppliers of) wireline telecommunications services is a matter of considerable
debate. Many customers purchase both wireline and wireless telecommunications services, although an
increasing number of customers are choosing to subscribe only to a supplier of wireless services.
26 Wholesale telecommunications services are services that other suppliers of telecommunications services
employ to serve their customers.
27 Some suppliers of cable television services have fairly ubiquitous network infrastructures that can be
employed to deliver traditional telephone service. The capabilities and geographic coverage of these
network infrastructures vary significantly across countries.
16
Increasing retail competition and limited wholesale competition have led regulators to shift their
focus from the regulation of retail prices to the regulation of access to the networks of incumbent
suppliers. This new focus reflects the belief that if multiple vibrant retail suppliers are afforded
access to essential wholesale services at low prices, then competition among the retail suppliers may
be sufficient to ensure that consumers enjoy high quality retail services at low prices.
The increased retail competition engendered by mandated access to the networks of
incumbent suppliers may provide substantial benefits to consumers. However, such access also
entails at least two potential drawbacks. First, by enabling vigorous competitors, such access can
reduce the earnings of incumbent suppliers and render these earnings less predictable. Mandated
access can thereby make it more difficult for incumbent suppliers to attract the capital they need to
maintain, expand, and enhance their networks.
Second, mandated access at low wholesale prices can limit the incentives of incumbent
suppliers to modernize and otherwise enhance their network infrastructure. If competitors are
afforded ready access to the expanded capabilities that arise from innovative investment by the
incumbent supplier, the incumbent may anticipate little financial return from such investment and
so refrain from the innovative activity.
Regulators have weighed these potential drawbacks of mandated access against the benefits
of more vibrant retail competition that such access can promote. In many jurisdictions, regulators
have decided that the benefits of access to existing network infrastructure outweigh the
corresponding costs, and so have mandated such access. This is the case, for example, in Australia,
France, Germany, the US, and the UK. Some regulators draw sharp distinctions between access to
existing infrastructure and access to new infrastructure. Incumbent suppliers often are required to
allow competitors to purchase at regulated prices wholesale services that employ traditional
technologies (e.g., copper loops). In contrast, incumbent suppliers often are not required to supply
to their retail competitors wholesale services that employ new technologies (e.g., fiber loops to the
premises of a customer).
Once a regulator has decided to require an incumbent operator to supply a key wholesale
service to its retail competitors, the regulator must specify the price at which the incumbent is
required to supply such access. A natural candidate for this price is the incumbent‟s realized cost of
supplying the access. Such a cost-based price offers at least two advantages. First, the price ensures
that the incumbent is reimbursed for the direct costs it incurs in delivering wholesale services to
competitors. Second, the price can help to induce retail competitors to make appropriate make-or-
17
buy decisions. When the regulated wholesale price reflects the incumbent‟s cost of supplying the
wholesale service, a retail competitor will minimize its operating costs if it: (i) purchases the
wholesale service from the incumbent supplier when the incumbent can produce the service at
lower cost than the retail competitor; and (ii) produces the wholesale service itself when it can do so
at lower cost than the incumbent. Thus, a cost-based access price can help to ensure that the service
is produced by the least cost supplier.28
Cost-based wholesale prices can entail at least two potential drawbacks, though. First, such
prices can provide incentives for the incumbent supplier to impede the operations of its retail
competitors. This is the case because, although a cost-based wholesale price compensates the
incumbent for its direct costs of producing the wholesale service, such a price does not compensate
the incumbent for the opportunity cost it incurs when it delivers the wholesale service to rivals. If
cost-based access to the incumbent‟s wholesale service reduces the rivals‟ costs and thereby renders
such rivals more formidable competitors, such access can reduce the profit that the incumbent
secures in the market place. This profit reduction can be viewed as an opportunity cost of supplying
the wholesale service to competitors. When the full unit cost (i.e., the sum of the direct unit cost and
the unit opportunity cost) of supplying a wholesale service exceeds the regulated price of the
service, an incumbent supplier can increase its profit by reducing its sales of the wholesale
service.29
In practice, an incumbent supplier might reduce the demand for a wholesale service by
reducing the quality of the service.30
Such quality diminution could be implemented by delaying the
delivery or reducing the reliability of the service, for example. In practice, telecommunications
28
The imposition of a uniform access price in all geographic regions that reflects the average cost of
supplying the relevant access service across the regions can help to limit cream skimming in a setting
where the incumbent is required to charge a uniform price for a key retail service. As the Organization for
Economic Co-operation and Development (OECD) reports, such geographic averaging is common in
regulated telecommunications sectors throughout the world. “Consistent with geographically-averaged
end-user prices, the regulated tariffs for unbundled local loops are usually geographically averaged. … In
fact … access prices are usually geographically averaged even in those countries which claim that they
are using a “cost-based” or “cost-oriented” approach to [pricing wholesale services] … Australia is one of
the few countries with geographically-averaged tariffs for end-users, but geographically de-averaged
prices for [local loops]” (OECD, 2004a, p. 135).
29 In part for this reason, some recommend access prices that reflect the efficient component pricing rule.
This rule requires a wholesale price to reflect the full costs of supplying the wholesale service. See
Baumol et al. (1997), for example.
30 An intentional reduction in the quality of wholesale services is often referred to as “sabotage.” See Mandy
(2000), for example.
18
regulators have implemented extensive monitoring programs in an attempt to identify and punish
such intentional reductions in the quality of wholesale services delivered to retail rivals.31
Second, wholesale prices that reflect the realized costs of supplying the wholesale services
provide little incentive for the incumbent supplier to reduce these costs. When a cost reduction
serves primarily to strengthen competitors by reducing the price that they pay for key inputs, an
incumbent supplier will have limited incentive to secure such a cost reduction.
In part to provide incentives for cost reduction, some regulators attempt to set wholesale
prices for key network services to reflect the costs the incumbent producer would incur in supplying
these services if it operated at minimum cost, using the best available technology.32
Under this
pricing procedure, regulators first estimate the minimum feasible cost of delivering the wholesale
service in question and then set the price for the wholesale service equal to this estimate of
minimum cost. By severing the link between the wholesale price and the incumbent‟s realized cost
of delivering the wholesale service, this procedure can provide the incumbent with some incentive
to reduce its costs of supplying wholesale services.
However, critics argue that, in practice, regulators do not have the information required to
formulate accurate assessments of the minimum possible cost of delivering key wholesale services.
Consequently, the prices that regulators set in practice may be unduly high or unduly low.33
Critics
also argue that even if regulators set prices for wholesale services at levels that accurately reflect the
minimum cost of supplying the services, such prices will inhibit facilities-based competition. If
retail competitors can always buy inputs from the incumbent producer at prices that reflect the
minimum possible cost of supplying the inputs, then the competitors will have little or no incentive
to produce the inputs themselves.34
Intercarrier Compensation Charges
As the number of facilities-based suppliers of telecommunications services increases, the
prices that these suppliers charge each other to terminate traffic on their networks become
increasingly important. To illustrate, a customer of network operator A may wish to call a customer
of network operator B. The call in question will originate on supplier A‟s network and terminate on
31
See Wood and Sappington (2004), for example.
32 This approach is employed in Australia, France, Germany, the US, and the UK, for example.
33 See Kahn et al. (1999), for example.
34 See Pindyck (2007), for example. Also see Rosston and Noll (2002) and Nuechterlein and Weiser (2005,
Appendix A) for discussions of the key issues in the debate about this pricing policy.
19
supplier B‟s network. Supplier B may charge supplier A for the termination service it provides in
completing the call. This charge affects supplier A‟s cost of serving its customers, and therefore
may affect the retail price that supplier A charges to its customers.
In some settings, suppliers may be able to negotiate intercarrier compensation charges in
the absence of any explicit regulation. This can be the case, for example, in a setting where two
network operators serve roughly the same number of customers in similar geographic regions and
where intra-network and inter-network traffic flows are similar on the two networks. In such a
setting, the network operators might agree to a “bill and keep” arrangement, whereby the carriers do
not charge each other for the origination and termination services that they supply to one another.35
In other settings, though, the carriers may not naturally set intercarrier compensation charges
that serve the best interests of retail customers. For example, if supplier A serves most of the
customers in a country while supplier B serves very few, supplier A might insist on a high charge to
terminate traffic on its large, and therefore presumably valuable, network. Such a high charge could
force supplier B to charge its customers a high price for telecommunications service, thereby
limiting the supplier‟s ability to compete effectively.36
Cost-based origination and termination charges are a natural candidate for regulated
intercarrier compensation charges. An input price that reflects the cost of supplying the input sends
appropriate signals to potential users of the input about the resource costs of employing the input. In
particular, when facing cost-based input prices, a potential user will find it most profitable to
employ the mix of inputs that minimizes the resource costs of producing its outputs.
However, cost-based intercarrier compensation charges can be problematic for at least three
reasons. First, input prices that reflect realized costs provide little incentive to minimize the cost of
supplying inputs. Second, actual costs often are difficult to measure accurately. The origination and
termination of calls each involve different functions (e.g., switching and transport) and different
35
See DeGraba (2003) and Nuechterlein and Weiser (2005, chapter 9), for example, for discussions of bill
and keep policies. Bill and keep is the essence of the peering arrangements that govern the interactions
between the large Internet backbone providers (Nuechterlein and Weiser, 2005, chapter 4).
36 Even symmetric suppliers might benefit from charging each other a high reciprocal fee to terminate
traffic. The high fee increases the cost that a supplier incurs when its customers make additional calls to
customers on other networks, and so can reduce the supplier‟s incentive to reduce the retail price that it
charges for calls. This reduced incentive, in turn, can lead to higher retail prices and lower levels of
consumer welfare, as Armstrong (1998) and Laffont et al. (1998a,b) demonstrate in a setting where
suppliers charge linear prices to their customers. Dessein (2003) shows that competing network operators
will not necessarily benefit from high reciprocal termination charges when they set nonlinear tariffs for
their retail services.
20
types of costs (including fixed (capacity) costs and variable costs). Furthermore, the cost of
originating or terminating a particular call varies with such factors as the point at which the call is
transferred from one network to the other and the distance the call travels on each network.37
Third, cost-based termination charges can erode valued revenue streams. Historically,
network operators in some countries have set termination charges well above cost in order to
generate a substantial portion of the revenue required to cover operating costs. Setting termination
charges at cost could reduce this source of revenue substantially. In principle, a network operator
could offset the reduced revenue from termination services with increased revenue from retail
services. However, a substantial increase in the prices that a network operator charges to its
subscribers could conflict with universal service objectives.
In practice, regulated intercarrier compensation charges often reflect an attempt to balance
cost principles and universal service concerns. In the US, for example, support has arisen for a
policy that reduces termination charges toward cost for large network operators while permitting
small, rural operators to set termination charges above cost (Rosenberg et al., 2006). Such
asymmetric termination charges allow the (high cost) small, rural network operators to recover a
substantial portion of their costs from the customers of other network operators (through the
termination charges collected from these other operators). Consequently, the rural operators can
ensure their financial viability while charging relatively low retail prices to their customers.
Intercarrier compensation policies that set different charges for different types of providers
or different technologies can invite strategic behavior. To illustrate, suppose a local network
operator charges a higher termination fee to an interexchange (long distance) carrier than to a local
network operator. To avoid paying the higher termination fee, the interexchange carrier might
attempt to establish itself as a local network operator, even if it is not an efficient supplier of local
network services and even if it does not supply all of the services that a local network operator
typically supplies. Similarly, an intercarrier compensation policy that sets lower termination charges
for certain types of traffic (e.g., voice over Internet protocol) can encourage carriers to find ways to
convert traffic to the form that enjoys the lower termination charge before delivering the traffic for
termination, even if such conversion increases operating costs (Nuechterlein and Weiser, 2005,
chapter 9). Intercarrier compensation policies that avoid such asymmetries can help to limit the
expenditure of socially unproductive resources that serve only to arbitrage regulatory rules.
37
A bill and keep policy avoids the practical difficulties associated with measuring costs accurately by not
requiring any intercarrier payment for the origination or termination of traffic.
21
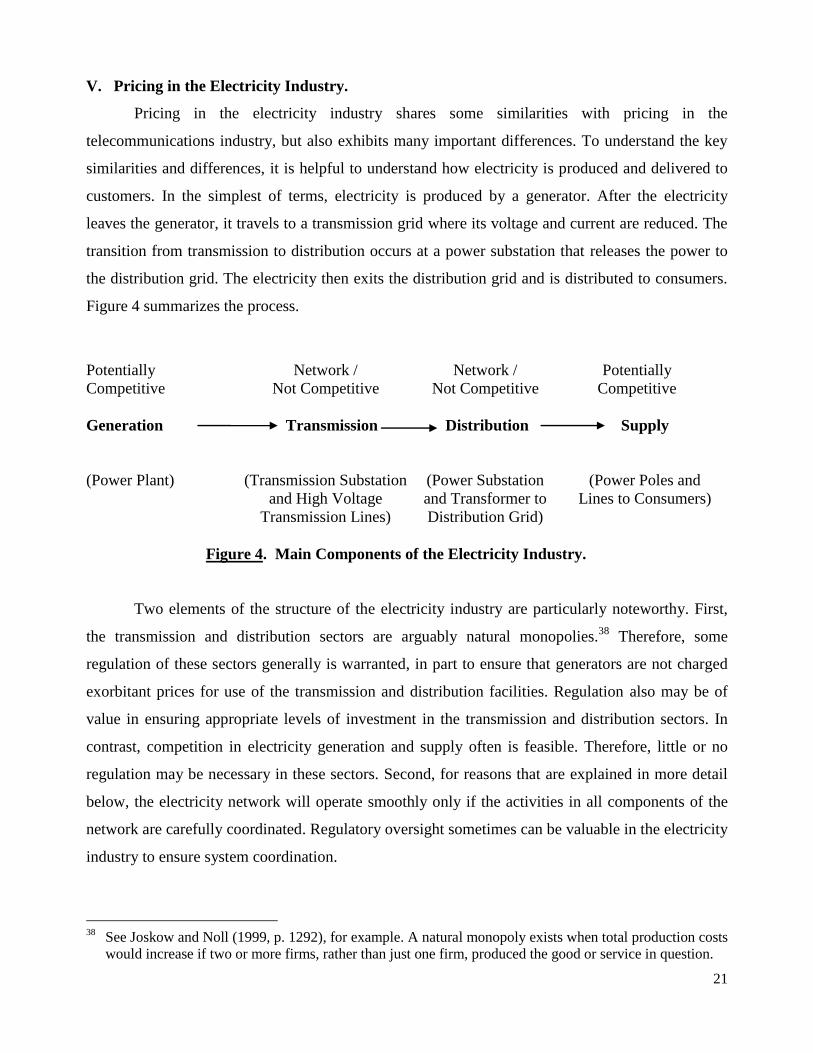
V. Pricing in the Electricity Industry.
Pricing in the electricity industry shares some similarities with pricing in the
telecommunications industry, but also exhibits many important differences. To understand the key
similarities and differences, it is helpful to understand how electricity is produced and delivered to
customers. In the simplest of terms, electricity is produced by a generator. After the electricity
leaves the generator, it travels to a transmission grid where its voltage and current are reduced. The
transition from transmission to distribution occurs at a power substation that releases the power to
the distribution grid. The electricity then exits the distribution grid and is distributed to consumers.
Figure 4 summarizes the process.
Potentially Network / Network / Potentially
Competitive Not Competitive Not Competitive Competitive
Generation Transmission Distribution Supply
(Power Plant) (Transmission Substation (Power Substation (Power Poles and
and High Voltage and Transformer to Lines to Consumers)
Transmission Lines) Distribution Grid)
Figure 4. Main Components of the Electricity Industry.
Two elements of the structure of the electricity industry are particularly noteworthy. First,
the transmission and distribution sectors are arguably natural monopolies.38
Therefore, some
regulation of these sectors generally is warranted, in part to ensure that generators are not charged
exorbitant prices for use of the transmission and distribution facilities. Regulation also may be of
value in ensuring appropriate levels of investment in the transmission and distribution sectors. In
contrast, competition in electricity generation and supply often is feasible. Therefore, little or no
regulation may be necessary in these sectors. Second, for reasons that are explained in more detail
below, the electricity network will operate smoothly only if the activities in all components of the
network are carefully coordinated. Regulatory oversight sometimes can be valuable in the electricity
industry to ensure system coordination.
38
See Joskow and Noll (1999, p. 1292), for example. A natural monopoly exists when total production costs
would increase if two or more firms, rather than just one firm, produced the good or service in question.

22
Pricing in Competitive Sectors
Because competition often is feasible in the generation sector, the compensation that
generators receive for the electricity that they generate frequently can be determined competitively,
rather than by direct regulation.39
Competition often takes the following form. Generators specify
the quantities of electricity that they are willing to supply at different prices. At the same time,
electricity buyers (generally suppliers and sometimes transmission or distribution companies)
specify the maximum amount that they are willing to pay for electricity. These supply and demand
“bids” for electricity are organized through a spot market (or “pool”), which is an auction market
that sets a price at regular time intervals (e.g., every half hour). The price set by the pool is the price
at which electricity demand and supply are balanced.40
In many cases, the party that administers the pool adds to the base price a capacity payment
that buyers who purchase electricity from the pool must pay. The capacity payment increases the
price that generators receive above the price established by the auction in the spot market. The
increased price increases the financial incentive for generators to supply electricity to the pool. The
initial auction price and the capacity payment together determine a pool purchase price. The pool
purchase price is the price that generators receive for the electricity that they supply to the pool.
The pool selling price often differs from the pool purchase price. The pool selling price is
the price that those purchasing electricity from the pool pay for their electricity. This price is the
sum of the pool purchase price and an uplift charge that helps to cover the costs of ensuring a secure
and stable transmission system.41
Spot markets balance the demand for electricity with the supply of electricity at each
specified point in time. In doing so, spot markets can produce highly volatile prices for electricity as
demand and supply fluctuate over time. Electricity differs from many other commodities in that it is
very costly to store, and so generally must be consumed as it is produced. To limit the volatility of
39
The independent operation of multiple generators does not ensure a competitive supply of electricity.
Large generators may be able to increase the market price for electricity by, for example, withholding
supply during periods of peak demand. See Joskow and Kahn (2002) and Borenstein and Bushnell (1999),
for example.
40 Markets can be differentiated by time period. For example, companies purchase electricity for delivery
the following day in day ahead markets. Companies can purchase electricity for delivery in the next hour
in real time markets
41 More specifically, uplift charges cover forecasting errors, small plant adjustments, and ancillary services
required to ensure security and stability of the transmission system. Security refers to the ability to
respond to disturbances in the system, such as loss of a generator or a lightning strike. Stability refers to
ensuring sufficient facilities exist to meet demand.
23
electricity prices, many countries rely upon spot markets for only a small portion (often less than
10%) of electricity transactions.42
Privately-negotiated contracts among generators and transmission
and distribution companies account for the majority of electricity transactions. Such contracts
typically specify the price at which electricity will be exchanged, and thereby may avoid the
uncertainty that often arises in spot markets.43,44
The experience in England and Wales provides a useful illustration of the extent and nature
of competition in the electricity industry. Prior to 1990, electricity supplied in England and Wales
was generated by the state-owned Central Electricity Generating Board (CEGB). The CEGB
delivered the electricity that it generated to twelve distribution companies, each of which was the
monopoly provider of electricity distribution in its designated geographic region of operation. In
1990, the CEGB was separated into three generating companies and one (privatized) transmission
company. Two of the generating companies were privatized firms: National Power provided 50
percent of the electricity supplied and PowerGen provided 30 percent. The third (nuclear) generator
remained state-owned and served the remaining demand.45
The generation companies competed to
sell electricity to suppliers and directly to other large final consumers of electricity. 46
The
42
Rosellon (2003) reports that less than ten percent of energy transactions are spot-market transactions.
Most transactions occur via contract. These contracts can govern the sale of electricity over very short or
very long periods of time. To illustrate, roughly seventy-five percent of the electricity traded in the
wholesale generation sector of ISO New England in the US is governed by privately-negotiated contracts.
Twenty-five percent of the electricity is exchanged via the prevailing spot market. See
http://www.nepool.com/markets/ index.html for additional details.
43 Privately-negotiated contracts can entail some risk. In particular, the market price of electricity may drop
after a price has been negotiated. For example, during the California electricity crisis in 2000-2001, the
spot price of electricity greatly exceeded the price that earlier had been negotiated by contract. This
electricity crisis was brought about by a series of events beginning with deregulation of generation and
wholesale prices, and including the introduction of retail competition and an associated retail price
ceiling. The ensuing problems have been analyzed by several researchers, including Borenstein (2002)
and Armstrong and Sappington (2006).
44 In settings where a generator fails to deliver the amount of electricity that it promised to supply, other
generators are called upon to eliminate the excess of demand over supply that otherwise would arise. The
generator that failed to deliver the promised electricity generally is required to compensate the other
generator(s) for the additional electricity that they supply. See Cramton and Wilson (1998) for additional
details.
45 See Statutory Instrument 1988, No. 1057. The Electricity Supply Regulations 1988 ISBN 0 11 087 587.7.
National Power was scheduled to own the nuclear generating facility under the initial privatization plan.
Ultimately, the nuclear power generator remained a state-owned enterprise, in part because nuclear power
was determined to be less economic than fossil-fuel plants at the time, and it was thought that the nuclear
plant would not attract private owners.
46 Initially, the 5,000 largest consumers with capacity demands of more than 1MW per year were permitted
to choose their preferred generator. Subsequently, the next largest 45,000 consumers with demands of
24
remaining electricity that was consumed by consumers with more modest demands for electricity
was sold to the distribution companies. These companies then sold the electricity to final
consumers. 47
Several countries, including the UK, Germany, New Zealand, and the US, have successfully
introduced competition in the supply of electricity by allowing electricity customers to choose their
preferred supplier. The freedom to choose a preferred supplier exerts pressure on suppliers to
compete for consumers by offering lower prices and improved service quality. In the countries that
have introduced this freedom, large scale customers typically have been granted the right to select
their electricity supplier before smaller customers received this right. Currently, large scale
customers (if not all customers) are able to choose their electricity suppliers in many countries, and
many customers exercise this choice. For example, approximately 11 percent of residential
customers in the UK switched their provider annually during the first three years of being permitted
to do so (beginning in 1998).48
As a result, 34 percent of residential customers were served by the
non-incumbent provider by 2002. Of those countries opening their residential markets to competition
between 1998 and 2000, the percentage of residential customers who were served by a non-incumbent
supplier varied substantially six years later. Only 5 percent of residential customers in Germany were
served by a non-incumbent supplier; the corresponding percentages in Norway and Sweden were 24
percent and 29 percent, respectively.
more than 100 kW per year were permitted to choose a generator. As a result, approximately 50 percent
of all electricity generated was subject to competition. Eventually, all consumers were granted the right to
select their preferred generator.
47 While England and Wales were the first European countries to privatize and introduce competition in
their electricity markets in 1989-1990, the common Nordic power market started shortly thereafter with
the Norwegian 1990 Energy Act. The Act was designed to regulate transmission tariffs, to provide
consumers with choices of suppliers, and to separate the natural monopoly activities from potentially
competitive activities in vertically integrated suppliers of electricity services. Reform of the Finnish,
Swedish, and Danish markets followed shortly thereafter (in 1995, 1996, and 1999, respectively). Not
only did each country liberalize individually, but they acted jointly to create a common Nordic wholesale
power market. Nord Pool ASA (the Nordic Power Exchange) was established in 1996 by Norway and
Sweden as a common electricity market. In March 2002, the final border tariff (between Sweden and
Denmark) was abolished, resulting in one common Nordic wholesale power market.
48 See Doucet and Littlechild (2006).
25
Incentive Regulation in Network Sectors
Effective regulation of the (generally monopolistic) transmission sector can enhance the
appeal of operating in – and thus the extent of competition in – the generation sector. Absent
regulation, a monopolistic supplier of transmission services would find it optimal to charge
relatively high prices to transport electricity to distributors and final customers. Such high prices
could reduce profit margins, and thereby discourage competition, in the generation sector.
Regulation can reduce these prices while facilitating the coordination of network operations
The appropriate regulation of the transmission sector must reflect the properties of
electricity transmission. Recall that electricity is very costly to store, and yet must be available to
meet varying demands for electricity. Further, electricity follows the path of least resistance (based
on Kirchhoff‟s Laws).49
Therefore, in order to determine how much electricity can be transferred
between particular suppliers and buyers at any point in time, one must be aware of all other
transactions on the network at that time. Many countries employ a coordinating entity to regulate
the transmission sector while promoting competition in generation. The coordinating entity
typically matches supply offers and demand bids and monitors capacity to ensure that all of the
electricity that is demanded at reasonable prices will be supplied.
This coordinating entity often is an independent system operator (ISO) that oversees and
coordinates transactions on the network, but does not own the network. In this case, the
transmission grid typically is owned by the generators that supply electricity to the grid. For
example, PJM is a federally regulated, independent regional transmission organization in the US
that manages the largest competitive wholesale electricity market in the world. PJM oversees the
electricity grid that serves 13 states and the District of Columbia.50
In some settings, the entity that oversees and coordinates network operations is a vertically
integrated generation and transmission company. In such instances, the entity typically is required
to separate its generation and transmission activities from its network management operations. Such
functional separation helps to ensure that the entity does not favor its own generation or
transmission activities over the corresponding activities of other market participants. The Federal
Energy Regulatory Commission (FERC) mandates and monitors such separation in the US.51,52
49
Kirchhoff‟s Voltage Law and Kirchhoff‟s Current Law are laws in electrical engineering. See Pickover
(2008).
50 See http://www.pjm.com/about/overview.html for additional information about PJM‟s operations.
51 For additional details on functional separation of tasks in the US electricity sector, see http://
www.ferc.gov/legal/maj-ord-reg.asp. An ISO that coordinates the bids of generators and distributors
26
An ISO incurs substantial costs in coordinating transactions on the transmissions network.
These costs include those associated with scheduling generators‟ dispatch and ensuring that
distributors‟ demands for electricity are met at the lowest possible cost. The ISO‟s costs also
include payments that compensate generators and distributors for unexpected costs due to
forecasting errors and for costs associated with correcting network damage (due to lightning strikes,
for example). Incentive regulation can provide incentives to ISOs to limit these costs.
The incentive regulation employed in the UK is illustrative. The National Grid Company
(the NGC) is the ISO in the UK.53
The NGC incurs costs when it buys and sells electricity in order
to ensure a balance between the demand for and the supply of electricity on the network, and when
it acts to limit network congestion.54
An earnings sharing (ES) plan governs the NGS‟s
compensation for performing these network management functions. The ES plan entails the sharing
of realized profit above and below a specified target level of profit, as described in Section III. The
plan eliminates exceptionally high and low profits while providing some incentives for cost
reduction. Stronger financial incentives for cost reduction (as might be provided by a price cap
regulation plan, for example) could induce excessive cost-cutting that would jeopardize the
reliability and security of the electricity system.
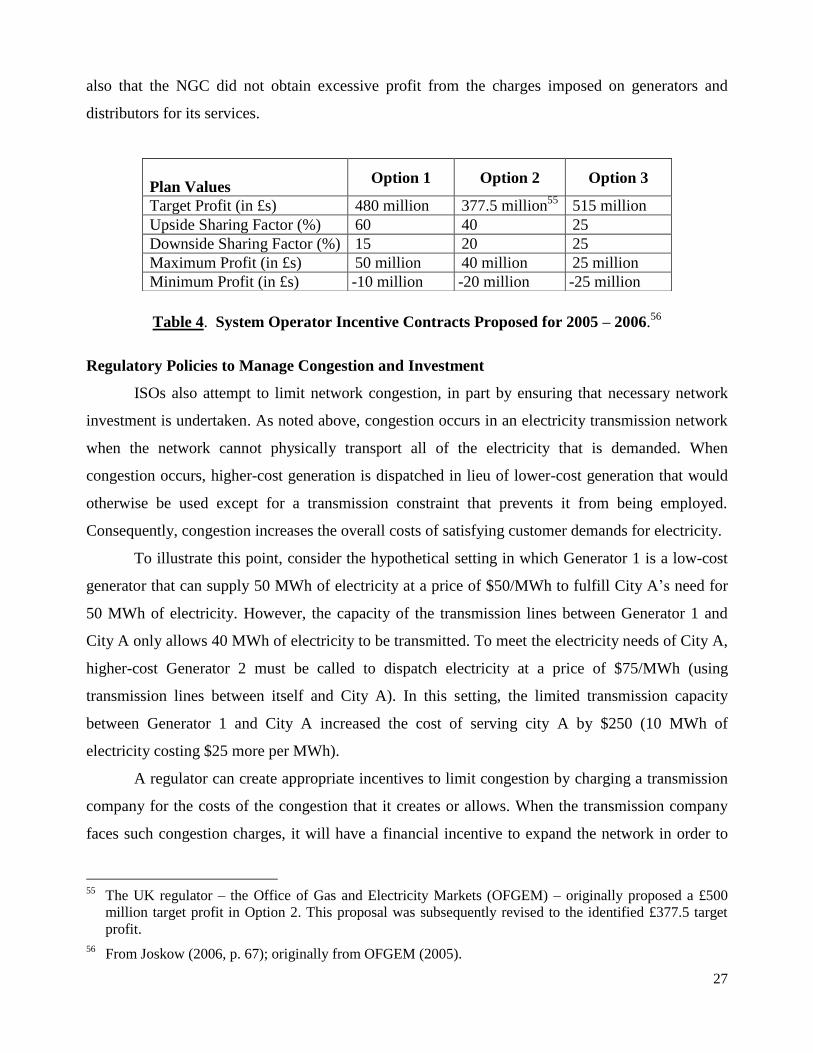
Table 4 describes the incentive plan under which the NGC operated in 2005 and 2006. The
plan included three options from which the NGC was permitted to choose. Each option included a
target level of profit and sharing factors for profit realizations above and below the target profit.
Each option also included a maximum and minimum permissible level of profit. The NGC selected
Option 2. Under Option 2, the NGC retained 40 percent of realized profit above the target, and 20
percent of losses below the target. This plan ensured that the NGC was setting prices sufficient to
cover its costs incurred in coordinating supply and demand among generators and distributors, and
facilitates both access to the electricity network and low prices for electricity customers, much as a
regulator does in the telecommunications industry. However, the ISO pursues these outcomes by
overseeing the interactions between market participants rather than by imposing detailed regulatory
mandates (including access prices).
52 The system operator also can be a regulated entity that owns the network and coordinates transactions on
the network, while separating its generation activities from its transmission and coordination activities.
Red Electrica serves this role in Spain. See www.ree.es for additional information.
53 National Grid usually is referred to more specifically as a transmission system operator (TSO). A TSO is a
company that is both system operator and owner and operator of the transmission network. The term ISO
generally indicates that the system operator does not own and operate the transmission network.
54 Congestion occurs when a generation or transmission network cannot physically accommodate all the
electricity that is demanded (because of a lack of capacity).
27
also that the NGC did not obtain excessive profit from the charges imposed on generators and
distributors for its services.
Table 4. System Operator Incentive Contracts Proposed for 2005 – 2006.56
Regulatory Policies to Manage Congestion and Investment
ISOs also attempt to limit network congestion, in part by ensuring that necessary network
investment is undertaken. As noted above, congestion occurs in an electricity transmission network
when the network cannot physically transport all of the electricity that is demanded. When
congestion occurs, higher-cost generation is dispatched in lieu of lower-cost generation that would
otherwise be used except for a transmission constraint that prevents it from being employed.
Consequently, congestion increases the overall costs of satisfying customer demands for electricity.
To illustrate this point, consider the hypothetical setting in which Generator 1 is a low-cost
generator that can supply 50 MWh of electricity at a price of $50/MWh to fulfill City A‟s need for
50 MWh of electricity. However, the capacity of the transmission lines between Generator 1 and
City A only allows 40 MWh of electricity to be transmitted. To meet the electricity needs of City A,
higher-cost Generator 2 must be called to dispatch electricity at a price of $75/MWh (using
transmission lines between itself and City A). In this setting, the limited transmission capacity
between Generator 1 and City A increased the cost of serving city A by $250 (10 MWh of
electricity costing $25 more per MWh).
A regulator can create appropriate incentives to limit congestion by charging a transmission
company for the costs of the congestion that it creates or allows. When the transmission company
faces such congestion charges, it will have a financial incentive to expand the network in order to
55
The UK regulator – the Office of Gas and Electricity Markets (OFGEM) – originally proposed a £500
million target profit in Option 2. This proposal was subsequently revised to the identified £377.5 target
profit.
56 From Joskow (2006, p. 67); originally from OFGEM (2005).
Plan Values Option 1 Option 2 Option 3
Target Profit (in £s) 480 million 377.5 million55
515 million
Upside Sharing Factor (%) 60 40 25
Downside Sharing Factor (%) 15 20 25
Maximum Profit (in £s) 50 million 40 million 25 million
Minimum Profit (in £s) - -10 million - -20 million - -25 million
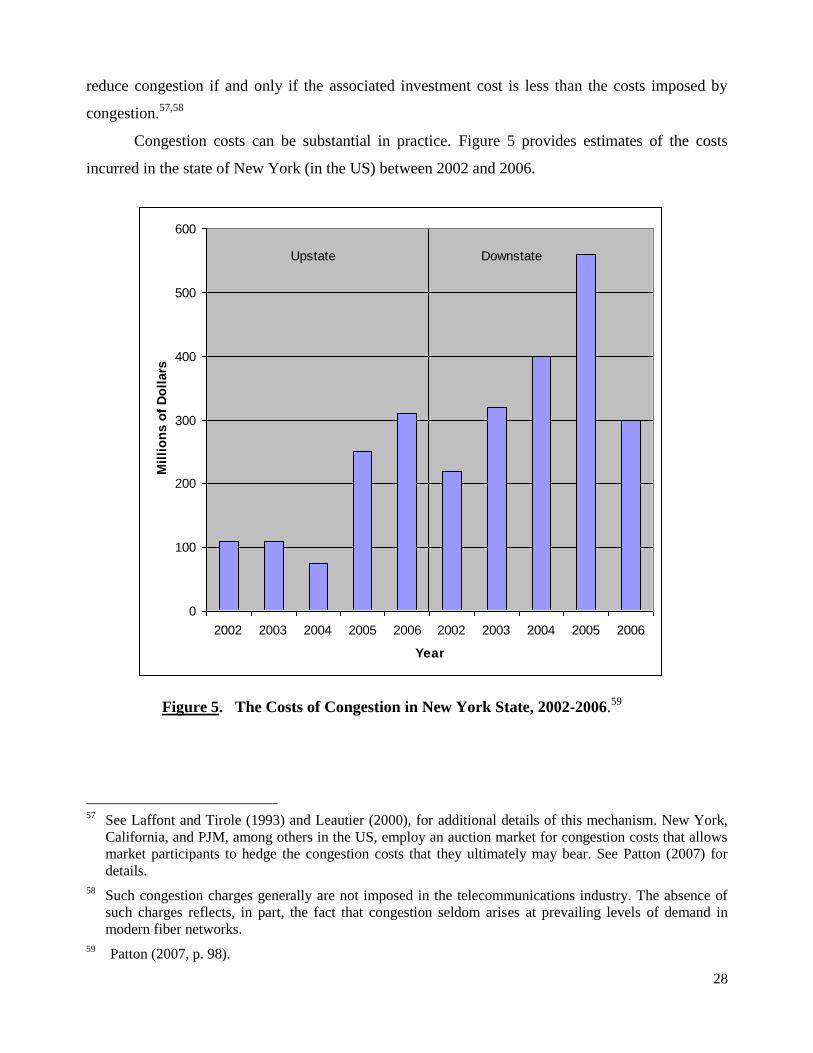
28
reduce congestion if and only if the associated investment cost is less than the costs imposed by
congestion.57,58
Congestion costs can be substantial in practice. Figure 5 provides estimates of the costs
incurred in the state of New York (in the US) between 2002 and 2006.
0
100
200
300
400
500
600
2002 2003 2004 2005 2006 2002 2003 2004 2005 2006
Year
Mil
lio
ns o
f D
oll
ars
Upstate Downstate
Figure 5. The Costs of Congestion in New York State, 2002-2006.59
57
See Laffont and Tirole (1993) and Leautier (2000), for additional details of this mechanism. New York,
California, and PJM, among others in the US, employ an auction market for congestion costs that allows
market participants to hedge the congestion costs that they ultimately may bear. See Patton (2007) for
details.
58 Such congestion charges generally are not imposed in the telecommunications industry. The absence of
such charges reflects, in part, the fact that congestion seldom arises at prevailing levels of demand in
modern fiber networks.
59 Patton (2007, p. 98).
29
The higher costs in the downstate region of New York (which includes New York City)
reflect in part the higher population in the region. The reduction in congestion costs in this region in
2006 reflect the installation of substantial new network capacity in New York City, and the use of a
more detailed network dispatch model that allowed better utilization of the transmission system.
Like the transmission operator, distribution companies must undertake a substantial amount
of network expansion and maintenance to meet the ever-increasing demand for electricity and to
ensure high-quality service. Although electricity distribution companies face increasing competition
in many countries (often from generators that deliver electricity directly to end-users), wholesale
price regulation is warranted in settings where the competition presently is limited. Such regulation
is imposed, for example, on the electricity distribution companies in the UK. These companies,
known as distribution network operators (DNOs), transport electricity from the transmission
provider to end-user customers in specific geographic areas. The prices that the DNOs charge to
suppliers and end-users are governed by price cap (PC) regulation. Because it does not entail the
sharing of earnings, PC regulation provides stronger incentives for cost reduction than does the
earnings sharing (ES) plan under which the NGC operates. These stronger incentives are deemed to
be appropriate in part because the cost-cutting measures that distribution companies might
undertake often have limited impact on system stability (since the distribution companies do not
control the transmission grid). The X factors in the PC plans for the DNOs, and thus allowed prices,
are derived by comparing the operating costs of the DNOs, each DNO‟s current asset value, and
forecasts of future expenditures needed to provide the levels of quality and service mandated by
OFGEM. OFGEM sets the X factors to allow an efficient DNO an expected return on (regulatory)
asset value equal to its cost of capital. In 2004, the X was set at zero for all of the DNOs. Thus,
prices were permitted to increase at the rate of retail price inflation. 60
OFGEM also oversees the capital investments of the DNOs to ensure that adequate, but not
excessive, investment is undertaken to meet present and future demand for electricity. To limit
excessive investment, OFGEM provides financial rewards to DNOs that are able to operate with
less capital investment than is initially estimated to be necessary.61
To ensure that incentives for
60
Joskow (2006, p. 39). OFGEM anticipated that the DNOs would continue to reduce operating costs
(excluding depreciation) while increasing their capital expenditure and output. On balance, prices that
were constant in real terms were deemed adequate to generate the desired returns for the DNOs.
61 See Joskow (2006) and Jamasb and Pollitt (2007) for the details of these rewards.
30
reduced capital expenditures do not jeopardize the reliability of the UK electricity network,62
OFGEM has implemented a system of financial penalties and rewards for the DNOs and for the
NGC that reflect their performance in limiting reductions in electricity supply due to network and
supply failures. Table 5 illustrates the key elements of the plan for selected DNOs.
The first column in Table 5 identifies the relevant DNO. The second column in the table lists
the starting position for each of the companies. The starting position for a company reflects the
percentage of its customers that experienced a short interruption in their electricity service (i.e., an
interruption of less than three minutes) on average each year between 1995/96 and 1999/2000. The
third column in the table reflects the corresponding target performance for each company in
2004/2005. This target performance reflects in part the interruption rate that the company
experienced in 2002 and in part the interruption rates experienced by other DNOs. The fourth
column in Table 5 specifies the incentive rate, which is the rate at which the relevant DNO‟s
revenue (based on 2000/2001 prices) increased or decreased as its achieved performance exceeded
or fell short of its target performance.63
The last column of Table 5 records the maximum increase
or decrease in the DNO‟s revenue due to the plan.
62
Key elements of system reliability include outages of generators controlled by the NGC, damages caused
by third parties affecting the system, and faults on transmission networks. A fault is any unintended
decrease in voltage. Electricity is measured in frequency and amplitude, and also in shape and symmetry.
Customers can be affected differently by the same fault. For example a residential customer may not be
aware of a short-term fault. In contrast, a business entity may incur high costs when electricity is not
delivered exactly as required, and so the operations of the entity‟s production line are disrupted. Any
variation from the expected delivery (i.e., a sine wave of 50/60 Hz) can affect quality. Faults may
originate in the electrical facility itself or may be caused by external factors beyond the facility‟s control.
63 The incentive rate is expressed in units of million pounds (£m) per interruption per 100 customers.
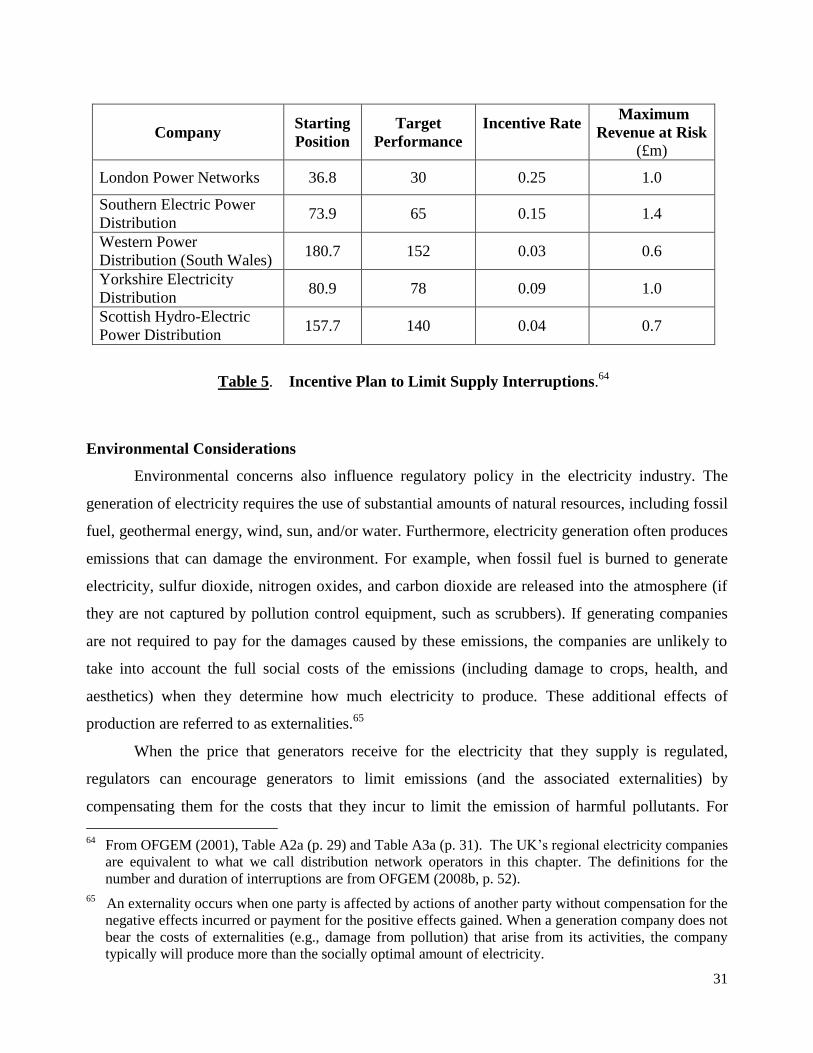
31
Company Starting
Position
Target
Performance
Incentive Rate
Maximum
Revenue at Risk
(£m)
London Power Networks 36.8 30 0.25 1.0
Southern Electric Power
Distribution 73.9 65 0.15 1.4
Western Power
Distribution (South Wales) 180.7 152 0.03 0.6
Yorkshire Electricity
Distribution 80.9 78 0.09 1.0
Scottish Hydro-Electric
Power Distribution 157.7 140 0.04 0.7
Table 5. Incentive Plan to Limit Supply Interruptions.64
Environmental Considerations
Environmental concerns also influence regulatory policy in the electricity industry. The
generation of electricity requires the use of substantial amounts of natural resources, including fossil
fuel, geothermal energy, wind, sun, and/or water. Furthermore, electricity generation often produces
emissions that can damage the environment. For example, when fossil fuel is burned to generate
electricity, sulfur dioxide, nitrogen oxides, and carbon dioxide are released into the atmosphere (if
they are not captured by pollution control equipment, such as scrubbers). If generating companies
are not required to pay for the damages caused by these emissions, the companies are unlikely to
take into account the full social costs of the emissions (including damage to crops, health, and
aesthetics) when they determine how much electricity to produce. These additional effects of
production are referred to as externalities.65
When the price that generators receive for the electricity that they supply is regulated,
regulators can encourage generators to limit emissions (and the associated externalities) by
compensating them for the costs that they incur to limit the emission of harmful pollutants. For
64
From OFGEM (2001), Table A2a (p. 29) and Table A3a (p. 31). The UK‟s regional electricity companies
are equivalent to what we call distribution network operators in this chapter. The definitions for the
number and duration of interruptions are from OFGEM (2008b, p. 52).
65 An externality occurs when one party is affected by actions of another party without compensation for the
negative effects incurred or payment for the positive effects gained. When a generation company does not
bear the costs of externalities (e.g., damage from pollution) that arise from its activities, the company
typically will produce more than the socially optimal amount of electricity.
32
example, suppose that it costs $70/MWh to generate electricity when scrubbers are not employed to
reduce emissions. Further suppose that it costs $80/MWh to generate the same amount of
electricity when scrubbers are employed to eliminate harmful emissions. A regulator can induce
generators to incur the extra cost required to eliminate harmful emissions by increasing by
$10/MWh the price that the generators receive for the electricity that they produce using scrubbers.
Tradable pollution permit policies constitute an alternative, market-based approach to
controlling externalities. Under such a policy, the aggregate amount of pollution that the industry
can emit annually is specified initially. Pollution permits that reflect the determined limit on
emissions are then distributed to industry participants. For example, one tradable carbon permit
allows the owner of the permit generally to emit one metric ton of carbon. Permits may be
distributed to companies based on historical patterns of emissions, or they may be auctioned.66
Under a tradable permit program, the companies that are able to reduce emissions at the lowest cost
will do so, and will sell their pollution permits to companies that find it more costly to reduce
emissions. The industry costs of achieving the specified maximum level of emissions can be
minimized through such a process.
Regulatory policies that encourage low retail prices can exacerbate environmental concerns
by encouraging electricity consumption. Demand side management (DSM) programs are designed
to encourage customers to reduce electricity consumption, even when the retail price of electricity is
relatively low. Reduced electricity consumption can provide several benefits. In particular, reduced
consumption decreases pollution because less coal and natural gas (which produce emissions) need
to be burned. Reduced consumption also helps to conserve limited natural resources, such as coal,
oil and water. Additionally, decreasing consumption may help to improve the reliability of the
electricity system and help to limit the partial or full reductions in the electricity supply that can
occur when the demand for electricity exceeds its supply. Finally, limited consumption can reduce
the cost of producing electricity by reducing peak-period usage and thereby limiting the need to
secure electricity from the highest-cost sources.
DSM programs encourage reduced energy consumption in many different ways. For
example, DSM programs can inform customers about the cost savings that they can realize by
constructing energy-efficient buildings and employing energy-efficient equipment. DSM programs
also encourage participants to reduce electricity consumption during periods of peak electricity
66
Cramton and Kerr (2002) provide details of permit market shares in the US.
33
demand. They may do so, for example, through load cycling programs.67
Under such programs, the
electricity supply company installs a programmable thermostat in the resident‟s home. The
company then adjusts the settings on the thermostat during periods of peak electricity demand. For
example, the company might increase by as much as four degrees the temperature that the central
air conditioning unit maintains in the home during periods of peak electricity demand. Load cycling
programs benefit consumers both by reducing their electricity bills and by limiting the number and
severity of electricity outages that they experience.
Time-of-day pricing of electricity can encourage customers to shift their consumption of
electricity from periods of peak demand to periods of off-peak demand. Under a time-of-day pricing
program, the prices that customers face for electricity are lower during off-peak periods than during
peak periods. To implement time-of-day pricing programs, meters must be installed that record the
time at which a customer consumes electricity. Customers often are required to pay a fee to
participate in a time-of-day pricing program, in part to offset the cost of this meter. Despite this
monthly charge, many customers who participate in time-of-day programs realize lower electricity
bills. Furthermore, such programs reduce the overall costs of generating a given level of electricity
by reducing the fraction of the electricity that is generated by the relatively costly generators that
are called upon to produce electricity only during periods of peak demand.
Alliant Energy offers a time-of-day residential pricing plan in the state of Iowa in the US.
Under this plan, off-peak electricity use (defined as use between 8:00 pm and 7:00 am on weekdays
and all weekend) is billed at a 50 percent discount. In contrast, peak electricity use is billed at a 40
percent premium. There is no charge for meter installation. However, customers pay a $3.35
monthly fee for use of the meter.68
Although customers that participate in time-of-day pricing plans often experience a
reduction in their electricity bills, such reductions are not guaranteed. To illustrate, Puget Sound
Energy (in the state of Washington in the US) had enrolled 240,000 customers in its new time-of-
day pricing plan by June 2001. During the peak hours of 10:00 am – 5:00 pm on weekdays,
customers enrolled in the plan faced the same price for electricity (5.8¢/kWh) that customers who
were not enrolled in the plan faced at all times. During other (off-peak) hours, customers in the plan
paid only 4.8¢/kWh. During the first year of the plan‟s operation, customers in the plan reduced
67
The Colorado Springs Utilities (U.S.) Pilot Program details such a scheme for a limited number of
residents (currently 500). Details can be found at http://www.csu.org/environment/conservation_res/
energy/load_cycling/index.html.
68 Additional details of this plan are available at www.alliantenergy.com/timeofday.
34
their consumption of electricity during peak periods by approximately 5 percent on average, and
typically experienced lower electricity bills. In the second year of the plan, Puget Sound Energy
instituted a $1 monthly charge to recoup metering costs. This charge offset customer savings so that
by the fall of 2002, 90 percent of customers were paying more under the time-of-day plan than they
would have paid had they continued to purchase under the original flat-rate plan.69
Energy conservation also can be encouraged by programs that reimburse customers for a
portion of their expenditures on energy-saving devices. In the United States, 21 states provide tax
incentives for energy conservation, and the federal government provides three additional incentive
programs.70
To illustrate, Hawaii provides state income tax credits for the installation of solar water
heating systems. The tax credits can be for as much as 35 percent of the installation cost, subject to
specified limits. Similarly, residents of Arizona can earn tax rebates equal to 5 percent of the cost of
energy efficient appliances (up to $5,000).
While DSM programs can reduce customers‟ electricity bills, the programs also can reduce
the profit of electricity suppliers. DSM programs can be costly for suppliers to implement. For
example, Colorado Springs Utilities must bear the cost of installing new thermostats at customers‟
residences in order to implement its load cycling program. DSM programs also can reduce the
revenue of electricity suppliers by reducing electricity consumption. For these reasons, it is often
deemed necessary to closely monitor company compliance with DSM programs. Financial
incentives for company participation in DSM programs may be provided in some instances. For
example, an electricity supply company might be paid a bonus if a specified fraction of its
customers enroll in a DSM program. Alternatively or in addition, the company might be permitted
to recover its costs of implementing a DSM program directly from its customers in the form of
higher prices for electricity. In this case, customers that do not participate in the program
nevertheless pay for a portion of the costs of the program. Additionally, the supplier might be
permitted to increase the price of electricity that it charges to end-users to offset the revenue
reduction that arises when customers consume less electricity.
In addition to encouraging reduced consumption of electricity, regulators in some countries
adopt policies that encourage increased reliance on renewable energy sources such as wind power,
69
Federal Energy Regulatory Commission (2006).
70 The federal programs are Residential Energy Conservation Subsidy Exclusion (Personal), Residential
Energy Efficiency Tax Credit, and Residential Solar and Fuel Cell Tax Credit. For additional information,
see http://www.dsireusa.org.
35
solar power, hydropower, geothermal power, and various forms of biomass.71
The UK, for example,
has implemented the Renewables Obligation, which requires generators to procure a specified
amount of power from a renewable source (2.6 percent of their electricity generated in 2006-
2007).72
Under the policy, a generator receives a renewables obligations certificate (ROC) for each
megawatt hour of electricity that it generates from a renewable resource.73
Generators meet their
obligations by generating enough energy from renewable resources to accumulate the required
number of ROCs. If a generator does not have enough ROCs to meet its obligations, the generator
must make a financial contribution to a fund. The money paid into the fund is distributed to the
suppliers that have generated the required amount of energy from renewable resources. In essence,
the program requires suppliers to either employ the mandated level of renewable resources or pay a
penalty for failing to do so.74
VI. Conclusions.
As the discussion in sections IV and V emphasizes, pricing policies in the
telecommunications and electricity industries reflect both the level of industry competition and the
prevailing industry structure. In both industries, competitive pressures vary at different stages of the
production process and for different types of customers. Competition among industry suppliers
often is most intense for the largest (business) customers. Consequently, regulatory protection often
is focused on the smaller (residential) customers. In the electricity industry, substantial competition
among generators facilitates limited regulatory control of the prices that generators receive for the
electricity that they produce. In contrast, regulation typically restricts the prices that (often
monopolistic) electricity transmission companies charge for their services. In the
71
Renewable energy encompasses energy from such sources as the sun, wind, rain, and geothermal heat,
which are naturally replenished. Geothermal heat is released from the earth through openings in the
earth‟s crust. Biomass grown from switchgrass, hemp, corn, sugarcane, palm oil, and other materials can
be burned to produce steam to make energy or to provide heat directly. It also can be converted to other
usable forms of energy like methane gas, ethanol, and biodiesel fuel. (See http://www.biomassec.com for
additional information on biomass).
72 Mandates to reduce emissions at each generating plant also were introduced, in many cases in compliance
with European Union directives. For example, in 2007 European leaders agreed to reduce CO2 emissions
by 20 percent below their 1990 levels by 2020. The reductions could be as large as 30 percent if other
nations set comparable goals (http://europa.eu/scadplus/ leg/en/s15004.htm).
73 Renewables are verified through OFGEM‟s Renewables and CHP Register. This is an electronic, web-
based system used to manage the renewables scheme. Additional information on the UK‟s sustainability
programs is available at http://www.ofgem.gov.uk/Sustainability/Pages/Sustain.aspx.
74 In contrast to tradable pollution permit policies, this renewables obligations policy does not allow
generators to trade renewable obligations.
36
telecommunications industry, increasing competition among retail suppliers (especially to serve
large customers) has permitted relaxed regulatory controls on retail prices. Regulatory oversight
often is focused on the prices that network owners charge for key wholesale services sold to
industry competitors.
Coordination among suppliers is crucial in both the telecommunications and electricity
industries. The requisite coordination in the telecommunications industry focuses on ensuring that
all customers can communicate with one another, regardless of the particular network to which they
subscribe. Such ubiquitous communication is facilitated by specifying the obligation that each
network operator has: (i) to allow other suppliers of telecommunications services to use key
elements of its network; and (ii) to accept and terminate calls that originate on different networks.
Coordination in the electricity industry requires additional ongoing oversight. The demand and
supply of electricity must constantly be balanced. This balancing often is ensured by an independent
system operator.
Given the ongoing need to balance the demand and supply of electricity and given the large
variation in demand that is common (as temperatures fluctuate widely, for example), prices tend to
be more volatile in the electricity industry than in the telecommunications industry. The most
pronounced variation tends to be in the prices that generators receive for the electricity that they
supply to the pool. Regulatory policy often limits the variation in the prices that retail customers pay
for electricity. The long-term contracts that generators negotiate with suppliers and large retail
customers help to limit the price variation that generators experience.
The marginal cost of production tends to increase more rapidly as demand increases in the
electricity industry than in the telecommunications industry. The typical wireline
telecommunications network has ample capacity to serve all calls that are placed on the network.
Consequently, the marginal cost of supplying telecommunications service tends to be fairly uniform
and fairly low. In contrast, the marginal cost of supplying electricity during periods of peak demand
can be much larger than the corresponding marginal cost during off-peak periods. The higher cost
during peak periods reflects in part the higher costs incurred by the less efficient generators that
typically are called upon when the demand for electricity is most pronounced.
To limit the extent to which these high costs of electricity supply are incurred, retail prices
for electricity can be elevated during periods of peak demand in order to reduce electricity
consumption during these periods. Demand side management programs also can be implemented to
reduce electricity consumption during both peak and off-peak periods. Such reduced consumption
37
has the added benefit of reducing the environmental externalities (e.g., air pollution) that arise from
the production of electricity.
The pricing policies that are presently employed in the telecommunications and electricity
industries offer advantages relative to traditional rate of return regulation. For example, by severing
the link between authorized prices and realized production costs, price cap regulation can provide
strong incentives for cost reduction and innovation. Price cap regulation also can afford incumbent
suppliers considerable flexibility to respond to emerging competitive pressures. Like all regulatory
plans, though, price cap regulation is not without its drawbacks. Price cap regulation can admit
considerable variation in earnings and thereby increase the regulated supplier‟s cost of capital and
discourage investment. Price cap regulation also can promote reduced service quality.
No regulatory plan is perfect. Each form of regulation has advantages and disadvantages.
The best regulatory plan varies with industry conditions and evolves over time as industry
conditions change (e.g., as industry competition increases). Industry participants are always
searching for superior forms of regulation. For instance, some advise encouraging industry
participants to negotiate mutually acceptable rules and regulations, while limiting the extent to
which regulators design and impose the rules unilaterally. One potential advantage of such
“negotiated settlement” is that it empowers industry participants to employ their privileged
knowledge of their capabilities and preferences to fashion rules and regulations that best serve the
needs of all parties. Negotiated settlement also may facilitate creative compromises across multiple
dimensions of industry activity (e.g., prices, service quality, and environmental protection) in part
by loosening the constraints imposed by cumbersome procedural rules.75
Of course, negotiated
settlement has the potential to harm relevant parties (e.g., future generations of consumers) that are
not adequately represented in the negotiation process. Thus, as is the case with all forms of
regulation, negotiated settlement offers potential advantages and disadvantages. The art of
continually tailoring regulatory policy to changing industry conditions remains a work in progress.
75
See Wang (2004), Doucet and Littlechild (2006), and Littlechild (2007), for example, for further
discussion of the potential merits of and actual experience with negotiated settlement.
38
REFERENCES
Armstrong, Mark, “Network Interconnection,” Economic Journal, 108(448), May 1998, 545-564.
Armstrong, Mark, Simon Cowan, and John Vickers, Regulatory Reform: Economic Analysis and
British Experience. Cambridge, MA: MIT Press, 1994.
Armstrong, Mark, and David Sappington, “Regulation, Competition, and Liberalization,” Journal of
Economic Literature, 44(2), June 2006, 325-366.
Baumol, William and David Bradford, “Optimal Departures from Marginal Cost Pricing”,
American Economic Review, 60(3), June 1970, 265-283.
Baumol, William, Janusz Ordover, and Robert Willig, “Parity Pricing and its Critics: A Necessary
Condition for Efficiency in the Provision of Bottleneck Services to Competitors,” Yale Journal on
Regulation, 14(1), Winter 1997, 145-164.
Borenstein, Severin, “The Trouble with Electricity Markets: Understanding California‟s
Restructuring Disaster,” Journal of Economic Perspectives, 16(1), Winter 2002, 191-211.
Borenstein, Severin, and James Bushnell, “An Empirical Analysis of the Potential for Market Power
in California's Electricity Industry,” Journal of Industrial Economics, 47(3), September 1999, 285-
323.
Braeutigam, Ronald and John Panzar, “Effects of the Change from Rate-of-Return Regulation to
Price Cap Regulation,” American Economic Review, 83(2), May 1993, 191-198.
Byatt, Ian, “Taking a View on Price Review: A Perspective on Economic Regulation in the Water
Industry,” National Institute Economic Review, 159(1), January 1997, 77-81.
Cramton, Peter, and Robert Wilson, “Design of New England‟s Wholesale Electricity Market,”
available at www.marketdesign.com/files/98presentation-design-of-wholesale-electricity-markets.
ppt, 1998.
Cramton, Peter, and Suzi Kerr, “Tradable Carbon Permit Auctions: How and Why to Auction not
Grandfather,” Energy Policy, 30(4), March 2002, 333-345.
DeGraba, Patrick, “Efficient Intercarrier Compensation for Competing Networks when Customers
Share the Value of a Call,” Journal of Economics and Management Strategy, 12(2), Summer 2003,
207-230.
Dessein, Wouter, “Network Competition in Nonlinear Pricing,” Rand Journal of Economics, 34(4),
Winter 2003, 593-611.
Doucet, Joseph and Stephen Littlechild, “Negotiated Settlements: The Development of Legal and
Economic Thinking,” Utilities Policy, 14(4), December 2006, 266-277.
39
Federal Energy Regulatory Commission, “Assessment of Demand Response and Advanced
Metering,” Docket No. AD-06-2-000, August 2006.
Garrido, Alberto, “Transition to Full-Cost Pricing of Irrigation Water for Agriculture in OECD
Countries,” OECD Publication COM/ENV/EPOC/AGR/CA(2001)62/FINAL, February 2002.
Jamasb, Tooraj and Michael Pollitt, “Incentive Regulation of Electricity Distribution Networks:
Lessons of Experience from Britain,” Energy Policy, 35(12), December 2007, 6163-6187.
Joskow, Paul, “Incentive Regulation in Theory and Practice: Electricity Distribution and
Transmission Networks,” February 2006, working paper available at http://www.electricitypolicy
.org.uk/pubs/wp/eprg0511.pdf.
Joskow, Paul and Edward Kahn, “A Quantitative Analysis of Pricing Behavior in California's
Wholesale Electricity Market During Summer 2000,” Energy Journal, 23(4), October 2002, 1-35.
Joskow, Paul and Roger Noll, “The Bell Doctrine: Applications in Telecommunications, Electricity,
and other Network Industries,” Stanford Law Review, 51(5), May 1999, 1249-1315.
Kahn, Alfred. The Economics of Regulation: Principles and Institutions. Volume I. New York: John
Wiley & Sons, 1970.
Kahn, Alfred, Timothy Tardiff, and Dennis Weisman, “The Telecommunications Act at Three
Years: An Economic Evaluation of its Implementation by the Federal Communications
Commission,” Information Economics and Policy, 11(4), December 1999, 319-365.
Kirkpatrick, Colin, David Parker, and Yin-Fang Zhang, “Price and Profit Regulation in Developing
and Transition Economies,” University of Manchester Working Paper No. 88, November 2004.
Laffont, Jean Jacques, and Jean Tirole, A Theory of Incentives in Procurement and Regulation.
Cambridge, MA: MIT Press, 1993.
Laffont, Jean-Jacques, Patrick Rey, and Jean Tirole, “Network Competition: I. Overview and
Nondiscriminatory Pricing,” Rand Journal of Economics, 29(1), Spring 1998a, 1-37.
Laffont, Jean-Jacques, Patrick Rey, and Jean Tirole, “Network Competition: II. Price
Discrimination,” Rand Journal of Economics, 29(1), Spring 1998b, 38-56.
Leautier, Thomas-Olivier, “Regulation of an Electric Power Transmission Company,” The Energy
Journal, 21(4), October 2000, 61-92.
Littlechild, Stephen, “Beyond Regulation,” in Robinson, Colin. (ed.): Utility Regulation in
Competitive Markets: Problems and Progress. Cheltenham: Edward Elgar, 2007, 7-33.
Mandy, David, “Killing the Goose that Laid the Golden Egg: Only the Data Know Whether
Sabotage Pays,” Journal of Regulatory Economics, 17(2), March 2000, 157-172.
40
Montginoul, Marielle, “Analyzing the Diversity of Water Pricing Structures: The Case of France,”
Water Resources Management, 21(5), May 2007, 861-871.
Mueller, Milton, Telephone Companies in Paradise: A Case Study in Telecommunications
Deregulation. New Brunswick, NJ: Transaction Publishers, 1993.
National Statistics Online, Retail Prices Index: Annual Index Numbers of Retail Prices 1948-2006,
http://www.statistics.gov.uk/StatBase/tsdataset.asp?vlnk=7172&More=N&All=Y (Visited
December 11, 2007).
Nuechterlein, Jonathan and Philip Weiser, Digital Crossroads: American Telecommunications
Policy in the Internet Age. Cambridge, MA: MIT Press, 2005.
Office of Gas and Electricity Markets (OFGEM), “Information and Incentives Project: Developing
the Incentive Scheme - Update,” November 2001, available at: http://www.ofgem.gov.uk/Networks
/ElecDist/QualofServ/QoSIncent/Documents1/184_9nov01.pdf.
OFGEM, “NGC System Operator Incentive Scheme from April 2005,” Final Proposals and
Statutory License Consultation, 65/05, March 2005.
OFGEM, “2007/2008 Electricity Distribution Quality of Service Report,” Ref 166/08, December
2008.
Organization for Economic Co-operation and Development (OECD), Access Pricing in
Telecommunications. Paris: OECD, 2004a.
OECD, Regulatory Reform in Telecommunications: Germany. Paris: OECD, 2004b.
Pérez-Chavolla, Lilia, State Retail Rate Regulation of Local Exchange Providers as of December
2006, National Regulatory Research Institute Report #07-04, Ohio State University, April 2007.
Patton, David, “2006 State of the Market Report: New York Electricity Markets,” Potomac
Economics, May 2007, available at: www.nyiso.com/public/webdocs/documents/market_advisor
_reports/2006_NYISO_Annual_Rpt_Final2.
Pickover, Clifford, Archimedes to Hawking: Laws of Science and the Great Minds Behind Them.
New York: Oxford University Press, Inc., 2008.
Pindyck, Robert, “Mandatory Unbundling and Irreversible Investment in Telecom Networks,”
Review of Network Economics, 6(3), September 2007, 249-273.
Rosellon, Juan, “Different Approaches Towards Electricity Transmission Expansion,” Review of
Network Economics, 2(3), September 2003, 238-269.
Rosenberg, Edward, Lilia Pérez-Chavolla, and Jing Liu, “Intercarrier Compensation and the
Missoula Plan,” National Regulatory Research Institute Briefing Paper #06-14, October 2006.
41
Rosston, Gregory and Roger Noll, “The Economics of the Supreme Court‟s Decision on Forward
Looking Costs,” Review of Network Economics, 1(2), September 2002, 81-89.
Rosston, Gregory and Bradley Wimmer, “The „State‟ of Universal Service,” Information
Economics and Policy, 12(3), September 2000, 261–283.
Sappington, David, “Price Regulation,” in The Handbook of Telecommunications Economics.
Volume I: Structure, Regulation, and Competition, edited by Martin Cave, Sumit Majumdar, and
Ingo Vogelsang. Elsevier Science Publishers, 2002, 225-293.
Wang, Zhongmin, “Selling Utility Rate Cases: An Alternative Ratemaking Procedure,” Journal of
Regulatory Economics, 26(2), September 2004, 141-164.
Wang, Young-Do, William Smith, and John Byrne, Water Conservation-Oriented Rates: Strategies
to Extend Supply, Promote Equity, and Meet Minimum Flow Levels. Denver, CO: American Water
Works Association, 2004.
Wood, Lisa and David Sappington, “On the Design of Performance Measurement Plans in the
Telecommunications Industry,” Telecommunications Policy, 28(11), December 2004, 801-820.