Embed Size (px)
Citation preview
Sources: Eurostat, MSs notifications, DG Agri, Comext, Comtrade, GTA, ITC, AMI, Expert groups, Freshfel, Wapa….
MS PRICES EU AVG PRICES
D G A G R I D A S H B O A R D : A P P L E S Last update: 22.05.2018 PRICES PROD. TRADE BALANCE INDEX EXPORT DIV.
30
38
4040
3837
41 41
44
48
48
33
31
34
32
31
34
36
38
47
47 47
3838
28
2526
27
25
27
29
32
40 39
38
30
34
26
23 23
25
24
25
26
29
35 34
33
2830
24
21
2324
26
3030
28
27
22
20
1415
20 20 2019
18 1817
19 18
10
15
20
25
30
35
40
45
50
Aug Sep Oct Nov Dec Jan Feb Mar Apr May Jun Jul YEAR
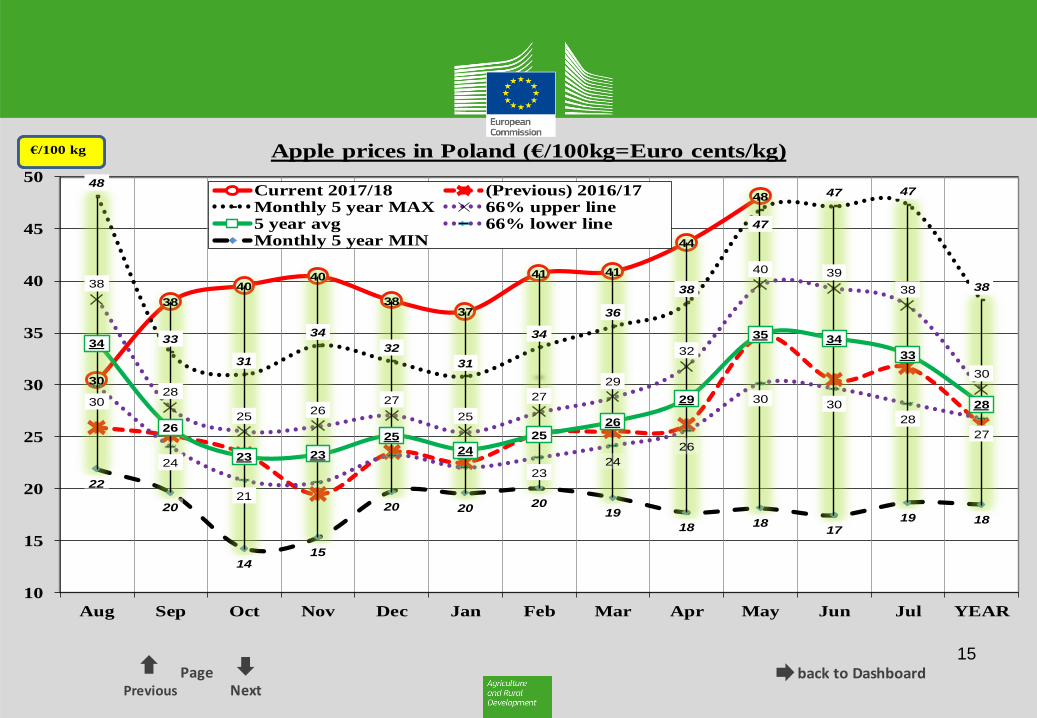
Apple prices in Poland (€/100kg=Euro cents/kg)
Current 2017/18 (Previous) 2016/17Monthly 5 year MAX 66% upper line5 year avg 66% lower lineMonthly 5 year MIN
€/100 kg€/100 kg
71
74
8687 87 88
9190
93
98
8889 89
8685
8386
88 88
9294
98
89
76 7677 77 76
75 7675 75
7778
79
76
7170
71 71 71 71 7170 71
7273 74
71
67
6465 66 66 66 66
6566
6869 68
67
60
52 52 52 5354
56 55
60 5960
62
56
50
55
60
65
70
75
80
85
90
95
100
105
Aug Sep Oct Nov Dec Jan Feb Mar Apr May Jun Jul YEAR
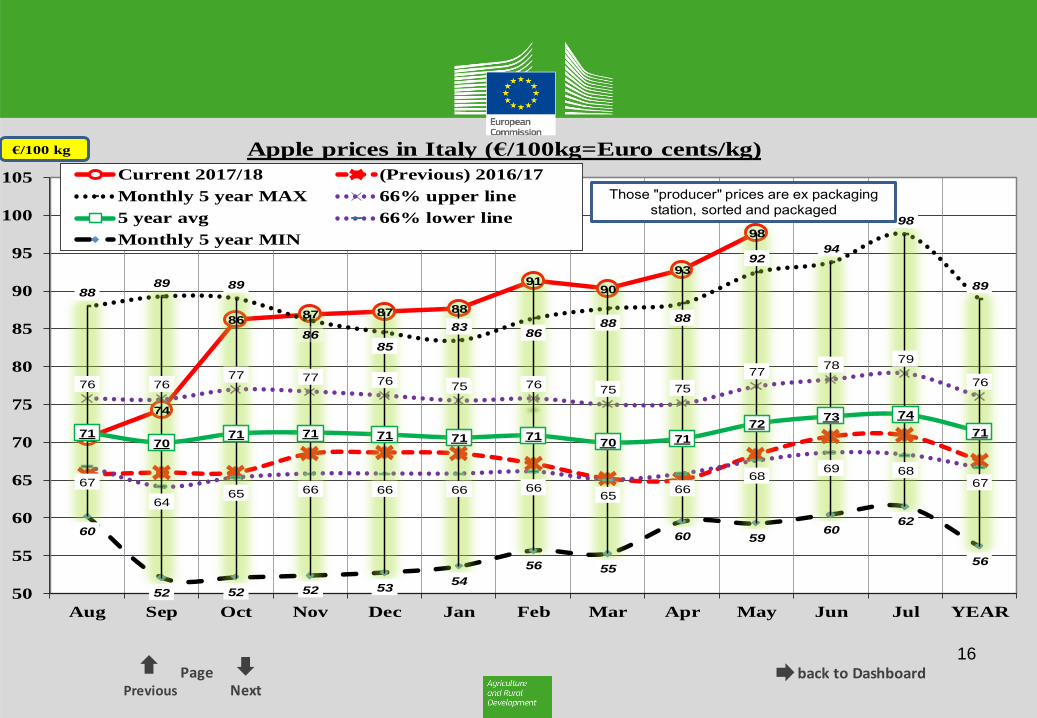
Apple prices in Italy (€/100kg=Euro cents/kg)
Current 2017/18 (Previous) 2016/17
Monthly 5 year MAX 66% upper line
5 year avg 66% lower line
Monthly 5 year MIN
€/100 kg
Those "producer" prices are ex packaging station, sorted and packaged
107
111
9694
90
93
95
97
101
109
121
99
96
9999
101 101
103
106
112
107
114
105
101
8887
86 8586
8586
89
93
83
8687
94
84 84
82 8182
8081
83
87
7778
83
87
7980
7877
77
7677
78
81
70 69
7878
68
72 73
7172
7172 72
73
66 66
71
65
70
75
80
85
90
95
100
105
110
115
120
Aug Sep Oct Nov Dec Jan Feb Mar Apr May Jun Jul YEAR
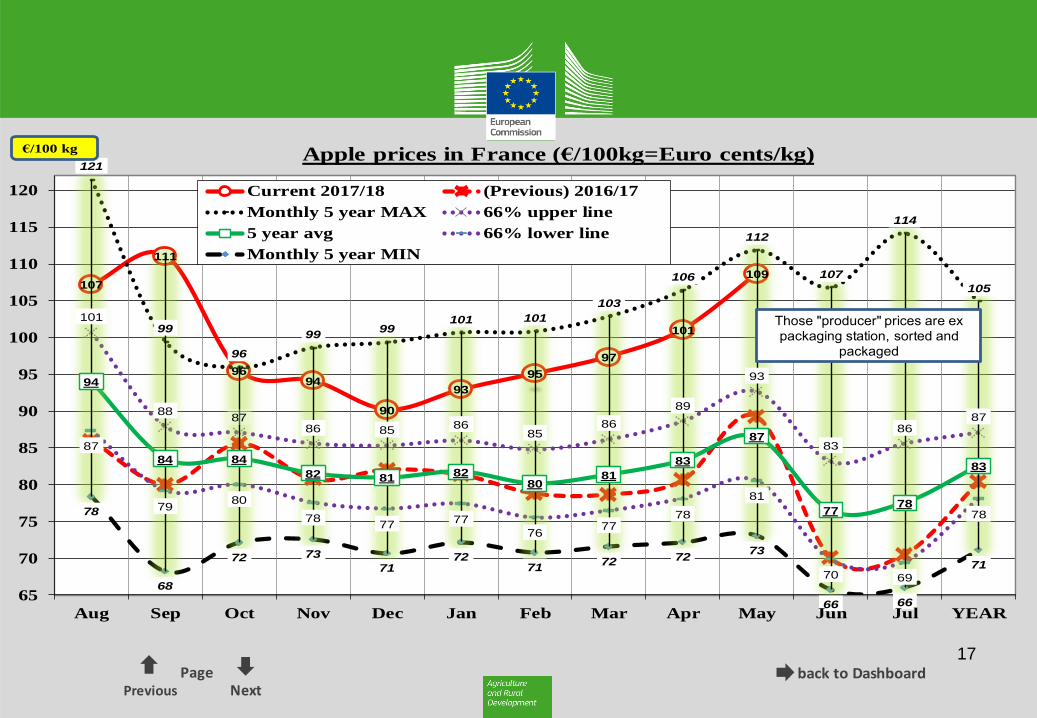
Apple prices in France (€/100kg=Euro cents/kg)
Current 2017/18 (Previous) 2016/17
Monthly 5 year MAX 66% upper line
5 year avg 66% lower line
Monthly 5 year MIN
€/100 kg
Those "producer" prices are ex packaging station, sorted and
packaged
54
73
84
90 9189 89
95 94
99
56
6162
5758 57 57
56
60 6061
6059
46
51 50
47 47 4748 48
49 4950 50
48
42
4644
41 42 4244 43
44 4446 46
44
38
4138
36 37 3839 38
40 4042 42
39
3230
23 2225
2628
29 30
33
38
3129
20
30
40
50
60
70
80
90
100
Aug Sep Oct Nov Dec Jan Feb Mar Apr May Jun Jul YEAR
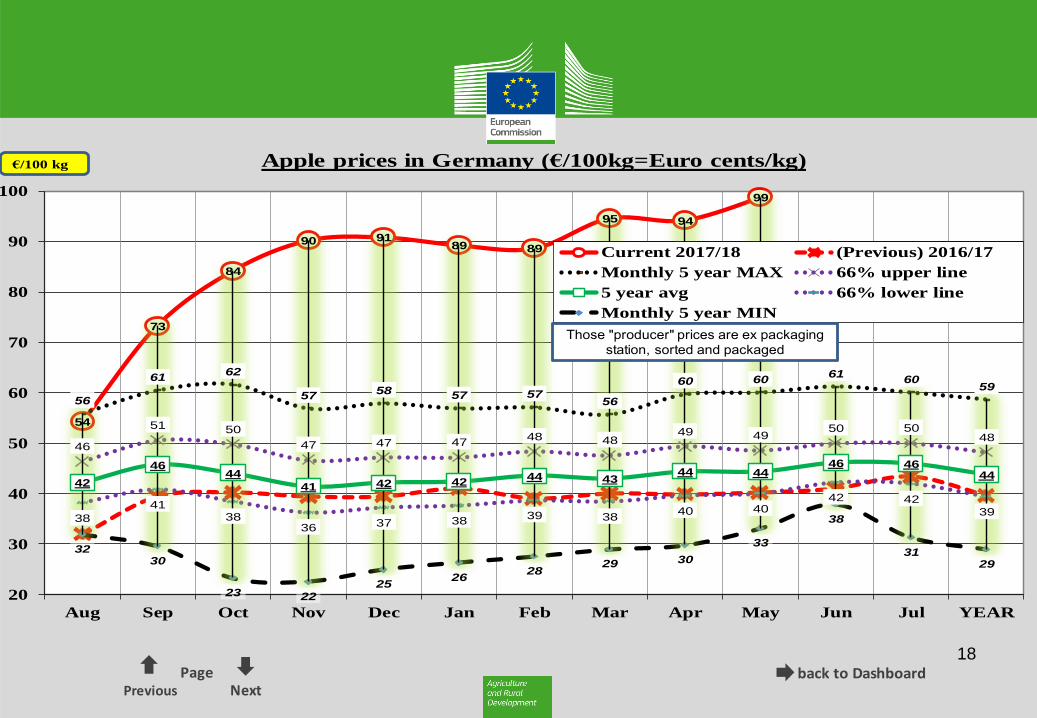
Apple prices in Germany (€/100kg=Euro cents/kg)
Current 2017/18 (Previous) 2016/17
Monthly 5 year MAX 66% upper line
5 year avg 66% lower line
Monthly 5 year MIN
€/100 kg
Those "producer" prices are ex packaging station, sorted and packaged
66
74
7678
77 77
79
81
83
88
75
6867
65 65 65
67 67
72
78 7779
70
64
60 6059 59 58 59 59
61
6463 63
60
60
5655
54 55 55 55 5557
60
58 5856
56
5251
5051 51 51 51
53
55
53 52 53
49
42
40 4142
4344
4748
50
4644 45
35
40
45
50
55
60
65
70
75
80
85
90
Aug Sep Oct Nov Dec Jan Feb Mar Apr May Jun Jul YEAR
Apple prices in the EU (€/100kg=Euro cents/kg) Simple avg of 4 MSs (the 4 major producers)
Current 2017/18 (Previous) 2016/17
Monthly 5 year MAX 66% upper line
5 year avg 66% lower line
€/100 kg
Those "producer" prices are ex packaging station, sorted and packaged
300 000
500 000
700 000
900 000
1 100 000
1 300 000
1 500 000
1 700 000
1 900 000
2005/06 2006/07 2007/08 2008/09 2009/10 2010/11 2011/12 2012/13 2013/14 2014/15 2015/16 2016/17 2017/18[f]
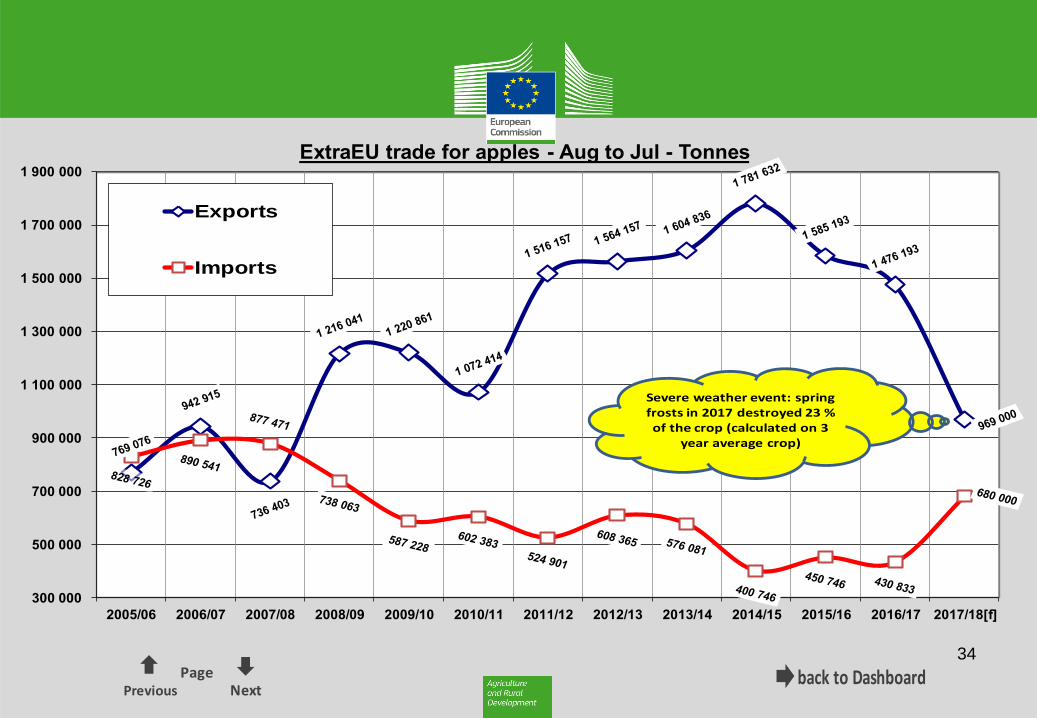
ExtraEU trade for apples - Aug to Jul - Tonnes
Exports
Imports
Severe weather event: spring frosts in 2017 destroyed 23 % of the crop (calculated on 3
year average crop)
2 246
2 080
1 676
1 5281 651
1 5791 701
1 1691 576
1 444
1 674
1 5151 396
2 1922 131
2 196 2 1642 237
2 1792 293
1 939
2 122
2 456
2 280 2 272
1 757
2 075
2 305
1 100
3 200
2 600
1 850
2 500
2 900
3 170
3 750
3 9794 035
2 870
891948
1 070 1 047 1 071
835953 972
804
1 116
9731 033
555
4 294 4 328
3 809 3 456
3 450
3 296 3 300
3 113
3 2593 744
3 359
2 923
2 766
0
500
1 000
1 500
2 000
2 500
3 000
3 500
4 000
4 500
5 000
2005/06 2006/07 2007/08 2008/09 2009/10 2010/11 2011/12 2012/13 2013/14 2014/15 2015/16 2016/17 2017/18[f]
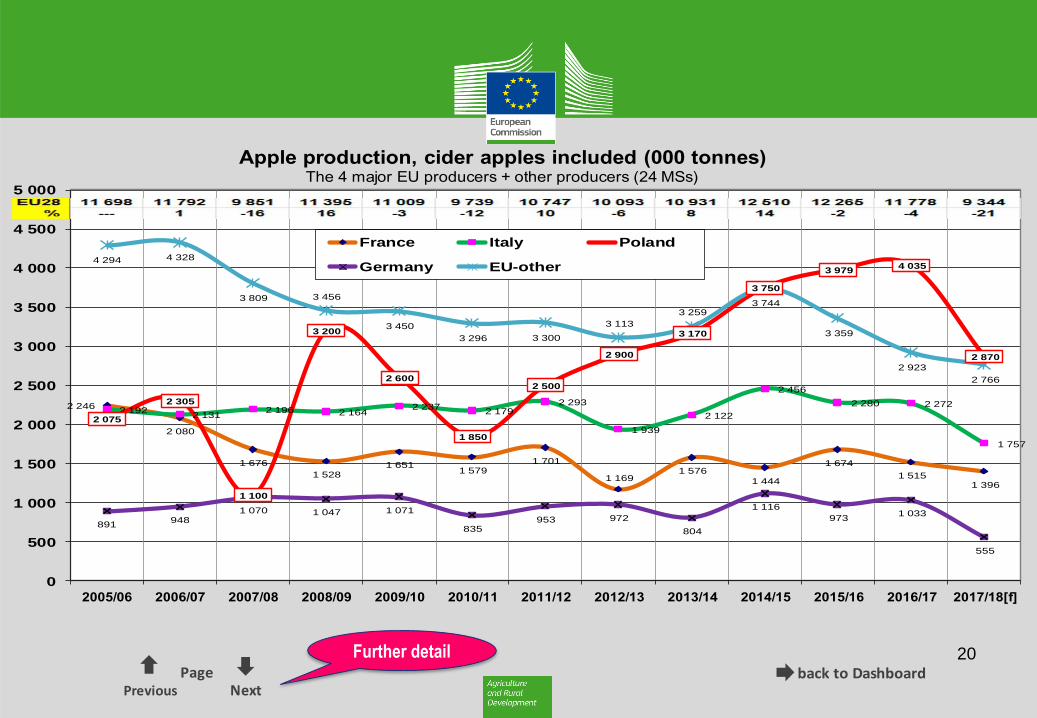
Apple production, cider apples included (000 tonnes)The 4 major EU producers + other producers (24 MSs)
France Italy Poland
Germany EU-other
back to DashboardPrevious
PageNext
2
INDEX
0. Summary overview, market update
1. Prices
* EU prices
* MS prices for major producers
2. Production (by variety + extreme weather events + stocks)
3. Trade
* Evolution of the trade balance
* Import monitoring
* Export development
4. Key balance indicators including CONSUMPTION
5. Export diversification
back to DashboardPrevious
PageNext
3
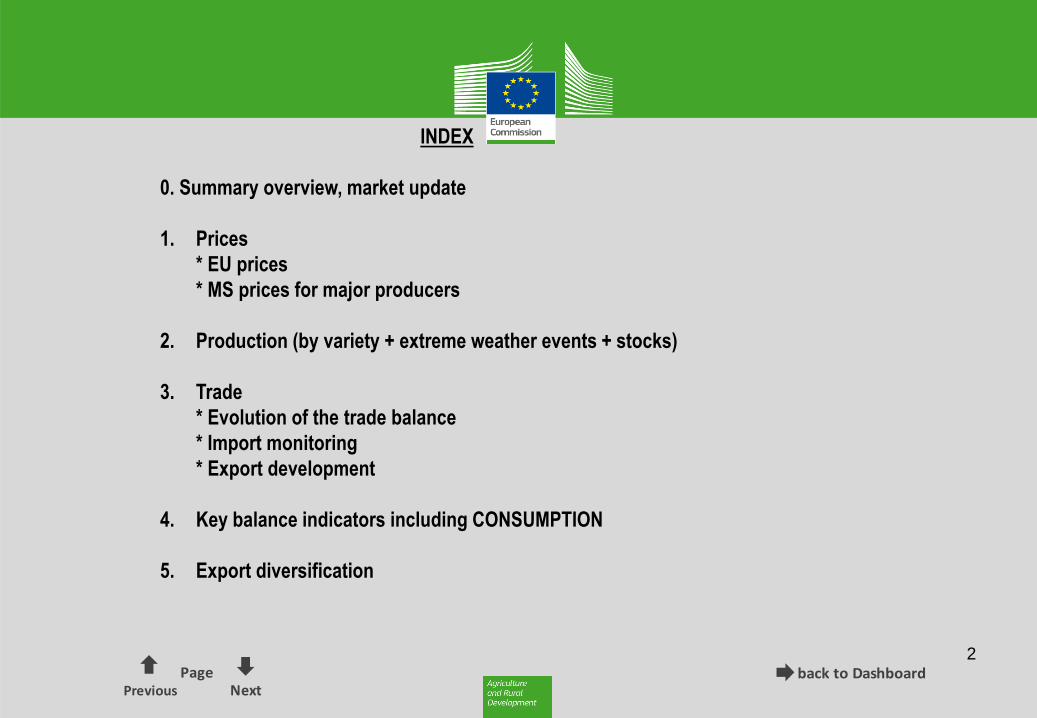
0. SUMMARY OVERVIEW, MARKET UPDATE
RECENT DEVELOPMENTS
1. The EU average price moved from 81 (*) EuroCents/kg in March to 83 (*) in April this year which implies evolving in line with the seasonal factors and
remaining at 46% above the reference's period average.
2. At MS level prices are increasing slightly in nominal terms in all cases; when taking account for the seasonal factors, however, minor reductions were
implicitly recorded in DE and PL.
3. Significant changes were registered during the last month in the international environment. China, a country representing over a half of the world's
production and a major exporter, suffered a severe frost that could imply an important reduction of the world's supply and, therefore, favourable
conditions for EU exports in Asia.
4. A substancial rise of the EU supply is expected for the next marketing year in absence of adverse weather conditions.
5. In conclusion, the impact on prices of the forecasted expansion of the EU supply for the incoming marketing year could be counter-balanced in case of
confirmation of a large reduction of China's supply.
(*) Minor last minute adjustments on previously disseminated figures are possible due to additional notifications coming from Member States.
Background
back to DashboardPrevious
PageNext
4
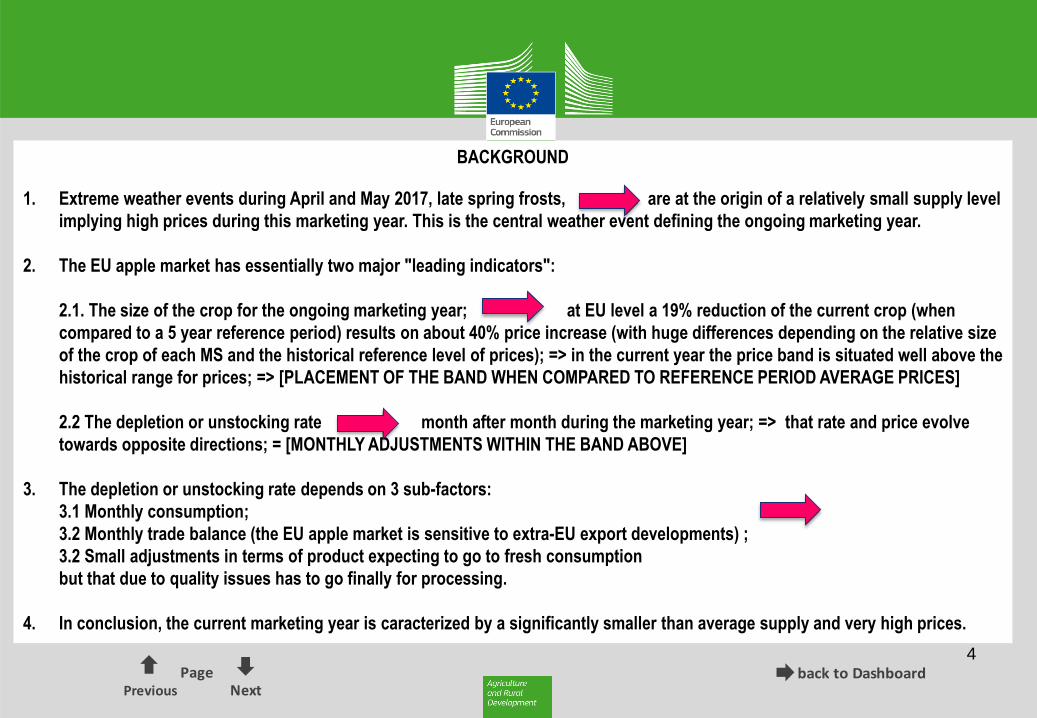
BACKGROUND
1. Extreme weather events during April and May 2017, late spring frosts, are at the origin of a relatively small supply level
implying high prices during this marketing year. This is the central weather event defining the ongoing marketing year.
2. The EU apple market has essentially two major "leading indicators":
2.1. The size of the crop for the ongoing marketing year; at EU level a 19% reduction of the current crop (when
compared to a 5 year reference period) results on about 40% price increase (with huge differences depending on the relative size
of the crop of each MS and the historical reference level of prices); => in the current year the price band is situated well above the
historical range for prices; => [PLACEMENT OF THE BAND WHEN COMPARED TO REFERENCE PERIOD AVERAGE PRICES]
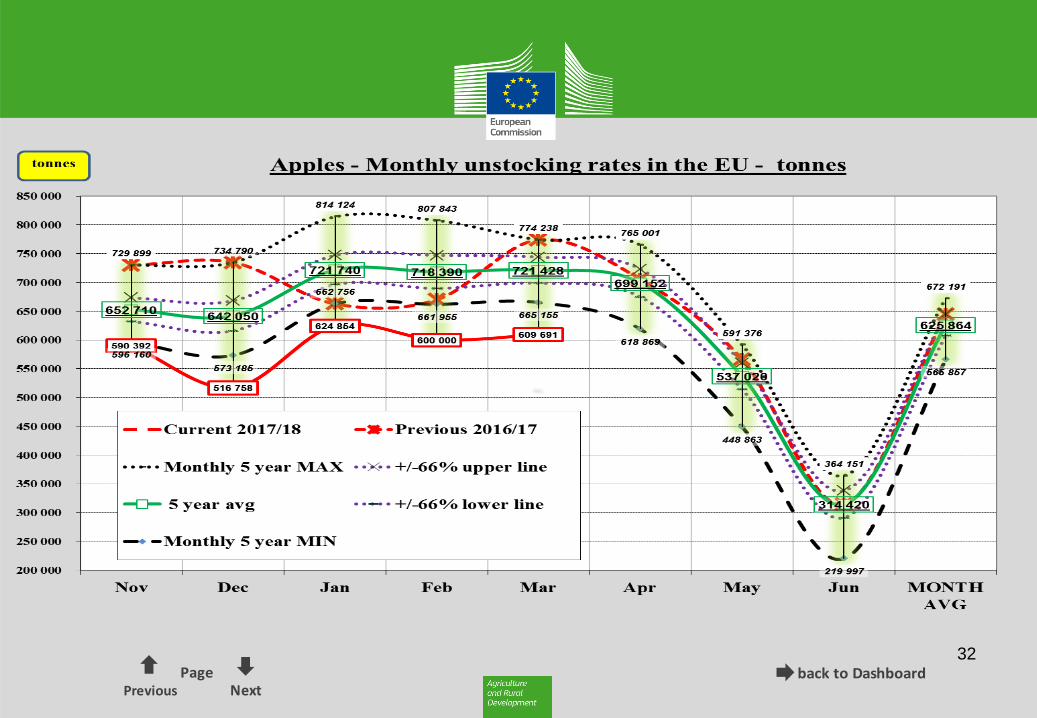
2.2 The depletion or unstocking rate month after month during the marketing year; => that rate and price evolve
towards opposite directions; = [MONTHLY ADJUSTMENTS WITHIN THE BAND ABOVE]
3. The depletion or unstocking rate depends on 3 sub-factors:
3.1 Monthly consumption;
3.2 Monthly trade balance (the EU apple market is sensitive to extra-EU export developments) ;
3.2 Small adjustments in terms of product expecting to go to fresh consumption
but that due to quality issues has to go finally for processing.
4. In conclusion, the current marketing year is caracterized by a significantly smaller than average supply and very high prices.
back to DashboardPrevious
PageNext
5
1. PRICES
1.1. EU Prices
1.2. MS prices for major producers
* Poland (1st EU28 volume producer)
* Italy (2nd)
* France (3rd)
* Germany (4th)

back to DashboardPrevious
PageNext
6
66
74
7678
77 77
79
81
83
88
75
6867
65 65 65
67 67
72
78 7779
70
64
60 6059 59 58 59 59
61
6463 63
60
60
5655
54 55 55 55 5557
60
58 5856
56
5251
5051 51 51 51
53
55
53 52 53
49
42
40 4142
4344
4748
50
4644 45
35
40
45
50
55
60
65
70
75
80
85
90
Aug Sep Oct Nov Dec Jan Feb Mar Apr May Jun Jul YEAR
Apple prices in the EU (€/100kg=Euro cents/kg) Simple avg of 4 MSs (the 4 major producers)
Current 2017/18 (Previous) 2016/17
Monthly 5 year MAX 66% upper line
5 year avg 66% lower line
€/100 kg
Those "producer" prices are ex packaging station, sorted and packaged
Market summary
back to DashboardPrevious
PageNext
7
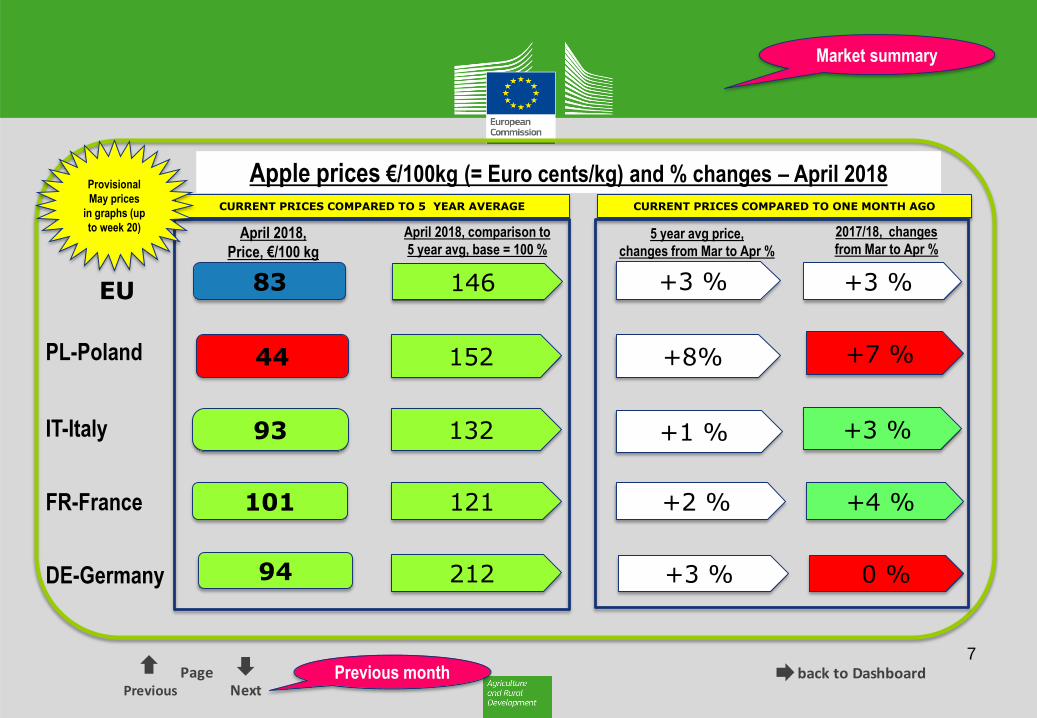
+3 %
+8%
+1 %
+2 %
83
44
93
101
146
152
132
121
EU
PL-Poland
IT-Italy
FR-France
April 2018,
Price, €/100 kg
2017/18, changes
from Mar to Apr % 5 year avg price,
changes from Mar to Apr %
April 2018, comparison to
5 year avg, base = 100 %
Apple prices €/100kg (= Euro cents/kg) and % changes – April 2018
+3 %
+7 %
+3 %
+4 %
+3 % 94 212 DE-Germany 0 %
CURRENT PRICES COMPARED TO 5 YEAR AVERAGE CURRENT PRICES COMPARED TO ONE MONTH AGO
Provisional
May prices
in graphs (up
to week 20)
Market summary
Previous month
back to DashboardPrevious
PageNext
8
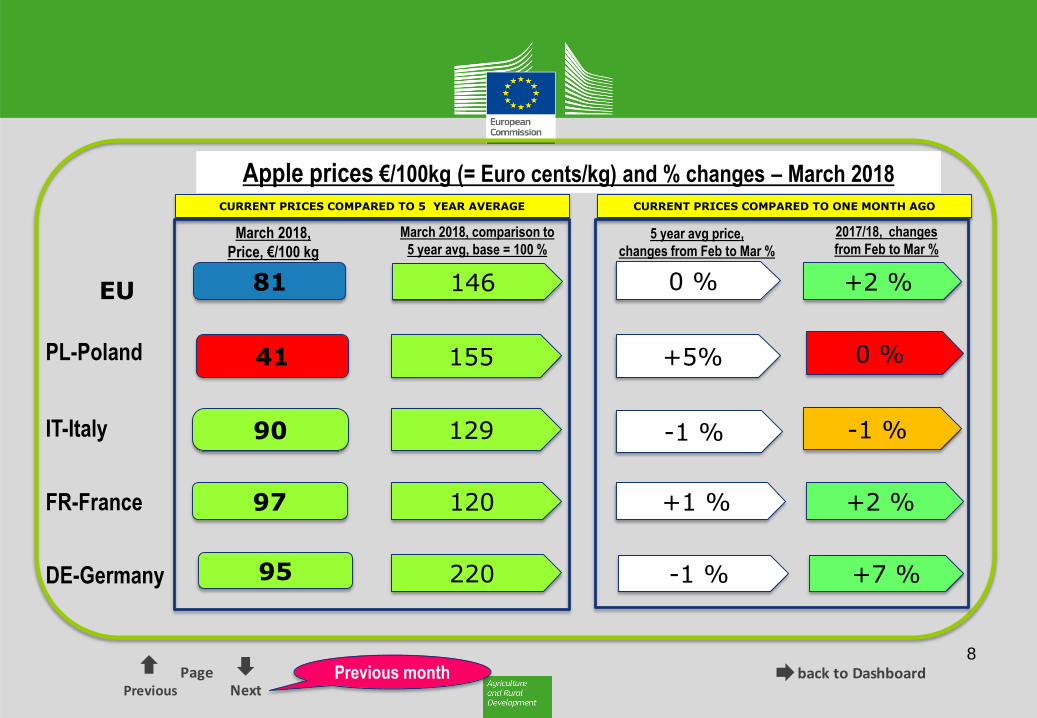
0 %
+5%
-1 %
+1 %
81
41
90
97
146
155
129
120
EU
PL-Poland
IT-Italy
FR-France
March 2018,
Price, €/100 kg
2017/18, changes
from Feb to Mar % 5 year avg price,
changes from Feb to Mar %
March 2018, comparison to
5 year avg, base = 100 %
Apple prices €/100kg (= Euro cents/kg) and % changes – March 2018
+2 %
0 %
-1 %
+2 %
-1 % 95 220 DE-Germany +7 %
CURRENT PRICES COMPARED TO 5 YEAR AVERAGE CURRENT PRICES COMPARED TO ONE MONTH AGO
Previous month
back to DashboardPrevious
PageNext
9
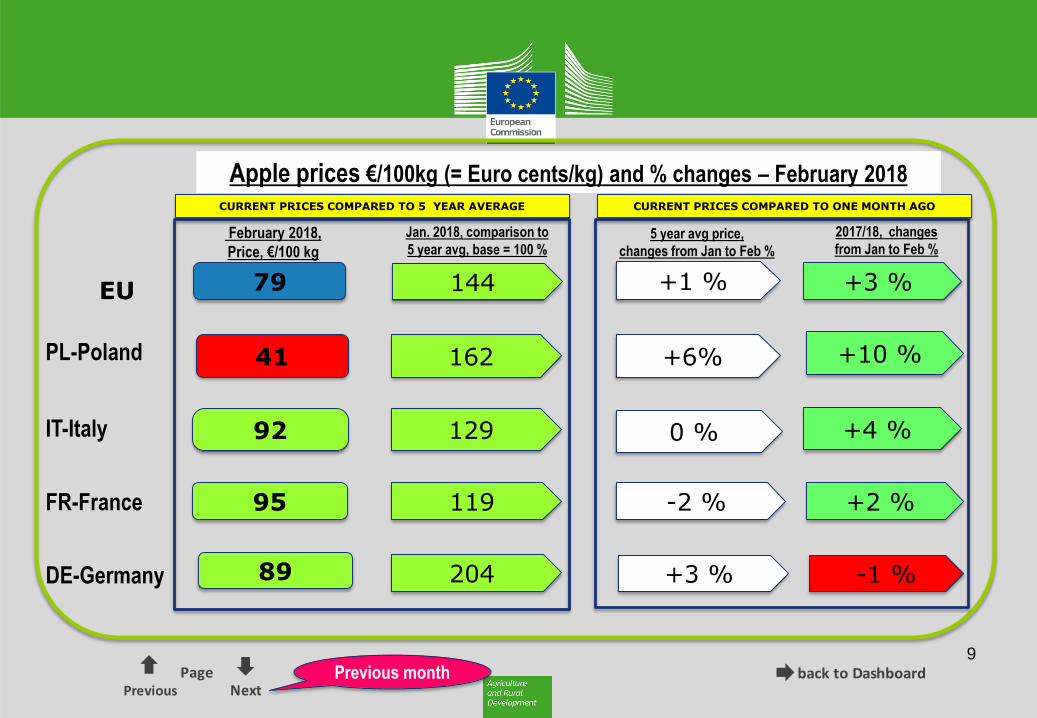
+1 %
+6%
0 %
-2 %
79
41
92
95
144
162
129
119
EU
PL-Poland
IT-Italy
FR-France
February 2018,
Price, €/100 kg
2017/18, changes
from Jan to Feb % 5 year avg price,
changes from Jan to Feb %
Jan. 2018, comparison to
5 year avg, base = 100 %
Apple prices €/100kg (= Euro cents/kg) and % changes – February 2018
+3 %
+10 %
+4 %
+2 %
+3 % 89 204 DE-Germany -1 %
CURRENT PRICES COMPARED TO 5 YEAR AVERAGE CURRENT PRICES COMPARED TO ONE MONTH AGO
Previous month
back to DashboardPrevious
PageNext
10
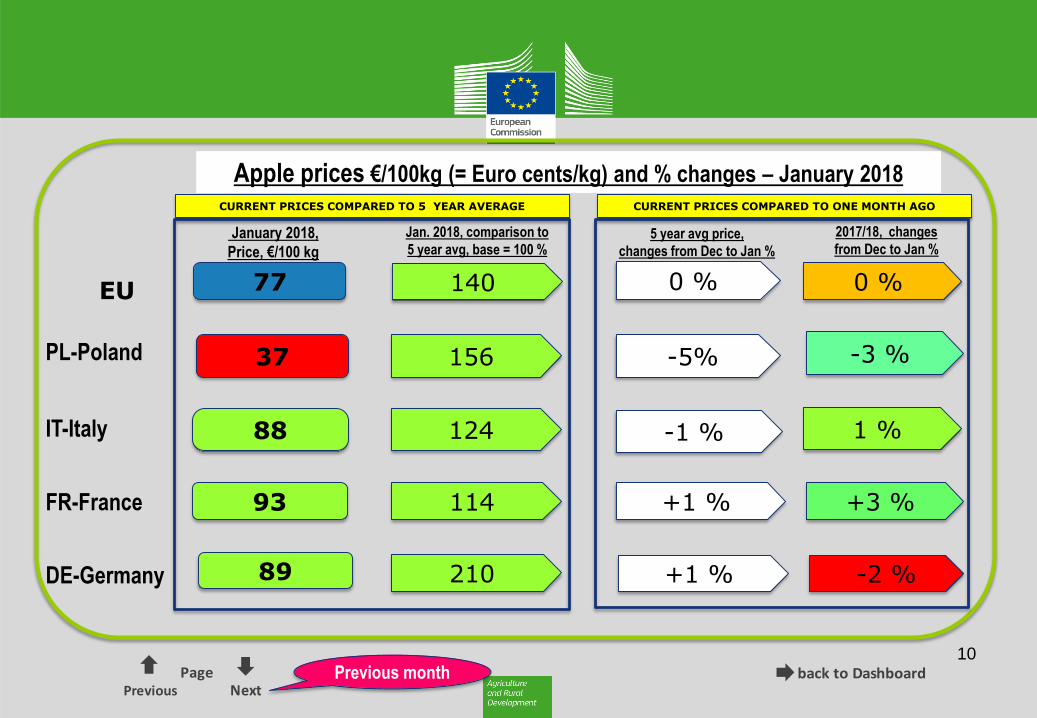
0 %
-5%
-1 %
+1 %
77
37
88
93
140
156
124
114
EU
PL-Poland
IT-Italy
FR-France
January 2018,
Price, €/100 kg
2017/18, changes
from Dec to Jan % 5 year avg price,
changes from Dec to Jan %
Jan. 2018, comparison to
5 year avg, base = 100 %
Apple prices €/100kg (= Euro cents/kg) and % changes – January 2018
0 %
-3 %
1 %
+3 %
+1 % 89 210 DE-Germany -2 %
CURRENT PRICES COMPARED TO 5 YEAR AVERAGE CURRENT PRICES COMPARED TO ONE MONTH AGO
Previous month
back to DashboardPrevious
PageNext
11
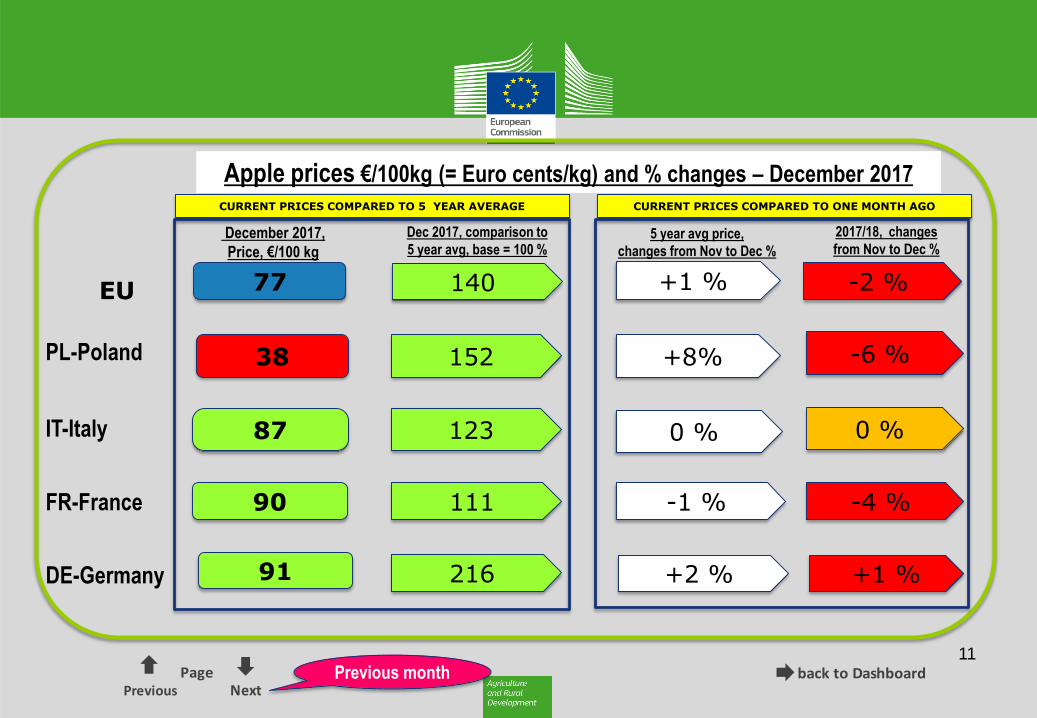
+1 %
+8%
0 %
-1 %
77
38
87
90
140
152
123
111
EU
PL-Poland
IT-Italy
FR-France
December 2017,
Price, €/100 kg
2017/18, changes
from Nov to Dec % 5 year avg price,
changes from Nov to Dec %
Dec 2017, comparison to
5 year avg, base = 100 %
Apple prices €/100kg (= Euro cents/kg) and % changes – December 2017
-2 %
-6 %
0 %
-4 %
+2 % 91 216 DE-Germany +1 %
CURRENT PRICES COMPARED TO 5 YEAR AVERAGE CURRENT PRICES COMPARED TO ONE MONTH AGO
Previous month
back to DashboardPrevious
PageNext
12
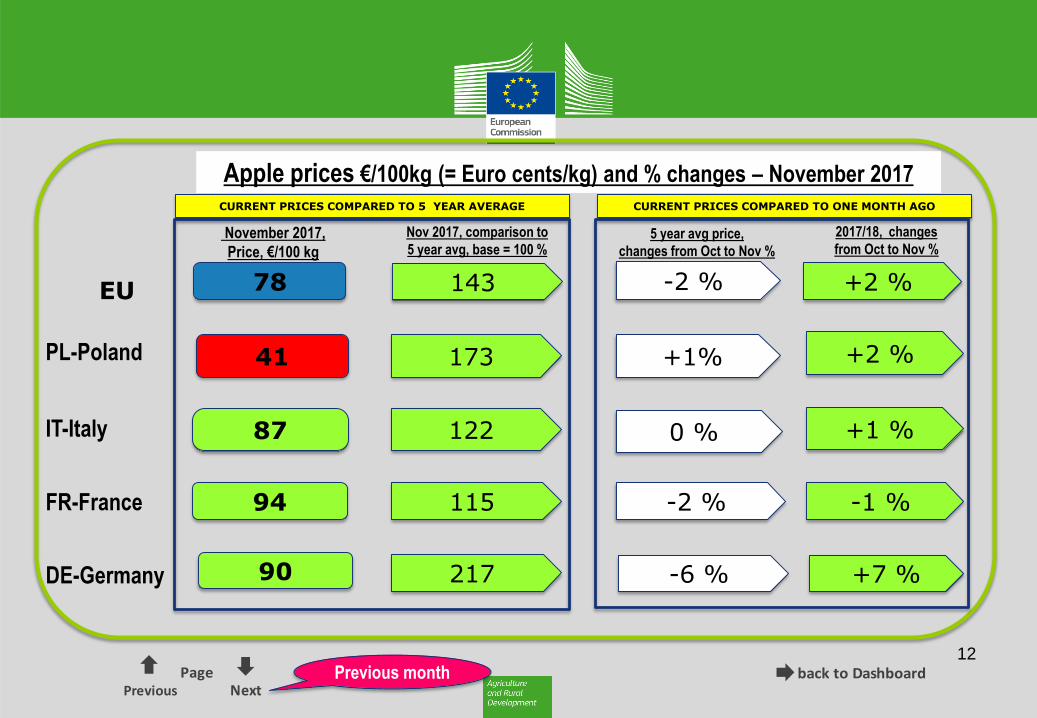
-2 %
+1%
0 %
-2 %
78
41
87
94
143
173
122
115
EU
PL-Poland
IT-Italy
FR-France
November 2017,
Price, €/100 kg
2017/18, changes
from Oct to Nov % 5 year avg price,
changes from Oct to Nov %
Nov 2017, comparison to
5 year avg, base = 100 %
Apple prices €/100kg (= Euro cents/kg) and % changes – November 2017
+2 %
+2 %
+1 %
-1 %
-6 % 90 217 DE-Germany +7 %
CURRENT PRICES COMPARED TO 5 YEAR AVERAGE CURRENT PRICES COMPARED TO ONE MONTH AGO
Previous month
back to DashboardPrevious
PageNext
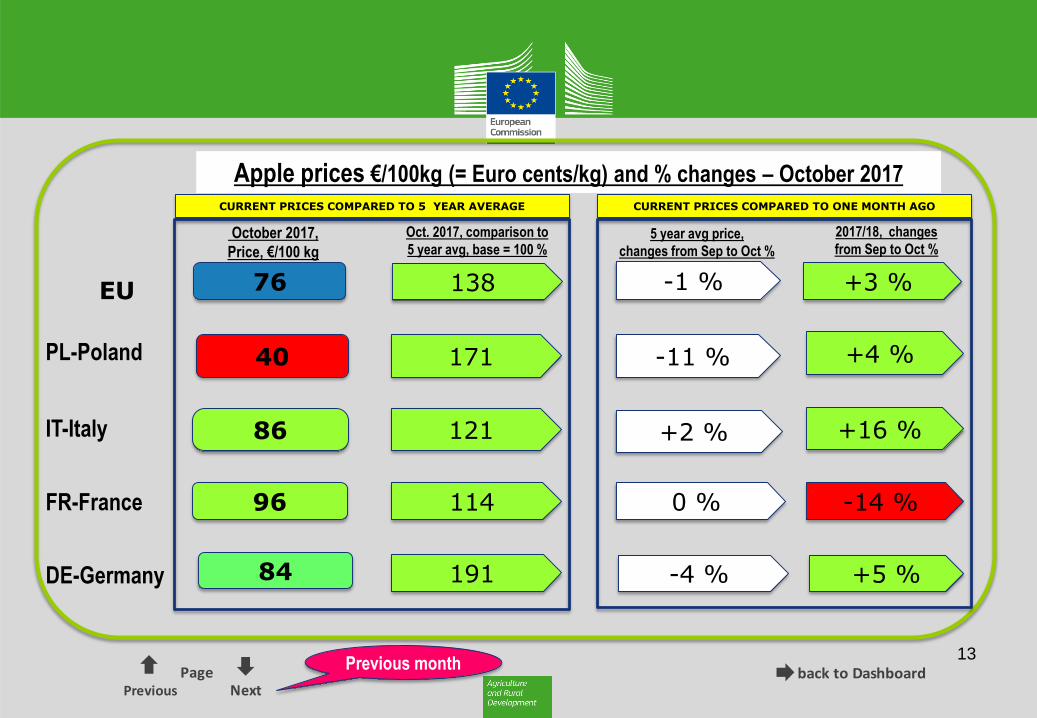
13
-1 %
-11 %
+2 %
0 %
76
40
86
96
138
171
121
114
EU
PL-Poland
IT-Italy
FR-France
October 2017,
Price, €/100 kg
2017/18, changes
from Sep to Oct % 5 year avg price,
changes from Sep to Oct %
Oct. 2017, comparison to
5 year avg, base = 100 %
Apple prices €/100kg (= Euro cents/kg) and % changes – October 2017
+3 %
+4 %
+16 %
-14 %
-4 % 84 191 DE-Germany +5 %
CURRENT PRICES COMPARED TO 5 YEAR AVERAGE CURRENT PRICES COMPARED TO ONE MONTH AGO
Previous month
back to DashboardPrevious
PageNext
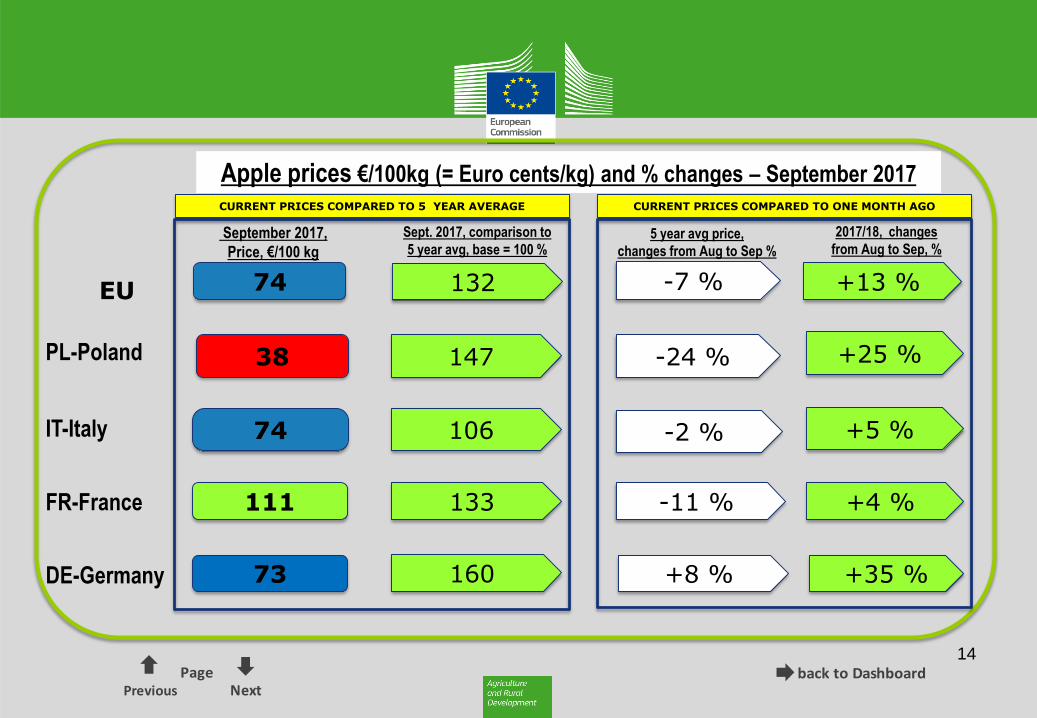
14
-7 %
-24 %
-2 %
-11 %
74
38
74
111
132
147
106
133
EU
PL-Poland
IT-Italy
FR-France
September 2017,
Price, €/100 kg
2017/18, changes
from Aug to Sep, % 5 year avg price,
changes from Aug to Sep %
Sept. 2017, comparison to
5 year avg, base = 100 %
Apple prices €/100kg (= Euro cents/kg) and % changes – September 2017
+13 %
+25 %
+5 %
+4 %
+8 % 73 160 DE-Germany +35 %
CURRENT PRICES COMPARED TO 5 YEAR AVERAGE CURRENT PRICES COMPARED TO ONE MONTH AGO
back to DashboardPrevious
PageNext
15
30
38
4040
3837
41 41
44
48
48
33
31
34
32
31
34
36
38
47
47 47
3838
28
2526
27
25
27
29
32
40 39
38
30
34
26
23 23
25
24
25
26
29
35 34
33
2830
24
21
2324
26
3030
28
27
22
20
1415
20 20 2019
18 1817
19 18
10
15
20
25
30
35
40
45
50
Aug Sep Oct Nov Dec Jan Feb Mar Apr May Jun Jul YEAR
Apple prices in Poland (€/100kg=Euro cents/kg)
Current 2017/18 (Previous) 2016/17Monthly 5 year MAX 66% upper line5 year avg 66% lower lineMonthly 5 year MIN
€/100 kg€/100 kg
back to DashboardPrevious
PageNext
16
71
74
8687 87 88
9190
93
98
8889 89
8685
8386
88 88
9294
98
89
76 7677 77 76
75 7675 75
7778
79
76
7170
71 71 71 71 7170 71
7273 74
71
67
6465 66 66 66 66
6566
6869 68
67
60
52 52 52 5354
56 55
60 5960
62
56
50
55
60
65
70
75
80
85
90
95
100
105
Aug Sep Oct Nov Dec Jan Feb Mar Apr May Jun Jul YEAR
Apple prices in Italy (€/100kg=Euro cents/kg)
Current 2017/18 (Previous) 2016/17
Monthly 5 year MAX 66% upper line
5 year avg 66% lower line
Monthly 5 year MIN
€/100 kg
Those "producer" prices are ex packaging station, sorted and packaged
\\net1.cec.eu.int\AGRI\C\4\C5 DATA\5. CEREALES\DASHBOARD\Dashboard_Cereals_Blue.xlsx - 'Dashboard (2)'!W64
back to DashboardPrevious
PageNext
17
107
111
9694
90
93
95
97
101
109
121
99
96
9999
101 101
103
106
112
107
114
105
101
8887
86 8586
8586
89
93
83
8687
94
84 84
82 8182
8081
83
87
7778
83
87
7980
7877
77
7677
78
81
70 69
7878
68
72 73
7172
7172 72
73
66 66
71
65
70
75
80
85
90
95
100
105
110
115
120
Aug Sep Oct Nov Dec Jan Feb Mar Apr May Jun Jul YEAR
Apple prices in France (€/100kg=Euro cents/kg)
Current 2017/18 (Previous) 2016/17
Monthly 5 year MAX 66% upper line
5 year avg 66% lower line
Monthly 5 year MIN
€/100 kg
Those "producer" prices are ex packaging station, sorted and
packaged
\\net1.cec.eu.int\AGRI\C\4\C5 DATA\5. CEREALES\DASHBOARD\Dashboard_Cereals_Blue.xlsx - 'Dashboard (2)'!W64
back to DashboardPrevious
PageNext
18
54
73
84
90 9189 89
95 94
99
56
6162
5758 57 57
56
60 6061
6059
46
51 50
47 47 4748 48
49 4950 50
48
42
4644
41 42 4244 43
44 4446 46
44
38
4138
36 37 3839 38
40 4042 42
39
3230
23 2225
2628
29 30
33
38
3129
20
30
40
50
60
70
80
90
100
Aug Sep Oct Nov Dec Jan Feb Mar Apr May Jun Jul YEAR
Apple prices in Germany (€/100kg=Euro cents/kg)
Current 2017/18 (Previous) 2016/17
Monthly 5 year MAX 66% upper line
5 year avg 66% lower line
Monthly 5 year MIN
€/100 kg
Those "producer" prices are ex packaging station, sorted and packaged
back to DashboardPrevious
PageNext
19
2. PRODUCTION
2.1. EU production for MSs that are major producers
2.2. EU production by variety (%)
2.3. Extreme weather events
2.4. Apple stocks
\\net1.cec.eu.int\AGRI\C\4\C5 DATA\5. CEREALES\DASHBOARD\Dashboard_Cereals_Blue.xlsx - 'Dashboard (2)'!W64
back to DashboardPrevious
PageNext
20 Further detail
2 246
2 080
1 676
1 5281 651
1 5791 701
1 1691 576
1 444
1 674
1 5151 396
2 1922 131
2 196 2 1642 237
2 1792 293
1 939
2 122
2 456
2 280 2 272
1 757
2 075
2 305
1 100
3 200
2 600
1 850
2 500
2 900
3 170
3 750
3 9794 035
2 870
891948
1 070 1 047 1 071
835953 972
804
1 116
9731 033
555
4 294 4 328
3 809 3 456
3 450
3 296 3 300
3 113
3 2593 744
3 359
2 923
2 766
0
500
1 000
1 500
2 000
2 500
3 000
3 500
4 000
4 500
5 000
2005/06 2006/07 2007/08 2008/09 2009/10 2010/11 2011/12 2012/13 2013/14 2014/15 2015/16 2016/17 2017/18[f]
Apple production, cider apples included (000 tonnes)The 4 major EU producers + other producers (24 MSs)
France Italy Poland
Germany EU-other
back to DashboardPrevious
PageNext
21
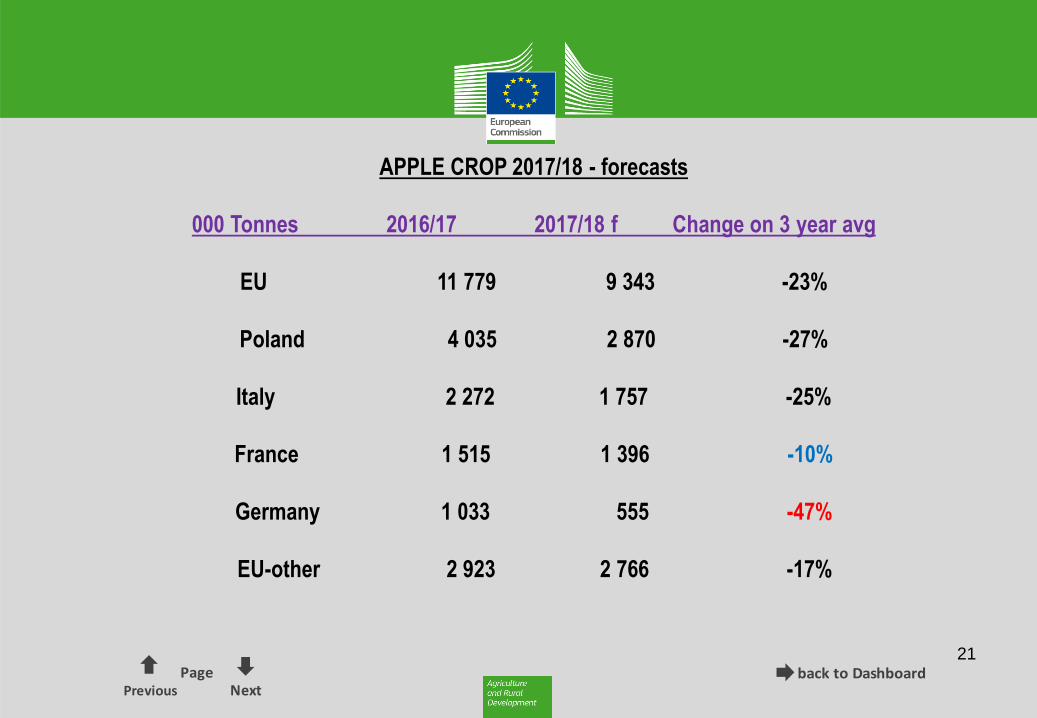
APPLE CROP 2017/18 - forecasts
000 Tonnes 2016/17 2017/18 f Change on 3 year avg
EU 11 779 9 343 -23%
Poland 4 035 2 870 -27%
Italy 2 272 1 757 -25%
France 1 515 1 396 -10%
Germany 1 033 555 -47%
EU-other 2 923 2 766 -17%

\\net1.cec.eu.int\AGRI\C\4\C5 DATA\5. CEREALES\DASHBOARD\Dashboard_Cereals_Blue.xlsx - 'Dashboard (2)'!W64
back to DashboardPrevious
PageNext
22

back to DashboardPrevious
PageNext
23
AGRO-WEATHER INDEX
1. Background with main elements
2. Summary multi-event map
* main events
3. Precipitation analysis
* 90 day
* 30 day
* maps of current or recent droughts in the EU
4. Temperature analysis
* 30 day average, °C, regional deviations
* Relative number of cold days
5. Other agro-weather events
General index
WEATHER FACTORS IN FRUIT AND VEGETABLE
PRODUCTIONS
Agro-weather index
back to DashboardPrevious
PageNext
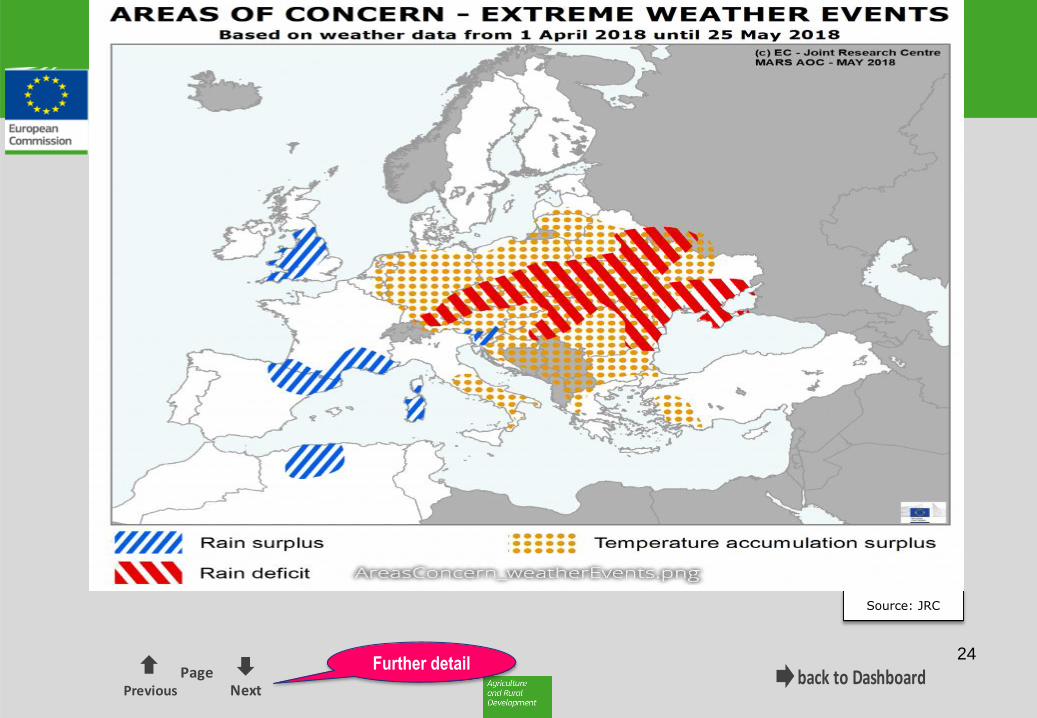
24
Source: JRC
Further detail
back to DashboardPrevious
PageNext
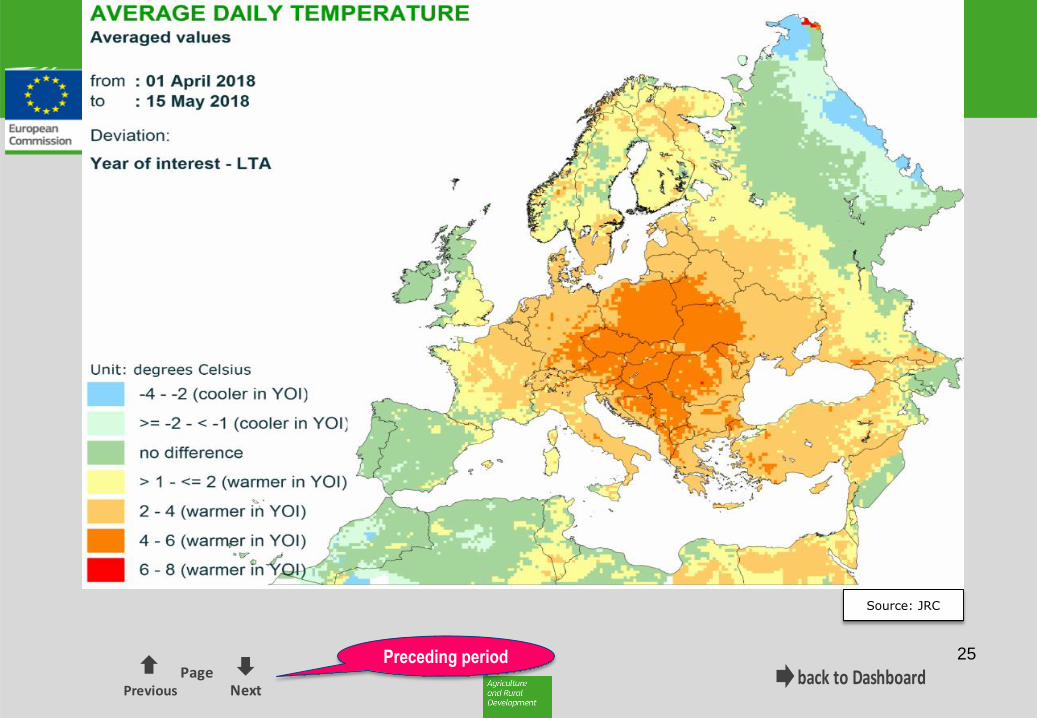
25 Preceding period
Source: JRC
back to DashboardPrevious
PageNext
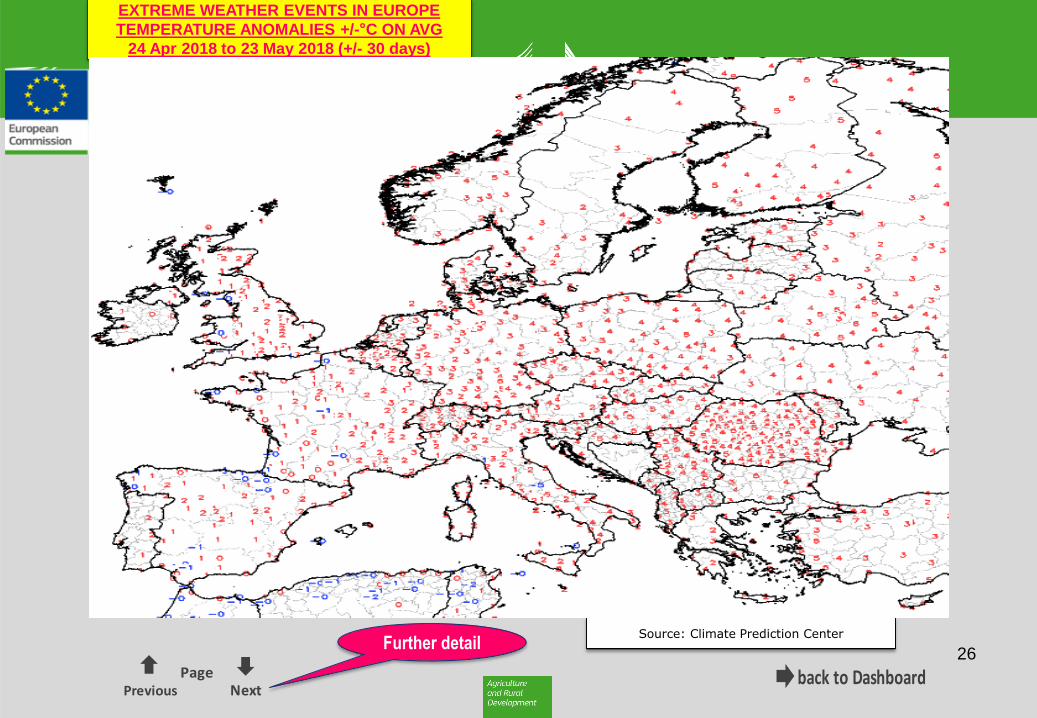
26 Further detail
EXTREME WEATHER EVENTS IN EUROPE
TEMPERATURE ANOMALIES +/-°C ON AVG
24 Apr 2018 to 23 May 2018 (+/- 30 days)
Source: Climate Prediction Center
back to DashboardPrevious
PageNext
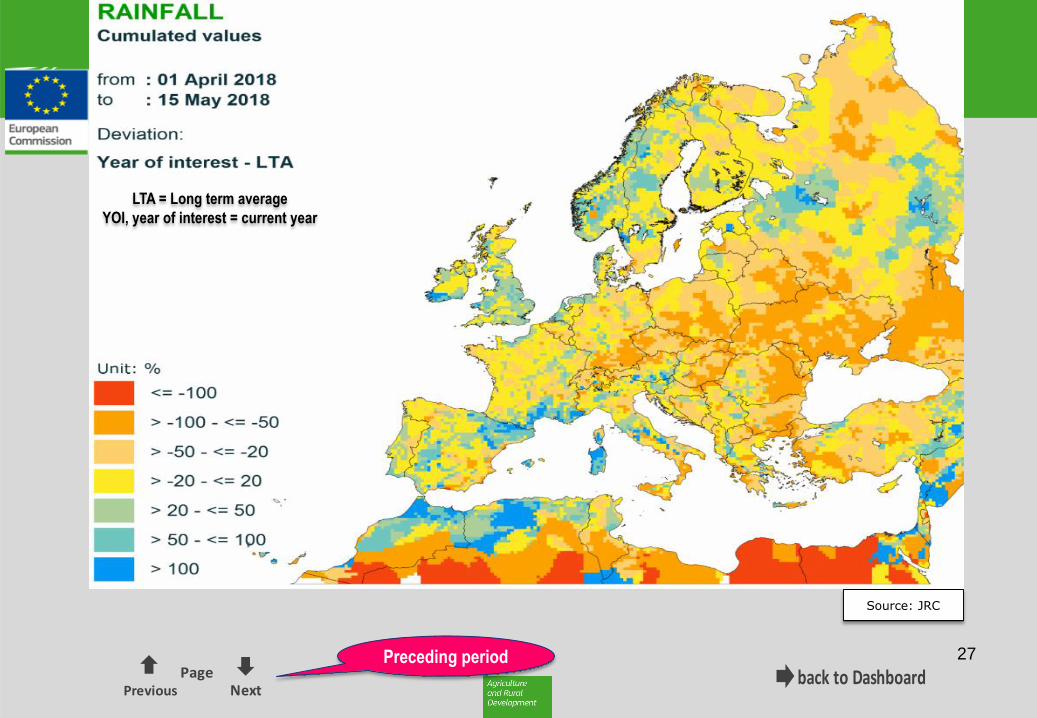
27 Preceding period
Source: JRC
LTA = Long term average
YOI, year of interest = current year
back to DashboardPrevious
PageNext
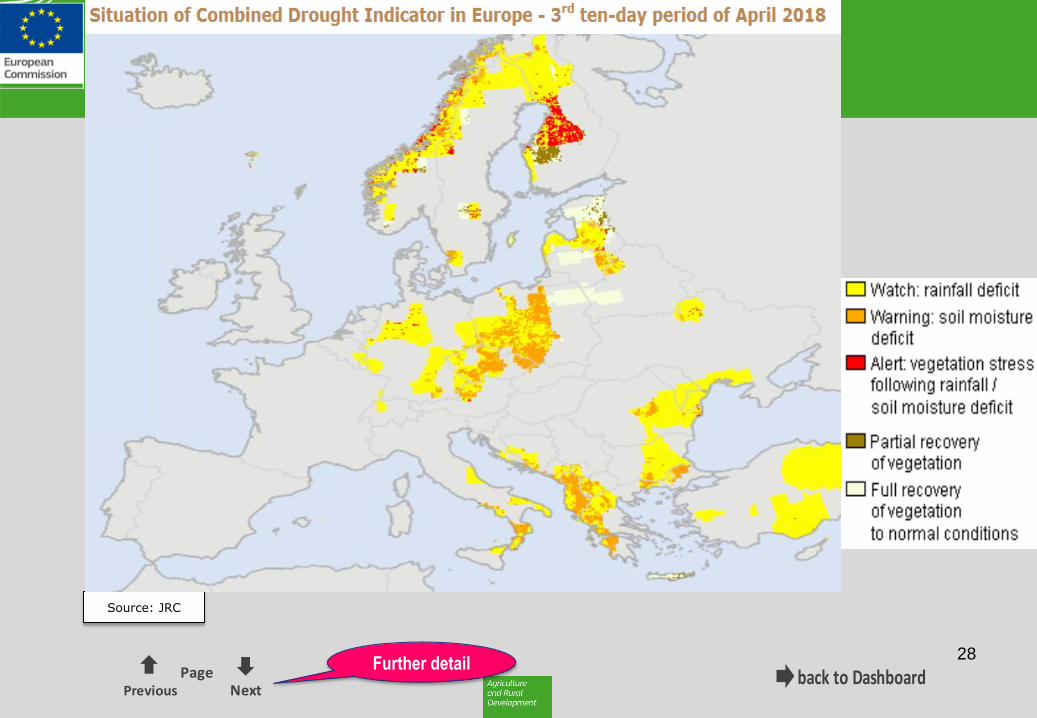
28 Further detail
Source: JRC
back to DashboardPrevious
PageNext
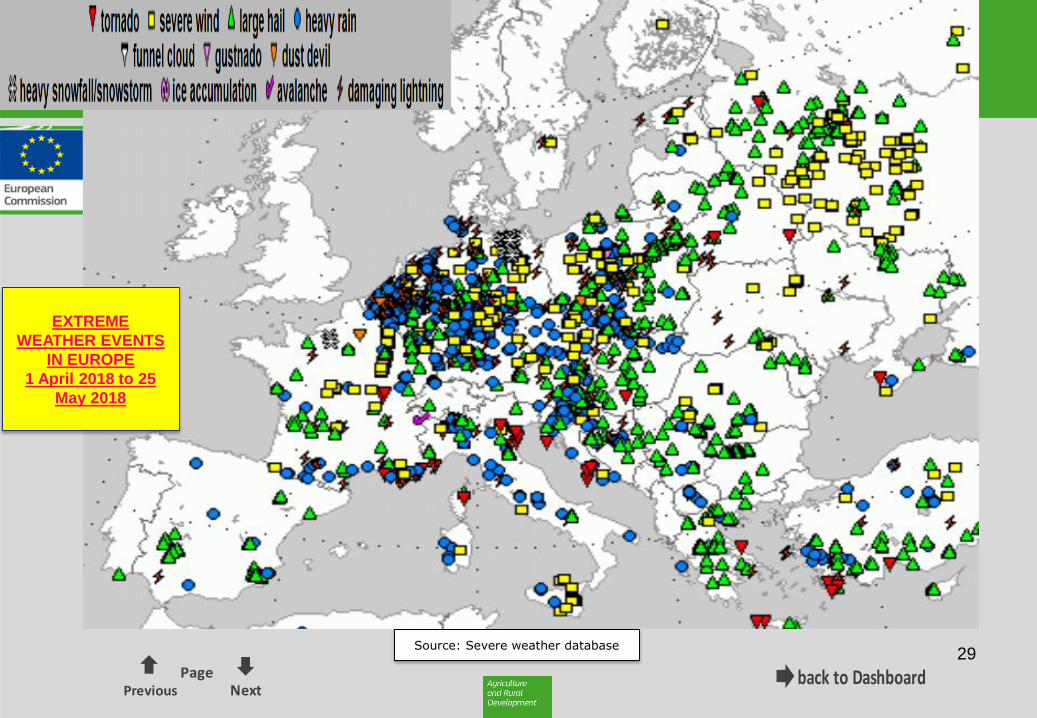
29
Main area of severe wind
Source: Severe weather database
EXTREME
WEATHER EVENTS
IN EUROPE
1 April 2018 to 25
May 2018

back to DashboardPrevious
PageNext
30 Further detail
SPRING 2017 (mid-April to
mid-May): huge damages to
the orchard crops mainly due
to frost and low temperatures
Agro-weather index
\\net1.cec.eu.int\AGRI\C\4\C5 DATA\5. CEREALES\DASHBOARD\Dashboard_Cereals_Blue.xlsx - 'Dashboard (2)'!W64
back to DashboardPrevious
PageNext
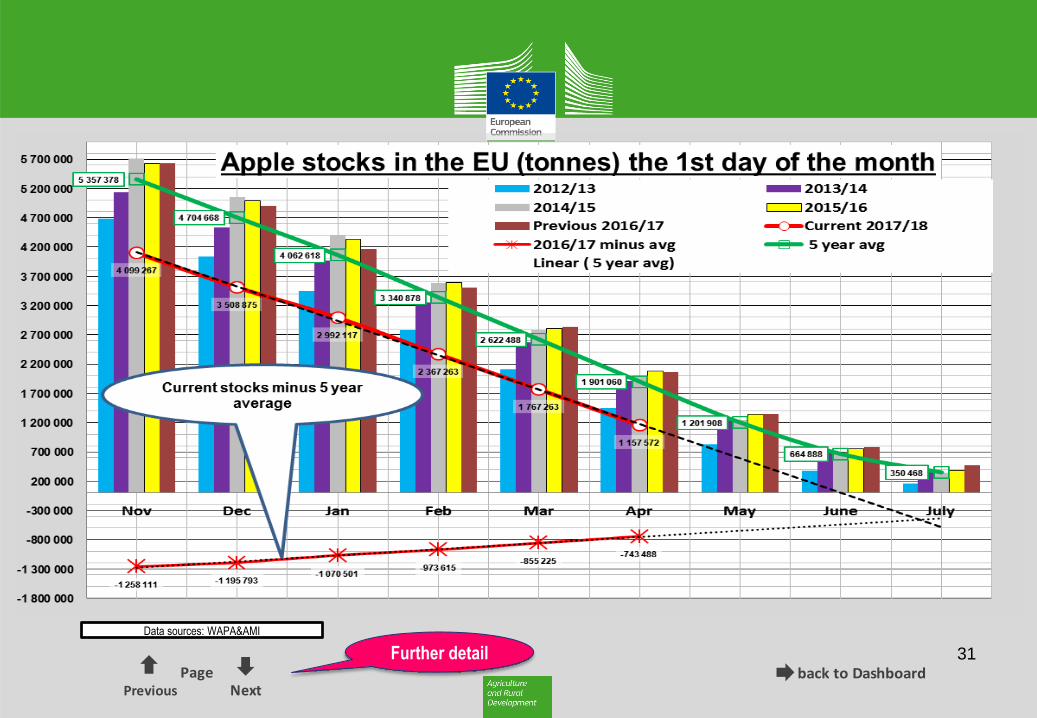
31
Data sources: WAPA&AMI
Further detail
\\net1.cec.eu.int\AGRI\C\4\C5 DATA\5. CEREALES\DASHBOARD\Dashboard_Cereals_Blue.xlsx - 'Dashboard (2)'!W64
back to DashboardPrevious
PageNext
32
back to DashboardPrevious
PageNext
33
3. TRADE
3.1. Evolution of the trade balance
3.2. Import monitoring
2.3. Export development (export diversification is under section 5)
back to DashboardPrevious
PageNext
34
300 000
500 000
700 000
900 000
1 100 000
1 300 000
1 500 000
1 700 000
1 900 000
2005/06 2006/07 2007/08 2008/09 2009/10 2010/11 2011/12 2012/13 2013/14 2014/15 2015/16 2016/17 2017/18[f]
ExtraEU trade for apples - Aug to Jul - Tonnes
Exports
Imports
Severe weather event: spring frosts in 2017 destroyed 23 % of the crop (calculated on 3
year average crop)
\\net1.cec.eu.int\AGRI\C\4\C5 DATA\5. CEREALES\DASHBOARD\Dashboard_Cereals_Blue.xlsx - 'Dashboard (2)'!W64
back to DashboardPrevious
PageNext
35
back to DashboardPrevious
PageNext
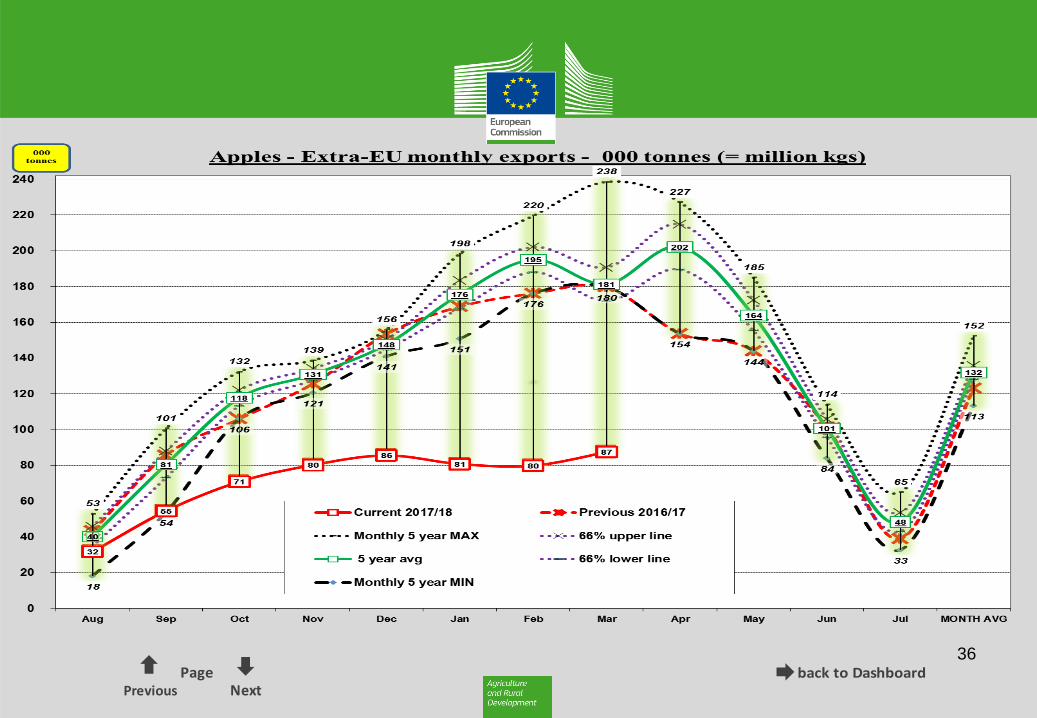
36
back to DashboardPrevious
PageNext
37
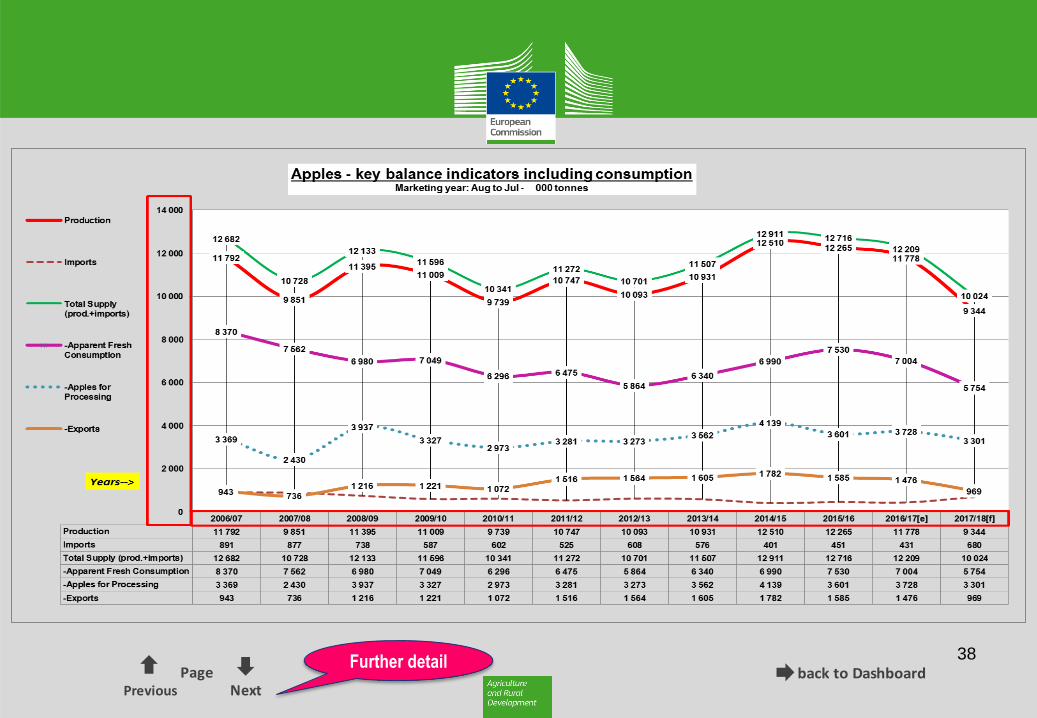
4. KEY BALANCE INDICATORS
including CONSUMPTION
- Production
- Imports
- Total supply (production +imports)
* Apparent fresh consumption
* Apples for processing
* Exports
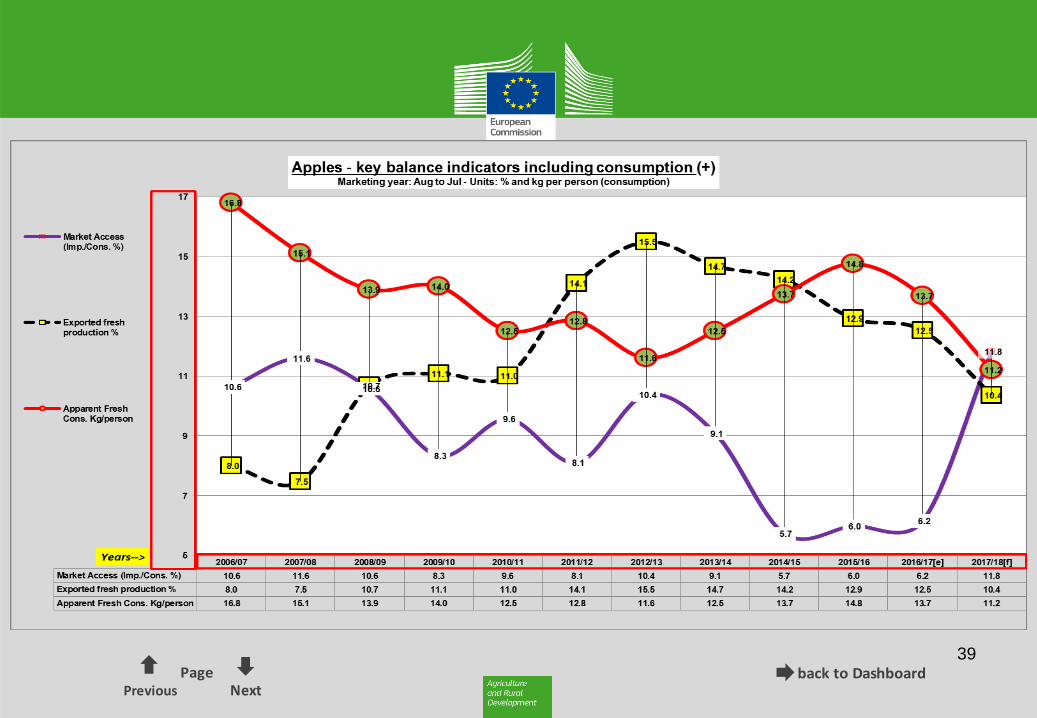
- Market access (Imports/Fresh consumption)
- Fresh production exported (%)
- Apparent fresh consumption (kg/person)
\\net1.cec.eu.int\AGRI\C\4\C5 DATA\5. CEREALES\DASHBOARD\Dashboard_Cereals_Blue.xlsx - 'Dashboard (2)'!W64
back to DashboardPrevious
PageNext
38 Further detail
\\net1.cec.eu.int\AGRI\C\4\C5 DATA\5. CEREALES\DASHBOARD\Dashboard_Cereals_Blue.xlsx - 'Dashboard (2)'!W64
back to DashboardPrevious
PageNext
39
back to DashboardPrevious
PageNext
40
5. EXPORT DIVERSIFICATION
- Map of top world importers of apples
- Bar chart on top world importers and annual growth rates
- Key trade indicators on top world importers of apples
- Main apple traders in the world and degree of diversification
- World consumption of apples, main players
\\net1.cec.eu.int\AGRI\C\4\C5 DATA\5. CEREALES\DASHBOARD\Dashboard_Cereals_Blue.xlsx - 'Dashboard (2)'!W64
back to DashboardPrevious
PageNext
41 Further detail
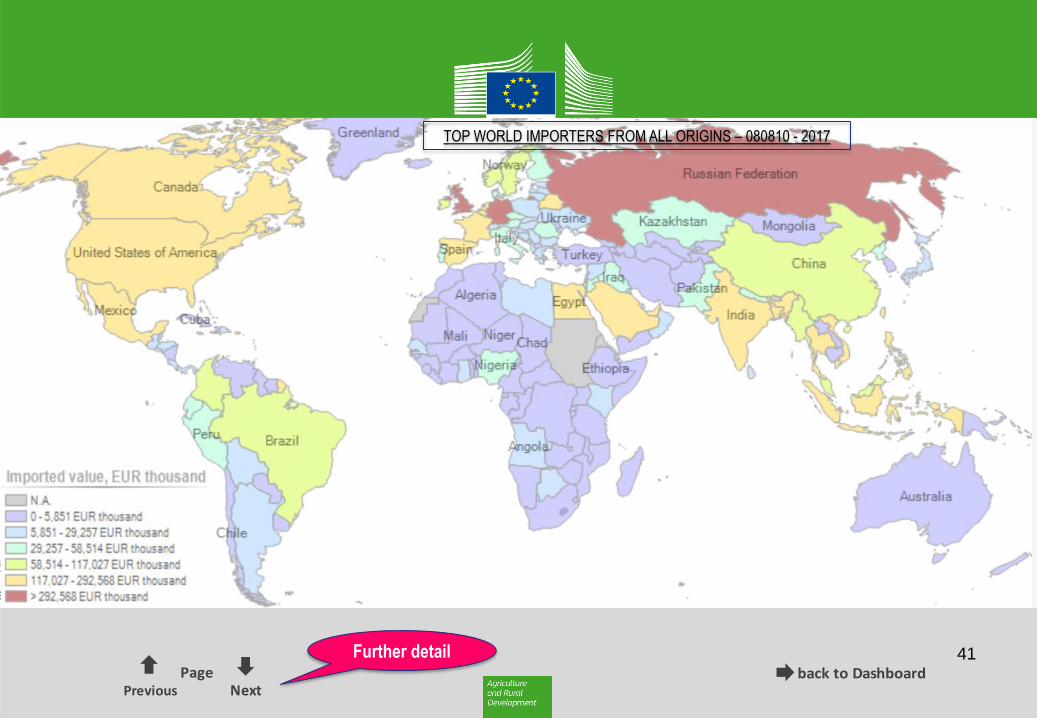
TOP WORLD IMPORTERS FROM ALL ORIGINS – 080810 - 2017
\\net1.cec.eu.int\AGRI\C\4\C5 DATA\5. CEREALES\DASHBOARD\Dashboard_Cereals_Blue.xlsx - 'Dashboard (2)'!W64
back to DashboardPrevious
PageNext
42 Further detail
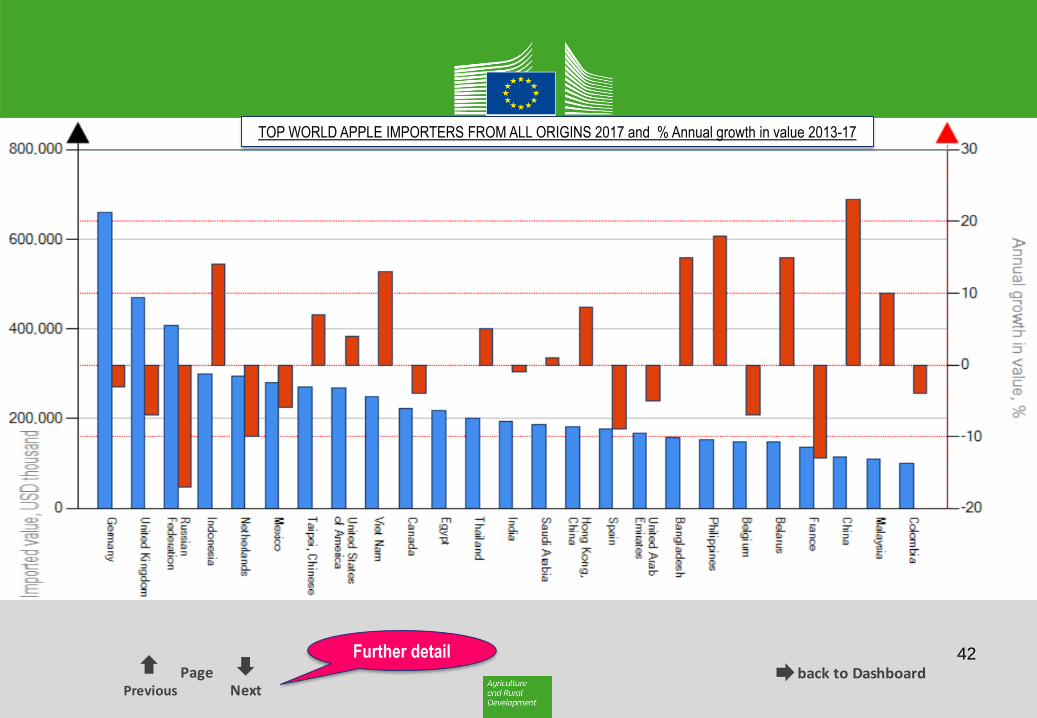
TOP WORLD APPLE IMPORTERS FROM ALL ORIGINS 2017 and % Annual growth in value 2013-17
\\net1.cec.eu.int\AGRI\C\4\C5 DATA\5. CEREALES\DASHBOARD\Dashboard_Cereals_Blue.xlsx - 'Dashboard (2)'!W64
back to DashboardPrevious
PageNext
43
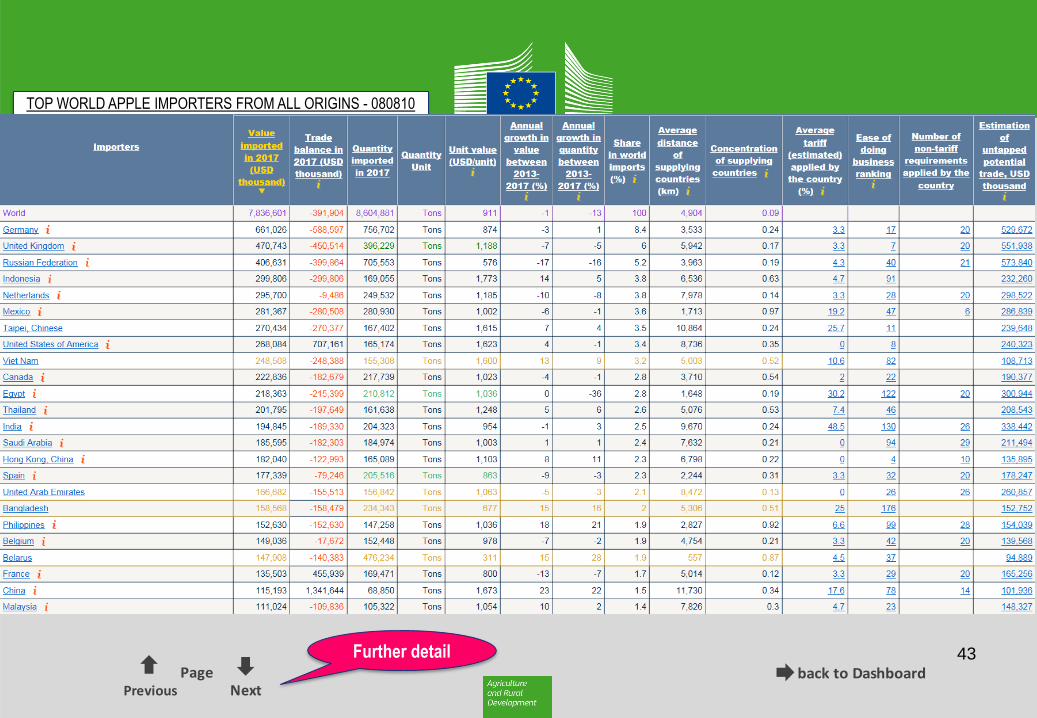
TOP WORLD APPLE IMPORTERS FROM ALL ORIGINS - 080810
Further detail
\\net1.cec.eu.int\AGRI\C\4\C5 DATA\5. CEREALES\DASHBOARD\Dashboard_Cereals_Blue.xlsx - 'Dashboard (2)'!W64
back to DashboardPrevious
PageNext
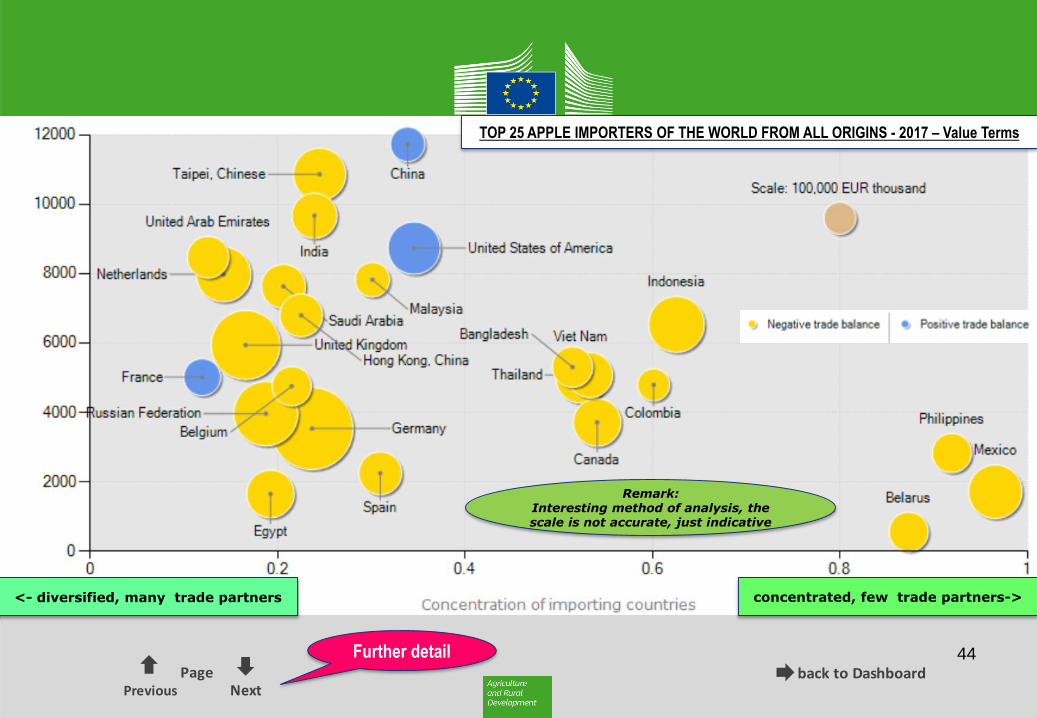
44 Further detail
concentrated, few trade partners-> <- diversified, many trade partners
Remark: Interesting method of analysis, the scale is not accurate, just indicative
TOP 25 APPLE IMPORTERS OF THE WORLD FROM ALL ORIGINS - 2017 – Value Terms
\\net1.cec.eu.int\AGRI\C\4\C5 DATA\5. CEREALES\DASHBOARD\Dashboard_Cereals_Blue.xlsx - 'Dashboard (2)'!W64
back to DashboardPrevious
PageNext
45
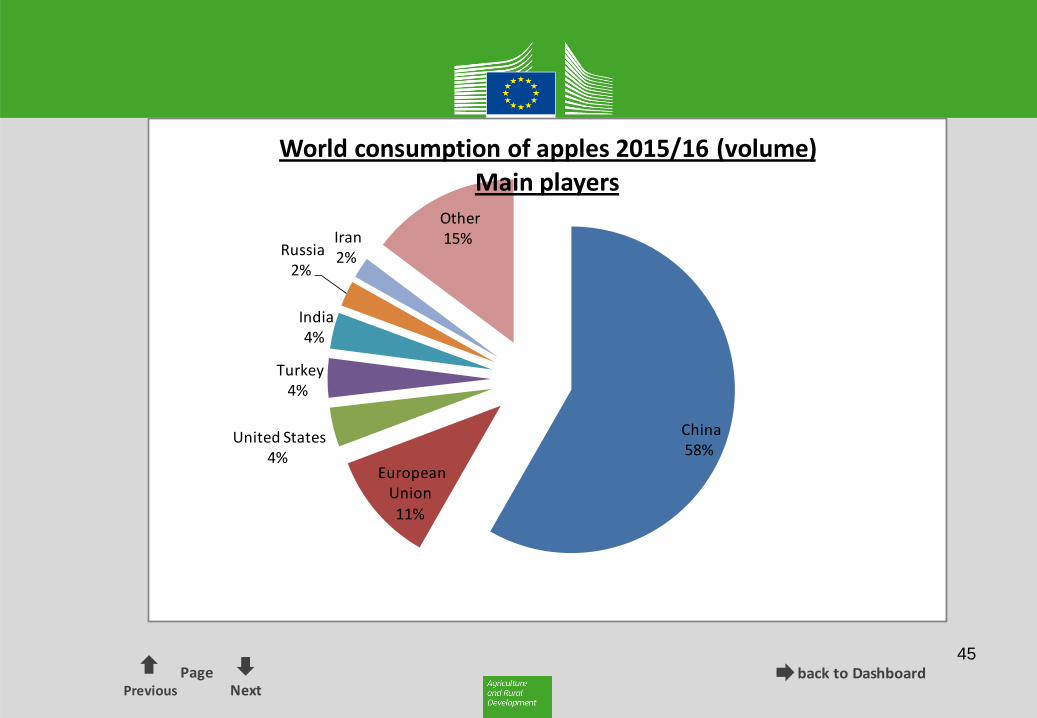
China58%
European Union11%
United States4%
Turkey4%
India4%
Russia2%
Iran2%
Other15%
World consumption of apples 2015/16 (volume) Main players
\\net1.cec.eu.int\AGRI\C\4\C5 DATA\5. CEREALES\DASHBOARD\Dashboard_Cereals_Blue.xlsx - 'Dashboard (2)'!W64
back to DashboardPrevious
PageNext
46
End
Thank you