Embed Size (px)
Citation preview

Karvy Comtrade Research reports are available on Thomson Reuters, ISI Emerging Markets, FACTSET
Karvy Comtrade Ltd.
Energy Quarterly Outlook Q4 2010
Karvy Comtrade Research reports are available on Thomson Reuters, ISI Emerging Markets, FACTSET
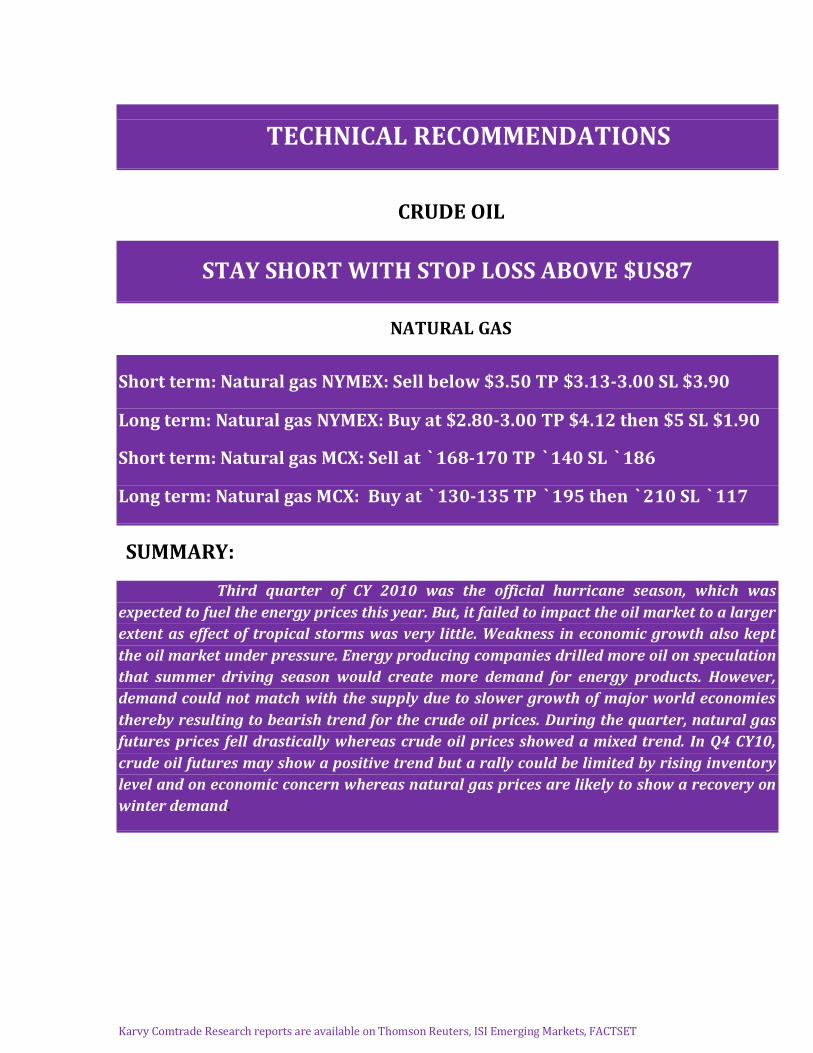
TECHNICAL RECOMMENDATIONS
CRUDE OIL
STAY SHORT WITH STOP LOSS ABOVE $US87
NATURAL GAS
Short term: Natural gas NYMEX: Sell below $3.50 TP $3.13-3.00 SL $3.90
Long term: Natural gas NYMEX: Buy at $2.80-3.00 TP $4.12 then $5 SL $1.90
Short term: Natural gas MCX: Sell at `168-170 TP `140 SL `186
Long term: Natural gas MCX: Buy at `130-135 TP `195 then `210 SL `117
SUMMARY:
Third quarter of CY 2010 was the official hurricane season, which was
expected to fuel the energy prices this year. But, it failed to impact the oil market to a larger
extent as effect of tropical storms was very little. Weakness in economic growth also kept
the oil market under pressure. Energy producing companies drilled more oil on speculation
that summer driving season would create more demand for energy products. However,
demand could not match with the supply due to slower growth of major world economies
thereby resulting to bearish trend for the crude oil prices. During the quarter, natural gas
futures prices fell drastically whereas crude oil prices showed a mixed trend. In Q4 CY10,
crude oil futures may show a positive trend but a rally could be limited by rising inventory
level and on economic concern whereas natural gas prices are likely to show a recovery on
winter demand.

Karvy Comtrade Research reports are available on Thomson Reuters, ISI Emerging Markets, FACTSET
CRUDE OIL
Crude oil futures prices movement formed a reverse V-shape in first two months of last
quarter and fell by 1% from penultimate quarter’s close on MCX. However, NYMEX
crude oil futures displayed a different direction wherein prices improved a tad on
depreciating dollar index. In September, dollar index depreciated by -6%, whereas
Indian rupee appreciated by 4.5%, making MCX oil futures to recover in a lower pace
than NYMEX oil price. Active hurricane season in North Atlantic and US summer driving
season failed to create more demand for the oil. In our last quarterly report, we had
presented a bearish outlook and market moved as per our expectation at the beginning
of the quarter. However, later it recovered tracking firm equity market. Prices climbed
to three month high in August, but it lasted for one week only. Build up in inventory and
dissipating hurricanes threat led the oil prices to fall from the monthly high in August.
Higher volatility was seen in September for oil price movement with upward bias.
Table 1: Crude oil price change (*Data collected till Sep 29, 2010)
Commodity July Aug Sep QTD YTD
NYMEX Crude Oil 0.04 -0.09 0.08 0.03 -0.02
MCX Crude Oil 0.04 -0.06 0.02 -0.004 -0.06
Source: Bloomberg & KCTL Research
Table 2: USD INR movement
Currencies JUL AUG SEP
INR 0% 1% -5%
DOLLAR -5% 2% -6%
Figure 1: Crude oil price movement
Source: Bloomberg & KCTL Research
The US benchmark WTI Light Sweet Crude Oil futures prices climbed more than 4% in
July. NYMEX oil price made a monthly high of $78.95/bbl while on MCX it climbed to

Karvy Comtrade Research reports are available on Thomson Reuters, ISI Emerging Markets, FACTSET
`3654. Future contract prices traded higher the most in beginning of August. Oil prices
climbed $83/bbl in NYMEX by rising more than 12% from opening of third quarter.
Similarly oil prices increased to `3796 with a rise of more than 11%. However, the
trend could not continue and prices fell to two months low in August end declining by
more than 13%. High volatility in oil prices is witnessed in the month of September. Oil
future contracts made a high of `3618 and a low of `3336 in September.
Figure 2: Crude Oil price & Hurricane Season
Source: National Hurricane Centre ,Bloomberg
Hurricane season in North Atlantic region runs between June and November.
About 30% of US crude oil production comes from Gulf of Mexico. Hence, occurrence of
storms and hurricane in this region will disturb the supply and production of oil. The
National Oceanic and Atmospheric Administration (NOAA) had projected 14-23 named
storm for the current season. In last four months, more than 13 storms (6 hurricanes
and 7 storms) have appeared. Figure 2 shows impact of hurricane and storm on the
crude oil price movement. Crude oil prices showed a marginal rise in July as Hurricane
Alex, Storm Bonnie and Colin hit the Gulf of Mexico and had a very little effect on
production. As a result of hurricane, oil prices surged by more than 12% on NYMEX and
by more than 7% on MCX. As the effect of hurricane started easing, prices tumbled in
the beginning of August. Crude oil prices rose once again in September following
production threat by Hurricane Igor and Julia. Crude oil production between June and
August average at 47,000 barrels per day in US, which was about half of EIA’s forecast of
96,000 barrels per day. There are still ten named storms to appear in north Atlantic,
which may disrupt oil supply and production. Hence, oil prices may take positive
cues.
Calendar Spread: The spread difference increased more than 51 percent in the
last quarter. In the month of July, prices of near month contract increased more than far
month contract which made spread to fall. Thereafter prices spread difference started
rising the most as prices of near month contract fell the most in comparison to far

Karvy Comtrade Research reports are available on Thomson Reuters, ISI Emerging Markets, FACTSET
month contract. However, spread fall from quarterly high as prices of near month
contract increased more than far month contract. As we are expecting prices to rise
slowly, this may push the spread in a higher side. However, a pull back can be seen in
later period.
Figure3: Spread chart
Source: Bloomberg & KCTL
Major Economy
Crude oil prices are often seen as being connected with inflation as a cause and effect.
Crude oil is considered as major input for the economy as most of the countries are
dependent on import of energy. It not only used for fueling engines but also being used
in manufacturing sector. Hence, an increase in crude oil price will ultimately lead to rise
in input, which translates into higher price for end products (means higher inflation).
Being the world largest economy, US are also largest producer and consumer of crude
oil. Let us have a brief review of US economic performance in last quarter. The US
Federal Reserve has indicated that employment rate in US is growing at much lower
pace than expected. Industrial production increased but at a slower pace in last quarter.
Consumer confidence increased slower-than-market expectation and the same trend is
likely to continue in this quarter. Unemployment rate continued to remain cause of
concern as it still above 9%. The US manufacturing activity has picked up in the last
quarter and remains above 50. However, Institute for Supply Management (ISM)
manufacturing index declined significantly during the quarter and Consumer price
index grew by only 0.1%.
Karvy Comtrade Research reports are available on Thomson Reuters, ISI Emerging Markets, FACTSET
China, the second largest oil consumer overtook Japan as the second largest economy
last quarter. Chinese GDP is at 7.4% of the world economy. Manufacturing in China
recovered in the month of August and Foreign Direct Investment in China climbed to
29.2% in July. Indian economy continued to exhibit strong growth in third quarter, as
both manufacturing and service expanded. The second quarter growth rate of Japan
(third largest oil consumer) is recorded only 0.40%. Japanese exports are likely to
advance and economic growth may remain in weak despite sizeable stimulus efforts.
The Euro-zone second quarter GDP growth stood at 1%. Only 7 of the banks failed in the
stress test, which is indicating potential for European economy to grow. However, retail
sales of Euro-zone declined and unemployment rate remains at 10% for the fifth
consecutive month.
Thus a slow growth of major economies is witnessed in the last quarter. However;
economic growth rate of the US is forecast to increase by 2.6% and 2.3% for 2010 and
2011 respectively. This data are revised from 2.8% and 2.5%. However, Euro-zone
growth for 2010 is expected to increase 1.2% from 0.8% forecasted previously. China
growth rate will remain unchanged from 9.5%.
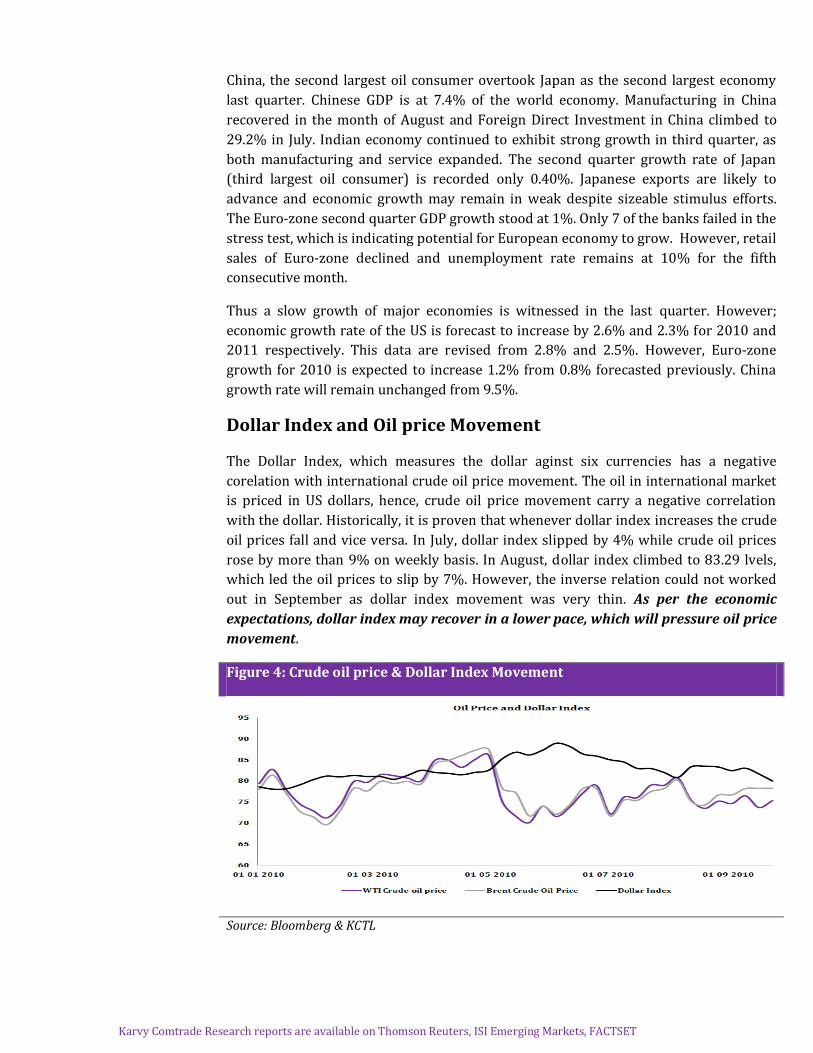
Dollar Index and Oil price Movement
The Dollar Index, which measures the dollar aginst six currencies has a negative
corelation with international crude oil price movement. The oil in international market
is priced in US dollars, hence, crude oil price movement carry a negative correlation
with the dollar. Historically, it is proven that whenever dollar index increases the crude
oil prices fall and vice versa. In July, dollar index slipped by 4% while crude oil prices
rose by more than 9% on weekly basis. In August, dollar index climbed to 83.29 lvels,
which led the oil prices to slip by 7%. However, the inverse relation could not worked
out in September as dollar index movement was very thin. As per the economic
expectations, dollar index may recover in a lower pace, which will pressure oil price
movement.
Figure 4: Crude oil price & Dollar Index Movement
Source: Bloomberg & KCTL

Karvy Comtrade Research reports are available on Thomson Reuters, ISI Emerging Markets, FACTSET
CFTC report: As per the report released by Commodity Futures Trading
Commission (CFTC) total short positions of crude oil futures contracts increased by 1%,
which was more than total long positions since July. Speculators have increased short
positions last quarter by 20%, whereas commercial short positions climbed by 10%.
Long positions also increased by both speculator and hedger, but, at much lower pace.
Thus, rise in short positions more than long positions indicates a bearish trend for
crude oil prices.
FUNDAMENTAL FACTORS: Oil prices in the last quarter were driven basically
by the fundamental factors like inventory and supply-demand. The continuing
hurricane season and summer driving season could not be effective on the back of
sluggish economic growth.
Figure 5: Crude oil Inventory & Price Movement
Source: US Energy Department Bloomberg & KCTL
According to US Energy Department, average crude oil inventory fell more than 7000
million barrels in July due to increase in refinery utilization. Refining companies
processed more crude oil during the month on speculation that demand for refined
products would increase ahead of summer driving season. Contrary to this, gasoline and
distillate inventories rose more than 3000 and 8000 million barrels, respectively.
Decline in inventory, speculative demand and supportive economic situation supported
the oil prices to trade higher by more than 4% in July. Surprisingly, distillate inventories
rose more than one-year’s average in August due to decline in import by the second
largest importing nation. This has resulted into a sharp decline in oil prices by 13% by
third week of August. But, in last week, oil prices recovered on anticipation of supply
disruption by Hurricane Karl and Danielle. With the end of summer demand, refinery
utilization declined as refineries went for maintenance. However, gasoline and distillate
inventories decline despite lower refinery utilization. In September, total crude oil
inventory declined for two consecutive weeks, but, stood higher than August average.
As per the crude oil inventory seasonality chart, we may expect further rise in
inventory in the next quarter. Thus rising inventory may be a negative price driver.

Karvy Comtrade Research reports are available on Thomson Reuters, ISI Emerging Markets, FACTSET
However, before the year end inventory is expected to decline in a lower pace which
may lead to recovery in oil prices.
Figure:6 Total Crude oil inventory Seasonality
Source: US Energy Department & Bloomberg
Crude Oil Supply & Demand
The discouraging economic growth of developed countries made weaker oil demand in
comparison to last quarter. It is not only the US, which is playing major role in the world
oil consumption; but declining oil demand in China also acting as a backup in lower
world consumption. Oil consumption has declined in the Europe by more than 1% last
month. Demand for crude oil has declined in China to 8.79 million barrels per day in
August though it has climbed to more than 9 million in July. Similarly consumption from
Asian countries also declined to 9.38 million barrels per day.
Figure 7: Total World Oil Production & Consumption with price
movement
Source: US Energy Department & Bloomberg
Summer driving season in the US could not boost oil consumption as expected though
gasoline consumption increased slightly. In the month of July, oil consumption declined
to 19.10 million barrels per day from 19.22 million barrels per day recorded in June. Jet
fuel consumption declined more than 5% in August, whereas distillates consumption

Karvy Comtrade Research reports are available on Thomson Reuters, ISI Emerging Markets, FACTSET
declined to more than 7% in July. Slowing economic activities have been affecting oil
consumption. US car and light vehicle sales reached a 28-year low in August. The world
consumption is forecast to remain at 86.37 mb/d, which is revised lower. European
oil demand forecast to contract by 0.35 mb/d. The world supply is forecasted to
remain at 85.9 mb/d. However, the US crude oil supply is expected to increase more
than 3%, though demand is expected to decline. Oil supply from OPEC is forecast to
rise from last quarter to 35 million barrels per day. Thus rising supply with lower
demand may pull down oil prices.
Figure 8:World Supply & Demand Forecast
Source: US Energy Department & Bloomberg
WTI and Brent- relation
As we know, WTI (West Texas Intermediate) light sweet crude oil is used as a
benchmark in oil pricing in the US. Brent crude, the benchmarks for ICE
(InterContinental Exchange), Europe which gets sourced from North Sea. This bench
mark crude oil is priced at about $4 per barrel premium to the OPEC basket
price or about a $1 or $2 per barrel discount to WTI. The daily basis pricing
relationship can vary. The most unusual and interesting thing happened in the last
quarter was spread between WTI and Brent declined the most. The difference started
declining from mid of August, which fell near $5. WTI has historically been more of a US
crude oil basket. It is not only used for US traded oil futures, but also for US production.
Therefore, WTI more closely reflects US supply/demand fundamentals, while Brent
tends to be more influenced by global events and international supply/demand
fundamentals.

Karvy Comtrade Research reports are available on Thomson Reuters, ISI Emerging Markets, FACTSET
Figure 9: WTI & Brent Spread
Source: Bloomberg &KCTL
North Sea quarterly production is expected to decline from the last quarter. In the third
quarter it was at 3.89 million barrels per day and is expected to 3.72 millions. Thus a
positive indication can be seen in Brent prices in a short- term.
Gold/Crude Ratio
Interrelationship between Gold and Oil found historically; Oil is the most important
commodity on earth because of economies’ dependence on this tangible commodity
while gold has been the ultimate form of money through centuries. It has been found
that these two moved in tandem with basically crude oil prices driving bullion prices.
Crude oil mainly adds to inflation numbers which further instigates the demand for gold
as an inflation-hedge. Therefore, if crude oil prices rise, gold also tends to march higher.
However, history shows that relationship imploded when the co-relation between gold
and crude oil dived into negative territory in 1992, 1993, 1996 and 1999-2001.Thus
occasional break-up between these commodities which have been mostly found trading
in tandem with each other. Current year 2010 is witnessing another year of those few
years when the relationship broken. The second quarter of the year 2010 saw European
debt crisis deepening which sent crude oil prices lower but lifted the bullion prices as a
safe haven instrument during the same time and it is continuing. Gold –crude ratio is
expected to rise in the next quarter, as demand for gold is expected to rise, where as
prices of crude futures will be under pressure.

Karvy Comtrade Research reports are available on Thomson Reuters, ISI Emerging Markets, FACTSET
Figure 10: Gold and Crude Oil Ratio
Source: Bloomberg & KCTL
CRUDE OIL TECHNICAL SNAPSHOT
Case1: View: Downside
Strategy: STAY SHORT TILL $87 MARK. We firmly believe if market fails to breach
$87 then a good correction can be expected. However, the fall also is likely to be limited.

Karvy Comtrade Research reports are available on Thomson Reuters, ISI Emerging Markets, FACTSET
If market clears $87.00 on higher side our wave analysis needs to give rethink. Since, we
were bearish from mid 2009 and our views have been correct we expect $87.00 mark
should be an important factor to watch out. On the down side the support can be seen at
$70.
Recent wave: Minor wave 2 of intermediate wave (2) of primary wave C, which is
corrective in nature.
Description: As expected in last quarter market declined after making a top of $82.97 in
august end considered as intermediate wave 2 of primary wave C. The key level to watch is
at $87 levels and market can extend its correction till the same. Incase market fails to
breach the resistance at $87 would possible to see a correction. Supports are at $78
followed by $70 levels. However, a significant break above $87 would confirm the fresh
trend.
(OR)
Case 2: Why we are considering Case 2?
As per the case 1 discussion market should not breach the resistance at $83-87. At present
market is trading at $83.66 levels suggesting upside bias. However, market is in
consolidation phase with unfolded counts. On the topside the key level to watch is at $87
levels. A significant break above $87 is likely to extend its gains and we need to consider
the case 2.
Karvy Comtrade Research reports are available on Thomson Reuters, ISI Emerging Markets, FACTSET
Natural Gas
Gas prices have fallen aberrantly more than fifteen percent on quarterly basis.
Hurricane season increased the speculation of lower supply which made producers to
increase storage. However, dissipating storms and steadily growing economy lead a
decline in demand, thus inventory climbed and ultimately prices declined. Fundamental
factors drive gas prices more than economical factors. Let’s see how gas prices tumbled
on the back of various fundamentals.
Table 3: Natural Gas Price Movement
Commodity July Aug Sep QTD YTD
NYMEX Natural Gas 7% -22% 4% -14% -29%
MCX Natural Gas 6% -20% -2% -16% -29%
Source: Bloomberg, KCTL Research
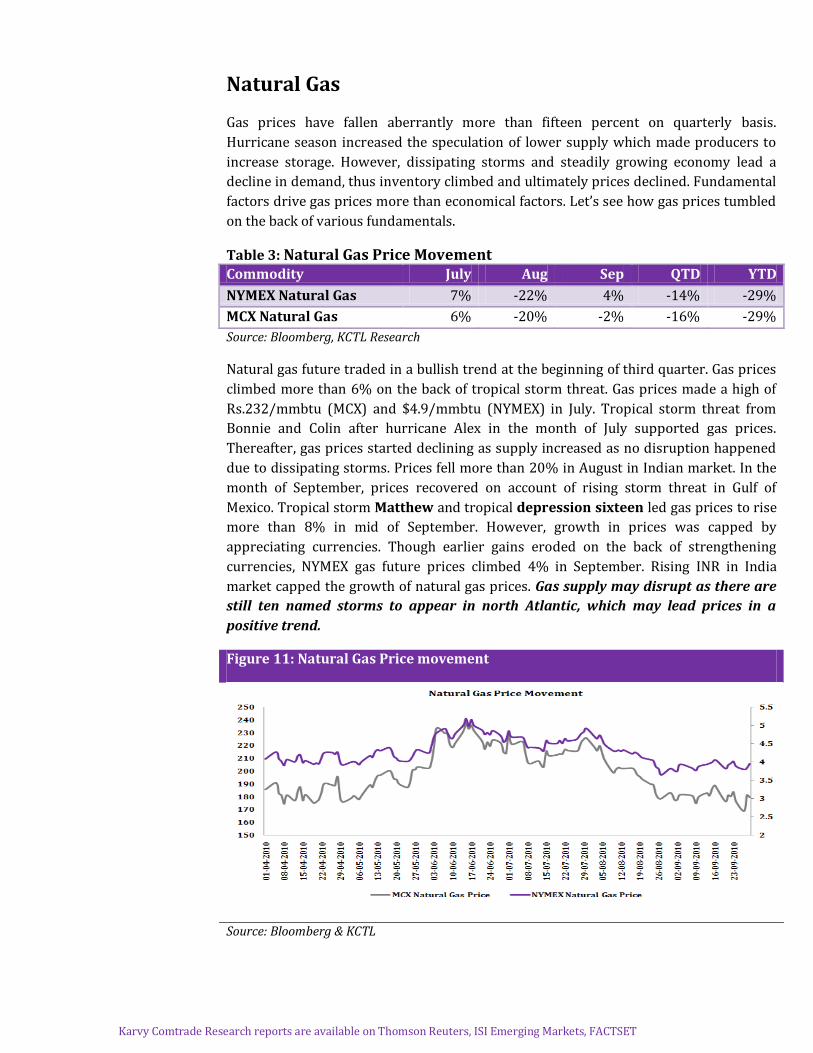
Natural gas future traded in a bullish trend at the beginning of third quarter. Gas prices
climbed more than 6% on the back of tropical storm threat. Gas prices made a high of
Rs.232/mmbtu (MCX) and $4.9/mmbtu (NYMEX) in July. Tropical storm threat from
Bonnie and Colin after hurricane Alex in the month of July supported gas prices.
Thereafter, gas prices started declining as supply increased as no disruption happened
due to dissipating storms. Prices fell more than 20% in August in Indian market. In the
month of September, prices recovered on account of rising storm threat in Gulf of
Mexico. Tropical storm Matthew and tropical depression sixteen led gas prices to rise
more than 8% in mid of September. However, growth in prices was capped by
appreciating currencies. Though earlier gains eroded on the back of strengthening
currencies, NYMEX gas future prices climbed 4% in September. Rising INR in India
market capped the growth of natural gas prices. Gas supply may disrupt as there are
still ten named storms to appear in north Atlantic, which may lead prices in a
positive trend.
Figure 11: Natural Gas Price movement
Source: Bloomberg & KCTL

Karvy Comtrade Research reports are available on Thomson Reuters, ISI Emerging Markets, FACTSET
Figure 11:Natural Gas Price movement with Hurricane
Source: Bloomberg & KCTL
Natural gas future contracts calendar spread difference was lower in the month of July.
In August, near month contract September futures traded in a higher range than August
contract, which lead spreads to rise more than Rs.15. Thereafter, a slow recovery was
witnessed in gas prices, which made spread to decline in September. However, the
current trend say spread is expected to rise, though recovery may happen in the US
winter season starting in November.
Figure 12:Natural Gas Spread
Source: Bloomberg & KCTL
As per CFTC report, a continuous rise in short positions is witnessed in the last
quarter. Total long positions have been declined than short positions in September,
which indicates a negative sign for natural gas in near term.

Karvy Comtrade Research reports are available on Thomson Reuters, ISI Emerging Markets, FACTSET
Inventory and Consumption
One of the important price driver of gas prices –Inventory; which is always in a rising
trend. The US is the largest producer and consumer of Natural gas. However, Europe,
Asia and UAE are in the queue as world’s large gas consumer. As per the US energy
department, natural gas storage increased more than 3000 billion cubic feet, up 20%
last quarter. Total dry gas production in the month of August increased from July,
whereas declined in the month of September. Baker’s Hughes US rig counts increased to
967 in September standing at two month’s low. while the number of rigs sprouting up
each year is decreasing, natural gas production is on the rise, with many of the shale
wells coming online with their sources fresh and untapped.Not only the industrial and
residential sectors consume gas, commercial, electric power plants and vehicles also use
natural gas in different form. Oversupply on demand pressured gas price movement in
the month of August. There has been more than 40% decline in consumption pattern,
while inventories have build up by more than 25% in the year 2010. The consumption
pattern remains low until the end of September as per the seasonality index and prices
are tending to rise with rising demand thereafter. In US, winter season starts in the
month of November which generally boosts demand of natural gas. Thus we are
expecting a rise in demand in the coming months, which will tend prices upward.
Figure 13: Natural Gas Consumption Vs. Inventory
Source: Bloomberg & KCTL

Karvy Comtrade Research reports are available on Thomson Reuters, ISI Emerging Markets, FACTSET
Figure 14: Natural gas Supply & Consumption Forecast
Source: Bloomberg & KCTL
NATURAL GAS TECHNICAL SNAPSHOT
Natural gas quarterly futures prices ended in bearish note loss by -14% with previous
quarter close. As per continues chart prices it made high of $4.636 and ended at lower -
$3.65.Since last seven quarters natural gas prices are trading in a consolidation phase
i.e. 3.412 -5.778 levels. As per the chart prices never closed below the $3.412 i.e23.6%
Fibonacci projections. As per Fibonacci retracement projections may consider $3.475
levels as major support for the prices. Unless and until market sustains above the
mentioned levels, may remains in consolidation phase in coming quarter. However, if
prices breach and sustains below the $3.412 levels may see a further bearishness in the
markets. Momentum indicator quarterly RSI is treading at 0.41 levels and a decline in

Karvy Comtrade Research reports are available on Thomson Reuters, ISI Emerging Markets, FACTSET
futures prices along with the decline volumes is suggesting that future prices may trade
sideways in coming quarter (i.e. may trade in previous ranges only) . Currently prices
are trading below the all short term and midterm EMA’s i.e. (9, 18 and 45) days.
Momentum indicator Stochastic also suggesting prices to trade sideways to lower
as %K at 11.91 and %D at 14.80 levels Over all the natural gas futures may trade
sideways in coming quarter.
Threat for Energy Price: Increasing Rig Counts
Rig counts are continuously increasing not only in North America but also at
International level. Currently, US Oil & Natural gas rotary rig counts stands at 1659
which is higher than last three month’s average. From figure one we can see rig counts
are started increasing since 2009, after a huge fall in 2008. In the month of August, total
world oil & natural gas rotary rig stands at 3127, last two year’s high. Rising rig counts
always put pressure on price movement. In the year 2010, natural gas prices have fallen
more than 65% till date, whereas rig counts are in an increasing trend. Natural gas
rotary rig counts are currently at 962 declined by 1% from September month. However,
rig counts still higher than last year average counts. Similarly, the US oil rig counts are
slowly in a rising trend in the current year. However, it is not only the rig counts, there
are many other fundamentals and economical factors which affect price movement.
Figure 14: US natural gas rig count
Source: Bloomberg & KCTL

Karvy Comtrade Research reports are available on Thomson Reuters, ISI Emerging Markets, FACTSET
Crude Oil- Natural Gas Ratio
Market price of crude oil divided by market price of natural gas gives the crude/natural
gas ratio. The ratio gets stronger if prices of crude oil rise higher than natural gas prices.
In the last quarter, the ratio has been increased more than yearly average, as gas prices
fell more than oil prices. In the end of September, the ratio was stronger, as crude oil
prices improved whereas gas prices fell from its month high. In coming two to three
months, crude prices are expected to decline whereas gas prices are expected to
improve, which may weak the ratio. However, ratio is expected to make a high in
recent period.
Figure 15: Crude Oil & Natural Gas Ratio
Source: Bloomberg & KCTL

Karvy Comtrade Research reports are available on Thomson Reuters, ISI Emerging Markets, FACTSET
To unsubscribe please mail us at [email protected]
Disclaimer
The report contains the opinions of the author that are not to be construed as investment advice. The author, directors and other employees of Karvy, and its affiliates, cannot be held responsible for the accuracy of the information presented herein or for the results of the positio ns taken based on the opinions expressed above. The above-mentioned opinions are based on the information which is believed to be accurate and no assurance can be given for the accuracy of this information. There is risk of loss in trading in derivatives. The author, directors and other employees of Karvy and its affi liates cannot be held responsible for any losses in trading.
Commodity derivatives trading involve substantial risk. The valuation of the underlying may fluctuate, and as a result, clients may lose their entire original investment. In no event should the content of this research report be construed as an express or an implied promise, guarantee or implication by, or from, Karvy Comtrade that you will profit or that losses can, or will be, limited in any manner whatsoever. Past results are no indicatio n of future performance. The information provided in this report is intended solely for informative purposes and is obtained from sources believed to be reliable. Information is in no way guaranteed. No guarantee of any kind is implied or possible where projections of future conditions are attempted.
We do not offer any sort of portfolio advisory, portfolio management, or investment advisory services. The reports are only f or information purposes and not to be construed as investment advice.
For a detailed disclaimer please go to following URLs:
http://www.karvycomtrade.com/disclaimer.asp
http://www.karvycomtrade.com/riskDisclaimer.asp